Article

Spatiotemporal Evolution Trends and Driving Force Analysis of Vegetation Greenness in Yunnan Province

1
College of Forestry, Southwest Forestry University, Kunming 650233, China
2
Southwest Survey and Planning Institute, National Forestry and Grassland Administration, Kunming 650216, China
*
Author to whom correspondence should be addressed.
Forests 2025, 16(8), 1303; https://doi.org/10.3390/f16081303
Submission received: 19 July 2025 / Revised: 4 August 2025 / Accepted: 8 August 2025 / Published: 10 August 2025
(This article belongs to the Section Forest Meteorology and Climate Change)

Abstract

Vegetation greenness is a key indicator for evaluating vegetation growth status and ecosystem health, playing an important role in ecological protection and management. Given the unique geographical location of Yunnan Province, studying the spatiotemporal variation in vegetation greenness and its driving factors provides a theoretical basis for environmental protection and ecological construction in the region. This study is based on MOD13A3 NDVI data, this study combined climate, socioeconomic, and air quality data, and applied Theil–Sen Median analysis, Mann–Kendall test, Hurst index trend analysis, coefficient of variation (CV), pixel-wise partial correlation analysis, and multivariate residual regression analysis to investigate the spatiotemporal variation trends and driving factors of the NDVI in Yunnan Province. The results showed the following: (1) From 2001 to 2020, the NDVI in Yunnan Province exhibited a fluctuating upward trend, with a multi-year average of 0.6342. Spatially, the NDVI showed a pattern of higher values in the south and west, and lower values in the north and east. In 40.11% of the study area, the NDVI is expected to continue increasing in the future. (2) Among the driving factors, temperature and precipitation (climate factors), GDP (socioeconomic factor), and O3 and PM2.5 (air quality factors) had the strongest positive correlations with the NDVI. The average contributions of climate, socioeconomic, and air quality factors to NDVI changes during the study period were 0.3436, 0.1153, and 0.2186, respectively. (3) Over the past two decades, the combined influence of climate, socioeconomic, and air quality factors has significantly driven NDVI increases in Yunnan Province, jointly contributing to NDVI growth in 61% of the area. Therefore, it is recommended that Yunnan Province optimizes governance strategies based on dominant driving factors through zonal management, strengthens pollution source control in key areas, promotes the adoption of clean energy alternatives, and establishes an integrated monitoring system for vegetation and air quality to precisely identify the lag effects of air pollution on vegetation.

1. Introduction

Vegetation greenness refers to the degree of green reflectance from the canopy of surface vegetation. It serves as a key indicator for evaluating vegetation growth status, biomass, and overall ecosystem health. Essentially, it reflects the photosynthetic activity and changes in the leaf area index (LAI) of green vegetation [1]. The NDVI (Normalized Difference Vegetation Index) is a remote sensing-based vegetation monitoring indicator used to quantitatively assess the growth condition of terrestrial vegetation [2]. Using the NDVI as an indicator to evaluate the greenness of vegetation can effectively reflect the growth status of vegetation and better carry out ecological protection and management. Situated on the southwestern border of China, Yunnan Province lies at the convergence of the Hengduan Mountains and the Yunnan–Guizhou Plateau. It features complex terrain, diverse climatic conditions, and abundant biological resources, with distinct ecological and geographical characteristics. Yunnan serves as a vital national ecological security barrier and a biodiversity hotspot. It is also a crucial area for climate regulation and water conservation in Southwest China [3]. At the same time, Yunnan is situated at the intersection of the “Belt and Road Initiative” and the “Western Development Strategy”. In recent years, rapid urban expansion, infrastructure development, and tourism growth have significantly accelerated socioeconomic development, intensifying anthropogenic pressures on the environment. These changes pose challenges to ecosystem stability. Therefore, examining the trends of vegetation greenness in Yunnan and identifying the dominant driving factors of such changes are essential for predicting future ecosystem evolution and enhancing vegetation resilience (Figure 1).
John et al. [4] introduced the Normalized Difference Vegetation Index (NDVI) into the public domain, demonstrating its effectiveness in assessing large-scale vegetation growth and cover dynamics, and establishing it as a key indicator of regional ecological quality. Studies on the variation in the NDVI can be traced back to the 1980s, when researchers around the world began using it to characterize ecological changes in vegetation [5]. In recent decades, numerous scholars have investigated vegetation changes across typical regions globally. For example, Sharma et al. [6] used MODIS-derived NDVI data to analyze vegetation dynamics in Nepal, revealing a consistent pattern of seasonal greening and browning from 2000 to 2015. Morawitz et al. [7] monitored the rapidly developing Puget Sound region using the NDVI and found that about 20% of each watershed assessment unit (WAU) showed significant NDVI changes within every five-year period. Eastman et al. [8] noted a significant upward trend in the seasonal NDVI values across all continents except Oceania.
The driving mechanisms behind the NDVI’s spatiotemporal variation have long been a central research focus. Pang et al. [9] analyzed the influence of climatic factors on vegetation growth in the Tibetan Plateau and found that the vegetation was highly sensitive to precipitation. Verbyla et al. [10] used MODIS-NDVI data as a proxy for maximum seasonal photosynthetic activity to explore interannual NDVI patterns (2002–2017) in Alaska and the Yukon, identifying strong correlations with elevation, July temperature, and precipitation. Zoungrana et al. [11] assessed vegetation degradation in the West African savanna, showing that the NDVI significantly declined when land cover was converted to agriculture and non-vegetated areas due to human activities. Pu Mengxin et al. [12] applied a geographically weighted regression model to investigate the NDVI dynamics in China’s Giant Panda National Park and found that natural factors, particularly climate and elevation, exerted a synergistic amplifying effect. Li Moyan et al. [13] analyzed vegetation greening in Xinjiang and discovered that NDVI changes during the growing season were primarily influenced by increased evapotranspiration, especially in grassland and desert ecosystems. Yang Wenjing et al. [14] identified CO2 concentration as the dominant driver (average contribution of 45%) of NDVI change in the Haihe River Basin, followed by anthropogenic activities (27%). Nemani et al. [15] highlighted the spatial heterogeneity of climate’s impact on vegetation, showing that arid northern regions were primarily limited by precipitation, while humid southern regions were more sensitive to temperature regulation. Although numerous studies have examined the effects of climate change, land use, and human activity on vegetation growth, there is a notable lack of research addressing air quality as a key environmental driver of vegetation change. In particular, the mechanisms through which atmospheric aerosols—such as PM2.5 and PM10-affect vegetation growth remain understudied. At the regional scale, quantitative assessments of air quality impacts on vegetation still face multiple challenges, including data accessibility, causal attribution, and modeling of spatial heterogeneity. Therefore, further research in this field holds significant theoretical and practical importance.
Although numerous studies have explored the climatic and socioeconomic drivers of the NDVI, the impact mechanisms of air quality factors on the NDVI at the regional scale remain unclear. In particular, for Yunnan Province, an ecologically fragile area, there is still a lack of systematic assessment of the spatiotemporal variation in the NDVI under the combined influence of multiple factors. This study incorporates O3, PM2.5, and PM10 as provincial-scale air pollution indicators to examine their spatial correlation and regional heterogeneity with the NDVI, and further quantifies their actual contributions to NDVI variation, aiming to explore the integrated effects of driving factors on the NDVI when air quality is taken into account. The integration of partial correlation analysis and multivariate residual regression enables a comprehensive assessment of the contribution of various driving factors to NDVI changes and facilitates the spatial delineation of dominant influencing factors. In this context, the present study utilizes NDVI data for Yunnan Province from 2001 to 2020, along with long-term time series data on climate, socioeconomic conditions, and air quality. Through trend analysis and contribution decomposition, we investigated the spatiotemporal evolution of vegetation greenness in Yunnan, quantified the relative contributions of climate, socioeconomic, and air quality factors, and identified the dominant drivers of change. The findings aim to provide scientific evidence for ecological protection and environmental management under ongoing climate and human-induced pressures in Yunnan Province.

2. Materials and Methods

2.1. Study Area

Yunnan Province is located in the southwestern border region of China (21°08′–29°15′ N, 97°31′–106°11′ E), covering a land area of approximately 394,100 square kilometers. The province features diverse and complex geographical environments, with a wide range of topographical types and significant elevation differences; the average altitude is around 2000 m. The annual average temperature ranges from 5 °C to 24 °C, and the average annual precipitation is approximately 1100 mm. Yunnan’s rich biodiversity, ecological vulnerability, and complex climate types make it an ideal region for studying NDVI changes and identifying dominant driving factor zones. In recent years, in addition to climatic influences, urbanization and air pollution have increasingly disturbed the ecological landscape, posing serious challenges for regional ecological governance. Therefore, research conducted in Yunnan can serve as a valuable reference for mountainous areas in Southwest China and similar ecological zones, offering both regional applicability and theoretical significance.

2.2. Data

2.2.1. NDVI Data

The NDVI data used in this study is derived from the MOD13A3 product of NASA (National Aeronautics and Space Administration)’s MODIS sensor., and the annual NDVI values from 2001 to 2020 were obtained by calculating the average of the monthly NDVI values for each year [16]. The data were processed through filtering, clipping, and averaging.

2.2.2. Climate Data

The climate variables used in this study include annual mean temperature, annual total precipitation, and annual total sunshine duration. These data were sourced from the Resource and Environment Science and Data Center of the Chinese Academy of Sciences [17].

2.2.3. Socioeconomic Data

Socioeconomic indicators used in this study include population density, per capita GDP, and nighttime light intensity. These data were obtained from the Resource and Environment Science and Data Center of the Chinese Academy of Sciences [18,19,20].

2.2.4. Air Quality Data

Air quality data, including O3, PM2.5, and PM10, were obtained from the National Tibetan Plateau Scientific Data Center website [21,22,23]. The dataset provides high-resolution (1 km) and high-quality near-surface atmospheric pollutant concentrations across China.
All the above datasets cover the period from 2001 to 2020. To ensure spatial consistency, all data were resampled and processed using Kriging interpolation, resulting in a uniform spatial resolution of 1 km.

2.3. Methods

2.3.1. Theil–Sen Median Analysis and Mann–Kendall Test

The combination of the Theil–Sen median method and the Mann–Kendall (MK) test provides a robust approach for detecting long-term spatial trends in NDVI. This integrated method offers high computational efficiency and demonstrates strong resistance to outliers and observational noise, making it well-suited for analyzing long-term vegetation dynamics [24].
The Theil–Sen Median method is well-suited for trend analysis over long time series due to its robustness to measurement errors and extreme values. The slope β is calculated as follows:
β = M e d i a n x j x i j i j > i
Median denotes the median value. The sign of β indicates the direction of the trend, with a positive value representing an upward trend and a negative value representing a downward trend.
The test statistic Z is used to determine the significance of the trend. At a given significance level α, if |Z| exceeds 1.65, 1.96, or 2.58, the trend passes the 90%, 95%, and 99% confidence levels, respectively. Criteria for trend significance are shown in Table 1.

2.3.2. Hurst Exponent

This study employs the Hurst exponent to characterize the long-term memory and self-similarity of the NDVI. Its value ranges from 0 to 1, different value ranges can represent the persistence of NDVI changes [25]. The future trend of the NDVI can be assessed by integrating the above analyses. The classification criteria are shown in Table 2.

2.3.3. Coefficient of Variation (CV)

The coefficient of variation (CV) effectively reflects the stability of long-term time series data; in this study, it is used to assess the fluctuation degree of the NDVI [26]. The CV is calculated as follows:
V j = S j A j
where Aj represents the standard deviation, Sj, denotes the mean, and Vj is the coefficient of variation (CV). A larger Vj indicates greater variability and lower stability in the data, while a smaller Vj reflects more stable fluctuations. CV values of different ranges represent different degrees of data stability, as shown in Table 3.

2.3.4. Pixel-Wise Partial Correlation Analysis

Pixel-wise partial correlation analysis can avoid the influence of other variables and accurately reveal the direct relationship between two variables [27]. In this study, partial correlation coefficients were calculated between the NDVI and temperature, precipitation, and sunshine duration, respectively. The calculation formula is as follows:
R a b · c d = R a b · c R a d · c R b d · c ( 1 R a d · c 2 ) ( 1 R b d · c 2 )
In the equation, a, b, c, and d represent the NDVI, temperature or population density or O3, precipitation or GDP or PM2.5, and sunshine duration or nighttime lights or PM10, respectively. Rab∙cd denotes the second-order partial correlation coefficient between the NDVI and one variable while controlling for the other two variables.
The t-test was used to evaluate the correlation significance of the NDVI at confidence levels of p = 0.05 and p = 0.01,
t = R a b · c d ( 1 R a d · c d 2 ) n m 1
where n is the number of samples, and m is the number of dependent variables.
The partial correlation analysis in this study was conducted by merging all data from 2001 to 2020. The resulting correlation coefficient range reflects the range of correlation values across different spatial locations within the study area over the past 20 years.

2.3.5. Multivariate Residual Regression Analysis

The multivariate residual regression analysis method can quantify the impact of the three major factors on the NDVI, the model is expressed as follows [28]:
d N D V I d t   δ N D V I δ C × d C d t + δ N D V I δ S × d S d t + δ N D V I δ A × d A d t + O t h e r c o n = C c o n + S c o n + A c o n + O t h e r c o n
where C, S, and A represent climate, socioeconomic, and air quality factors, respectively. Where Ccon, Scon, and Acon represent the contribution to the change in the NDVI. Othercon denotes the residual between the observed NDVI trend and the combined contribution of the three factors, representing the contribution of other unknown or unmodeled factors to NDVI changes. The d N D V I d t indicates the trend of NDVI change over time t caused by the combined effects of the three main categories and other factors. Similarly, d C d t , d S d t , and d A d t indicate the contributions of individual factors. The sign of each contribution (positive or negative) reflects whether the factor promotes or inhibits NDVI growth. The multivariate residual regression analysis used in this study was conducted by merging all data from 2001 to 2020. The resulting contribution values of each factor represent the average contributions over the past 20 years.

3. Results

3.1. Spatiotemporal Characteristics of NDVI

3.1.1. Temporal Variation in NDVI

From a temporal perspective, the annual mean NDVI from 2001 to 2020 showed a fluctuating upward trend. The slope of the NDVI trend line was 0.0031. Annual NDVI values ranged between 0.6063 and 0.6676, with a mean of 0.6342. The maximum value occurred in 2017 (0.6676), and the minimum in 2001 (0.6063). The fastest NDVI increase occurred between 2010 and 2017, with an average annual growth rate of 0.0078 (Figure 2).

3.1.2. Spatial Variation in NDVI

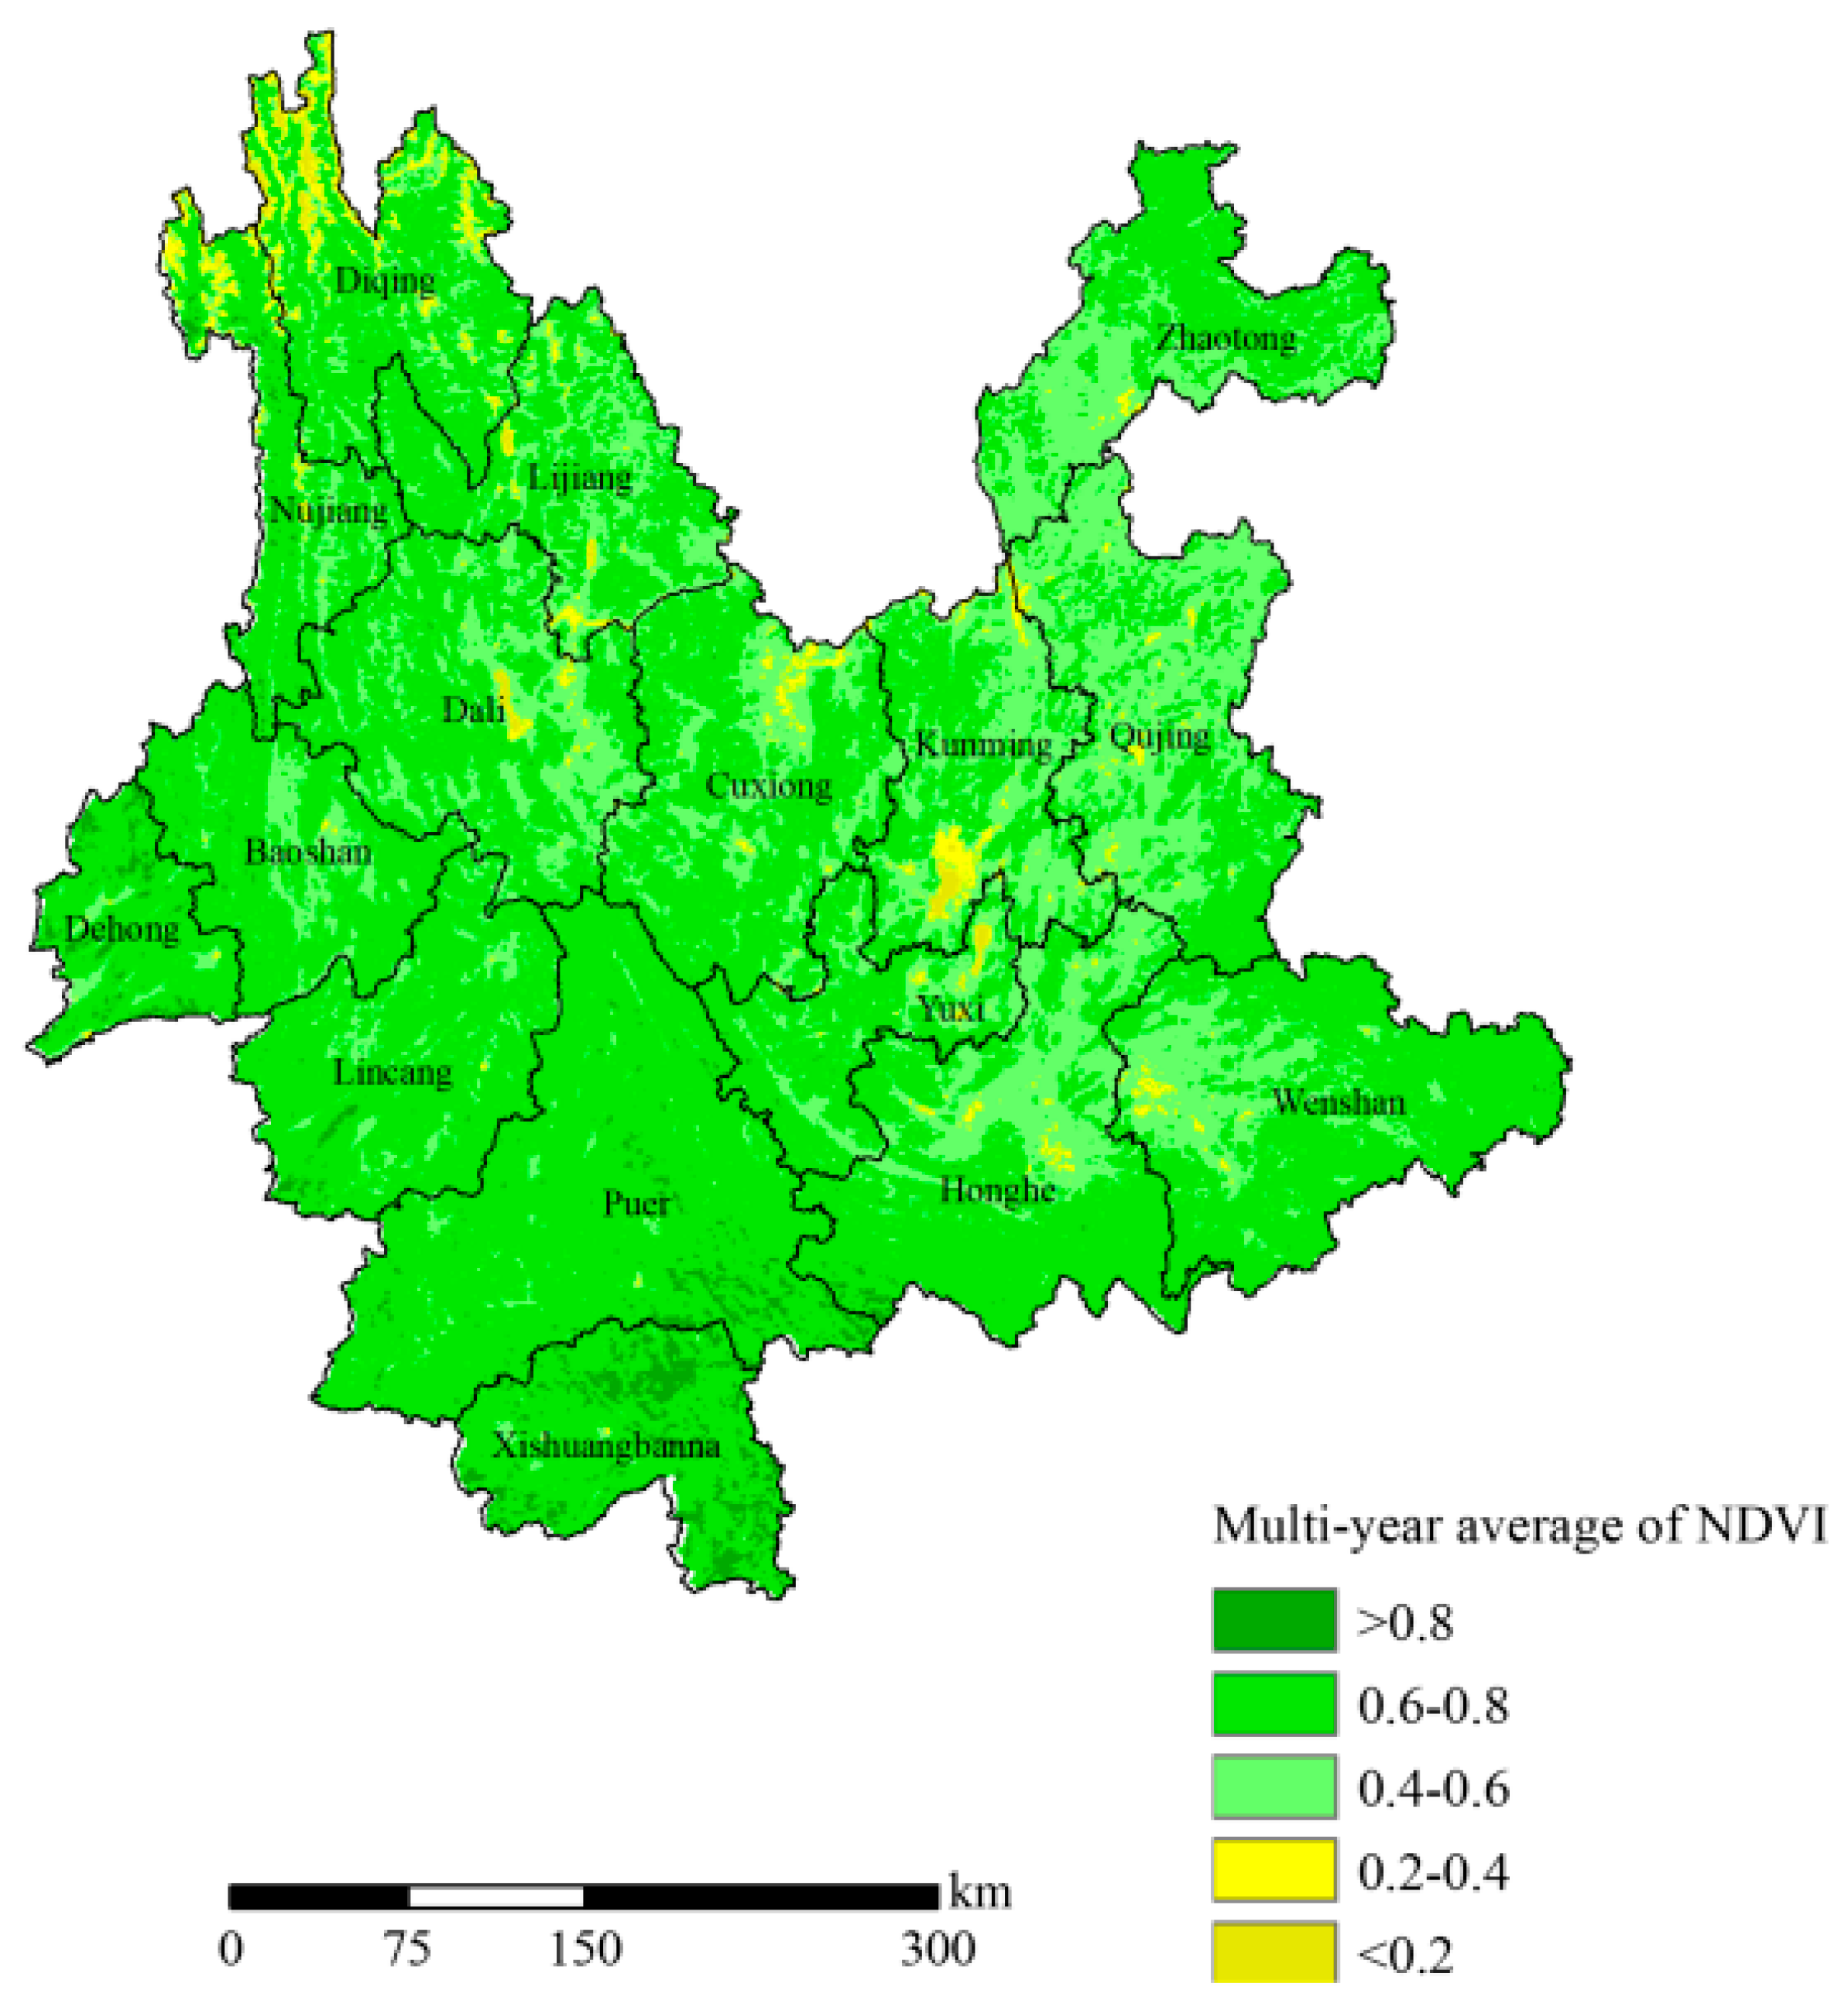
The NDVI in Yunnan shows a spatial pattern of being higher in the south than in the north, and higher in the west than in the east. Most of the NDVI values exceed 0.6, accounting for 66.7% of the study area, primarily located in southwestern Yunnan. Areas with an NDVI < 0.4 account for 2.22% of the study area, mainly located in the northwestern plateau regions and parts of central cities such as Kunming and Yuxi. In the study area, 31.08% of the regions have NDVI values ranging from 0.4 to 0.6, and the distribution is particularly dense in the southern part of Zhaotong, the northern part of Qujing, and their surrounding areas (Figure 3 and Table 4).
The coefficient of variation (CV) for the NDVI in Yunnan ranged from 0 to 0.78, with a mean of 0.02, indicating a relatively stable spatial pattern over the past 20 years. The ecosystem has exhibited a positive and stable ecological cycle. Spatially, NDVI stability from 2001 to 2020 decreased from the west to the east. Low variability areas are mainly distributed across most of central and western Yunnan. Relatively low variability occurs in the undulating terrains of eastern Yunnan. Moderate variability areas are concentrated in the northwest and central plateau regions. Relatively high and high variability areas are mainly distributed in a belt-like pattern in the northern parts of Nujiang and Diqing Prefectures. These regions lie near the Meili Snow Mountains at the Yunnan–Tibet border, with high elevations and persistent alpine snow cover. Seasonal shifts in the snowline may contribute to large NDVI fluctuations and higher CV values (Figure 4 and Table 5).
The average NDVI in Yunnan Province over the past 20 years was 0.6342, with an overall increasing trend. Areas with a decreasing NDVI accounted for 12.15% of the study area. Areas with an increasing NDVI accounted for 87.85%. Areas with no significant change accounted for only 0.12%. Regions with an increasing NDVI were mainly distributed in central and eastern Yunnan, while decreasing trends were concentrated in the northwest and parts of central Yunnan—especially in eastern Diqing, eastern Dali, southern Kunming, Yuxi, Honghe, and parts of Qujing (Figure 5). The Mann–Kendall significance test indicated that the most significant increases occurred in Zhaotong, Qujing, and Wenshan (Figure 6 and Table 6).

3.1.3. Future NDVI Change Trends

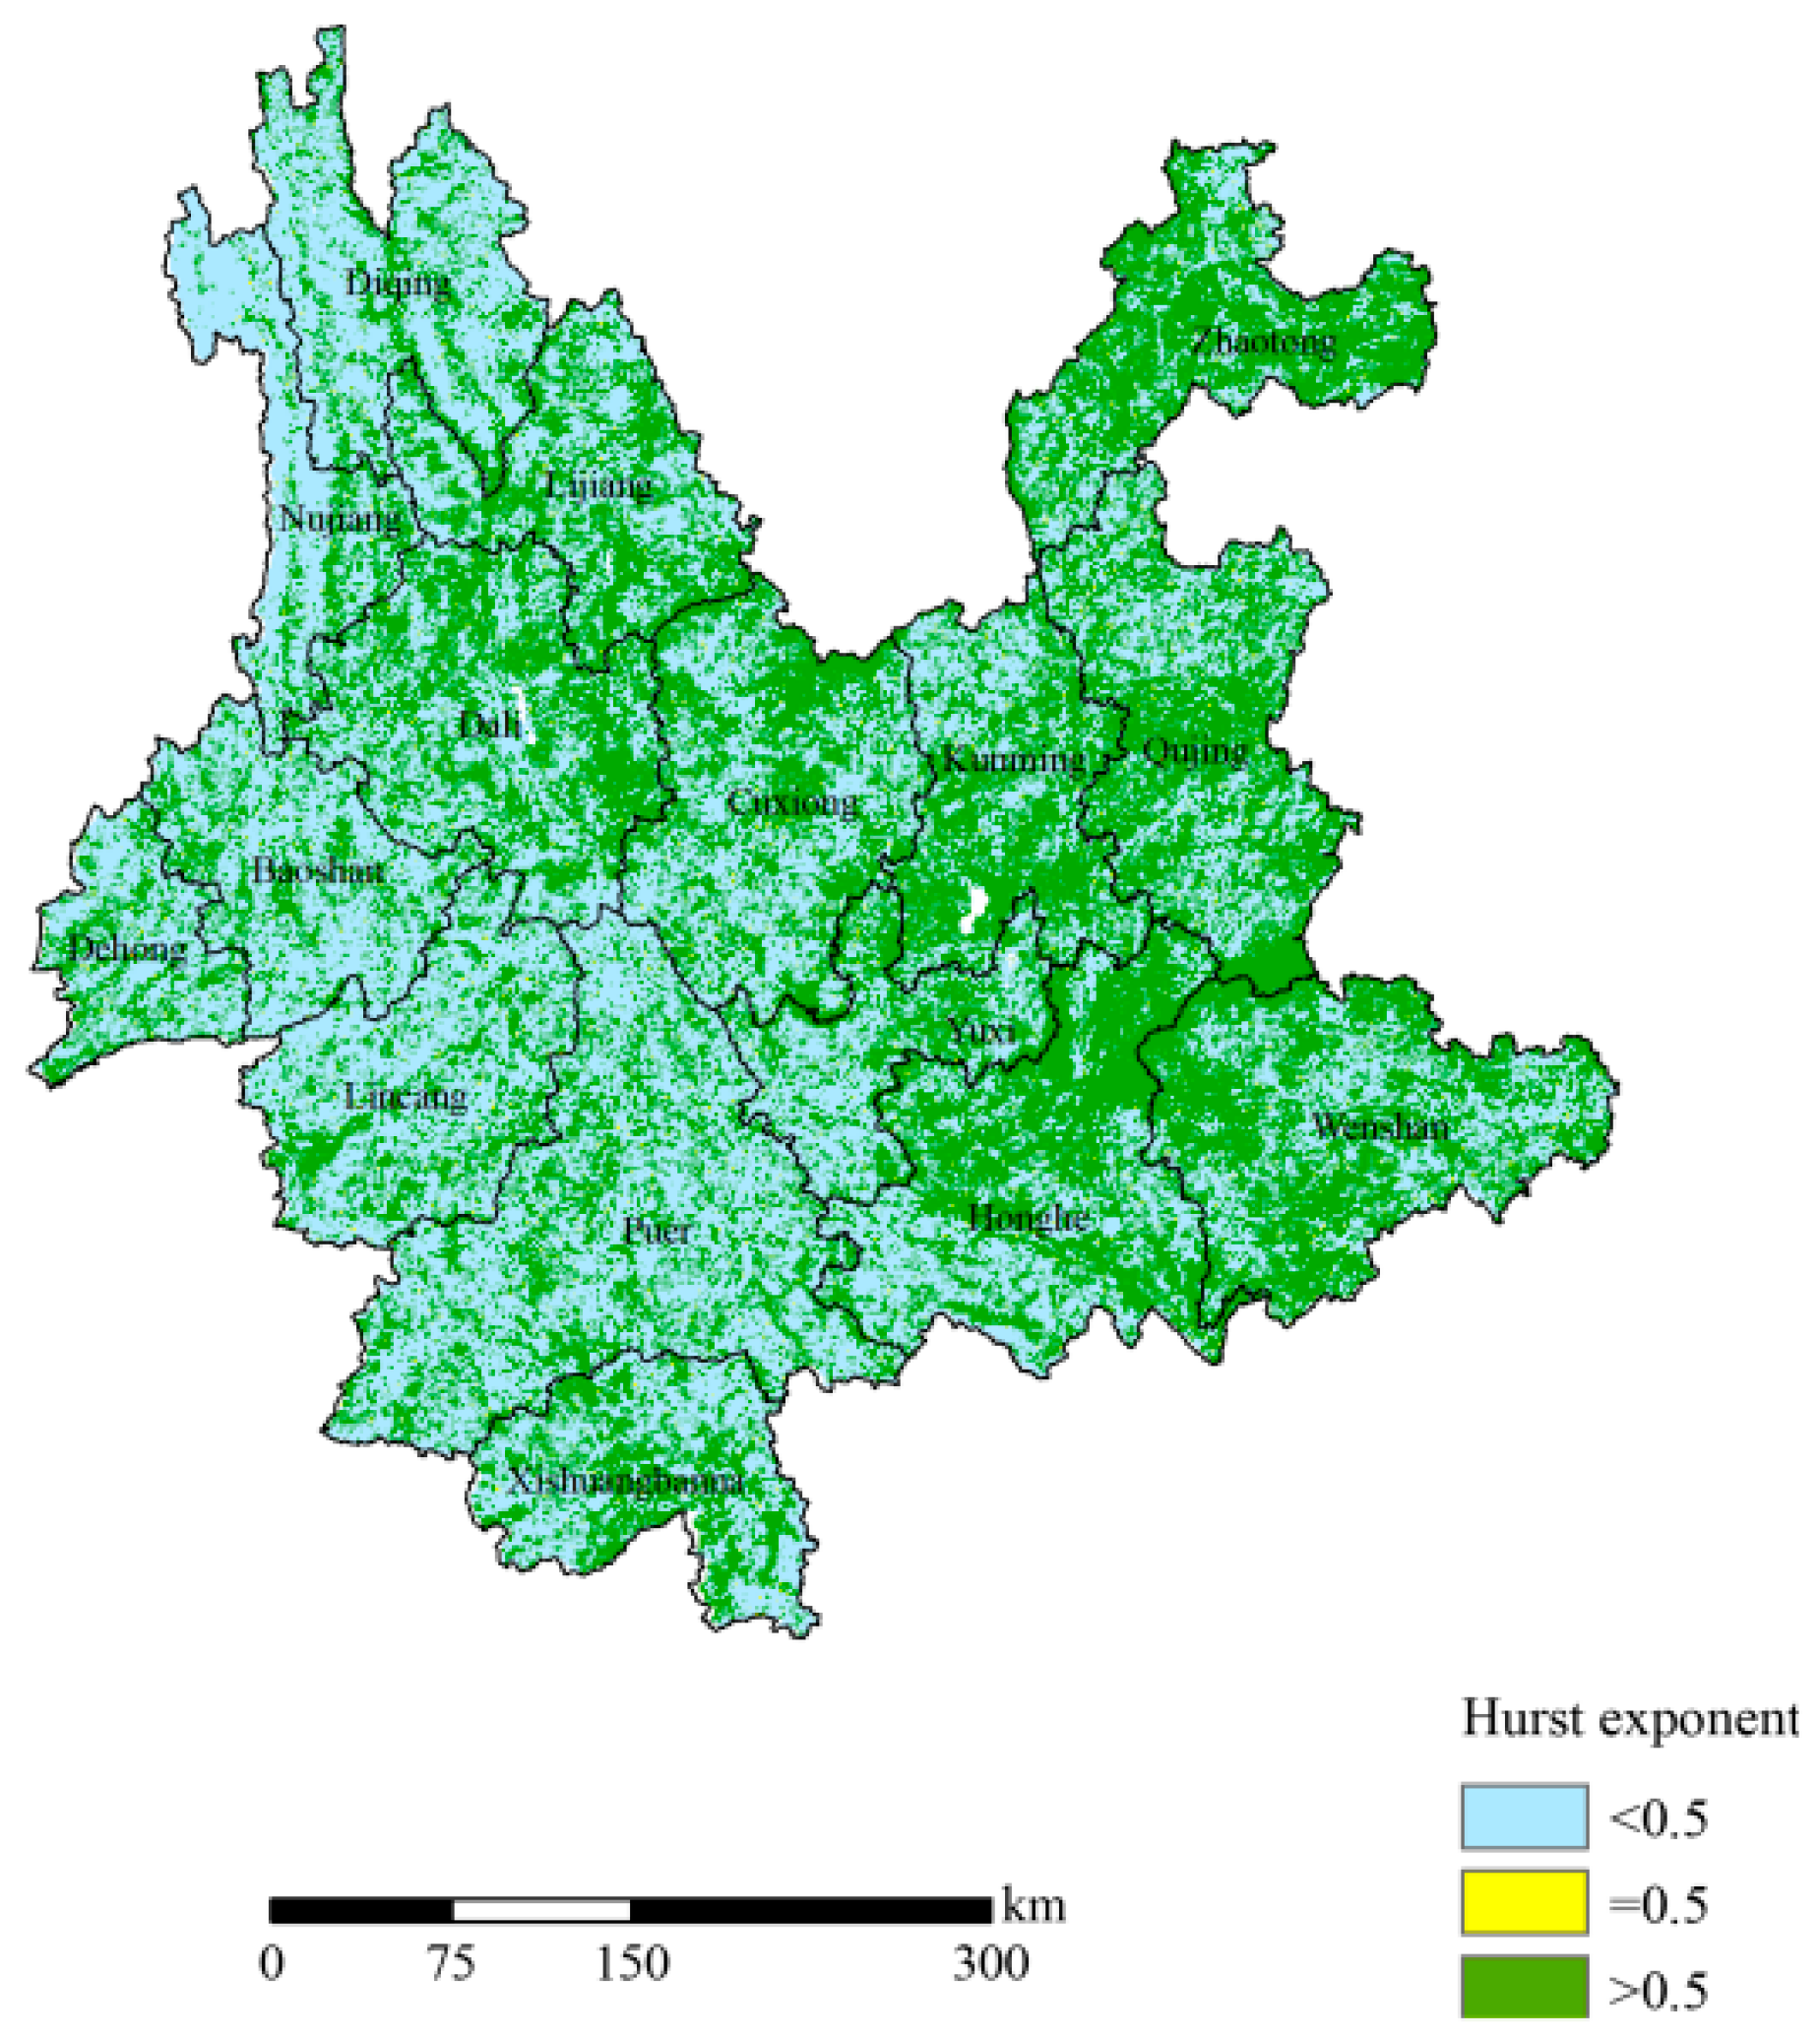
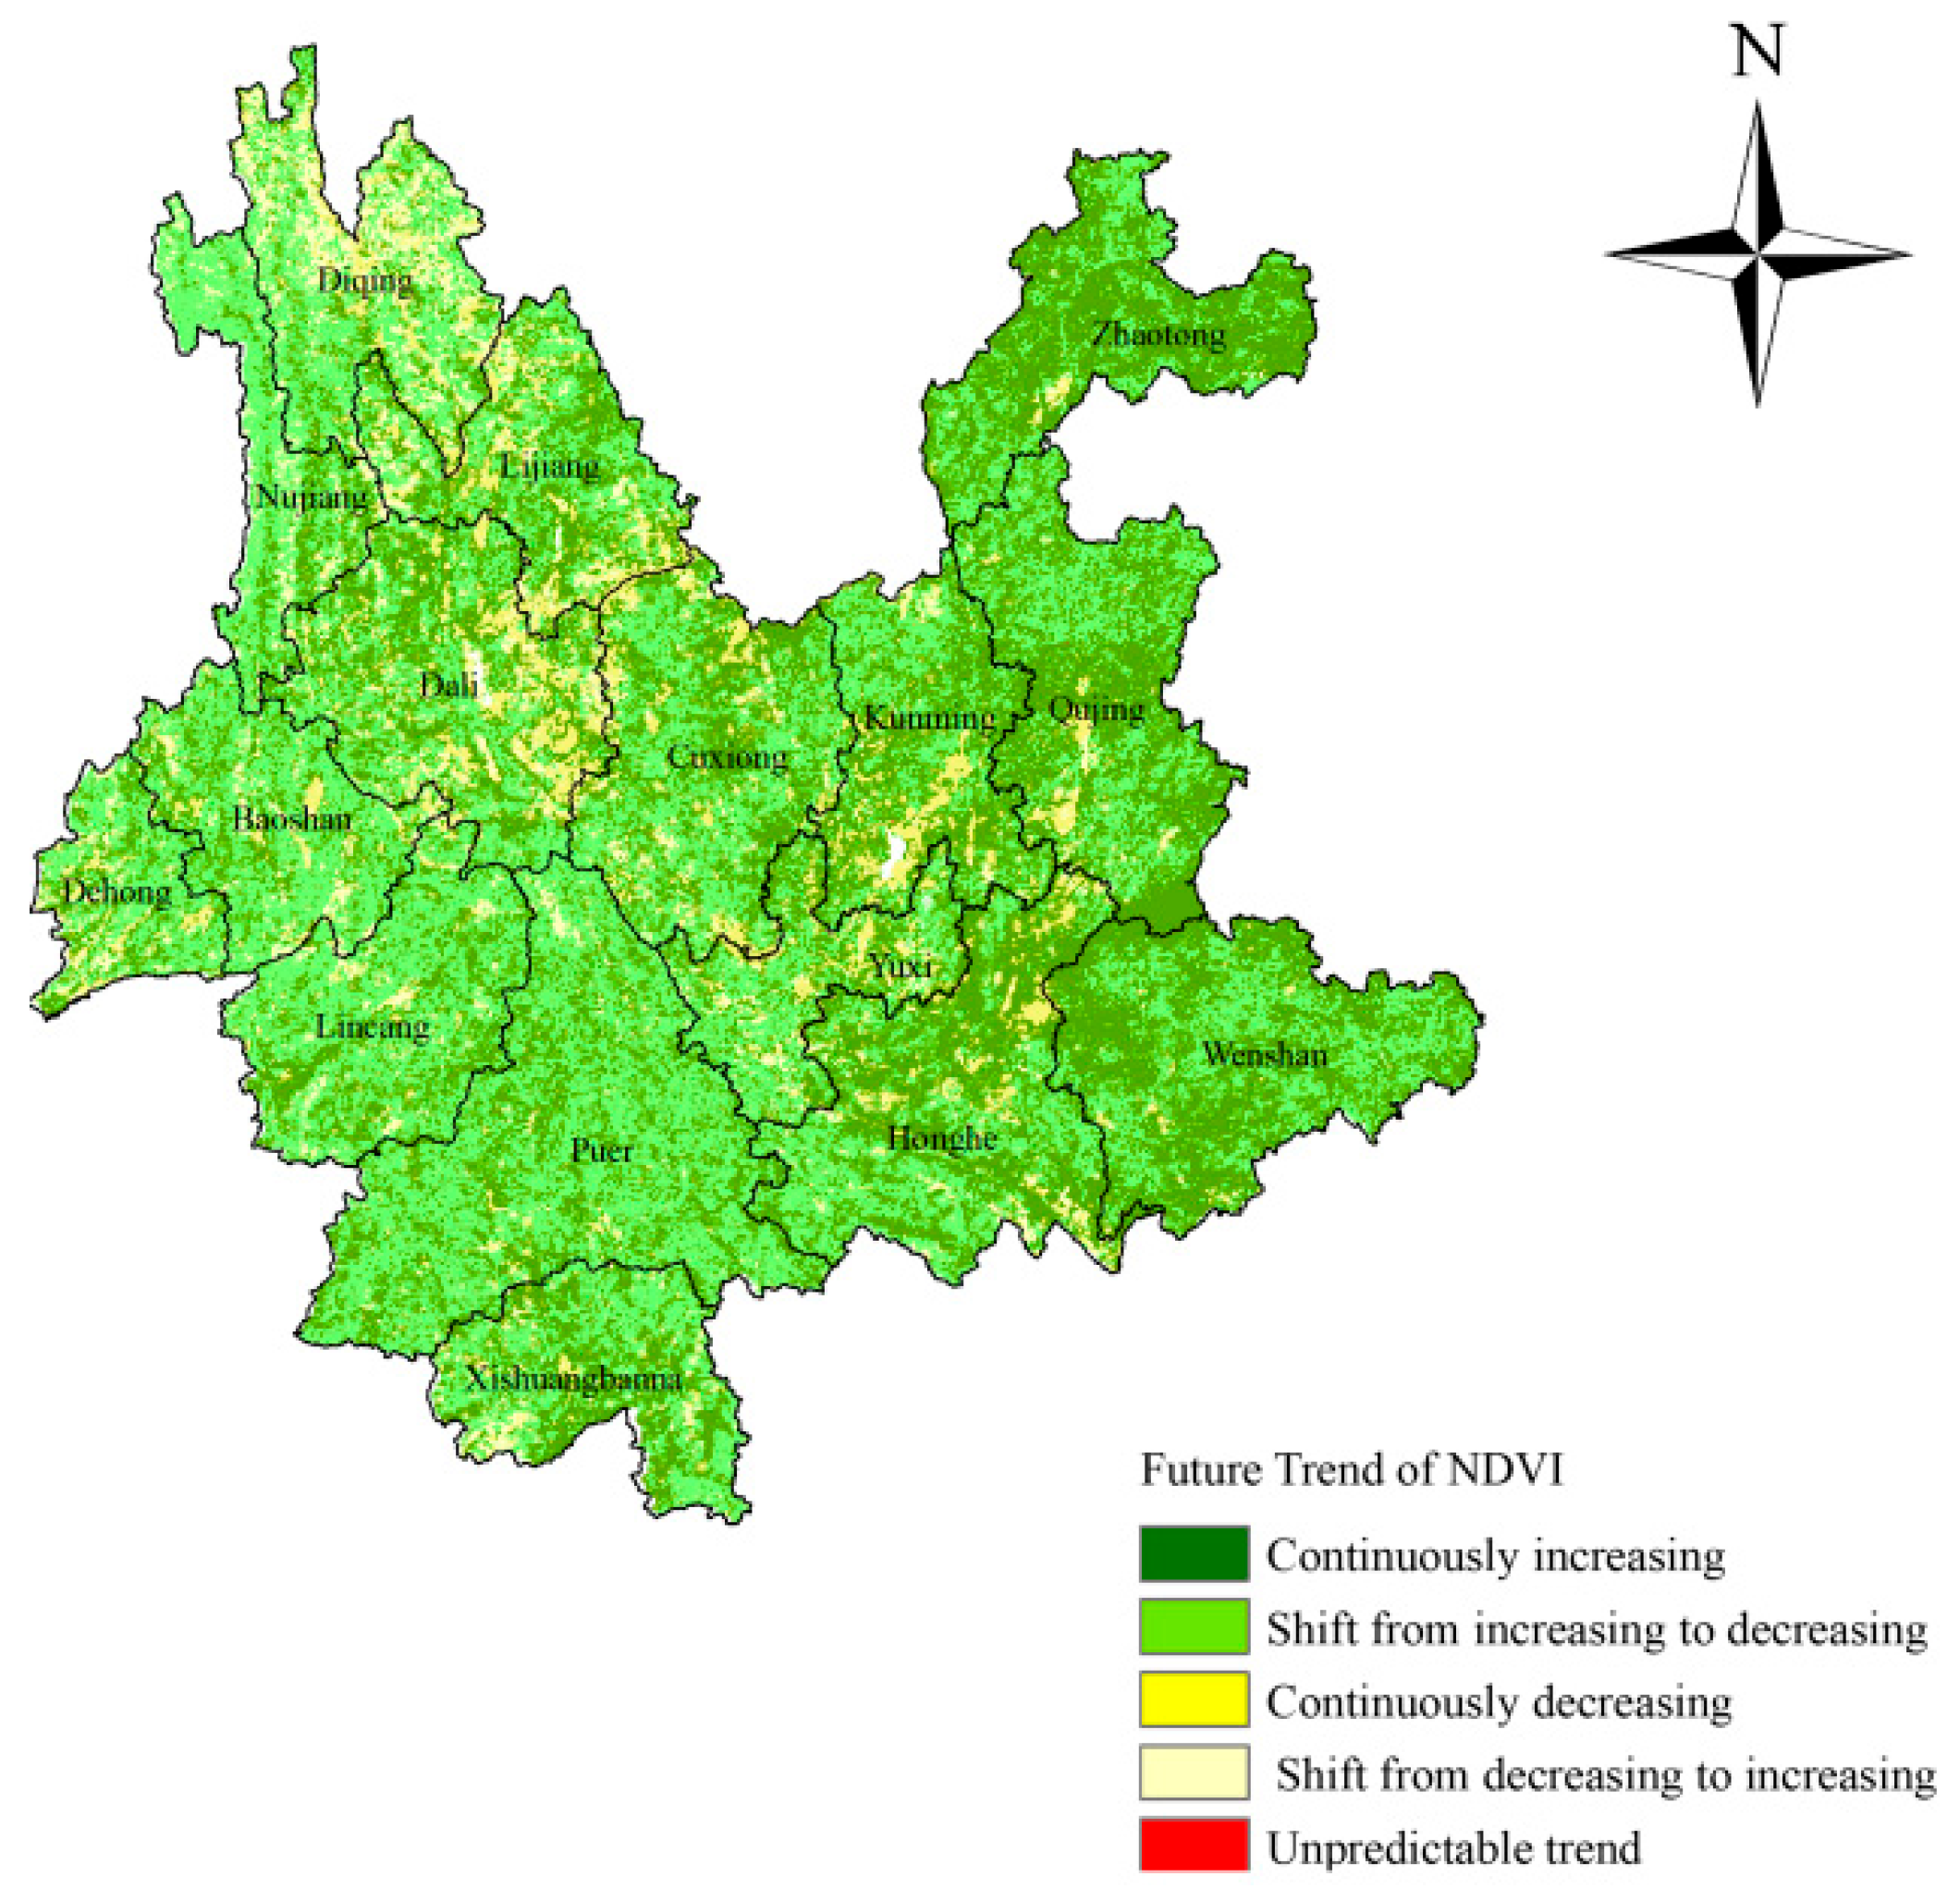
In the future trend of change, persistent trends are mainly found in northwestern and southwestern Yunnan. Anti-persistent trends are mainly located in eastern Yunnan (Figure 7). Continuously increasing areas are mainly located in eastern Yunnan. Areas changing from increasing to decreasing are concentrated in western Yunnan. Continuously decreasing areas are mainly found in the eastern Dali Prefecture and central Yunnan. Areas changing from decreasing to increasing are located in the northwest region (Figure 8 and Table 7).

3.2. The Driving Factors of NDVI

3.2.1. Influence of Climate

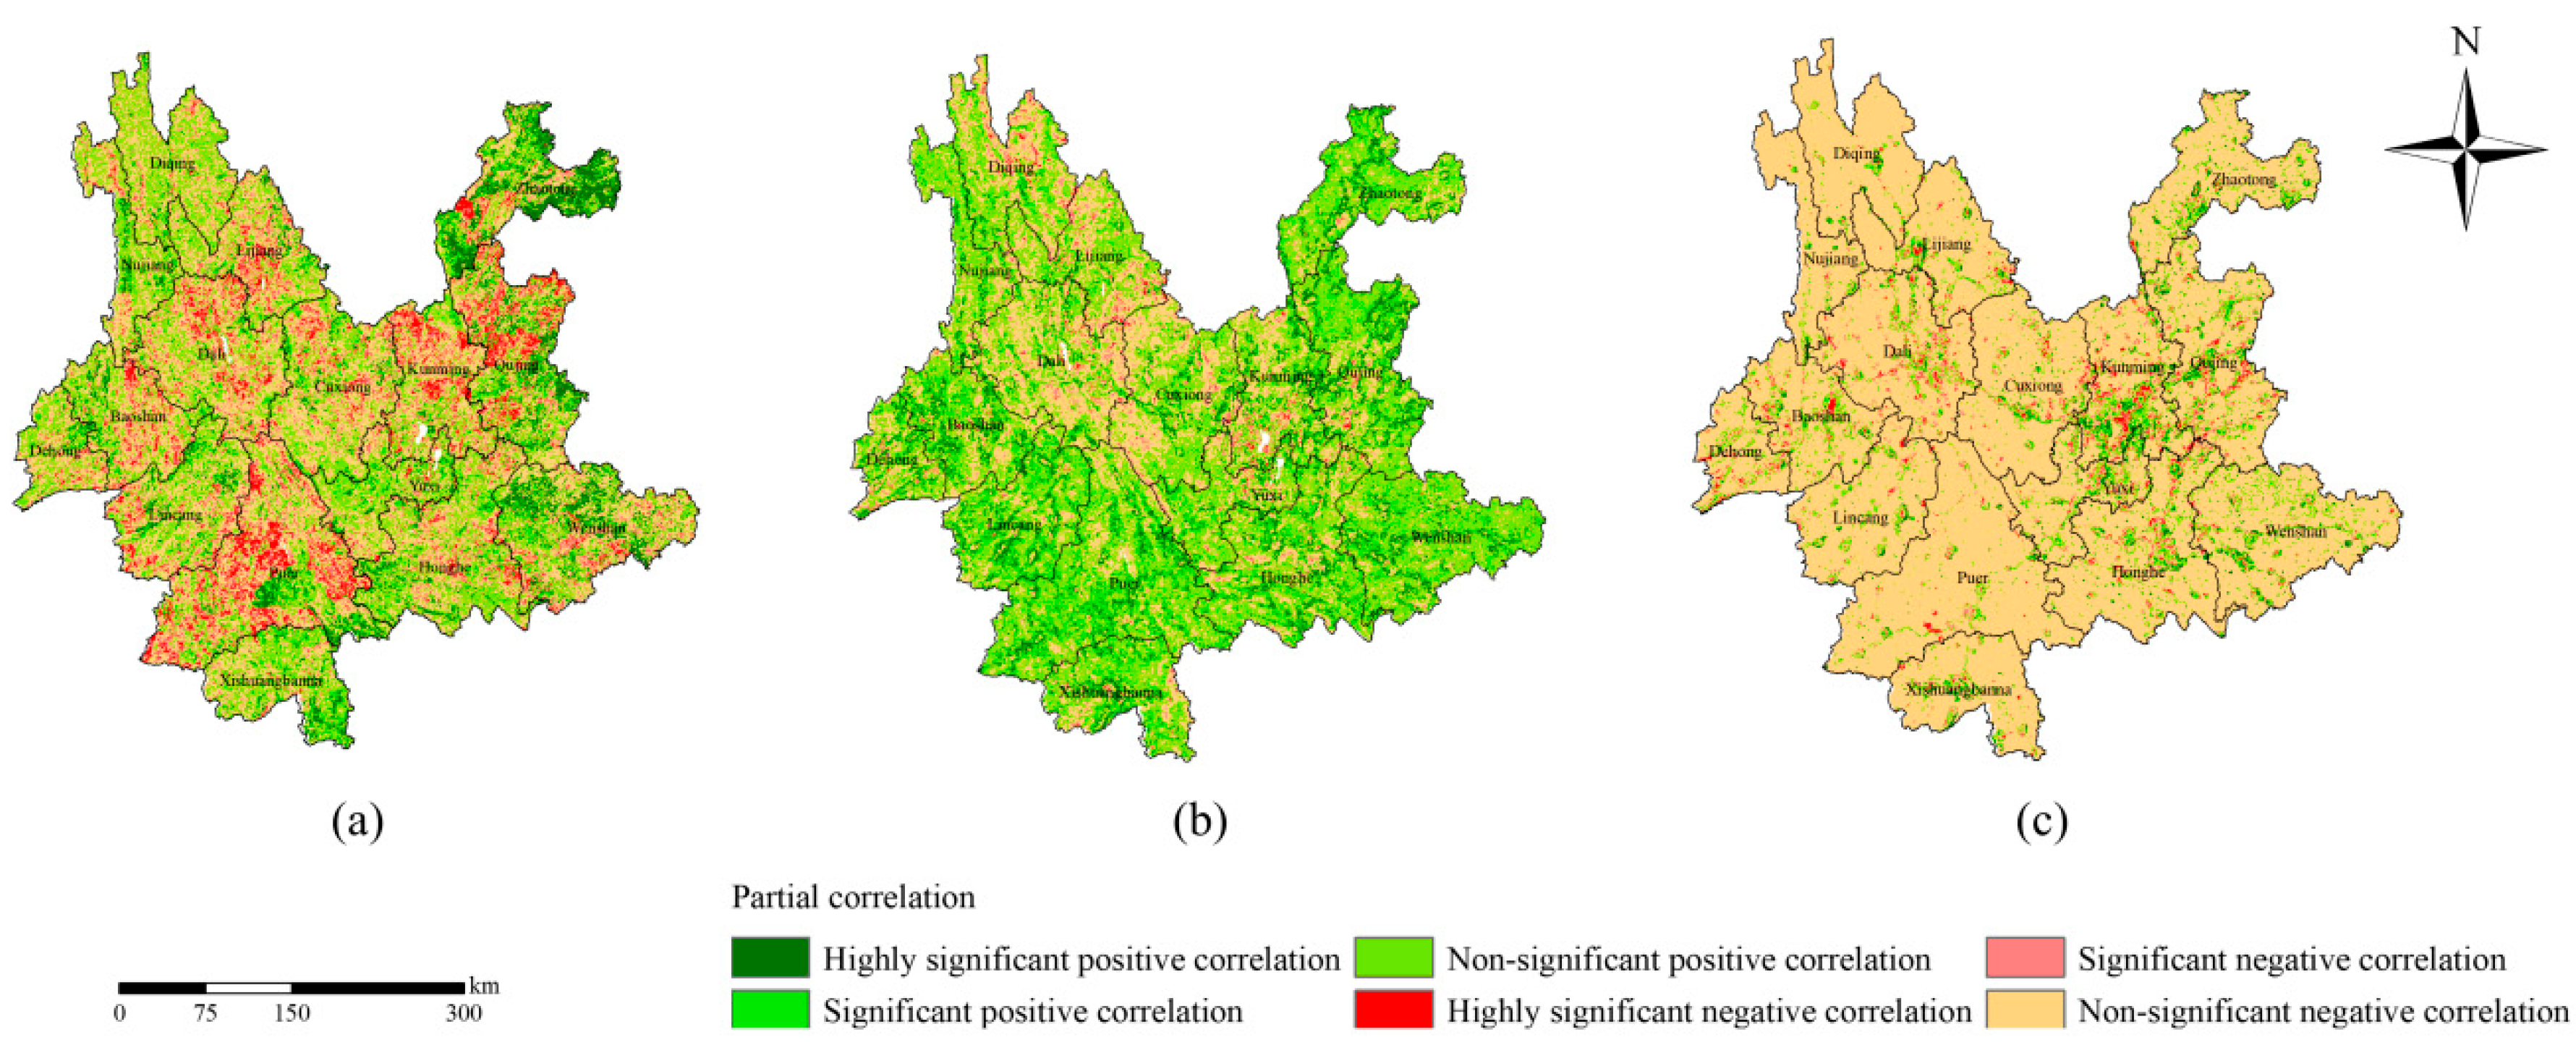
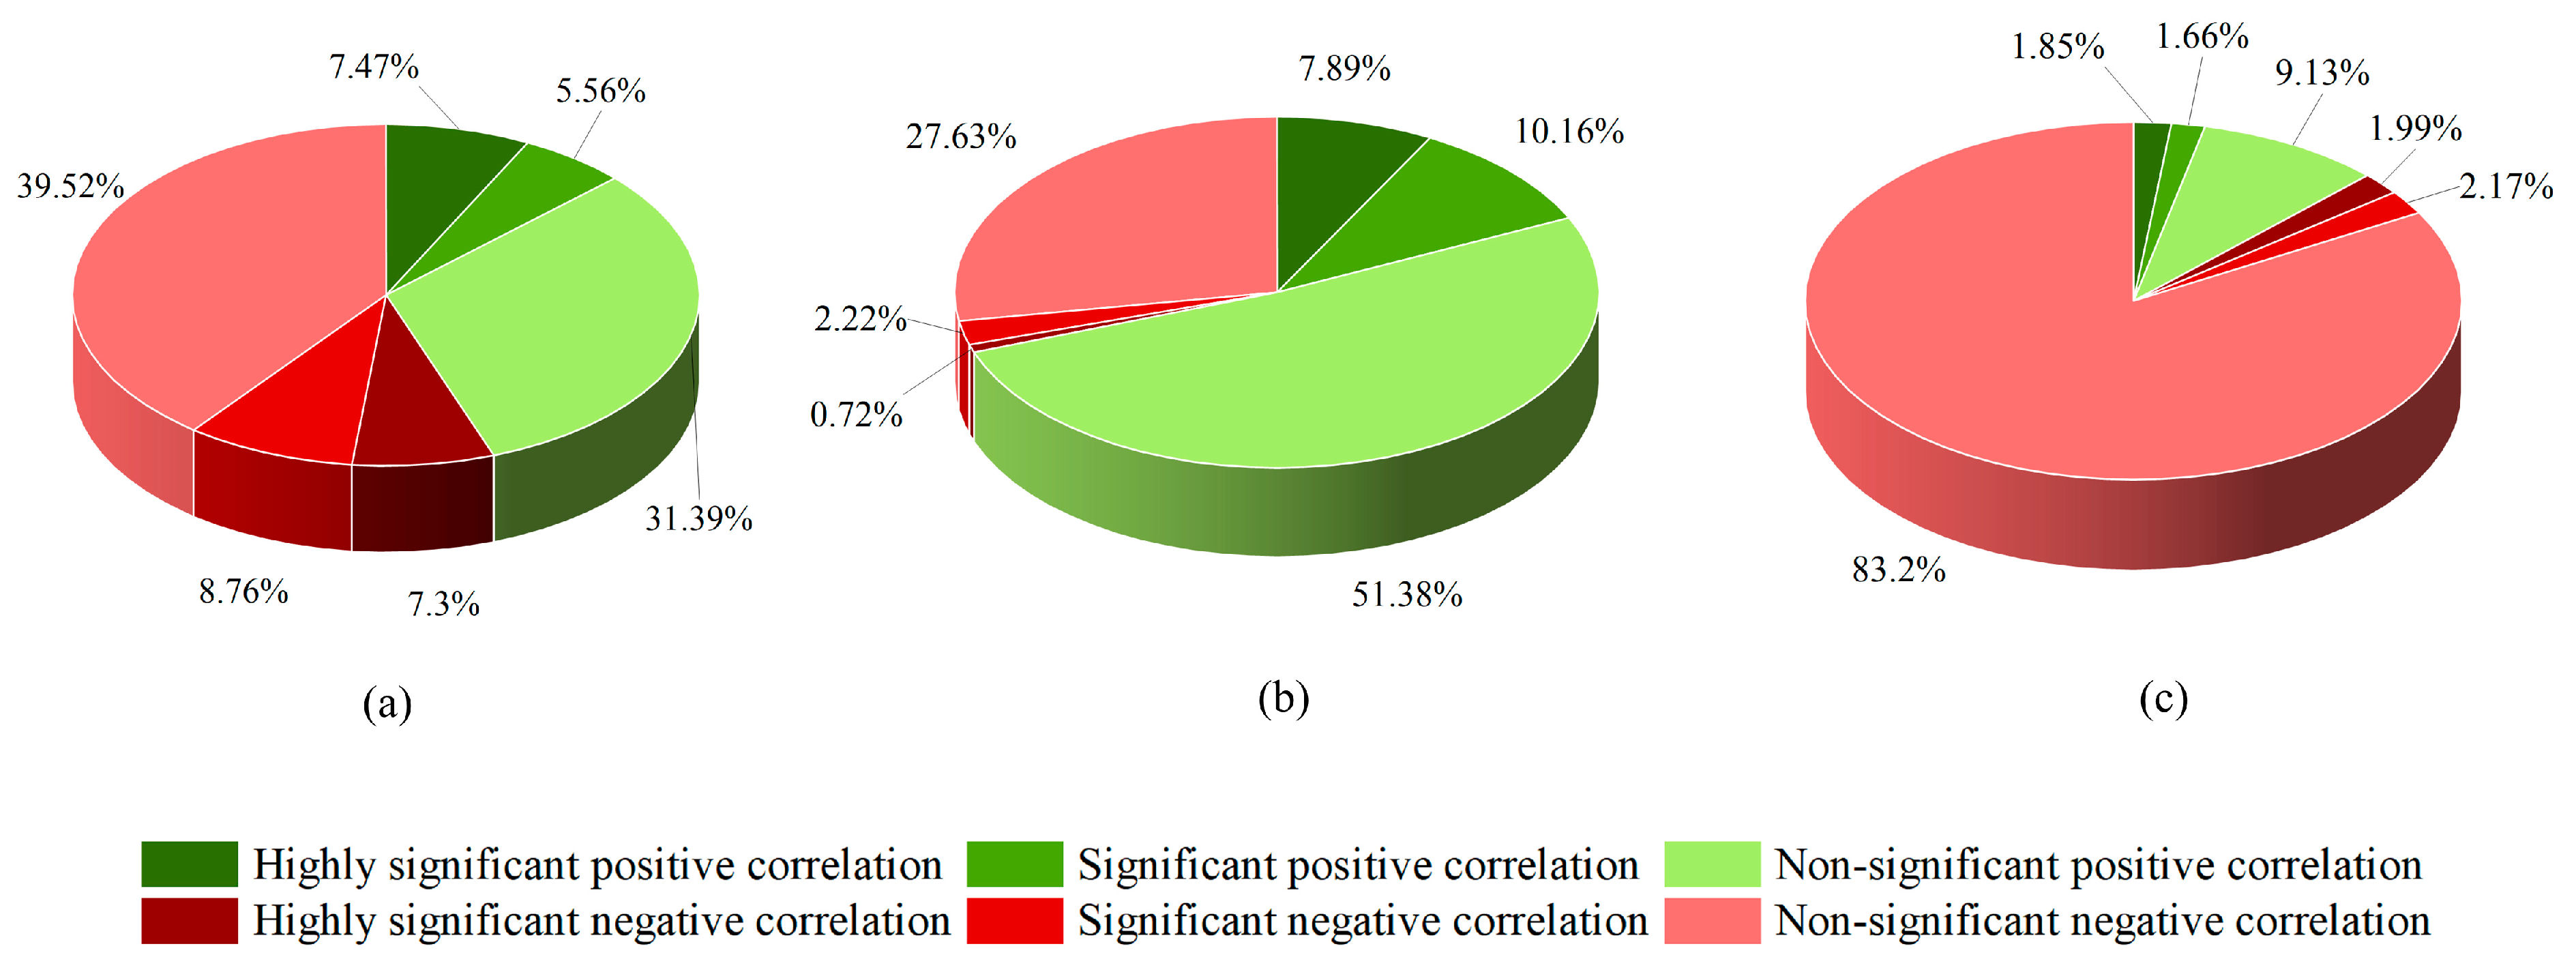
The NDVI was correlated with temperature, with coefficients spanning from −0.86 to 0.88. Areas with positive correlation accounted for 64.82%, with significantly and highly significantly positive regions mainly distributed in northern Zhaotong, southeastern Qujing, and eastern Wenshan. Areas with negative correlation accounted for 35.18%, with significantly negative regions concentrated in the border area between Baoshan and Lincang and southwestern Yuxi. The NDVI was correlated with precipitation, with coefficients spanning from −0.85 to 0.87. Positively correlated areas covered 59.57% of the province, particularly evident in eastern Yunnan, with Zhaotong showing the strongest signal. Negatively correlated regions (40.43%) were scattered across central and western Yunnan. The NDVI was correlated with sunshine duration, with coefficients spanning from −0.89 to 0.78. Positive correlation was observed in 35.16% of the region, notably in the northwestern and central Yunnan Plateau. Negative correlation was more widespread (64.84%), mainly in eastern, southwestern Yunnan, and areas such as Dali, Chuxiong, and Yuxi ( Figure 9; Figure 10).

3.2.2. Influence of Socioeconomics

The NDVI was correlated with population density, with coefficients spanning from −0.95 to 0.97. Positive correlations were found in 44.42% of the region, especially in eastern Yunnan, with Zhaotong being the most prominent. Negative correlations (55.58%) were mainly distributed in southwestern Yunnan, particularly in Pu’er. For GDP, the coefficient ranged from −0.95 to 0.98, with 69.44% of the area showing positive correlation, mostly in eastern and southern Yunnan. Negative correlation areas (30.56%) were scattered in northwestern Yunnan. The NDVI and nighttime light showed correlation coefficients ranging from −0.98 to 0.97. Only 12.65% of the region exhibited positive correlation, mostly scattered, with Kunming as the primary hotspot. Negative correlation areas (87.35%) were widespread, with higher concentrations in Kunming and Dali ( Figure 11; Figure 12).

3.2.3. Influence of Air Quality

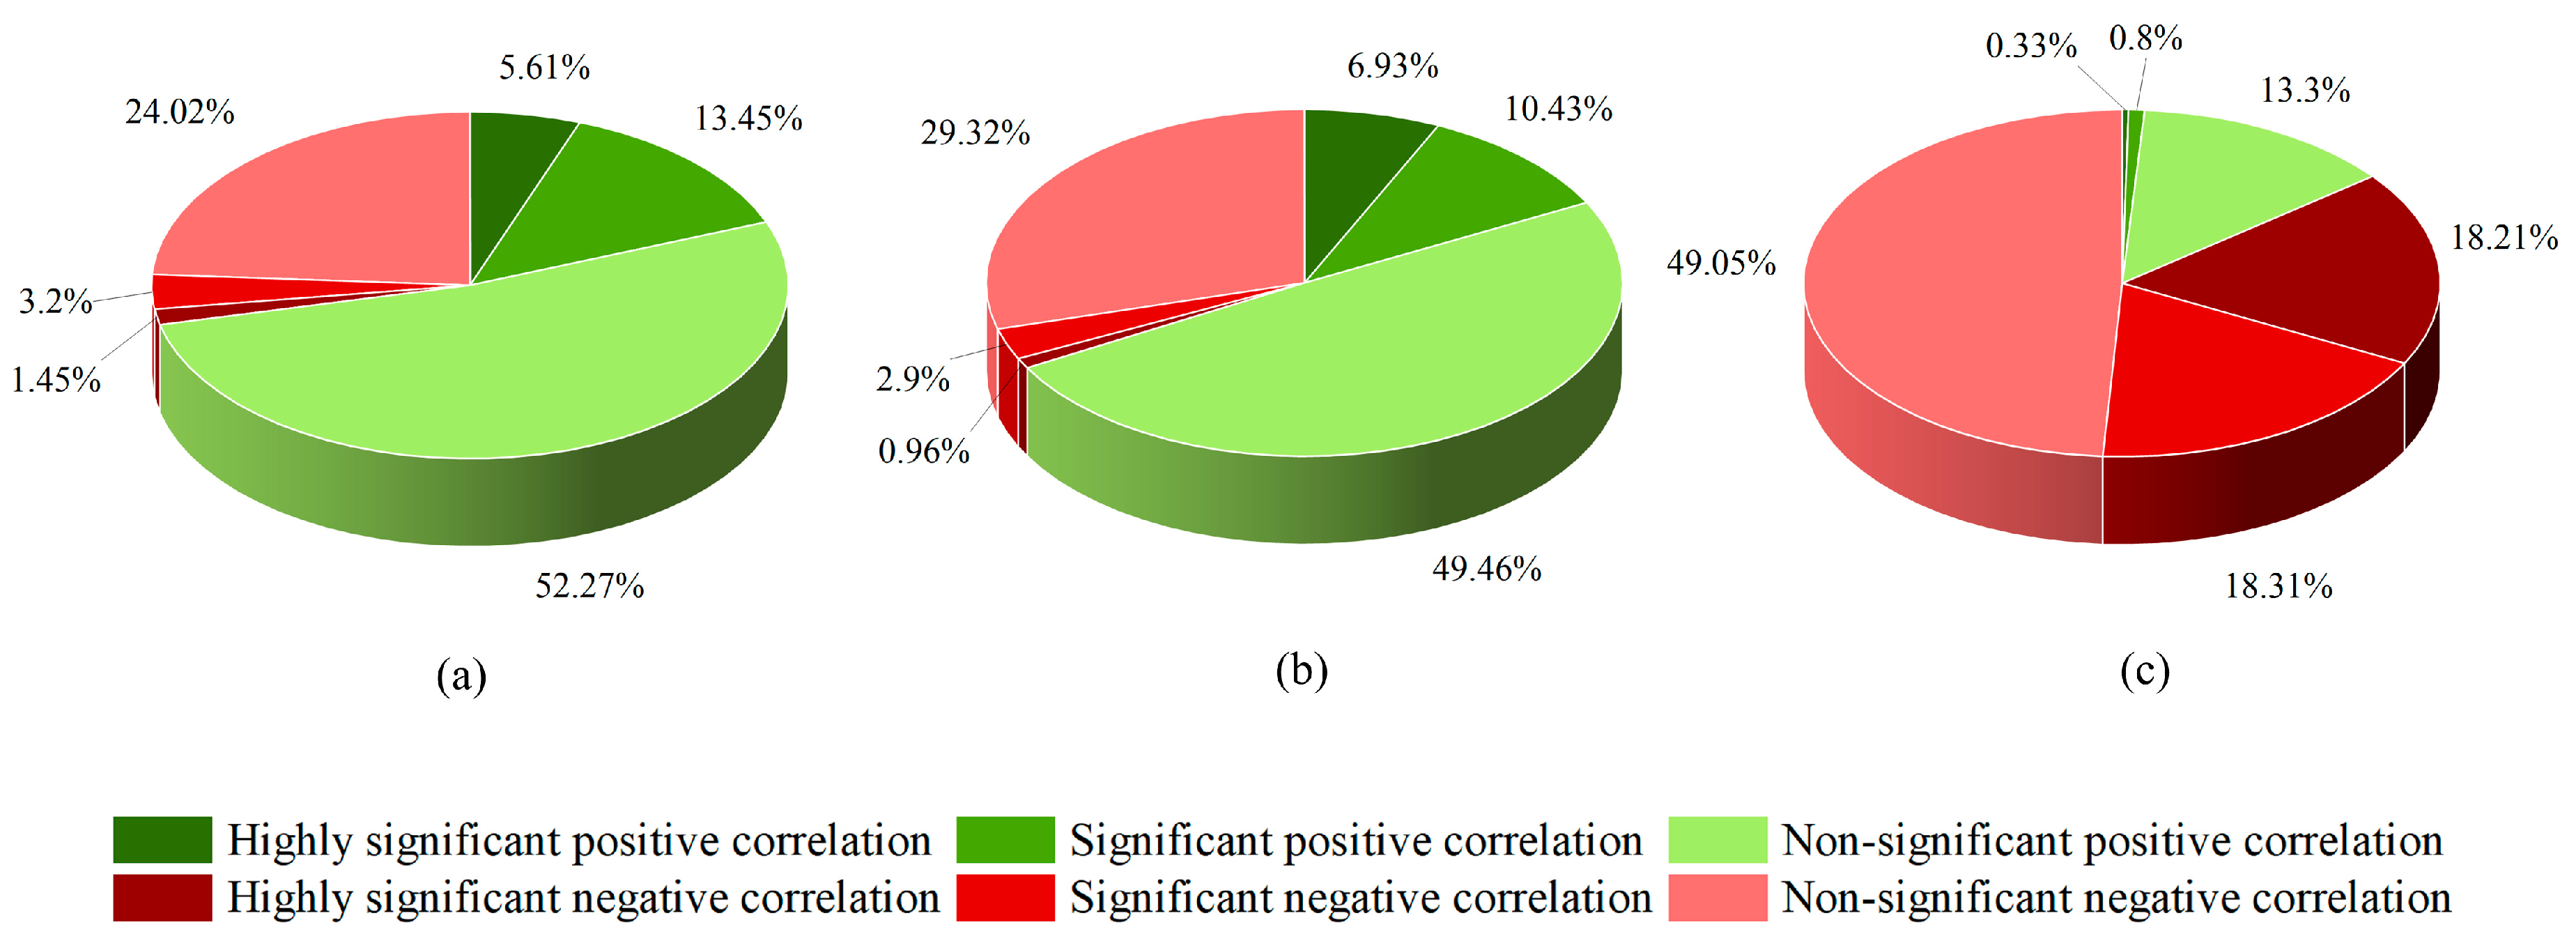
The NDVI was correlated with ozone (O3), with coefficients spanning from −0.90 to 0.87. Positive correlation areas covered 71.33%, mainly concentrated in northeastern and northwestern Yunnan, especially Zhaotong. Negative correlations (28.67%) were scattered in central Yunnan. For PM2.5, the correlation ranged from −0.87 to 0.95. Positive regions accounted for 66.82%, especially in Qujing, Wenshan, Baoshan, Dehong, and Lincang. Negative correlations (33.18%) were mostly found in southwestern Yunnan. The correlation coefficient between the NDVI and PM10 ranged from −0.97 to 0.86. Only 14.43% of the region showed positive correlation, concentrated in the northwestern plateau and southern Xishuangbanna. Negative correlation dominated 85.57% of the area, particularly in Baoshan, Dehong, Lincang, and Wenshan ( Figure 13; Figure 14).

3.2.4. Contribution Analysis

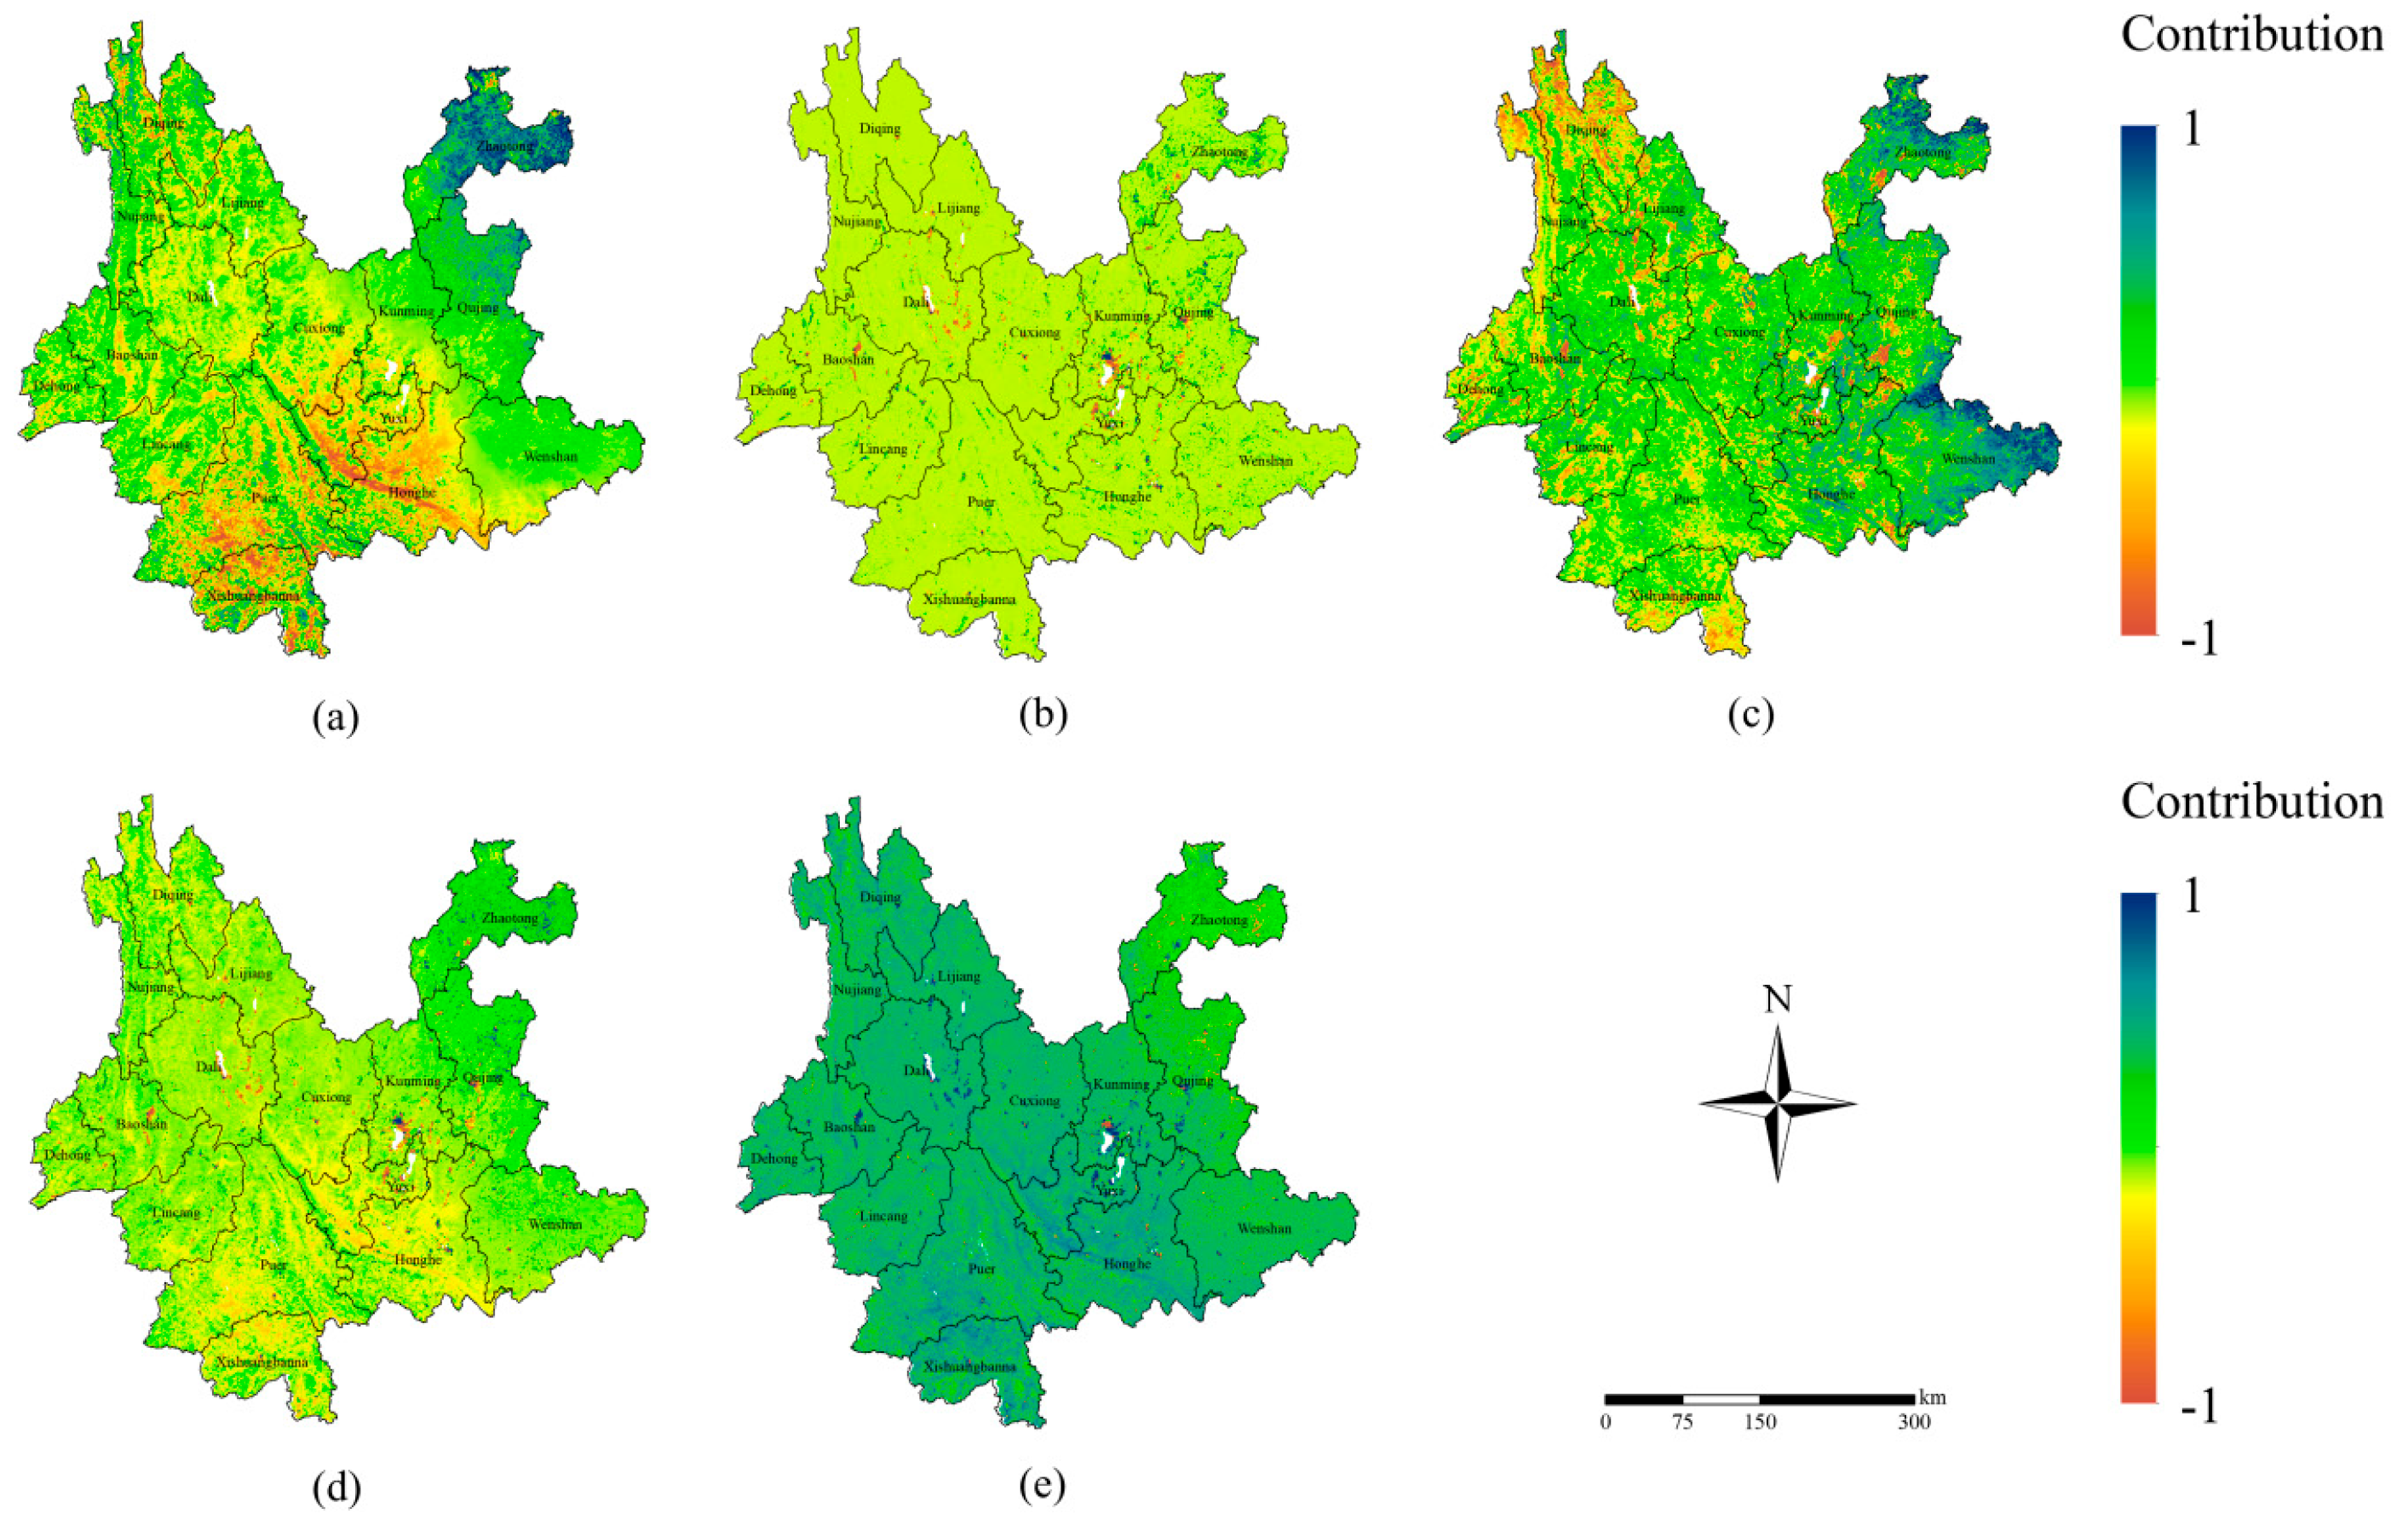
The average contributions of NDVI changes across the study period were as follows: Climate factors: 0.3436. Socioeconomic factors: 0.1153. Air quality factors: 0.2186. The combined contribution of these three categories was 0.6775, while other factors contributed −0.6744, indicating suppression.
The positive contribution of climatic factors is concentrated in northern Kunming, Zhaotong, Qujing, and Wenshan. Negative effects were found in central and southern Yunnan, particularly in Yuxi and Honghe.
Positive socioeconomic contributions were concentrated in eastern Yunnan, especially Zhaotong, while negative contributions were more prominent in Lijiang, northern Chuxiong, southern Kunming, and across much of southern Yunnan, especially southern Pu’er, southern Honghe, and Xishuangbanna.
Air quality improvements had widespread positive effects. However, negative effects were concentrated in northwestern Yunnan and southern Xishuangbanna.
Combined contributions of climate, socioeconomic, and air quality factors were strongly positive in eastern and western Yunnan, especially in Zhaotong, Kunming, Qujing, and Wenshan. Negative regions were mainly in southern Yunnan, especially Yuxi and Honghe.
Other factors mainly had inhibitory effects, concentrated in eastern Yunnan, while positive effects from other factors were mainly observed in southern Yunnan, particularly in Pu’er, Honghe, and Xishuangbanna (Figure 15 and Table 8).

3.2.5. Dominant Driving Factor Analysis

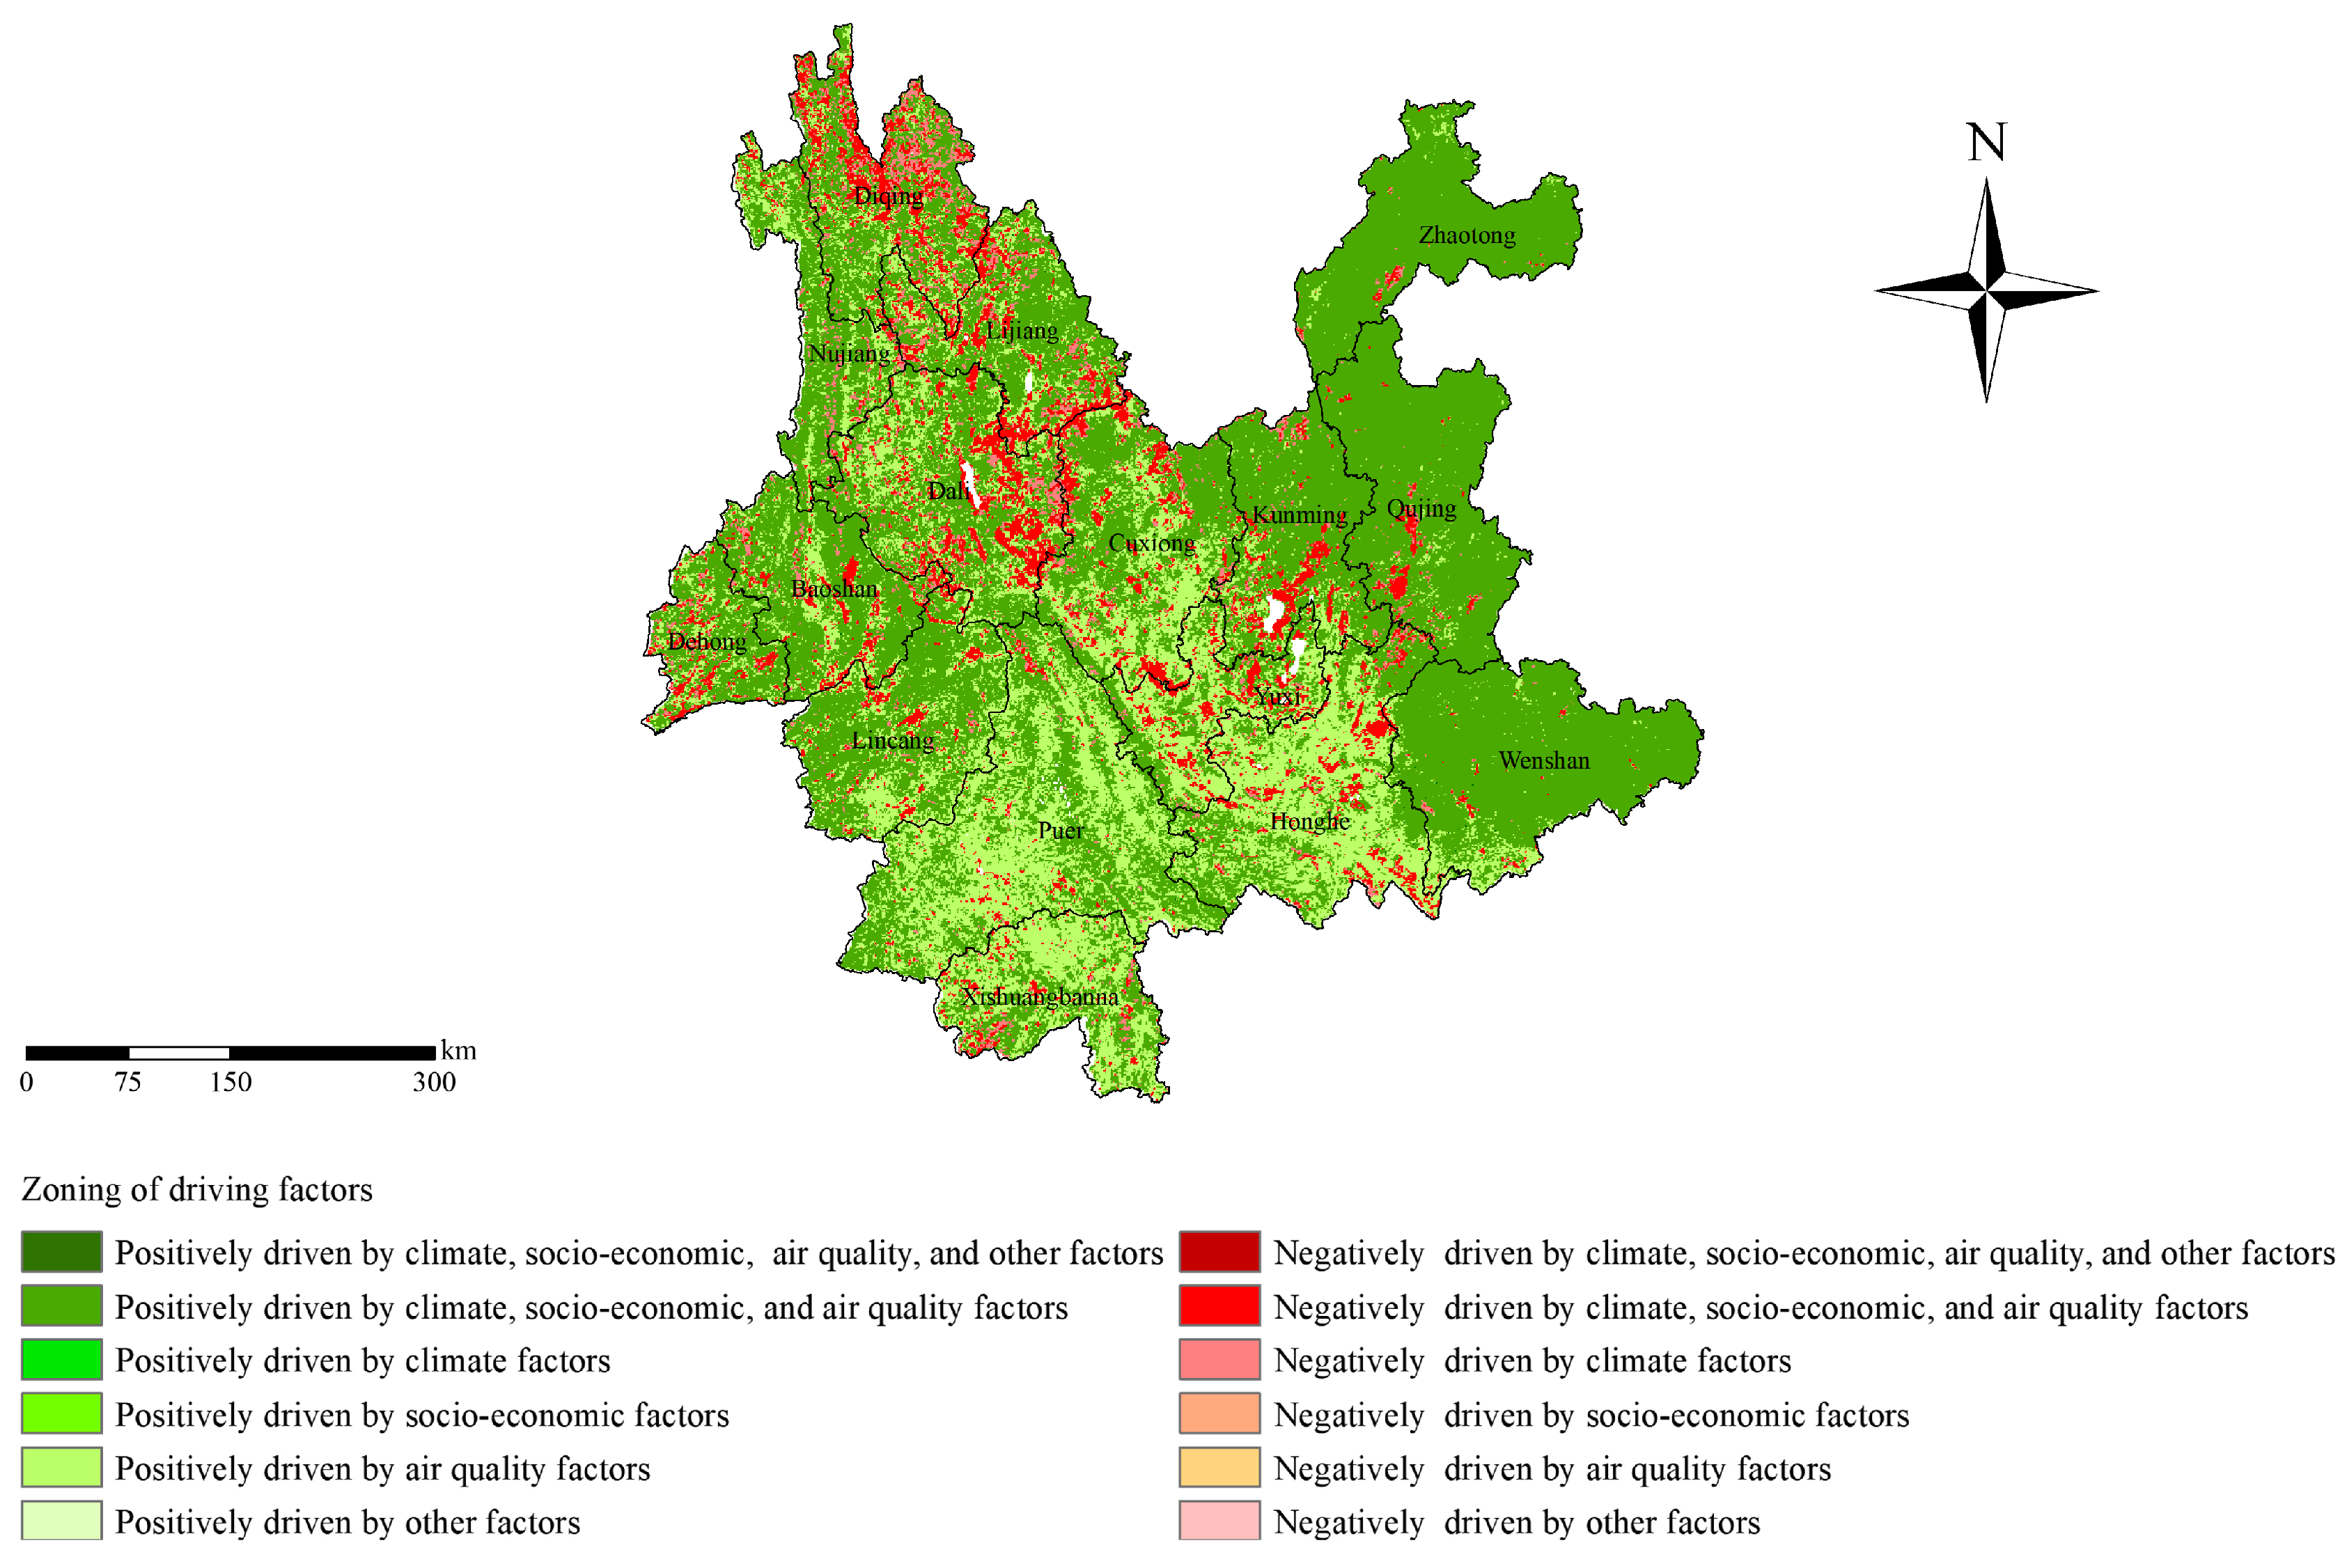
Based on the above results, a spatial partitioning of NDVI driving factors during the study period was performed: Areas where climate, socioeconomic, and air quality factors jointly drove NDVI increase were mainly located in eastern and western Yunnan, especially in Zhaotong, Kunming, Qujing, and Wenshan. Areas where other factors were dominant in NDVI increase were mainly found in Pu’er, Honghe, and Xishuangbanna. Other dominant types were scattered across the province. Areas where climate, socioeconomic, and air quality factors jointly drove NDVI decrease were scattered in central and northwestern Yunnan, as were regions dominated by other factors leading to NDVI decrease (Figure 16 and Table 9).

4. Discussion

4.1. Spatiotemporal Variations in NDVI

This study explored the spatiotemporal trends of the NDVI in Yunnan Province from 2001 to 2020 and analyzed the driving mechanisms from three perspectives: climate, socioeconomic, and air quality factors.
Temporally, NDVI in Yunnan exhibited a fluctuating upward trend, with an average value of 0.6342, ranging from 0.6063 to 0.6676, and an interannual growth rate of 0.0031. Upon comparison, this is generally consistent with previous studies on the NDVI in Yunnan Province, indicating its reliability [29]. This suggests a continuous improvement in the region’s greenness level, driven by national ecological programs and localized climatic amelioration. Since 2000, China has implemented several ecological forestry projects, such as reforestation and natural forest protection, effectively improving vegetation conditions in Yunnan, enhancing ecosystem greenness, and promoting regional ecological development. Particularly from 2011 to 2020, under national ecological strategies, vegetation coverage in Yunnan has been increasing steadily [30].
Spatially, the NDVI in Yunnan showed a distinct pattern of being higher in the south and west, and lower in the north and east, with an overall gradient increasing from northeast to southwest. This pattern is consistent with the province’s vegetation distribution and climatic zones. Yunnan spans multiple climatic subregions, from the highland climate in the northeast to tropical and subtropical zones in the southwest, where dense forest ecosystems dominate. Compared to other vegetation types, forests have more complex structures and deeper root systems, enabling better interception of solar radiation and more efficient use of soil resources, thus enhancing photosynthesis, promoting vegetation growth, and increasing carbon sequestration. In contrast, the northeastern region, with a subtropical semi-arid climate and predominantly grassland use, exhibits lower NDVI. The northwestern area, characterized by high-altitude alpine climates, shows the lowest NDVI due to cold temperatures and limited vegetation, mainly herbaceous plants.
In terms of spatial stability, the southwestern region of Yunnan, with its warm and humid climate, displays lush vegetation and strong ecological stability, with small NDVI fluctuations. The northeast, despite human activity, also shows a relatively stable NDVI. In contrast, the Diqing Tibetan Autonomous Prefecture in the northwest, being ecologically fragile and part of the plateau climate zone, is subject to large NDVI fluctuations likely driven by snowline changes on Meili Snow Mountain. Moreover, the NDVI declines in urban and peri-urban areas such as eastern Dali, southern Kunming, and eastern Yuxi can be attributed to rapid urbanization and industrialization, which replace natural vegetation with built-up land [31].
Additionally, the Hurst index-based forecast suggests that while NDVI trends are expected to persist in most regions, some ecologically fragile areas—such as alpine zones and hot-dry valleys—face a risk of trend reversal. These areas also showed high coefficient of variation (CV), indicating lower ecosystem stability and underscoring the need for continued ecological protection.

4.2. Analysis of NDVI Driving Factors

From the perspective of driving forces, climate remains the dominant factor influencing NDVI changes. For 20 years, Yunnan has experienced a warming and drying trend. In most areas, precipitation and temperature play a positive role in the NDVI. However, in western and northwestern Yunnan, these correlations are negative. This is due to the region’s steep terrain and predominance of alpine meadows, where excessive rainfall can lead to waterlogging and soil erosion, inhibiting vegetation growth. In the southwest, abundant rainfall can cause overly moist soil and flooding, which also hinder plant growth [32]. Regarding temperature, the Hengduan Mountains in the west exhibit high elevations and low temperatures that limit plant growth, while the tropical forests in the south may experience growth suppression under excessive heat. The suppressive effect of sunshine duration is evident in regions like Dali, Chuxiong, and Yuxi, where frequent cloudy and rainy weather limits photosynthetically active radiation, thus constraining vegetation growth.
Socioeconomic factors are another important driver of regional NDVI changes, particularly in Yunnan, where ecological diversity coexists with strong development demands [33]. These factors have dual effects. On one hand, high population density and rapid urbanization lead to land conversion from forest and farmland to urban infrastructure, reducing green coverage and lowering NDVI. On the other hand, in economically developed regions like eastern Yunnan, large-scale ecological restoration projects (e.g., afforestation and grassland recovery) have been effectively implemented, significantly boosting the NDVI. Conversely, in ecologically fragile and less-developed areas such as the northwest, complex terrain and limited economic resources hinder ecological recovery efforts. This implies that a solid economic foundation and proactive ecological governance can mitigate the negative ecological impacts of urbanization.
Air quality factors also influence the NDVI with significant spatial variability and dual characteristics. In high-altitude forested and relatively unpolluted ecological protection zones (e.g., northwestern Yunnan), ozone (O3) appears to promote NDVI increases. This may be attributed to the stimulatory effects of low-concentration ozone on plant physiological processes, enhancing photosynthesis and antioxidant enzyme activity, thereby improving stress resistance. However, in more industrialized and densely populated central regions, elevated O3 concentrations exceed vegetation tolerance thresholds, leading to oxidative damage in leaf tissues, suppressed photosynthesis, and a reduced NDVI [34]. For aerosols (PM2.5 and PM10), in areas with good air quality, moderate levels of particulate matter can enhance the NDVI. This is because aerosols scatter sunlight, increasing diffuse radiation that penetrates deeper into plant canopies, thereby improving photosynthesis in shaded leaves. Aerosols can also alter microclimates by reducing vapor pressure deficits and transpiration rates. In cooler climates, aerosol deposition can warm soils by absorbing solar radiation, indirectly supporting plant growth [35]. Additionally, some aerosol components can enhance soil structure and nutrient content, further benefiting vegetation [33]. However, under high aerosol concentrations, particles may impede normal plant metabolism, inhibit photosynthesis, and degrade plant health. Harmful components in aerosols may alter soil pH, nutrient availability, and microbial composition, causing toxic effects and disrupting plant physiological processes. Therefore, the impact of air pollutants on the NDVI is not linear but is modulated by pollutant levels, spatial context, and ecological responses. Monitoring and mitigation strategies should thus prioritize pollution-sensitive vegetation regions, supported by both ground observations and remote sensing tools to establish a robust framework for assessing vegetation responses to air pollution.
Other factors, such as pest outbreaks and natural disasters, may also inhibit the NDVI. Although these factors are difficult to quantify directly, they play vital roles in ecosystem dynamics and can significantly affect vegetation greenness.
Despite its widespread use, the NDVI is prone to saturation and may not fully capture canopy or physiological changes. Future studies should integrate other vegetation indices to better assess plant physiological responses. The present study focuses on quantifying the contributions of climate, socioeconomic, and air quality factors to NDVI variation. However, other factors such as land use, natural disasters, and topographic conditions also exert significant influences on the NDVI. Due to limitations in data availability or scale incompatibility, these variables were not included in the model, which may have led to an underestimation or omission of certain driving mechanisms. In addition, deeper spatial heterogeneity has not been fully captured. Even within regions dominated by the same driving factors, the response patterns and sensitivities of the NDVI may vary considerably due to differences in landforms, vegetation types, or management regimes. Therefore, future studies should incorporate methods with stronger spatial and causal inference capabilities—such as geographically weighted regression (GWR) and structural equation modeling (SEM)—to more precisely analyze the driving mechanisms behind NDVI changes.

5. Conclusions

This study quantitatively assessed the spatiotemporal dynamics and driving forces of NDVI in Yunnan Province from 2001 to 2020, integrating climate, socioeconomic, and air quality variables through multiple statistical approaches.
(1)
The findings revealed a generally increasing NDVI trend, with over 87% of the region showing vegetation improvement, especially in the south and west. Despite this positive trend, areas of potential greenness decline remain, underscoring the need for region-specific monitoring and interventions.
(2)
Climate variables, particularly temperature and precipitation, alongside GDP and air pollutants such as O3 and PM2.5, were identified as key contributors to NDVI dynamics, jointly explaining a substantial portion of the observed variability. However, the inverse impact of other factors, including land use changes, topographic constraints, and potential data uncertainties, suggests that NDVI evolution is shaped by complex and interacting mechanisms.
(3)
Notably, 61% of NDVI increases were attributable to the joint effect of the three major factor groups, highlighting the importance of considering compound drivers rather than isolated variables. Still, in declining NDVI zones, the dominant role of unmodeled or local factors suggests limitations in current modeling approaches.
Therefore, it is recommended that Yunnan Province establish an ecological management framework centered on “zonal governance and targeted intervention”. For areas with continuously declining the NDVI or high fluctuation, ecological restoration projects should be prioritized. In regions where high pollution overlaps with ecological sensitivity, the adoption of green and clean energy alternatives should be promoted. At the policy level, the implementation of ecological compensation mechanisms should be advanced to ensure a dynamic balance between ecological protection and regional development.

Author Contributions

Writing, original draft preparation, experimental analysis, Z.L.; data monitoring and thesis revision, C.L.; data collection, C.Z.; data collection, M.W. All authors have read and agreed to the published version of the manuscript.

Funding

Supported by Yunnan Fundamental Research Projects: “Precise Remote Sensing Prediction of Forest Carbon Stocks in Yunnan Province Based on Spatiotemporal Characteristics” (grant NO. 202401AT070272) and Open Fund Project of Forestry Discipline and Key Laboratory: “Accurate Estimation of Forest Carbon Storage and Research on Spatial Imbalance of Data Based on Multi-source Remote Sensing Data Synergy” (grant NO. LXXK-2025M11).

Data Availability Statement

The NDVI data that were used in the study are openly available at https://developers.google.com/earth-engine/datasets/ (accessed on 25 March 2025). The climate data and socioeconomic data that were used in the study are openly available at https://www.resdc.cn/ (accessed on 25 March 2025). The air quality data that were used in the study are openly available at https://data.tpdc.ac.cn/ (accessed on 25 March 2025).

Conflicts of Interest

The authors declare no conflicts of interest.

References

  1. Wang, Z.; Wu, J.; Li, M.; Cao, Y.; Tilahun, M.; Chen, B. The variability in sensitivity of vegetation greenness to climate change across Eurasia. Ecol. Indic. 2024, 163, 112140. [Google Scholar] [CrossRef]
  2. Bai, Z.; Wu, Q.; Zhou, M.; Tian, Y.; Sun, J.; Jiang, F.; Xu, Y.-P. An Integrated Framework for NDVI and LAI Forecasting with Climate Factors: A Case Study in Oujiang River Basin, Southeast China. Forests 2025, 16, 1075. [Google Scholar] [CrossRef]
  3. Han, Y.; Lin, Y.; Zhou, P.; Duan, J.; Cao, Z. Dynamic change, driving mechanism and spatiotemporal prediction of the normalized vegetation index: A case study from Yunnan Province, China. Front. Ecol. Evol. 2023, 11, 1177849. [Google Scholar] [CrossRef]
  4. Townshend, J.R.G.; Goff, T.E.; Tucker, C.J. Multitemporal dimensionality of images of normalized difference vegetation index at continental scales. IEEE Trans. Geosci. Remote Sens. 2007, 6, 888–895. [Google Scholar] [CrossRef]
  5. Chen, C.; Park, T.; Wang, X.; Piao, S.; Xu, B.; Chaturvedi, R.K.; Fuchs, R.; Brovkin, V.; Ciais, P.; Fensholt, R.; et al. China and India lead in greening of the world through land-use management. Nat. Sustain. 2019, 2, 122–129. [Google Scholar] [CrossRef] [PubMed]
  6. Sharma, I.; Tongkumchum, P.; Ueranantasun, A. Regression Analysis of Normalized Difference Vegetation Index (NDVI) to Compare Seasonal Patterns and 15 Year Trend of Vegetation from East to West of Nepal. Nat. Environ. Pollut. Technol. 2021, 20, 267–273. [Google Scholar] [CrossRef]
  7. Morawitz, D.F.; Blewett, T.M.; Cohen, A.; Alberti, M. Using NDVI to assess vegetative land cover change in central Puget Sound. Env. Environ. Monit. Assess. 2006, 114, 85–106. [Google Scholar] [CrossRef]
  8. Eastman, J.; Sangermano, F.; Machado, E.; Rogan, J.; Anyamba, A. Global Trends in Seasonality of Normalized Difference Vegetation Index (NDVI), 1982–2011. Remote Sens. 2013, 5, 4799–4818. [Google Scholar] [CrossRef]
  9. Pang, G.; Wang, X.; Yang, M. Using the NDVI to identify variations in, and responses of, vegetation to climate change on the Tibetan Plateau from 1982 to 2012. Quat. Int. 2017, 444, 87–96. [Google Scholar] [CrossRef]
  10. Verbyla, D.; Kurkowski, T.A. NDVI–Climate relationships in high-latitude mountains of Alaska and Yukon Territory. Arct. Antarct. Alp. Res. 2019, 51, 397–411. [Google Scholar] [CrossRef]
  11. Zoungrana, B.J.B.; Conrad, C.; Thiel, M.; Amekudzi, L.K.; Da, E.D. MODIS NDVI trends and fractional land cover change for improved assessments of vegetation degradation in Burkina Faso, West Africa. J. Arid. Environ. 2018, 153, 66–75. [Google Scholar] [CrossRef]
  12. Pu, M.; Zhao, Y.; Ni, Z.; Huang, Z.; Peng, W.; Zhou, Y.; Liu, J.; Gong, Y. Spatial-Temporal Evolution and Driving Forces of NDVI in China’s Giant Panda National Park. Int. J. Environ. Res. Public Health 2022, 19, 6722. [Google Scholar] [CrossRef]
  13. Li, M.; Guan, J.; Zheng, J. Climate Drivers Contribute in Vegetation Greening Stalls of Arid Xinjiang, China: An Atmospheric Water Drying Effect. Water 2022, 14, 2019. [Google Scholar] [CrossRef]
  14. Yang, W.; Zhao, Y.; Wang, Q.; Guan, B. Climate, CO2, and Anthropogenic Drivers of Accelerated Vegetation Greening in the Haihe River Basin. Remote Sens. 2022, 14, 268. [Google Scholar] [CrossRef]
  15. Nemani, R.R.; Keeling, C.D.; Hashimoto, H.; William, M.; Jolly, W.M.; Piper, S.C.; Tucker, C.J.; Myneni, R.B.; Running, S.W. Climate-driven increases in global terrestrial net primary production from 1982 to 1999. Science 2003, 300, 1560–1563. [Google Scholar] [CrossRef]
  16. Verbyla, D. Comparison of eMODIS and MOD/MYD13A2 NDVI products during 2012–2014 spring green-up periods in Alaska and northwest Canada. Int. J. Appl. Earth Obs. Geoinf. 2015, 36, 83–86. [Google Scholar] [CrossRef]
  17. Xu, X. Annual Spatial Interpolation Dataset of Meteorological Elements in China; Register and Publishing System of Resources and Environmental Science Data Center: Beijing, China, 2022. [Google Scholar] [CrossRef]
  18. Xu, X. Spatial Distribution Dataset of Population in China on a 1 km Grid; Register and Publishing System of Resources and Environmental Science Data Center: Beijing, China, 2017. [Google Scholar] [CrossRef]
  19. Xu, X. Spatial Distribution Dataset of GDP in China on a 1 km Grid; Register and Publishing System of Resources and Environmental Science Data Center: Beijing, China, 2017. [Google Scholar] [CrossRef]
  20. Xu, X. Annual Nighttime Light Dataset of China; Register and Publishing System of Resources and Environmental Science Data Center: Beijing, China, 2022. [Google Scholar] [CrossRef]
  21. Wei, J.; Li, Z. ChinaHighO3: High-Resolution and High-Quality Ground-Level MDA8 O3 Dataset for China (2000–2023); National Tibetan Plateau/Third Pole Environment Data Center: Beijing, China, 2023. [Google Scholar] [CrossRef]
  22. Wei, J.; Li, Z. ChinaHighPM2.5: High-Resolution and High-Quality Ground-Level PM2.5 Dataset for China (2000–2023); National Tibetan Plateau/Third Pole Environment Data Center: Beijing, China, 2023. [Google Scholar] [CrossRef]
  23. Wei, J.; Li, Z. ChinaHighPM10: High-Resolution and High-Quality Ground-Level PM10 Dataset for China (2000–2023); National Tibetan Plateau/Third Pole Environment Data Center: Beijing, China, 2023. [Google Scholar] [CrossRef]
  24. Liu, H.; Na, Y.; Wu, Y.; Li, Z.; Qu, Z.; Lv, S.; Jiang, R.; Sun, N.; Hao, D. Spatiotemporal Patterns of Vegetation Coverage and Its Response to Land-Use Change in the Agro-Pastoral Ecotone of Inner Mongolia, China. Land 2025, 14, 1202. [Google Scholar] [CrossRef]
  25. Chang, J.; Liu, Q.; Wang, S.; Huang, C. Vegetation Dynamics and Their Influencing Factors in China from 1998 to 2019. Remote Sens. 2022, 14, 3390. [Google Scholar] [CrossRef]
  26. Hong, C.; Jin, X.; Ren, J.; Gu, Z.; Zhou, Y. Satellite data indicates multidimensional variation of agricultural production in land consolidation area. Sci. Total. Environ. 2019, 653, 735–747. [Google Scholar] [CrossRef] [PubMed]
  27. Zhang, X.; Wang, X.; Zohner, C.M.; Penuelas, J.; Li, Y.; Wu, X.; Zhang, Y.; Liu, H.; Shen, P.; Jia, X.; et al. Declining precipitation frequency may drive earlier leaf senescence by intensifying drought stress and enhancing drought acclimation. Nat. Commun. 2025, 16, 910. [Google Scholar] [CrossRef] [PubMed]
  28. Yan, Y.; Liu, X.; Wen, Y.; Ou, J. Quantitative analysis of the contributions of climatic and human factors to grassland productivity in northern China. Ecol. Indic. 2019, 103, 542–553. [Google Scholar] [CrossRef]
  29. Xia, K.; Huang, Y. Spatiotemporal Changes and Driving Factors of Vegetation in Yunnan Based on MODIS-NDVI. J. South. Agric. 2023, 54, 3427–3437. [Google Scholar] [CrossRef]
  30. Li, M.; Yin, L.; Zhang, Y.; SU, X.; Liu, G.; Wang, X.; Ao, Y.; Wu, X. Spatio-temporal variation and driving factors of vegetation cover in Southwest China based on MODIS-EVI. Acta Ecol. Sin. 2022, 31, 1080–1090. (In Chinese) [Google Scholar]
  31. Tu, Y.; Jiang, L.; Liu, R.; Xiao, Z.; Min, J. Spatiotemporal changes of vegetation NDVI and its driving forces in China during 1982–2015. Trans. Chin. Soc. Agric. Eng. 2021, 37, 75–84. (In Chinese) [Google Scholar] [CrossRef]
  32. Li, Z.; Wang, X.; Xu, Y.; Wen, L.; Huang, L. Changes of Net Primary Productivity of vegetation from 1996 to 2015 in Shangri-La region, China. Acta Ecol. Sin. 2022, 42, 266–276. (In Chinese) [Google Scholar] [CrossRef]
  33. Pan, S.; Tian, H.; Lu, C.; Dangal, S.R.S.; Liu, M. Net primary production of major plant functional types in China: Vegetation classification and ecosystem simulation. Acta Ecol. Sin. 2015, 35, 28–36. [Google Scholar] [CrossRef]
  34. Ping, Q.; Fang, C.; Yuan, X.; Agathokleous, E.; He, H.; Zheng, H.; Feng, Z. Nitrogen addition changed the relationships of fine root respiration and biomass with key physiological traits in ozone-stressed poplars. Sci. Total Environ. 2023, 875, 162721. [Google Scholar] [CrossRef] [PubMed]
  35. Wang, Z.; Wang, C.; Wang, X.; Wang, B.; Wu, J.; Liu, L. Aerosol pollution alters the diurnal dynamics of sun and shade leaf photosynthesis through different mechanisms. Plant Cell Environ. 2022, 45, 2943–2953. [Google Scholar] [CrossRef] [PubMed]
Figure 1. Administrative zoning map of Yunnan Province.
Forests 16 01303 g001
Figure 2. Annual NDVI variation trend in Yunnan Province.
Forests 16 01303 g002
Figure 3. Annual spatial distribution of NDVI in Yunnan Province.
Forests 16 01303 g003
Figure 4. Variation coefficient of NDVI in Yunnan Province.
Forests 16 01303 g004
Figure 5. NDVI trends in Yunnan Province from 2001 to 2020.
Forests 16 01303 g005
Figure 6. Significance test of NDVI trend change.
Forests 16 01303 g006
Figure 7. Distribution of NDVI Hurst exponent in Yunnan Province.
Forests 16 01303 g007
Figure 8. Future trend of NDVI in Yunnan Province.
Forests 16 01303 g008
Figure 9. Partial correlation between NDVI and climatic factors in Yunnan Province. (a) NDVI and temperature. (b) NDVI and precipitation. (c) NDVI and sunshine duration.
Forests 16 01303 g009
Figure 10. Area proportion of partial correlation between NDVI and climate. (a) NDVI and temperature. (b) NDVI and precipitation. (c) NDVI and sunshine duration.
Forests 16 01303 g010
Figure 11. Partial correlation between NDVI and socioeconomic factors in Yunnan Province. (a) NDVI and population density. (b) NDVI and GDP. (c) NDVI and nighttime light intensity.
Forests 16 01303 g011
Figure 12. Area proportion of partial correlation between NDVI and socioeconomic. (a) NDVI and population density. (b) NDVI and GDP. (c) NDVI and nighttime light intensity.
Forests 16 01303 g012
Figure 13. Partial correlation between NDVI and air quality factors in Yunnan Province. (a) NDVI and O3. (b) NDVI and PM2.5. (c) NDVI and PM10.
Forests 16 01303 g013
Figure 14. Area proportion of partial correlation between NDVI and air quality. (a) NDVI and O3. (b) NDVI and PM2.5. (c) NDVI and PM10.
Forests 16 01303 g014
Figure 15. Contribution of various factors to NDVI change in Yunnan Province. (a) Climatic contribution. (b) Socioeconomic contribution. (c) Air quality contribution. (d) Combined contribution of climate, socioeconomic, and air quality factors. (e) Contribution of other factors.
Forests 16 01303 g015
Figure 16. Zoning of dominant factors of NDVI changes in Yunnan Province.
Forests 16 01303 g016
Table 1. Mann–Kendall test trend categories.
βZTrend CategoryTrend Characteristics
β > 0Z > 2.584Extremely significant increase
1.96 < Z ≤ 2.583Significant increase
1.65 < Z ≤ 1.962Slightly significant increase
Z ≤ 1.651Not significant increase
β = 0Z0No change
β < 0Z ≤ 1.65−1Not significant decrease
1.65 < Z ≤ 1.96−2Slightly significant decrease
1.96 < Z ≤ 2.58−3Significant decrease
Z > 2.58−4Extremely significant decrease
Table 2. Classification criteria for future change trends.
βHTrend CategoryTrend Characteristics
β > 00.5 < H < 11Continuously increasing
β > 00 < H < 0.52Shift from increasing to decreasing
β < 00.5 < H < 13Continuously decreasing
β < 00 < H < 0.54Shift from decreasing to increasing
β = 0H = 05Unpredictable trend
Table 3. Coefficient of variation stable category.
CVStability Category
Vj ≤ 0.05Low fluctuation
0.05 < Vj ≤ 0.10Relatively low volatility
0.10 < Vj ≤ 0.15Moderate fluctuation
0.15 < Vj ≤ 0.20Relatively high fluctuation
Vj > 0.20High fluctuation
Table 4. Area proportion of mean NDVI.
Mean NDVIProportion of Area
>0.81.87%
0.6–0.864.83%
0.4–0.631.08%
0.2–0.41.89%
<0.20.33%
Table 5. Area proportion of NDVI variability.
VariabilityProportion of Area
Low Variability54.73%
Relatively Low Variability42.1%
Moderate Variability2.57%
Relatively High Variability0.38%
High Variability0.22%
Table 6. Area proportion of NDVI spatial trend change.
Characteristics of ChangeProportion of Area
Extremely significant increase54.34%
Significant increase10.23%
Slightly significant increase4.6%
Not significant increase18.69%
No change0.12%
Not significant decrease8.21%
Slightly significant decrease0.8%
Significant decrease1.21%
Extremely significant decrease1.8%
Table 7. Area proportion of future NDVI change characteristics.
Characteristics of ChangeProportion of Area
Continuously increasing40.11%
Shift from increasing to decreasing47.86%
Continuously decreasing6.24%
Shift from decreasing to increasing5.76%
Unpredictable trend0.03%
Table 8. Area proportion of NDVI contribution by each factor.
TypeContribution ValueArea Proportion of Positive InfluenceArea Proportion of Negative Influence
Climatic0.343652.44%47.56%
Socioeconomic0.115376.46%23.54%
Air Quality0.218689.82%10.18%
Combined Contribution of Climate, Socioeconomic, and Air Quality0.677564.14%35.86%
Other Factors−0.674464.08%35.92%
Table 9. Area proportion of dominant factors driving NDVI change.
Dominant TypeFactor TypeProportion of Area
PositivelyCombined Contribution of Climate, Socioeconomic, Air Quality, and Other Factors0.1%
Combined Contribution of Climate, Socioeconomic, and Air Quality61%
Climatic1.3%
Socioeconomic0.2%
Air Quality1.5%
Other Factors23.75%
NegativelyCombined Contribution of Climate, Socioeconomic, Air Quality, and Other Factors0.1%
Combined Contribution of Climate, Socioeconomic, and Air Quality4%
Climatic0.3%
Socioeconomic0.4%
Air Quality0.35%
Other Factors7%
Disclaimer/Publisher’s Note: The statements, opinions and data contained in all publications are solely those of the individual author(s) and contributor(s) and not of MDPI and/or the editor(s). MDPI and/or the editor(s) disclaim responsibility for any injury to people or property resulting from any ideas, methods, instructions or products referred to in the content.