Article

Decoding China’s Smart Forestry Policies: A Multi-Level Evaluation via LDA and PMC-TE Index

1
Department of Forestry Economics & Management, Northeast Forestry University, Harbin 150040, China
2
School of Business, Anyang Institute of Technology, Anyang 455000, China
*
Author to whom correspondence should be addressed.
Forests 2025, 16(8), 1297; https://doi.org/10.3390/f16081297
Submission received: 11 July 2025 / Revised: 5 August 2025 / Accepted: 6 August 2025 / Published: 8 August 2025

Abstract

Smart forestry is gaining global prominence as countries seek to modernize forest governance through digital technologies and data-driven approaches. In China, smart forestry serves as a central pillar of ecological modernization, with policy playing a pivotal role in shaping its development. This study addresses these gaps by proposing an integrated evaluation framework combining thematic modeling via Latent Dirichlet Allocation (LDA) and structural assessment using the Policy Modeling Consistency–Text Encoder (PMC-TE) index. A total of 82 national and provincial policy documents (2009–2025) were analyzed to identify 13 core topics and categorize instruments into supply-side, demand-side, and environmental types. To assess structural coherence, a PMC-TE index was constructed based on a nine-variable, 32-indicator framework, with results visualized through three-dimensional PMC surfaces. Structural evaluation based on the PMC-TE index indicates that while most policies fall within the “good” or “excellent” range, notable gaps remain between policy objectives and the instruments employed to achieve them. Beyond China, the proposed framework provides a replicable tool for evaluating smart forestry governance in other countries undergoing digital transitions. The findings further highlight the need to enhance demand-side participation, strengthen closed-loop governance mechanisms, and promote cross-sectoral coordination to achieve greater policy coherence.

1. Introduction

1.1. Background

Smart forestry is gaining global prominence as countries seek to modernize forest governance through digital technologies and data-driven approaches. In China, smart forestry serves as a central pillar of ecological modernization, representing a critical intersection between digital transformation and environmental governance. Smart forestry is defined as the integration of digital technologies and infrastructures, including the Internet of Things (IoT), artificial intelligence (AI), and remote sensing, into forest management for the purpose of monitoring environmental change, optimizing resource use, and addressing forest degradation [1,2,3]. It addresses the pressing need to balance resource use, biodiversity conservation, and climate adaptation, and has become increasingly prominent under national initiatives such as “Digital China” and “New Infrastructure.” As a forestry-rich nation with vast forest resources and ecological responsibilities, China is actively advancing its smart forestry agenda. While grounded in the Chinese context, the strategic frameworks and analytical approaches adopted in this study offer broader relevance for other countries navigating digital–environmental governance transitions.
The development of smart forestry in China is inherently policy-driven due to the dispersed nature of forestry infrastructure, the long ecological cycles, and the involvement of multiple governance actors. Market mechanisms alone are insufficient to sustain such a complex transformation; policy creation and management have played a key role in the rapid development of China’s smart forestry. Economic incentives and regulatory instruments, in particular, have played a crucial role in expanding forest cover and improving resource governance, thereby highlighting the significance of coherent policy design and implementation [4]. Since the late 2000s, China has established a multi-tiered and multi-dimensional policy system, which encompasses political, ecological, economic, and technological dimensions to expedite the digitalization of forest governance. Although the intention behind the formulation of a given policy is often evident, extracting and quantifying the effectiveness of policy implementation from a large number of policy texts presents a multifaceted challenge [5]. However, as policy volume increases, concerns have emerged regarding their internal coherence, instrument alignment, and strategic consistency across governance levels. Clarifying these structural issues, such as internal coherence and policy instrument alignment, can inform both theoretical exploration and practical policy-making, particularly in contexts undergoing digital transformation in forest governance.

1.2. Literature Review

While smart forestry is increasingly prioritized within global digital governance agendas, academic research remains fragmented, especially in rapidly evolving contexts where technological innovation is not yet effectively integrated with institutional and policy systems.

1.2.1. Research on Smart Forestry

Existing research on smart forestry is commonly classified into three major streams: conceptual frameworks, socio-environmental perspectives, and technological implementation.
Conceptual studies highlight the potential of smart systems for real-time monitoring, automated decision-making, and intelligent management [6]. Recent contributions integrate AI, digital twins, and remote sensing to enhance climate resilience, carbon sequestration, and system intelligence [7]. While these works offer theoretical models and overviews of enabling technologies, they frequently lack empirical validation, limiting their applicability in real-world forest governance settings.
Socio-environmental studies regard smart forestry as a sociotechnical system embedded within dynamic governance structures. Researchers examine how data-driven forest management reconfigures authority, governance, and public participation [2]. Scholars emphasize community participation and institutional support as key to successful smart forestry governance in diverse regional contexts [8] and highlight the need for climate-smart forestry policies to explicitly address social equity, transparency, and trade-offs within forest governance systems [9]. Extending this line of inquiry, growing attention has been directed toward the role of institutional and social innovation in supporting the transition toward smart and climate-resilient forestry. These innovations refer to new governance arrangements, collaborative decision-making processes, and adaptive learning mechanisms that go beyond traditional policy instruments. The Horizon 2020 SIMRA project (Social Innovation in Marginalized Rural Areas) has demonstrated how social innovation can improve policy responsiveness and empower local actors in forest management across diverse European contexts [10,11]. Similarly, research on climate-smart forestry highlights the need to complement digitalization with flexible, multilevel institutional frameworks capable of managing social-ecological complexity [12]. A composite climate-smart index developed for Mediterranean forests integrates not only ecological indicators but also social criteria based on stakeholder input, emphasizing that digital tools must be embedded within socially responsive governance systems [13]. In addition, comparative studies across Europe have shown that social innovation can act as both a driver and an outcome of institutional change, with bottom-up initiatives often shaping new policy configurations and institutional arrangements [14].
The field of technological implementation studies has undergone significant developments, with a notable emphasis on the advancement of digital tools, the establishment of data infrastructures, and the integration of artificial intelligence systems to facilitate the management and operation of forests [7,15]. For instance, IoT-linked digital twin systems enable fully integrated timber harvesting workflows, significantly improving efficiency, traceability, and real-time responsiveness in forestry operations [16]. Compared to earlier conceptual contributions, these studies place greater emphasis on engineering feasibility, practical deployment, the alignment of digital technologies with tangible ecological indicators, and operational performance metrics.

1.2.2. Policy Evaluation Methods and Analytical Tools

Research on forestry policy research has undergone a substantial paradigm shift, transitioning from post-implementation impact assessments to more forward-looking, structural approaches to policy design and coherence. This shift encompasses three key dimensions: (i) methodological innovation in causal analysis, (ii) the advancement of text-based policy structure evaluation, and (iii) the conceptual development of policy instrument frameworks. However, smart forestry policy studies remain fragmented in connecting these dimensions into an integrated analytical model.
(i)
Causal Inference and Empirical Evaluation
Traditional evaluations have focused primarily on the ecological or socioeconomic outcomes of policy implementation [17]. In recent years, the text-mining techniques and remote sensing-panel fixed effects have been used to match text-generated policy intensity indices with forest cover change data to estimate causal policy impacts [4]. New methods such as Bayesian Causal Forests (aBCF) and Difference-in-Differences Causal Forests (DiD-BCF) now offer more precise estimation of heterogeneous policy effects in hierarchical datasets [18,19]. These models address non-linearity, staggered adoption, and group-level treatment heterogeneity, providing greater robustness compared to classical parametric models.
(ii)
Policy Text Analysis and Structure Modeling
The application of computational text analysis methods, such as Latent Dirichlet Allocation (LDA), has enabled systematic identification of latent themes and governance priorities within large volumes of policy documents [20]. The incorporation of text-mining indicators into spatial causal frameworks not only reduces evaluation expenses but also enhances empirical support for programs such as payments for ecosystem services (PES), forest certification, and REDD+ [21]. Recent studies have combined text mining with quasi-experimental causal inference, enabling the simultaneous testing of “policy structure” and “actual effects.” Structural evaluation models, including the Policy Modeling Consistency (PMC) index and various policy coherence metrics, offer robust tools for assessing internal consistency and alignment between policy goals and implementation mechanisms [22]. The DEA model and the synthetic control method have also been employed to evaluate the effectiveness of environmental policy instruments [23]. Furthermore, when combined with stakeholder interviews and framework perception methods [24,25]. However, few smart forestry policy studies have employed these models to evaluate coherence between digital governance tools, ecological goals, and socioeconomic priorities.
(iii)
Policy Instrument Typologies and Governance Logic
Early policy studies often sorted tools into the classic legal, economic, and informational buckets [26]. Policy instrument classification frameworks, particularly the tripartite categorization into supply-oriented, demand-oriented, and institutional tools, have enhanced the analysis of instrument diversity and design logic [27]. These policy instruments are crafted to generate particular regulatory outcomes, subtly reflecting the anticipated behaviors of those being governed and the normative expectations regarding appropriate forms of governance [28]. Despite reflecting past political decisions and shaping future governance trajectories, policy instruments remain insufficiently integrated into policymaking, particularly during the formulation and evaluation stages [29,30]. With this shift in focus, scholars now view policy tools as hybrid elements embedded within diverse governance models rather than as independent measures. Such hybrid configurations not only reflect the legacy of past institutional choices but also stimulate novel forms of governance innovation [31]. In forestry, regulatory controls, economic incentives, and information campaigns are frequently utilized concurrently to achieve objectives related to both ecological conservation and livelihood improvement [32,33]. Effective policy design should account for the actual governance practices or “rules-in-use,” recognizing that diverse instruments may be concurrently implemented on a single land unit [34].

1.2.3. Remaining Gaps in the Literature

Despite substantial progress in theoretical development, technological applications, and the understanding of social and environmental impacts, current smart forestry research still faces notable structural deficiencies. There is a lack of systematic analyses concerning the thematic frameworks and underlying logic behind the allocation of policy tools. Although some scholars have conceptualized smart forestry as a socio-technical system that integrates digital technologies with governance mechanisms, empirical research on the internal consistency of policy frameworks, governance logics, and tool interdependencies remains limited.
Second, current policy evaluation methods primarily emphasize post-implementation effects or ecological outcomes, offering insufficient attention to forward-looking frameworks that assess policy design, structural coherence, and tool coordination. This shortcoming is especially evident in the rapidly evolving domain of smart forestry, where the rationality of policy design and the effectiveness of tool configuration are critical for achieving ecological governance goals.
Third, although methodologies such as Latent Dirichlet Allocation (LDA), the Policy Modeling Consistency (PMC) index, and policy instrument classification frameworks have gained traction, their empirical application within the context of smart forestry policies is still in the early stages. Most existing studies apply these methods in isolation, without constructing a cohesive analytical framework that bridges policy themes, tool deployment, and implementation outcomes.
As a result, the field lacks a scalable and integrated approach to evaluating the structural rationality of smart forestry policies. This fragmentation not only constrains theoretical development but also hampers evidence-based policymaking in multi-level governance contexts. To address these challenges, there is an urgent need to develop a unified analytical framework that connects policy content, instrument design, and governance coherence in a systematic and scalable manner.

1.3. Research Objectives and Contribution

In response to these identified gaps, this study proposes and operationalizes an integrated analytical framework to examine the structural design and internal coherence of smart forestry policies across different levels of government. The proposed framework combines Latent Dirichlet Allocation (LDA) for extracting thematic structures, a tripartite classification of policy instruments, and the Policy Modeling Consistency–Text Encoder (PMC-TE) index to evaluate policy coherence. Applied to a curated corpus of national and provincial policy texts, this framework enables a comprehensive and scalable evaluation of policy themes, instrument configurations, and structural coherence in China’s smart forestry governance.
This study contributes to the existing research in three important ways:
(i)
Theoretically, this study contributes to the ongoing shift from outcome-based to structure-oriented policy analysis, enriching the understanding of how digital governance logics are embedded in multi-level smart forestry policy design.
(ii)
Methodologically, it builds a replicable and scalable framework integrating textual analysis, instrument classification, and coherence modeling for complex environmental policy.
(iii)
Practically, it delivers empirical insights into the structural configuration and underlying logic of smart forestry policies and offers a transferable framework for improving policy coherence in other national and regional contexts undergoing digital transformation in environmental governance.

2. Materials and Methods

To systematically assess the design effectiveness of China’s smart forestry policies, this study developed a methodological framework integrating LDA topic modelling with the PMC-TE index model. The overall research process is illustrated in Figure 1, which delineates a structured and iterative approach to text-based policy analysis and evaluation. The process begins with the collection and preprocessing of policy documents issued by central and provincial-level forestry administrations. These documents form the raw material for the construction of an analyzable policy text corpus, which serves as the foundation for downstream analysis.
Second, the LDA theme model was employed to identify core issues in policy texts, combined with keyword analysis to identify policy tool types, thereby clarifying ‘what to do’ and ‘how to do it’.
Third, around the identified themes and tools, a multi-level indicator system was designed, which consists of two complementary parts: (i) theme-derived indicators, extracted directly from the LDA results to reflect empirically grounded priorities; and (ii) literature-derived indicators, drawn from existing academic frameworks to enhance conceptual validity and comparability. These indicators serve as inputs to the PMC-TE index model, a quantitative evaluation tool that assesses the internal structure, coherence, and implementation logic of each policy.
Finally, the framework proceeds to the policy evaluation stage, which synthesizes insights from both the thematic and instrumental dimensions. This method facilitates a deep semantic exploration of policy content, improves the structural consistency and comparability of evaluation outcomes, and provides both theoretical grounding and empirical evidence for optimizing China’s smart forestry policy system.

2.1. Data Collection and Preprocessing

2.1.1. Data Collection

This study collected smart forestry policy documents issued between 2009 and 2025 by multi-level forestry administrations across China to enable a comprehensive examination of policy development. The collection process involved manual browsing and keyword-based retrieval from the official websites of key government agencies, including the National Forestry and Grassland Administration, the Ministry of Natural Resources, provincial departments of forestry, and municipal-level bureaus in selected regions.
A total of 82 smart forestry-related policy documents were compiled. These documents include strategic plans, regulatory notices, implementation guidelines, and technical standards. To ensure the reliability and authority of the corpus, this study selected policy documents issued by central- and provincial-level governments. Central government documents reflect the overarching strategic direction and national agenda for smart forestry development. At the provincial level, three representative regions were selected. Fujian Province, as an early pioneer of smart forestry, stands out for its investments in digital infrastructure and active local innovation. In contrast, Heilongjiang and Jilin represent the northeastern state-owned forest areas, which are central to China’s national ecological security strategy and serve as key regions for the implementation of ecological protection and digital transformation initiatives under resource constraints.
Documents were screened for relevance and substance. Policies that were purely procedural, e.g., meeting announcements, duplicative without major updates, or lacking implementation content were excluded. The final corpus ensures coverage of multiple types of policy instruments and provides a reliable foundation for textual analysis and model-based evaluation in the subsequent research stages.

2.1.2. Text Preprocessing

To ensure the model quality, this study constructed a Chinese policy text preprocessing workflow within a Python (3.12.4)-based environment, which primarily includes four steps: cleaning, word segmentation, stop-word removal, and high-frequency word extraction.
First, the text was formatted using regular expressions to remove the date of issuance, document number, name of the issuing authority, and invalid symbols, retaining the core content with semantic value. Second, the text was segmented using the Jieba segmentation tool, and a custom domain dictionary was loaded, containing over 300 terms related to smart forestry to enhance the accuracy of identifying complex policy terminology. Third, a custom stop-word list was constructed by combining general stop-words with policy-specific terms, and the segmentation results were further filtered to exclude words with low semantic contribution. Finally, all cleaned documents were saved in word sequence format, and word frequencies were counted to extract high-frequency keywords, providing corpus support for constructing the LDA model’s word bag. This process uniformly processed policy texts from multiple central and local sources, laying a semantic consistency and structurally standardized data foundation for subsequent topic identification and policy tool analysis.

2.2. Identification of Policy Themes

2.2.1. LDA Topic Modeling Approach

This study used the Latent Dirichlet Allocation (LDA) model for thematic modeling to identify potential thematic structures in smart forestry policy texts. The LDA model is one of the most widely adopted topic modeling methods. It is a statistical model that applies algorithms to semantic analysis and corpus clustering in order to discover and learn text topics in an unsupervised manner [19]. LDA offers several advantages, including scalability for large corpora, resilience against overfitting, and the capacity for unsupervised learning, making it well-suited for discovering latent topics in unstructured policy texts [35]. Due to these strengths, LDA has shown superior performance in large-scale semantic analysis tasks [36,37] and has been extensively applied in fields such as natural language processing, text mining, policy classification, and information retrieval [38].
Following text cleaning and word segmentation, this study employed the Gensim toolkit to create a dictionary and a bag-of-words model. Topic modeling was then performed based on the LDA method. To improve the stability and semantic validity of the model, terms with frequencies of less than three or more than 50% were removed from the dictionary during the construction process.
One of the key parameters in the LDA model is the number of topics, K. To avoid semantic confusion (too few topics) or structural redundancy and overfitting (too many topics), this study conducted a grid search within the range K = 2 to 20. The following four mainstream evaluation metrics were introduced to provide a comprehensive evaluation of each candidate model:
  • Topic Coherence: This measures the co-occurrence of keywords within each topic, reflecting the semantic coherence of the topic. Higher values indicate tighter semantic cohesion within the topic. This study used the c_v metric for calculation.
  • Perplexity: This measures the model’s ability to predict unseen documents. A lower value indicates a stronger ability to generalize. This study used log-perplexity for measurement.
  • Kullback–Leibler divergence (KL divergence): It measures the deviation between the average topic distribution learned by the model and the theoretical uniform distribution, reflecting topic distinctiveness.
  • Jensen–Shannon divergence (JSD): A symmetric improvement of KL divergence that is used to assess the balance and separability of the overall topic distribution. Values range from 0 to 1.
This study further identified the optimal number of topics by comprehensively comparing the above metrics and plotting trends, and then constructed the final model based on this number. During the modeling process, all LDA models were trained using 50 passes and 800 iterations with a fixed random seed to ensure reproducibility. Following model training, keyword lists were generated for each topic, and typical policy texts were identified based on the topic-document distribution results to support subsequent categorization of policy instruments and structural analysis.

2.2.2. Topic Identification and Policy Selection

Following the completion of text preprocessing and LDA topic modelling, this study identified 13 topics covering multi-dimensional issues such as ‘smart forestry construction,’ ‘ecological protection and restoration,’ and ‘forest resource rights confirmation.’ These topics are said to comprehensively reflect the core focus and semantic structure of China’s current smart forestry-related policies.
The affiliation probability of each policy text under each topic was calculated based on the document-topic distribution matrix output by the LDA model. This distribution is indicative of the semantic association degree of policy texts under different topics, providing a quantitative basis for selecting representative texts. Referring to existing practices in topic modelling applications where documents with the highest topic proportions are used as representatives for downstream tasks [39]. For each of the 13 identified topics, the top two policy texts with the highest affiliation probabilities were selected, resulting in a total of 26 representative documents. This sampling strategy balances thematic representation and analytical feasibility while preserving the diversity of policy content. This screening strategy ensures balanced representation of each theme at the sample level while maximizing the retention of structural differences and content characteristics among policies, thereby enhancing the interpretability and coverage of subsequent analyses. To illustrate the representativeness of the selected texts, the corpus covers supply-side, demand-side, and environmental instruments at both central and provincial levels. Central documents include guidelines such as the Forestry Cloud Development Opinions (2017) and the “14th Five-Year Plan” Forestry and Grassland Protection Outline (2021). At the provincial level, Fujian issued digital platform construction plans, while Heilongjiang and Jilin introduced regulations on digital forestry, ecological protection, and big data application. These examples highlight the diversity of instruments and ensure balanced coverage of national strategies, local innovations, and region-specific governance approaches. A partial list of representative policies is presented in Table 1, with the full list detailed in Appendix A.

2.3. Analysis of Policy Instruments

As fundamental mechanisms for translating policy goals into action, policy instruments occupy a central position within the smart forestry governance system. Moreover, they serve as a foundational element in the development of PMC-TE evaluation indicators. In this study, based on Rothwell’s policy tool classification theory [40], China’s smart forestry policy instruments were systematically classified into supply-side instruments, demand-side instruments, and environment-type instruments.
Supply-side instruments refer to policy actions that directly provide public goods, services, or technical support to enhance system capacity. In the context of smart forestry, these include the construction of ecological infrastructure, R&D initiatives, biodiversity conservation, and investment in digital technologies such as remote sensing and information platforms. Demand-side instruments are designed to influence the behavior of target actors through the use of financial incentives, the creation of markets, or the utilization of public procurement. In forestry governance, these may involve subsidies for carbon trading, afforestation incentives, or insurance schemes tailored to forest-dependent communities. The external institutional and regulatory conditions under which forestry activities are conducted are shaped by environmental instruments. The implementation environment is defined by a series of tools, including laws, technical standards, monitoring and evaluation frameworks, and interdepartmental coordination mechanisms.
Based on the framework, the topics generated by the LDA model were manually assigned to one of the three categories through keyword analysis and thematic interpretation. The classification process considered the dominant functions and policy intentions embedded in the high-probability terms of each topic. This categorization provides a conceptual lens for understanding the internal composition of China’s smart forestry policy system and lays the foundation for subsequent PMC-TE evaluation and instrument structure analysis.

2.4. Quantification of Policy Effectiveness

This study constructed the Policy Modeling Consistency-Text Encoder (PMC-TE) index model using a dataset of China’s smart forestry policy texts as the research object. The model combined quantitative analysis of policy instruments with comprehensive, multidimensional, and specific standards and corresponding scoring strategies to obtain detailed quantitative results for different policy instruments. The PMC model is grounded in the Omnia Mobilis principle [41,42], which assumes systemic interdependence among policy variables, implying that all relevant indicators should be incorporated into the evaluation framework. Therefore, no related variable should be overlooked or deemed insignificant. Drawing on recent practices in text mining that integrate ‘theme-coding’ technology into PMC [43], this study uses the PMC-TE index model to conduct a quantitative assessment of China’s smart forestry policies. The analysis involves the following four basic steps [44]:
(i)
Constructing the multi-input–output matrix based on the variable indicator system;
(ii)
Categorizing variables and assigning values to corresponding parameters;
(iii)
Calculating the PMC index through standardized scoring rules;
(iv)
Visualizing the results through the construction of the PMC surface.

2.4.1. Classification of Variables and Identification of Parameters

This study constructs a policy evaluation indicator system based on the PMC-TE model and conducts a structural quantitative evaluation of representative smart forestry policy texts. Drawing on Estrada’s (2011) PMC policy modeling concept [43] and referencing relevant research on variable construction [45,46], nine primary variables were ultimately established: policy nature (X1), timeliness (X2), policy level (X3), policy evaluation (X4), policy domain (X5), policy safeguards (X6), policy priorities (X7), policy targets (X8), and policy perspective (X9). Each primary variable is further divided into several secondary indicators, totaling 32 in all (see Table 2).
Each secondary indicator is assigned a Boolean value (0/1) for text scoring, i.e., if the policy text explicitly contains semantic features or keywords corresponding to the indicator, it is recorded as 1; otherwise, it is recorded as 0. It provides a foundational basis for subsequent PMC-TE index calculations and visualization analysis.

2.4.2. Construction of the Multi-Input–Output Matrix

The multi-input–output table is a data analysis framework that quantifies a single variable from multiple dimensions. In the multi-input output table, 32 sub-variables are grouped under 9 main variables. Each variable possesses an equal weight. The matrix is constructed based on the defined variables and the thematic features of smart forestry policies identified through LDA topic modeling (as defined in Table 2). This matrix forms the basis for calculating the PMC index.

2.4.3. Measurement of the PMC Index

The measurement of the PMC index follows a four-step process:
(i)
Input the 9 main variables and 32 sub-variables into the multi-input–output matrix.
(ii)
Evaluate sub-variable by sub-variable according to the parameters mentioned above (see Expressions (1) and (2)).
(iii)
Calculate the value of each main variable by averaging the scores of its sub-variables (see Expression (3)).
(iv)
Measure the PMC index by summing the values of all main variables (see Expression (4)).
X N 0 , 1
X = X R : 0 , 1
X t = j = 1 n X i j T X i j , t = 1 , 2 , 3 , 4 , 5 , 6 , 7 , 8 , 9 , 10 , ,
i = main variable; j = sub-variable; t = total variables in analysis.
P M C = X 1 i = 1 4 X 1 i 4 + X 2 j = 1 4 X 2 j 4 + X 3 k = 1 2 X 3 k 2 X 4 l = 1 4 X 4 l 4 + X 5 m = 1 4 X 5 m 4 + X 6 n = 1 4 X 6 n 4 X 7 o = 1 4 X 7 o 4 + X 8 p = 1 4 X 8 p 4 + X 9 r = 1 2 X 9 r 2

2.4.4. Construction of the PMC Surface

The PMC surface provides a visual summary of the strengths and weaknesses of a policy by mapping PMC matrix results onto a multi-dimensional space [43]. The degree of concavity in the curved graph reflects the quality of the policy sample, while the convex parts indicate high scores in the corresponding evaluation indicators. This suggests that the policy has advantages in those indicators, and vice versa.
The construction of the PMC surface is based on the results of the PMC matrix (see expression (5)). The PMC matrix is a 3 × 3 matrix that contains the individual results of the nine primary variables. When the matrix is perfectly balanced in rows and columns, the resulting surface achieves symmetry, offering a more intuitive comparison across indicators.
P M C S u r f a c e = X 1 X 2 X 3 X 4 X 5 X 6 X 7 X 8 X 9

3. Results

3.1. Topic Modeling of Smart Forestry Policies

To determine the optimal number of topics, an LDA grid search was conducted within the range of k = 2∼20 and comprehensively evaluated four metrics: topic coherence (c_v), perplexity, Kullback–Leibler divergence (KL divergence), and Jensen–Shannon divergence (JSD).
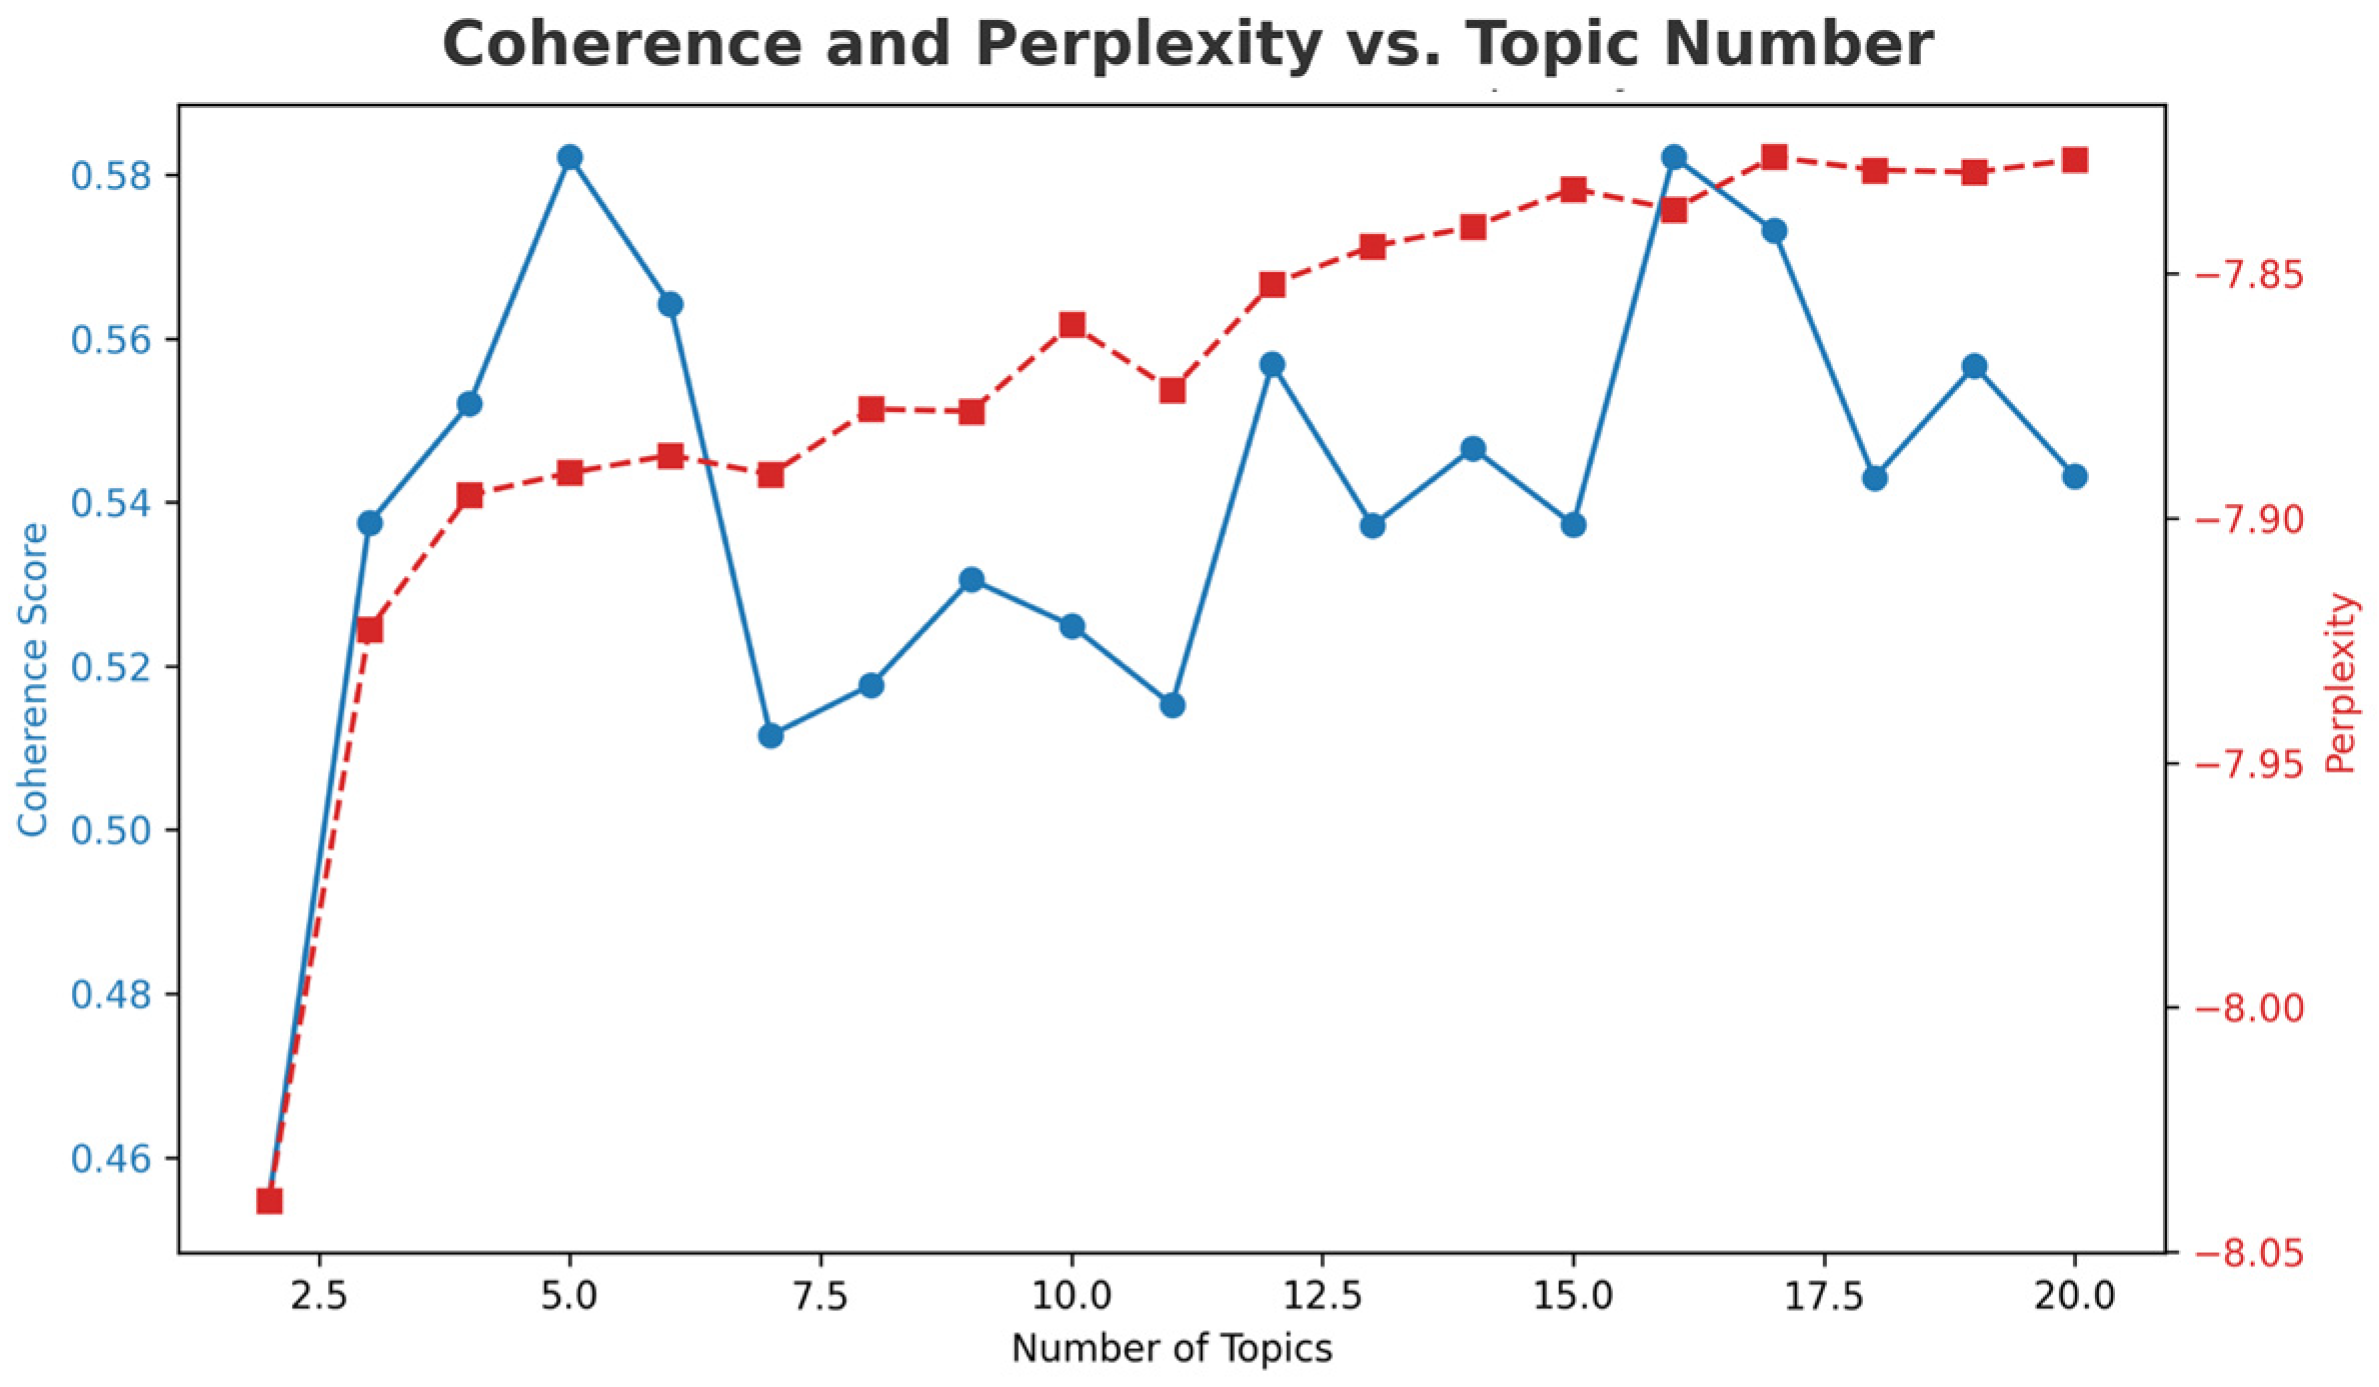
Topic coherence is commonly used to evaluate the quality of topics generated by the LDA model, as it captures the semantic similarity among the most representative keywords within each topic. A higher coherence score indicates tighter semantic clustering of keywords, thus reflecting better topic quality. Perplexity is a metric for evaluating a topic model’s ability to predict new data. The lower the perplexity, the better the model’s clustering performance. As shown in Figure 2, the coherence metric exhibits local peaks at k = 5 and k = 16, indicating that the model exhibits strong semantic cohesion at these two topic counts. However, considering the overall stability and generalization capability of the topic model, coherence alone is insufficient for making an optimal decision. At k = 13, the coherence score remains at a high level (0.537), while the perplexity has converged to −7.84, indicating that the model has achieved a relatively stable fitting effect at this point. Considering both semantic quality and model robustness, k = 13 is a reasonable choice that balances semantic interpretability and convergence characteristics.
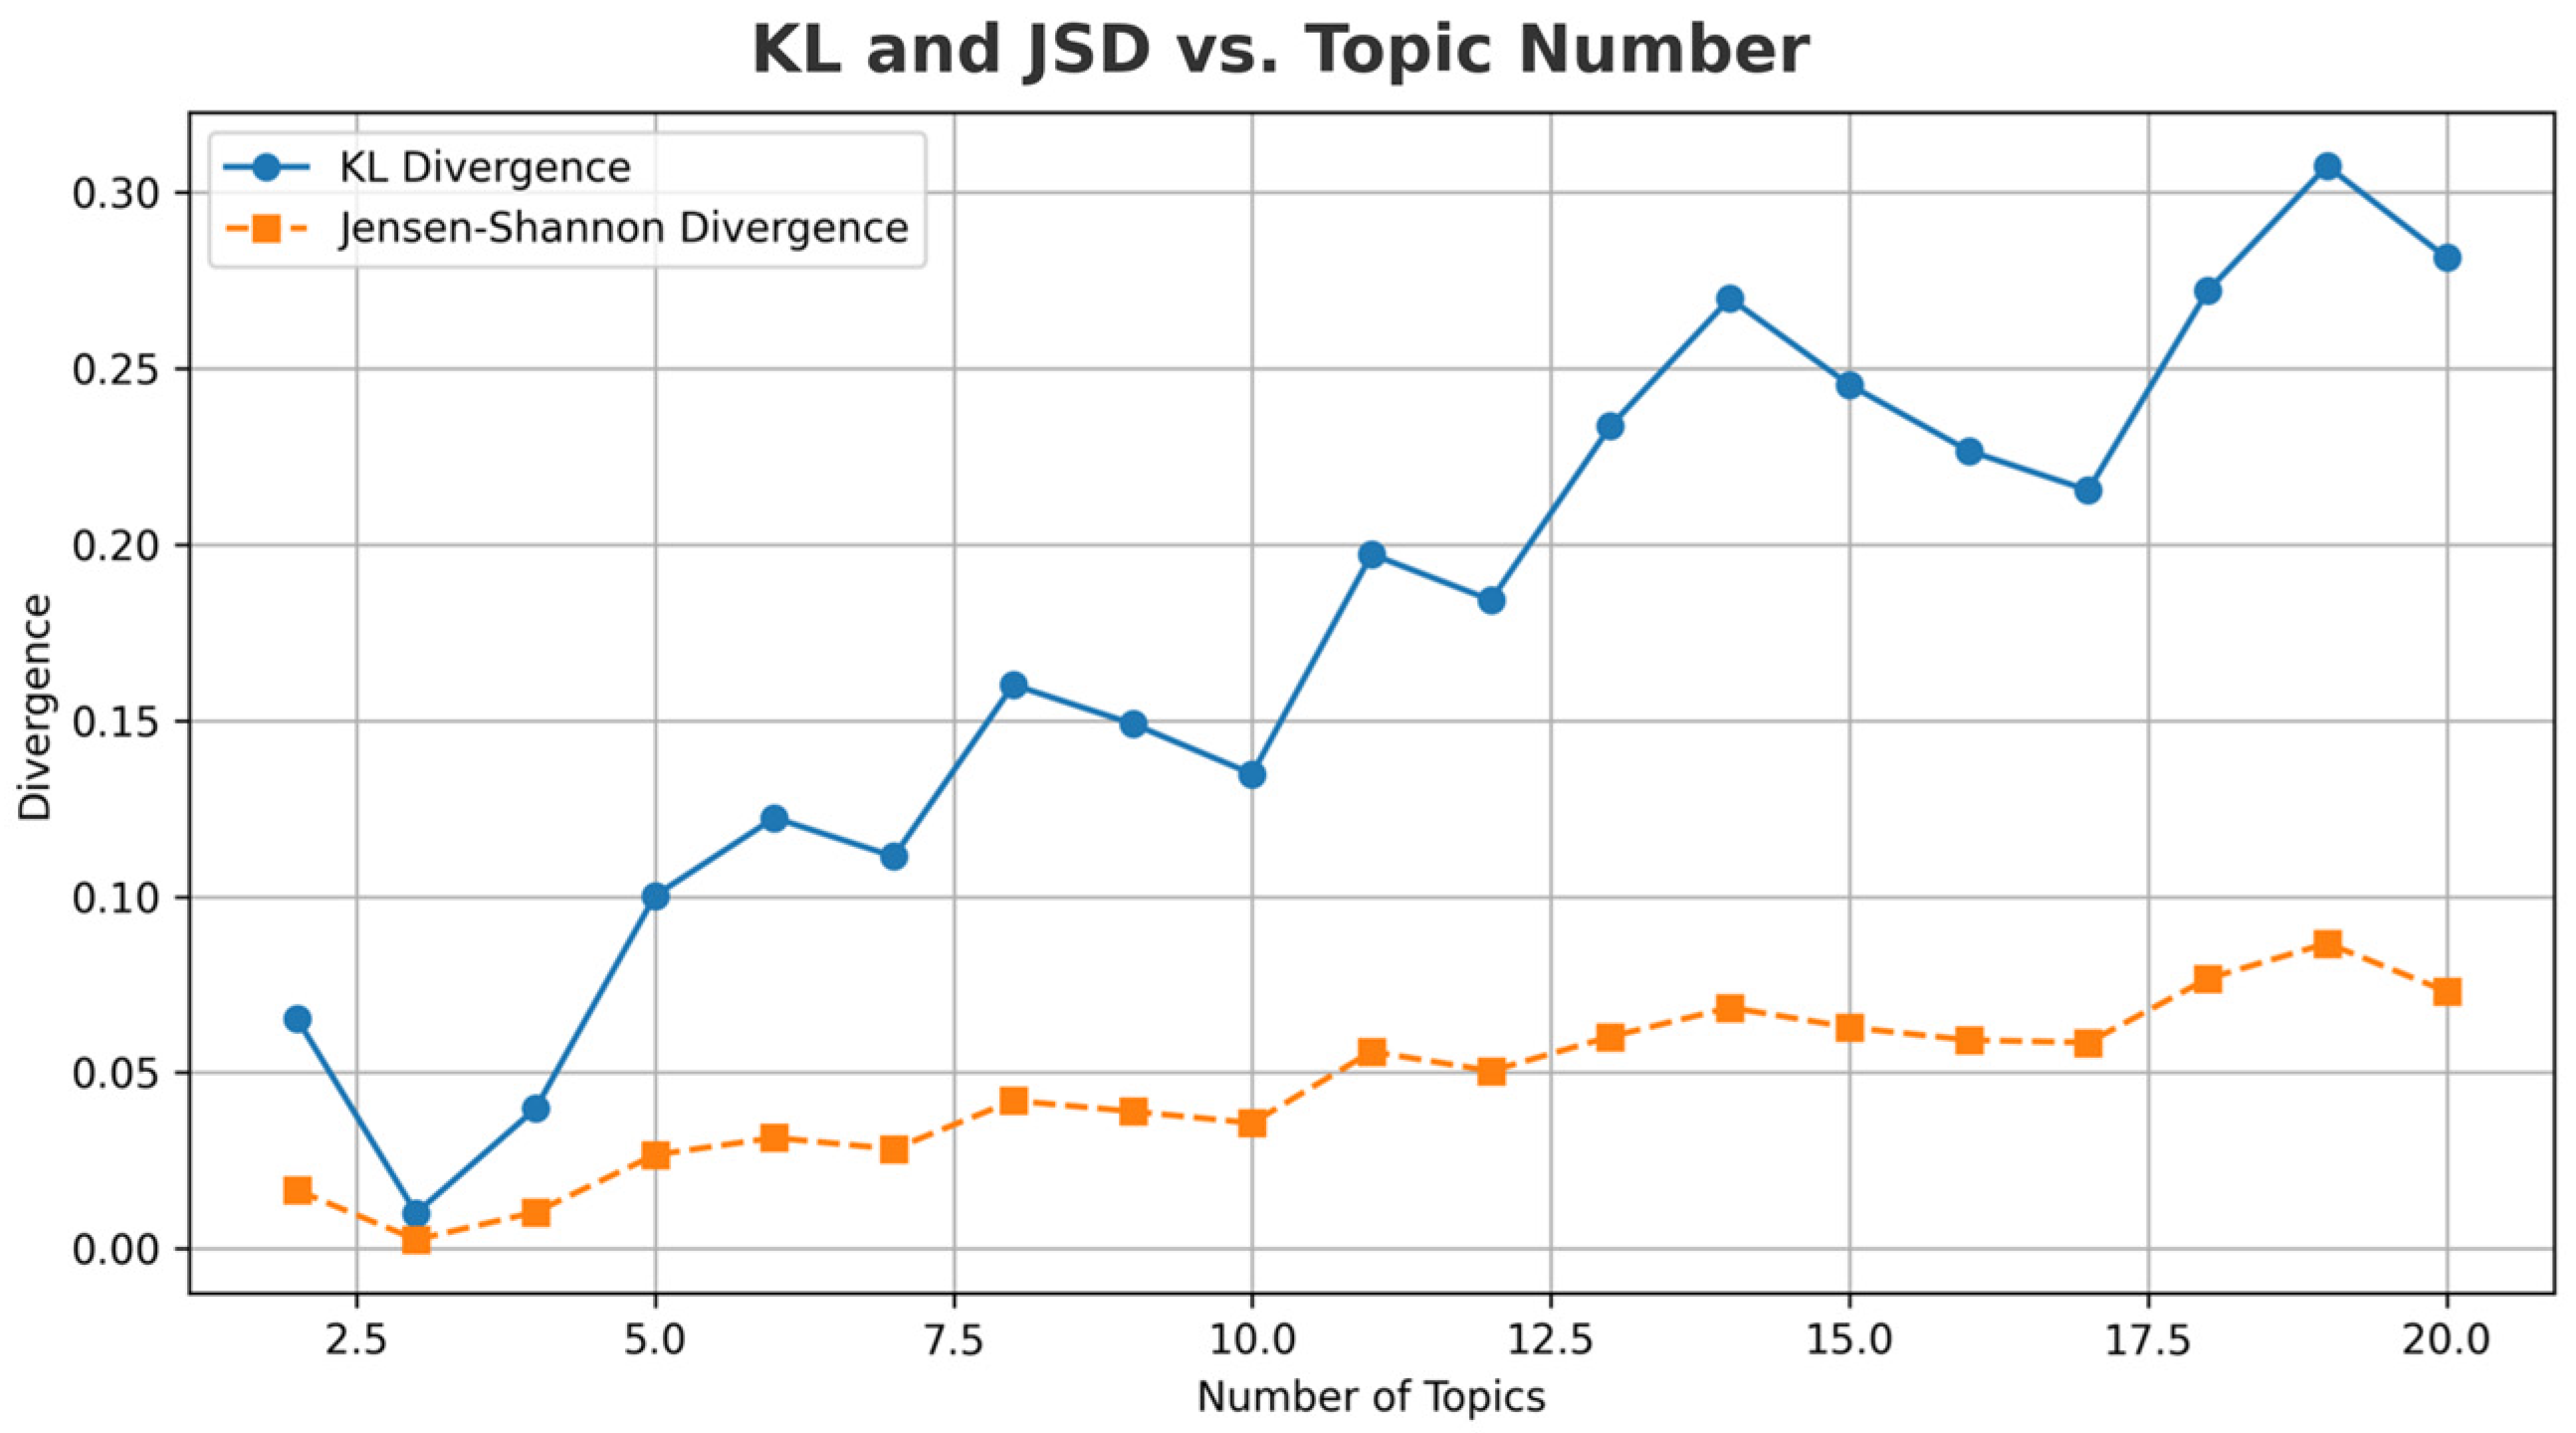
To further assess the model’s structural performance under different numbers of topics, Figure 3 shows the trends of KL divergence and Jensen–Shannon divergence (JSD) as the number of topics changes. Overall, KL divergence increases with the increase in the number of topics, reflecting that the topic distribution gradually becomes sparse and focused, and the model’s ability to distinguish between topics is enhanced. At the same time, JSD remains at a low level, indicating that the model’s overall distribution has not deviated significantly and still maintains good structural balance. At k = 13, the KL divergence is in the moderately high range, and the JSD is stable at approximately 0.06, meaning that the model maintains strong topic recognition capabilities without producing semantic bias or overfitting tendencies, further confirming the structural rationality advantages of this number of topics.
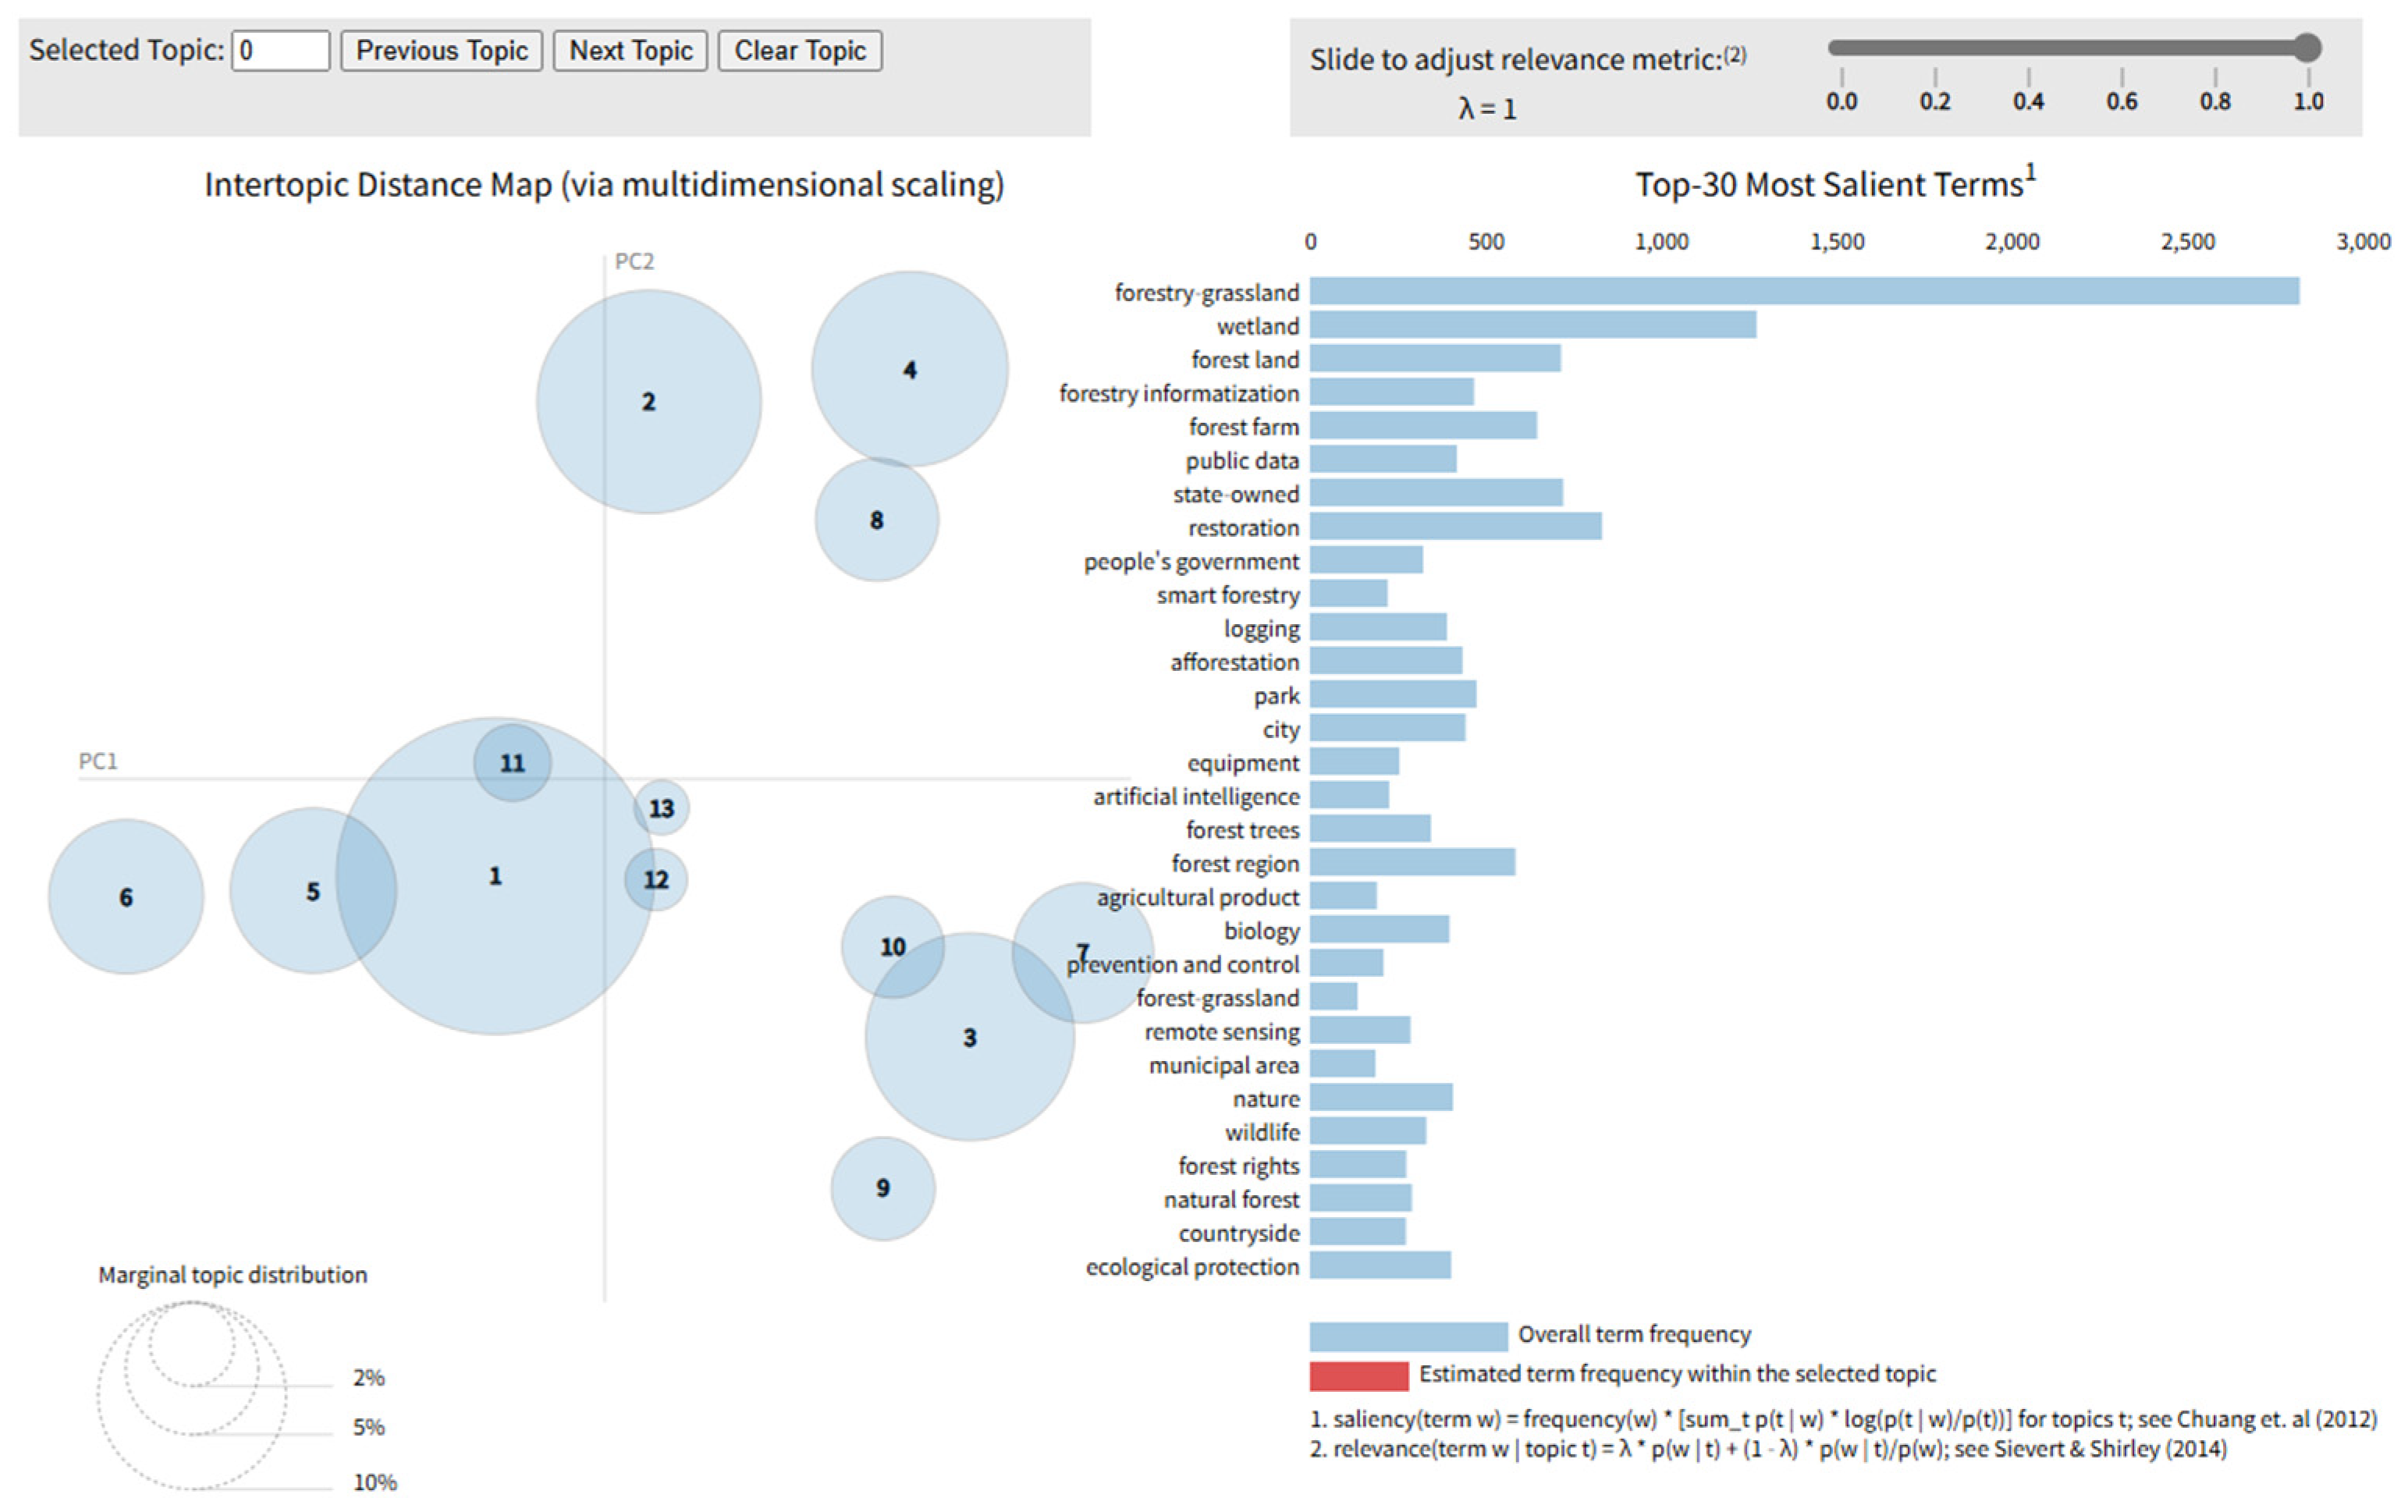
The k = 13 model demonstrates efficacy in terms of semantic consistency, model stability, structural distribution, and keyword richness. This study has identified k = 13 as the ultimate number of themes. Referring to the visualization methods proposed in previous studies [47,48], we utilized the PyLDAvis tool to visualize the LDA model with k = 13 themes, as shown in Figure 4. Each circle represents a topic, with its size indicating topic prevalence and the distance between circles reflecting inter-topic similarity. Overlaps in the two-dimensional plot result from dimensionality reduction and do not imply actual semantic overlap [43]. As illustrated in the inter-topic distance map on the left, the majority of topics demonstrate clear distributions, suggesting high topic separation. The keyword distribution on the right demonstrates that terms such as ‘forestry grassland,’ ‘wetland,’ ‘public data,’ ‘smart forestry,’ and ‘artificial intelligence’ frequently appear, covering diverse policy issues including ecological resources, digital technology, and public governance. This visualization result validates the rationality of the topic modelling from both structural and semantic dimensions, providing semantic support for subsequent policy type classification and PMC indicator design.

3.2. Typological Classification of Smart Forestry Policy Instruments

This study utilized the results of LDA topic modelling as a foundation for the further annotation and categorization of the policy content across the 13 identified themes, based on types of policy instruments. Table 3 summarizes the representative keywords, policy categories, instrument types, and topic descriptions. Based on instrument orientation, the topics were grouped into three categories:
(i)
Supply-side instruments: Seven themes primarily encompass technical support and digital infrastructure. These instruments reflect direct governmental investment in areas such as funding, platforms, and technology. Representative themes include forestry technology and germplasm innovation, intelligent sensing and monitoring support, and digital economy and infrastructure development.
(ii)
Demand-side instruments: Two themes emphasize the enhancement of public services and the empowerment of rural sectors, focusing on service accessibility and livelihood support. Representative themes include digital circulation and livelihood services and rural industry and agricultural empowerment.
(iii)
Environmental instruments: Four themes focus on ecological norms, institutional mechanisms, and governance coordination. Examples include forest supervision and data governance, policy coordination and mobilization mechanisms, and ecological governance and disaster control.
In terms of specific tool types, those with higher frequencies include technical support, digital infrastructure, environmental regulations, and institutional tools. This indicates that smart forestry policies currently remain characterized by a strong emphasis on technological investment and institutional capacity building. Furthermore, a clear pattern of thematic clustering is evident: supply-side tools are mainly associated with technology- and platform-oriented themes, while environmental tools are more evenly distributed across ecological and institutional themes. These findings highlight a dual policy focus on both enabling technological advancement and strengthening governance frameworks for forest protection.

3.3. Structural Consistency and Coherence Evaluation Based on the PMC-TE Model

3.3.1. Overall Evaluation of PMC-TE Scores

To evaluate the structural consistency and internal logical integrity of the selected smart forestry policies in a comprehensive manner, the comprehensive scores of 26 representative policy texts based on the PMC-TE model were calculated. According to the pre-set grading standards (Perfect: 8–9 points; Excellent: 6–7.99 points; Good: 4–5.99 points; Acceptable: below 4 points), the PMC-TE scores for each policy ranged from 3.00 to 8.75, with an average of 6.46 and a median of 6.25. This indicates that the overall quality of China’s current smart forestry policies is above the moderate level, though certain structural weaknesses remain.
The score distribution shows the following:
  • Seven policies (approximately 27%) rated as ‘Perfect’, demonstrating high structural integrity and coordination;
  • Nine policies (approximately 35%) were rated as ‘Excellent’, performing well in most secondary indicators.
  • Seven policies (approximately 27%) were rated as ‘Average’, with certain dimensions lacking completeness or coordination.
  • Three policies (approximately 11%) were classified as ‘Acceptable’, exhibiting a weak overall structure with noticeable logical gaps and missing elements.
To visualize the score distribution across different policy tool types, Figure 5 presents a boxplot comparing PMC-TE scores among supply-side, demand-side, and environmental instruments. The findings indicate that supply-side instruments generally achieved higher and more stable scores, while environmental instruments exhibit greater variability, suggesting the presence of inconsistent internal structures.

3.3.2. Structural Heterogeneity Analysis

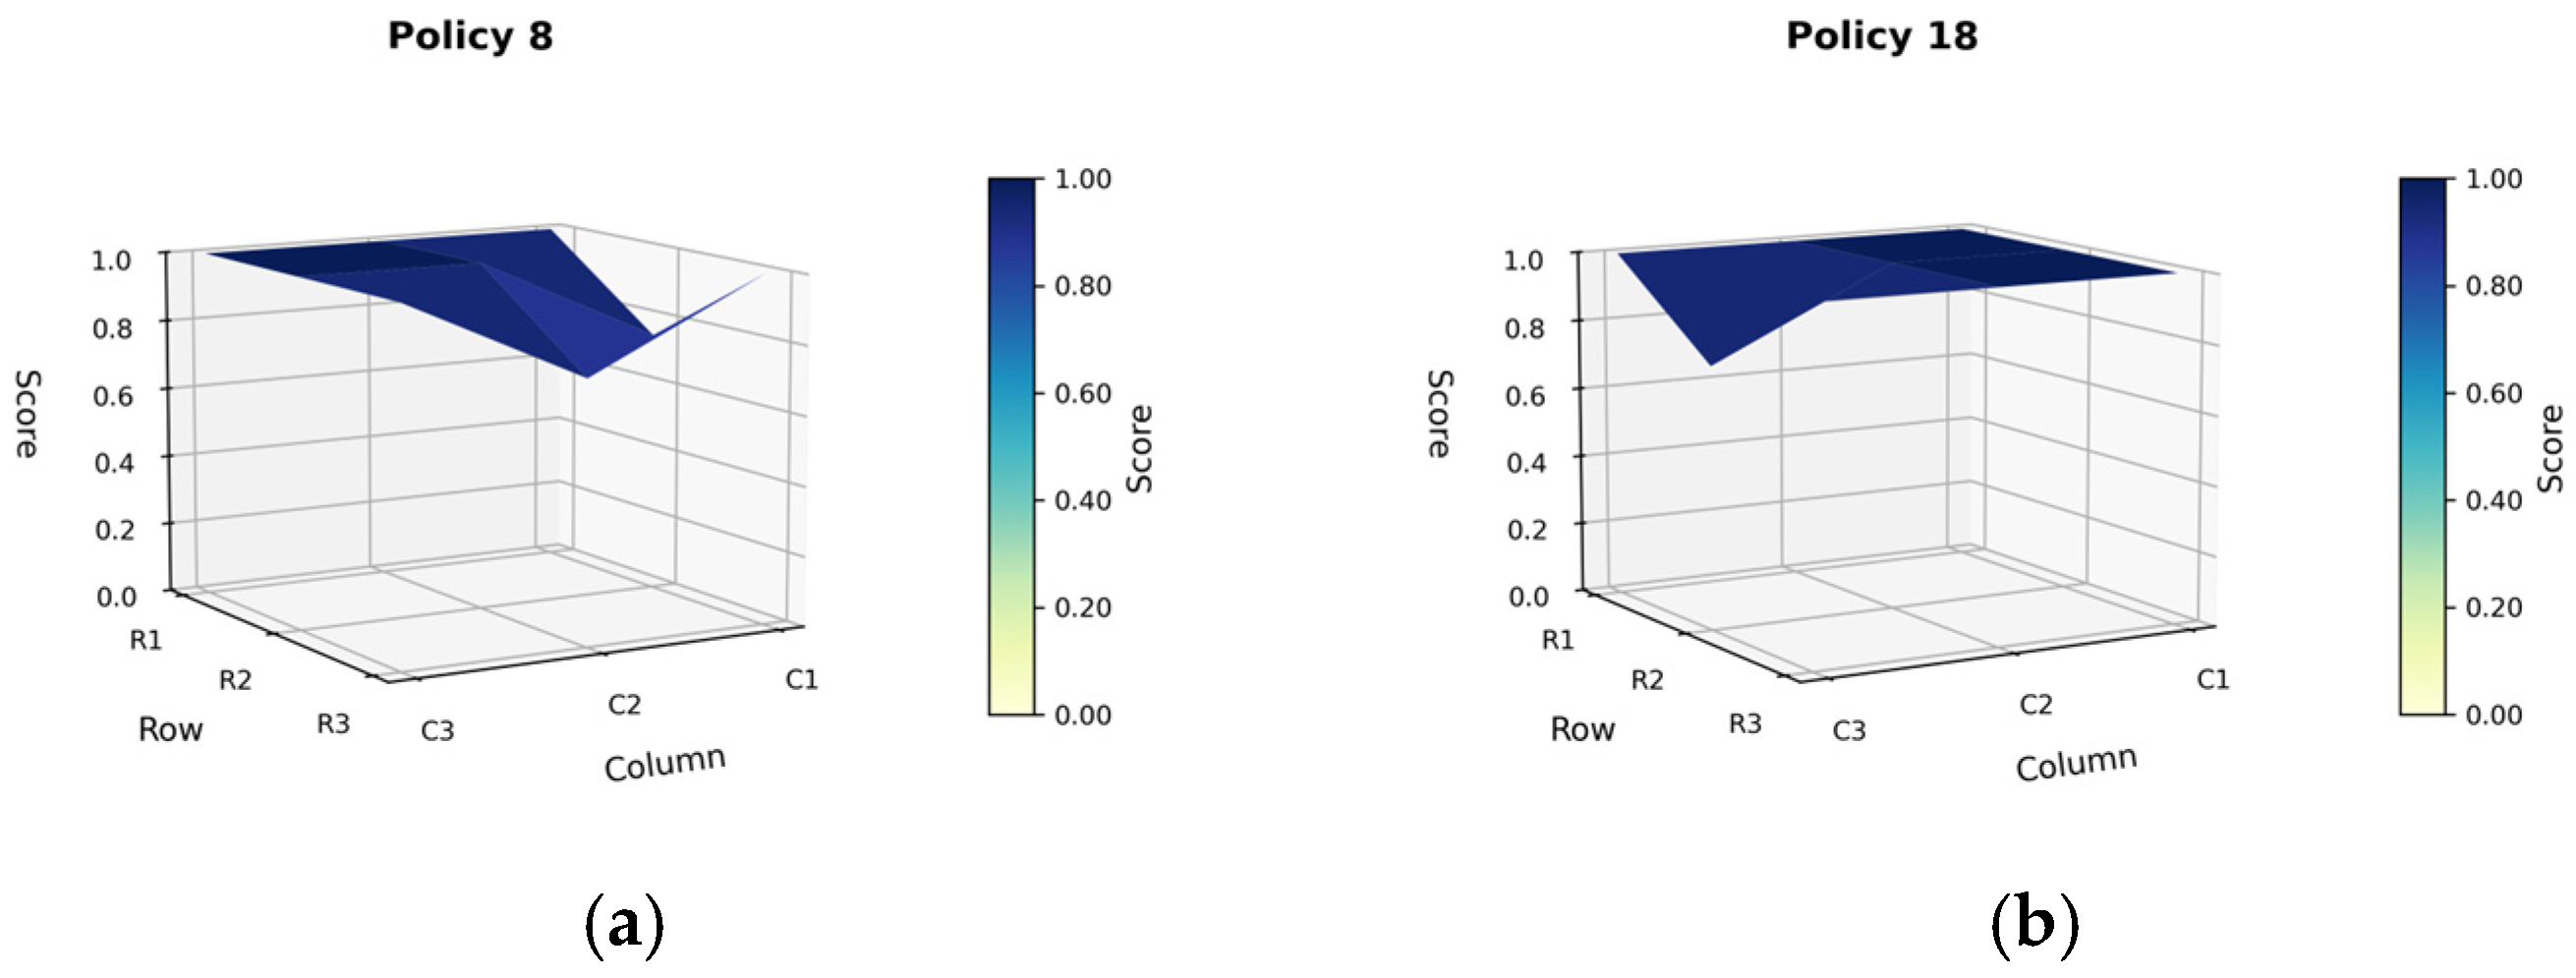
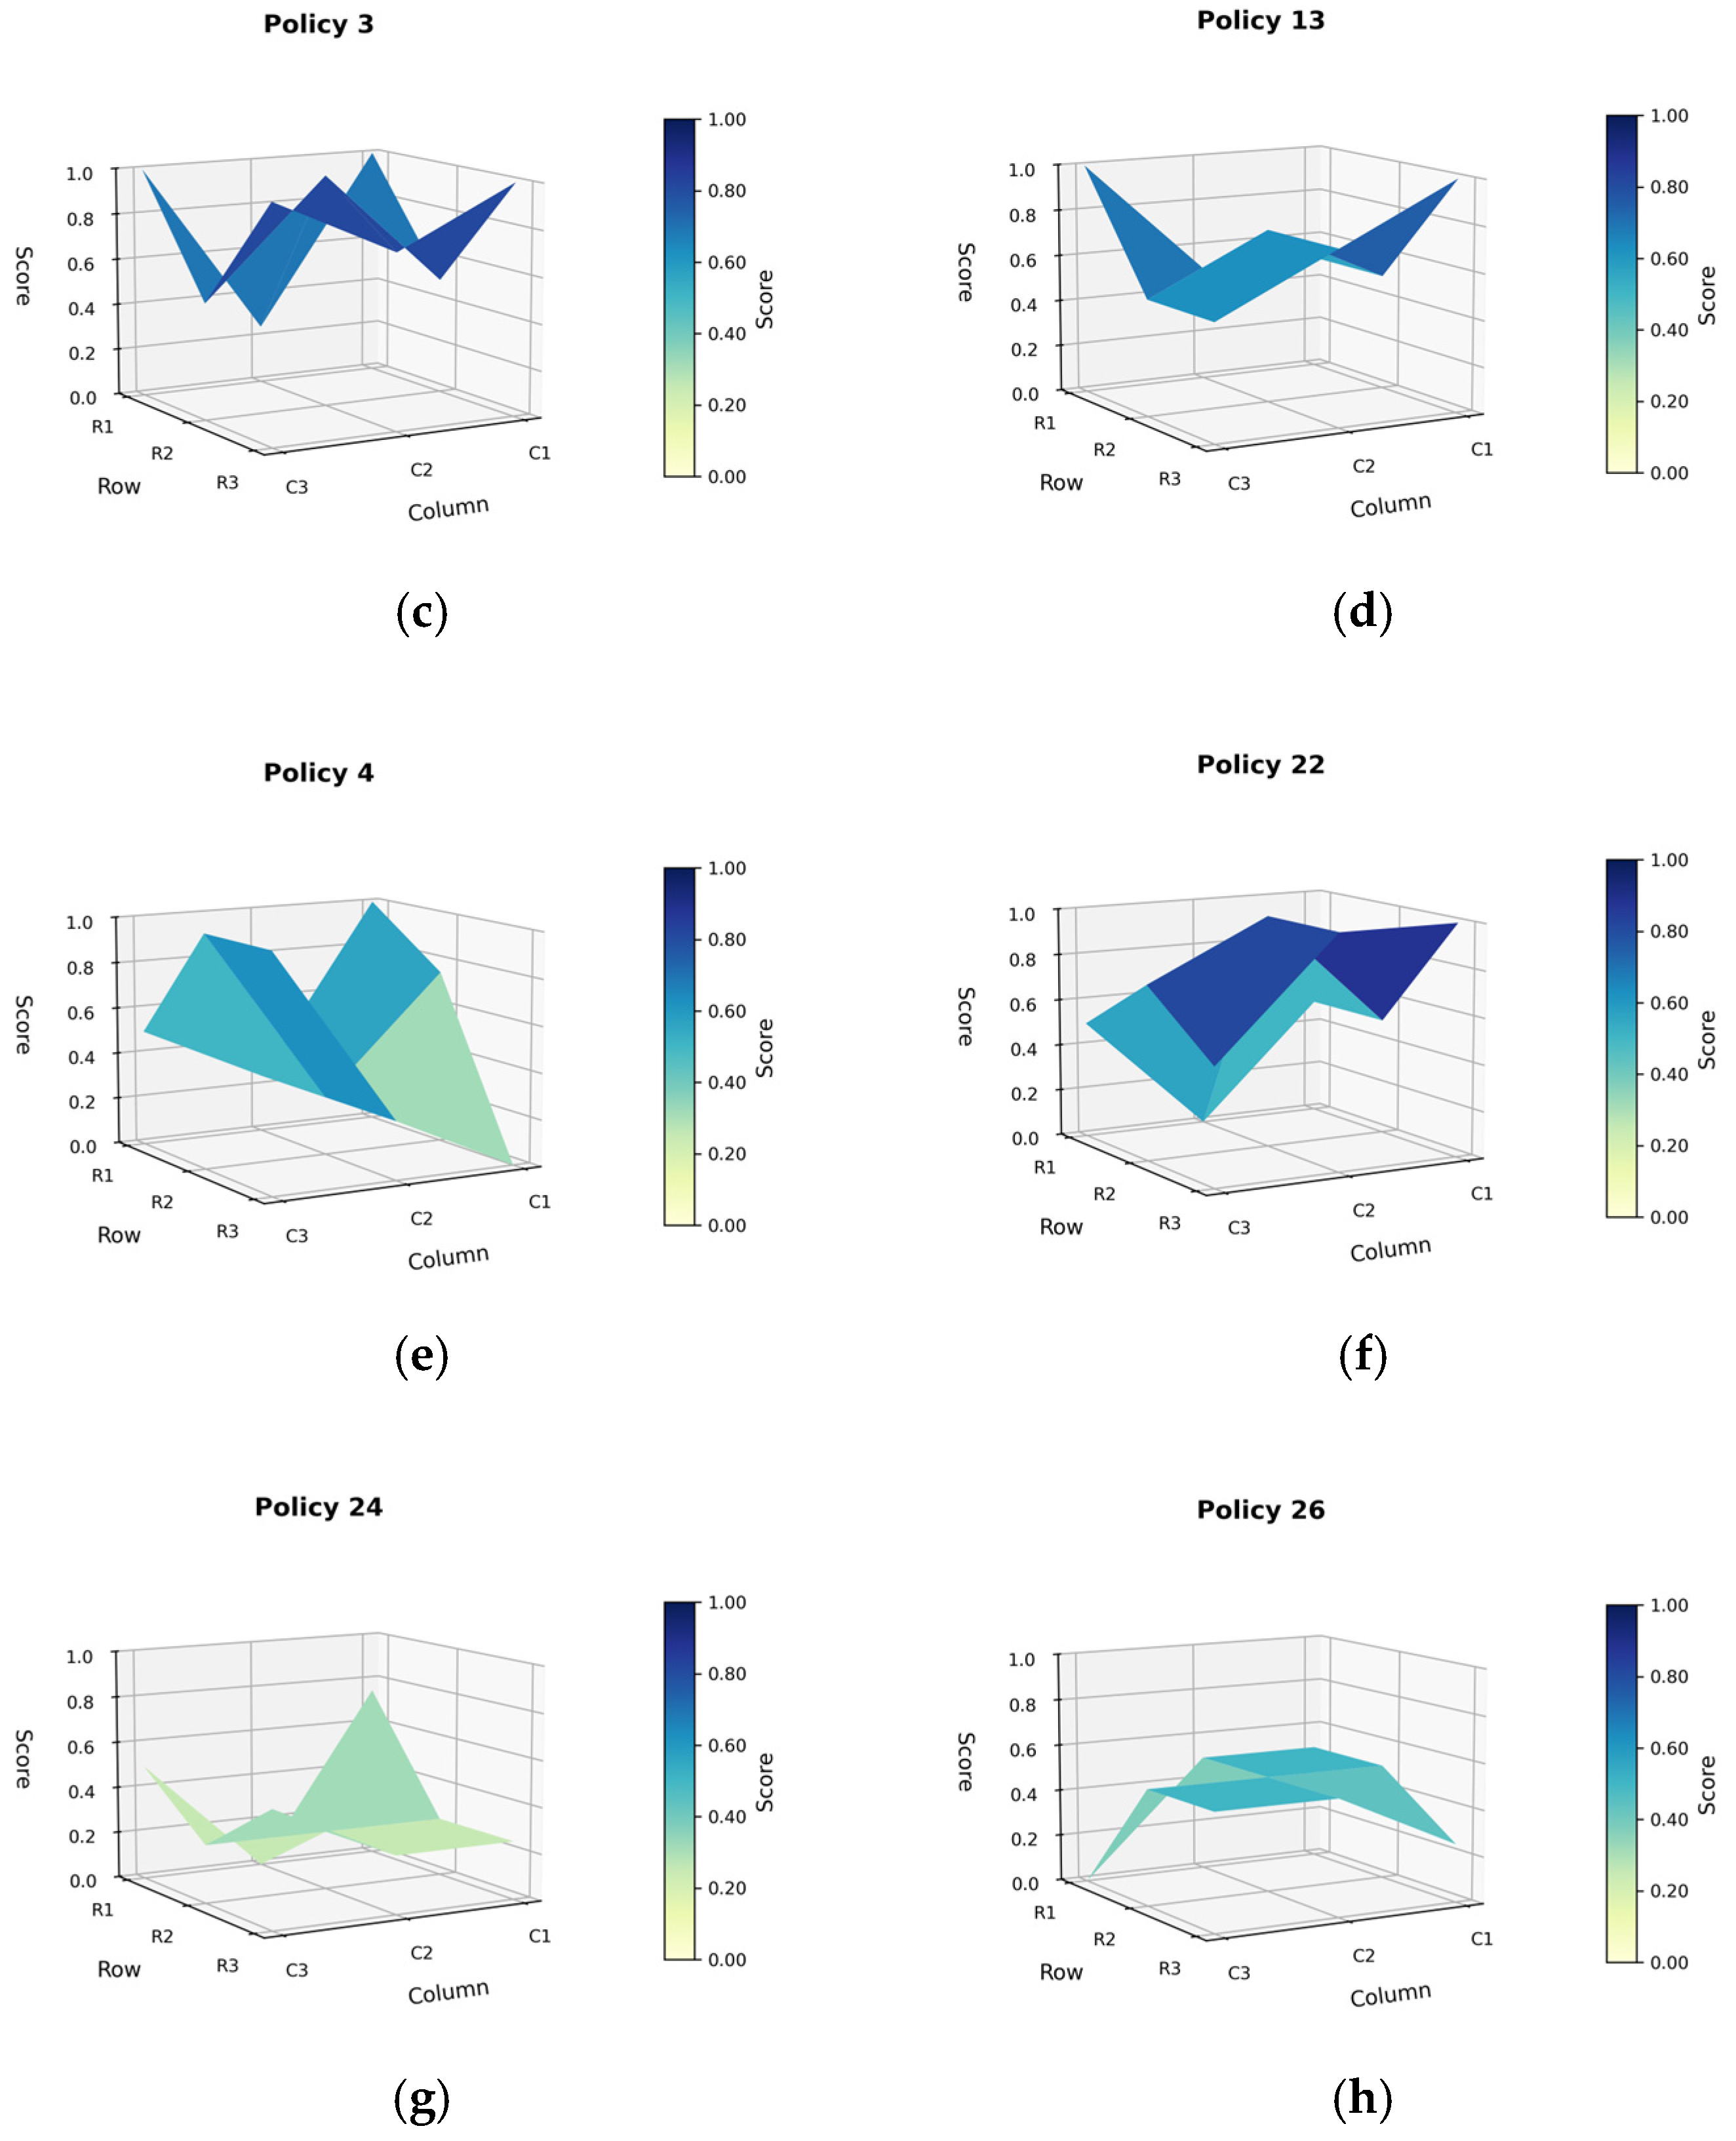
To present the differences in policy structure in terms of completeness and balance in an objective manner, this study constructed three-dimensional surface diagrams for 26 policies based on the PMC-TE model. Due to space constraints, only eight representative surfaces are shown, covering four evaluation grades, as shown in Figure 6:
The visualized results reveal distinct differences across grades in terms of surface morphology, structural smoothness, and local concavity.
Perfect Grade (e.g., P08, P18): The surface exhibits a continuous, upward-curving form with a smooth structure with no noticeable discontinuities or depressions. The distribution of surface vertices is relatively uniform, indicating that scores across various dimensional indicators are closely aligned and that the structural design achieves comprehensive coverage across dimensions.
Excellent Grade (e.g., P03, P13): The surface is relatively flat but shows some undulation and slight depressions in local areas, indicating weaker scores in individual dimensions. However, the overall structure remains coherent without severe gaps.
Good level (e.g., P04, P22): The surface exhibits noticeable undulations and fluctuations, with localized areas showing concave depressions. The overall structure exhibits uneven distribution in several areas, suggesting partial imbalance in structural composition.
Acceptable level (e.g., P24, P26): The surface map commonly shows deep depressions and fractured structures in multiple dimensions. The surfaces present notable subsidence zones, pointing to low scores in several secondary indicators and limited structural completeness.
These differences reflect the diversity in structural design among the evaluated policies, particularly in the coverage and balance of key elements.

4. Discussion

4.1. Strategic Priorities and Policy Instrument Balance

A joint analysis of LDA topic modeling and policy tool classification reveals that China’s smart forestry policy system demonstrates strategic coherence in its alignment with national goals. However, structural imbalances in the allocation and coordination of policy instruments remain prominent. At the strategic level, current policy priorities are concentrated in three key areas: (i) digital infrastructure and technological support, (ii) ecological governance and environmental management, and (iii) rural revitalization and public service enhancement.
Among these, supply-side tools dominate, with seven out of thirteen topics centered on direct government investments in digital platforms, intelligent sensing, IT protection, and forest technology. This aligns with China’s national strategies, such as the “Digital China” initiative and the “Carbon Peak–Carbon Neutrality” target, which emphasize technological enablement as a primary driver of ecological modernization.
For instance, the National Smart Forestry Development Plan (2021–2025) underscores the promotion of the “Smart Forestry and Grassland Integrated Map” and the construction of an “integrated monitoring system spanning land and space.” However, from the perspective of the distribution of policy instruments, there is a noticeable structural bias. On the one hand, demand-side instruments are significantly insufficient, with only two themes falling into this category, and no systematic service incentive mechanisms have been established. On the other hand, environmental instruments are fragmented across institutional, ecological, and regulatory domains, with limited integration. For instance, while topic four (Forest Ecosystem Protection) and topic eight (Ecological Governance) reflect ecological engineering principles, their connection to practical incentive mechanisms remains weak. This suggests a mismatch between thematic emphasis and policy instrument diversification.
This supply-oriented, technology-centric approach is somewhat rational and effective at rapidly promoting capacity building. However, it faces issues such as insufficient instrument diversity and weak coordination. This tool imbalance undermines strategic coherence. Existing studies underscore that the effectiveness and adaptability of policy systems hinge not only on individual instruments but also on the structure of the policy mix. A well-designed mix that integrates economic incentives, regulatory measures, and participatory mechanisms is considered essential for achieving coherent and adaptive governance [49,50]. Moreover, previous studies highlight that over-reliance on a single tool can lead to “instrument bias”, reducing the adaptive capacity of the system [51]. In contrast, a well-balanced policy mix that combines economic incentives, regulations, and systemic support mechanisms enhances policy coherence, which is crucial for behavioral change and effective inter-agency coordination during sustainability transitions [52].
To further contextualize these structural issues, we compare China’s approach with international cases. For instance, the EU’s “EU Forest Strategy for 2030” adopts a more balanced policy mix. It combines fiscal, institutional, and informational tools, such as ecological compensation and green employment funds, public participation databases, and shared platforms, to enhance governance adaptability and resilience [53]. In Belgium, flexible grants and expert consultations help bridge gaps between top-down goals and grassroots implementation [54]. Furthermore, the lack of feedback and adaptive mechanisms weakens policy resilience. As emphasized by international cases, the integration of “monitoring-feedback-learning” loops is crucial to avoid static policy structures [22]. Without such loops, even well-funded platforms may fail to evolve with ecological and social dynamics.
To improve policy instrument balance and strategic coherence in China’s smart forestry system, the following adjustments should be considered:
(i)
Enhance demand-side participation. Introduce incentive mechanisms that encourage local governments, rural entities, and forestry cooperatives to participate actively in smart forestry development.
(ii)
Strengthen the closed-loop logic between tools. Use ecological indicators to connect platform construction, monitoring data, and feedback mechanisms to achieve a closed-loop governance system of “goal-execution-feedback.”
(iii)
Promote the construction of institutionalized coordination mechanisms. Learn from the EU’s cross-departmental coordination experience to establish a joint forestry policy or information-sharing mechanism that reduces departmental barriers.

4.2. Practical Meaning of Structural Coherence

Structural coherence is a critical attribute of policy design. It directly influences policy implementation effectiveness, interdepartmental coordination, and institutional adaptability. The PMC-TE evaluation conducted in this study reveals that China’s smart forestry policies generally demonstrate a high level of structural quality. While a few policies reached the “Excellent” level, the majority fall within the “Good” or “Acceptable” categories, reflecting gaps in structural closure, element alignment, and logical consistency. These findings highlight the multifaceted significance of structural consistency for the systemic nature and practical adaptability of policies.
First, structural coherence reflects the internal alignment between policy goals, instruments, and implementation mechanisms [49]. In the context of digital governance, smart forestry policies span multiple dimensions, such as remote sensing, data management, and ecological monitoring. A loose structure and fragmented logic can easily lead to policy transmission failure or fragmented implementation [55]. Policies with lower scores in this study often exhibit “elemental deficiencies” and “pathway interruptions,” such as an absence of systematic arrangements for data governance and performance feedback mechanisms. This contrasts with the experience of foreign digital forestry policies in constructing a “closed-loop feedback structure.” For instance, Ontario, Canada, demonstrates the importance of establishing a “closed-loop feedback structure” to enhance the structural consistency and implementation effectiveness of forest policies. Ontario requires the annual, systematic monitoring and reporting of forest management plans. This process involves comparing actual ecological conditions with established goals and feeding the assessment results back into the policy cycle [56]. This institutional arrangement ensures continuous policy improvement and reflects the “plan–monito–feedback–adjust” oversight logic of Canada’s federal-level forest governance [57]. Such built-in oversight and performance evaluation ensure policies are implemented coherently, lessons are captured, and strategies are updated, exemplifying Howlett and Rayner’s concept of instrument consistency and feedback loops [22]. China’s smart forestry policies, particularly those targeting the lower-rated group, stand to benefit from the alignment with these models. This alignment would entail the introduction of integrated data loops, stakeholder engagement protocols, and dynamic policy correction mechanisms. These elements are critical for developing adaptive capacity in a rapidly evolving socio-ecological and technological context.
Second, structural coherence is associated with long-term policy resilience and cross-cycle adaptability. Ecosystem governance highly depends on the consistency and evolutionary capacity of policies over time [58]. From the PMC-TE model visualization, policies with higher scores exhibit smoother surface structures and fewer structural gaps, reflecting their high internal coupling in key dimensions such as policy timeliness (X2), target logic evaluation (X4), and safeguard mechanisms (X6). These features enhance stable support in addressing external disturbances, system feedback, and policy iteration. In contrast, structurally fragmented policies often encounter “pathway discontinuities” and “implementation weaknesses” during phase transitions, which are detrimental to the formation of a sustainable policy evolution chain.
Third, structural coherence can serve as a reference indicator for assessing the design quality of policy instruments. This study reveals that supply-side policy instruments demonstrated relatively stable performance in the PMC structural consistency dimensions, exhibiting characteristics of clear institutional norms and low path dependence. In contrast, while essential for shaping behavioral change and institutional reform, demand-side and environmental instruments often reveal fragmented logic chains or insufficient coordination mechanisms. As Hood and Margetts argue, instruments based on incentives and behavioral governance are more susceptible to misalignment between design and delivery, particularly in complex or rapidly evolving policy domains [59]. However, it is imperative to exercise caution and not be deceived by superficial similarities, as they may obscure underlying structural inadequacies. It is important to note that policies with high PMC scores may appear well-structured on paper; however, they may face practical challenges due to weak institutional responsiveness or limited adaptive capacity. As Kattel and Mazzucato emphasize, effective policy systems should be designed with “modular structures” and “adaptive loops” to accommodate uncertainty and enable iterative learning [60]. Absent such design flexibility, formal consistency may come at the expense of innovation, responsiveness, and long-term policy resilience.
In summary, structural coherence should not be reduced to normative completeness; rather, it should reflect functional integration, logical continuity, and adaptive capability. In the future, policy design should integrate the following strategies:
(i)
Establish a closed-loop feedback structure that connects planning, implementation, and evaluation.
(ii)
Strengthen resilience through coherent time design and stakeholder adaptability.
(iii)
Promote modular and participatory tool configuration to enhance system responsiveness.
Compared with those in the EU and Canada, China’s smart forestry policies reveal potential areas for structural improvement. In these international cases, structural modeling, tool nesting, and policy monitoring are integrated to provide long-term, adaptive governance. This cross-national perspective helps to position China’s smart forestry development within a broader global context, enhancing the study’s international relevance. This study suggests reframing structural consistency not merely as a descriptive metric but as a core design principle, signaling a shift in policy logic from functional accumulation to systemic synergy.

5. Conclusions

5.1. Research Conclusions

This study conducts a multi-level evaluation of China’s smart forestry policy architecture by integrating semantic topic modeling and instrumental coherence assessment. The findings suggest that, while national and provincial policies exhibit a certain degree of strategic alignment, particularly with regard to themes such as digital infrastructure, ecological governance, and rural revitalization, notable imbalances persist in the allocation of policy instruments.
The observed dominance of supply-side instruments, alongside the underutilization of demand-side and institutional mechanisms, indicates a technocratic inclination in current policy design, which may hinder participatory governance and limit the responsiveness of policy systems to localized ecological needs. This imbalance may limit stakeholder engagement, inter-agency collaboration, and iterative policy learning, which are critical to effective governance in complex ecological settings. The discrepancies between policy objectives and instrument logic highlight persistent gaps between design intentions and implementation feasibility, suggesting limits in institutional capacity to deliver coherent digital–environmental governance.
These findings reflect deeper structural tensions within China’s smart forestry agenda, where rapid technological advancement has outpaced the development of integrative and adaptive governance mechanisms. While firmly rooted in the Chinese context, this study identifies misalignments and governance challenges that may resonate with other countries undergoing similar digital transitions in natural resource management, offering valuable insights for future comparative research.

5.2. Marginal Contributions

This study proposes an integrated and theory-informed framework for evaluating smart forestry policies, making three core contributions to the fields of environmental governance and digital policy analysis.
First, it represents a significant advancement in the field of policy evaluation by integrating semantic modeling with systemic coherence assessment. This dual-method framework goes beyond conventional descriptive text analysis, as it captures the internal logic and adaptive capacity of policy designs in dynamic governance contexts. This approach responds to recent calls for more integrative and diagnostic tools in policy studies.
Second, by situating China’s smart forestry agenda within a multilevel, mixed-instrument context, this study reveals critical tensions between technological acceleration and institutional integration. These findings contribute to the existing comparative governance literature by demonstrating how digital–environmental transitions may be susceptible to thematic-instrument misalignment, even in the context of robust strategic planning.
Third, the framework developed here has clear international relevance. The model provides a transferable analytical framework and comparative benchmarks for other countries seeking to advance digital forest governance. This approach contributes to a comprehensive rethinking of how policy systems can become more coherent, modular, and adaptive in the face of ecological and technological uncertainty.

5.3. Research Limitations and Future Prospects

While this study proposes a structured and replicable framework for evaluating smart forestry policies, it is important to acknowledge certain methodological boundaries inherent to the adopted approach. First, topic modeling outcomes are influenced by text preprocessing techniques and parameter settings. Although these techniques are commonly applied, they may subtly affect theme identification. Second, although the PMC-TE index provides a comprehensive structure for assessing policy coherence, it may not fully capture the institutional complexity and contextual variation embedded in diverse policy environments. Additionally, as this study is empirically grounded in the Chinese context, the lack of cross-regional comparisons limits the generalizability of its findings.
These limitations do not undermine the overall validity of the analytical framework; rather, they highlight opportunities for refinement. Future research could expand the scope by examining the evolution of policy design over time, incorporating case studies from different regions, or linking textual evaluations with implementation outcomes. Comparative analyses between countries with varying levels of digital capacity, forest ownership regimes, or decentralization structures could enhance the understanding of smart forestry governance.
Moreover, this study did not include direct engagement with forestry experts, practitioners, or stakeholders. As digital transformation involves social and organizational dynamics beyond technology, future research should adopt qualitative methods such as interviews, focus groups, or participatory mapping. These approaches would capture stakeholders’ perceptions, interests, and lived experiences and help bridge the gap between policy intentions and ground-level realities. In addition, future work could integrate spatial and panel econometric methods to complement text-based analysis. These methods would enhance causal inference and improve both the explanatory depth and predictive capacity of smart forestry policy research.

Author Contributions

Conceptualization, Y.C. and Y.Z.; methodology, software, data curation, writing—original draft preparation, and visualization, Y.Z.; validation, formal analysis, and investigation, Y.Z., J.L., and Y.R.; resources, supervision, project administration, and funding acquisition, Y.C.; writing—review and editing, J.L. and Y.R. All authors have read and agreed to the published version of the manuscript.

Funding

This research supported by the Fundamental Research Funds for the Central Universities (No. 2572025AW110) “Exploring the Mechanisms and Pathways of Smart Empowerment for State-Owned Forest Resource Conservation in Heilongjiang”; the National Social Science Foundation Youth Program (No. 23CGL063) “Study on the Path of Enhancing the Efficiency of Ecological Protection and Restoration in State-owned Forest Areas by Digital Empowerment”; the Humanities and Social Sciences Research Project of Henan Provincial Department of Education, China (No. 2026-ZDJH-102); and 2025 Annual Project of the 14th Five-Year Plan for Educational Science in Heilongjiang Province “Research on Innovative Talent Training Models in Universities to Empower the Digital and Intelligent Transformation of Forestry in Heilongjiang Province” (No. GJB1425001).

Data Availability Statement

The data that support the findings of this study are available from the corresponding author upon reasonable request.

Conflicts of Interest

The authors declare no conflicts of interest.

Appendix A

Table A1. Representative policy documents on smart forestry.
Topic IDCategoryRegionPolicy Document TitleDocument Issuance NumberRelease Date
1Supply-side instrumentsJilinJilin Province Digital Agriculture Development “14th Five-Year Plan” (2021-2025)JNongShiFa (2021) No. 913 May 2021
JilinImplementation Opinions of the General Office of Jilin Provincial People’s Government on Smart Agriculture DevelopmentJZhengBanFa (2022) No. 348 October 2022
2Supply-side instrumentsCentralGuiding Opinions on Promoting the Development of China Forestry CloudLinXinFa (2017) No. 11625 October 2017
CentralNational Forestry Informatization Construction Technical GuideLinBanFa (2009) No. 231 February 2009
3Demand-side instrumentsCentral“14th Five-Year Plan” Forestry and Grassland Protection Development Plan OutlineLinGuiFa (2021) No. 10814 December 2021
CentralGuiding Opinions of the National Forestry and Grassland Administration on Promoting High-Quality Development of Forestry and Grassland IndustriesLinGaiFa (2019) No. 1419 February 2019
4Environment-type instrumentsCentral“Internet Plus” Forestry Action Plan—National Forestry Informatization “13th Five-Year” Development PlanLinGuiFa (2016) No. 11622 March 2016
CentralNational Forestry Informatization Development “12th Five-Year” PlanLinGuiFa (2011) No. 18330 November 2011
5Supply-side instrumentsFujianConstruction Plan for Six Service Platforms for High-Quality Forestry DevelopmentMinLinWen (2024) No. 7726 August 2024
FujianFujian Province Implementation Plan for Comprehensively Accelerating Digital Empowerment of High-Quality Economic and Social DevelopmentMinZheng (2025) No. 418 February 2025
6Environment-type instrumentsHeilongjiangHeilongjiang Province Grassland Ecological Protection, Restoration and Utilization PlanHeiLinCaoFa (2021) No. 6315 November 2021
JilinBeautiful Jilin Construction Action Plan (2024–2027)JZhengBanFa (2024) No. 2111 December 2024
7Environment-type instrumentsJilinJilin Province Pilot Scheme for Establishing Modern State-Owned Forest FarmsJiLinLianFa (2020) No. 2618 September 2020
Heilongjiang2020 Central Budget Investment Plan for Grassland Fire Prevention ProjectsHeiLinCaoGui (2020) No. 1226 April 2020
8Environment-type instrumentsCentralForestry Development “13th Five-Year” PlanLinGuiFa (2016) No. 606 May 2016
CentralTypical Cases of Forestry Reform and Development in Fujian Province (Second Batch)MinLinWen (2024) No. 477 June 2024
9Supply-side instrumentsHeilongjiangHeilongjiang Province Digital Forestry and Grassland Construction Plan (2018–2025)–Ecological System ChapterHeiZhengBanGui (2018) No. 31 December 2018
HeilongjiangHeilongjiang Province Digital Forestry and Grassland Construction Plan (2018–2025)HeiZhengBanGui (2018) No. 31 December 2018
10Supply-side instrumentsHeilongjiangHeilongjiang Province “14th Five-Year” Digital Economy Development PlanHeiZhengFa (2022) No. 922 March 2022
Fujian2023 Key Tasks for Digital Fujian ConstructionMinZhengBan (2023) No. 1622 May 2023
11Demand-side instrumentsJilinJilin Province Big Data RegulationsJilin Province 13th People’s Congress Standing Committee Announcement No. 2527 November 2020
HeilongjiangHeilongjiang Province Regulations on Promoting Big Data Development and ApplicationHeilongjiang Province 13th People’s Congress Standing Committee Announcement No. 331 July 2022
12Environment-type instrumentsHeilongjiangHeilongjiang Province Digital Forestry and Grassland Construction Plan (2018–2025)–Supervision System ChapterHeiZhengBanGui (2018) No. 31 December 2018
HeilongjiangHeilongjiang Province Interim Measures for Satellite Remote Sensing Monitoring of Forestry and Grassland ResourcesHeiLinCaoFa (2020) No. 1025 February 2020
13Supply-side instrumentsHeilongjiang2021 Heilongjiang Province Forest Supervision and “One Map” Annual Update Work Plan for Forest Resource ManagementHeiLinCaoFa (2021) No. 2522 April 2021
HeilongjiangWork Plan for Satellite Remote Sensing Monitoring of Forestry and Grassland ResourcesHeiLinCaoFa (2022) No. 0812 April 2022

References

  1. Arts, K.; Van der Wal, R.; Adams, W.M. Digital technology and the conservation of nature. Ambio 2015, 44, 661–673. [Google Scholar] [CrossRef]
  2. Gabrys, J. Smart forests and data practices: From the Internet of Trees to planetary governance. Big Data Soc. 2020, 7, 2053951720904871. [Google Scholar] [CrossRef]
  3. Gabrys, J.; Westerlaken, M.; Urzedo, D.; Ritts, M.; Simlai, T. Reworking the political in digital forests: The cosmopolitics of sociotechnical worlds. Prog. Environ. Geogr. 2022, 1, 58–83. [Google Scholar] [CrossRef]
  4. Hou, R.; Ma, G.; Tong, L. How policy instruments affect forest cover: Evidence from China. For. Policy Econ. 2025, 172, 103455. [Google Scholar] [CrossRef]
  5. Layani, G.; Mehrjou, S.; Farajzadeh, Z. Effects of government policies reform on environmental sustainability: An integrated approach of PMP and system dynamics simulation model. J. Clean. Prod. 2023, 426, 138985. [Google Scholar] [CrossRef]
  6. Singh, R.; Gehlot, A.; Akram, S.V.; Thakur, A.K.; Buddhi, D.; Das, P.K. Forest 4.0: Digitalization of forest using the Internet of Things (IoT). J. King Saud Univ.-Comput. Inf. Sci. 2022, 34, 5587–5601. [Google Scholar] [CrossRef]
  7. Wang, G.G.; Lu, D.; Gao, T.; Zhang, J.; Sun, Y.; Teng, D.; Yu, F.; Zhu, J. Climate-smart forestry: An AI-enabled sustainable forest management solution for climate change adaptation and mitigation. J. For. Res. 2024, 36, 7. [Google Scholar] [CrossRef]
  8. Padilla, E.C.; Giuliani, A.; Kanniya, K.S.; Heang, V.L.; Sokchea, T.; Hou, K.; Gilliéron, J. Community engagement in the governance of Cambodian recreation forests. For. Policy Econ. 2025, 170, 103386. [Google Scholar] [CrossRef]
  9. Himes, A.; Hayes, P.; Jansens, J.-W.; Patterson, C.; Singer, J.; Evans, Z. Forest Stewards Guild position on climate-smart forestry. For. Monit. 2024, 1, 1–15. [Google Scholar] [CrossRef]
  10. Nijnik, M.; Secco, L.; Miller, D.; Melnykovych, M. Can social innovation make a difference to forest-dependent communities? For. Policy Econ. 2019, 100, 207–213. [Google Scholar] [CrossRef]
  11. Ludvig, A.; Weiss, G.; Sarkki, S.; Nijnik, M.; Živojinović, I. Mapping European and forest related policies supporting social innovation for rural settings. For. Policy Econ. 2018, 97, 146–152. [Google Scholar] [CrossRef]
  12. Brnkalakova, S.; Melnykovych, M.; Nijnik, M.; Barlagne, C.; Pavelka, M.; Udovc, A.; Marek, M.; Kovac, U.; Kluvánková, T. Collective forestry regimes to enhance transition to climate smart forestry. Environ. Policy Gov. 2022, 32, 492–503. [Google Scholar] [CrossRef]
  13. Alfieri, D.; Tognetti, R.; Santopuoli, G. Exploring climate-smart forestry in Mediterranean forests through an innovative composite climate-smart index. J. Environ. Manag. 2024, 368, 122002. [Google Scholar] [CrossRef]
  14. Ludvig, A.; Sarkki, S.; Weiss, G.; Živojinović, I. Policy impacts on social innovation in forestry and back: Institutional change as a driver and outcome. For. Policy Econ. 2021, 122, 102335. [Google Scholar] [CrossRef]
  15. Ehrlich-Sommer, F.; Hoenigsberger, F.; Gollob, C.; Nothdurft, A.; Stampfer, K.; Holzinger, A. Sensors for digital transformation in smart forestry. Sensors 2024, 24, 798. [Google Scholar] [CrossRef] [PubMed]
  16. Hoppen, M.; Chen, J.; Kemmerer, J.; Baier, S.; Bektas, A.R.; Schreiber, L.J.; Mayer, D.G.; Kaulen, A.; Ziesak, M.; Rossmann, J. Smart forestry—A forestry 4.0 approach to intelligent and fully integrated timber harvesting. Int. J. For. Eng. 2024, 35, 137–152. [Google Scholar] [CrossRef]
  17. Meng, G.; Wu, S.; Yu, Y. Forestry policy effectiveness and performance evaluation in China—Quantitative study based on policy texts 1998–2020. For. Policy Econ. 2025, 170, 103367. [Google Scholar] [CrossRef]
  18. Thal, D.R.C.; Forrow, L.V.; Lipman, E.R.; Starling, J.E.; Finucane, M.M. Aggregate bayesian causal forests: The abcs of flexible causal inference for hierarchically structured data. arXiv 2024, arXiv:2407.07067. [Google Scholar] [CrossRef]
  19. Souto, H.G.; Neto, F.L. Forests for Differences: Robust Causal Inference Beyond Parametric DiD. arXiv 2025, arXiv:2505.09706. [Google Scholar] [CrossRef]
  20. Blei, D.M.; Ng, A.Y.; Jordan, M.I. Latent Dirichlet Allocation. J. Mach. Learn. Res. 2003, 3, 993–1022. [Google Scholar]
  21. Blackman, A. Evaluating forest conservation policies in developing countries using remote sensing data: An introduction and practical guide. For. Policy Econ. 2013, 34, 1–16. [Google Scholar] [CrossRef]
  22. Sarker, P.K.; Fischer, R.; Tamayo, F.; Navarrete, B.T.; Günter, S. Analyzing forest policy mixes based on the coherence of policies and the consistency of legislative policy instruments: A case study from Ecuador. For. Policy Econ. 2022, 144, 102838. [Google Scholar] [CrossRef]
  23. Chen, X.; Lin, B. Towards carbon neutrality by implementing carbon emissions trading scheme: Policy evaluation in China. Energy Policy 2021, 157, 112510. [Google Scholar] [CrossRef]
  24. Elomina, J.; Pülzl, H. How are forests framed? An analysis of EU forest policy. For. Policy Econ. 2021, 127, 102448. [Google Scholar] [CrossRef]
  25. Aurenhammer, P.K.; Glormann, M.; Strüber, P.; Krott, M. The relevance of social-milieus for forest policy research—Insights from a Germany-focused review. Trees For. People 2025, 20, 100866. [Google Scholar] [CrossRef]
  26. Vatn, A. Rationality, institutions and environmental policy. Ecol. Econ. 2005, 55, 203–217. [Google Scholar] [CrossRef]
  27. Howlett, M.; Rayner, J. Patching vs packaging in policy formulation: Assessing policy portfolio design. Politics Gov. 2013, 1, 170–182. [Google Scholar] [CrossRef]
  28. Lascoumes, P.; Le Gales, P. Introduction: Understanding public policy through its instruments—From the nature of instruments to the sociology of public policy instrumentation. Governance 2007, 20, 1–21. [Google Scholar] [CrossRef]
  29. Neeff, T.; Piazza, M. How countries link forest monitoring into policy-making. For. Policy Econ. 2020, 118, 102248. [Google Scholar] [CrossRef]
  30. Jordan, A.; Benson, D.; Wurzel, R.; Zito, A.R.; Richardson, J.J. Environmental policy: Governing by multiple policy instruments. In Constructing a Policy-Making State? Oxford University Press: Oxford, UK, 2012; pp. 104–124. [Google Scholar]
  31. Lockie, S. Market instruments, ecosystem services, and property rights: Assumptions and conditions for sustained social and ecological benefits. Land Use Policy 2013, 31, 90–98. [Google Scholar] [CrossRef]
  32. Blackstock, K.L.; Novo, P.; Byg, A.; Creaney, R.; Bourke, A.J.; Maxwell, J.L.; Tindale, S.J.; Waylen, K.A. Policy instruments for environmental public goods: Interdependencies and hybridity. Land Use Policy 2021, 107, 104709. [Google Scholar] [CrossRef]
  33. Cubbage, F.; Harou, P.; Sills, E. Policy instruments to enhance multi-functional forest management. For. Policy Econ. 2007, 9, 833–851. [Google Scholar] [CrossRef]
  34. Barton, D.N.; Ring, I.; Rusch, G.M. Policy Mixes: Aligning instruments for biodiversity conservation and ecosystem service provision. Environ. Policy Gov. 2017, 27, 397–403. [Google Scholar] [CrossRef]
  35. Shan, B.; Li, F. A Review of LDA-based Topic Evolution Research Methods. J. Chin. Inf. Process. 2010, 24, 43–49. [Google Scholar]
  36. Mimno, D.; Wallach, H.M.; Talley, E.; Leenders, M.; McCallum, A. Optimizing semantic coherence in topic models. In Proceedings of the Conference on Empirical Methods in Natural Language Processing, Edinburgh, UK, 27–31 July 2011; Association for Computational Linguistics: Stroudsburg, PA, USA, 2011; pp. 262–272. [Google Scholar]
  37. Qin, C.; Zhu, T.; Zhao, P.; Zhang, Y. Research progress in natural language semantic analysis. Libr. Inf. Serv. 2014, 58, 130–137. [Google Scholar] [CrossRef]
  38. Jelodar, H.; Wang, Y.; Yuan, C.; Feng, X. Latent Dirichlet allocation (LDA) and topic modeling: Models, applications, a survey. Multimed. Tools Appl. 2019, 78, 15169–15211. [Google Scholar] [CrossRef]
  39. Cai, Z.; Li, H.; Hu, X.; Graesser, A. Can Word Probabilities from LDA Be Simply Added up to Represent Documents? In Proceedings of the 9th International Conference on Educational Data Mining, Raleigh, NC, USA, 29 June–2 July 2016. [Google Scholar]
  40. Rothwell, R.; Zegveld, W. Industrial Innovation and Public Policy: Preparing for the 1980s and the 1990s; Greenwood Press: Westport, CT, USA, 1981. [Google Scholar]
  41. Ruiz Estrada, M.A.; Yap, S.F.; Nagaraj, S. Beyond the ceteris paribus assumption: Modeling demand and supply assuming omnia mobilis. Int. J. Econ. Res. 2008, 5, 185–194. [Google Scholar]
  42. Liu, Q.; Jia, M.; Xia, D. Dynamic evaluation of new energy vehicle policy based on text mining of PMC knowledge framework. J. Clean. Prod. 2023, 392, 136237. [Google Scholar] [CrossRef]
  43. Song, C.; Liu, Z.; Yuan, M.; Zhao, C. From text to effectiveness: Quantifying green industrial policies in China. J. Clean. Prod. 2024, 446, 141445. [Google Scholar] [CrossRef]
  44. Estrada, M.A.R. Policy modeling: Definition, classification and evaluation. J. Policy Model. 2011, 33, 523–536. [Google Scholar] [CrossRef]
  45. Dai, S.; Zhang, W.; Zong, J.; Wang, Y.; Wang, G. How effective is the green development policy of China’s Yangtze River Economic Belt? A quantitative evaluation based on the PMC-index model. Int. J. Environ. Res. Public Health 2021, 18, 7676. [Google Scholar] [CrossRef]
  46. Yiye, Z.; Mo, W.; Yuxiu, C.; Wenze, H. Quantitative evaluation of the civil aviation green development policy of China based on the policy modeling consistency (PMC) index model. Transp. Policy 2025, 162, 171–187. [Google Scholar] [CrossRef]
  47. Chuang, J.; Manning, C.D.; Heer, J. Termite: Visualization techniques for assessing textual topic models. In Proceedings of the International Working Conference on Advanced Visual Interfaces, Capri Island, Italy, 21–25 May 2012; pp. 74–77. [Google Scholar]
  48. Sievert, C.; Shirley, K. LDAvis: A method for visualizing and interpreting topics. In Proceedings of the Workshop on Interactive Language Learning, Visualization, and Interfaces, Baltimore, MD, USA, 27 June 2014; pp. 63–70. [Google Scholar]
  49. Howlett, M.; Rayner, J. Design principles for policy mixes: Cohesion and coherence in ‘new governance arrangements’. Policy Soc. 2007, 26, 1–18. [Google Scholar] [CrossRef]
  50. Tesfaye, M.; Kimengsi, J.N.; Giessen, L. A policy mix for achieving ambitious goals on forest landscape restoration: Analyzing coherence and consistency in Ethiopia forest-related policy. Land Use Policy 2024, 144, 107214. [Google Scholar] [CrossRef]
  51. Ramesh, M. Studying Public Policy: Policy Cycles and Policy Subsystems; Oxford University Press: Toronto, ON, Canada, 2003. [Google Scholar]
  52. Rogge, K.S.; Reichardt, K. Policy mixes for sustainability transitions: An extended concept and framework for analysis. Res. Policy 2016, 45, 1620–1635. [Google Scholar] [CrossRef]
  53. European Commission. New EU Forest Strategy for 2030. 2021. Available online: https://ec.europa.eu/info/news (accessed on 10 June 2025).
  54. Van Gossum, P.; Ledene, L.; Arts, B.; De Vreese, R.; Van Langenhove, G.; Verheyen, K. New environmental policy instruments to realize forest expansion in Flanders (northern Belgium): A base for smart regulation? Land Use Policy 2009, 26, 935–946. [Google Scholar] [CrossRef]
  55. Capano, G.; Howlett, M. Causal logics and mechanisms in policy design: How and why adopting a mechanistic perspective can improve policy design. Public Policy Adm. 2021, 36, 141–162. [Google Scholar] [CrossRef]
  56. Ontario Ministry of Natural Resources and Forestry. Forest Management Planning Manual. Government of Ontario. 2021. Available online: https://files.ontario.ca/mnrf-forest-management-planning-manual-en-2021-04-09.pdf (accessed on 10 June 2025).
  57. Natural Resources Canada. The State of Canada’s Forests: Annual Report 2020. Government of Canada. 2020. Available online: https://natural-resources.canada.ca/our-natural-resources/forests/state-canadas-forests-report/16496 (accessed on 10 June 2025).
  58. Bennear, L.S.; Stavins, R.N. Second-best theory and the use of multiple policy instruments. Environ. Resour. Econ. 2007, 37, 111–129. [Google Scholar] [CrossRef]
  59. Hood, C.; Margetts, H. The Tools of Government in the Digital Age; Bloomsbury Publishing: London, UK, 2007. [Google Scholar]
  60. Kattel, R.; Mazzucato, M. Mission-oriented innovation policy and dynamic capabilities in the public sector. Ind. Corp. Change 2018, 27, 787–801. [Google Scholar] [CrossRef]
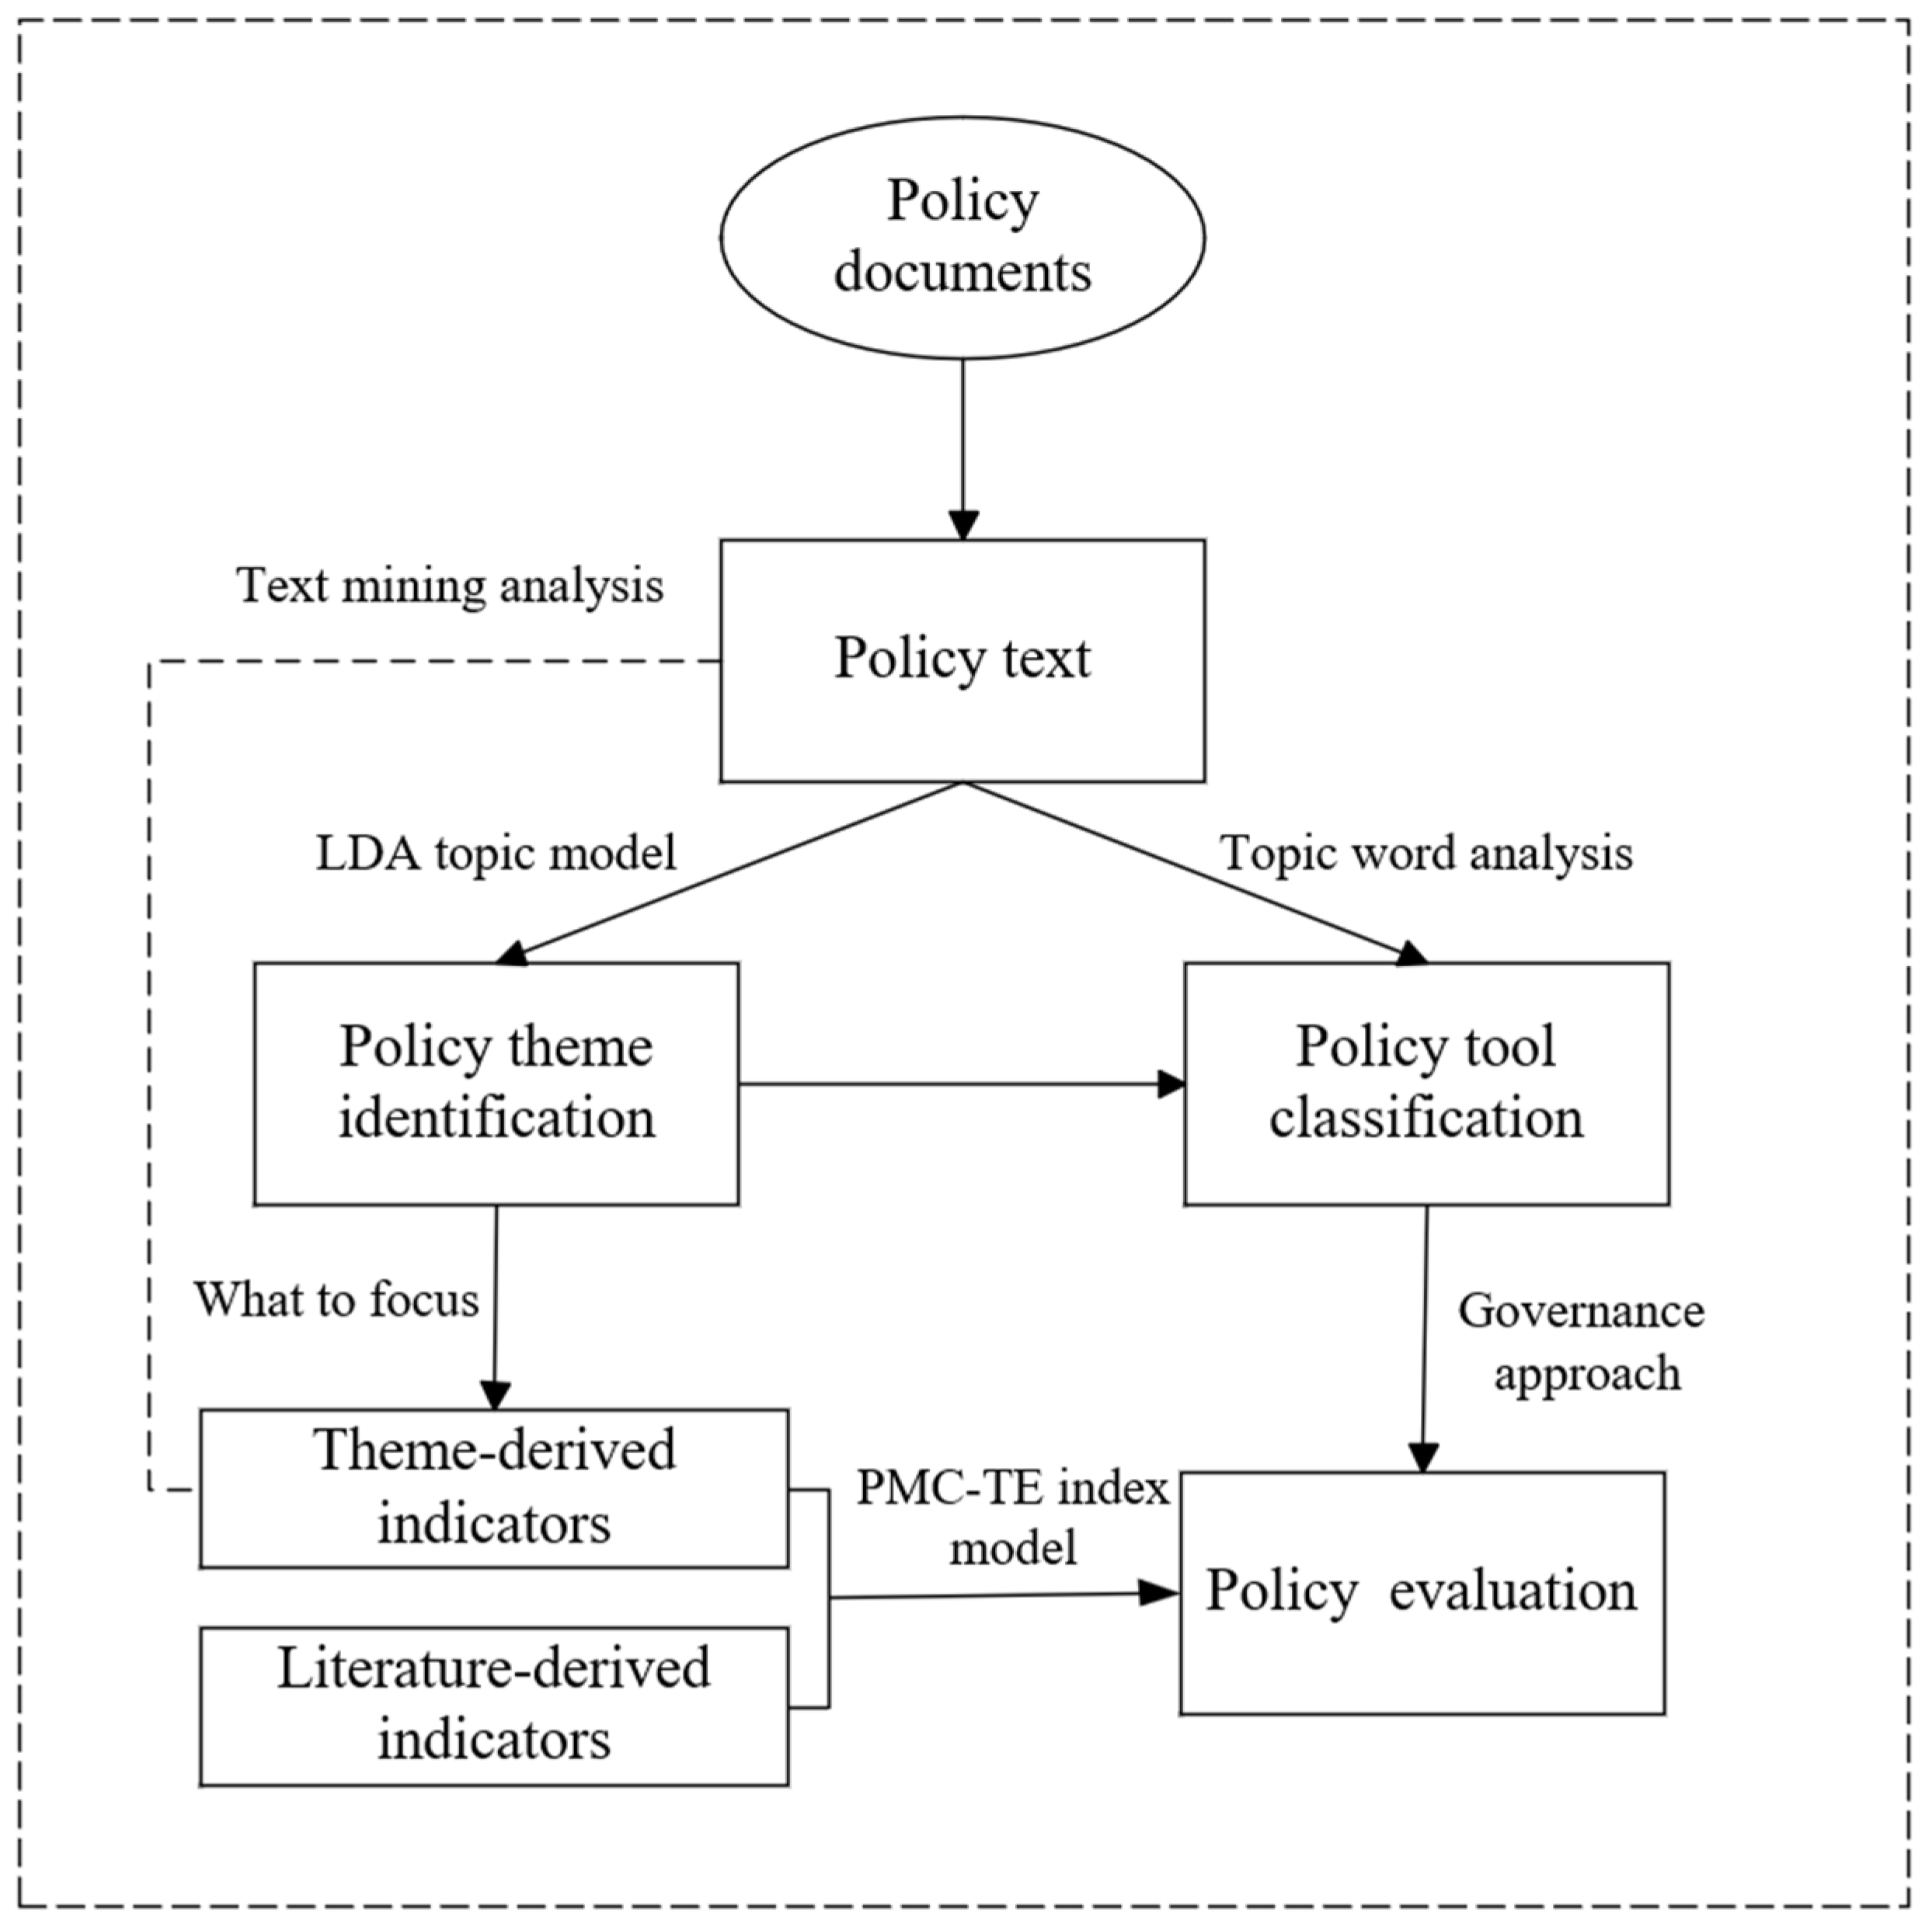
Figure 1. Methodology framework. (Source: Drawn by the authors based on the research design.).
Forests 16 01297 g001
Figure 2. Impact of topic number on coherence and perplexity. (Source: generated by the authors based on LDA model tuning results).
Forests 16 01297 g002
Figure 3. Impact of topic number on KL divergence and JSD divergence. (Source: generated by the authors based on LDA model tuning results).
Forests 16 01297 g003
Figure 4. Visualization of LDA model output using the pyLDAvis tool. (Source: Authors’ visualization based on LDA results of smart forestry policy texts, rendered via the open-source pyLDAvis toolkit (BSD license)).
Forests 16 01297 g004
Figure 5. Distribution of PMC-TE scores by policy instrument type. (Source: Developed by the authors based on PMC-TE evaluation results.).
Forests 16 01297 g005
Figure 6. Three-dimensional PMC surfaces of selected smart forestry policies. (Source: generated by the author based on PMC-TE evaluation results. Panels (ah) correspond to four policy quality levels: (a,b)—Perfect; (c,d)—Excellent; (e,f)—Good; (g,h)—Acceptable.).
Forests 16 01297 g006aForests 16 01297 g006b
Table 1. Representative policy documents on smart forestry.
Topic IDCategoryRegionPolicy Document TitleDocument Issuance NumberRelease Date
1Supply-side instrumentsJilinJilin Province Digital Agriculture Development “14th Five-Year Plan” (2021–2025)JNongShiFa (2021) No. 913 May 2021
JilinImplementation Opinions of the General Office of Jilin Provincial People’s Government on Smart Agriculture DevelopmentJZhengBanFa (2022) No. 348 October 2022
13Supply-side instrumentsHeilongjiang2021 Heilongjiang Province Forest Supervision and “One Map” Annual Update Work Plan for Forest Resource ManagementHeiLinCaoFa (2021) No. 2522 April 2021
HeilongjiangWork Plan for Satellite Remote Sensing Monitoring of Forestry and Grassland ResourcesHeiLinCaoFa (2022) No. 0812 April 2022
Table 2. Evaluation criteria of second-level variables under the PMC-TE model.
First-Level VariableSecond-Level IDEnglish NameDescription
X1 Policy NatureX1.1PredictiveWhether the policy reflects predictiveness
X1.2RegulatoryWhether the policy reflects regulatory content
X1.3DescriptiveWhether the policy provides descriptive guidance
X1.4Diagnostic/AdvisoryWhether the policy includes diagnostic assessments or offers actionable recommendations based on prior evaluations
X2 Policy TimelinessX2.1Long-termPolicy duration or target period is ≥5 years
X2.2Medium-termPolicy duration or target period is between 3 and 5 years
X2.3Short-termPolicy duration or target period is between 1 and 3 years
X2.4Immediate/PhaseWithin 1 year or a one-off work plan
X3 Policy LevelX3.1National levelWhether the policy is issued by a national agency
X3.2Local levelWhether the policy is issued by a local agency
X4 Policy EvaluationX4.1Clear objectivesWhether the policy objectives are clearly stated
X4.2Substantial measuresWhether the policy provides substantial measures
X4.3Reasonable planningWhether the policy plan is reasonable
X4.4Logical CoherenceA complete logical chain connecting objectives, measures, and evaluation
X5 Policy domainX5.1Digital Infra and CybersecurityTopic 2/9/13
X5.2Ecological Protection and RestorationTopic 4/8
X5.3Rural-Industry and LivelihoodTopic 3/11
X5.4Disaster and Risk ControlTopic 8
X6 Policy safeguardsX6.1Legal/NormativeWhether the policy cites laws, standards, or enforcement clauses
X6.2Funding and TalentSpecial funds, talent programs, and subsidies
X6.3Technical SupportPlatforms, cloud services, AI tools
X6.4Supervision and KPIDynamic monitoring, performance evaluation, third-party assessments
X7 Policy prioritiesX7.1Supply-sideDirect inputs: technology, R&D funding, infrastructure
X7.2Demand-sideIncentivizing users/markets: subsidies, demonstration consumption, etc.
X7.3EnvironmentalInstitutional arrangements, taxation, standard constraints
X7.4Mixed/PilotCombination of the three tool types or pilot initiatives
X8 Policy TargetsX8.1Enterprises/Market ActorsForestry equipment providers, platform companies, etc.
X8.2Public/FarmersForest farmers, communities, the general public
X8.3Governmental BodiesLocal forestry and grassland authorities
X8.4Multi-stakeholdersPublic-private partnerships, associations, social organizations
X9 Policy PerspectiveX9.1Macro StrategyTop-level design, nationwide layout
X9.2Micro-implementationOperational guidelines, manuals, SOPs
Table 3. Mapping of smart forestry policy topics to types of policy instruments.
Topic IDTopic NameSample KeywordsPolicy CategoryType of Policy InstrumentDescription
Topic 1Forestry Technology and Germplasm InnovationEquipment, new varieties, science outreach, R&DSupply-sideTechnical SupportProvides research platforms, innovation conversion, and biodiversity tech/equipment support
Topic 2Smart Forestry and Information InfrastructureSmart forestry, IT systems, cybersecurity, operationSupply-sideDigital InfrastructureBuilds monitoring platforms, forest data systems, and IT protection layers
Topic 3Digital Circulation and Livelihood ServicesCities, logistics, e-government, public servicesDemand-sidePublic Service ProvisionPromotes e-gov access, broadband, rural e-commerce
Topic 4Forest Ecosystem Protection and RestorationWetlands, rehabilitation, ecosystems, greeningEnvironmentalEnvironmental RegulationSets restoration targets and ecological norms
Topic 5Intelligent Sensing and Remote Monitoring SupportAI, GIS, remote sensing, surveyingSupply-sideTechnical SupportSupports digital infrastructure for ecological sensing
Topic 6Forest Supervision and Data GovernanceRegulation, GIS map, supervision, complianceEnvironmentalRegulation and StandardsPromotes legal enforcement and data-driven governance
Topic 7Forestland Rights and Resource AllocationForestland, tenure, logging, ownershipEnvironmentalInstitutional and Property ToolsClarifies land rights, harvesting, and tenure procedures
Topic 8Ecological Governance and Disaster ControlDesertification, sand control, wildlifeEnvironmentalEcological EngineeringImplements large-scale restoration and disaster mitigation
Topic 9Forest Cybersecurity and IT System ProtectionServers, threats, systems, detectionSupply-sideInfrastructure SupportSecures IT systems via hardware/software provision
Topic 10Data Statistics and Information ProcessingStatistics, imagery, permissions, systemsSupply-sideInfrastructure SupportDevelops geospatial/statistical processing platforms
Topic 11Rural Industry and Agricultural EmpowermentAgricultural products, cloud platform, rural economyDemand-sidePublic Service ProvisionSupports farmers and value-added agriculture
Topic 12Policy Coordination and Mobilization MechanismNDRC, fiscal bureau, implementation coordinationEnvironmentalAdministrative Coordination ToolsPromotes policy delivery via inter-agency collaboration
Topic 13Digital Economy and Infrastructure DevelopmentPublic data, e-commerce, computing powerSupply-sideDigital Infrastructure SupportInvests in 5G, computing, and national data hubs
Disclaimer/Publisher’s Note: The statements, opinions and data contained in all publications are solely those of the individual author(s) and contributor(s) and not of MDPI and/or the editor(s). MDPI and/or the editor(s) disclaim responsibility for any injury to people or property resulting from any ideas, methods, instructions or products referred to in the content.