Article

Prediction of the Potentially Suitable Area for Anoplophora glabripennis (Coleoptera: Cerambycidae) in China Based on MaxEnt

1
College of Agriculture, Shihezi University, Shihezi 832003, China
2
Xinjiang Production and Construction Corps, Forestry and Grassland Work Station, Urumqi 830000, China
*
Author to whom correspondence should be addressed.
These authors contributed equally to this work.
Forests 2025, 16(8), 1239; https://doi.org/10.3390/f16081239
Submission received: 16 April 2025 / Revised: 10 July 2025 / Accepted: 22 July 2025 / Published: 28 July 2025
(This article belongs to the Section Forest Health)

Abstract

Anoplophora glabripennis (Asian longhorned beetle, ALB) (Motschulsky, 1854) is a local forest pest in China. Although the suitable area for this pest has some research history, it does not accurately predict the future distribution area of ALB. Accurate prediction of its suitable area can help control the harm caused by ALB more effectively. In this study, we applied the maximum entropy model to predict the suitable area for ALB. Moreover, the prediction results revealed that ALB is distributed mainly in northern, eastern, central, southern, southwestern, and northwestern China, and its high-fit areas are located mainly in northern, northwestern, and southwestern China. The average minimum temperature in September, precipitation seasonality (coefficient of variation), the average maximum temperature in April, and average precipitation in October had the greatest influence on ALB. The greatest distribution probabilities were observed at the September average minimum temperature of 16 °C, the precipitation seasonality (coefficient of variation) of 130%, the April average maximum temperature of 14 °C, and the October average precipitation of 30 mm. Furthermore, with climate change, the non-suitability area for the ALB will show a decreasing trend in the future. The intermediate suitability area will increase, while the low and high suitability areas will first increase and then decrease. Taken together, the potentially suitable areas for ALB in China include the Beijing–Tianjin–Hebei region and the Shanghai region in North China and East China, providing a deeper understanding of ALB control.

1. Introduction

The long-horned beetle A. glabripennis belongs to the Cerambycidae of Coleoptera [1]. ALB is distributed in North China, East China, South China, and Central China [1]. It is also distributed in Asia, except China, such as Japan and Korea [2]. It was introduced into North America in the 1990s, probably from different regions such as China and South Korea, mainly through human activities such as wood packaging materials, containers, and wood transportation in international trade. Afterward, it was introduced into some European countries [3]. ALB is an important boring pest in forestry [1]. ALB feeds on the phloem and xylem of trees at the larval stage to form a worm passage, which destroys the conducting tissue and causes the trees to wither and die [2]. In the adult stage, it feeds on bark and leaves and lays eggs, further exacerbating the harm to key economic and ecological tree species, such as poplars and willows [2]. Due to the strong concealment of larvae and the rapid spread of adults, the pest can cause large-scale death of trees and economic losses in forestry [4]. Therefore, strict management of the species is essential. Larvae mainly feed on trunks, and adults mainly feed on petioles, twig bark, or leaves, which also seriously threatens the ecological function of the forest [5]. For example, most ALB drill holes in trees in the form of larvae, seriously damaging the xylem structure of trees, causing the death of trees, and endangering forest ecosystems [1]. At present, although some studies have been conducted on the occurrence area of ALB, the potential distribution area of ALB requires further study [2,6,7]. Because ALB is highly harmful to forestry, it is very important to predict the distribution of this insect in the future for the healthy development of forestry [8]. In 1985, a study identified the distribution area of ALB in East China through field investigation, determining its range in China to be between 100° E and 127° E and between 21° N and 43° N [9], whereas another study in 2007 revealed that its distribution in western China was mainly concentrated in Bayingolin Mongol Autonomous Prefecture in Xinjiang [10]. There is also a study using the modeling software CLIMEX to predict the potential global distribution of ALB based on historical (1987–2016) and future (2021–2050) climatic conditions [11], which provides a reference for us to use the maximum entropy model to predict the future potential distribution of ALB in China. To predict the potential distribution area of ALB more accurately, this study uses the maximum entropy model in a machine learning algorithm to predict the suitable area distribution of ALB on the basis of previous studies [12].
The maximum entropy model (MaxEnt) is a statistical modeling method based on the principle of information theory, which has been widely used in the fields of pest control and forest ecology [13]. In this study, Maxent was used to predict the species distribution of ALB. One study used the MaxEnt to predict that the potential suitable habitats of A. horsfieldi (Hope, 1831) were mainly distributed in northwest, central, and southwest China [14]. In 2022, a study using the MaxEnt model to predict the distribution and natural enemies of the Asian longhorn beetle and ALB concluded that the suitable habitat area for their natural enemies will migrate northward in the future, providing potential measures for future pest control through appropriate protection measures for future pest control through appropriate protection measures [7]. A study predicted the potential distribution of R. ferrugineus (Olivier, 1790) in China and concluded that Hainan, Guangdong, Fujian, and other regions are more suitable for the survival of red palm weevil [15]. Some researchers have predicted the suitable survival range of F. occidentalis (Pergande, 1895) in China and concluded that the areas of high and low suitability will continue to decrease in the future [16]. A previous study based on the Maxent model revealed that the suitable distribution range of two giant water bugs (Hemiptera: Belostomatidae) may shift to higher latitudes and altitudes, concluding that the future distribution range of these two giant water bugs will expand or contract northwards and maintain the original distribution range [17]. In summary, although the species studied previously using the maximum entropy model are different from ALB, these studies demonstrate that the maximum entropy model is feasible for predicting the future suitable habitats of species.
The summary of previous research methods shows that Maxent has strong robustness in predicting potentially suitable areas of organisms, and its prediction results have high credibility. Therefore, this study used Maxent to predict the future potential suitable areas of ALB in the SSP245 climate scenario, which may be distributed in the northwest and southwest regions. By collecting occurrence point data of ALB for prediction and simulation, and comparing the results, the distribution of potentially suitable areas of ALB and its future trend were obtained, and the key bioclimatic factors affecting the distribution of ALB were analyzed.

2. Materials and Methods

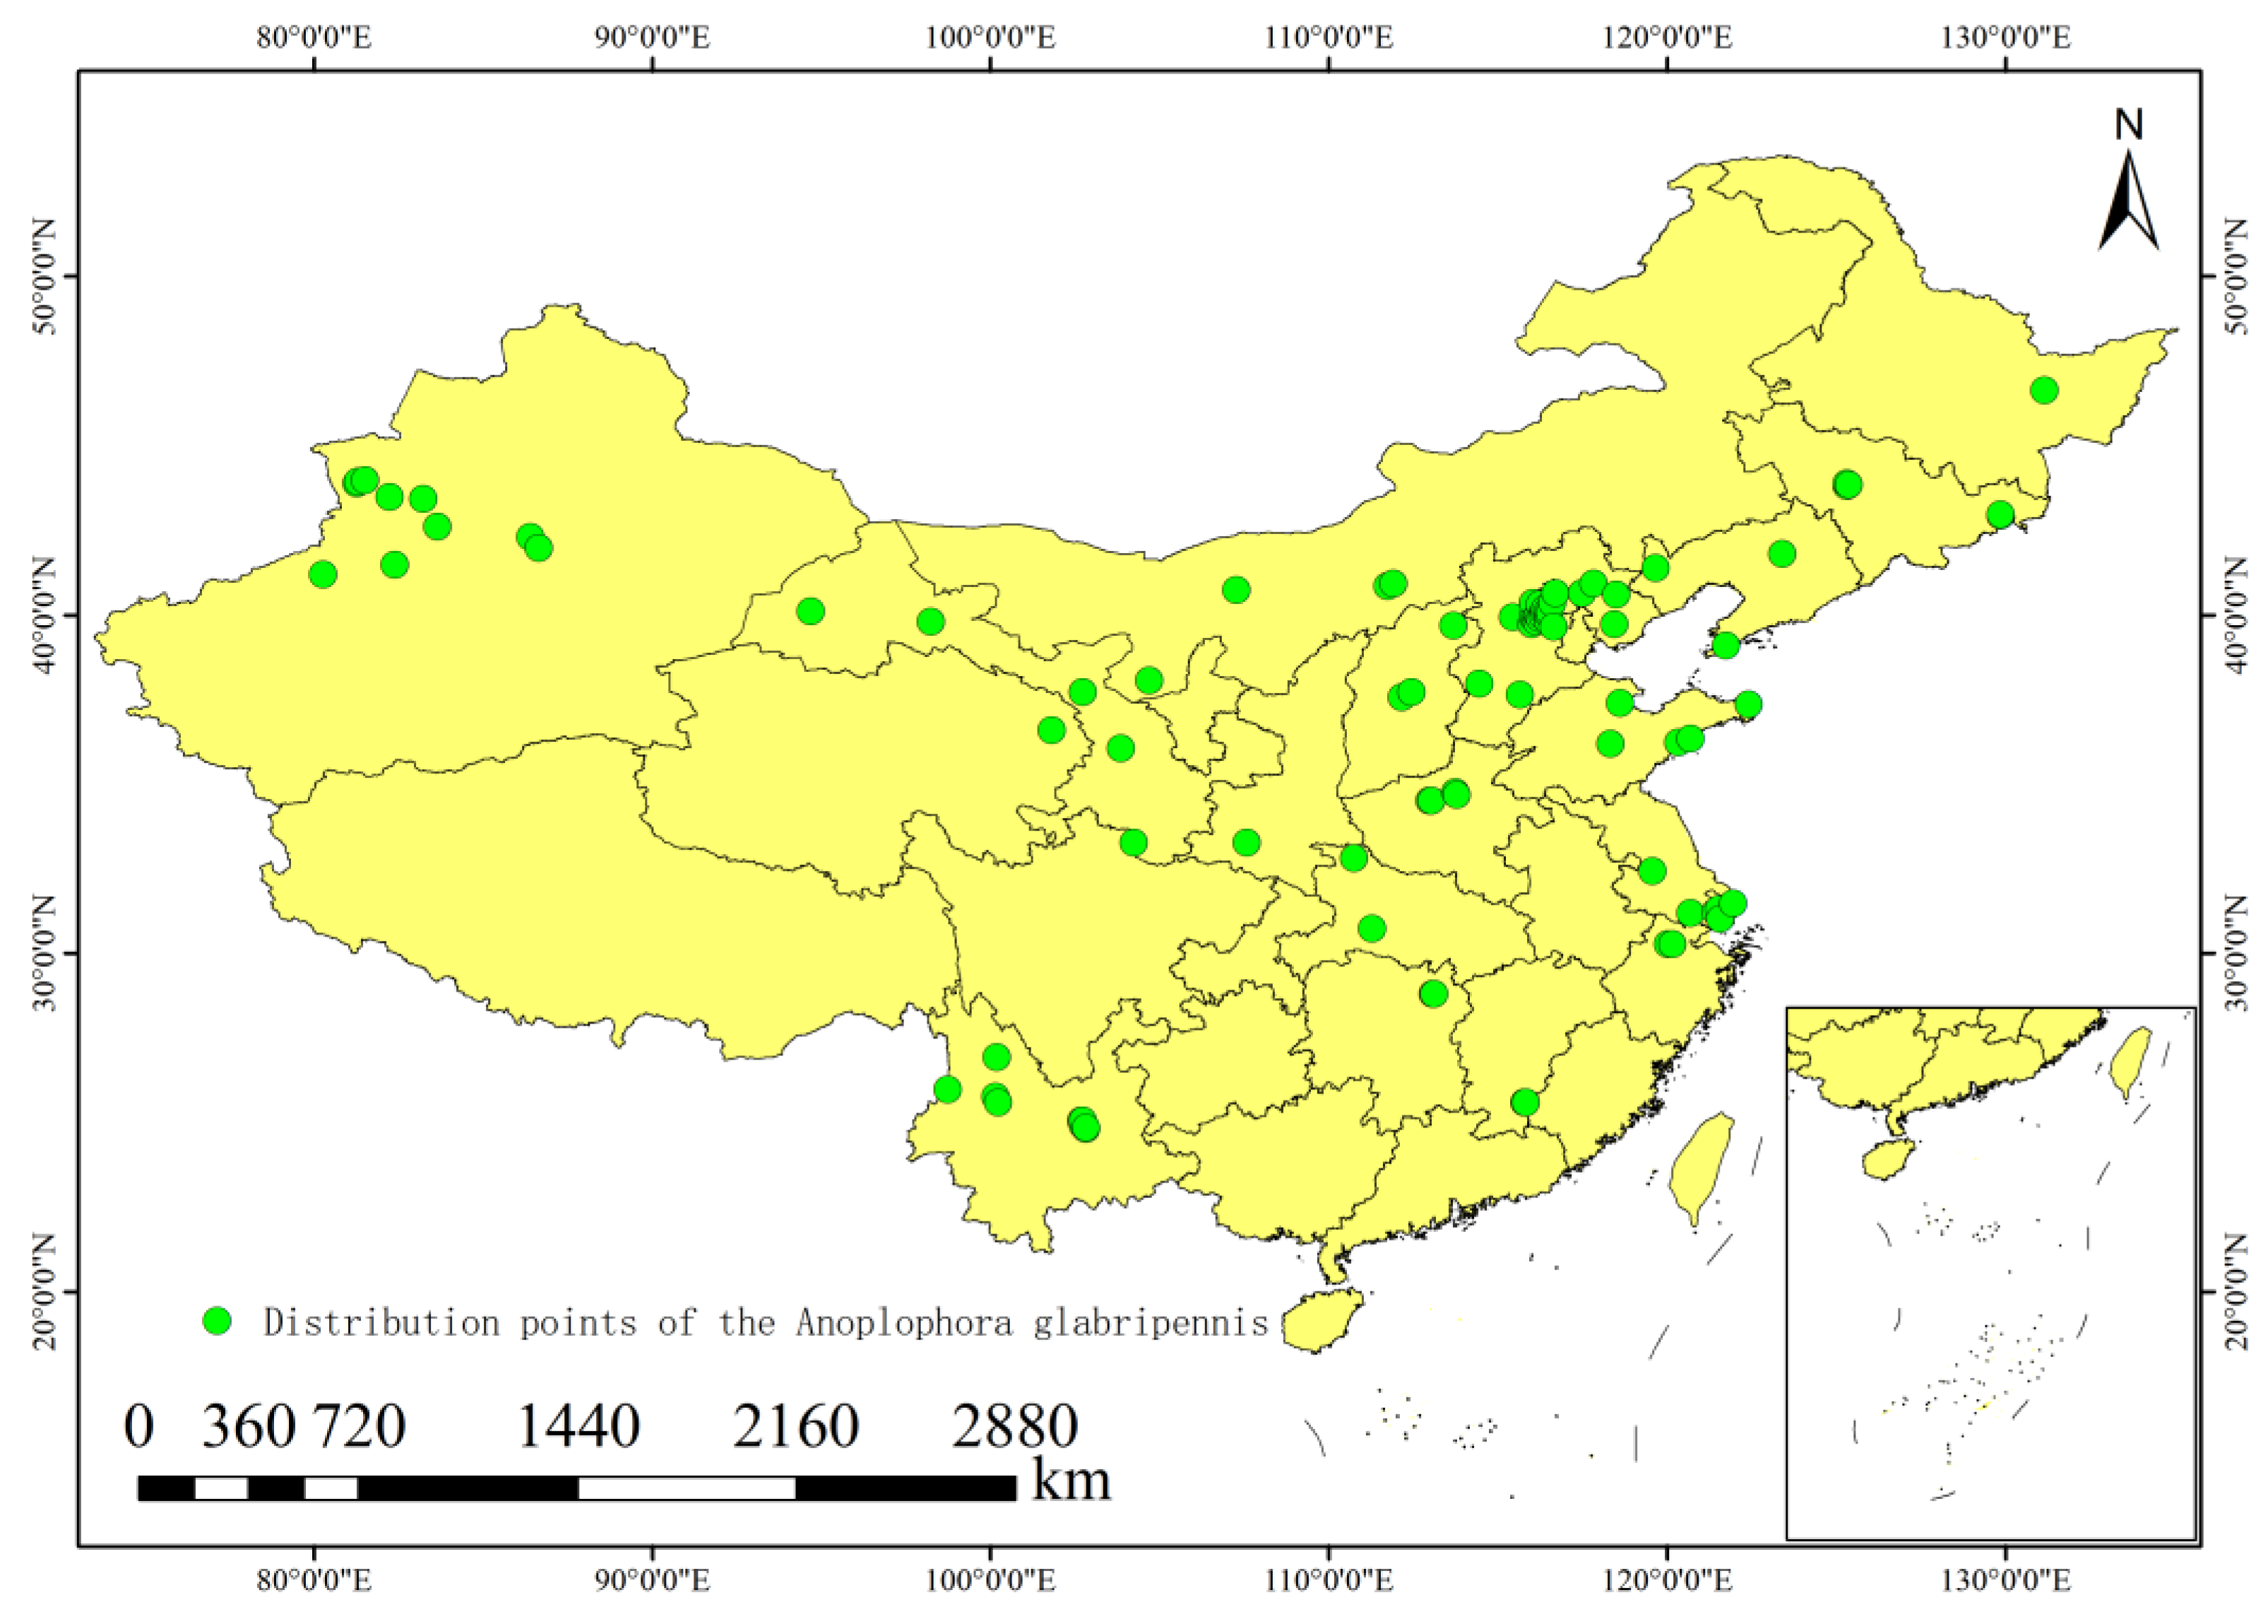
2.1. Occurrence Point Data for A. glabripennis (Asian longhorned beetle, ALB)

All occurrence data for ALB were obtained from GBIF (https://www.gbif.org (accessed on 14 April 2024)), and data points for China were selected for use [18]. Moreover, the distribution of this species in China was supplemented by a literature review [12,19]. ENMTools.pl (https://github.com/danlwarren/ENMTools (accessed on 5 May 2025)) was used to thin occurrence points, retaining only one observation per 2.5 arc-minute grid cell (corresponding to the environmental variable data below), in order to mitigate sampling bias in the data [7]. After screening outliers and repeating similar positions, a total of 96 representative distributions of ALB in China (Figure 1) were obtained and stored in .csv format.

2.2. Environmental Variable Data

In this study, a total of 55 environmental variables (Table 1) were selected from the World Meteorological Data website (WorldClim, https://www.worldclim.org (accessed on 14 April 2024)) [20]. The historical (1970–2000) meteorological data included 19 bioclimatic variables, 12-month average minimum temperature data, 12-month average maximum temperature data, and 12-month precipitation data. The Beijing Climate Center Climate System Model (BCC-CSM2-MR) under the SSP245 Shared Socio-Economic Pathway scenario is characterized by a medium-emission path. The radiative forcing remains stable at 4.5 W/m2 in 2100, and the model data used include 20th-century climate simulation experiments (r1i1p1 set) and monthly data under the SSP245 path in the 21st century. The future (2021–2040, 2021–2060) meteorological data are derived from the Beijing Climate Center Climate System Model (BCC-CSM2-MR) 19 bioclimatic variable data under the future shared economic and social path SSPs245 scenario, as well as 12-month average minimum temperature data, 12-month average maximum temperature data, and 12-month precipitation data. The spatial resolution is 2.5 arc minutes.

2.3. Geographic Data

The database map is an administrative division map derived from the National Basic Geographic Information Center (https://www.ngcc.cn (accessed on 4 April 2024)). The use of the administrative division map of the National Basic Geographic Information Center (review number: GS (2024) 0650) is mainly based on its statutory authority, data accuracy, and research suitability. The map has been officially audited, strictly in line with national surveying and mapping regulations, ensuring the accuracy of core geographic information such as national boundaries and administrative divisions, and avoiding politically sensitive risks. Its high-resolution data (such as 1:10,000 scale) and the latest administrative division adjustment information provide a reliable spatial benchmark for the distribution analysis of ALB, and support the accurate superposition of multi-source data (such as meteorology, traffic) and the formulation of cross-regional collaborative prevention and control strategies. At the same time, standardized mapping specifications and lightweight format design not only meet the visualization requirements of international journals but also facilitate the efficient integration of GIS tools. By labeling the image review number and data source, copyright compliance and data security are guaranteed, and spatial information support with both legal effect and scientific value is provided for scientific research and policy decision-making. The map revision number is GS (2024) 0650, which is only used for map visualization [21].

2.4. Variable Selection

Too many variables and their multicollinearity affect the accuracy and stability of the model [22]. Therefore, 55 variables need to be screened before making predictions. This study is based on the method of Shen et al. [23]. First, the contribution rate of each environmental variable is determined using the jackknife method, and then a Pearson correlation analysis is carried out on all variables. A highly correlated variable with a significant p-value less than 0.05 and a correlation coefficient greater than or equal to 0.8 was selected. According to the contribution rate of each variable to the model, the variables with the highest contribution rates are selected, and the variables with the lowest contribution rates are discarded. At the same time, variables with a contribution rate of less than 1.0 are discarded. Through variable screening, 12 variables were ultimately selected to predict the suitable area for ALB.

2.5. Software and Parameters

The suitable area prediction software selected in this paper is maximum entropy species distribution modeling (version 3.4.4) based on the Java environment [24]. When running the program, the software parameters include creating response curves, making pictures of predictions, performing a jackknife to measure variable importance, setting 75% of the distribution points as the training set and 25% of the distribution points as the test set, and repeating the iteration 10 times. We used the ENMeval package (https://github.com/jamiemkass/ENMeval (accessed on 5 May 2025)) to optimize the regularization multiplier (ranging from 0.5 to 5, with a step size of 0.5) and feature class parameters in R version 4.3.2 software (https://cran.r-project.org (accessed on 5 May 2025)). The optimization process was repeated 10 times to ensure robustness and reliability of the results. The data visualization software used was ArcGIS 10.8 [25].

3. Results

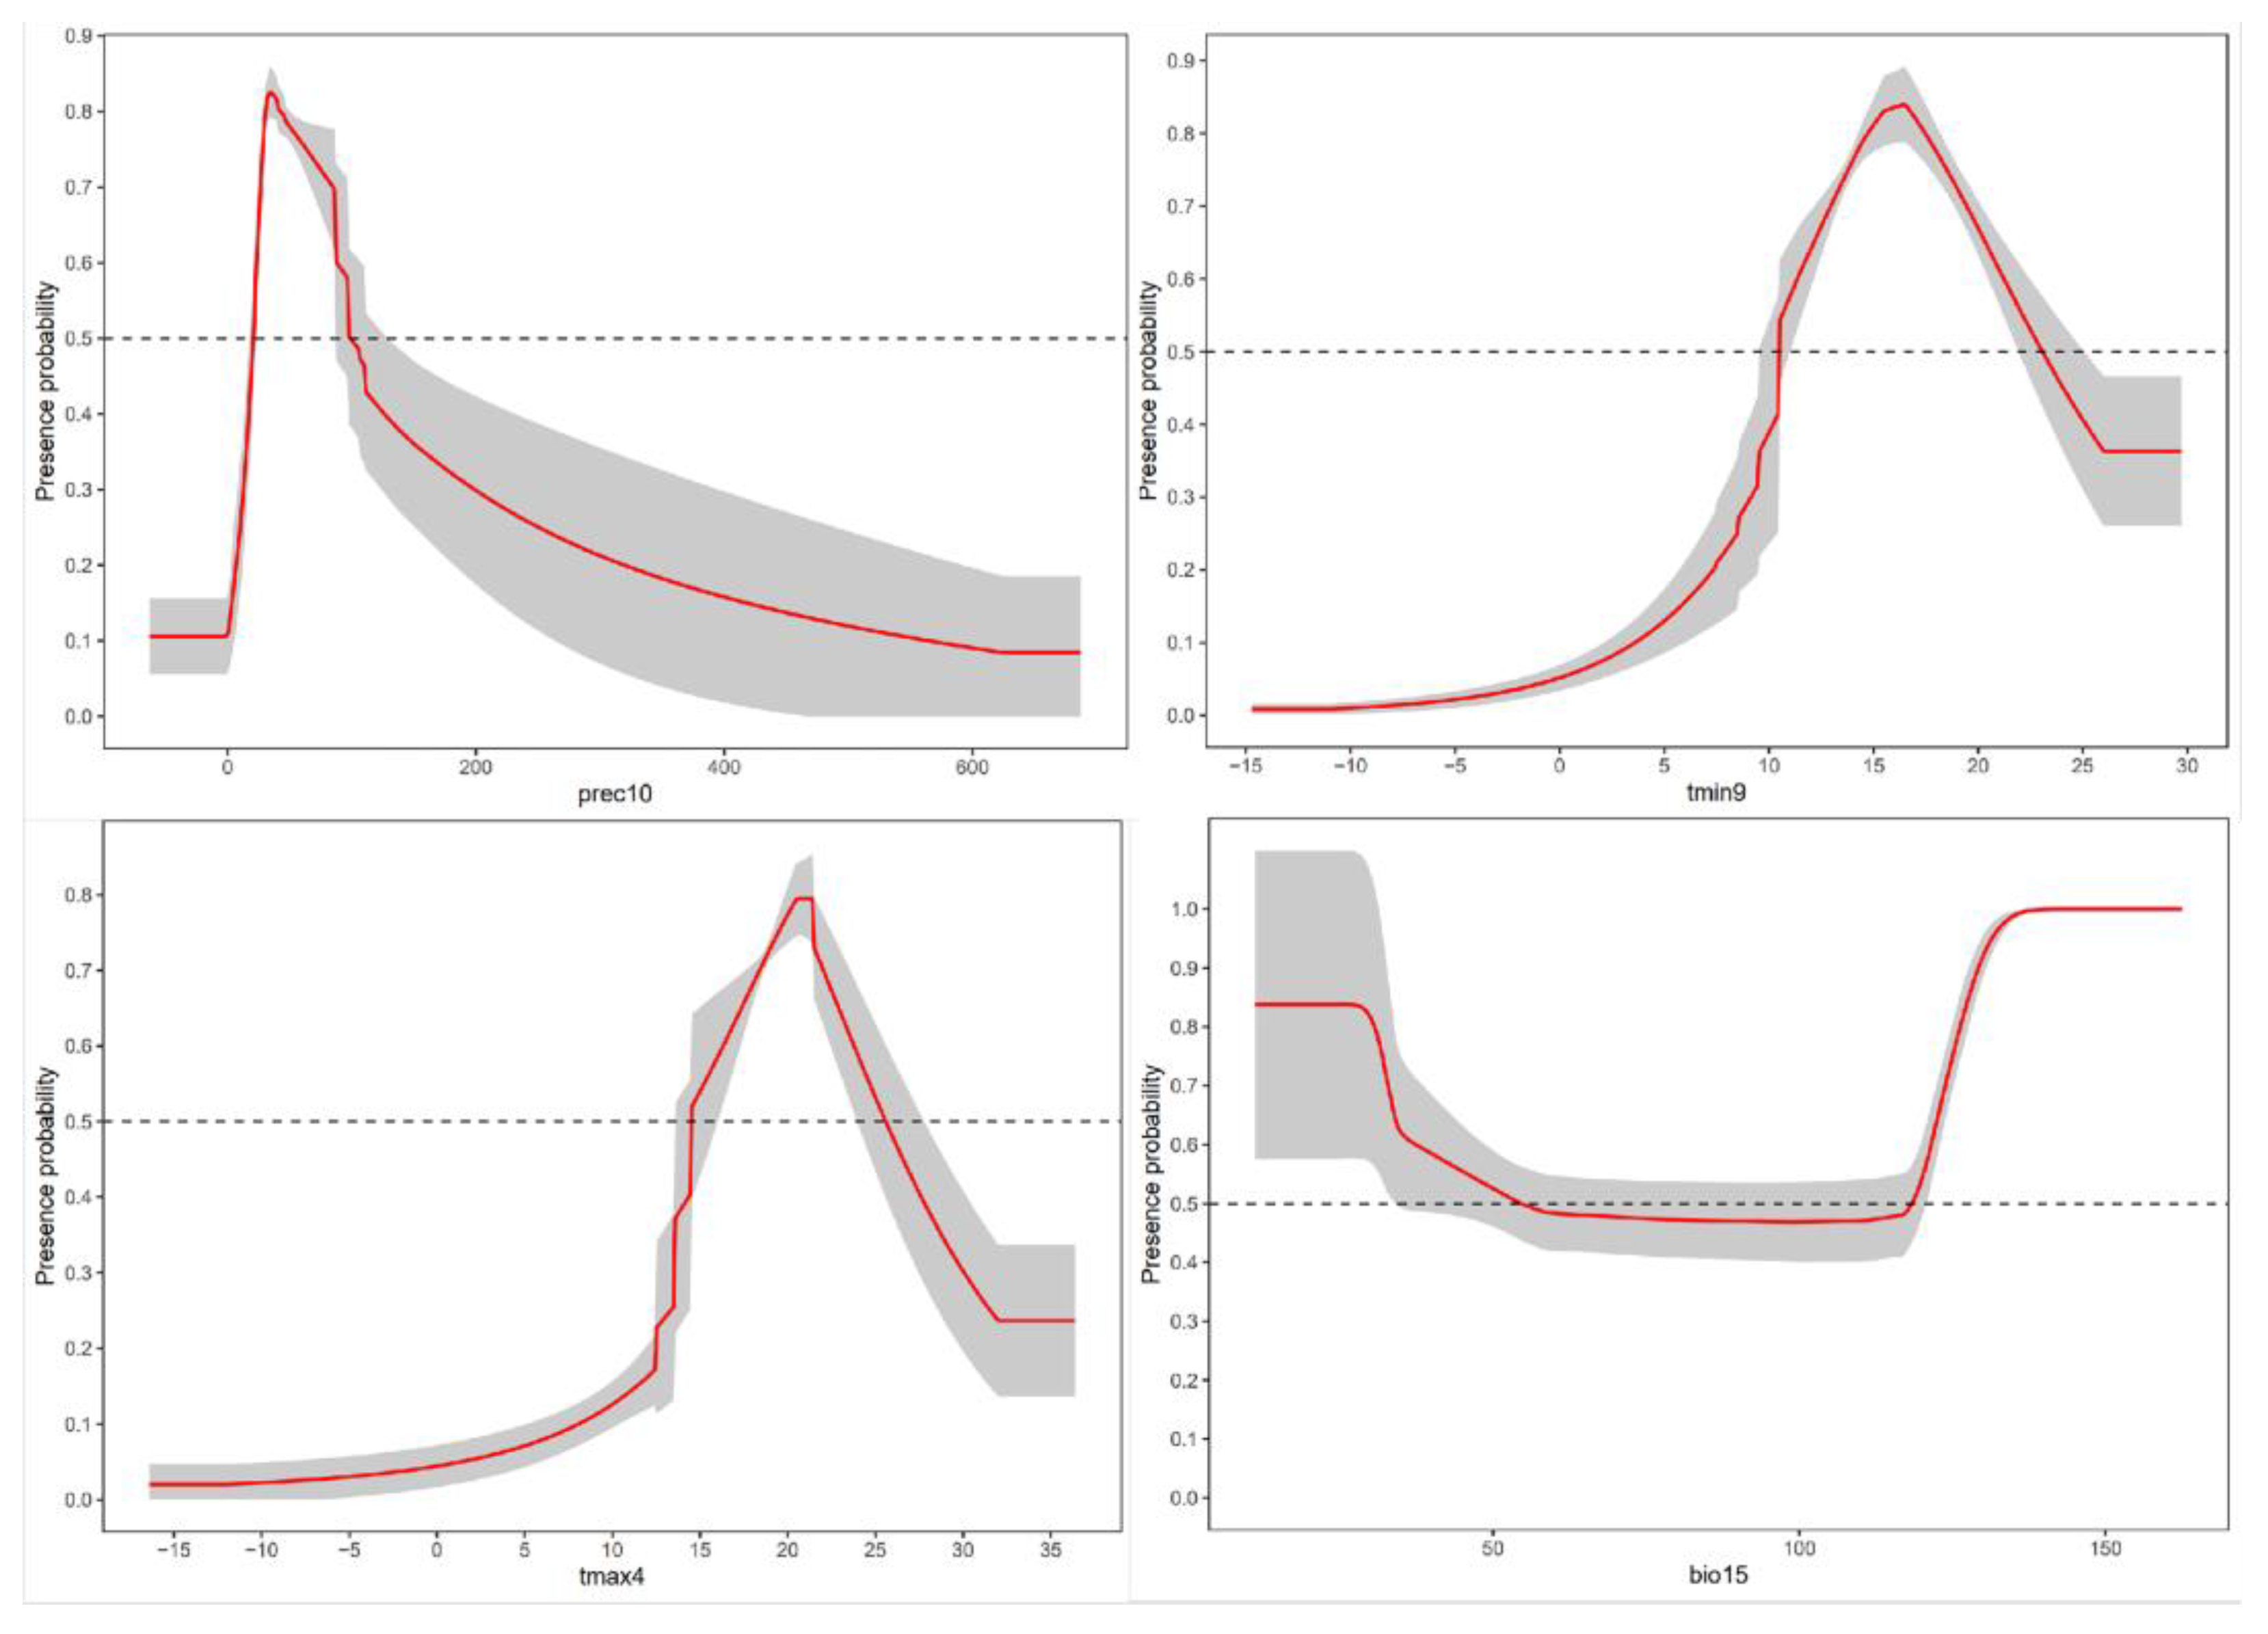
3.1. Key Environmental Variables Affecting the Distribution of Potentially Suitable Areas for A. glabripennis (Asian longhorned beetle, ALB)

Among the 12 variables input into the final model, the contribution of each variable is also different (Table 2). The results of the knife-cutting method revealed that the average minimum temperature in September (min 9), the seasonal variation coefficient of precipitation (Bio 15), the average maximum temperature in April (tmax 4), and the average precipitation in October (prec 10) had the highest contribution rates (Figure 2), with a cumulative contribution rate exceeding 50%. This indicates that temperature and precipitation during the eclosion and oviposition periods were the dominant factors affecting the suitable distribution of ALB.
An analysis of the response curves of the four main environmental variables revealed that when the average minimum temperature in September was 16 °C, it was the most suitable temperature for the growth of ALB, and the adaptation range of survival probabilities greater than 0.5 was approximately 11~23 °C (Figure 3). The average minimum temperature in September was too low or too high, which was not suitable for the growth of ALB. When the average maximum temperature in April is 21 °C, it is the most suitable temperature for the growth of the ALB. The survival probability is above 0.5 within a temperature range of approximately 16~26 °C (Figure 3). Average maximum temperatures in April that are too low or too high are not suitable for the growth of the ALB. When the seasonality (coefficient of variation) of precipitation was 130%, it was the most suitable for the growth of ALB, and a survival probability greater than 0.5 was approximately 0~55% or greater than 122% (Figure 3). When the seasonality (coefficient of variation) of precipitation was moderate, it was not suitable for the growth of ALB. When the average precipitation in October was 30 mm, it was the most suitable for the growth of ALB, and the adaptation range of survival probability greater than 0.5 was approximately 20~100 mm (Figure 3). When the average precipitation in October was high, it was not suitable for the growth of ALB.

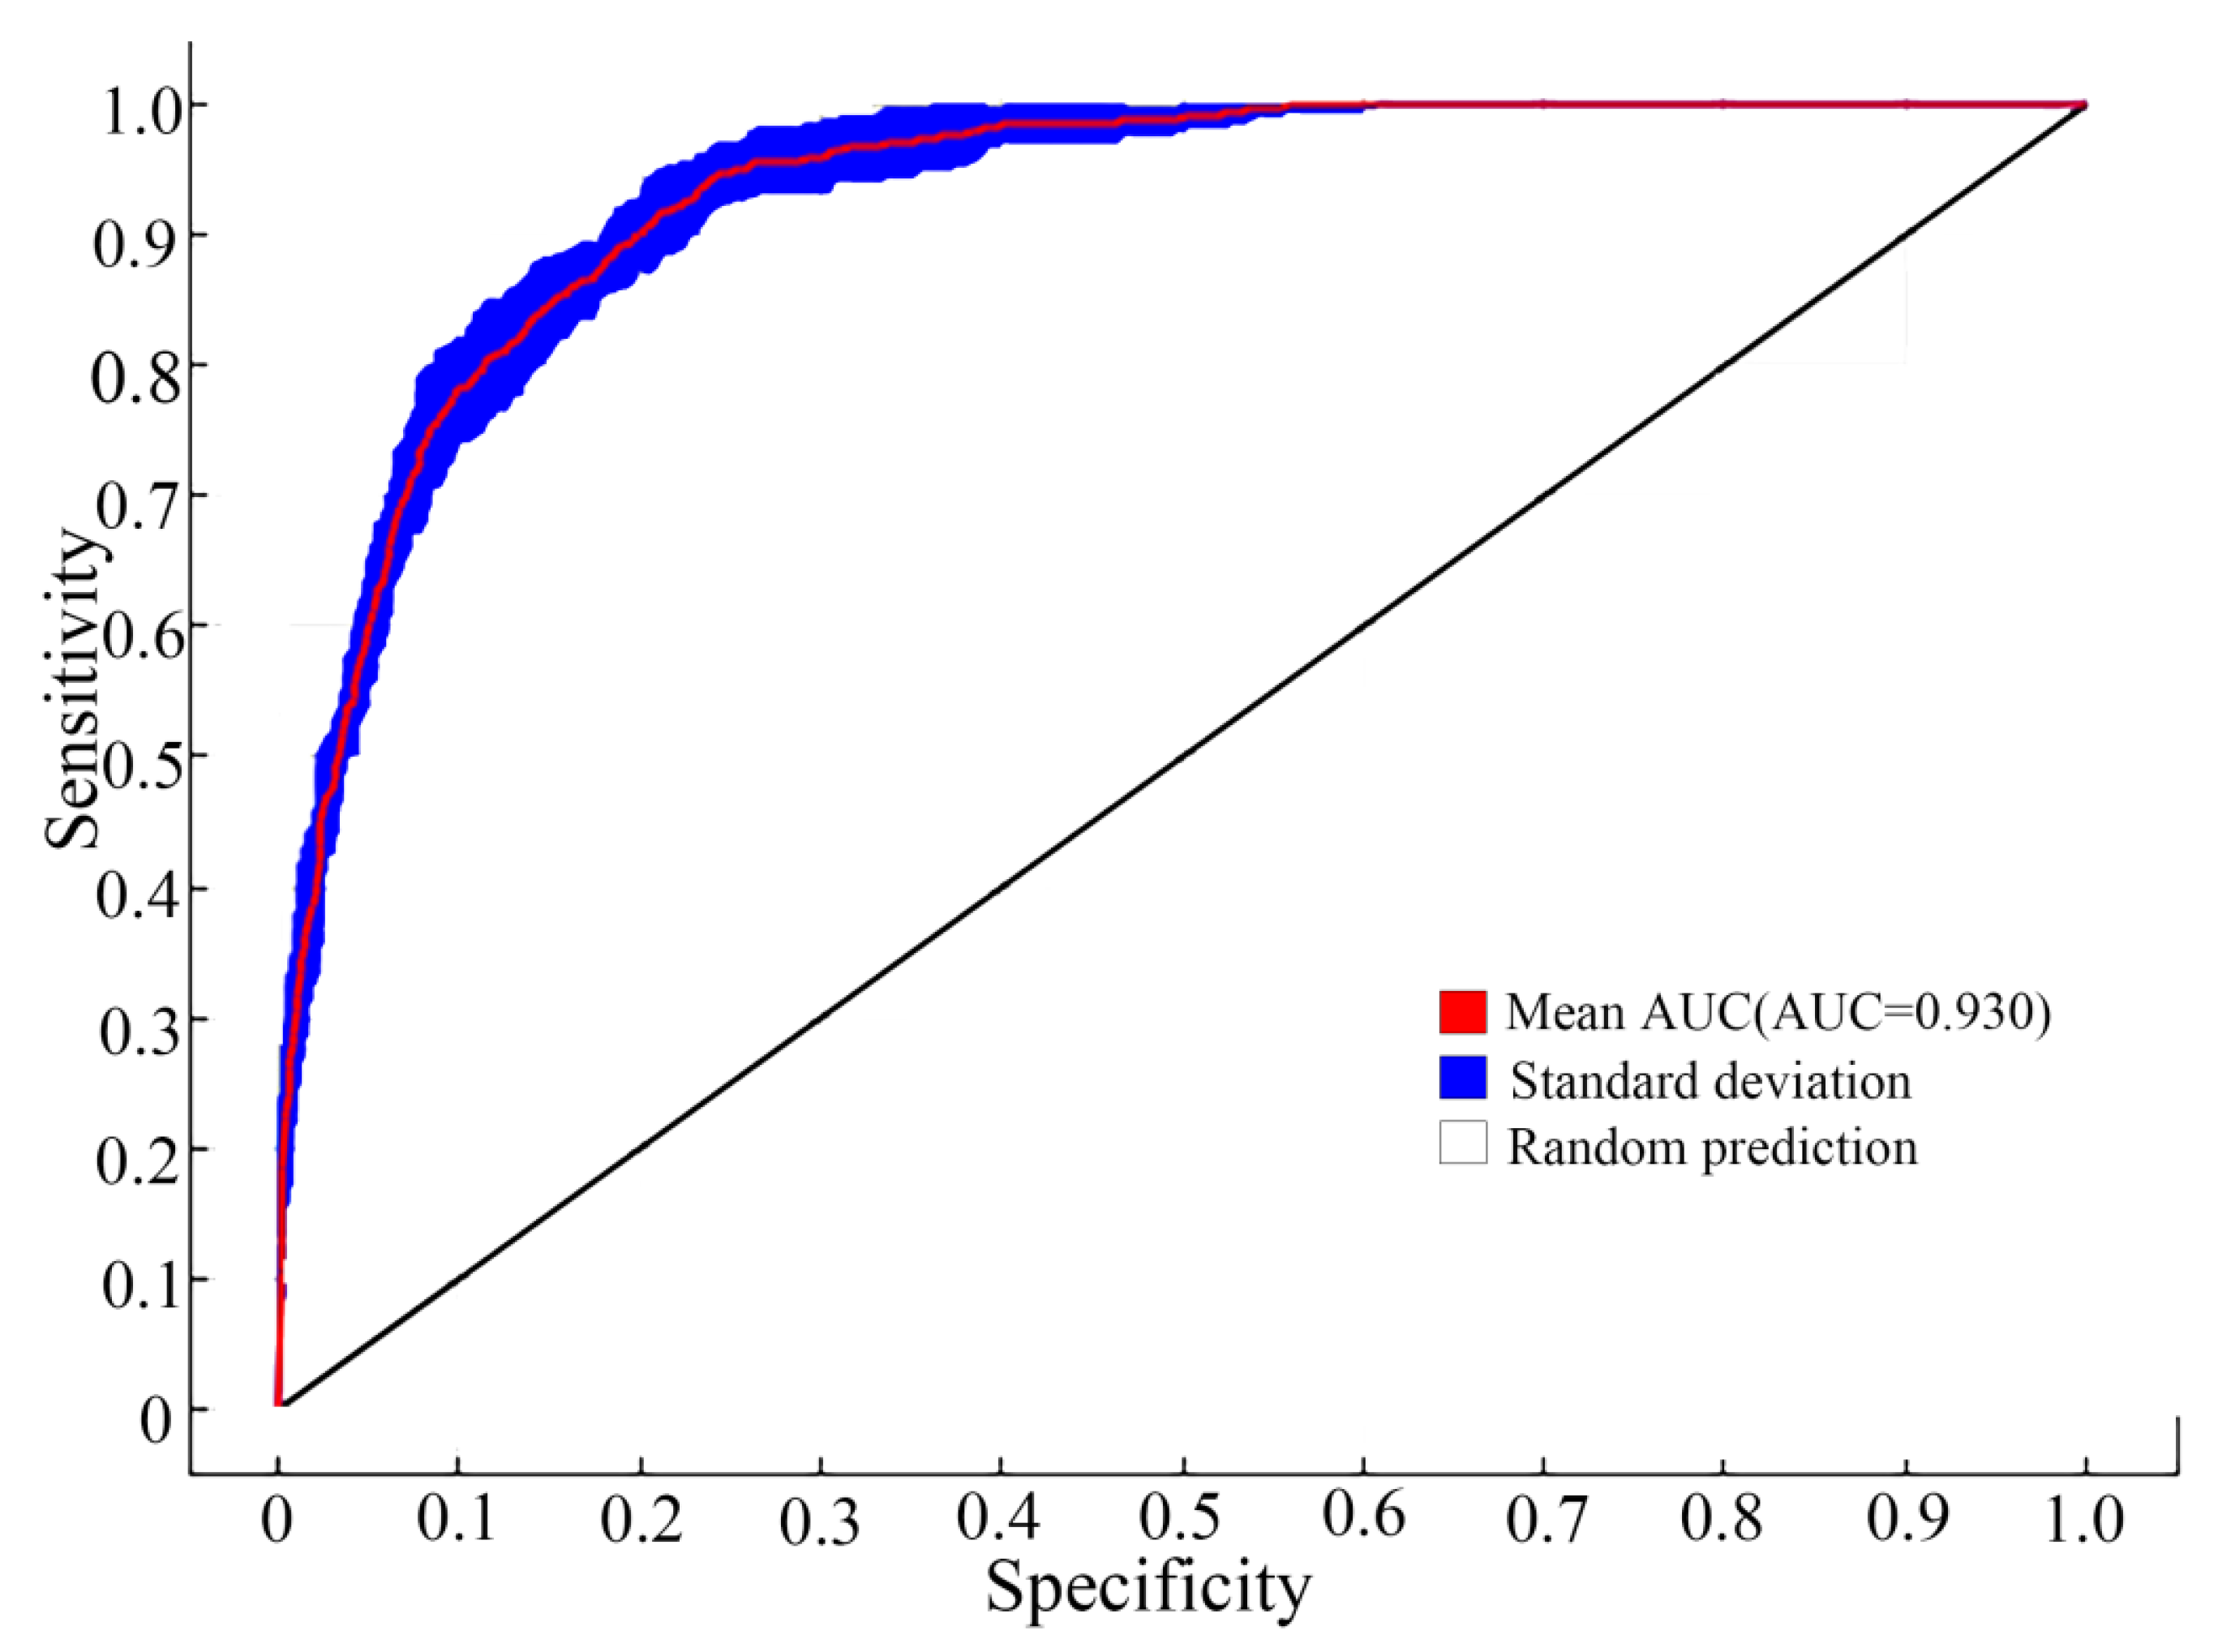
3.2. Evaluation of Model Accuracy

This paper evaluates the results of the maximum entropy model output. The optimal model settings for the ALB, as determined by ENMeval package based on the calculated Akaike Information Criterion corrected (AICc), are the feature classes (FC): linear (L), quadratic (Q), hinge (H), product (P), threshold (T), and the regularization multiplier (RM) equal to 2.0. Through the intuitive analysis of the accuracy image, it can be concluded that the AUC of the receiver operating characteristic curve of the prediction result is 0.930 (unqualified (0.5~0.6), poor (0.6~0.7), medium (0.7~0.8), good (0.8~0.9), and excellent (0.9~1) (Figure 4). In summary, this paper uses MaxEnt to predict the future potential suitable area distribution of ALB. The results are more reliable, and the accuracy of the prediction results is higher.

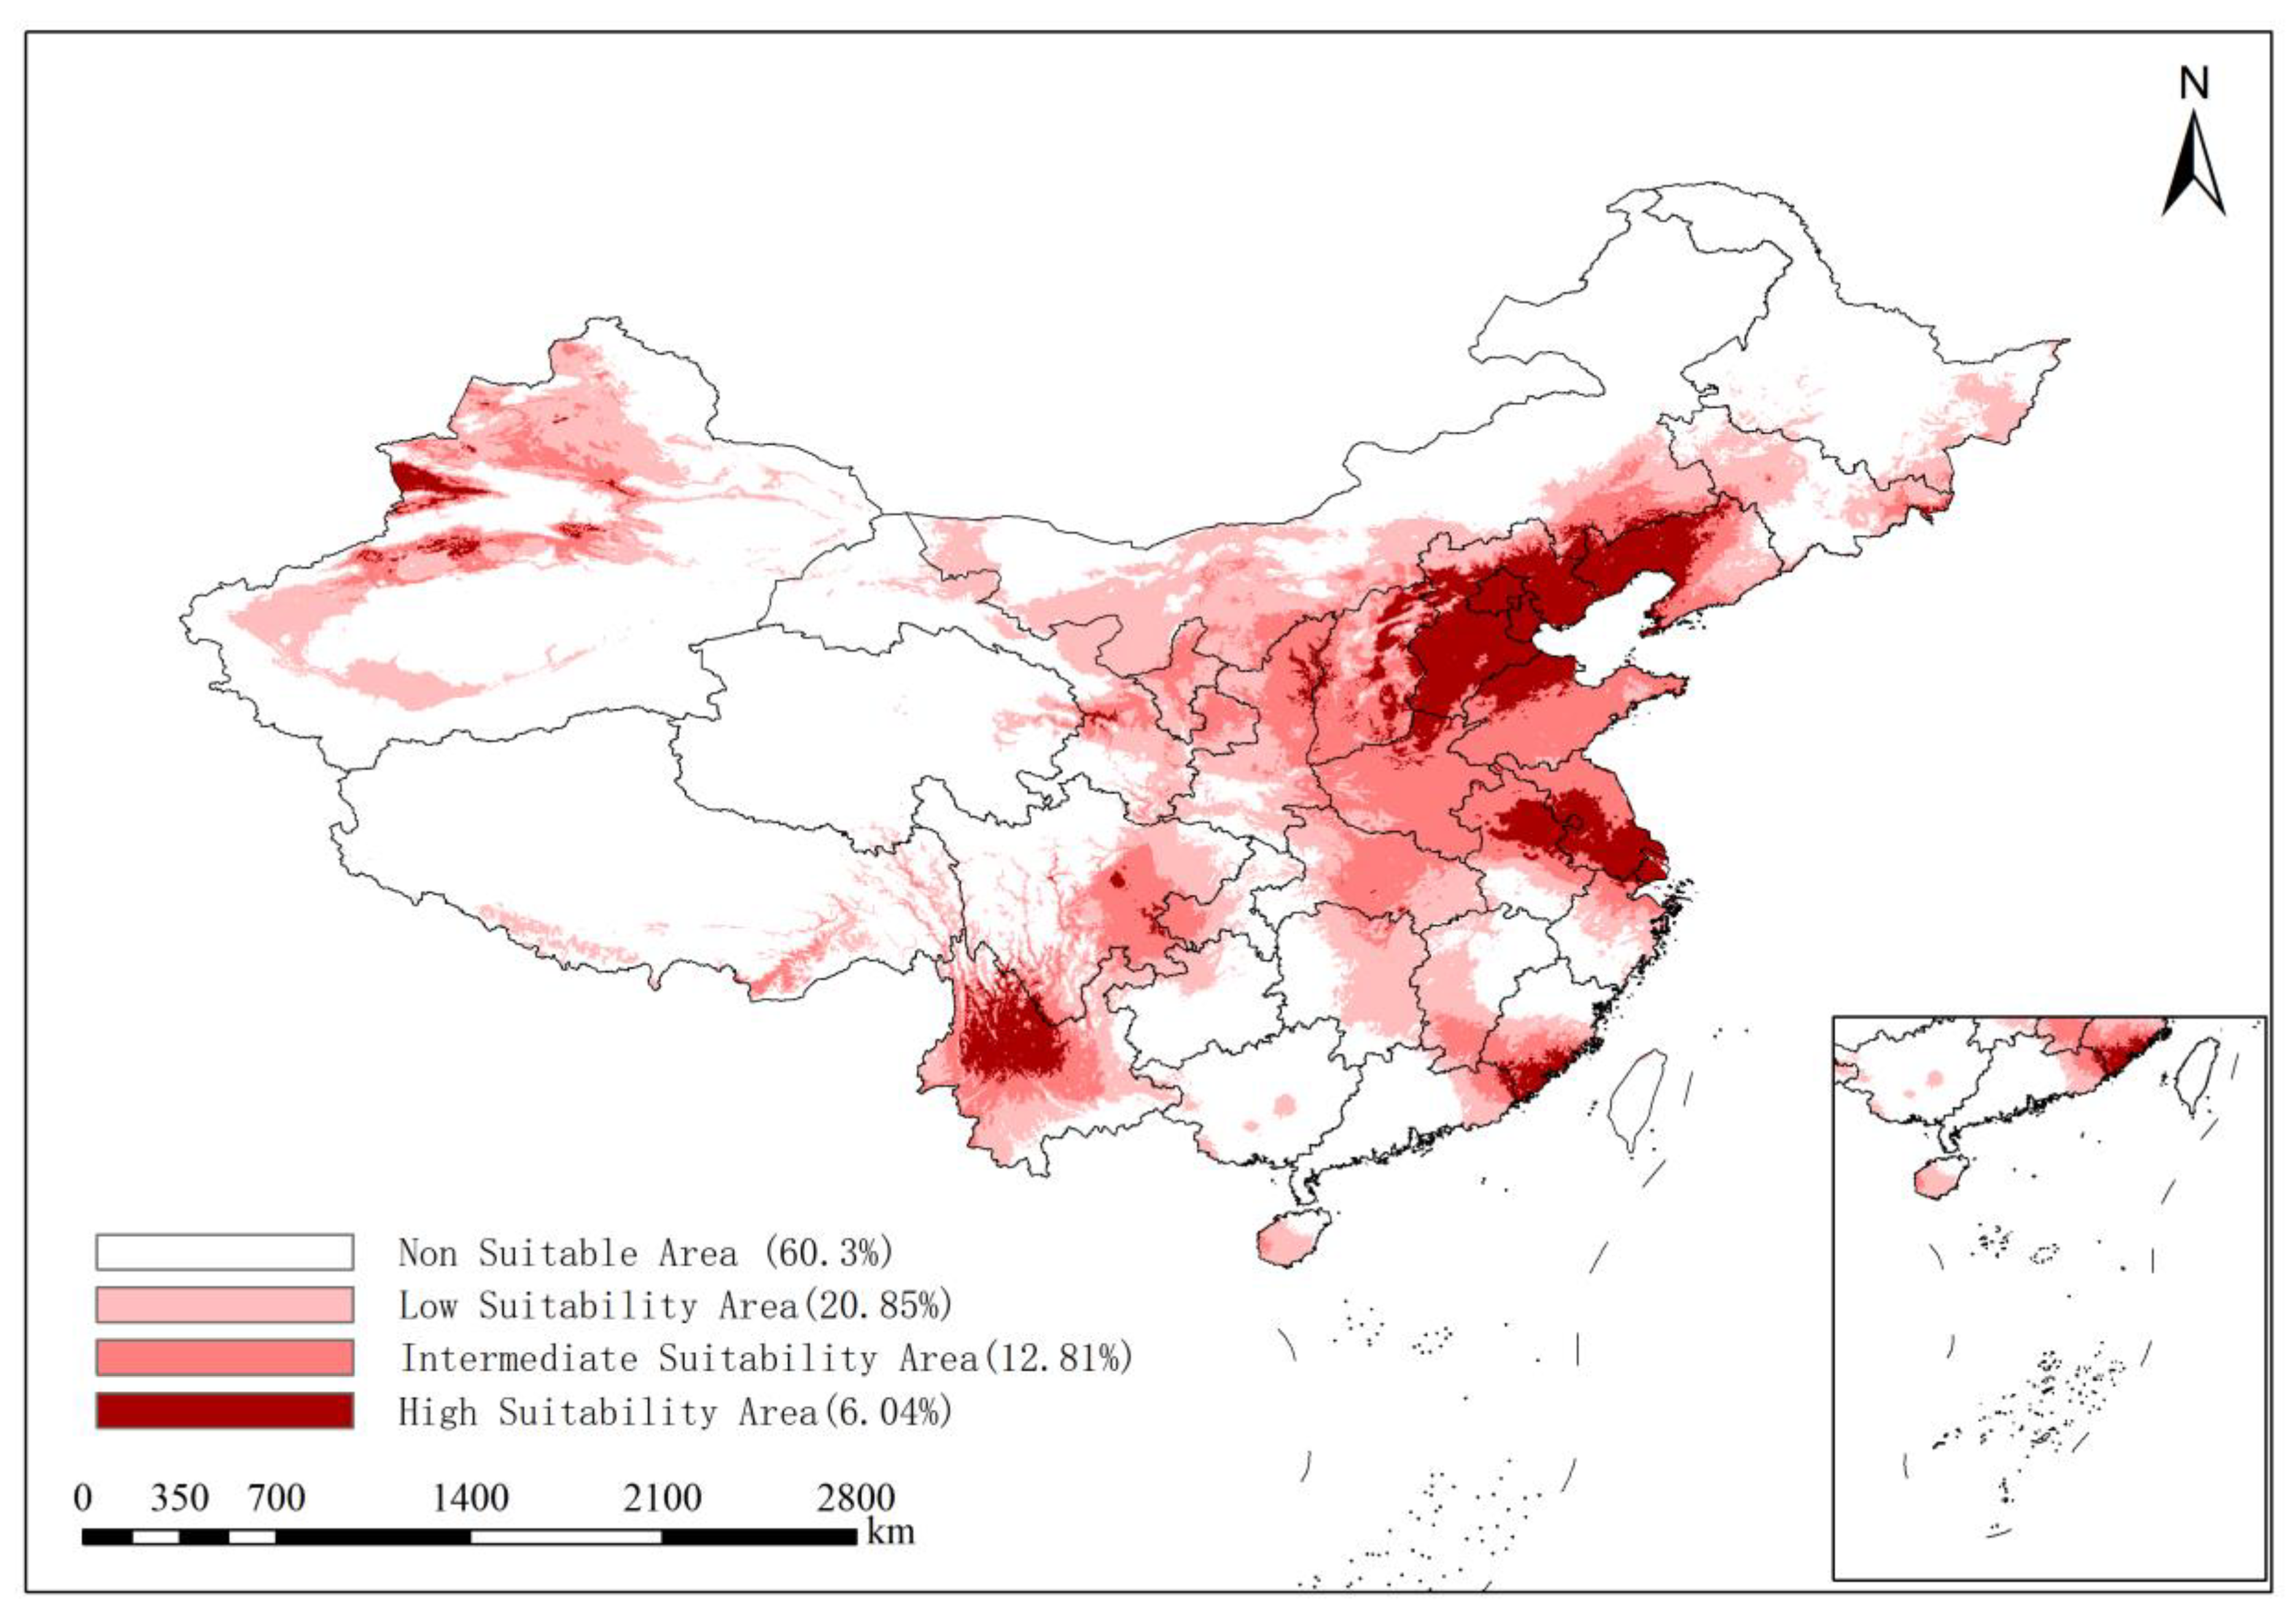
3.3. Prediction of the Distribution of the Suitable Area for ALB in the Present Period

The suitable distribution area of ALB was divided into four grades via the natural discontinuous point classification method. Four grades were expressed by color depth: high-suitability areas (0.54~1), intermediate-suitability areas (0.27~0.54), low-suitability areas (0.09~0.27), and non-suitable areas (0~0.09).
The prediction results revealed that the distribution of ALB is suitable in most areas of China. It is distributed mainly between 20~40° north latitude and 90~130° east longitude. The areas highly suitable for ALB in China are mainly distributed in Beijing–Tianjin–Hebei, Shanghai, Yunnan, and Xinjiang. The intermediate suitability areas are mainly distributed in Central China, North China, and Northeast China, and are also distributed in Southwest China and Northwest China. The low-suitability areas are mainly distributed in South China and Southwest China, and are also distributed in North China, Northeast China, and Northwest China. The non-suitable areas are mainly distributed in Guangxi, Qinghai, and Lhasa, as well as other regions in China (Figure 5).

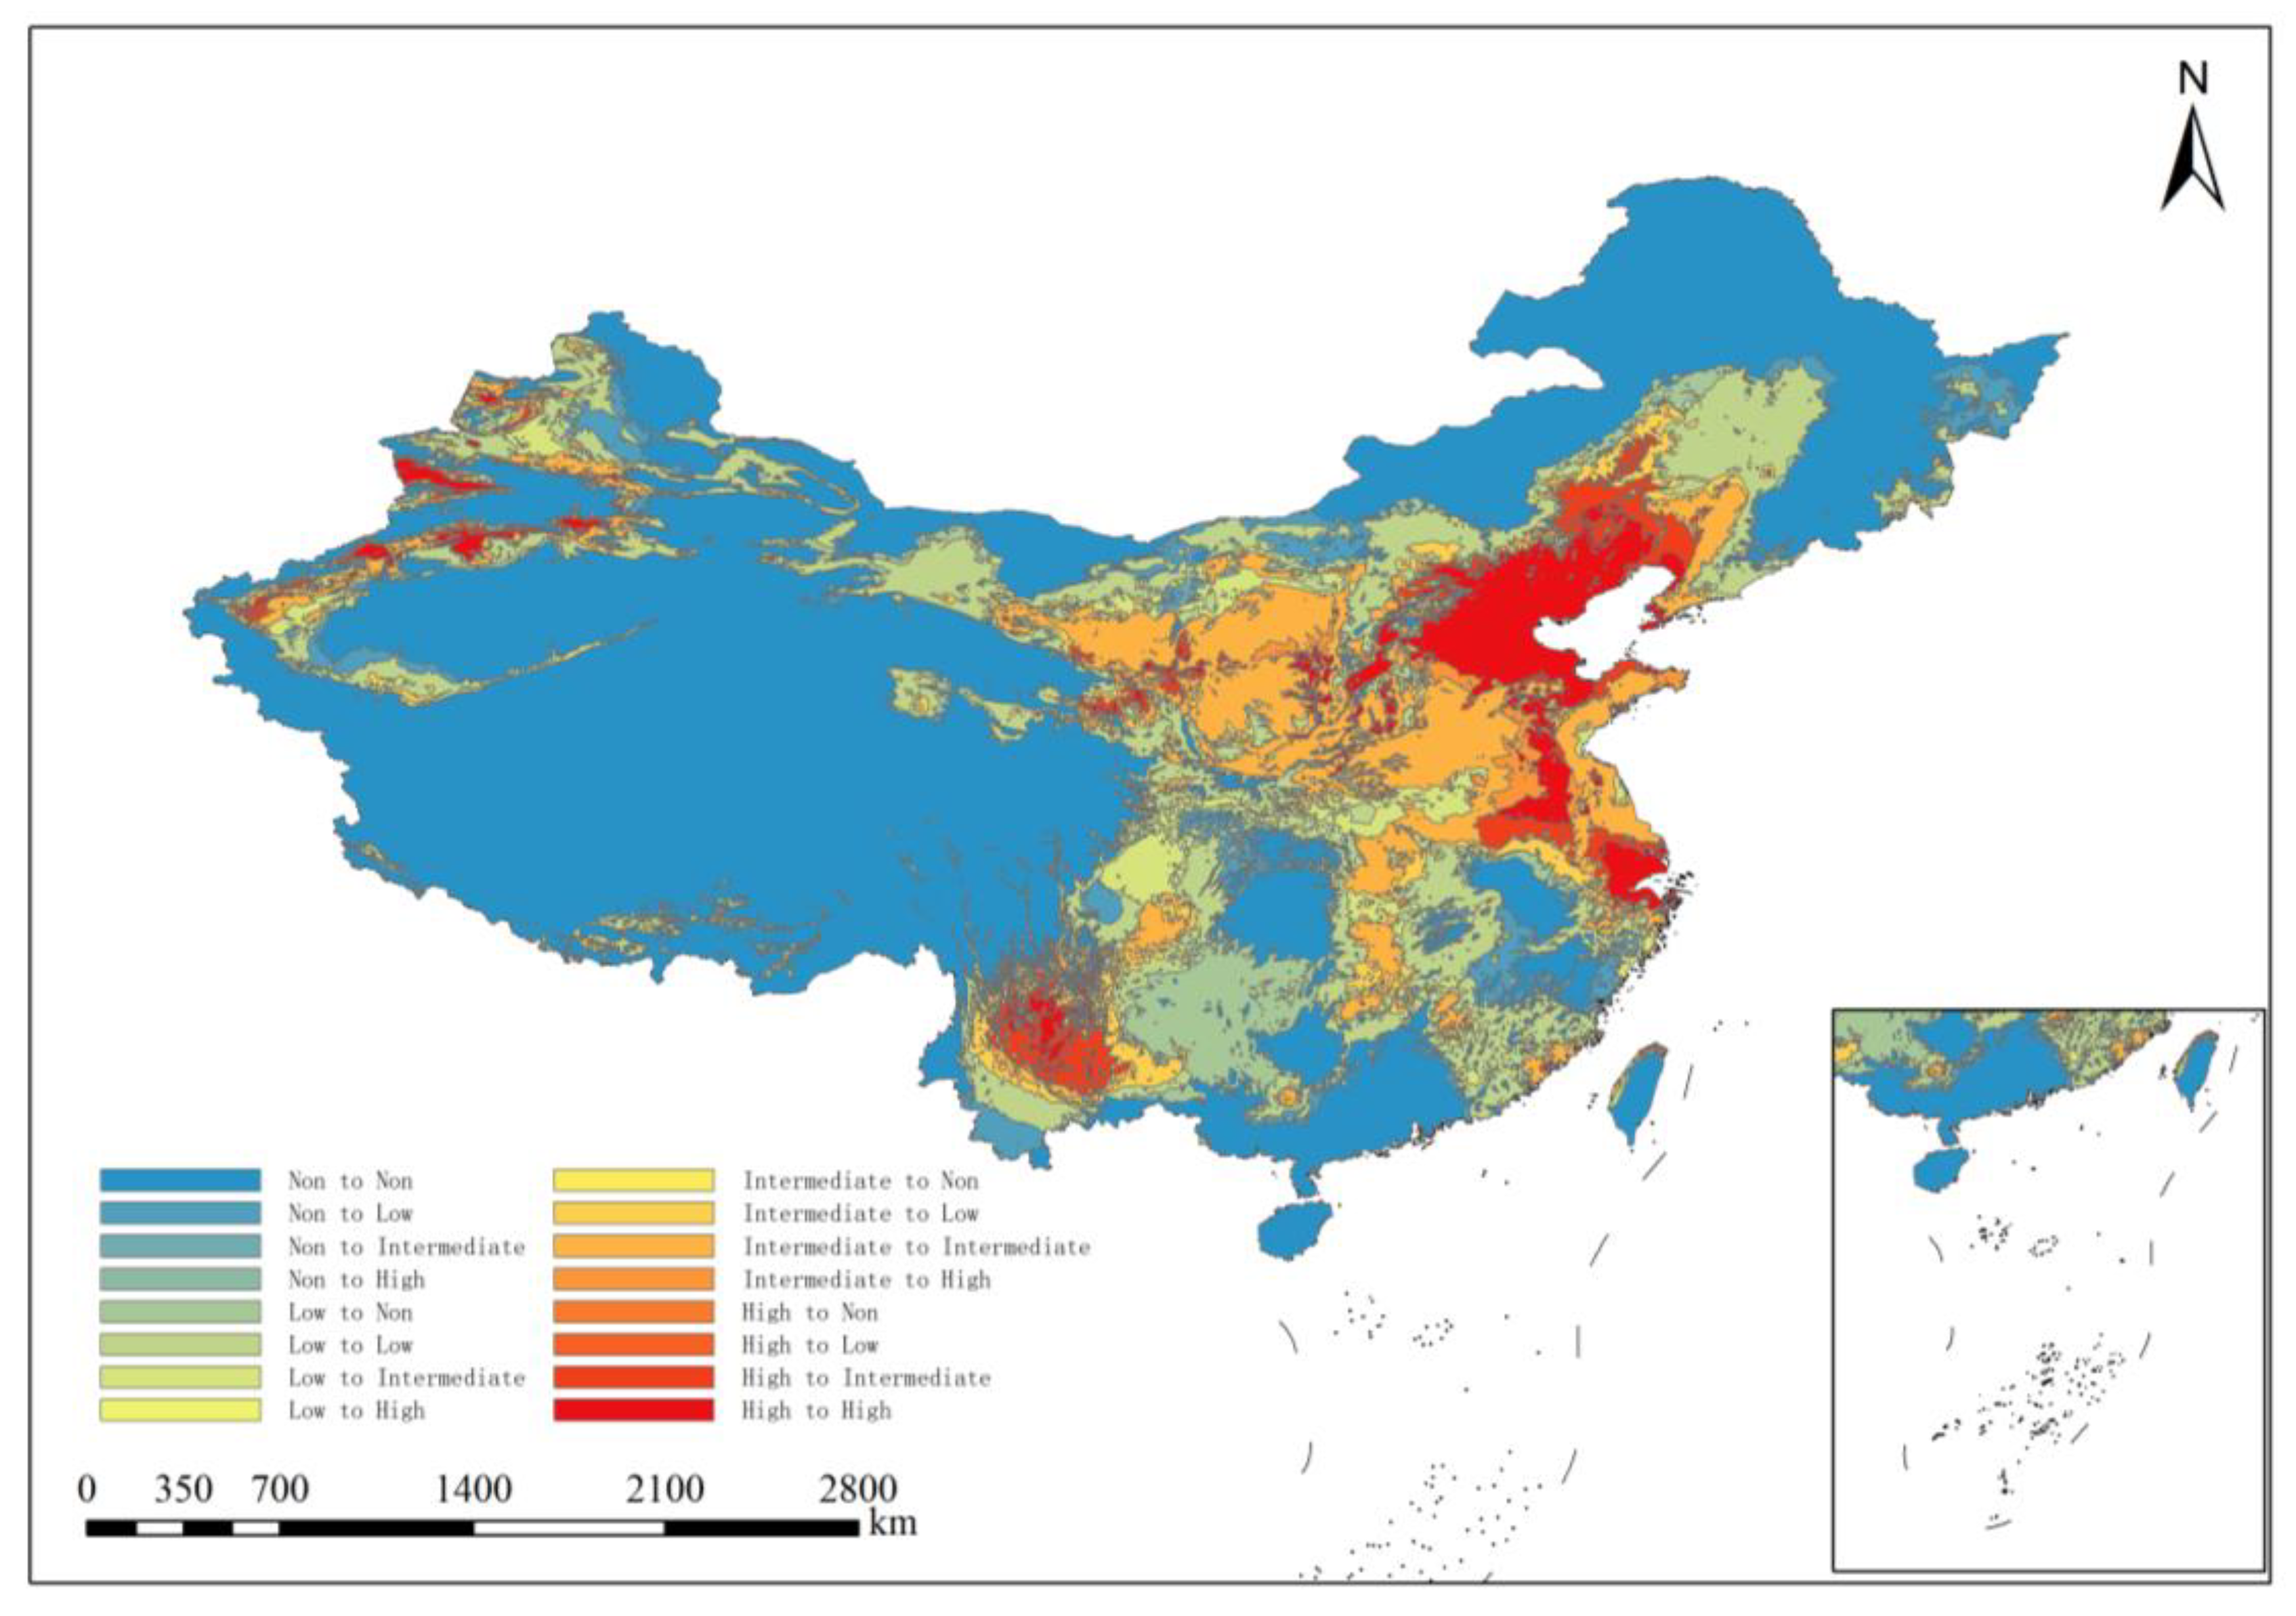
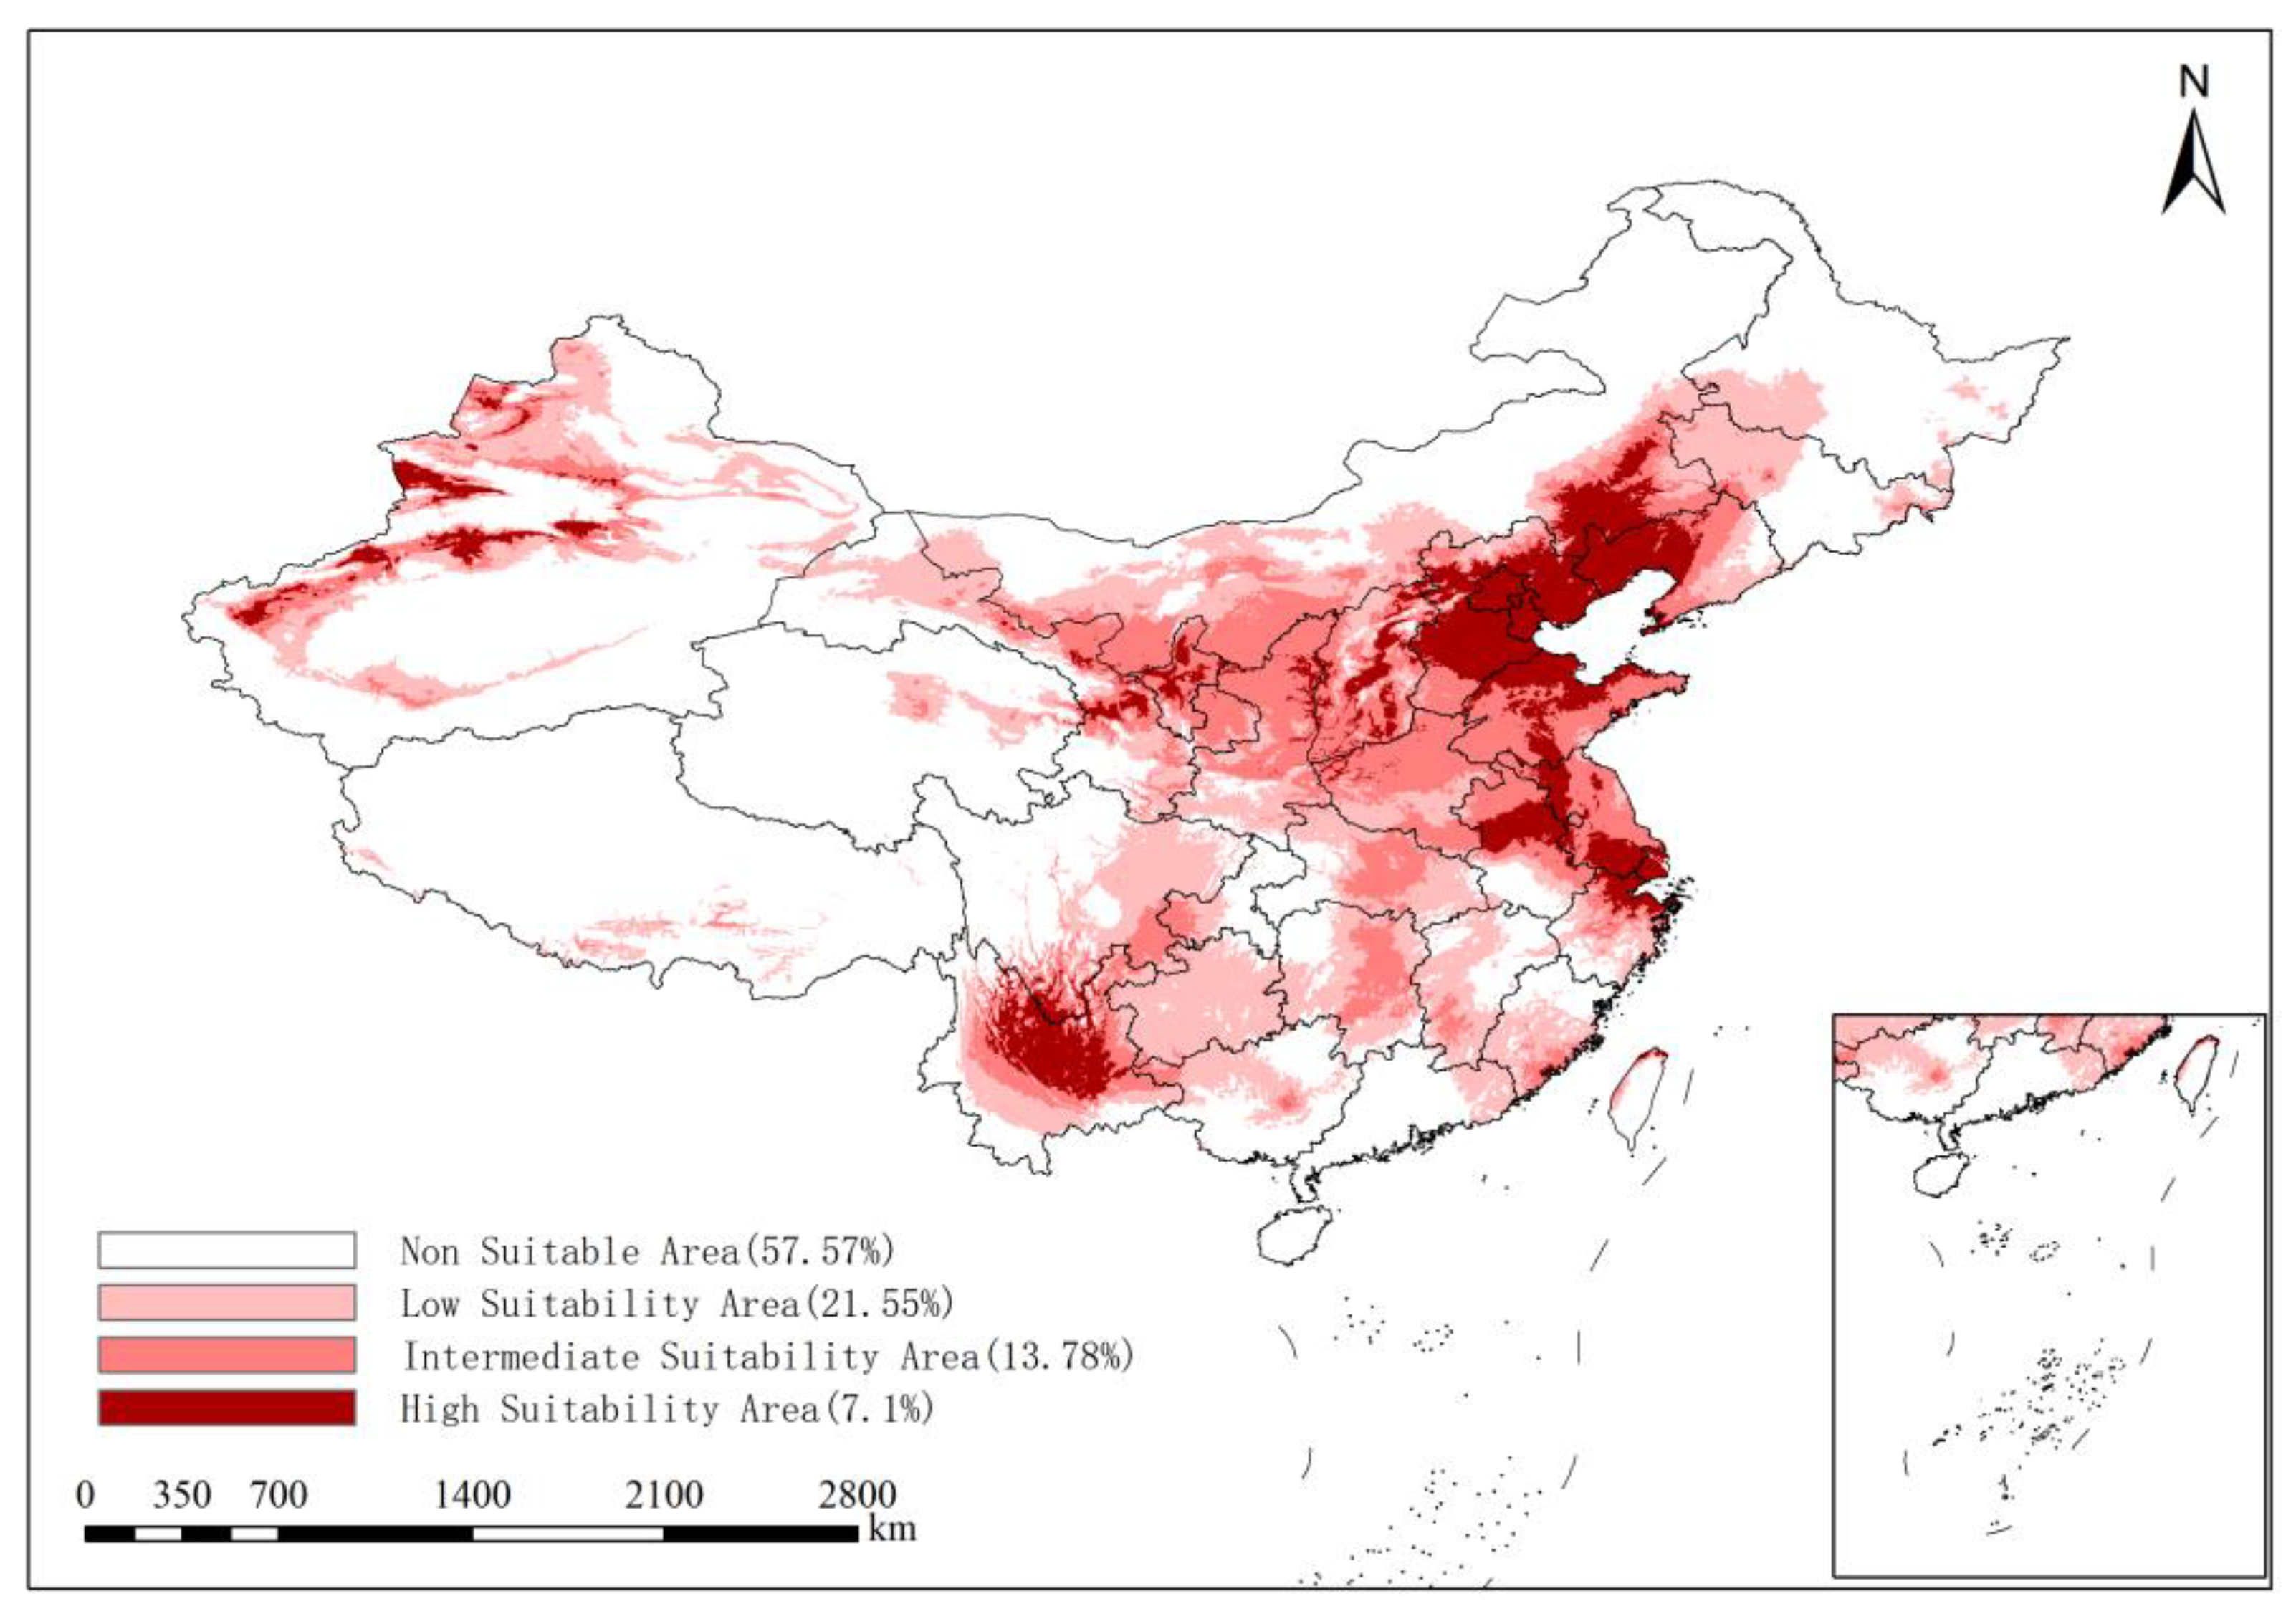
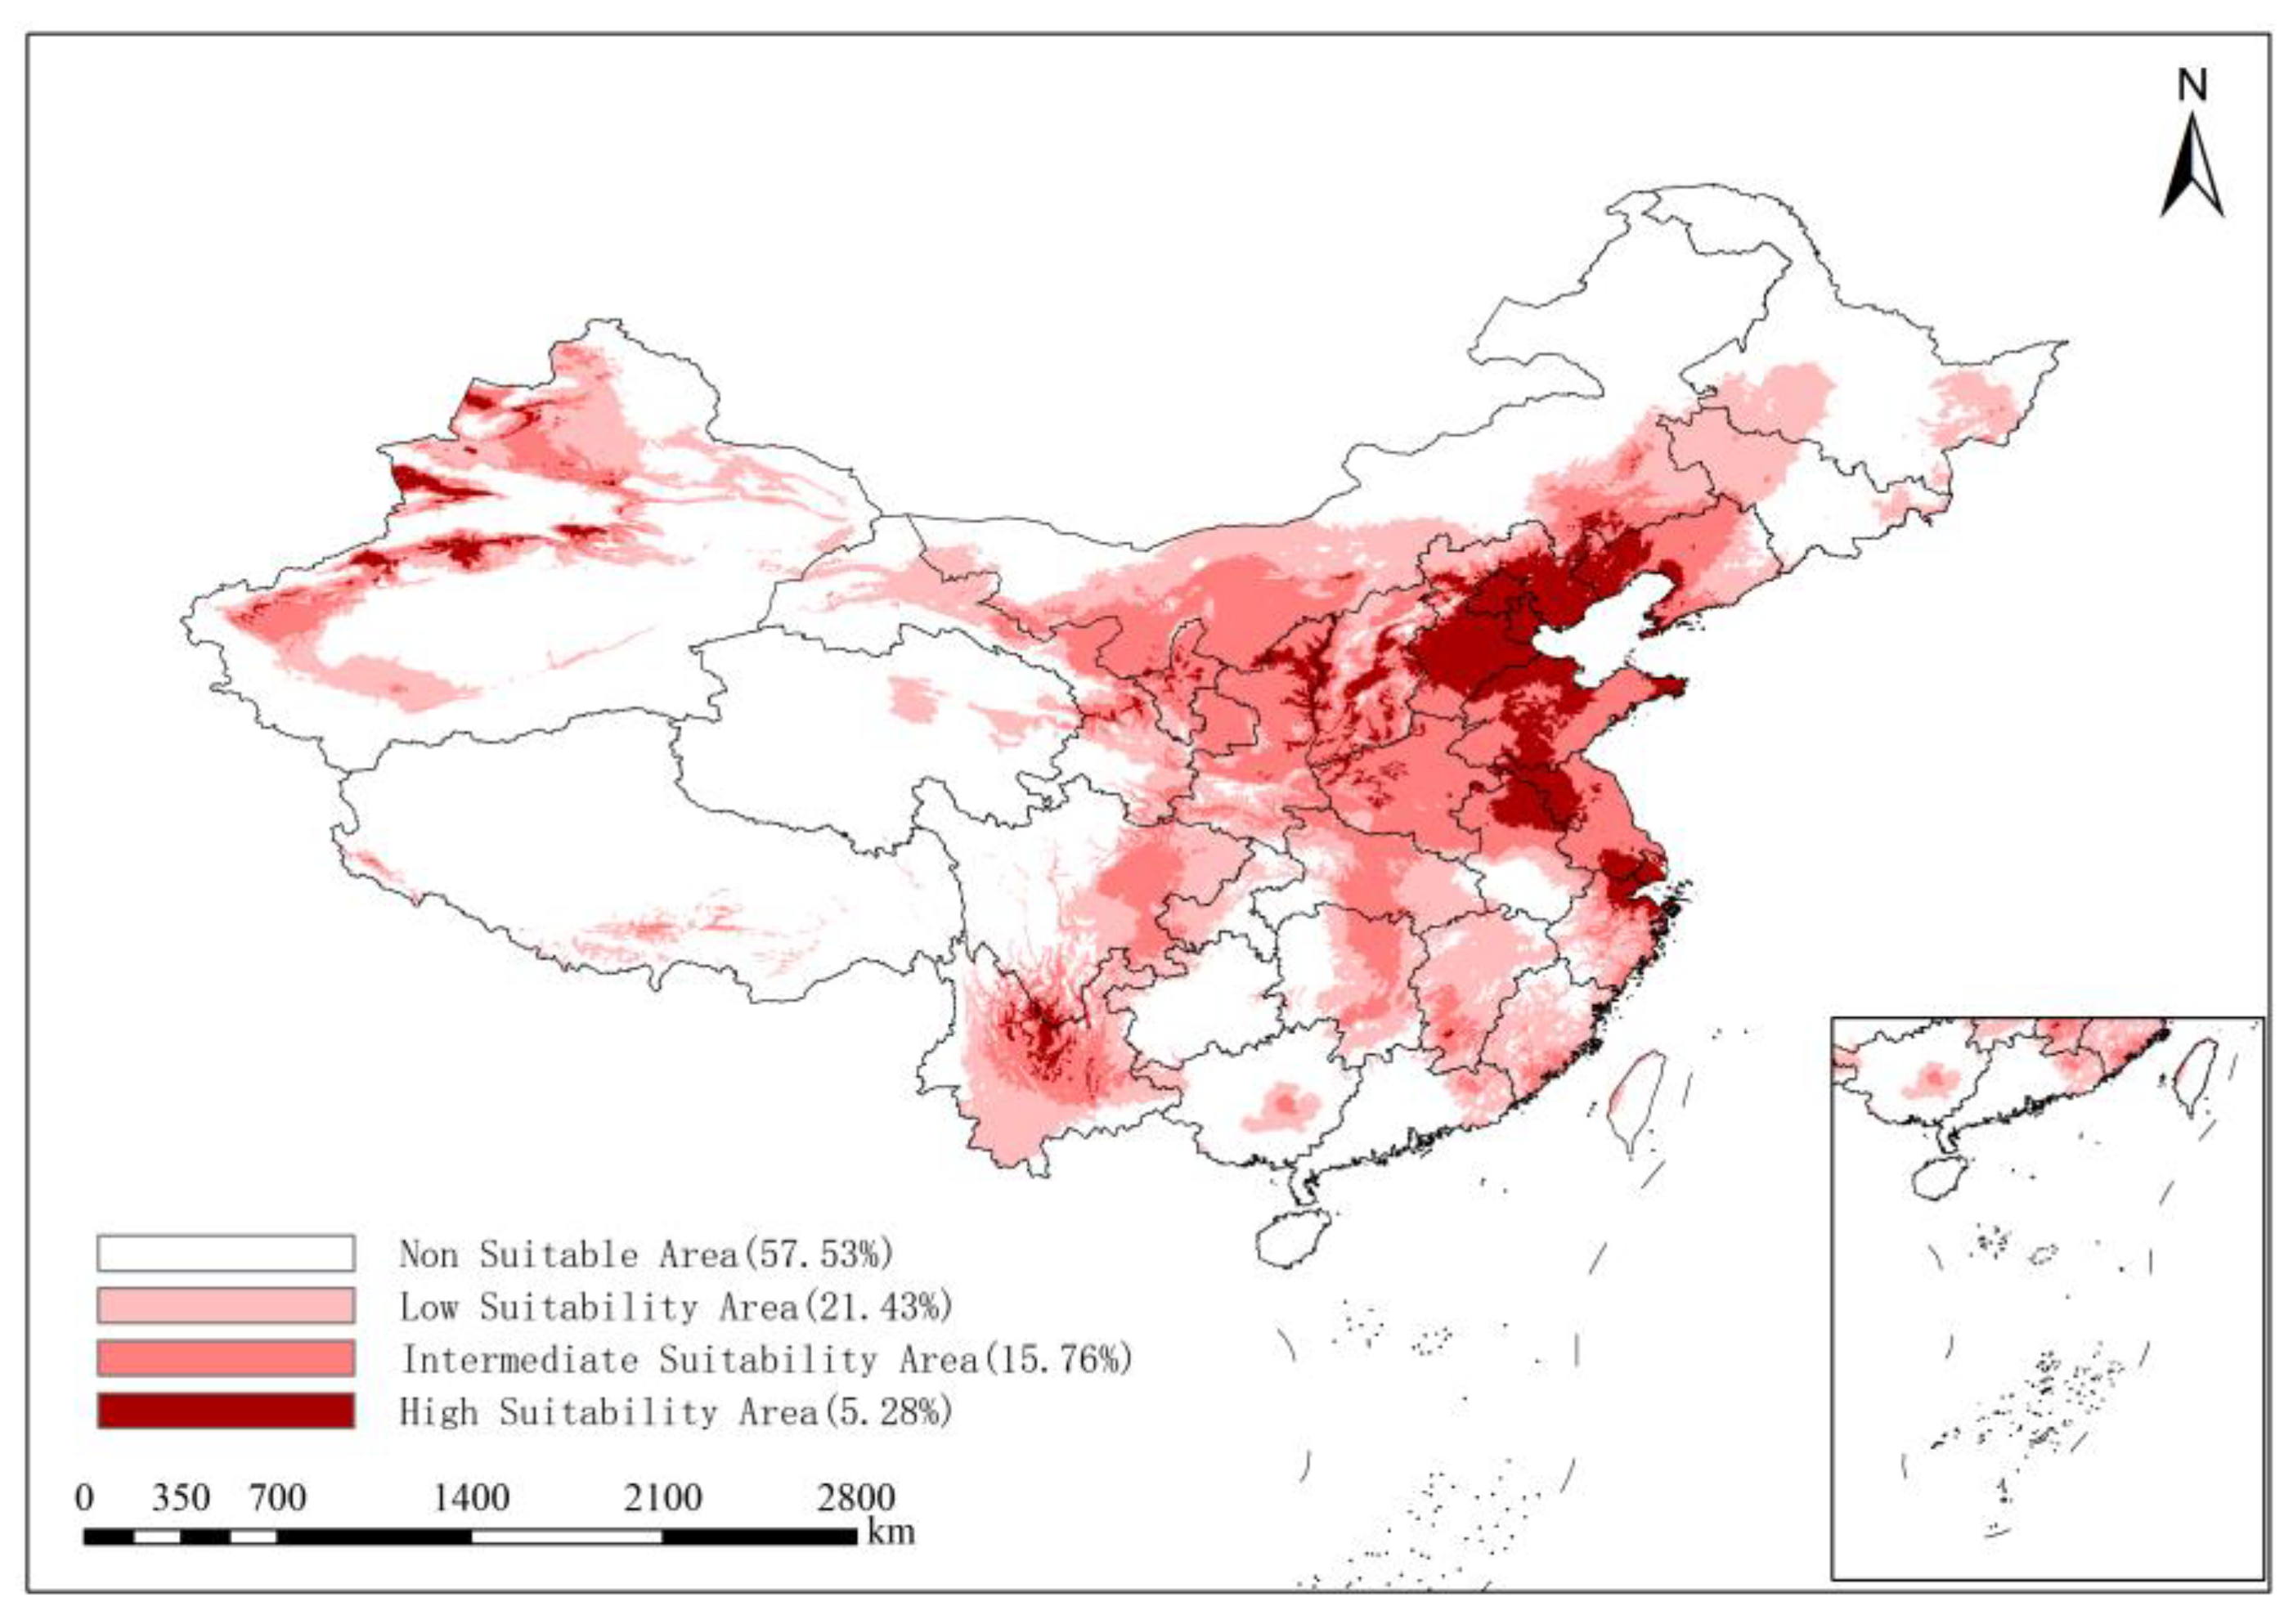
3.4. Future Distribution Changes in ALB in China

On the basis of climate data derived from the Beijing Climate Center Climate System Model (BCC-CSM2-MR) from 2021–2040 and 2041–2060, the future distribution of suitable areas for ALB is predicted under the condition that the future shared economic and social path is SSP245. According to the above criteria for the classification of suitable areas, the prediction results are divided into four grades. Moreover, the change in the proportion of the suitable area of ALB in the land area was also analyzed.
The Markov state transition matrix results for the periods from 2021 to 2040 and from 2021 to 2041–2060 are shown in Table 3 and Table 4, respectively, and indicate the probabilities of future area changes under the SSP245 scenario. Spatial Distribution and Shift of Suitable Habitats for ALB in China are shown in Figure 6 and Figure 7.
In this work, the current distribution of areas suitable for ALB is compared with the future distribution of areas suitable for ALB predicted by using 2021–2040 climatic and biological data (Figure 8) (the higher the grade of suitable areas is, the darker the color). In the future, compared with the present area, the area of high suitability area in the Beijing–Tianjin–Hebei region will expand, whereas the area of high suitability area in southern regions such as Yunnan and Shanghai will decrease, and the area of high suitability area in Bayingol Mongol Autonomous Prefecture, Aksu Prefecture and Ili Kazak Autonomous Prefecture in western Xinjiang will expand and strengthen. In general, the area of suitable regions is expanding.
Moreover, the existing prediction results are compared with the future suitable distribution of ALB predicted via climate biology data from 2041 to 2060 (Figure 9). The area of the high suitability area in the Beijing–Tianjin–Hebei region decreases slightly; the high suitability area in Shanghai transforms into the intermediate suitability area; the area of the suitable area in Xinjiang increases, and the area of the high suitability area increases. In general, the suitable areas increased.
A comparison of the predicted results revealed that the suitable area for ALB in China is currently expanding. The unsuitable areas account for more than 50% of China’s land area. The intermediate suitability area is continuously increasing, while the low and high suitability areas first increase and then decrease (Table 5).

4. Discussion

4.1. Dominant Ecological Factors Affecting the Distribution of A. glabripennis (Asian longhorned Beetle, ALB)

In recent decades, with global warming, the distribution ranges, population dynamics, and reproductive cycles of insects have changed significantly [26]. In this study, the main ecological factors affecting the distribution of potentially suitable areas of ALB were revealed by dominant ecological factor analysis, including the average minimum temperature in September (contribution rate 17.9%), seasonal precipitation (coefficient of variation, contribution rate 14.5%), average precipitation in October (contribution rate 21.3%), and the average maximum temperature in April (contribution rate 17.1%). These factors play a leading role in the growth and distribution of ALB. The average minimum temperature and the average maximum temperature in April and September had an important effect on the growth and development of ALB eggs. Previous studies have shown that the average minimum temperature in September is between 11~23 °C, and the average maximum temperature in April is between 16~26 °C, which may promote the growth and development of ALB eggs [7]. In addition, the adaptive range of precipitation seasonality (coefficient of variation) is 0%–55% or greater than 122%. The precipitation distribution is relatively uniform in areas with a low seasonal variation coefficient of precipitation (0%–55%). This stable precipitation pattern is conducive to the survival and reproduction of ALB. Studies have shown that ALB can better adapt to the environment in areas with relatively stable precipitation distribution, and its distribution range is wider [10]. In the short term, the precipitation pattern with a high coefficient of variation may provide some advantages for ALB. For example, the increase in water content in trees after a rainstorm may temporarily benefit the growth of larvae. The average precipitation in October is 20~100 mm. October is the end of the active month of ALB. If too much precipitation in October leads to high environmental humidity, it may have a negative impact on the growth and development of larvae, which, in turn, affects their survival rate. Therefore, the precipitation in October has an important impact on its suitability [27]. In addition, ALB has strong adaptability to areas below 300 m, which may be related to the fact that low-altitude areas may provide a more suitable climate and host tree species conditions, so it is difficult to spread to high-altitude areas [1]. The results of this study are highly consistent with the existing research. For example, some researchers have pointed out that the temperature change in September may affect the oviposition period of insects in July and August, thus affecting the growth of eggs [28]. This is consistent with the important role of the average minimum temperature in September on the growth and development of ALB eggs in this study. In addition, the seasonality of precipitation has a great influence on the activity times of insects, and precipitation in October directly affects the overwintering survival rate of these insects [29]. This further supports the important role of precipitation seasonality and October precipitation in the distribution of ALB in this study. The findings of this study are of great significance for the management of ALB. By identifying and quantifying the main ecological factors affecting their distribution, the potentially suitable areas can be predicted more accurately. This helps to develop more effective monitoring and control strategies, especially in the context of climate change. For example, understanding the effects of the average minimum temperature in September and the seasonality of precipitation on the distribution of ALB can help predict its potential dispersal range under future climatic conditions. In addition, identifying altitude as an important factor can guide prevention and control measures in high-altitude areas and prevent their further spread. These findings provide a scientific basis for the integrated management of ALB and help to reduce its potential impact on ecosystems and economies.

4.2. Changes in the Potential Distribution Area of ALB Under Future Climate Change

In this study, the Maxent model was used to analyze the change trends of the potential distribution area and suitable area of ALB under specific climate scenarios (SSP245) in the current (1970–2000) and future periods (2021–2040, 2041–2060). Compared to the current distribution area, the suitable area of ALB will gradually migrate to high latitudes in the future. This is mainly due to global warming, which leads to higher temperatures in the southern region [30]. Studies have shown that high temperatures (≥35 °C) can significantly affect the survival and reproduction of ALB, which may limit its distribution in high-temperature areas [7]. The increase in suitable areas may be due to the opening of the northern region to insects, while the warmer areas have not yet reached a high enough temperature to cause population collapse. Then, when the warm areas become unsuitable, the range will shrink [31]. During the period from 1970 to 2000, the proportion of suitable areas for ALB remained relatively stable. From 2021 to 2040, under the SSP245 scenario, compared to those from 1970 to 2000, the proportions of unsuitable areas decreased, and the proportions of low, intermediate, and high suitability areas increased. Among these, the proportion of high-suitability areas increased the most, indicating that suitable living areas improved. From 2041 to 2060, under the SSP245 scenario, the proportion of unsuitable areas decreased slightly, the proportion of low-suitability areas decreased, the proportion of medium-suitability areas increased, and the proportion of high-suitability areas decreased, indicating that the improvement trend of suitable living areas was reversed. With the passage of time, under the SSP245 scenario, the proportion for suitable areas of each grade showed a trend of initial improvement and then deterioration. This may be because some environmental factors are beneficial to the survival of species in the early stages, but with the passage of time, other unfavorable factors, such as agricultural pollution, temperature rise, urbanization, and habitat loss, gradually appear, resulting in a decrease in suitable survival areas [9]. Studies have shown that ALB is mainly affected by temperature and precipitation, and the potentially suitable habitats are mainly concentrated in Central China, South China, East China, Southwest China, and Northwest China [14]. This is consistent with our findings. However, the MaxEnt model in this study assumes that the species distribution and climate are in equilibrium; however, the invasive characteristics of ALB (such as the jump diffusion driven by the timber trade) may cause its actual distribution to lag behind climate potential. For example, the model predicts that the suitable areas of H. cunea (Drury, 1773) in China have not been covered by actual observation records, which may reflect areas where climatic conditions permit but have not yet been invaded [32].
This study revealed the potential suitable distribution areas of ALB in different regions of China and found that its suitable area increased with climate change, suggesting that we need to formulate differentiated monitoring and prevention and control strategies according to regional characteristics and strengthen dynamic monitoring, comprehensive prevention and control, and cross-regional cooperation to effectively respond to the spread risk of ALB and protect the ecological environment and economic interests. Even if the prediction results of the maximum entropy model selected in this paper are more accurate, the method still has some limitations. The research on suitable areas for ALB should not only stay in the influence level of bioclimatic data but also take into account the characteristics of the region, such as the tree species growing in the region, human activities, and so on. Future research will combine high-resolution host distribution data, dynamic forest models, and cross-regional cooperation to deepen pest diffusion risk assessment and economic impact analysis.

5. Conclusions

This study revealed that potentially suitable areas for ALB are distributed in North China, East China, Central China, South China, Southwest China, and Northwest China. The novelty is that it predicts a distribution in northwest and southwest China. In North China and East China, the Beijing–Tianjin–Hebei region and Shanghai are more suitable areas for ALB. Xinjiang in Northwest China is a more suitable area for ALB, and Yunnan is a more suitable area for ALB in Southwest China. Moreover, the results of this study revealed that the suitable area for ALB in China increased with climate change over time, and the area changes in suitable areas of different grades differed. These findings can provide a reference for the prevention and control of ALB in China. In the prevention and control of ALB in the future, targeted prevention and control can be carried out according to different levels of suitable areas to reduce the harm caused by ALB to trees and shelter forests.

Supplementary Materials

The following supporting information can be downloaded at: https://www.mdpi.com/article/10.3390/f16081239/s1, Table S1. Original data of Anoplophora glabripennis occurrence points. Table S2. Maxent Parameter Optimization. Table S3. Markov Analysis. Table S4. Autocorrelation Analysis.

Author Contributions

K.T. and M.Z.: Conceptualization, writing—original draft, and methodology. C.T.: Validation, writing—review and editing, and funding acquisition. N.D.: Formal analysis and funding acquisition. H.H.: Validation and visualization. All authors have read and agreed to the published version of the manuscript.

Funding

This work was supported by the Major Scientific and Technological Research Project of Xinjiang Production and Construction Corps (2021AB015) and Division-City Science and Technology Key Project (2024GG1501).

Data Availability Statement

The original contributions presented in the study are included in the article and Supplementary Materials; further inquiries can be directed to the corresponding authors.

Acknowledgments

We wish to express our gratitude to all the authors of this study, all of whom provided useful feedback on our manuscript.

Conflicts of Interest

The authors declare no conflicts of interest.

References

  1. Hu, J.; Angeli, S.; Schuetz, S.; Luo, Y.; Hajek, A.E. Ecology and management of exotic and endemic Asian longhorned beetle Anoplophora glabripennis. Agric. For. Entomol. 2009, 11, 359–375. [Google Scholar] [CrossRef]
  2. Yasui, H.; Fujiwara-Tsujii, N.; Kugimiya, S.; Shibuya, K.; Mishiro, K.; Uechi, N. Anoplophora glabripennis, an invasive longhorned beetle, has the potential to damage fruit trees in Japan. Sci. Rep. 2024, 14, 12708. [Google Scholar] [CrossRef] [PubMed]
  3. Haeussermann, I.; Hasselmann, M. Complex European invasion history of Anoplophora glabripennis (Motschulsky): New insights in its population genomic differentiation using genotype-by-sequencing. Sci. Rep. 2024, 14, 4263. [Google Scholar] [CrossRef] [PubMed]
  4. European Food Safety Authority; Tramontini, S.; Antoniou, A.; Gilioli, G.; Krusteva, R.; Sabbatini, P.G.; Rzepecka, D.; Scala, M.; Sánchez, B.; Nougadère, A.V.S. Anoplophora glabripennis—Pest Report to support the ranking of EU candidate priority pests. EFSA Support. Publ. 2025, 22, 9446E. [Google Scholar]
  5. Dhandapani, R.K.; Gurusamy, D.; Duan, J.; Palli, S.R. RNAi for management of Asian long-horned beetle, Anoplophora glabripennis: Identification of target genes. J. Pest Sci. 2020, 93, 823–832. [Google Scholar] [CrossRef]
  6. Byeon, D.-h.; Kim, S.-H.; Jung, J.-M.; Jung, S.; Kim, K.-H.; Lee, W.-H. Climate-based ensemble modelling to evaluate the global distribution of Anoplophora glabripennis (Motschulsky). Agric. For. Entomol. 2021, 23, 569–583. [Google Scholar] [CrossRef]
  7. Zhang, Q.-C.; Wang, J.-G.; Lei, Y.-H. Predicting distribution of the Asian longhorned beetle, Anoplophora glabripennis (Coleoptera: Cerambycidae) and its natural enemies in China. Insects 2022, 13, 687. [Google Scholar] [CrossRef] [PubMed]
  8. Wang, L.; Li, C.; Luo, Y.; Wang, G.; Dou, Z.; Haq, I.U.; Shang, S.; Cui, M. Current and future control of the wood-boring pest Anoplophora glabripennis. Insect Sci. 2023, 30, 1534–1551. [Google Scholar] [CrossRef] [PubMed]
  9. Boyle, M.J.W.; Bonebrake, T.C.; da Silva, K.D.; Dongmo, M.A.K.; França, F.M.; Gregory, N.; Kitching, R.L.; Ledger, M.J.; Lewis, O.T.; Sharp, A.C.; et al. Causes and consequences of insect decline in tropical forests. Nat. Rev. Biodivers. 2025, 1, 315–331. [Google Scholar] [CrossRef]
  10. Huang, J.; Lu, X.; Liu, H.; Zong, S. The driving forces of Anoplophora glabripennis have spatial spillover effects. Forests 2021, 12, 1678. [Google Scholar] [CrossRef]
  11. Zhou, Y.; Ge, X.; Zou, Y.; Guo, S.; Wang, T.; Zong, S. Prediction of the potential global distribution of the Asian longhorned beetle Anoplophora glabripennis (Coleoptera: Cerambycidae) under climate change. Agric. For. Entomol. 2021, 23, 557–568. [Google Scholar] [CrossRef]
  12. Zhang, L.; Wang, P.; Xie, G.; Wang, W. Impacts of climate change conditions on the potential distribution of Anoplophora glabripennis and its host plants, Salix babylonica and Salix matsudana, in China. Ecol. Evol. 2024, 14, e70692. [Google Scholar] [CrossRef] [PubMed]
  13. Lai, J.; Fan, M.; Liu, Y.; Huang, P.; Gaisberger, H.; Li, C.; Zheng, Y.; Lin, F. Habitat suitability modeling of a nearly extinct rosewood species (Dalbergia odorifera) under current, and future climate conditions. J. For. Res. 2025, 36, 58. [Google Scholar] [CrossRef]
  14. Yong, D.; Xu, D.; Deng, X.; He, Z.; Zhuo, Z. Potential distribution of Anoplophora horsfieldii Hope in China based on MaxEnt and its response to climate change. Insects 2025, 16, 484. [Google Scholar] [CrossRef] [PubMed]
  15. Wang, Z.; Zhuo, Z.; Ali, H.; Mureed, S.; Liu, Q.; Yang, X.; Xu, D. Predicting potential habitat distribution of the invasive species Rhynchophorus ferrugineus Olivier in China based on MaxEnt modelling technique and future climate change. Bull. Entomol. Res. 2024, 114, 524–533. [Google Scholar] [CrossRef] [PubMed]
  16. Wang, Z.; Xu, D.; Liao, W.; Xu, Y.; Zhuo, Z. Predicting the current and future distributions of Frankliniella occidentalis (Pergande) based on the MaxEnt species distribution model. Insects 2023, 14, 458. [Google Scholar] [CrossRef] [PubMed]
  17. Kim, S.Y.; Lim, C.; Kang, J.H.; Bae, Y.J. The effect of climate change on indicator wetland insects: Predicting the current and future distribution of two giant water bugs (Hemiptera: Belostomatidae) in South Korea. Insects 2024, 15, 820. [Google Scholar] [CrossRef] [PubMed]
  18. Pagad, S.; Bisset, S.; Genovesi, P.; Groom, Q.; Hirsch, T.; Jetz, W.; Ranipeta, A.; Schigel, D.; Sica, Y.V.; McGeoch, M.A. Country compendium of the global register of introduced and invasive species. Sci. Data 2022, 9, 391. [Google Scholar] [CrossRef] [PubMed]
  19. Shao, P.; Luo, J.; Zhang, R.; Liu, J.; Cao, D.; Su, Z.; Wei, J. Methyl jasmonate enhances the resistance of Populus alba var. pyramidalis against Anoplophora glabripennis (Coleoptera: Cerambycidae). Insects 2025, 16, 153. [Google Scholar] [PubMed]
  20. Hijmans, R.J.; Cameron, S.E.; Parra, J.L.; Jones, P.G.; Jarvis, A. Very high resolution interpolated climate surfaces for global land areas. Int. J. Climatol. 2005, 25, 1965–1978. [Google Scholar] [CrossRef]
  21. Marchi, M.; Sinjur, I.; Bozzano, M.; Westergren, M. Evaluating WorldClim version 1 (1961–1990) as the baseline for sustainable use of forest and environmental resources in a changing climate. Sustainability 2019, 11, 3043. [Google Scholar] [CrossRef]
  22. Akhtar, N.; Alharthi, M.F. Enhancing accuracy in modeling highly multicollinear data using alternative shrinkage parameters for ridge regression methods. Sci. Rep. 2025, 15, 10774. [Google Scholar] [CrossRef] [PubMed]
  23. Shen, S.; Zheng, F.; Zhang, W.; Xu, G.; Li, D.; Yang, S.; Jin, G.; Clements, D.R.; Nikkel, E.; Chen, A.; et al. Potential distribution and ecological impacts of Acmella radicans (Jacquin) R.K. Jansen (a new Yunnan invasive species record) in China. BMC Plant Biol. 2024, 24, 494. [Google Scholar] [CrossRef] [PubMed]
  24. Pulighe, G.; Lupia, F.; Manente, V. Climate-driven invasion risks of Japanese beetle (Popillia japonica Newman) in Europe predicted through species distribution modelling. Agriculture 2025, 15, 684. [Google Scholar] [CrossRef]
  25. Wu, J.; Wei, X.; Wang, Z.; Peng, Y.; Liu, B.; Zhuo, Z. Mapping the distribution of curculio davidi Fairmaire 1878 under climate change via geographical data and the MaxEnt model (CMIP6). Insects 2024, 15, 583. [Google Scholar] [CrossRef] [PubMed]
  26. Peng, Y.; Yang, J.; Xu, D.; Zhuo, Z. Global distribution prediction of Cyrtotrachelus buqueti guer (Coleoptera: Curculionidae) insights from the optimised MaxEnt model. Insects 2024, 15, 708. [Google Scholar] [CrossRef] [PubMed]
  27. John, A.; Riat, A.K.; Bhat, K.A.; Ganie, S.A.; endarto, O.; Nugroho, C.; Handoko, H.; Wani, A.K. Adapting to climate extremes: Implications for insect populations and sustainable solutions. J. Nat. Conserv. 2024, 79, 126602. [Google Scholar] [CrossRef]
  28. Keena, M.A.; Moore, P.M. Effects of temperature on Anoplophora glabripennis (Coleoptera: Cerambycidae) larvae and pupae. Environ. Entomol. 2010, 39, 1323–1335. [Google Scholar] [CrossRef] [PubMed]
  29. Wen, X.; Fang, G.; Chai, S.; He, C.; Sun, S.; Zhao, G.; Lin, X. Can ecological niche models be used to accurately predict the distribution of invasive insects? A case study of Hyphantria cunea in China. Ecol. Evol. 2024, 14, e11159. [Google Scholar] [CrossRef] [PubMed]
  30. Sun, C.; Jiang, Z.; Li, W.; Hou, Q.; Li, L. Changes in extreme temperature over China when global warming stabilized at 1.5 °C and 2.0 °C. Sci. Rep. 2019, 9, 14982. [Google Scholar] [CrossRef] [PubMed]
  31. Skendžić, S.; Zovko, M.; Živković, I.P.; Lešić, V.; Lemić, D. The impact of climate change on agricultural insect pests. Insects 2021, 12, 440. [Google Scholar] [CrossRef] [PubMed]
  32. Cui, M.; Wu, Y.; Javal, M.; Giguère, I.; Roux, G.; Andres, J.A.; Keena, M.; Shi, J.; Wang, B.; Braswell, E.; et al. Genome-scale phylogeography resolves the native population structure of the Asian longhorned beetle, Anoplophora glabripennis (Motschulsky). Evol. Appl. 2022, 15, 934–953. [Google Scholar] [CrossRef] [PubMed]
Figure 1. Occurrence point distribution map of ALB.
Forests 16 01239 g001
Figure 2. The influence of various environmental variables was tested by the jack-knife method.
Forests 16 01239 g002
Figure 3. Response curves of major environmental variables affecting the distribution of the area.
Forests 16 01239 g003
Figure 4. ROC curve analysis of the prediction results for ALB.
Forests 16 01239 g004
Figure 5. Distribution of ALB in China on the basis of bioclimatic data from 1970 to 2000.
Forests 16 01239 g005
Figure 6. Spatial Distribution and Shift of Suitable Habitats for ALB in China from Present to (2021–2040).
Forests 16 01239 g006
Figure 7. Spatial Distribution and Shift of Suitable Habitats for ALB in China from (2021–2040) to (2041–2060).
Forests 16 01239 g007
Figure 8. Distribution of ALB in China based on bioclimatic data from 2021 to 2040.
Forests 16 01239 g008
Figure 9. Distribution of ALB in China based on bioclimatic data from 2041 to 2060.
Forests 16 01239 g009
Table 1. Climate variables.
Environment VariablesDescriptionEnvironment VariablesDescription
Bio1mean annual temperatureBio12Average annual precipitation
Bio2Average temperature difference between day and nightBio13Precipitation in the wettest month
Bio3IsothermalityBio14Precipitation in the driest month
Bio4Temperature seasonalityBio15Seasonal variation coefficient of precipitation
Bio5The highest temperature of the hottest monthBio16Wettest quarterly precipitation
Bio6The lowest temperature in the coldest monthBio17Precipitation in the driest quarter
Bio7Annual temperature variation rangeBio18Warmest quarterly precipitation
Bio8The average temperature of the wettest quarterBio19Precipitation in the coldest quarter
Bio9The average temperature of the driest quarterPreci (i = 1, 2, …, 12)The average precipitation in month i
Bio10The average temperature of the hottest quartertmaxi (i = 1, 2, …, 12)The average maximum temperature in month i
Bio11The average temperature of the coldest quartertmini (i = 1, 2, …, 12)The average minimum temperature in the ith month
Table 2. The extent to which the different bioclimatic variables contributed to the model.
Environment VariablesDescriptionPercent Contribution %
Bio15Seasonal variation coefficient of precipitation17.7
tmin9The average minimum temperature in September15.4
prec10The average precipitation in October8.9
prec4The average precipitation in April5.2
prec1The average precipitation in January4.4
prec11The average precipitation in November4.1
tmax4The average maximum temperature in April3.5
prec6The average precipitation in June2.7
Bio3Isothermality2.7
Bio7Annual temperature variation range2.3
prec9The average precipitation in September2.1
Tmax6The average maximum temperature in June1.3
Table 3. The Markov state transition matrix results from the present to 2021–2040.
Porportion China2021–2040
NonLowIntermediateHighTotal
PresentNon0.920.080.010.001
Low0.330.520.140.011
Intermediate0.030.340.520.111
High0.000.070.320.611
Total0.60.20.10.11
Note: Yellow represents Persistence; light green represents Increase distribution; and light blue represents Reduction distribution.
Table 4. The Markov state transition matrix results from 2021–2040 to 2041–2060.
Porportion China2041–2060
NonLowIntermediateHighTotal
2021–2040Non0.930.070.000.001
Low0.190.670.140.001
Intermediate 0.010.200.620.181
High0.000.000.190.811
Total0.60.20.10.11
Note: Yellow represents Persistence; light green represents Increase distribution; and light blue represents Reduction distribution.
Table 5. Changes in the proportions of the present and future suitable areas in China.
Area Ratio (%)SSPNonsuitability AreaLow Suitability AreaIntermediate Suitability AreaHigh Suitability Area
Time (Year)
1970–2000 60.3020.8512.816.04
2021–2040SSP24557.5721.5513.787.10
2041–2060SSP24557.5321.4315.765.28
Note: SSP stands for Shared Socioeconomic Pathways.
Disclaimer/Publisher’s Note: The statements, opinions and data contained in all publications are solely those of the individual author(s) and contributor(s) and not of MDPI and/or the editor(s). MDPI and/or the editor(s) disclaim responsibility for any injury to people or property resulting from any ideas, methods, instructions or products referred to in the content.

