Article

Spatial Patterning and Growth of Naturally Regenerated Eastern White Pine in a Northern Hardwood Silviculture Experiment

by
David A. Kromholz
,
Christopher R. Webster
* and
Michael D. Hyslop
College of Forest Resources and Environmental Science, Michigan Technological University, 1400 Townsend Drive, Houghton, MI 49931, USA
*
Author to whom correspondence should be addressed.
Forests 2025, 16(8), 1235; https://doi.org/10.3390/f16081235
Submission received: 30 June 2025 / Revised: 22 July 2025 / Accepted: 25 July 2025 / Published: 26 July 2025
(This article belongs to the Section Forest Ecology and Management)

Abstract

In forests dominated by deciduous tree species, coniferous species are often disproportionately important because of their contrasting functional traits. Eastern white pine (Pinus strobus L.), once a widespread emergent canopy species, co-occurs with deciduous hardwoods in the northern Lake States, but is often uncommon in contemporary hardwood stands. To gain insights into the potential utility of hardwood management strategies for simultaneously regenerating white pine, we leveraged a northern hardwood silvicultural experiment with scattered overstory pine. Seven growing seasons post-harvest, we conducted a complete census of white pine regeneration (height ≥ 30 cm) and mapped their locations and the locations of potential seed trees. Pine regeneration was sparse and strongly spatially aggregated, with most clusters falling within potential seed shadows of overstory pines. New recruits were found to have the highest density in a scarified portion of the study area leeward of potential seed trees. Low regeneration densities within treatment units, strong spatial aggregation, and the spatial arrangement of potential seed trees precluded generalizable inferences regarding the utility of specific treatment combinations. Nevertheless, our results underscore the critical importance of residual overstory pines as seed sources and highlight the challenges associated with realizing their potential in managed northern hardwoods.

1. Introduction

In forests dominated by deciduous tree species, conifer species are often disproportionately important components of overstory diversity and provide a variety of valuable ecosystem services [1,2,3,4]. For example, within northern hardwood forests, conifer species provide valuable resources to wildlife as unique habitat and food sources, and by promoting structural heterogeneity [3,5]. The retention and conservation of species with contrasting functional traits, like conifers in hardwood forests, has been highlighted as an important strategy for maintaining forest resilience and increasing adaptive capacity [1,6,7]. These species are often minor stand components as a result of past management [8], competitive hierarchies [9], limited seed availability [1,10], and/or dispersal and microsite limitations [5,11]. Consequently, a better understanding of the spatial patterning of naturally occurring individuals (potential seed trees and regeneration) in managed forests could help inform management recommendations.
Conifers are often difficult to maintain within hardwood-dominated forests, particularly those with shade-tolerant, dominant deciduous species such as sugar maple (Acer saccharum Marsh.) [3,12]. Individual conifers in these stands may be particularly valuable as seed trees because their retention increases the odds of successful natural regeneration if they represent a local genotype adapted to specific site conditions [13]. Artificial planting operations generally rely heavily on herbicide [14] and/or site preparation treatments [15]. While generally effective, these methods are expensive, especially in the context of restoration, where these species may be of limited commercial value. Furthermore, it may be difficult to obtain site-adapted local genotypes for planting. Therefore, managing overstory pines, when and where they occur, to promote natural regeneration could be a cost-effective approach to promoting forest diversity and enhancing forest resilience.
In the northern Lakes States region, prior to widespread logging and anthropogenic fires, conifer species often co-dominated with deciduous species in northern hardwood forests, especially on lower-quality sites and along riparian areas [16,17,18]. For example, eastern white pine (Pinus strobus L.), once a widespread emergent canopy species, was selectively harvested from hardwood stands during the cutover of the Lake States between 1860 and 1910 [16,19], resulting in a lower prevalence in contemporary forest stands [3,20]. The emergent character of this species provides an important ecological niche in northern hardwood forests [3]. For example, emergent white pines are a valuable habitat for bald eagles (Haliaeetus leucocephalus L.), osprey (Pandion haliaetus L.), and black bears (Ursus americanus Pallas) [3], and the seed is a food source for small mammals and birds [21]. Furthermore, the species holds important cultural significance within indigenous communities [20]. Nevertheless, restoration efforts for this species have been confounded by disease and insect pests (white pine weevil [Pissodes strobi Peck] and white pine blister rust [Cronartium ribicola J.C. Fisch.]) [22], herbivory [23], and a lack of suitable seed trees and microsites for establishment [3,10,23,24]. White pine has light-windblown seed, which can disperse upwards of 210 m in the open and at least 60 m under closed-canopy pine forests, necessitating well-distributed seed trees to facilitate colonization following disturbance [25].
We leveraged a large-scale investigation of silvicultural techniques for enhancing tree species diversity in northern hardwood forests (Northern Hardwood Silviculture Experiment to Enhance Diversity, NH-SEED [26,27,28,29]) by mapping residual overstory white pines and regeneration 7 years post-harvest. A better understanding of spatial patterning of potential seed trees and natural regeneration within this study could aid in the management of long-lived conifers dependent on scattered seed trees for regeneration. Specifically, we hypothesized that treatment units with the highest levels of canopy opening and scarification would produce greater white pine regeneration than areas with minimal canopy opening and scarification. Areas that lack intentional scarification were hypothesized to have an increased spatial aggregation of white pine, since incidental scarification is likely highly localized around machine trails. On the other hand, areas with scarification should exhibit increased spatial regularity as suitable microsites for regeneration become more common across a treatment unit. Our findings should help clarify spatial constraints on regeneration of white pine in hardwood stands dominated by shade-tolerant species when only scattered seed trees are present.

2. Materials and Methods
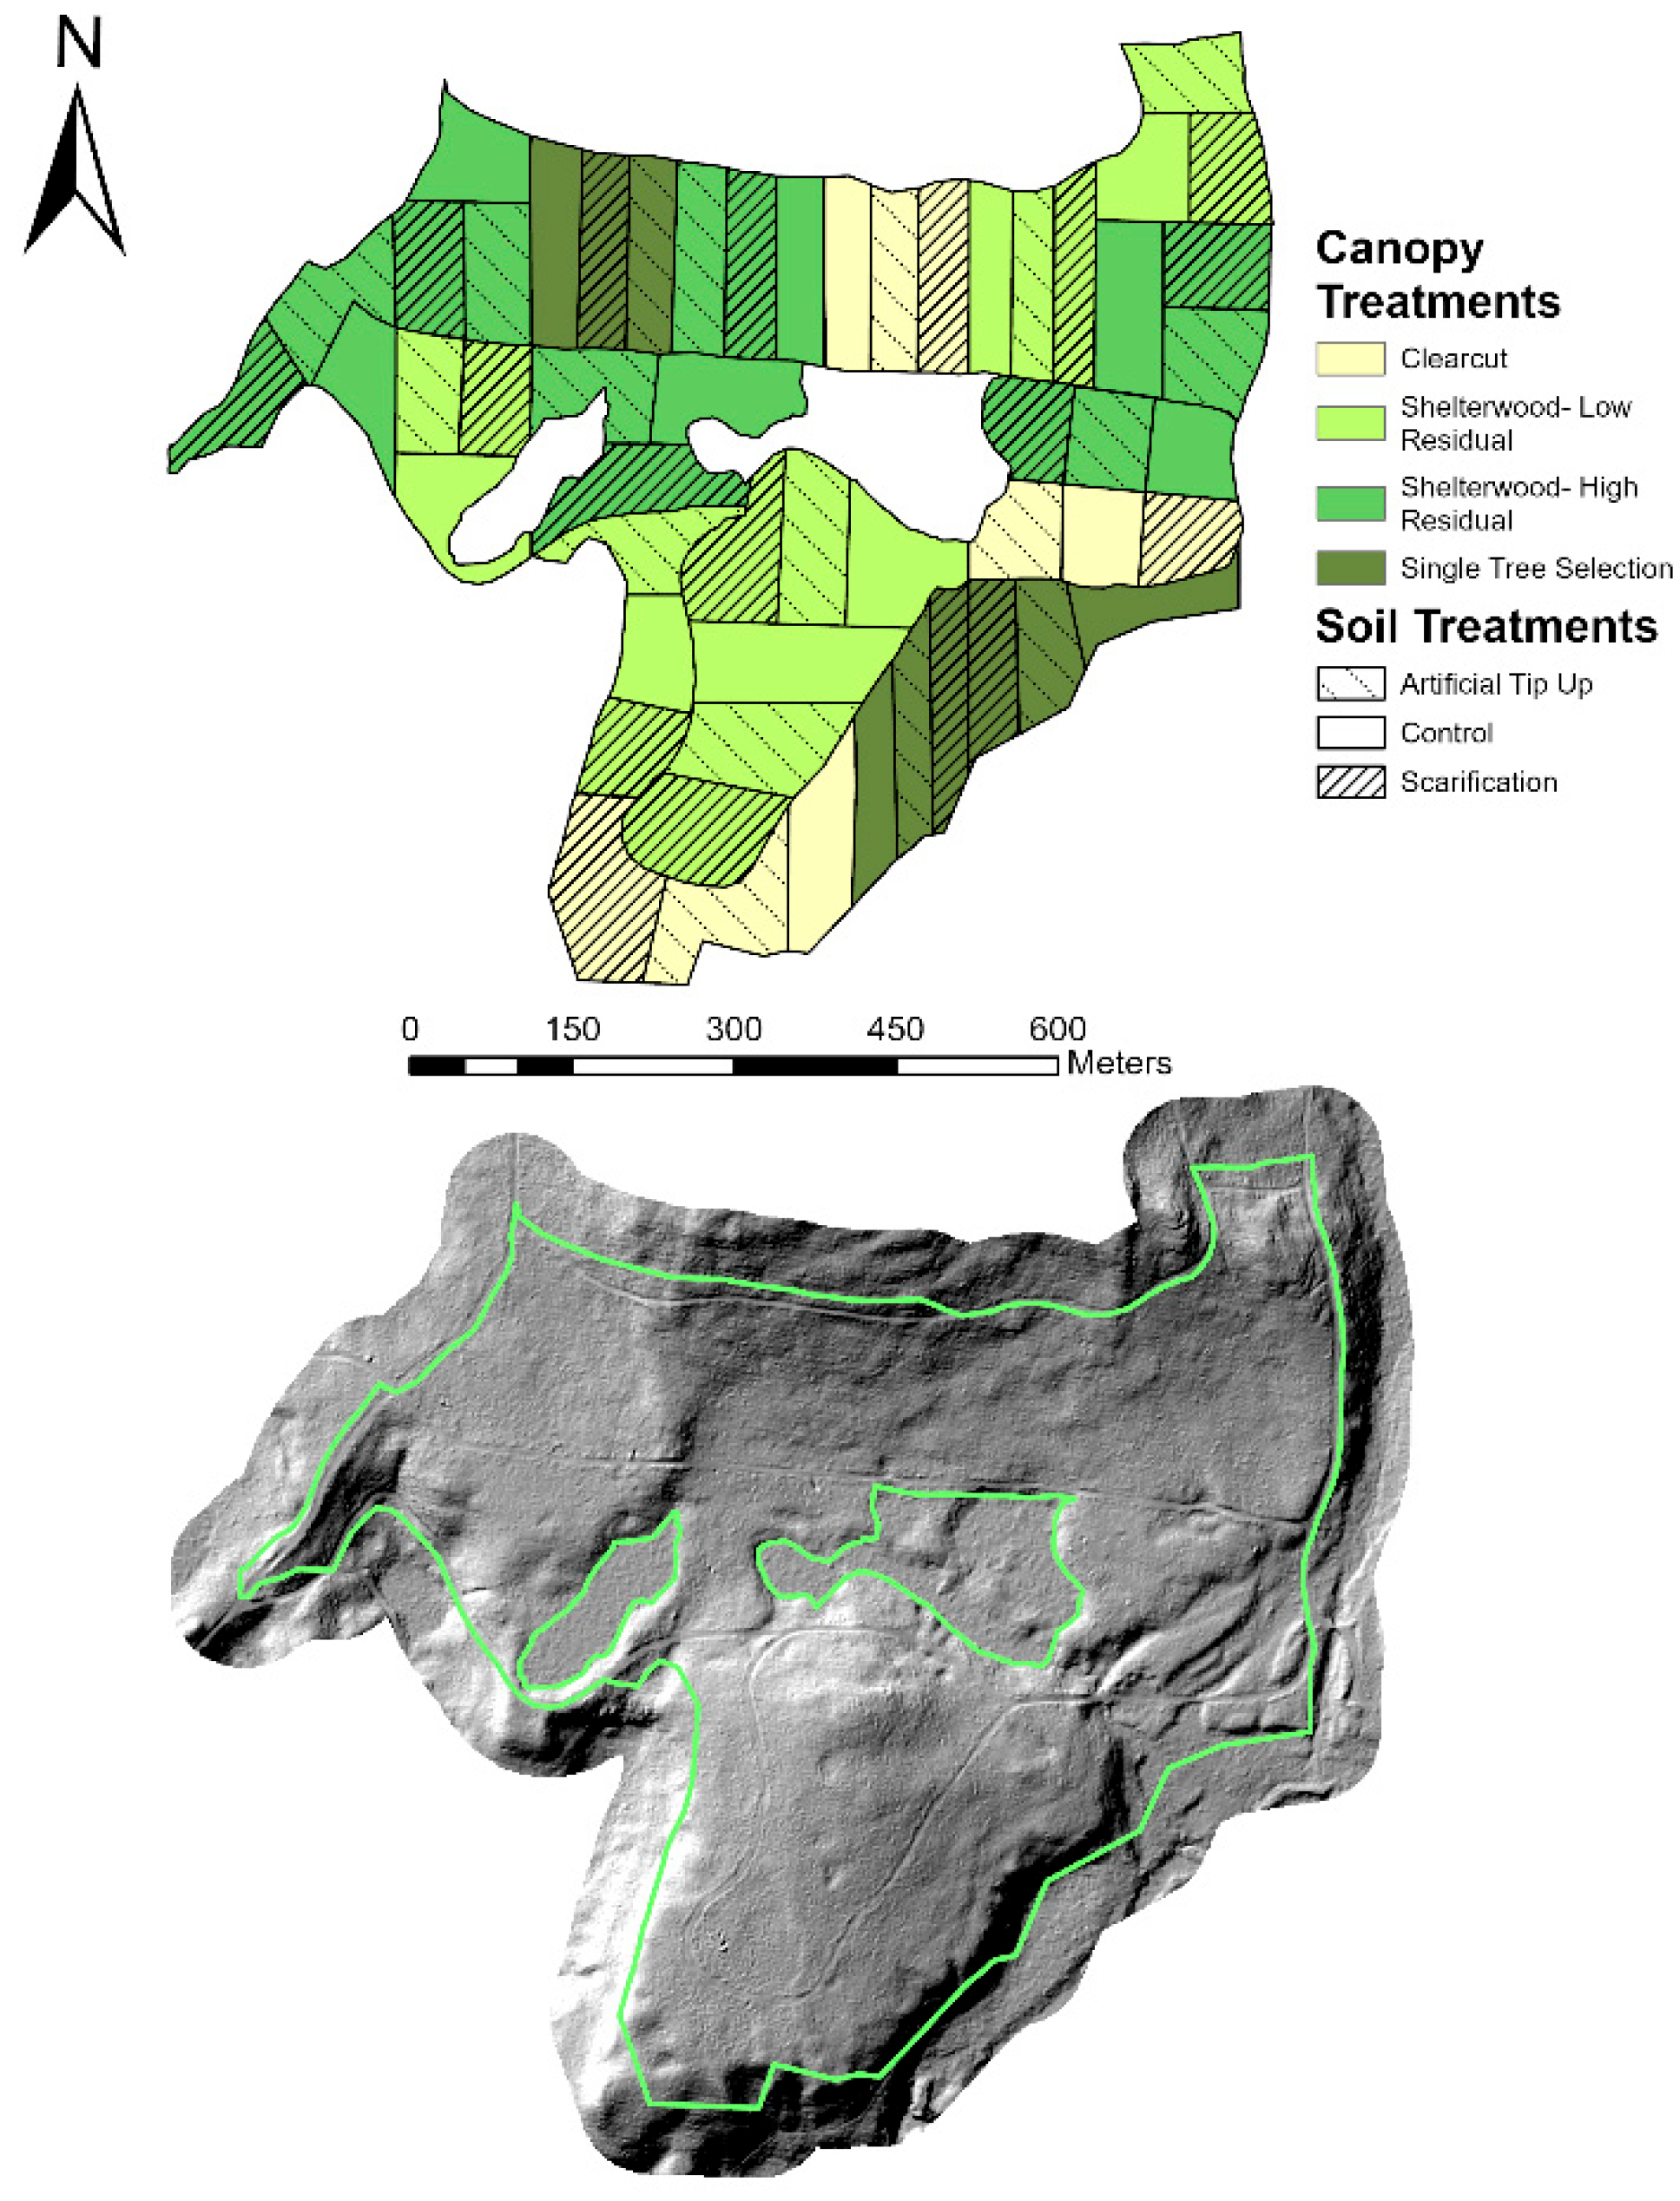
2.1. Study Site

Our study was conducted at the ~45 ha Northern Hardwood Silviculture Experiment to Enhance Diversity (NH-SEED) at Michigan Technological University’s Ford Forest near Alberta, MI (46°37′ N 88°29′ W) [28]. The study area has rolling terrain, and the primary soil types include the Champion cobbly silt loam, Champion-Michigamme cobbly silt loam, and Kallio cobbly silt loam. Additional soil types present include Witbeck, Carbondale, and Tacoosh mucks [30]. The habitat type is Acer saccharum-Tsuga Candensis/Dryopteris spinulosa, which is typically associated with near-optimal growing conditions for mesic hardwoods and a windthrow disturbance regime [31]. Average daily temperatures varied from a minimum of −10.8 °C in January to a maximum of 18.7 °C in July (1981–2010) [32]. Mean annual precipitation and snowfall were 94.6 cm and 557.8 cm, respectively (1981–2010) [33]. Prevailing winds during the seed dispersal period for white pine (August–September) [25] are predominately westerly to southerly (Global Wind Atlas. Available online: https://globalwindatlas.info/en/ [accessed 21 July 2025]). Stand composition pre-establishment of NH-SEED was dominated by sugar maple. Additional minor hardwood components included red maple (Acer rubrum L.), yellow birch (Betula alleghaniensis Britton), American elm (Ulmus americana L.), ironwood (Ostrya virginiana L.), green ash (Fraxinus pennsylvanica Marsh.), and paper birch (Betula papyrifera Marsh.). Minor conifer components included eastern hemlock (Tsuga canadensis [L.] Carrière), white spruce (Picea glauca [Moench] Voss), balsam fir (Abies balsamea [L.] Mill.), and white pine [26,29]. White pine was selectively logged across the region during the late 1800s and early 1900s [34,35]. The land base encompassing NH-SEED comprised a mixed pine-hardwood type prior to selective harvesting [36,37], and it has been managed on a regular cutting cycle using single-tree and small-group selection since shortly after it was donated to Michigan Technological University by the Ford Motor Company [38].

2.2. The NH-SEED Experiment

NH-SEED canopy treatments were established in early 2017 and consist of single-tree selection (business as usual), clear cuts, low residual shelterwoods (regular and irregular), and high residual shelterwoods (regular and irregular) (Figure 1) [29]. At the time of our study, the overwood had not yet been removed from any shelterwoods, so we do not differentiate between regular and irregular (Figure 1). The original experiment sought to test treatment combinations that provided a gradient of intensity and employed both classical (e.g., mechanical scarification) and novel (e.g., artificial tip-up mounds) silvicultural techniques [29].
The study utilized a randomized split-plot design with blocking (Figure 1). The study area was split into three blocks, within which canopy treatments were assigned at random. Within each canopy treatment unit, three soil treatments were applied at random (control, artificial tip-up mounds, and scarification). Control and artificial tip-up were combined for analysis, since the area impacted by mounds at the treatment scale was minimal. Most mounds were small due to machinery limitations encountered while uprooting trees during the harvest, and many uprooted and inverted stumps ended up resting on their root plates and not emulating mounds created by windthrow [39]. No white pines were observed on or proximate to the artificial mounds. For additional details on mound attributes and regeneration response, see Bartlick et al. [39]. Single-tree selection treatments were implemented based on a 15-year cutting cycle using BDq methodology (q = 1.3, basal area = 75 ft2 ac−1, and upper dbh [diameter at breast height, 1.37 m] limit of 50.8 cm). High residual shelterwood treatments retained 60% of the original canopy cover, while low residual shelterwood treatments retained 30% post-treatment. To reduce competition, sub-merchantable hardwood trees and shrubs (>1.4 m tall and <5 cm dbh) were cut with brush saws in all clearcut and shelterwood units. Soil treatments were conducted in the fall of 2017. Scarification was completed using a salmon blade on a small bulldozer, and artificial tip-up mounds were created by mechanically forcing trees over using harvesting machinery [39]. For additional details on treatments and initial stand conditions, see Hupperts et al. [26], Bartlick et al. [28], and Webster et al. [29].

2.3. Field Data Collection

Field data collection took place from October 2023 to January 2024. To facilitate efficient mapping and ensure that the entirety of each treatment was searched for white pine saplings, parallel transects were walked throughout the entirety of NH-SEED following compass bearings. Transects were spaced to maintain visibility between them (i.e., one or two chains apart, 20.1 or 40.2 m). Every white pine sapling (height ≥ 30 cm) observed along or between the transects was mapped and measured. Isolated individuals were mapped directly with a Garmin GPSMAP 62sc GPS unit. Individuals within groups of white pine saplings were mapped relative to a waypoint using a Haglöf Sonic DME Rangefinder and Suunto Compass. We also mapped all potential white pine seed trees (dbh ≥ 12.7 cm) within NH-SEED and within an adjacent 60 m buffer. Waypoints were averaged to 100% confidence for clusters, and for 3–5 min for each individual. Height (m), diameter at breast height if applicable (dbh; cm), number of whorls per tree (to assess approximate age), and height of the seventh whorl counting down from the top of the tree (m; to indicate height at establishment of NH-SEED treatments) were measured on each sapling. White pine produces a single whorl per year, with the first whorl appearing 2–3 years after gemination [40]. Our count included the internode between the last whorl and the terminal bud, so our whorl count is equal to the number of observable internodes. Height and dbh were measured for each seed tree. Height was measured using a height pole for saplings and a Suunto clinometer for seed trees and saplings that exceeded the maximum range of the height pole. The presence of browse, mechanical damage, and white pine weevil were recorded for each sapling measured. White pine weevil damage was assessed by observing afflicted terminal leaders, and in addition to presence, the number of affected terminal leaders was recorded. Weevil damage can cause a loss of apical dominance, resulting in a shrubby growth form, and is of particular concern under environmental conditions that favor rapid tree growth [22].

2.4. Analysis Methods

Saplings were divided into two categories: new recruits and advance regeneration. Saplings with less than seven internodes between whorls were labeled new recruits (likely established post-treatment), while saplings with seven or more whorls were labeled advance regeneration (established pre-treatment). The number of whorls was used as an estimate of minimum age, since we did not attempt to correct for very young seedlings not developing lateral branches [40]. Mean internode growth (m yr−1) was calculated since treatment. For advance regeneration, this was done by dividing the length of the last seven internodes by seven. For new recruits, total internode length was divided by the number of internodes between whorls. Density values (stems ha−1) were calculated by completing a spatial join (combining attributes from one feature layer to another based on their spatial relationship) to establish abundance per polygon using ArcGIS Pro version 3.2.2 (Esri Inc., Redlands, CA, USA). Descriptive statistics are provided in Table 1. Treatment means for new recruits and advance regeneration were compared with mixed-effects general linear models, with block and split-plot as random effects. Pairwise comparisons were conducted using Tukey’s multiple comparison test, with an α = 0.05. Mixed models and pairwise comparisons were performed using MiniTab version 21.1.0 (Minitab LLC, State College, PA, USA). Treatment means are reported ±1 standard error (SE), and simple arithmetic means for attributes of advance regeneration and new recruits are reported ±1 standard deviation (SD).
To examine the spatial patterning of both new recruits and advance regeneration, we conducted univariate multi-distance spatial cluster analyses (Ripley’s K) using ArcGIS Pro version 3.2.2. ArcGIS Pro uses the L(d) transformation of Ripley’s K function [41,42,43]. L(d) is calculated as
L d = A   i = 1 n j = 1 ,   j 1 n k i ,   j π n ( n 1 )
where d is the distance (search radius), n is the number of points, A is the total area, i is the event (point), j are the other points within the search radius, and ki,j is a weight with a value of 1 when the distance between i and j is ≤d and 0 otherwise. The observed L(d) values across a range of distances are compared to a confidence envelope that contains expected L(d) values that would likely occur under complete spatial randomness. This envelope is generated by performing multiple permutations with randomized data at each distance interval. Spatial aggregation is indicated where observed values are above the confidence envelope, and spatial dispersion is indicated where observed values are below the confidence envelope. To construct confidence envelopes (99.9%) for new recruits and advance regeneration, we used 999 permutations (the maximum number of permutations available in ArcGIS Pro) at each distance interval (3 m), and the default number of distance bands (10). The tool uses a minimum enclosing rectangle to define the study area based on the overall point pattern. A beginning search distance of 0.5 m was used. To improve neighborhood estimates near the study area boundary, we chose the simulate outer boundary values option, which mirrors points near the study area margins. For additional detail on this analysis technique, as implemented in ArcGIS Pro, see the ArcGIS Pro Tool References [44,45].
Average internode growth (m yr−1) was estimated for both new recruits and advance regeneration (since treatment) using Inverse-Distance Weighted Interpolation (IDW) across the study area. Interpolation was completed using the IDW tool in ArcGIS Pro. IDW is a spatial analysis technique that takes the inverse distance between points and raises them to a power as optimized by the ArcGIS Pro Geostatistical Wizard. The values are then interpolated across the study area. This method assumes that points that are spatially closer to one another have an increased relation and, therefore, influence each other more than points that are further away from one another [46,47]. Default settings (variable, 12 points), with no weights, were used when determining the search radius. The processing extent was defined as the NH-SEED study area. Kernel density estimation (KDE) was performed using the Kernel Density tool (planar method) in ArcGIS Pro for both new recruits and regeneration to estimate density (stems ha−1). Kernel density estimation works by utilizing a quartic kernel function to estimate density [48]. Both IDW and KDE outputs were clipped to the extent of the study area.
Potential wind dispersal seed shadows were created in ArcGIS Pro. These seed shadows are provided for descriptive and interpretive purposes and do not reflect precise mechanistic or stochastic models [49]. Rather, we used the seed dispersal range estimates for white pine (60 m in forested settings, 210 m in the open) [25] to create buffers around potential seed trees. The dispersal ranges were limited to the extent of the study area. A 60 m dispersal range was used to represent the dispersal range for all seed trees when estimating potential seed shadows for advance regeneration, as regeneration established pre-treatment was under intact forest canopies. Since our treatments created a mosaic of open- and closed-canopy conditions, for new recruits, we applied a 60 m potential dispersal range to trees that were located in areas of closed canopy and a 210 m range to those within or adjacent to open areas. Adjacency was defined as within one tree height of an open area based on the average tree height of potential our seed trees (20.4 m). Open areas included clearcuts and low residual shelterwood treatments. Single-tree selection and high residual shelterwoods were considered barriers due to their dense nature and likely effect on wind speed and seed transport [50]. We considered these treatments as stoppers and truncated open dispersal ranges at their boundaries.

3. Results

3.1. Density

Our complete census of white pine regeneration identified 156 saplings that appeared to predate the establishment of the study (advance regeneration) and 81 saplings that appeared to have been established since treatment (new recruits) (Table 1, Figure 2). New recruits suggest a 65.8% increase in white pine sapling abundance by 7 years post-treatment. Nevertheless, across all treatment units, these census values translate to 3.84 ± 0.91 (SE) stems ha−1 of advance regeneration and 1.89 ± 0.46 (SE) stems ha−1 for new recruits. Not surprisingly, given the low densities and spatial aggregation described below, mixed general linear models failed to detect significant differences in either the density of advance regeneration (p ≥ 0.215) or new recruits (p ≥ 0.360) between canopy and soil treatment combinations.

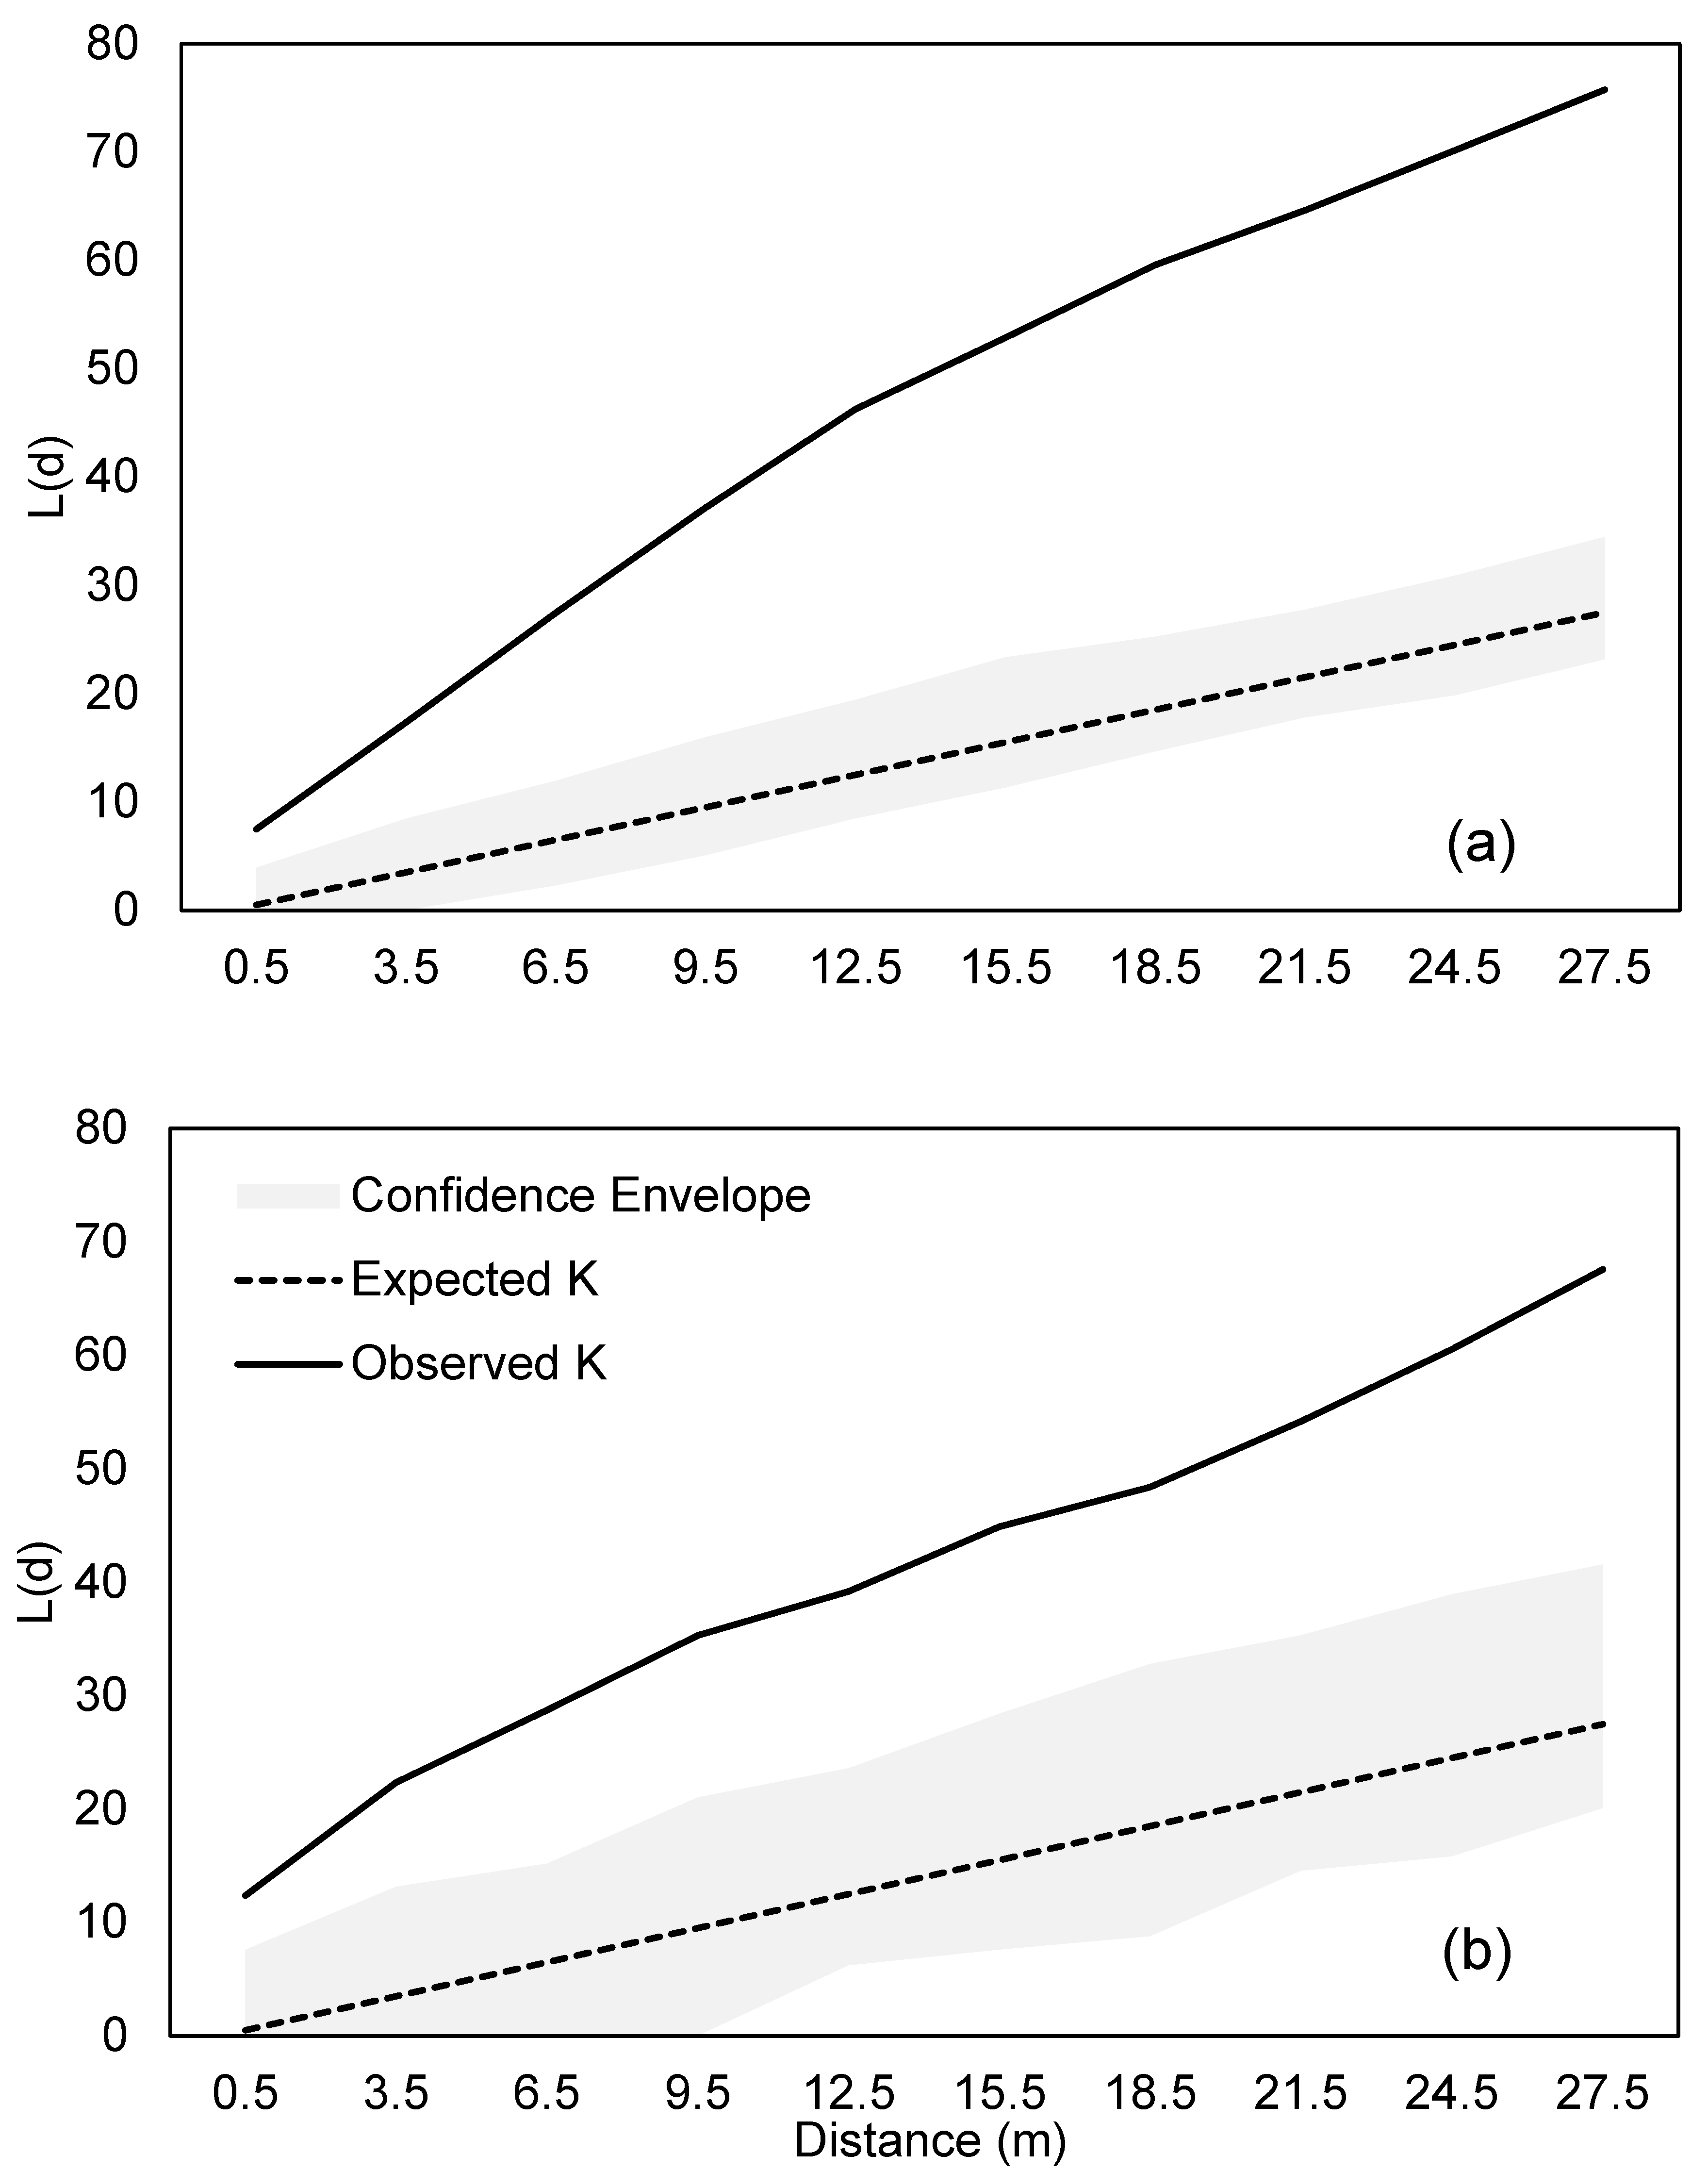
3.2. Spatial Pattern

Densities were too low to examine spatial pattering at the treatment unit scale; therefore, we assessed spatial structure study-wide. Advance regeneration and new recruits were spatially aggregated at all relevant spatial scales (Figure 2 and Figure 3). Mean nearest-neighbor distance was also similar for new recruits and advance regeneration (9.8 ± (SE) 0.9 m and 12.3 ± (SE) 2.1 m, respectively; Table 2). There were three main clusters of advance regeneration and two main clusters of new recruits. The clusters of advance regeneration and new recruits were not evenly distributed across the study area, but they did exhibit some overlap in space (Figure 2). Much of the overlap corresponded with the locations of potential seed sources (Figure 4). The nearest potential seed tree distances for advance regeneration and new recruits averaged 61.6 ± (SE) 3.5 m and 46.9 ± (SE) 4.3 m, respectively (Table 2). Given reported dispersal ranges in forested and open settings of 60 m and 210 m, respectively [25], on average, individuals fell within seed shadows associated with forested settings. Buffering potential seed trees based on association with edges or closed-canopy forests illustrated that nearly all new recruits fell within potential seed shadows associated with open conditions (Figure 4). Similarly, while some advance regeneration occurred further from potential seed trees than might be expected in forested conditions, nearly all fell within the ranges expected under open conditions (Figure 4). Notably, the maximum distances from potential seed trees for advance regeneration and new recruits (Table 1) across all treatments were similar to the range reported in the literature for open conditions (199.4 m and 212.6 m, respectively, vs. 210 m).
New recruits were found to have the highest density in the west central, scarified portion of the study area directly southeast of a pocket wetland with a high density of potential seed trees (Figure 2 and Figure 4). Additional potential seed trees were present to the north, west, and south of this cluster. The second-highest density of new recruits occurred in the southeastern portion of the study area. This cluster of new recruits overlapped with the highest density of advance regeneration in the study area. There were potential seed trees present to the north and south of this cluster of new recruits and advance regeneration. Advance regeneration also existed in two lower-density clusters. One was located northeast of a cluster of potential seed trees located in the primary wetland of the study area. The other was located to the northeast of a cluster of potential seed trees in the pocket wetland. Other low-density patches of new recruits were centered around potential seed trees across the study area. This was generally true for advance regeneration, apart from one cluster in the north central region of the study area and some isolated individuals, which may indicate chance long-distance dispersal, a wind tunnel effect from a nearby forest road, or seed rain from seed trees that are no longer present. Few white pines occurred between these clusters of regeneration.

3.3. Internode Growth

Mean annual internode growth of neither advance regeneration nor new recruits varied significantly among treatments (p ≥ 0.521 and p ≥ 0.230, respectively; Table 1). Nevertheless, spatial interpolations of internode growth suggested that when present in treatment areas with more open canopy, higher growth rates were more common (contrast Figure 1 vs. Figure 5). Individual tree internode growth since treatment for advance regeneration (21.5 ± 11.9 (SD) cm yr−1) was significantly greater than that of new recruits (14.5 ± 11.9 (SD) cm yr−1) (F 1, 235 = 23.87, p < 0.001). The number of whorls (internodes) also varied significantly between advance regeneration (13.3 ± 4.8 (SD)) and new recruits (4.5 ± 1.2 (SD)) (F 1, 235 = 260.05, p < 0.001).

3.4. Damaging Agents

The most common damage observed on both advance regeneration and new recruits was evidence of ungulate browse (Table 3). Browse was most evident on advance regeneration (41.7%) compared to new recruits (14.1%). Mechanical damage was the second most common damage observed overall and was observed on 23.1% of advance regeneration and 5.8% of new recruits (Table 3). Most mechanical damage was observed in clearcuts and low residual shelterwoods. White pine weevil affected 30.1% of advance regeneration, but only 3.8% of new recruits. White pine weevil damage was most common in clearcuts, followed by (in decreasing order) low residual shelterwoods, high residual shelterwoods, and single-tree selection for advance regeneration (Table 3).

4. Discussion

Retaining large white pine seed trees has been shown to enhance its persistence and natural reproduction in aspen (Populus spp.)-dominated landscapes in northern Michigan [1], and dispersal from marginal habitats likely contributed to its persistence in late successional forests [3]. Our results confirm the importance of scattered white pine in hardwood forests as seed sources, but also highlight the challenges associated with realizing their potential during conventional northern hardwood management. These challenges include a paucity of advance pine regeneration in the understories of stands managed with single-tree selection, timing harvest and scarification treatments with good seed crops, and limits imposed by the spatial distribution of white pine seed trees in hardwood-dominated stands. Notwithstanding these limitations, our results suggest that a range of overstory and understory treatment combinations may be suitable depending on trade-offs between local seed availability, damaging agents, and canopy closure rates.
Prior to the establishment of NH-SEED, the northern hardwood stands encompassed by the experiment had a long history of single-tree selection management, dating back to the 1950s [26]. Light levels in the understories of selection stands tend to be quite low, increasing only briefly following harvest [51]. Therefore, given white pine’s intermediate shade tolerance [25], we did not anticipate that advance regeneration would be abundant at our study site. Correspondingly, across all treatments, we found only 156 white pine saplings (~3.5 saplings ha−1) that appeared to predate the establishment of NH-SEED. Advance regeneration was spatially aggregated at all spatial scales examined and often proximate to potential seed trees. Some clusters, however, appeared to be beyond typical seed shadows and may represent chance long-distance dispersal events. Most of these clusters of advance regeneration were found just north of an east–west forest road. Linear features like roads and seismic exploration lines can accelerate wind dispersal by increasing wind speeds 7-fold compared to adjacent undisturbed forests [52]. Wind speed, along with the height of a seed’s launch, are the primary determinants of dispersal distance [50]. Additionally, increased turbulence and variation in wind velocity may also enhance long-distance dispersal by generating uplift and keeping seeds aloft longer above the forest canopy [50]. Other clusters, especially those distal from forest roads and potential seed trees, may indicate especially rare dispersal events or locations of seed trees that died and/or were removed prior to the establishment of NH-SEED.
While a lack of advance regeneration was anticipated, the low abundance of new recruits, especially in areas with scarification proximate to potential seed trees, was not. After six full growing seasons following scarification treatments, we observed just 81 new recruits (~1.8 saplings ha−1) that were ≥30 cm in height. The new recruits were spatially aggregated at all spatial scales examined, and their locations were largely commensurate with open scarified areas near potential seed trees. Early growth of seed-origin white pine is slow [53,54], but under open conditions, saplings usually reach 30 cm height within 5 years and may reach 137 cm between 8 and 10 years of age [55]. Consequently, given a 30 cm height cutoff for mapping, our sample of new recruits—collected 7 years post-harvest—is likely biased towards white pine that established in the first or second year following canopy and/or scarification treatments. That being said, we observed very few white pine saplings below our height cutoff. We defined new recruits as those with <7 discernable internodes between branch whorls. The observed mean number of internodes for new recruits was 4.46 ± 0.14. Since internodes between whorls may not be readily discernable until a sapling is 2 to 3 years of age [40], this suggests that most of these individuals likely established subsequent to canopy treatment and incidental scarification (7 years) or intentional scarification (6 years). Therefore, the low abundance of new recruits may reflect poor seed availability and/or competitive exclusion.
White pine typically produces abundant cone crops once every 3–5 years, with at least some seed produced in most intervening years [54,55]. However, extended periods of poor seed production (only a single light seed crop over the course of a 15-year period) have been reported in the literature [55]. Favorable results regenerating white pine naturally from seeds with scarification are common in the literature, especially on sandy loams and loamy sands [56,57,58]. Results have been less favorable on stony loams and silt loams (such as the ones present at NH-SEED), where broadleaves and graminoids are more aggressive and interfere with pine establishment [54]. Two years post-treatment, large increases in the cover of graminoids and woody shrubs were observed at our study site, and tree seeding and sapling composition was dominated by broadleaves [26,27]. We did not measure cone crops, but our results suggest that seed production was likely not adequate to overwhelm competing vegetation or fully exploit microsites created by intentional and incidental scarification. Similarly, a multi-factor, plot-level seed addition study nested within NH-SEED identified seed limitation for a wide range of species, including white pine, as an impediment to increasing tree species diversity in northern hardwood forests [28]. In that study, white pine seedlings and saplings were completely absent on plots that were not seeded and/or protected from deer [28].
Another challenge our data highlight is limitations imposed by the spatial arrangement of potential seed trees. Given the randomized design of NH-SEED, lower residual canopy and scarification treatments were not preferentially placed near relict white pines. This likely reduced our ability to specifically test treatment efficacy for white pine. Similarly, Hupperts et al. [26] found that overstory and understory treatments at NH-SEED were not predictive of seedling abundance for mid-tolerant yellow birch. Rather, the best predictor of yellow birch abundance was local basal area of conspecifics followed by within-plot variation in litter depth [26]. Low seed tree densities generally result in sparse and strongly aggregated patterns of reproduction [59], such as those observed for yellow birch at NH-SEED [26] and white pine herein. Furthermore, within NH-SEED and a buffer extending 60 m around the study boundary, only 87 potential seed trees were found. These trees occurred singularly and in clumps, with many aggregated in riparian and wetland areas and on steep slopes adjacent to treatment boundaries (Figure 4). Marginal habitats, wetland edges, and riparian areas are important refuge sites for white pine and likely allowed it to persist and establish following disturbance in late-successional, hemlock-hardwood landscapes prior to European settlement [5,60]. The lower landscape positions of these trees relative to our treatments, however, may have reduced their ability to disseminate seed by effectively reducing seed launch height [50]. Collectively, these results suggest that precision treatments proximate to seed sources of minor species may yield more satisfactory results than spatially extensive or dispersed treatments.
We did not observe significant differences in internode growth rates between treatments for either advance regeneration or new recruits, but low sample sizes within some treatment combinations warrant caution in interpreting this finding. Spatial interpolations of individual growth rates may provide a better assessment of potential treatment effects where pines are present. Interpolation of internode growth rates suggests that advance regeneration benefited from release, particularly within and proximate to clearcuts and low residual shelterwoods. Similarly, new recruits exhibited the highest growth rates within clearcuts and a high residual shelterwood. These results are consistent with those of Fahey and Lorimer [3], who observed a linear relationship between sapling white pine height growth and light intensity, with the fastest-growing trees occurring in areas of low competition and >35% transmitted solar radiation. Given the dominance of regenerating hardwoods at NH-SEED [26,28], weeding [56,61,62] and/or pre-commercial release treatments [63] will likely be necessary to recruit these pines into the overstory.
We observed modest levels of common damaging agents among our population of naturally regenerated white pine saplings. Approximately 30% of advance regeneration showed evidence of white pine weevil damage. This level of damage was higher than that observed by Krueger and Puettmann [62] on planted white pine in the understory of a northern hardwood stand in Minnesota but lower than other studies that looked at trees growing in plantations and under more open conditions [64,65,66]. Given that white pine weevils preferentially attack fast-growing trees [65] and growth increases with light transmittance [3,56], the intermediate level of attack we observed is consistent with what might be expected under shelterwood conditions and in clearcuts with numerous broadleaved competitors. Similarly, the lower levels of attack we observed on new recruits are consistent with their lower growth rates. Growing white pines under an existing overstory is generally recommended as a means of mitigating weevil damage, but entails inherent trade-offs when balancing stem form, other pests, and canopy recruitment rate. The levels of deer browse we observed on advance regeneration were similar to those reported by Krueger and Puettmann [62] for planted white pine; browse on new recruits was about one-third as high. Deer browse can reduce the likelihood of successful white pine recruitment, especially if it occurs during the early establishment period [23,61]. Once established, however, white pine appears to be able to tolerate moderate browsing on laterals without a reduction in growth rate [3]. Continued monitoring will be needed to clarify the impact of herbivory and other forest health issues on white pine recruitment at NH-SEED.

5. Study Limitations

A primary limitation of our study was that NH-SEED was not specifically designed to favor the regeneration of white pine. Rather, it was established with the goal of enhancing the heterogeneity and diversity of tree species more generally that co-occur in northern hardwood forests dominated by sugar maple [29]. Nevertheless, the presence of scattered overstory white pine provided an opportunity to evaluate the utility of various silvicultural treatments for naturally regenerating this iconic tree species in a northern hardwood forest. Unfortunately, low regeneration densities within treatment units, strong spatial aggregation, and the spatial arrangement of potential seed trees reduced our ability to make generalizable inferences regarding the utility of specific treatment combinations. Similarly, very low densities within individual treatment units preclude detailed spatial analysis at that scale. Nevertheless, by using the data in aggregate, we were able to make useful inferences at the scale of the full experiment.

6. Conclusions

Our results highlight the importance of conserving overstory white pines as seed trees and applying scarification and canopy treatments within their seed shadows. Similarly, conserving established white pine advance regeneration and protecting it from mechanical damage during harvest and scarification may provide a critical hedge against potential seed and seedbed limitations. High residual and irregular shelterwood harvests may be particularly desirable as a means of reducing the incidence of white pine weevil damage by slowing leader growth. However, a longer period in the understory presents trade-offs that include a greater risk of herbivory and prolonged competition with more shade-tolerant hardwood species. These risks may be lessened with targeted control of competing hardwood regeneration and protection of pine regeneration from deer browse.

Author Contributions

D.A.K.: Conceptualization, methodology, formal analysis, investigation, data curation, writing—original draft, visualization. C.R.W.: Conceptualization, methodology, formal analysis, writing—original draft. M.D.H.: Methodology, formal analysis, visualization, writing—review and editing. All authors have read and agreed to the published version of the manuscript.

Funding

Support for NH-SEED was provided by the United States Department of Agriculture—National Institute of Food and Agriculture (Award No. 2017-67013-26261) and the Michigan Technological University College of Forest Resources and Environmental Science. D.A.K. also received an Earn and Learn Scholarship from the College of Forest Resources and Environmental Science.

Data Availability Statement

Data are available upon request from the corresponding author.

Acknowledgments

We thank past and current faculty and staff in the College of Forest Resources and Environmental Science at Michigan Technological University for their contributions to the initial experimental design and implementation of NH-SEED. We also thank Michigan Technological University, College of Forest Resources and Environmental Science, Ford Forest, for logistical support and hosting this experiment. This manuscript benefited from helpful comments on earlier drafts by a colleague and anonymous reviewers.

Conflicts of Interest

The authors declare no conflicts of interest.

References

  1. Palik, B.J.; Pregitzer, K.S. White pine seed-tree legacies in an aspen landscape: Influences on post-disturbance white pine population structure. For. Ecol. Manag. 1994, 67, 191–201. [Google Scholar] [CrossRef]
  2. Lutz, J.A.; Larson, A.J.; Swanson, M.E.; Freund, J.A. Ecological importance of large-diameter trees in a temperate mixed-conifer forest. PLoS ONE 2012, 7, e36131. [Google Scholar] [CrossRef] [PubMed]
  3. Fahey, R.T.; Lorimer, C.G. Restoring a midtolerant pine species as a component of late-successional forests: Results of gap-based planting trials. For. Ecol. Manag. 2013, 292, 139–149. [Google Scholar] [CrossRef]
  4. Jactel, H.; Bauhus, J.; Boberg, J.; Bonal, D.; Castagneyrol, B.; Gardiner, B.; Gonzalez-Olabarria, J.R.; Koricheva, J.; Meurisse, N.; Brockerhoff, E.G. Tree diversity drives forest stand resistance to natural disturbances. Curr. For. Rep. 2017, 3, 223–243. [Google Scholar] [CrossRef]
  5. Fahey, R.T.; Lorimer, C.G.; Mladenoff, D.J. Habitat heterogeneity and life-history traits influence presettlement distributions of early-successional tree species in a late-successional, hemlock-hardwood landscape. Landsc. Ecol. 2012, 27, 999–1013. [Google Scholar] [CrossRef]
  6. Walker, B.; Kinzig, A.; Langridge, J. Plant attribute diversity, resilience, and ecosystem function: The nature and significance of dominant and minor Species. Ecosystems 1999, 2, 95–113. [Google Scholar] [CrossRef]
  7. Espelta, J.M.; Cruz-Alonso, V.; Alfaro-Sánchez, R.; Hampe, A.; Messier, C.; Pino, J. Functional diversity enhances tree growth and reduces herbivory damage in secondary broadleaf forests, but does not influence resilience to drought. J. Appl. Ecol. 2020, 57, 2362–2372. [Google Scholar] [CrossRef]
  8. Hermy, M.; Verheyen, K. Legacies of the past in the present-day forest biodiversity: A review of past land-use effects on forest plant species composition and diversity. Ecol. Res. 2007, 22, 361–371. [Google Scholar] [CrossRef]
  9. Tripler, C.E.; Canham, C.D.; Inouye, R.S.; Schnurr, J.L. Competitive hierarchies of temperate tree species: Interactions between resource availability and white-tailed deer. Écoscience 2005, 12, 494–505. [Google Scholar] [CrossRef]
  10. Weyenberg, S.A.; Frelich, L.E.; Reich, P.B. Logging versus fire: How does disturbance type influence the abundance of Pinus strobus regeneration? Silva Fenn. 2004, 38, 179–194. [Google Scholar] [CrossRef]
  11. Cornett, M.W.; Reich, P.B.; Puettmann, K.J. Canopy feedbacks and microtopography regulate conifer seedling distribution in two Minnesota conifer-deciduous forests. Écoscience 1997, 4, 353–364. [Google Scholar] [CrossRef]
  12. Webster, C.R.; Dickinson, Y.L.; Burton, J.I.; Frelich, L.E.; Jenkins, M.A.; Kern, C.C.; Raymond, P.; Saunders, M.R.; Walters, M.B.; Willis, J.L. Promoting and maintaining diversity in contemporary hardwood forests: Confronting contemporary drivers of change and the loss of ecological memory. For. Ecol. Manag. 2018, 421, 98–108. [Google Scholar] [CrossRef]
  13. Gibson, A.L.; Espeland, E.K.; Wagner, V.; Nelson, C.R. Can local adaptation research in plants inform selection of native plant materials? An analysis of experimental methodologies. Evol. Appl. 2016, 9, 1219–1228. [Google Scholar] [CrossRef]
  14. Granger, J.J.; Buckley, D.S. Performance of white oak (Quercus alba) and three pine species in novel multi-cropped plantations in Tennessee, USA. For. Ecol. Manag. 2021, 489, 119060. [Google Scholar] [CrossRef]
  15. Clabo, D.C.; Clatterbuck, W.K. Site preparation techniques for the establishment of mixed pine-hardwood stands: 22-year results. For. Sci. 2015, 61, 790–799. [Google Scholar] [CrossRef]
  16. Whitney, G.G. An ecological history of the Great Lakes forest of Michigan. J. Ecol. 1987, 75, 667–684. [Google Scholar] [CrossRef]
  17. Pastor, J.; Broschart, M. The spatial pattern of a northern conifer-hardwood landscape. Landsc. Ecol. 1990, 4, 55–68. [Google Scholar] [CrossRef]
  18. Goebel, P.C.; Palik, B.J.; Pregitzer, K.S. Structure and composition of riparian forests in an old-growth northern hardwood–hemlock watershed. For. Ecol. Manag. 2012, 280, 52–61. [Google Scholar] [CrossRef]
  19. Neithercut, M.E. The White Pine Industry and the Transformation of Nineteenth-Century Michigan. Master’s Thesis, University of British Columbia, Vancouver, BC, Canada, 1984. Available online: https://open.library.ubc.ca/collections/ubctheses/831/items/1.0096560 (accessed on 7 March 2024).
  20. Uprety, Y.; Asselin, H.; Bergeron, Y. Preserving ecosystem services on indigenous territory through restoration and management of a cultural keystone species. Forests 2017, 8, 194. [Google Scholar] [CrossRef]
  21. Naylor, B.J. Managing wildlife habitat in red pine and white pine forests of central Ontario. For. Chron. 1994, 70, 411–419. [Google Scholar] [CrossRef]
  22. Costanza, K.K.L.; Whitney, T.D.; McIntire, C.D.; Livingston, W.H.; Gandhi, K.J.K. A synthesis of emerging health issues of white pine (Pinus strobus) in North America. For. Ecol. Manag. 2018, 423, 3–17. [Google Scholar] [CrossRef]
  23. Zenner, E.K.; Peck, J.E. Maintaining a pine legacy in Itasca State Park. Nat. Areas J. 2009, 29, 157–166. [Google Scholar] [CrossRef]
  24. Willis, J.L.; Walters, M.B.; Farinosi, E. Local seed source availability limits young seedling populations for some species more than other factors in northern hardwood forests. For. Sci. 2016, 62, 440–448. [Google Scholar] [CrossRef]
  25. Wendel, G.W.; Smith, H.C. Eastern White Pine. In Silvics of North America; Burns, R.M., Honkala, B.H., Eds.; Volume 1. Conifers. Agric. Handb. 654; United States Department of Agriculture, Forest Service: Washington, DC, USA, 1990; pp. 476–488. [Google Scholar]
  26. Hupperts, S.F.; Webster, C.R.; Froese, R.E.; Dickinson, Y.L. Seedling and sapling recruitment following novel silvicultural treatments in Great Lakes northern hardwoods. For. Ecol. Manag. 2020, 462, 117983. [Google Scholar] [CrossRef]
  27. Hupperts, S.F.; Webster, C.R.; Froese, R.E.; Lilleskov, E.A.; Marcarelli, A.M.; Dickinson, Y.L. Increasing ground-layer plant taxonomic diversity masks declining phylogenetic diversity along a silvicultural disturbance gradient. Can. J. For. Res. 2020, 50, 1259–1267. [Google Scholar] [CrossRef]
  28. Bartlick, C.I.; Burton, J.I.; Webster, C.R.; Froese, R.E.; Dickinson, Y.L. An experimental approach to identify drivers of tree regeneration diversity, composition, and heterogeneity in northern hardwood forests. For. Ecol. Manag. 2023, 546, 121320. [Google Scholar] [CrossRef]
  29. Webster, C.R.; Dickinson, Y.L.; Froese, R.E. Introducing the NH-SEED: A holistic experiment to revisit classical and test novel silvicultural systems in a changing world. In Proceedings of the First Biennial Northern Hardwood Conference 2021: Bridging Science and Management for the Future, Online, 15–16 June 2021; Gen. Tech. Rep. NRS-P-211. USDA Forest Service: Madison, WI, USA, 2023; pp. 131–135. [Google Scholar] [CrossRef]
  30. Soil Survey Staff, Natural Resources Conservation Service, United States Department of Agriculture. Official Soil Series Descriptions. Available online: https://websoilsurvey.nrcs.usda.gov/app/ (accessed on 7 March 2024).
  31. Burger, T.L.; Kotar, J. A Guide to Forest Communities and Habitat Types of Michigan; University of Wisconsin: Madison, WI, USA, 2003. [Google Scholar]
  32. National Centers for Environmental Information, National Oceanic and Atmospheric Administration. U.S. Climate Normals Quick Access, 1981–2010. Available online: https://www.ncei.noaa.gov/access/us-climate-normals/#dataset=normals-monthly&timeframe=81&location=MI&station=USC00200089 (accessed on 20 April 2023).
  33. Midwestern Regional Climate Center. (1981–2010) Snow and Precipitation Summaries for Station USC00203744—HERMAN, MI. Available online: https://mrcc.purdue.edu (accessed on 20 April 2023).
  34. Graham, S.A. Climax forests of the Upper Peninsula of Michigan. Ecology 1941, 22, 355–362. [Google Scholar] [CrossRef]
  35. Jacquemyn, H.; Butaye, J.; Hermy, M. Influence of environmental and spatial variables on regional distribution of forest plant species in a fragmented and changing landscape. Ecography 2003, 26, 768–776. [Google Scholar] [CrossRef]
  36. Reed, D.D.; Holmes, M.J.; Johnson, J.A. A 22-year study of stand development and financial return in northern hardwoods. North. J. Appl. For. 1986, 3, 35–38. [Google Scholar] [CrossRef]
  37. Erickson, M.D.; Reed, D.D.; Mroz, G.D. Stand development and economic analysis of alternative cutting methods in northern hardwoods: 32-year results. North. J. Appl. For. 1990, 7, 153–158. [Google Scholar] [CrossRef]
  38. Schwartz, J.W.; Nagel, L.M.; Webster, C.R. Effects of uneven-aged management on diameter distribution and species composition of northern hardwoods in Upper Michigan. For. Ecol. Manag. 2005, 211, 356–370. [Google Scholar] [CrossRef]
  39. Bartlick, C.I.; Burton, J.I.; Webster, C.R.; Froese, R.E.; Hupperts, S.F.; Dickinson, Y.L. Artificial tip-up mounds influence tree seedling composition in a managed northern hardwood forest. Can. J. For. Res. 2023, 53, 893–904. [Google Scholar] [CrossRef]
  40. Harlow, W.M.; Harrar, E.S.; Hardin, J.W.; White, F.M. Textbook of Dendrology, Seventh Edition; McGraw-Hill: New York, NY, USA, 1991. [Google Scholar]
  41. Ripley, B.D. The second-order analysis of stationary processes. J. Appl. Prob. 1976, 13, 255–266. [Google Scholar] [CrossRef]
  42. Besag, J. Contribution to the discussion on Dr. Ripley’s paper. J. R. Stat. Soc. B 1977, 39, 192–212. [Google Scholar] [CrossRef]
  43. Ripley, B.D. Modeling Spatial Patterns. J. R. Stat. Soc. B 1977, 39, 172–192. [Google Scholar] [CrossRef]
  44. Esri Inc. Multi-Distance Spatial Cluster Analysis. Available online: https://pro.arcgis.com/en/pro-app/latest/tool-reference/spatial-statistics/multi-distance-spatial-cluster-analysis.htm (accessed on 18 June 2025).
  45. Esri Inc. How Multi-Distance Spatial Cluster Analysis (Ripley’s K-Function) Works. Available online: https://pro.arcgis.com/en/pro-app/latest/tool-reference/spatial-statistics/h-how-multi-distance-spatial-cluster-analysis-ripl.htm (accessed on 18 June 2025).
  46. Philip, G.M.; Watson, D.F. A precise method for determining contoured surfaces. Aust. Pet. Explor. Assoc. J. 1982, 22, 205–212. [Google Scholar] [CrossRef]
  47. Watson, D.F.; Philip, G.M. A refinement of inverse distance weighted interpolation. Geoprocessing 1985, 2, 315–327. [Google Scholar]
  48. Silverman, B.W. Density Estimation for Statistics and Data Analysis. Chapman and Hall: New York, NY, USA, 1986. [Google Scholar] [CrossRef]
  49. Andersen, M. Mechanistic models for the seed shadows of wind-dispersed plants. Am. Nat. 1991, 137, 476–497. [Google Scholar] [CrossRef]
  50. Horn, H.S.; Nathan, R.; Kaplan, S.R. Long-distance dispersal of tree seeds by wind. Ecol. Res. 2001, 16, 877–885. [Google Scholar] [CrossRef]
  51. Domke, G.M.; Caspersen, J.P.; Jones, T.A. Light attenuation following selection harvesting in northern hardwood forests. For. Ecol. Manag. 2007, 239, 182–190. [Google Scholar] [CrossRef]
  52. Roberts, D.; Ciuti, S.; Barber, Q.E.; Willier, C.; Nielsen, S.E. Accelerated seed dispersal along linear disturbances in the Canadian oil sands region. Sci. Rep. 2018, 8, 4828. [Google Scholar] [CrossRef]
  53. Frothingham, E.H. United States Department of Agriculture Agricultural Bulletin; 13; United States Department of Agriculture: Washington, DC, USA, 1914.
  54. Lancaster, K.F.; Leak, W.B. A Silviculture Guide for White Pine in the Northeast; Gen. Tech. Rep. NE-41; United States Department of Agriculture, Forest Service, Northeastern Forest Experiment Station: Broomall, PA, USA, 1978; p. 13.
  55. Wilson, R.W.; McQuilkin, W.E. Silvical Characteristics of Eastern White Pine (Pinus strobus); Res. Paper NE-13; United States Department of Agriculture, Forest Service, Northeastern Forest Experiment Station: Broomall, PA, USA, 1963; p. 29.
  56. Wetzel, S.; Burgess, D. Understorey environment and vegetation response after partial cutting and site preparation in Pinus strobus L. stands. For. Ecol. Manag. 2001, 151, 43–59. [Google Scholar] [CrossRef]
  57. Burgess, D.; Wetzel, S. Recruitment and early growth of eastern white pine (Pinus strobus) regeneration after partial cutting and site preparation. Forestry 2002, 75, 419–423. [Google Scholar] [CrossRef]
  58. Raymond, P.; Munson, A.D.; Ruel, J.C.; Nolet, P. Group and single-tree selection cutting in mixed tolerant hardwood–white pine stands: Early establishment dynamics of white pine and associated species. For. Chron. 2003, 79, 1093–1106. [Google Scholar] [CrossRef]
  59. Bleher, B.; Oberrath, R.; Böhning-Gaese, K. Seed dispersal, braeding system, tree density and the spatial pattern of trees—A simulation approach. Basic Appl. Ecol. 2002, 3, 115–123. [Google Scholar] [CrossRef]
  60. Fahey, R.T.; Lorimer, C.G. Habitat associations and 150 years of compositional change in white pine-hemlock-hardwood forests based on resurvey of public land survey corners. J. Torrey Bot. Soc. 2014, 141, 277–293. [Google Scholar] [CrossRef]
  61. Saunders, M.R.; Puettmann, K.J. Effects of overstory and understory competition and simulated herbivory on growth and survival of white pine seedlings. Can. J. For. Res. 1999, 29, 536–546. [Google Scholar] [CrossRef]
  62. Krueger, J.A.; Puettmann, K.J. Growth and injury patterns of eastern white pine (Pinus strobus L.) seedlings as affected by hardwood overstory density and weeding treatments. North. J. Appl. For. 2004, 21, 61–68. [Google Scholar] [CrossRef]
  63. Bevilacqua, E.; Puttock, D.; Blake, T.J.; Burgess, D. Long-term differential stem growth responses in mature eastern white pine following release from competition. Can. J. For. Res. 2005, 35, 511–520. [Google Scholar] [CrossRef]
  64. Garret, P. Resistance of eastern white pine (Pinus strobus L.) provenances to the white-pine weevil (Pissodes strobi Peck). Silvae Genet. 1972, 21, 119–121. [Google Scholar]
  65. Wilkinson, R.C. Leader and growth characteristics of eastern white pine associated with white pine weevil attack susceptibility. Can. J. For. Res. 1983, 13, 78–84. [Google Scholar] [CrossRef]
  66. Stiell, W.M.; Berry, A.B. Limiting white pine weevil attacks by side shade. For. Chron. 1985, 61, 5–9. [Google Scholar] [CrossRef]
Figure 1. NH-SEED study area with canopy and soil treatments depicted in the top image, and a hillshade depicting topographic variation across the study area in the bottom image. The study area boundary is denoted with a green line in the bottom image.
Forests 16 01235 g001
Figure 2. Kernel density estimates (stems ha−1) for new recruits and advance regeneration across treatments at NH-SEED. Locations of potential seed trees are denoted with triangles. Note the difference in range between legends.
Forests 16 01235 g002
Figure 3. Univariate multi-distance cluster analysis for white pine advance regeneration (a) and new recruits (b) located in NH-SEED. The analysis was completed using a beginning distance of 0.5 m and distance increment of 3 m. A 99% confidence envelope was computed using 999 permutations with randomized data. Boundary correction was completed by simulating the outer boundary values.
Forests 16 01235 g003
Figure 4. Potential seed shadows of overstory white pines for advance regeneration and new recruits. Wind dispersal distances follow Wendel and Smith [25] for closed canopy and open conditions. Dispersal distances for new recruits were adjusted to reflect the open conditions resulting from harvest treatments.
Forests 16 01235 g004
Figure 5. Inverse distance-weighted interpolation of average internode growth (m yr−1) since treatment for both new recruits and advance regeneration within NH-SEED. Note the differences in scale between legends.
Forests 16 01235 g005
Table 1. Descriptive statistics for eastern white pine saplings by site preparation and canopy treatment at NH-SEED 7 years post-treatment.
TreatmentDensity (stems ha−1)Height (m)DBH (cm)Number of Whorls Internode Growth (m yr−1)
Mean ± SEMean ± SEMean ± SEMean ± SEMean ± SE
Advance Regeneration (n = 156)3.84±0.912.31±0.123.56±0.2713.30±0.390.21±0.01
Clearcut (n = 48)7.41±2.842.75±0.234.24±0.4713.40±0.630.25±0.02
Control * (n = 39)9.26±3.872.76±0.274.26±0.5713.62±0.760.24±0.02
Scarification (n = 9)3.72±2.452.72±0.314.14±0.6712.44±0.630.28±0.03
Shelterwood―High Residual (n = 23)1.54±0.402.33±0.383.51±0.7313.43±1.110.19±0.03
Control (n = 14)1.42±0.422.15±0.312.98±0.3612.36±1.180.21±0.04
Scarification (n = 9)1.76±0.842.59±0.834.48±1.8615.11±2.040.17±0.04
Shelterwood―Low Residual (n = 43)3.03±0.902.38±0.213.35±0.5112.72±0.760.25±0.02
Control (n = 36)3.81±1.252.34±0.223.10±0.5312.69±0.740.25±0.02
Scarification (n = 7)1.47±0.662.56±0.655.60±1.2612.86±2.740.26±0.05
Single-Tree Selection (n = 42)6.52±3.801.71±0.192.53±0.4313.71±0.750.15±0.02
Control (n = 34)7.89±5.461.75±0.232.86±0.5114.12±0.870.15±0.02
Scarification (n = 8)3.78±2.541.57±0.241.35±0.1012.00±1.090.18±0.02
New Recruits (n = 81)1.89±0.460.63±0.040.97±0.214.46±0.140.15±0.01
Clearcut (n = 19)2.76±0.910.78±0.090.75±0.184.58±0.230.16±0.01
Control (n = 17)3.74±1.140.72±0.070.50±0.004.47±0.240.16±0.01
Scarification (n = 2)0.80±0.661.23±0.451.00±0.005.50±0.350.21±0.07
Shelterwood―High Residual (n = 28)1.75±1.060.55±0.04 - 4.43±0.230.13±0.01
Control (n = 8)0.88±0.390.54±0.04 - 5.00±0.310.11±0.01
Scarification (n = 20)3.48±2.950.56±0.05 - 4.20±0.280.15±0.02
Shelterwood―Low Residual (n = 21)1.53±0.560.66±0.091.40±0.004.19±0.300.16±0.01
Control (n = 16)1.75±0.810.64±0.111.40±0.004.25±0.310.15±0.02
Scarification (n = 5)1.08±0.320.73±0.18 - 4.00±0.750.17±0.02
Single-tree Selection (n = 13)2.04±0.930.54±0.06 - 4.77±0.330.12±0.01
Control (n = 7)1.65±1.030.57±0.09 - 5.57±0.190.10±0.02
Scarification (n = 6)2.83±1.780.50±0.04 - 3.83±0.440.15±0.02
* Note: Control and artificial tip-up treatments were combined for analysis. Note: The numbers of observations for density and DBH differ, since some stems were less than DBH height (1.37 m). Note: This count includes the internode between the last whorl and the terminal bud. Note: Internode growth since treatment was measured directly on advance regeneration and was estimated for new recruits by dividing total height by the number of visible internodes between whorls.
Table 2. Spatial attributes of naturally regenerated white pine within canopy and understory treatments at NH-SEED.
TreatmentNearest Neighbor (m)Nearest Seed Tree (m)
MinMean ± SEMaxMinMean ± SEMax
Advance Regeneration (n = 156)0.19.8±0.960.82.461.6±3.5199.4
Clearcut (n = 48)0.38.8±1.660.82.448.2±5.6133.6
Control * (n = 39)0.38.6±1.860.82.441.0±6.4133.6
Scarification (n = 9)1.69.8±3.431.568.479.6±3.399.2
Shelterwood―High Residual (n = 23)1.714.5±2.544.99.173.6±9.7153.2
Control (n = 14)5.515.1±3.043.19.172.1±11.3143.3
Scarification (n = 9)1.713.7±4.444.916.175.8±17.5153.2
Shelterwood―Low Residual (n = 43)1.712.4±1.748.32.563.8±8.6199.4
Control (n = 36)1.711.1±1.848.32.560.1±8.9199.4
Scarification (n = 7)6.518.9±4.748.331.882.7±25.0192.2
Single-Tree Selection (n = 42)0.15.8±1.245.211.968.2±3.7139.5
Control (n = 34)0.15.2±1.445.211.969.0±4.3139.5
Scarification (n = 8)2.08.6±2.020.251.464.8±6.2108.2
New Recruits (n = 81)0.112.3±2.1107.83.946.9±4.3212.6
Clearcut (n = 19)1.610.6±2.445.65.348.4±7.9135.0
Control (n = 17)1.711.0±2.745.65.344.2±8.2135.0
Scarification (n = 2)1.66.5±3.511.567.284.7±12.4102.3
Shelterwood―High Residual (n = 28)0.111.4±4.0107.29.631.2±4.4103.3
Control (n = 8)2.027.0±11.8107.29.653.2±11.9103.3
Scarification (n = 20)0.15.2±1.527.311.622.5±1.431.9
Shelterwood―Low Residual (n = 21)3.411.4±2.354.73.952.8±11.3212.6
Control (n = 16)3.49.0±1.018.83.939.3±9.9164.6
Scarification (n = 5)6.519.1±8.154.738.895.8±27.9212.6
Single-tree Selection (n = 13)1.018.2±7.8107.834.869.0±8.5141.2
Control (n = 7)1.018.5±13.8107.848.780.0±12.6141.2
Scarification (n = 6)10.117.9±5.145.234.856.1±8.598.5
* Note: Control and artificial tip-up treatments were combined for analysis.
Table 3. Frequency of forest health conditions observed on naturally regenerated white pine under canopy and understory treatments at NH-SEED.
TreatmentMechanical Damage (%)Browse (%)White Pine Weevil (%)# of Terminal Leaders Affected by Weevil Damage
Mean± SE
Advance Regeneration23.141.730.11.3±0.1
Clearcut7.110.911.51.4±0.2
Control *4.510.37.71.3±0.2
Scarification2.60.63.81.8±0.5
Shelterwood—High Residual5.12.67.11.2±0.2
Control3.81.92.61.3±0.3
Scarification1.30.64.51.1±0.2
Shelterwood—Low Residual8.37.78.31.2±0.2
Control7.16.48.31.2±0.2
Scarification1.31.30.00.0±0.0
Single-Tree Selection2.620.53.21.0±0.1
Control2.616.03.21.0±0.2
Scarification0.04.50.00.0±0.0
New Recruits5.814.13.81.0±0.1
Clearcut1.95.80.61.0±0.2
Control0.65.80.61.0±0.2
Scarification1.30.00.00.0±0.0
Shelterwood—High Residual0.61.93.21.0±0.2
Control0.01.31.31.0±0.3
Scarification0.60.61.91.0±0.2
Shelterwood—Low Residual1.93.20.00.0±0.0
Control1.93.20.00.0±0.0
Scarification0.00.00.00.0±0.0
Single-Tree Selection1.33.20.00.0±0.0
Control1.33.20.00.0±0.0
Scarification0.00.00.00.0±0.0
* Note: Control and artificial tip-up treatments were combined for analysis.
Disclaimer/Publisher’s Note: The statements, opinions and data contained in all publications are solely those of the individual author(s) and contributor(s) and not of MDPI and/or the editor(s). MDPI and/or the editor(s) disclaim responsibility for any injury to people or property resulting from any ideas, methods, instructions or products referred to in the content.

