Article

Derivation and Application of Allometric Equations to Quantify the Net Primary Productivity (NPP) of the Salix pierotii Miq. Community as a Representative Riparian Vegetation Type

1
Department Bio and Environmental Technology, Seoul Women’s University, Seoul 01797, Republic of Korea
2
Center for Atmospheric and Environmental Modeling, Seoul 08375, Republic of Korea
3
National Institute of Ecology, Seocheon 33657, Republic of Korea
*
Author to whom correspondence should be addressed.
Forests 2025, 16(8), 1225; https://doi.org/10.3390/f16081225
Submission received: 21 May 2025 / Revised: 8 July 2025 / Accepted: 23 July 2025 / Published: 25 July 2025
(This article belongs to the Section Forest Inventory, Modeling and Remote Sensing)

Abstract

International efforts are underway to implement carbon neutrality policies in rapidly changing climate conditions. This situation has strongly demanded the discovery of novel carbon sinks. The Salix genus has attracted attention as a promising carbon sink owing to its rapid growth and efficient use as a biofuel in short-rotation cultivation. The present study aims to derive an allometric equation and conduct stem analysis as fundamental tools for estimating net primary productivity (NPP) in Salix pierotii Miq. stand, which is increasingly acknowledged as an important emerging carbon sink. The allometric equations derived showed a high explanatory rate and fitness (R2 ranged from 0.74 to 0.99). The allometric equations between DBH and stem volume and biomass derived in the process of stem analysis also showed a high explanatory rate and fitness (R2 ranged from 0.87 to 0.94). The NPPs calculated based on the allometric equation derived and stem analysis were 11.87 tonC∙ha−1∙yr−1 and 15.70 tonC∙ha−1∙yr−1, respectively. These results show that the S. pierotii community, recognized as the representative riparian vegetation, could play an important role as a carbon sink. In this context, an assessment of the carbon absorption capacity of riparian vegetation such as willow communities could contribute significantly to achieving carbon neutrality goals.

1. Introduction

Climate change is one of our most important global challenges, and comprehensive and effective policy establishment is urgently required to solve the problem. The changing climate influences almost all sectors of the global economy and is intricately intertwined with other major environmental threats such as population growth, desertification and land degradation, air and water pollution, biodiversity loss, and deforestation. To date, international efforts to combat climate change have fallen far short and have usually focused on industrial and energy sectors, i.e., sources of emissions [1,2,3].
For many years, the world has invested heavily in technology and engineering to combat climate change. Technology is a very important part of our efforts to tackle climate change, but we must remember that measures to cope with climate change should be comprehensive, including absorbing and removing greenhouse gases emitted, along with measures to reduce greenhouse gas emissions. Whether for mitigation or adaptation to climate change, conserving nature is a vital safety net. We already know how to manage, conserve, and restore nature and the benefits this can provide [4,5,6].
Riparian forests are known to be significant carbon sinks and thus are crucial systems that mitigate the effects of climate change and provide a regulatory ecosystem service [7,8,9,10]. Riparian forests are subjected to frequent floods and resulting geomorphologic processes, exhibiting high spatiotemporal variability with consequent high potential for long-term C storage. Sediment and nutrient changing patterns combined with water availability promote rapid changes in species composition, distribution, and density. These factors can lead to a higher biomass accumulation rate in riparian zones compared with terrestrial forest systems [11,12,13]. The evaluation of carbon absorption capacity by applying allometric equations is widely adopted across various ecosystems. Riparian zones established along rivers are increasingly gaining attention due to their complex plant assemblages and unique structural characteristics, particularly concerning their roles in carbon storage and climate regulation. Consequently, there is growing interest in understanding the unique carbon sequestration capacity of these ecosystems [14,15,16].
As plants absorb and store carbon through photosynthesis, biomass estimates of vegetation are necessary for evaluating carbon budgets and are a key element of carbon-dynamics models [17,18,19]. Ground-based measurements of biomass and NPP are also useful for calibrating and validating remote sensing models [20,21].
Direct measurement of vegetation biomass is time-consuming and labor-intensive, in addition to being costly [22], but allometric equations provide an efficient alternative to destructive sampling [23]. Allometry uses one or more plant dimensions (usually DBH, diameter at breast height) to estimate a separate dimension (e.g., stem volume) that is more difficult to obtain. Such allometric equations have been widely used to estimate biomass and carbon stocks [24,25,26,27].
Studies have shown that allometric equations can accurately estimate above-ground biomass (AGB), particularly in riparian forests dominated by species like willows (Salix spp.), alders (Alnus glutinosa (L.) Gaertn.), and poplars (Populus spp.). Such studies rely on species-specific equations for understanding the carbon absorption capacity, which use parameters like diameter at breast height (DBH) and tree height to assess biomass and carbon content accurately, often approximating carbon content as 50% of biomass weight [28,29].
Advanced techniques such as remote sensing and UAV-based imagery have enhanced the accuracy of allometric measurements. These technologies allow for detailed mapping of riparian zones, enabling researchers to assess carbon storage across entire landscapes and monitor changes over time, which is vital for conservation and management efforts. Implementing these methods supports the effective evaluation of riparian zones’ role in carbon sequestration, particularly in regions vulnerable to climate change impacts. However, these technologies require calibrating and validating through ground-based measurements [12,30,31].
Studies on the allometric equations for willow (Salix spp.) focus primarily on estimating AGB. Allometric equations help estimate biomass based on easily measurable attributes like stem diameter and height, which is particularly useful for biomass and carbon stock assessments. Studies have produced both genus-specific equations and a generalized equation that accurately estimates biomass across willow, alder (Alnus spp.), and bog birch (Betula pumila) species. This generalized equation showed a high correlation across multiple species, indicating its broad applicability for shrub biomass estimation in these environments [32,33,34].
Local, ecosystem-specific equations for willow tend to perform better than generalized models developed in other regions, as they account for regional variations in shrub structure and density. Studies highlight the reduced accuracy of these equations in smaller willow stems due to high variability in leafy biomass, which adds complexity to precise biomass prediction. Nevertheless, local equations developed specifically are found to be valuable in carbon budget models, wildlife habitat assessments, and biofuel potential studies within these regions [31].
This study aims to derive the allometric equation and to conduct stem analysis as a basic tool to estimate the NPP of the willow (S. pierotii Miq.) community, the representative riparian vegetation in Korea. Furthermore, evaluating the carbon absorption capacity of the willow community, which is emerging as an important carbon sink, using the allometric equation and expansion coefficients obtained from the results is another goal of this study.

2. Materials and Methods
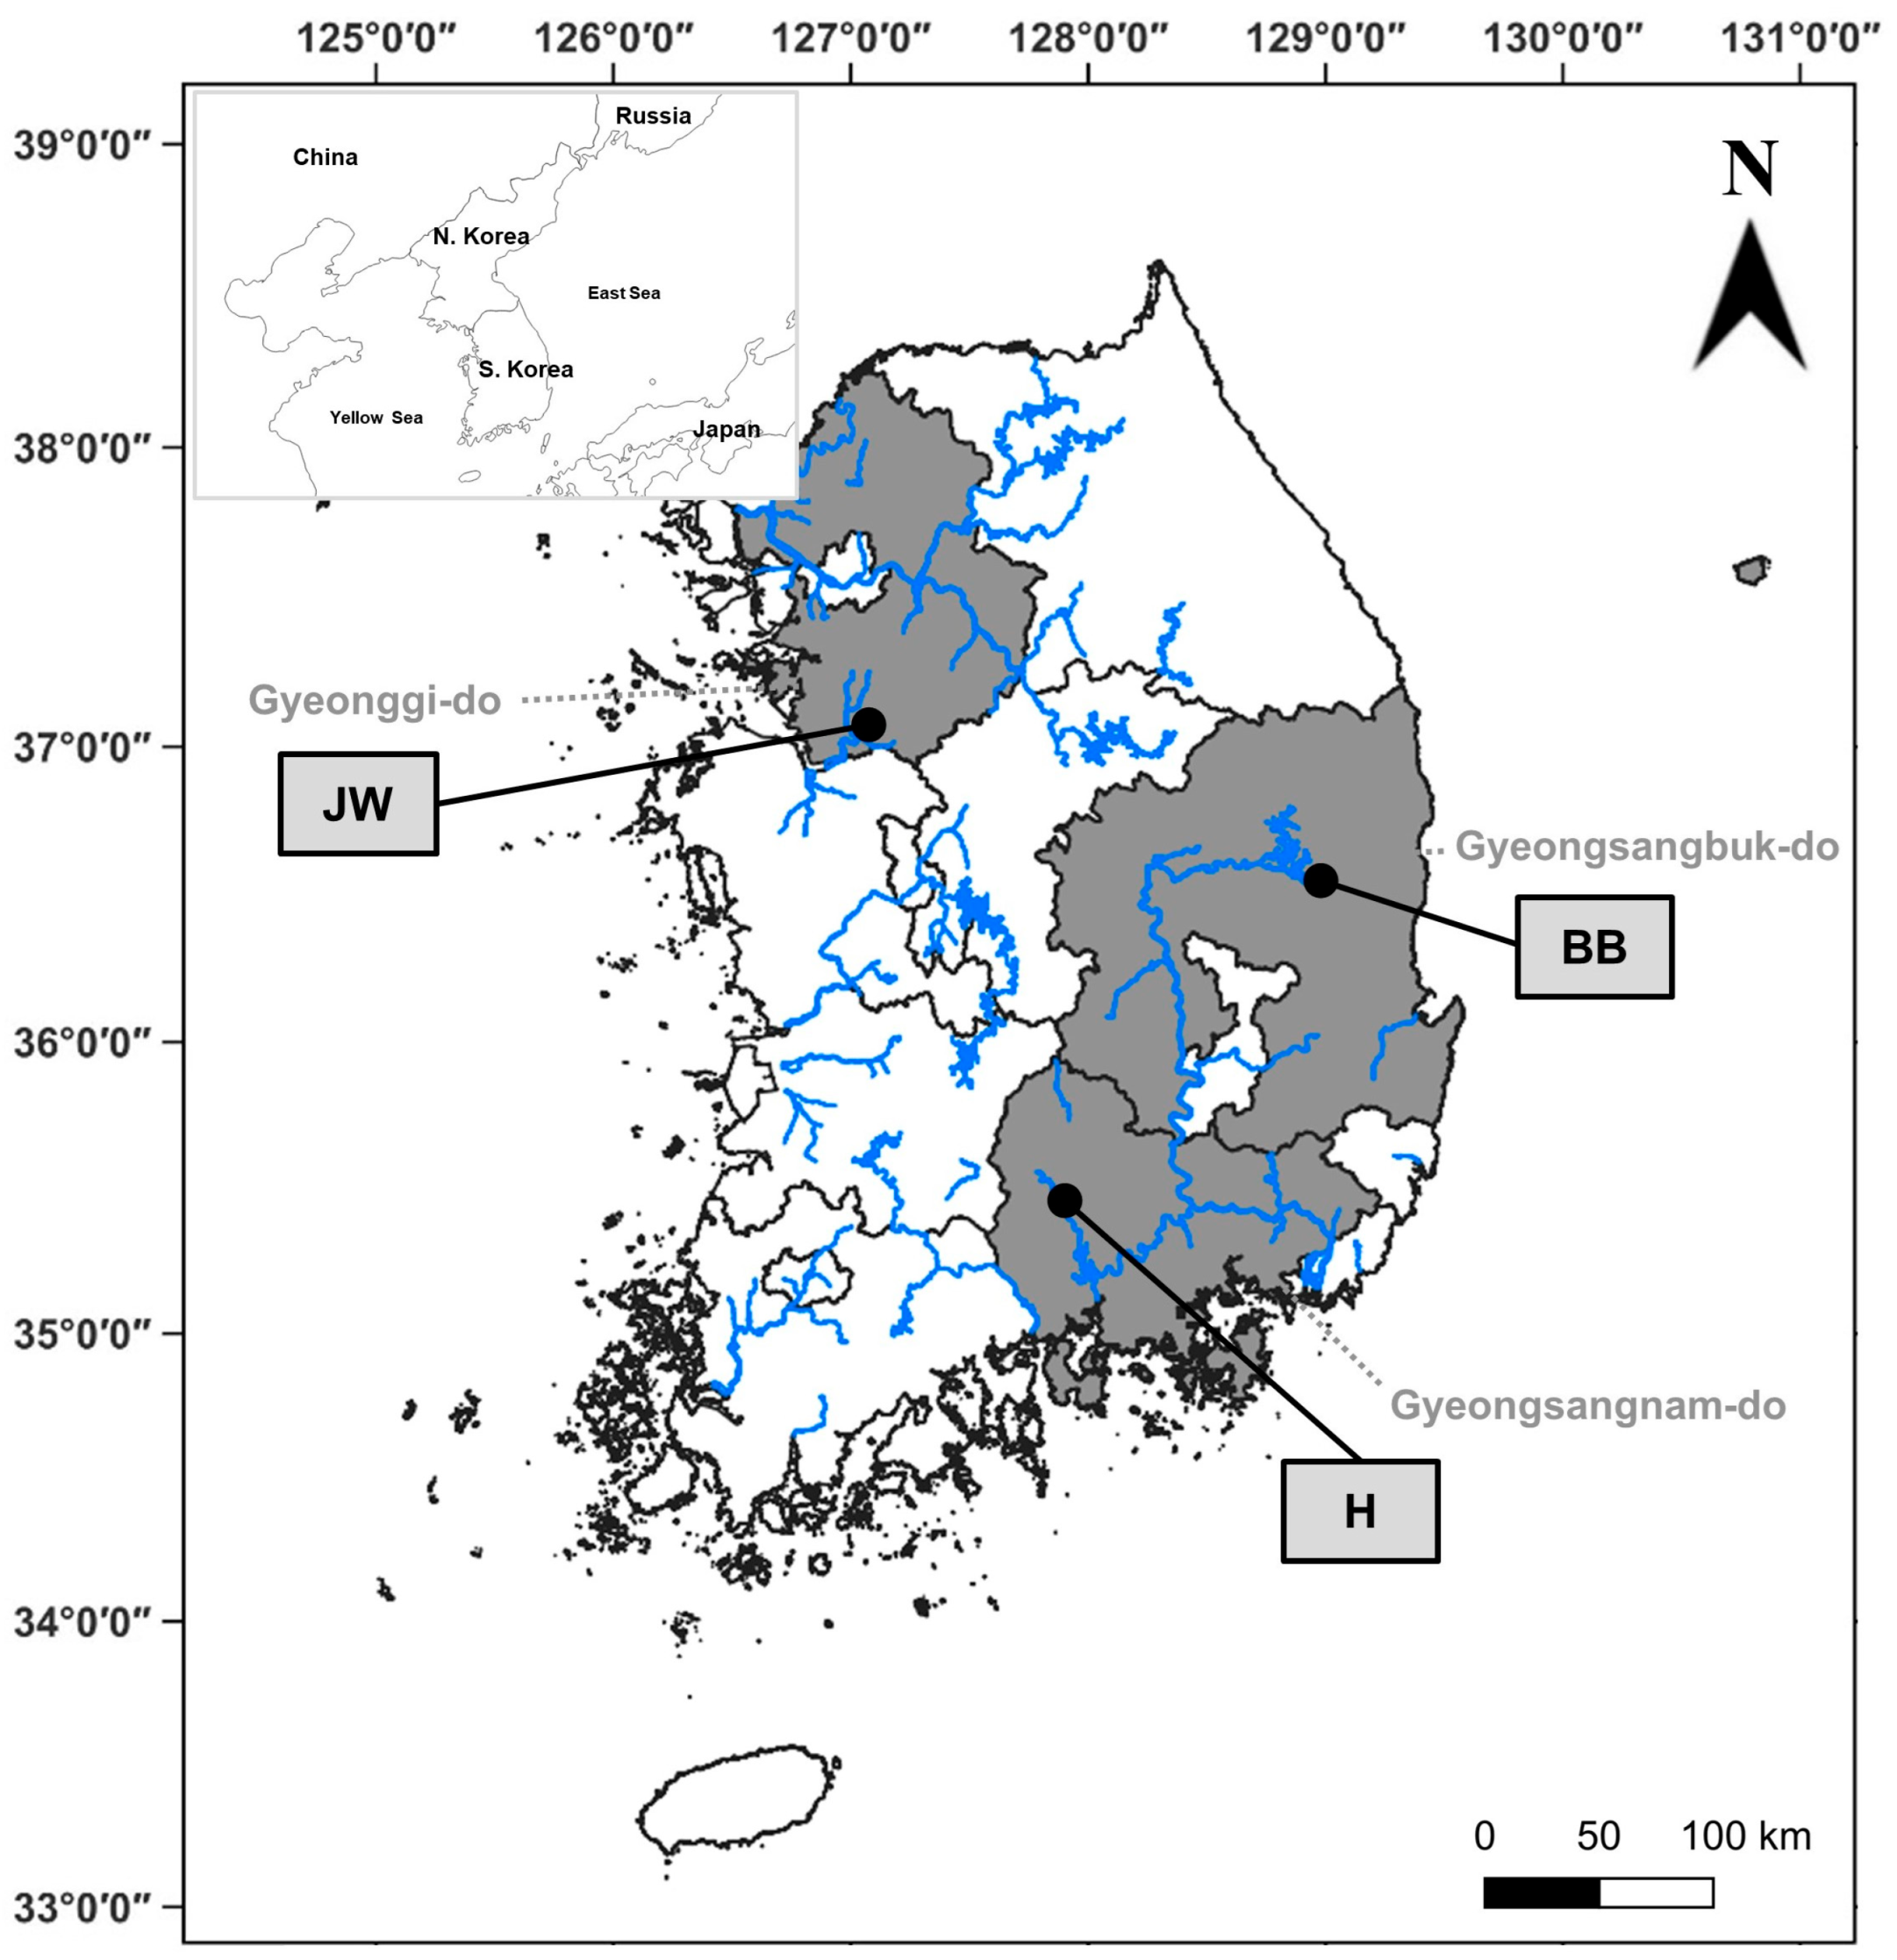
2.1. Study Site

The survey sites were selected by considering the geographical location to ensure even representation of climate conditions and accessibility for excavator entry to enable sampling (Figure 1). Jinwi River (JW), which belongs to the temperate deciduous broad-leaved forest zone, Banbyeon River (BB), which belongs to the eastern part of the warm temperate deciduous broad-leaved forest zone, and Hwang River (H), which belongs to the western part of the warm temperate broad-leaved forest zone, were selected as the survey sites [35,36].
The study sites were dominated by S. pierotii. The elevations ranged from 6 to 162 m and slopes ranged from 1.24 to 13.22 degrees (Table 1).

2.2. Field Sampling and Measurements

Sample trees of various sizes (total of 33 S. pierotii) were selected, and among them, individuals with normal canopies were excavated to derive the allometric equation of the S. pierotii community. The diameter at breast height (DBH) for the selected trees was measured, and the fresh weight of the excavated individuals was measured by dividing them into stems, branches, leaves, and roots in the field. Then, a part of each organ was sampled, transported to a laboratory, and oven-dried at 80 °C to a constant weight. The moisture content was calculated from the difference between the fresh and dry weights.

2.3. Measurement of Carbon Stock and Net Primary Productivity (NPP)

Biomass was calculated using two methods: an allometric equation and stem analysis. The regression equation between the diameter (DBH) and the dry weight of each component was obtained using the dry weight by organ of the excavated sample tree, and an allometric equation was applied (Equation (1)).
Y = aXb
log Y = log a + b log X
Y: estimated standing crop.
X: DBH.
a: regression coefficient.
b: slope of the regression line.
In the stem analysis, the volume of the stems was calculated by applying Equation (2) to the disks collected at intervals of 1 to 2 m. In cases where the final length of the top part was less than 2 m, the conical volume formula was used. For stem analysis, disks were collected at 0.2 m and 1.2 m above ground level and subsequently at 2 m intervals along the stem. The current and 5-year-ago volumes were calculated by applying the Huber method based on the diameter of each disk. The biomass at two time points was derived by applying carbon coefficients (WD, BEF, and R) to the calculated volume. Wood density (WD) was obtained by dividing the biomass of the stem by its volume. The biomass expansion factor (BEF) was calculated as the stem dry weight ratio to the sum of the dry weight of each component of the sample tree. The root ratio (R) was obtained as the ratio of below-ground to above-ground biomass.
Volume of stem (cm3) = Σ{(D/2)2 × π × 200)} + (d/2)2 × π × t × 1/3
D: diameter (cm) of each disk excluding the final disk (uppermost part).
π: circumferential ratio (3.1416).
200: length of divided stems (cm).
d: diameter of the final disk (uppermost part) (cm).
t: length of upper most part (final disk collection site) (cm).
1/3: conical volume ratio.
To evaluate the NPP, two permanent quadrats of 100 m2 (10 m × 10 m) were established, and then the density of willow trees that appeared in them was examined. Disk samples for measuring diameter growth were collected by logging a total of 33 individuals, including 9, 14, and 10 individuals in Jinwi, Banbyeon, and Hwang Rivers, respectively, outside of the survey plot. Because the annual ring growth in 2024, the study year, was not yet complete, diameter growth was measured up to 2023. Diameter growth was measured in mm units using a Vernier caliper (Sigma-Aldrich, Schnelldorf, Germany) for the entire growth period. Diameter growth was taken as the mean of the two measurements after measuring long and short diameters.
The NPP of the S. pierotii individual was calculated as the mean annual change in biomass after obtaining the annual biomass by substituting the diameter measured by year into the allometric equation derived. The NPP of the S. pierotii stand was calculated by multiplying the density of the willow stand by the NPP of an individual willow [37].
In stem analysis, the NPP was estimated based on tree volume. The volume was converted to biomass by applying WD, BEF, and the root ratio.
The amount of carbon and CO2 was estimated by applying the carbon fraction of the IPCC [38].

2.4. Statistical Test of the Allometric Equation

The measured data, DBH and biomass, are nonlinear data and need to be converted into linear data. Therefore, the measured values were converted into linear data by taking logs (Equation (1)), and normality verification was performed through the Shapiro–Wilk test. The accuracy verification of the calculated regression equation indicated the explanatory rate of the regression equation through R2. The difference and variance between predicted and measured values were verified through root mean squared error (RMSE), mean absolute error (MAE), and mean percentage error (MPE).
RMSE = i = 1 n y i y ^ i 2 n
MAE = 1 n i = 1 n y i y ^ i
MPE = 100 n i = 1 n ( y i y ^ i y i )
n: number of sample trees;
y: measured biomass of sample trees;
ŷ: estimated biomass of sample trees using the allometric equation.

3. Results

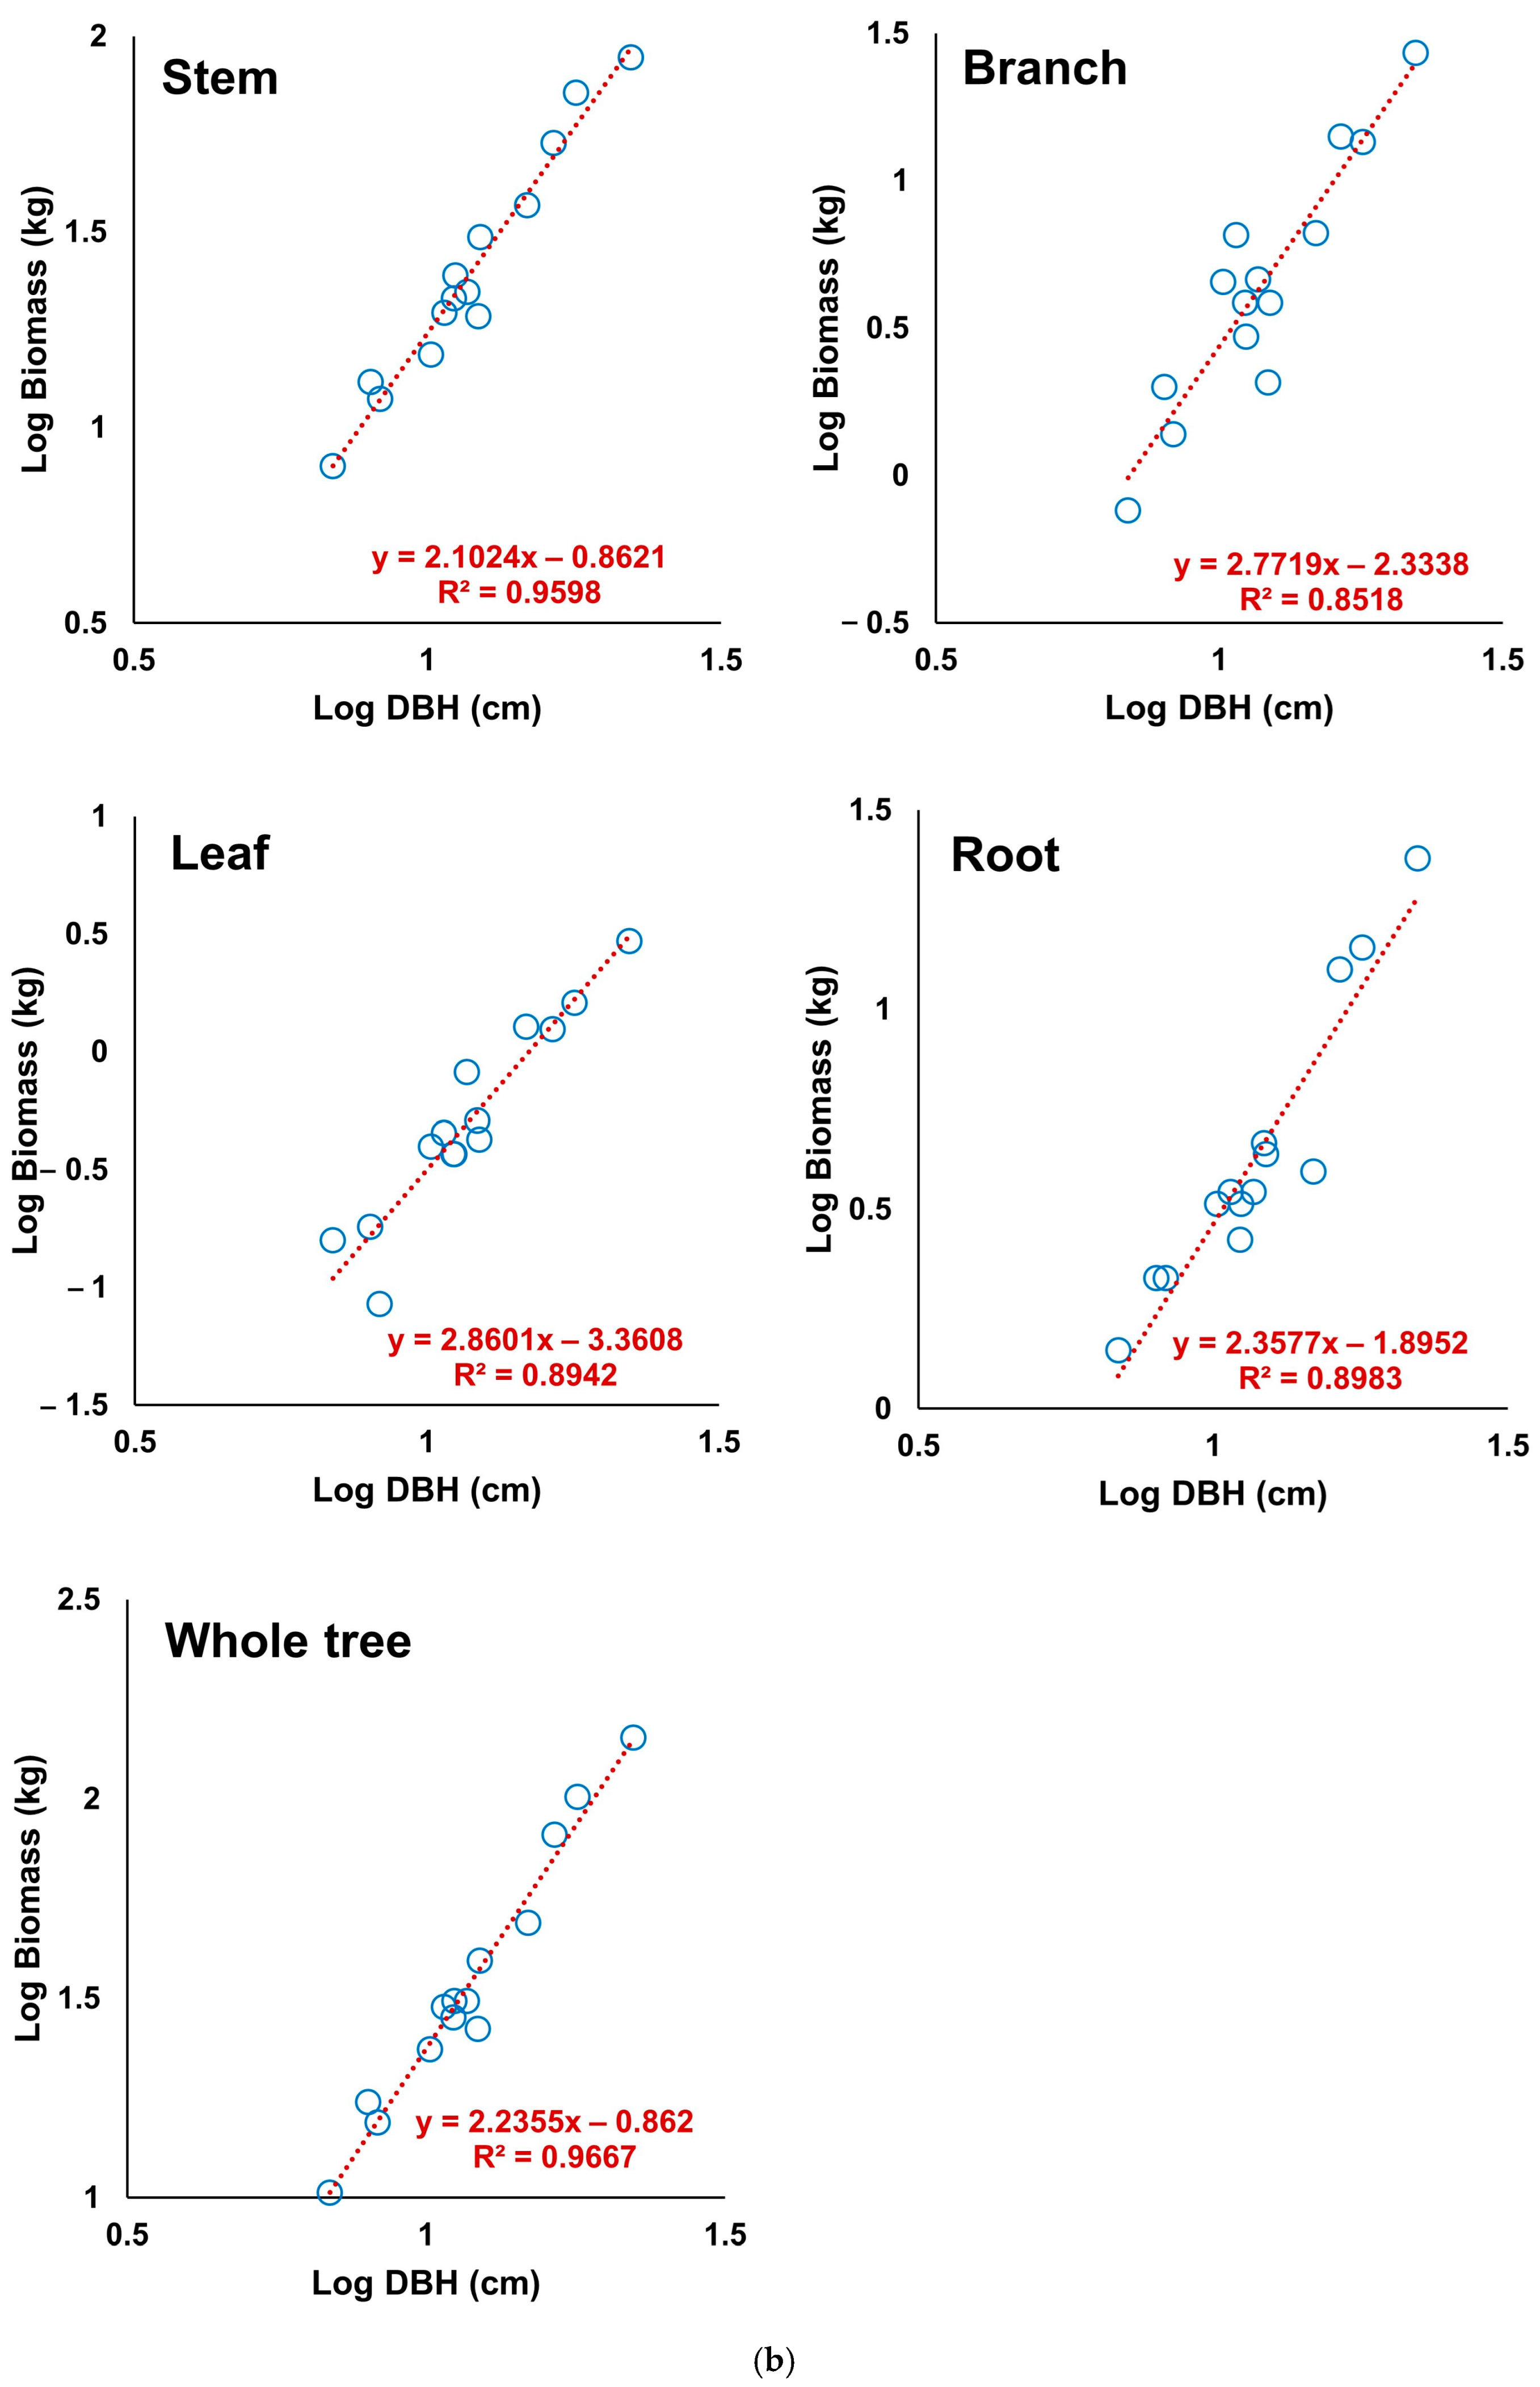
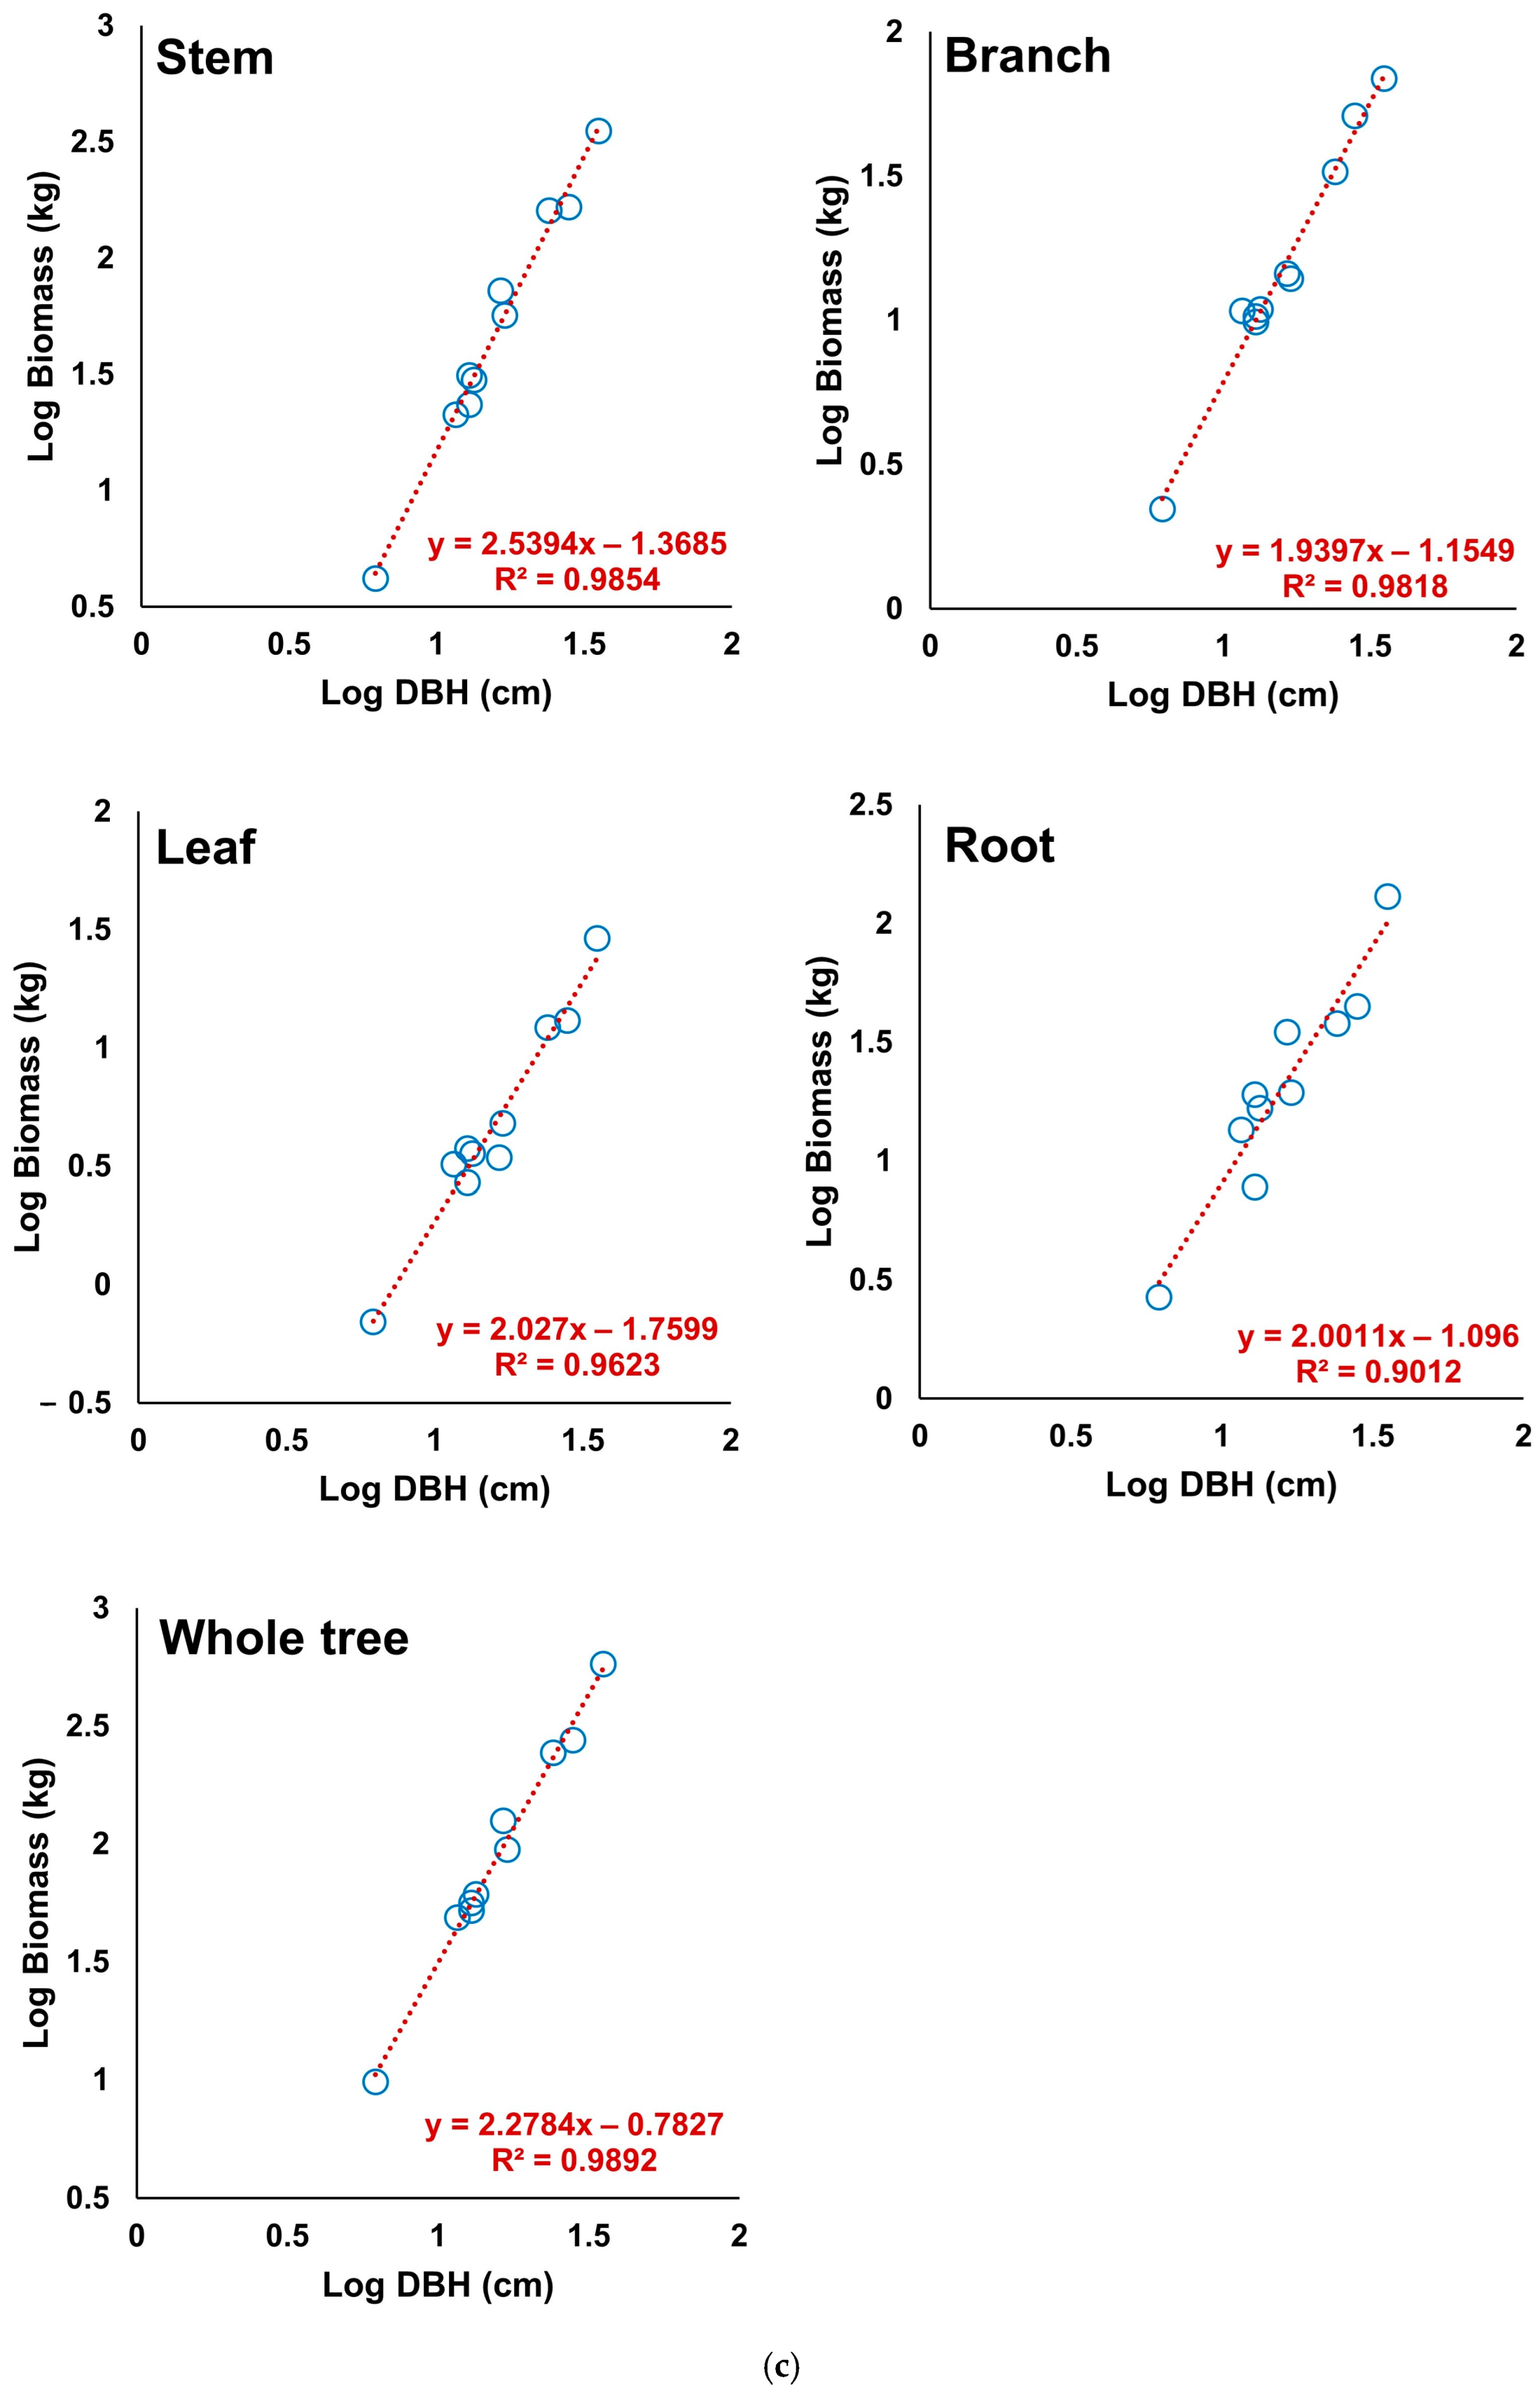
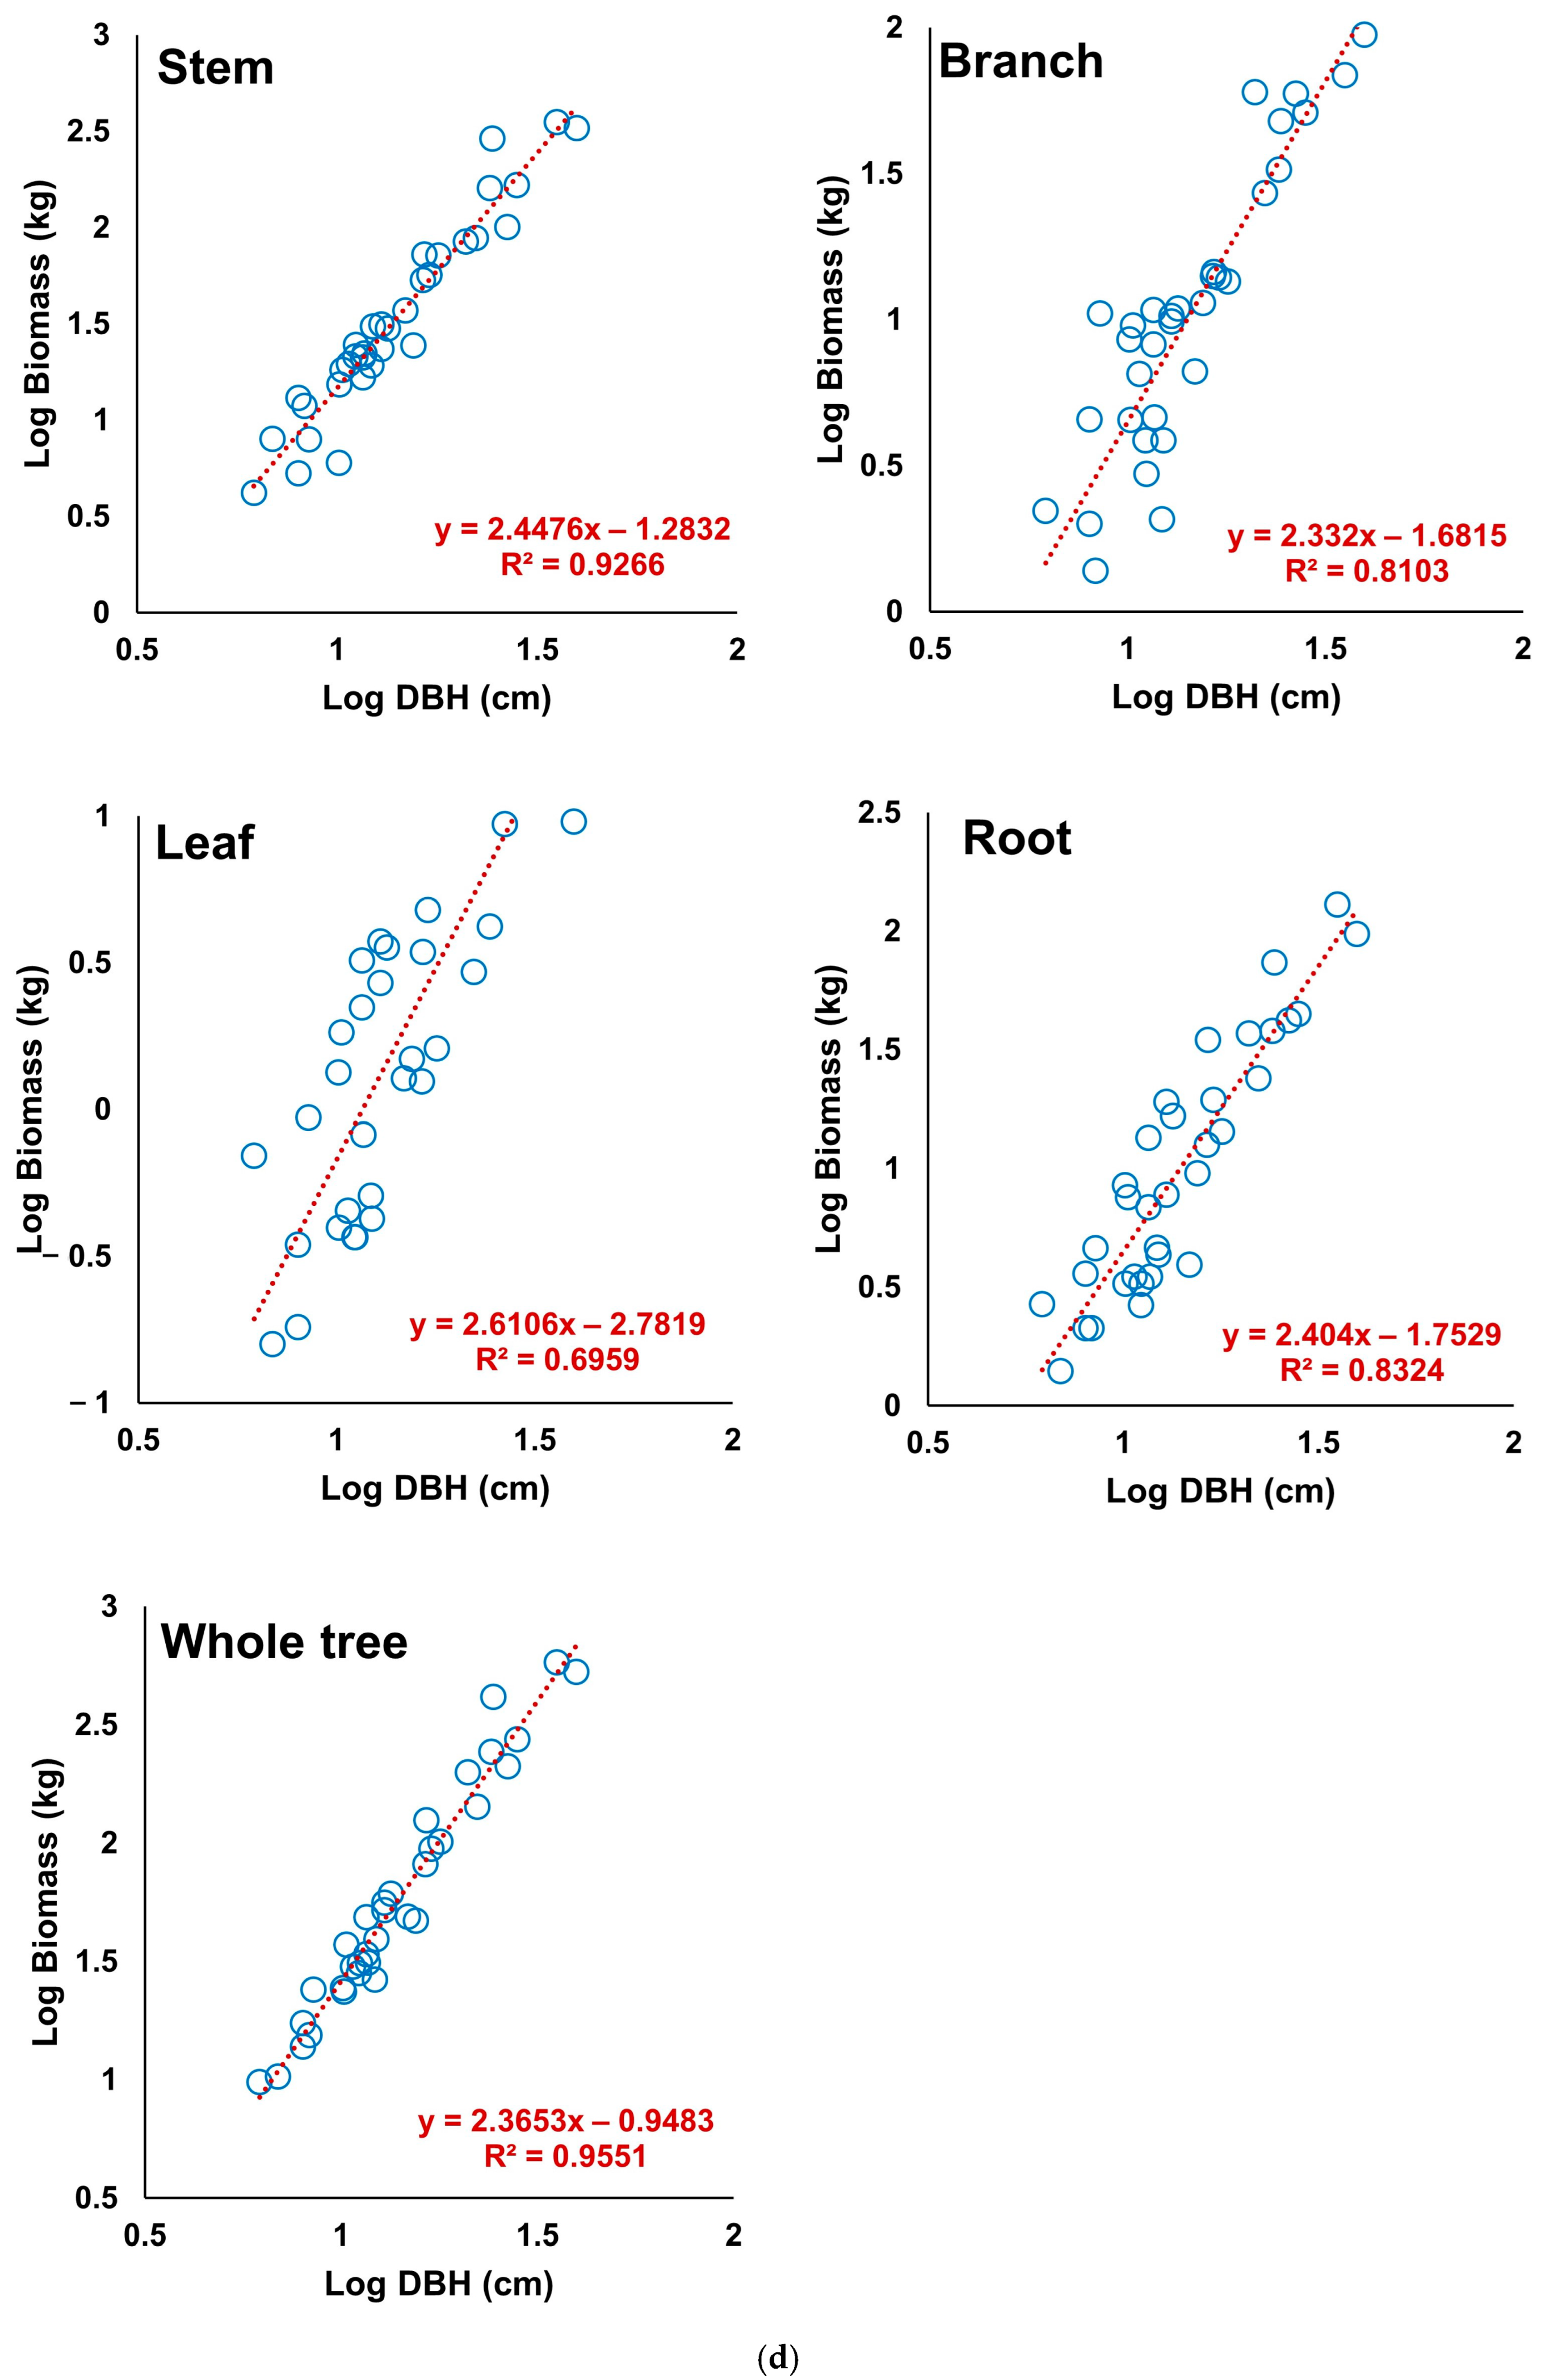
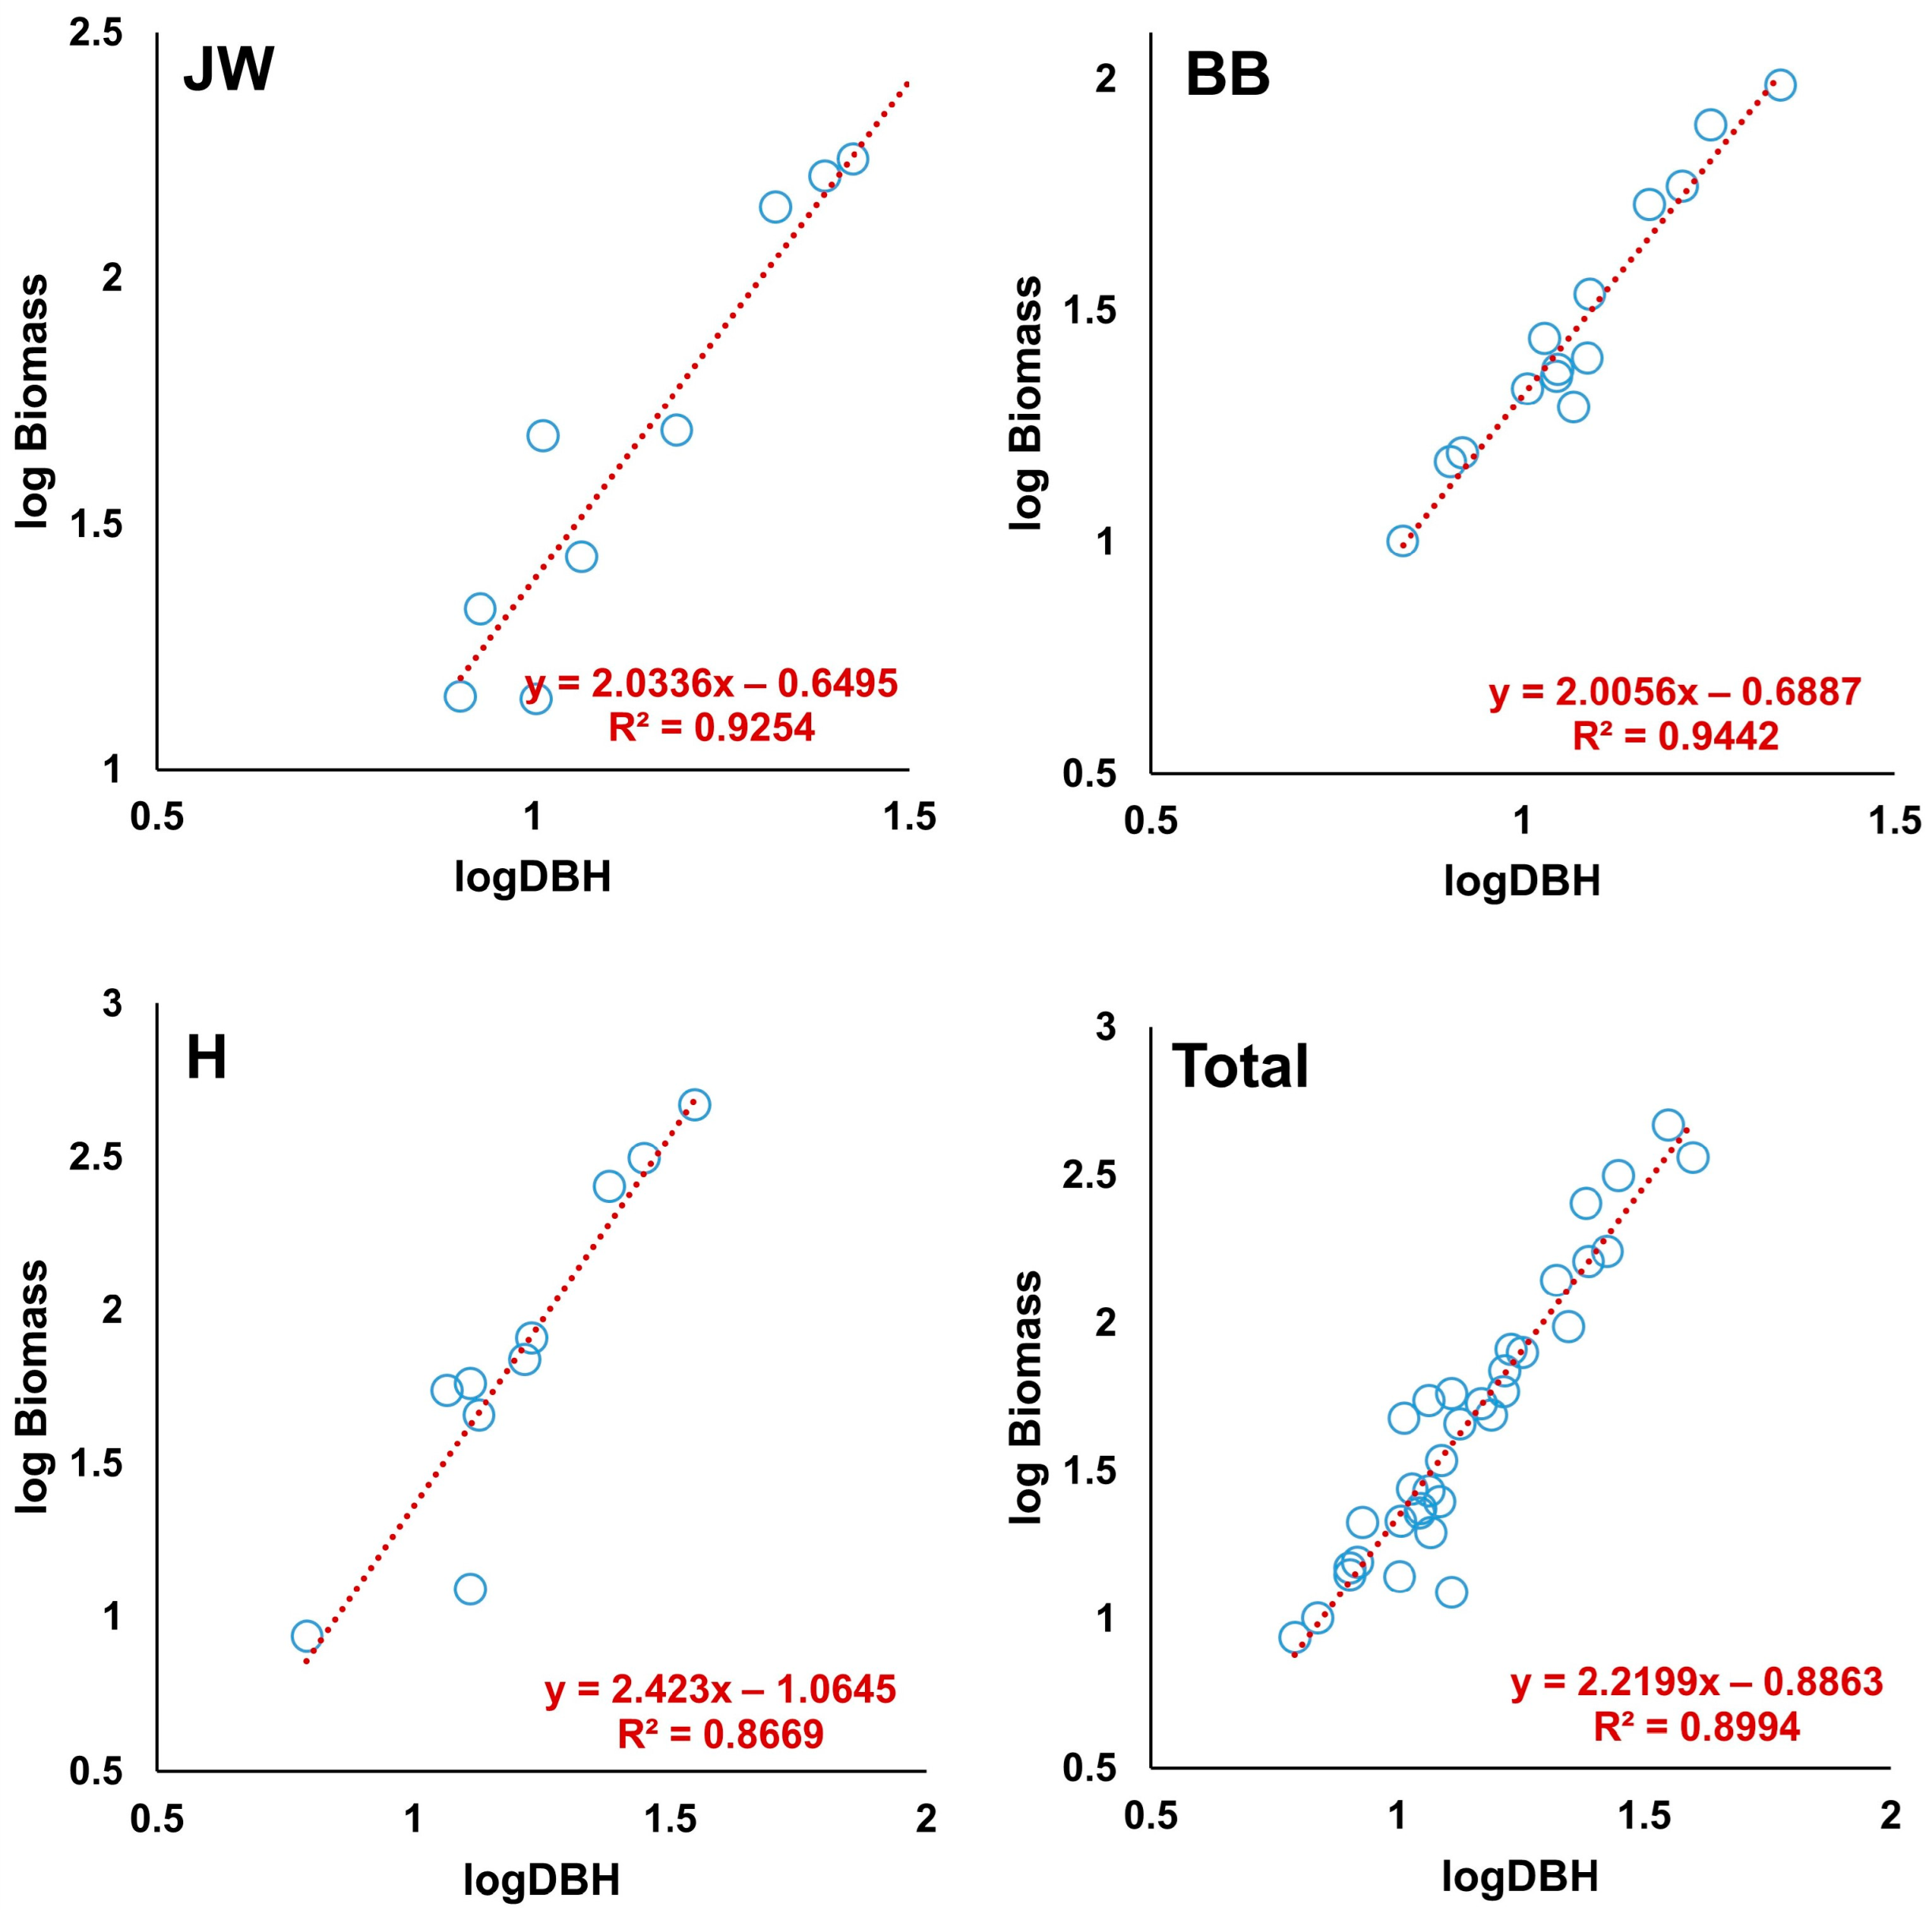
3.1. Derivation of the Allometric Equation of S. pierotii

The allometric equation was derived from the correlation between the diameter at breast height (DBH) and dry weight of willow (S. pierotii) excavated in three study sites (JW, BB, and H) and by summing the results obtained at the three sites (Figure 2). The DBH was significantly correlated with the dry weight of each component and the whole tree, and the allometric equations derived showed high explanatory rates in the four study cases mentioned above (R2 ranged from 0.6959 to 0.9854 in each component and from 9351 to 9891 in the whole tree) (Figure 2a–d).

3.2. Assessment of the Derived Allometric Equation

Table 2 shows the variables used to evaluate the fitness of the allometric equations derived in S. pierotii communities. The explanation rates of the allometric equation derived in Jinwi River ranged from 73.81 to 93.51% in each component and the whole tree. The RMSE, MAE, and MPE of the equations in each component and the whole tree of Jinwi River ranged from 0.13 to 0.26 (kg), 0.10 to 0.20 (kg), and −0.02 to 0.06 (%), respectively. The explanation rates of the allometric equation derived in Banbyeon River ranged from 85.18 to 96.67% in each component and the whole tree. The RMSE, MAE, and MPE of the equations in each and the whole tree of Banbyeon ranged from 0.06 to 0.16 (kg), 0.04 to 0.12 (kg), and −0.18 to 0.02 (%), respectively. The explanation rates of the allometric equation derived in Hwang River ranged from 90.12 to 98.92% in each component and the whole tree. The RMSE, MAE, and MPE of the equations in each component and the whole tree of Hwang River ranged from 0.05 to 0.14 (kg), 0.04 to 0.12 (kg), and −0.19 to 0.00 (%), respectively. The explanation rates of the allometric equation derived by combining the results collected from all the sites ranged from 67.49 to 89.68% in each component and the whole tree. The RMSE, MAE, and MPE of the equation ranged from 0.15 to 0.32 (kg), 0.12 to 0.28 (kg), and −4.01 to 11.40 (%), respectively.

3.3. NPPs of Individuals and Stands of S. pierotii Based on the Allometric Method

The density and net primary productivity of the individual willows and willow stands established in Jinwi, Banbyeon, and Hwang Rivers are shown in Table 3. The net primary productivity (NPP) of individual willows calculated based on the allometric method was 4.52 (ton C∙ha−1∙yr−1), 1.85 (ton C∙ha−1∙yr−1), and 7.03 (ton C∙ha−1∙yr−1) in Jinwi, Banbyeon, and Hwang Rivers, respectively, and the mean NPP was 4.47 (ton C∙ha−1∙yr−1).
The net primary productivity of the willow stands calculated based on the allometric method was 11.30 (ton C∙ha−1∙yr−1), 5.35 (ton C∙ha−1∙yr−1), and 18.98 (ton C∙ha−1∙yr−1) in Jinwi, Banbyeon, and Hwang Rivers, respectively, and the mean NPP was 11.87 (ton C∙ha−1∙yr−1).

3.4. Conversion Coefficients by Component Derived to Estimate Biomass in Stem Analysis

The biomass conversion coefficients required to estimate stand biomass are shown in Table 4. The ratios of the branch, leaf, and root biomass to the stem biomass were 0.32, 0.04, and 0.37 in Jinwi River. The ratios were 0.22, 0.02, and 0.20 in Banbyeon River and 0.25, 0.08, and 0.36 in Hwang River. The mean ratios of the three sites were 0.27, 0.06, and 0.33. The ratios of the root biomass to the AGB were 0.27, 0.16, and 0.27 in Jinwi River, Banbyeon River, and Hwang River, respectively. The mean ratio of the root biomass to the AGB was 0.25.
The expansion factors derived in the studied rivers were shown in Table 5. The wood densities were 0.80 (kg m−3), 0.46 (kg m−3), and 0.64 (kg m−3) in Jinwi, Banbyeon, and Hwang River, respectively, and the mean wood density was 0.63 (kg m−3). The biomass expansion factors were 1.79, 1.21, and 1.44 in Jinwi, Banbyeon, and Hwang River, respectively, and the mean biomass extension factor was 1.45. The root ratios to AGB were 0.28, 0.15, and 0.31 in Jinwi, Banbyeon, and Hwang River, respectively, and the mean root ratio to AGB was 0.24.

3.5. Derivation of the Allometric Equations of S. pierotii Based on Stem Analysis

The allometric equations were derived from the correlation between the diameter at breast height (DBH) and stem volume of willows excavated in the three study sites (Figure 3). The DBH was significantly correlated with stem volume, and the allometric equations showed an explanatory rate (R2) from 0.8948 to 0.9628 (Figure 3).
The allometric equations were derived from the correlation between the diameter at breast height (DBH) and the biomass derived from stem analysis (Figure 4). The DBH was significantly correlated with stem volume, and the allometric equations showed an explanatory rate (R2) from 0.8948 to 0.9628 (Figure 4).

3.6. Assessment of the Allometric Equation Derived from Stem Analysis

Table 6 shows the variables derived to evaluate the fitness of the allometric equations derived in stem analysis. The explanation rate of the allometric equation derived in Jinwi River was 92.54% for the whole tree. The RMSE, MAE, and MPE of the equation were 1.38 (kg), 1.37 (kg), and −0.87 (%), respectively. The explanation rate of the allometric equation derived in Banbyeon River was 94.42% for the whole tree. The RMSE, MAE, and MPE of the equation were 1.38 (kg), 1.38 (kg), and −1.91 (%), respectively. The explanation rate of the allometric equation derived in Hwang River was 86.69% for the whole tree. The RMSE, MAE, and MPE of the equation were 2.14 (kg), 2.13 (kg), and −1.29 (%), respectively. The explanation rate of the allometric equation derived by combining the results collected at three study sites was 89.94% for the whole tree. The RMSE, MAE, and MPE of the equation were 1.64 (kg), 1.60 (kg), and −12.01 (%), respectively.

3.7. NPPs of Individuals and Stands of S. pierotii Based on Stem Analysis

The stand densities and NPPs of the individual willows and the willow stands established in Jinwi, Banbyeon, and Hwang Rivers are shown in Table 7. The NPPs of individual willows were 8.17 (kgC∙yr−1), 2.16 (kgC∙yr−1), and 7.60 (kgC∙yr−1) in Jinwi, Banbyeon, and Hwang Rivers, respectively, and the mean was 5.98 (kgC∙yr−1). The NPPs of the stands, which were calculated by multiplying the density by the NPP of the individual willow, were 20.41 (tonC∙ha−1∙yr−1), 6.28 (tonC∙ha−1∙yr−1), and 20.52 (tonC∙ha−1∙yr−1) in Jinwi, Banbyeon, and Hwang Rivers, respectively, and the mean NPP was 15.74 (tonC∙ha−1∙yr−1).

4. Discussion

4.1. Comparison of Two Approaches

When comparing the fitness of the allometric equation and the stem analysis, the former method showed a relatively better result (Table 1 and Table 5). This may be because in stem analysis, values are estimated through an indirect method of multiplying the volume by the wood density, whereas the allometric method directly uses the changes in biomass and DBH. The willow stands in the riparian zone are regularly exposed to flooding disturbances, unlike forest vegetation, which is established in a relatively stable environment. Thus, the tree shape was different from that of forest trees, and branching frequently occurred; thus, the biomass of branches was high. Therefore, it can be suggested that the accuracy will be lower if the NPP of willow stands is estimated using stem analysis, which has been applied to the NPP estimation of forest vegetation. In this regard, it is considered more appropriate to estimate the NPP of willow stands by applying the allometric method.
When comparing the NPPs of individual willows calculated by the allometric equation and by stem analysis, the NPP calculated by applying the latter method was relatively higher (Table 2 and Table 6). This is likely due to the fact that the allometric method, which is based on the stem volume, focuses on the growth of stems, which account for a large proportion of the biomass.
The allometric method is a widely used approach to estimate the carbon absorption (or sequestration) capacity of forests. It relies on mathematical relationships, called allometric equations, which link tree dimensions (e.g., diameter, height) to biomass. The allometric method has advantages, as follows: This method is non-destructive and quick, making it ideal for large-scale or long-term studies. It also requires less labor and is cost-effective. In addition, it can be applied to diverse species and forest types with appropriate equations.
However, the allometric method also has limitations, as follows: First of all, the accuracy of the method depends on the suitability and precision of the allometric equations for the specific species, region, or forest type. In addition, it may introduce errors if the chosen equations are not validated for the study area [39,40,41,42,43].
Stem analysis is a method used to evaluate the carbon absorption capacity of forests by studying the growth and biomass accumulation of individual trees over time. It involves examining the cross-sections of tree stems to gain insights into past growth patterns, carbon sequestration rates, and overall forest productivity. Stem analysis, while detailed and informative, is labor-intensive and typically applied to a limited number of trees.
The advantages of stem analysis are as follows: First of all, this method provides a detailed, tree-specific growth history. In addition, stem analysis is highly accurate for reconstructing past growth and carbon accumulation. Meanwhile, this method is destructive. For example, stem analysis requires tree felling, which limits its application in large-scale studies or conservation-sensitive areas. In addition, this method is time-consuming and labor-intensive [1,44,45].
In practice, these two methods are complementary. Stem analysis is used to develop and refine allometric equations, while allometric methods are applied for scaling up carbon estimation across large areas. Therefore, by combining both approaches, researchers can achieve detailed and scalable estimates of carbon absorption capacity [46,47,48].

4.2. NPP of the Willow Community

The calculated NPP of the willow community was found to be significantly higher than that of forest vegetation reported in Korea [49,50,51]. This is because the riparian zone where the willow community is established has higher fertility and better moisture conditions than the upland forest area [13,52].
Moreover, establishing early successional vegetation with relatively high productivity due to frequent disturbances could be another factor [53,54]. In addition, the productivity was found to be higher than that of other willow trees studied in Korea [48]. Such differences are believed to be the result of the larger and more diverse DBH range of the willow trees measured in this study. In addition, the environmental characteristics of this study site, which is exposed to more frequent flooding than the relatively stable Upo Swamp, would have impacted the result. On the other hand, when compared to the NPP of the riparian vegetation of other countries worldwide, the value was higher or similar [55,56,57,58].

4.3. Methods of Measuring the Absorption Capacity of New Carbon Sinks

Forests are important terrestrial carbon sinks, but human land use and the resulting anthropogenic climate change have significantly reduced the size of these ecosystems. Although forests cannot substitute all emission reductions, the conservation, restoration, and sustainable management of diverse forests can contribute to achieving global climate and biodiversity conservation goals [59,60].
Climate change at the global level is considered the greatest threat to all life on Earth, and despite various efforts, it is increasing in severity. REDD+ (reducing emissions from deforestation and forest degradation) was developed under the United Nations Framework Convention on Climate Change (UNFCCC) to restore and preserve forests by giving value to their carbon sequestration capacity [61,62,63,64]. It aims to preserve, restore, and sustainably manage forests to enhance carbon sequestration [65]. Information on the rate of forest transformation and carbon stocks at a specific time is required to quantify carbon emissions or avoided emissions [66,67]. A reliable estimation of forest carbon stocks is required to generate carbon credits under REDD+. The destructive or harvesting method is the most accurate method for estimating biomass. However, this method results in the loss of trees. Therefore, non-destructive allometric equation-based approaches that require only measurable parameters such as diameter, height, and wood-specific gravity (WSG) are among the best methods for estimating the biomass and the amount of carbon. The main source of error when estimating biomass and carbon content lies in the choice of allometric equation [68,69,70,71,72]. Forest biomass is often calculated using a standard general allometric equation, which is widely applied in many areas [73,74]. This method is prone to introducing errors in varying environmental conditions [74,75,76,77]. However, the use of site-specific allometric equations can minimize errors in biomass estimation [74,75,76,77]. In addition, errors in biomass estimation may occur when the allometric equation is applied beyond the diameter range used to derive it [78]. Thus, the use of separate equations depending on the diameter range can reduce these errors and increase their accuracy [26,61,68,70,74,79,80,81].
Wetlands are an important carbon sink and have a significant impact on greenhouse gas reduction [82,83]. To reveal the carbon absorption capacity of wetlands, many researchers have evaluated this metric [37,82,84]. Methods of measuring the carbon of wetlands can be divided into three types: direct measurement method, model estimation method, and remote sensing method [85]. Direct measurement is used to directly measure the carbon flux between water, vegetation, soil, and the atmosphere. This method is usually used to make small-scale measurements or to verify the results of large-scale or regional-scale estimates [85,86]. However, this method requires damaging vegetation to obtain information, and large-scale measurements are difficult due to limited data [87,88]. Nevertheless, it remains highly valuable as the most accurate method for reflecting the field situation. Furthermore, if the measured data are linked with indirect methods, the range of use can be expanded [42].

4.4. The Importance of Securing New Carbon Sinks

Although climate change problems require the development of comprehensive solutions, including sources of emission and absorption, absorption source sectors such as forests have not been treated as an integral part in climate change policies so far. The world has a variety of solutions to help combat climate change. Protecting and better managing natural resources is a cost-effective and efficient way to stabilize greenhouse gas emissions when we make a transition to a sustainable, low-carbon world in the future. Natural resources can also help us adapt to the impacts of climate change that we already face. This is an opportunity we cannot give up [87,88,89].
Conserving nature can help us to reduce greenhouse gas emissions (mitigation) and adapt to the impacts of climate change. The biodiversity found in nature can benefit the Earth in the same way that a healthy immune system can benefit individuals. Biodiversity can help us to be more productive and adapt to change, while its loss can make us more vulnerable to it [90,91,92].
Securing carbon absorption sources, often called carbon sinks, is crucial for mitigating climate change. Carbon sinks, such as forests, oceans, peatlands, and soils, play a vital role in absorbing carbon dioxide (CO2) from the atmosphere, offsetting emissions and helping regulate the global carbon cycle. They help to reduce the concentration of CO2 in the atmosphere, which is the main greenhouse gas that contributes to global warming. By maintaining and strengthening these sinks, it is possible to delay climate change. Carbon sinks, forests and wetlands, in particular, additionally provide various ecosystem services such as biodiversity conservation, water purification, and flood control. In addition, natural carbon sinks, including forests, support industries such as tourism, agriculture, and fishing. Therefore, if the quality of these sinks is degraded, it can lead to economic loss. Furthermore, carbon sinks also provide cultural ecosystem services to people who depend on natural ecosystems for their livelihoods, cultures, and traditions [93,94,95].
We can secure carbon sinks and improve their quality through a variety of methods. Conserving and restoring natural landscapes such as forests, wetlands, and oceans is one way of doing this [95,96,97]. Agroforestry, various types of intercropping, and sustainable land management such as reforming and afforestation can also contribute [97,98].

5. Conclusions

This study generated an allometric equation and biomass expansion coefficient, serving as fundamental tools to evaluate the NPP and carbon absorption capacity of S. pierotii, the dominant riparian vegetation type. The allometric equations derived by both methods showed a high explanatory rate and fitness. The NPPs of S. pierotii calculated by applying both methods were evaluated to be very high, and it was determined that the riparian vegetation type which they dominate would function as a significant carbon sink.
Although wetland ecosystems are widely recognized for their substantial carbon sequestration capacity, existing studies have primarily focused on blue carbon and soil carbon pools. However, riparian vegetation, characterized by rapid growth facilitated by high moisture availability, may represent an underexplored yet effective carbon sink. This study estimated carbon absorption capacity based on net primary productivity (NPP). In future studies, however, it is necessary to incorporate a carbon budget evaluation, measuring the amount of carbon emitted from soil where vegetation is established.

Author Contributions

Conceptualization, C.S.L.; methodology, B.S.L., J.S., S.J.J. and C.S.L.; software, B.S.L., J.S. and C.S.L.; validation, J.C.L. and C.S.L.; formal analysis, J.C.L. and C.S.L.; investigation, B.S.L., J.S., S.J.J. and C.S.L.; resources, C.S.L.; data curation, C.S.L.; writing—original draft preparation, C.S.L.; writing—review and editing, S.J.J. and C.S.L.; visualization, S.J.J. and C.S.L.; supervision, C.S.L.; project administration, C.S.L.; funding acquisition, C.S.L. All authors have read and agreed to the published version of the manuscript.

Funding

This work was supported by the Korea Environment Industry & Technology Institute (KEITI) through the Wetland Ecosystem Value Evaluation and Carbon Absorption Value Promotion Technology Development Project, funded by the Korea Ministry of Environment (2022003630002).

Institutional Review Board Statement

Not applicable.

Informed Consent Statement

Not applicable.

Data Availability Statement

The data are included in the manuscript.

Conflicts of Interest

The authors declare no conflicts of interest.

Abbreviations

The following abbreviations are used in this manuscript:
AGBAbove-ground Biomass
BEFBiomass Expansion Factor
DBHDiameter of Breast Height
MAEMean Absolute Error
MPEMean Percentage Error
NPPNet Primary Productivity
RRoot Ratio
RMSERoot Mean Squared Error
WDWood Density

References

  1. Wang, F.; Harindintwali, J.D.; Wei, K.; Shan, Y.; Mi, Z.; Costello, M.J.; Grunwald, S.; Feng, Z.; Wang, F.; Guo, Y. Climate Change: Strategies for Mitigation and Adaptation. Innov. Geosci. 2023, 1, 100015. [Google Scholar] [CrossRef]
  2. Rawat, A.; Kumar, D.; Khati, B.S. A Review on Climate Change Impacts, Models, and Its Consequences on Different Sectors: A Systematic Approach. J. Water Clim. Change 2024, 15, 104–126. [Google Scholar] [CrossRef]
  3. Singh, A.; Pope, F.D.; Radcliffe, J.; Luiu, C.; Bakare, H.; Bartington, S.E.; Bonsu, N.O.; Bryson, J.R.; Cheeseman, N.; Flowe, H. Delivering Sustainable Climate Action: Reframing the Sustainable Development Goals. npj Clim. Action 2024, 3, 110. [Google Scholar] [CrossRef]
  4. Olaleru, S.A.; Kirui, J.K.; Elegbeleye, F.I.; Aniyikaiye, T.E. Green Technology: Solution to Global Climate Change Mitigation. Energy Environ. Storage 2021, 1, 26–41. [Google Scholar] [CrossRef]
  5. Turrentine, J. What Are the Solutions to Climate Change. The Natural Resources Defense Council (NRDC) of The United States. 2022. Available online: https://www.nrdc.org/stories/what-are-solutions-climate-change (accessed on 5 November 2023).
  6. Ciocchi, P. Technology Use for Climate Change: Tech Solutions That Could Help Blog Lemu. Available online: https://le.mu/blog/technology/technology-use-for-climate-change/ (accessed on 25 April 2025).
  7. Cierjacks, A.; Kleinschmit, B.; Babinsky, M.; Kleinschroth, F.; Markert, A.; Menzel, M.; Ziechmann, U.; Schiller, T.; Graf, M.; Lang, F. Carbon Stocks of Soil and Vegetation on Danubian Floodplains. J. Plant Nutr. Soil Sci. 2010, 173, 644–653. [Google Scholar] [CrossRef]
  8. Rieger, I.; Kowarik, I.; Cierjacks, A. Drivers of Carbon Sequestration by Biomass Compartment of Riparian Forests. Ecosphere 2015, 6, 185. [Google Scholar] [CrossRef]
  9. Nakamura, F. Riparian Forests and Climate Change: Interactive Zone of Green and Blue Infrastructure. In Green Infrastructure and Climate Change Adaptation: Function, Implementation and Governance; Springer Nature: Singapore, 2022; pp. 73–91. [Google Scholar]
  10. Zhu, Y.; Liu, R.; Zhang, H.; Liu, S.; Zhang, Z.; Yu, F.-H.; Gregoire, T.G. Post-Flooding Disturbance Recovery Promotes Carbon Capture in Riparian Zones. Biogeosciences 2023, 20, 1357–1370. [Google Scholar] [CrossRef]
  11. Aishan, T.; Betz, F.; Halik, Ü.; Cyffka, B.; Rouzi, A. Biomass Carbon Sequestration Potential by Riparian Forest in the Tarim River Watershed, Northwest China: Implication for the Mitigation of Climate Change Impact. Forests 2018, 9, 196. [Google Scholar] [CrossRef]
  12. Fernandes, M.R.; Aguiar, F.C.; Martins, M.J.; Rico, N.; Ferreira, M.T.; Correia, A.C. Carbon Stock Estimations in a Mediterranean Riparian Forest: A Case Study Combining Field Data and UAV Imagery. Forests 2020, 11, 376. [Google Scholar] [CrossRef]
  13. Sutfin, N.A.; Wohl, E.E.; Dwire, K.A. Banking Carbon: A Review of Organic Carbon Storage and Physical Factors Influencing Retention in Floodplains and Riparian Ecosystems. Earth Surf. Process. Landf. 2016, 41, 38–60. [Google Scholar] [CrossRef]
  14. Glenday, J. Carbon Storage and Sequestration Analysis for the eThekwini Environmental Services Management Plan Open Space System; eThekwini Municipality Environmental Management Department: Durban, South Africa, 2007. [Google Scholar]
  15. Di Sacco, A.; Hardwick, K.A.; Blakesley, D.; Brancalion, P.H.; Breman, E.; Cecilio Rebola, L.; Chomba, S.; Dixon, K.; Elliott, S.; Ruyonga, G. Ten Golden Rules for Reforestation to Optimize Carbon Sequestration, Biodiversity Recovery and Livelihood Benefits. Glob. Change Biol. 2021, 27, 1328–1348. [Google Scholar] [CrossRef]
  16. Banoo, R.; Singh, D.; Khan, S.; Madiwalar, A.F.; Abbas, G. Agroforestry: A Practical Means of Achieving the “Net-Zero” Target. In Agroforestry Solutions for Climate Change and Environmental Restoration; Springer: Singapore, 2024; pp. 151–170. [Google Scholar]
  17. Zhuang, Q.; Shao, Z.; Gong, J.; Li, D.; Huang, X.; Zhang, Y.; Xu, X.; Dang, C.; Chen, J.; Altan, O. Modeling Carbon Storage in Urban Vegetation: Progress, Challenges, and Opportunities. Int. J. Appl. Earth Obs. Geoinf. 2022, 114, 103058. [Google Scholar] [CrossRef]
  18. Sun, W.; Liu, X. Review on Carbon Storage Estimation of Forest Ecosystem and Applications in China. For. Ecosyst. 2020, 7, 4. [Google Scholar] [CrossRef]
  19. Matthews, H.D.; Weaver, A.J.; Meissner, K.J. Terrestrial Carbon Cycle Dynamics under Recent and Future Climate Change. J. Clim. 2005, 18, 1609–1628. [Google Scholar] [CrossRef]
  20. Lefsky, M.A.; Harding, D.; Cohen, W.B.; Parker, G.; Shugart, H.H. Surface Lidar Remote Sensing of Basal Area and Biomass in Deciduous Forests of Eastern Maryland, USA. Remote Sens. Environ. 1999, 67, 83–98. [Google Scholar] [CrossRef]
  21. Kankare, V.; Räty, M.; Yu, X.; Holopainen, M.; Vastaranta, M.; Kantola, T.; Hyyppä, J.; Hyyppä, H.; Alho, P.; Viitala, R. Single Tree Biomass Modelling Using Airborne Laser Scanning. ISPRS J. Photogramm. Remote Sens. 2013, 85, 66–73. [Google Scholar] [CrossRef]
  22. Verwijst, T.; Telenius, B. Biomass Estimation Procedures in Short Rotation Forestry. For. Ecol. Manag. 1999, 121, 137–146. [Google Scholar] [CrossRef]
  23. Seidel, D.; Fleck, S.; Leuschner, C.; Hammett, T. Review of Ground-Based Methods to Measure the Distribution of Biomass in Forest Canopies. Ann. For. Sci. 2011, 68, 225–244. [Google Scholar] [CrossRef]
  24. Ter-Mikaelian, M.T.; Korzukhin, M.D. Biomass Equations for Sixty-Five North American Tree Species. For. Ecol. Manag. 1997, 97, 1–24. [Google Scholar] [CrossRef]
  25. Zianis, D.; Mencuccini, M. On Simplifying Allometric Analyses of Forest Biomass. For. Ecol. Manag. 2004, 187, 311–332. [Google Scholar] [CrossRef]
  26. Basuki, T.; Van Laake, P.; Skidmore, A.; Hussin, Y. Allometric Equations for Estimating the Above-Ground Biomass in Tropical Lowland Dipterocarp Forests. For. Ecol. Manag. 2009, 257, 1684–1694. [Google Scholar] [CrossRef]
  27. Kuyah, S.; Muthuri, C.; Wakaba, D.; Cyamweshi, A.R.; Kiprotich, P.; Mukuralinda, A. Allometric Equations and Carbon Sequestration Potential of Mango (Mangifera indica) and Avocado (Persea americana) in Kenya. Trees For. People 2024, 15, 100467. [Google Scholar] [CrossRef]
  28. Huylenbroeck, L.; Latte, N.; Lejeune, P.; Georges, B.; Claessens, H.; Michez, A. What Factors Shape Spatial Distribution of Biomass in Riparian Forests? Insights from a LiDAR Survey over a Large Area. Forests 2021, 12, 371. [Google Scholar] [CrossRef]
  29. Dahal, B.; Poudel, K.P.; Renninger, H.J.; Granger, J.J.; Leininger, T.D.; Gardiner, E.S.; Souter, R.A.; Rousseau, R.J. Aboveground Biomass Equations for Black Willow (Salix Nigra Marsh.) and Eastern Cottonwood (Populus Deltoides Bartr. Ex Marsh.). Trees For. People 2022, 7, 100195. [Google Scholar] [CrossRef]
  30. Pham, T.D.; Ha, N.T.; Saintilan, N.; Skidmore, A.; Phan, D.C.; Le, N.N.; Viet, H.L.; Takeuchi, W.; Friess, D.A. Advances in Earth Observation and Machine Learning for Quantifying Blue Carbon. Earth-Sci. Rev. 2023, 243, 104501. [Google Scholar] [CrossRef]
  31. Jia, X.; Wang, C.; Da, Y.; Tian, X.; Ge, W. Tree-Level Biomass Estimation Using Unmanned Aerial Vehicle (UAV) Imagery and Allometric Equation. Biomass Bioenergy 2024, 190, 107420. [Google Scholar] [CrossRef]
  32. Ríos-Saucedo, J.C.; Acuña-Carmona, E.; Cancino-Cancino, J.; Rubilar-Pons, R.; Navar-Chaidez, J.d.J.; Rosales-Serna, R. Allometric Equations Commonly Used for Estimating Shoot Biomass in Short-Rotation Wood Energy Species: A Review. Rev. Chapingo Ser. Cienc. For. Ambiente 2016, 22, 193–202. [Google Scholar] [CrossRef]
  33. He, A.; McDermid, G.J.; Rahman, M.M.; Strack, M.; Saraswati, S.; Xu, B. Developing Allometric Equations for Estimating Shrub Biomass in a Boreal Fen. Forests 2018, 9, 569. [Google Scholar] [CrossRef]
  34. Cabrera-Ariza, A.; Valdés, S.; Gilabert, H.; Santelices-Moya, R.E.; Alonso-Valdés, M. Allometric Models for Estimating Aboveground Biomass in Short Rotation Crops of Acacia Species in Two Different Sites in Chile. Forests 2021, 12, 1767. [Google Scholar] [CrossRef]
  35. Kira, T. Forest Ecosystems of East and Southeast Asia in a Global Perspective. Ecol. Res. 1991, 6, 185–200. [Google Scholar] [CrossRef]
  36. Yim, Y.; Kira, T. Distribution of Forest Vegetation and Climate in the Korean Peninsula.: I. Distribution of Some Indices of Thermal Climate. Jpn. J. Ecol. 1975, 25, 77–88. [Google Scholar]
  37. Lim, B.-S.; Joo, S.-J.; Seok, J.-E.; Lee, C.-S. An Assessment of the Carbon Budget of the Passively Restored Willow Forests Along the Miho River, Central South Korea. Climate 2024, 12, 182. [Google Scholar] [CrossRef]
  38. IPCC. A Report of Working Group of the Intergovernmental Panel on Climate Change; Intergovernmental Panel on Climate Change: Cambridge, UK, 2001. [Google Scholar]
  39. Mukuralinda, A.; Kuyah, S.; Ruzibiza, M.; Ndoli, A.; Nabahungu, N.L.; Muthuri, C. Allometric Equations, Wood Density and Partitioning of Aboveground Biomass in the Arboretum of Ruhande, Rwanda. Trees For. People 2021, 3, 100050. [Google Scholar] [CrossRef]
  40. Camargo García, J.C.; Arango Arango, A.M.; Trinh, L. The Potential of Bamboo Forests as a Carbon Sink and Allometric Equations for Estimating Their Aboveground Biomass. Environ. Dev. Sustain. 2024, 26, 20159–20187. [Google Scholar] [CrossRef]
  41. Yang, M.; Zhou, X.; Liu, Z.; Li, P.; Liu, C.; Huang, H.; Tang, J.; Zhang, C.; Zou, Z.; Xie, B. Dynamic Carbon Allocation Trade-off: A Robust Approach to Model Tree Biomass Allometry. Methods Ecol. Evol. 2024, 15, 886–899. [Google Scholar] [CrossRef]
  42. Khan, K.; Khan, S.N.; Ali, A.; Khokhar, M.F.; Khan, J.A. Estimating Aboveground Biomass and Carbon Sequestration in Afforestation Areas Using Optical/SAR Data Fusion and Machine Learning. Remote Sens. 2025, 17, 934. [Google Scholar] [CrossRef]
  43. Picard, N.; Fonton, N.; Boyemba Bosela, F.; Fayolle, A.; Loumeto, J.; Ngua Ayecaba, G.; Sonké, B.; Yongo Bombo, O.D.; Maïdou, H.M.; Ngomanda, A. Selecting Allometric Equations to Estimate Forest Biomass from Plot-Rather than Individual-Level Predictive Performance. Biogeosciences 2025, 22, 1413–1426. [Google Scholar] [CrossRef]
  44. Beets, P.N.; Kimberley, M.O.; Oliver, G.R.; Pearce, S.H. The Application of Stem Analysis Methods to Estimate Carbon Sequestration in Arboreal Shrubs from a Single Measurement of Field Plots. Forests 2014, 5, 919–935. [Google Scholar] [CrossRef]
  45. Wu, H.; Sun, S.; Forrester, D.I.; Shi, J.; Deng, W.; Deng, X.; Ouyang, S.; Chen, L.; Zeng, Y.; Hu, Y. StemAnalysis: An R-Package for Reconstructing Tree Growth and Carbon Accumulation with Stem Analysis Data. Comput. Electron. Agric. 2023, 210, 107924. [Google Scholar] [CrossRef]
  46. Kuyah, S.; Dietz, J.; Muthuri, C.; Jamnadass, R.; Mwangi, P.; Coe, R.; Neufeldt, H. Allometric Equations for Estimating Biomass in Agricultural Landscapes: II. Belowground Biomass. Agric. Ecosyst. Environ. 2012, 158, 225–234. [Google Scholar] [CrossRef]
  47. Yuen, J.; Fung, T.; Ziegler, A. Review of Allometric Equations for Major Land Covers in SE Asia: Uncertainty and Implications for above-and below-Ground Carbon Estimates. For. Ecol. Manag. 2016, 360, 323–340. [Google Scholar] [CrossRef]
  48. Contreras, F.; Cayuela, M.L.; Sánchez-Monedero, M.Á.; Pérez-Cutillas, P. Multi-Source Remote Sensing for Large-Scale Biomass Estimation in Mediterranean Olive Orchards Using GEDI LiDAR and Machine Learning. EGUsphere 2025, 2025, 1–27. [Google Scholar] [CrossRef]
  49. Han, S.-J.; Kim, H.-W.; Kim, H.-R.; Kim, H.-J.; Han, D.-U.; Park, S.-K.; You, Y.-H. Net Primary Production, Annual Accumulation of Organic Carbon and Leaf Decomposition in Salix Plant Community. J. Wetl. Res. 2010, 12, 15–22. [Google Scholar]
  50. Sung, S.; Nicklas, F.; Georg, K.; Lee, D.K. Estimating Net Primary Productivity under Climate Change by Application of Global Forest Model (G4M). J. Korean Soc. People Plants Environ. 2016, 19, 549–558. [Google Scholar] [CrossRef]
  51. Song, C.; Choi, H.; Son, J.; Ko, Y.; Pietsch, S.; Lee, W. Assessing Forest Net Primary Productivity Based on a Process-Based Model: Focusing on Pine and Oak Forest Stands in South and North Korea. Korean J. Environ. Biol. 2023, 41, 400–412. [Google Scholar] [CrossRef]
  52. Naiman, R.J.; Decamps, H.; McClain, M.E. Riparia: Ecology, Conservation, and Management of Streamside Communities; Elsevier: Amsterdam, The Netherlands, 2010; ISBN 978-0-08-047068-9. [Google Scholar]
  53. Kozlowski, T.T. Physiological-Ecological Impacts of Flooding on Riparian Forest Ecosystems. Wetlands 2002, 22, 550–561. [Google Scholar] [CrossRef]
  54. Hennings, N.; Becker, J.N.; Guillaume, T.; Damris, M.; Dippold, M.A.; Kuzyakov, Y. Riparian Wetland Properties Counter the Effect of Land-Use Change on Soil Carbon Stocks after Rainforest Conversion to Plantations. Catena 2021, 196, 104941. [Google Scholar] [CrossRef]
  55. Szczukowski, S.; Stolarski, M.; Tworkowski, J.; Przyborowski, J.; Klasa, A. Productivity of Willow Coppice Plants Grown in Short Rotations. Plant Soil Environ. 2005, 51, 423. [Google Scholar] [CrossRef]
  56. Sleight, N.J.; Volk, T.A.; Eisenbies, M. Belowground Biomass and Root: Shoot Ratios of Three Willow Cultivars at Two Sites. Forests 2023, 14, 525. [Google Scholar] [CrossRef]
  57. Volk, T.A.; Verwijst, T.; Tharakan, P.J.; Abrahamson, L.P.; White, E.H. Growing Fuel: A Sustainability Assessment of Willow Biomass Crops. Front. Ecol. Environ. 2004, 2, 411–418. [Google Scholar] [CrossRef]
  58. Kopp, R.F.; Abrahamson, L.P.; White, E.H.; Volk, T.A.; Nowak, C.A.; Fillhart, R.C. Willow Biomass Production during Ten Successive Annual Harvests. Biomass Bioenergy 2001, 20, 1–7. [Google Scholar] [CrossRef]
  59. Mo, L.; Zohner, C.M.; Reich, P.B.; Liang, J.; De Miguel, S.; Nabuurs, G.-J.; Renner, S.S.; van den Hoogen, J.; Araza, A.; Herold, M. Integrated Global Assessment of the Natural Forest Carbon Potential. Nature 2023, 624, 92–101. [Google Scholar] [CrossRef]
  60. Nzabarinda, V.; Bao, A.; Tie, L.; Uwamahoro, S.; Kayiranga, A.; Ochege, F.U.; Muhirwa, F.; Bao, J. Expanding Forest Carbon Sinks to Mitigate Climate Change in Africa. Renew. Sustain. Energy Rev. 2025, 207, 114849. [Google Scholar] [CrossRef]
  61. Pothong, T.; Elliott, S.; Chairuangsri, S.; Chanthorn, W.; Shannon, D.P.; Wangpakapattanawong, P. New Allometric Equations for Quantifying Tree Biomass and Carbon Sequestration in Seasonally Dry Secondary Forest in Northern Thailand. New For. 2022, 53, 17–36. [Google Scholar] [CrossRef]
  62. Yang, H.; Song, M.; Son, H.; Kim, R.; Choi, E. Evaluating REDD+ Readiness: High-Potential Countries Based on MRV Capacity. Forests 2025, 16, 67. [Google Scholar] [CrossRef]
  63. Mardiatmoko, G.; Kastanya, A.; Hatulesila, J.W. Allometric Equation for Estimating Aboveground Biomass of Nutmeg (Myristica Fragrans Houtt) to Support REDD+. Agrofor. Syst. 2019, 93, 1377–1387. [Google Scholar] [CrossRef]
  64. Venter, O.; Koh, L.P. Reducing Emissions from Deforestation and Forest Degradation (REDD+): Game Changer or Just Another Quick Fix? Ann. N. Y. Acad. Sci. 2012, 1249, 137–150. [Google Scholar] [CrossRef]
  65. Parrotta, J.A.; Mansourian, S.; Wildburger, C.; Grima, N. Forests, Climate, Biodiversity and People: Assessing a Decade of REDD; IUFRO: Vienna, Austria, 2022. [Google Scholar]
  66. Gibbs, H.K.; Brown, S.; Niles, J.O.; Foley, J.A. Monitoring and Estimating Tropical Forest Carbon Stocks: Making REDD a Reality. Environ. Res. Lett. 2007, 2, 045023. [Google Scholar] [CrossRef]
  67. Zhang, D.; Tang, X.; Lu, S.; Geng, X.; Yu, Z.; Xie, Y.; Peng, S.; Wang, X. Near Real-Time Monitoring of Carbon Effects from Continuous Forest Change in Rapidly Urbanizing Region of China from 2000 to 2020. For. Ecosyst. 2025, 13, 100327. [Google Scholar] [CrossRef]
  68. Chave, J.; Andalo, C.; Brown, S.; Cairns, M.A.; Chambers, J.Q.; Eamus, D.; Fölster, H.; Fromard, F.; Higuchi, N.; Kira, T. Tree Allometry and Improved Estimation of Carbon Stocks and Balance in Tropical Forests. Oecologia 2005, 145, 87–99. [Google Scholar] [CrossRef]
  69. Chave, J.; Condit, R.; Aguilar, S.; Hernandez, A.; Lao, S.; Perez, R. Error Propagation and Scaling for Tropical Forest Biomass Estimates. Philos. Trans. R. Soc. London. Ser. B Biol. Sci. 2004, 359, 409–420. [Google Scholar] [CrossRef] [PubMed]
  70. Chave, J.; Réjou-Méchain, M.; Búrquez, A.; Chidumayo, E.; Colgan, M.S.; Delitti, W.B.; Duque, A.; Eid, T.; Fearnside, P.M.; Goodman, R.C. Improved Allometric Models to Estimate the Aboveground Biomass of Tropical Trees. Glob. Change Biol. 2014, 20, 3177–3190. [Google Scholar] [CrossRef]
  71. Molto, Q.; Rossi, V.; Blanc, L. Error Propagation in Biomass Estimation in Tropical Forests. Methods Ecol. Evol. 2013, 4, 175–183. [Google Scholar] [CrossRef]
  72. Pandey, H.P.; Bhandari, S.K.; Harrison, S. Comparison among Allometric Models for Tree Biomass Estimation Using Non-Destructive Trees’ Data. Trop. Ecol. 2022, 63, 263–272. [Google Scholar] [CrossRef]
  73. Houghton, R. Aboveground Forest Biomass and the Global Carbon Balance. Glob. Change Biol. 2005, 11, 945–958. [Google Scholar] [CrossRef]
  74. Chaturvedi, R.; Raghubanshi, A. Aboveground Biomass Estimation of Small Diameter Woody Species of Tropical Dry Forest. New For. 2013, 44, 509–519. [Google Scholar] [CrossRef]
  75. Litton, C.M.; Boone Kauffman, J. Allometric Models for Predicting Aboveground Biomass in Two Widespread Woody Plants in Hawaii. Biotropica 2008, 40, 313–320. [Google Scholar] [CrossRef]
  76. Djomo, A.N.; Chimi, C.D. Tree Allometric Equations for Estimation of above, below and Total Biomass in a Tropical Moist Forest: Case Study with Application to Remote Sensing. For. Ecol. Manag. 2017, 391, 184–193. [Google Scholar] [CrossRef]
  77. Wang, J.; Zhong, A.; Comeau, P.; Tsze, M.; Kimmins, J. Aboveground Biomass and Nutrient Accumulation in an Age Sequence of Aspen (Populus Tremuloides) Stands in the Boreal White and Black Spruce Zone, British Columbia. For. Ecol. Manag. 1995, 78, 127–138. [Google Scholar] [CrossRef]
  78. Fonseca, W.; Ruiz, L.; Rojas, M.; Alice, F. Modelos Alométricos Para La Estimación de Biomasa y Carbono En Alnus Acuminata. Rev. Cienc. Ambient. 2013, 46, 37–50. [Google Scholar] [CrossRef]
  79. Chaturvedi, R.; Raghubanshi, A.; Singh, J. Biomass Estimation of Dry Tropical Woody Species at Juvenile Stage. Sci. World J. 2012, 2012, 790219. [Google Scholar] [CrossRef]
  80. Fayolle, A.; Doucet, J.-L.; Gillet, J.-F.; Bourland, N.; Lejeune, P. Tree Allometry in Central Africa: Testing the Validity of Pantropical Multi-Species Allometric Equations for Estimating Biomass and Carbon Stocks. For. Ecol. Manag. 2013, 305, 29–37. [Google Scholar] [CrossRef]
  81. Van Breugel, M.; Ransijn, J.; Craven, D.; Bongers, F.; Hall, J.S. Estimating Carbon Stock in Secondary Forests: Decisions and Uncertainties Associated with Allometric Biomass Models. For. Ecol. Manag. 2011, 262, 1648–1657. [Google Scholar] [CrossRef]
  82. Zhang, Y.; Zhang, X.; Fang, W.; Cai, Y.; Zhang, G.; Liang, J.; Chang, J.; Chen, L.; Wang, H.; Zhang, P. Carbon Sequestration Potential of Wetlands and Regulating Strategies Response to Climate Changes. Environ. Res. 2025, 269, 120890. [Google Scholar] [CrossRef]
  83. Cao, M.; Wang, F.; Ma, S.; Geng, H.; Sun, K. Recent Advances on Greenhouse Gas Emissions from Wetlands: Mechanism, Global Warming Potential, and Environmental Drivers. Environ. Pollut. 2024, 355, 124204. [Google Scholar] [CrossRef] [PubMed]
  84. Guan, Y.; Tian, X.; Bai, J.; Zhou, H.; Wen, L. Assessing the Carbon Neutrality Capacity of Wetland and Non-Wetland Ecosystems in a Typical Coastal Region. Sustain. Prod. Consum. 2025, 53, 17–27. [Google Scholar] [CrossRef]
  85. Li, L.; Xu, H.; Zhang, Q.; Zhan, Z.; Liang, X.; Xing, J. Estimation Methods of Wetland Carbon Sink and Factors Influencing Wetland Carbon Cycle: A Review. Carbon Res. 2024, 3, 50. [Google Scholar] [CrossRef]
  86. Banerjee, K.; Bastviken, D.; Berg, P.; Bogard, M.; Chow, A.; Conner, W.; Craft, C.; Creamer, C.; DelSontro, T.; Duberstein, J. Practical Guide to Measuring Wetland Carbon Pools and Fluxes. Wetl. J. Soc. Wetl. Sci. 2023, 43, 105. [Google Scholar]
  87. Brack, D. Forests and Climate Change. In Proceedings of the Background Study Prepared for the Fourteenth Session of the United Nations Forum on Forests, New York, NY, USA, 6–10 May 2019. [Google Scholar]
  88. Fawzy, S.; Osman, A.I.; Doran, J.; Rooney, D.W. Strategies for Mitigation of Climate Change: A Review. Environ. Chem. Lett. 2020, 18, 2069–2094. [Google Scholar] [CrossRef]
  89. Feigin, S.V.; Wiebers, D.O.; Lueddeke, G.; Morand, S.; Lee, K.; Knight, A.; Brainin, M.; Feigin, V.L.; Whitfort, A.; Marcum, J. Proposed Solutions to Anthropogenic Climate Change: A Systematic Literature Review and a New Way Forward. Heliyon 2023, 9, e20544. [Google Scholar] [CrossRef]
  90. Mant, R.; Perry, E.; Heath, M.; Munroe, R.; Väänänen, E.; Großheim, C.; Kümper-Schlake, L. Addressing Climate Change—Why Biodiversity Matters; UNEP-WCMC: Cambridge, UK, 2014. [Google Scholar]
  91. Shivanna, K.R. Climate Change and Its Impact on Biodiversity and Human Welfare. Proc. Indian Natl. Sci. Acad. 2022, 88, 160–171. [Google Scholar] [CrossRef]
  92. UN Climate Action. Biodiversity—Our Strongest Natural Defense Against Climate Change. Available online: https://www.un.org/en/climatechange/science/climate-issues/biodiversity (accessed on 15 May 2025).
  93. Nayak, N.; Mehrotra, R.; Mehrotra, S. Carbon Biosequestration Strategies: A Review. Carbon Capture Sci. Technol. 2022, 4, 100065. [Google Scholar] [CrossRef]
  94. Prajapati, S.; Choudhary, S.; Kumar, V.; Dayal, P.; Srivastava, R.; Gairola, A.; Borate, R. Carbon Sequestration: A Key Strategy for Climate Change Mitigation towards a Sustainable Future. Emerg. Trends Clim. Change 2023, 2, 1–14. [Google Scholar]
  95. Choudhary, B.; Dhar, V.; Pawase, A.S. Blue Carbon and the Role of Mangroves in Carbon Sequestration: Its Mechanisms, Estimation, Human Impacts and Conservation Strategies for Economic Incentives. J. Sea Res. 2024, 199, 102504. [Google Scholar] [CrossRef]
  96. Guo, X.; Liu, Y.; Xie, T.; Li, Y.; Liu, H.; Wang, Q. Impact of Ecological Restoration on Carbon Sink Function in Coastal Wetlands: A Review. Water 2025, 17, 488. [Google Scholar] [CrossRef]
  97. Fahad, S.; Chavan, S.B.; Chichaghare, A.R.; Uthappa, A.R.; Kumar, M.; Kakade, V.; Pradhan, A.; Jinger, D.; Rawale, G.; Yadav, D.K. Agroforestry Systems for Soil Health Improvement and Maintenance. Sustainability 2022, 14, 14877. [Google Scholar] [CrossRef]
  98. Ollinaho, O.I.; Kröger, M. Agroforestry Transitions: The Good, the Bad and the Ugly. J. Rural Stud. 2021, 82, 210–221. [Google Scholar] [CrossRef]
Figure 1. A map showing the study sites. JW: Jinwi River; BB: Banbyeon River; H: Hwang River. The blue lines indicate the national rivers.
Forests 16 01225 g001
Figure 2. (a) Allometric equations derived from the correlation between the diameter at breast height (DBH) and the dry weight by component, including stem, branch, leaf, root, and whole tree, of S. pierotii excavated in Jinwi River (JW). Red dotted lines indicate the regression line. (b) Allometric equations derived from the correlation between the diameter at breast height (DBH, and the dry weight by component, including stem, branch, leaf, root, and whole tree, of S. pierotii excavated in Banbyeon River (BB). Red dotted lines indicate the regression line. (c) Allometric equations derived from the correlation between the diameter at breast height (DBH) and the dry weight by component, including stem, branch, leaf, root, and whole tree, of S. pierotii excavated in Hwang River (H). Red dotted lines indicate the regression line. (d). Allometric equations derived from the correlation between the diameter at breast height (DBH) and the dry weight by component, including stem, branch, leaf, root, and whole tree, of S. pierotii excavated in all the sites presented above. Red dotted lines indicate the regression line.
Forests 16 01225 g002aForests 16 01225 g002bForests 16 01225 g002cForests 16 01225 g002d
Figure 3. Allometric equations derived from the correlation between the diameter at breast height (DBH) and the volume of the willow stems excavated in Jinwi (JW), Banbyeon (BB), and Hwang Rivers (H). Total indicates an allometric equation derived by combining data obtained from the three sites. Red dotted lines indicate the regression line.
Forests 16 01225 g003
Figure 4. Allometric equations derived from the correlation between the diameter at breast height (DBH) and the biomass estimated based on the stem analysis for the willows excavated in Jinwi (JW), Banbyeon (BB), and Hwang Rivers (H). Total indicates an allometric equation derived by combining data obtained from the three sites. Red dotted lines indicate the regression line.
Forests 16 01225 g004
Table 1. Environmental conditions of the study sites.
SiteDominant SpeciesLatitude
(N)
Longitude
(E)
Elevation
(m)
Slope
(°)
Jinwi
River
S. pierotii37°05′35.86″127°00′50.13″6.411.24
Banbyeon
River
S. pierotii36°33′19.07″129°00′28.53″162.1513.22
Hwang RiverS. pierotii35°34′16.95″128°20′24.91″10.551.93
Table 2. The results of statistical assessment for the allometric equations derived.
SiteComponentR2RMSE (kg)MAE
(kg)
MPE
(%)
Jinwi RiverStem0.91650.180.15−0.02
Branch0.90010.140.110.02
Leaf0.73810.260.200.06
Root0.93470.130.100.01
Whole tree0.93510.140.120.01
Banbyeon
River
Stem0.95980.060.04−0.00
Branch0.85180.160.120.01
Leaf0.89420.130.09−0.18
Root0.89830.110.080.02
Whole tree0.96670.060.04−0.00
Hwang RiverStem0.98540.060.05−0.00
Branch0.98180.050.04−0.01
Leaf0.96230.080.07−0.01
Root0.90120.140.12−0.19
Whole tree0.98920.050.04−0.00
TotalStem0.92660.180.132.89
Branch0.81030.220.173.36
Leaf0.69590.320.2811.40
Root0.83240.270.22−4.01
Whole tree0.95510.150.12−0.15
Table 3. The density, and NPPs of the individual and the stand measured by the allometric method in the S. pierotii communities established in the riparian zone of three rivers across South Korea (unit: ton·C·ha−1·yr−1).
SiteDensity
(Individuals Per ha)
NPP of Individual
(kg C∙yr−1)
NPP of Stand
(ton C∙ha−1∙yr−1)
Jinwi25004.5211.30
Banbyeon29001.855.35
Hwang27007.0318.98
Mean27004.4711.87
Table 4. The biomass conversion coefficients of the branch, leaf, and root to the stem.
SiteStemBranchLeafRootTotal
Jinwi1.00.320.040.371.73
Banbyeon1.00.220.020.201.44
Hwang1.00.250.080.361.69
Total1.00.270.060.331.66
Table 5. The expansion factors derived in the studied rivers.
SiteWood Density
(kg·m−3)
Biomass
Expansion Factor
Root Ratio to AGB
Jinwi0.801.790.27
Banbyeon0.461.210.16
Hwang0.641.440.31
Total0.631.450.24
Table 6. The results of statistical verification for the allometric equations derived in stem analysis.
SiteR2RMSE (kg)MAE (kg)MPE (%)
Jinwi0.92541.381.37−0.87
Banbyeon0.94421.381.38−1.91
Hwang0.86692.142.13−1.29
Total0.89941.641.60−12.01
Table 7. The density, and NPPs of the individual and the stand measured by the stem analysis in the S. pierotii communities established in the riparian zone of three rivers across South Korea (unit: ton·C·ha−1·yr−1).
SiteDensity
(Individuals Per ha)
NPP of Individual
(kgC∙yr−1)
NPP of Stand
(tonC∙ha−1∙yr−1)
Jinwi25008.1720.41
Banbyeon29002.166.28
Hwang27007.6020.52
Mean27005.9815.74
Disclaimer/Publisher’s Note: The statements, opinions and data contained in all publications are solely those of the individual author(s) and contributor(s) and not of MDPI and/or the editor(s). MDPI and/or the editor(s) disclaim responsibility for any injury to people or property resulting from any ideas, methods, instructions or products referred to in the content.

