Article

Determining the Structural Characteristics of Farmland Shelterbelts in a Desert Oasis Using LiDAR

1
School of Soil and Water Conservation, Beijing Forestry University, Beijing 100083, China
2
State Key Laboratory of Efficient Production of Forest Resources, Beijing Forestry University, Beijing 100083, China
3
Experimental Center of Desert Forestry, Chinese Academy of Forestry, Bayannur 015200, China
4
Inner Mongolia Dengkou Desert Ecosystem National Observation Research Station, National Forestry and Grassland Administration, Bayannur 015200, China
5
Department of Geography, The University of Hong Kong, Hong Kong SAR 999077, China
6
School of Information Science and Technology, Beijing Forestry University, Beijing 100083, China
*
Author to whom correspondence should be addressed.
Forests 2025, 16(8), 1221; https://doi.org/10.3390/f16081221
Submission received: 24 June 2025 / Revised: 20 July 2025 / Accepted: 23 July 2025 / Published: 24 July 2025
(This article belongs to the Section Forest Inventory, Modeling and Remote Sensing)

Abstract

The structural analysis of shelterbelts forms the foundation of their planning and management, yet the scientific and effective quantification of shelterbelt structures requires further investigation. This study developed an innovative heterogeneous analytical framework, integrating three key methodologies: the LeWoS algorithm for wood–leaf separation, TreeQSM for structural reconstruction, and 3D alpha-shape spatial quantification, using terrestrial laser scanning (TLS) technology. This framework was applied to three typical farmland shelterbelts in the Ulan Buh Desert oasis, enabling the first precise quantitative characterization of structural components during the leaf-on stage. The results showed the following to be true: (1) The combined three-algorithm method achieved ≥90.774% relative accuracy in extracting structural parameters for all measured traits except leaf surface area. (2) Branch length, diameter, surface area, and volume decreased progressively from first- to fourth-order branches, while branch angles increased with ascending branch order. (3) The trunk, branch, and leaf components exhibited distinct vertical stratification. Trunk volume and surface area decreased linearly with height, while branch and leaf volumes and surface areas followed an inverted U-shaped distribution. (4) Horizontally, both surface area density (Scd) and volume density (Vcd) in each cube unit exhibited pronounced edge effects. Specifically, the Scd and Vcd were greatest between 0.33 and 0.60 times the shelterbelt’s height (H, i.e., mid-canopy). In contrast, the optical porosity (Op) was at a minimum of 0.43 H to 0.67 H, while the volumetric porosity (Vp) was at a minimum at 0.25 H to 0.50 H. (5) The proposed volumetric stratified porosity (Vsp) metric provides a scientific basis for regional farmland shelterbelt management strategies. This three-dimensional structural analytical framework enables precision silviculture, with particular relevance to strengthening ecological barrier efficacy in arid regions.

1. Introduction

Farmland shelterbelts are artificial forest ecosystems established to regulate and improve the structure and function of fragile, disaster-prone agricultural ecosystems. Their ultimate objective is to create or restore sustainable and stable farmland ecosystems, characterized by high productivity and enhanced ecological benefits [1,2,3]. From the standpoint of modern ecology, shelterbelts function as heterogeneous ecotones—zones characterized by ecological stress, edge effects, and biodiversity convergence [4]. Research on their structure aims to elucidate the interrelationships among integrity, stability, and persistence components that define their formation. These insights provide a scientific foundation for shelterbelt design, management, and the sustained delivery of multifunctional benefits, which explains why the farmland shelterbelt structure has long been a focal research area.
The shelterbelt structure refers to the spatial density and distribution patterns of tree trunks, branches, and leaves. It is determined by a combination of multiple factors, including species composition, stand density, vertical stratification, diameter at breast height, tree height, and age [5]. Shelterbelt structural descriptors are categorized into two distinct groups: external structural characteristics (including width, height and cross-sectional geometry), and internal structural characteristics (comprising optical porosity (Op), surface area density (Scd) and volumetric density (Vcd)) [6,7]. Notably, porosity emerges as a holistic parameter that synthetically represents the integrated effects of all other structural components. Porosity is fundamentally defined as the ratio of void space to the space occupied by plant trunks, branches, and leaves [8,9,10]. However, the direct measurement of true porosity remains methodologically challenging, leading to the widespread adoption of optical porosity as a practical representation in most studies [11,12]. For multi-row shelterbelts, the internal three-dimensional architecture cannot be adequately characterized by two-dimensional approaches. To describe the three-dimensional structural characteristics of shelterbelts more scientifically, several researchers have suggested certain parameters, such as stumpage porosity, density, and biomass volume. However, the acquisition of these parameter data requires destructive sampling, making it a complicated process.
In the early stage, shelterbelt structure research was mainly carried out based on ground experiments and statistical methods. Subsequently, remote sensing technology was gradually applied to the monitoring of farmland shelterbelts. However, the inversion of some shelterbelt structure parameters was not mature and complete. As an active remote sensing technology, Light Detection and Ranging (LiDAR) originated in the 1960s and gradually entered China after 2000. Terrestrial laser scanning (TLS), a type of LiDAR, possesses high angular and distance resolution capabilities, enabling it to accurately capture object information. This provides strong technical support for shelterbelt structure investigation [13,14]. These emerging developments are revolutionizing our capacity to observe and monitor structural and functional dynamics in trees and forest ecosystems [15,16,17,18].
The shelterbelt structure typically exhibits pronounced spatial heterogeneity. To better quantify this structural variability, researchers have developed the concept of stratified porosity, which accurately characterizes the vertical distribution of porosity within shelterbelts [10]. The structural variation among individual trees leads to diverse stand configurations. Consequently, investigating single-tree architecture forms the foundation for the precision management of shelterbelt systems [19]. The spatial distribution patterns of branches and leaves, along with their biomass composition and allocation structure, constitute critical components in the study of whole-tree architecture. Separating tree’s branches and leaves is often necessary to obtain detailed information about their components from the point cloud data. At present, the methods for the separation of leaf–wood mainly include geometric and radiation intensity methods [20,21]. In recent years, network diagram methods have been increasingly applied to unsupervised leaf–wood separation, which uses tree points as a connected topological network to separate wood or larger branches from leaves through the Dijkstra algorithm [22]. The LeWoS algorithm employs a recursive point cloud segmentation and regularization process to facilitate the separation of leaf–wood. A key advantage of this algorithm is its ability to operate automatically by merely configuring the feature threshold parameter, “Nz_thres”, which is applicable across various types of LiDAR data [23]. The TreeQSM algorithm is utilized to derive parameters of tree branches, with optimization accomplished by adjusting the sensitivity of the specific input parameter “PathDiam” [24]. The 3D alpha-shape algorithm is mainly suitable for calculating the volume and surface area parameters of objects in a disordered point cloud. By creating a sphere with a radius of “α” around three points in the point set and identifying the boundary points, the surface of the entire point cloud is determined. This approach resolves the issue of quantitatively analyzing the components of leaves [25]. However, for wide shelterbelts composed of multi-row trees, further research into the effective quantification of their structures is required.
In this study, three typical shelterbelts in the desert oasis of Ulan Buh were studied. These include Populus alba var. pyramidalis Bunge, Populus popular’s Zhonghua, Populus nigra var. thevestina (Dode) Bean. The point cloud data of the shelterbelts were obtained by LiDAR, and the structural characteristics of the shelterbelts were obtained by combining the LeWoS leaf–wood separation algorithm, the TreeQSM algorithm, and the 3D alpha-shape algorithm. The main objectives of this research were (1) to explore the tree branch and leaf structure within the shelterbelt, (2) to analyze the spatial distribution characteristics of the shelterbelt structure, and (3) to develop quantitative structural parameters for shelterbelt characterization. The results of this study provide a basis for the structural optimization and management of farmland shelterbelts in the Ulan Buh desert oasis.

2. Materials and Methods

2.1. Study Area

The study plot is located in the Desert Forestry Experimental Center of the Chinese Academy of Forestry in Dengkou County, Inner Mongolia, China. The geographical coordinates are 40°17′–40°29′ N, 106°35′–106°59′ E (Figure 1). Strong winds mainly occur in spring, accounting for 47.5% of the year, and cause frequent sandstorms and serious surface erosion in the area. The area is dominated by artificial vegetation, mainly farmland shelterbelts and crops. The main tree species of the farmland shelterbelts are P. alba var. pyramidalis, P. nigra var. thevestina, P. popular’s, Elaeagnus angustifolia Linn, Ulmus pumila L, and Salix matsudana Koidz, among others. Notably, poplars collectively account for over 90% of the tree composition [26,27,28,29].

2.2. Methods

2.2.1. Field Survey

From May to June 2021, three shelterbelts with different configurations were selected, including three typical species: P. alba var. pyramidalis, P. nigra var. thevestina and P. popular’s (Table 1). The quadrate is set in the shelterbelt. This was examined for various parameters. The obtained parameters included tree height, diameter at breast height (DBH), crown width, and under-branch height.

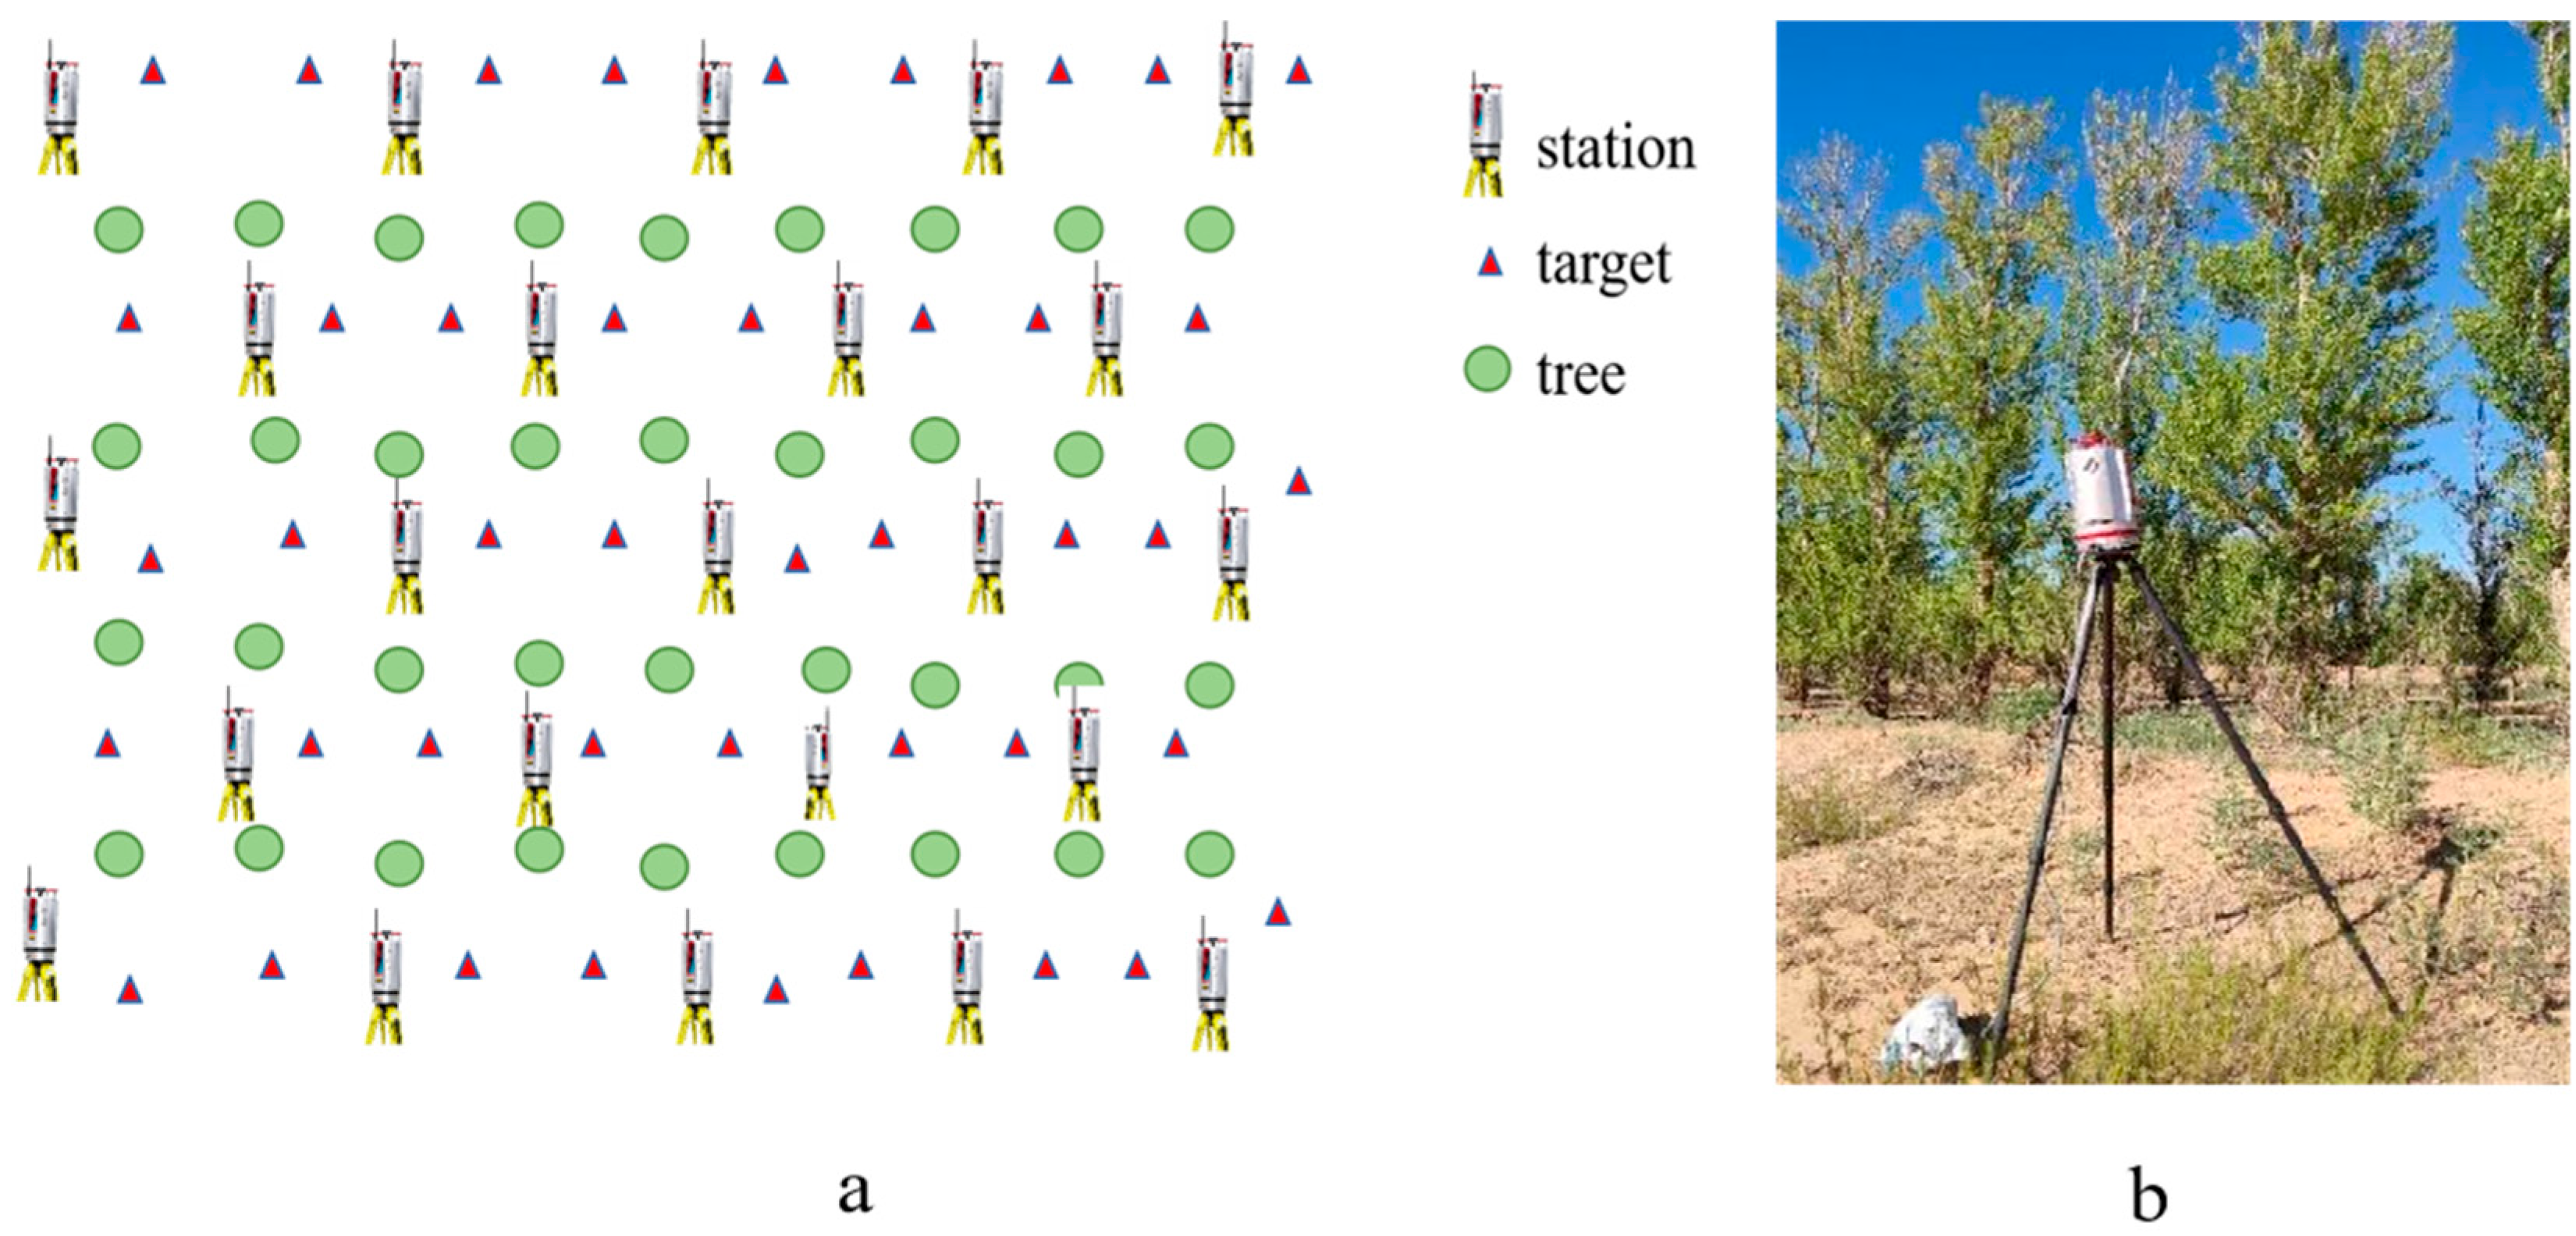
2.2.2. LiDAR Data Acquisition

The shelterbelt point cloud data were acquired using a RIEGL VZ-400i terrestrial laser scanner (TLS) (CHINTERGEO, Beijing, China) featuring a 360° horizontal and 100° vertical scanning range, with a maximum measurement distance of 300 m and a scanning speed of 1 million points per second. To mitigate occlusion effects from dense vegetation, a multi-station scanning approach was employed as shown in Figure 2. The initial scanning station was established at the upper-left corner of the shelterbelt, followed by subsequent stations positioned at 8 m intervals (corresponding to twice the mean tree spacing), with each station scanned for 5 min. Four reflective targets are strategically positioned alongside each other during the scanning process to facilitate point cloud data stitching.

2.2.3. Measurement of Structural Parameters

Fifteen trees from the three shelterbelts were selected for the accuracy assessment of the TLS parameter extraction and algorithm tuning. Five trees were selected for each tree species. Branch angles were measured using a protractor below 0.20 H (where H represents tree height), with photographic documentation for verification. After falling, the trunk was separated from the branches and leaves, and their respective parameters were measured. The surface area and volume of branches and trunks were calculated using cylindrical formulas. Leaf surface area was measured with a CI-202 leaf area scanner (LI-COR Biosciences, Beijing, China), while leaf volume was determined through the water displacement method. Branch diameters were measured using vernier calipers, while branch lengths were determined with measuring tapes.

2.3. Data Processing

2.3.1. Shelterbelt Point Cloud Data Pretreatment

Point cloud data pretreatment mainly includes stitching, cropping, denoising, thinning, filtering, and normalization. The RiSCANPro software (http://www.ilidar.com/, accessed on 12 August 2021), compatible with the TLS, was utilized for point cloud data stitching and cropping. Point cloud data denoising and ground point separation were carried out in CloudCompare v2.12 software (https://github.com/cloudcompare/cloudcompare, accessed on 1 May 2022). The Statistical Outlier Removal algorithm was employed for noise removal. The Cloth Simulation Filtering method was used to eliminate ground points [30].

2.3.2. Single Tree Segmentation and Parameter Extraction

For the accurate segmentation of single trees, the manual segmentation of point cloud data was performed. The parameters of tree height, DBH, crown width and under-branch height were extracted by Lidar360 v6.0 software (https://www.lidar360.com/, accessed on 7 May 2022). Due to the different modeling principles of wood and leaves, the estimated structural parameters of the whole tree model are high, and so it is necessary to separate wood and leaves. This study combines the LeWoS wood–leaf separation algorithm (https://github.com/DiWangLiDAR/LeWoS, accessed on 1 June 2022), the TreeQSM 2.4 algorithm of branch modeling (https://github.com/InverseTampere/TreeQSM, accessed on 20 June 2022), which is a leaf modeling algorithm based on the 3D alpha-shape for tree branches and leaf structure parameters.

2.3.3. Algorithm Optimization

Firstly, we set different Nz_thres and PathDiam parameter combinations using LeWoS and TreeQSM algorithms. Early researchers made a lot of attempts to define a series of values for each input parameter and select a group of optimal parameters. The typical value of Nz_thres falls within the range of 0.1 to 0.2. The value range for PathDiam is from 0.02 to 0.09 [31,32]. The leaf structure parameters were extracted using the 3D alpha-shape algorithm. A sphere has a radius of “α”, which is a value set between 0.0048 and 0.0053 [33,34]. In this study, nine destructive samplings were used for sensitivity analysis. When this involved three parameters, six destructive samplings were tested. The optimal parameters were used as input parameters for other samples. The optimal values of Nz_thres, PathDiam and α parameters are set as follows: The optimal parameter combination of P. alba var. pyramidalis is 0.145, 0.04 and 0.005, that of P. popular is 0.14, 0.03 and 0.0051, and that of the P. nigra var. thevestina is 0.145, 0.03 and 0.005.

2.3.4. Tree Branching Feature and Leaf Parameters Acquisition

In order to further analyze the structural characteristics of the shelterbelt, this study used the optimized TreeQSM algorithm to extract the first- to fourth-level branches of trees. The length, diameter, angle, ratio of branch diameter (RBD) and bifurcation ratio (BR) of branches were extracted. The calculation formula for the RBD is as follows:
R B D i = D i + 1 / D i
where RBDi denotes the ratio of branch diameter at the i level, Di+1 denotes the diameter of the branch at the i + 1 level, and Di denotes the diameter of the branch at the i level. The BR calculation formula is as follows:
B R i = N i + 1 / N i
where BRi denotes the bifurcation ratio at the i level, Ni+1 denotes the number of the branch at the i + 1 level, and Ni denotes the number of the branch at the i level.
The 3D alpha-shape algorithm was employed to extract leaf surface area and volume structural parameters.

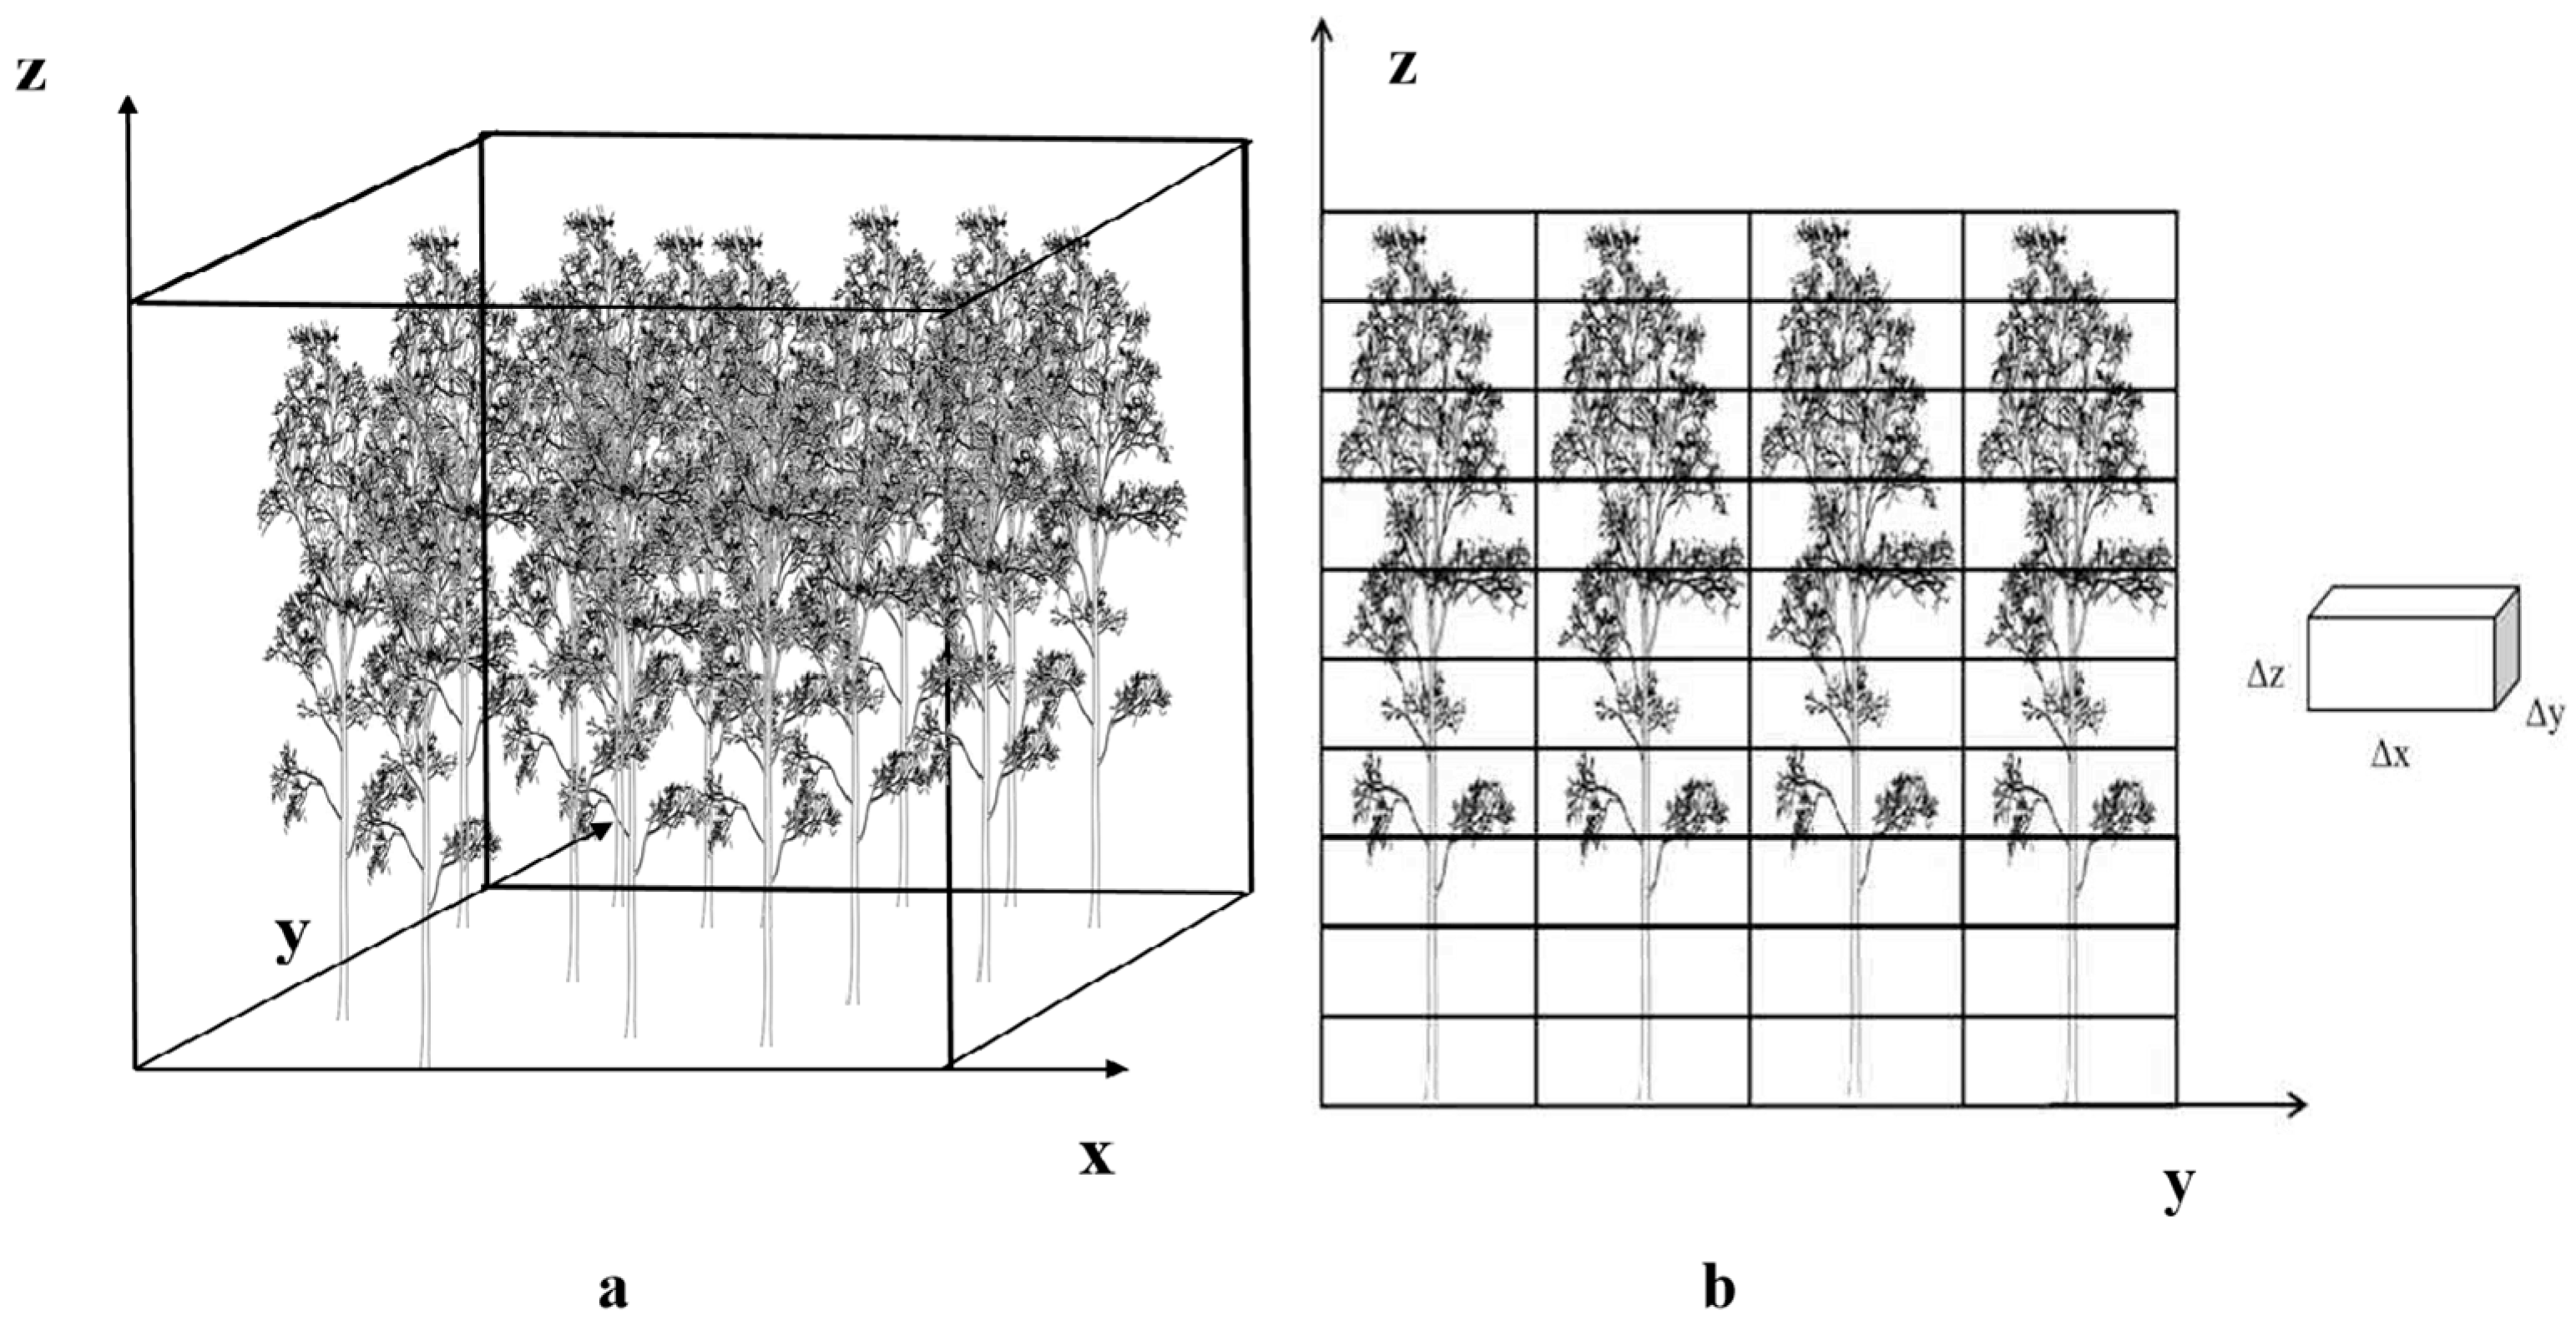
2.3.5. Shelterbelt Parameter Calculation

Optical porosity (Op) is the ratio of the vertical porosity S0 of the shelterbelt to its total area S [10]. In this study, a digital camera is used to capture the whole shelterbelt photo, and Adobe Photoshop 2022 (Adobe Systems, San Jose, CA, USA, https://www.adobe.com/products/photoshop.html, accessed on 5 March 2023) is used for monochrome processing to distinguish the shelterbelt part from the transparent part, and to calculate the proportion of pixels. The Op is determined by the Formula (3):
O p = S 0 S
Volume porosity (Vp) refers to the ratio of the pore volume to the total volume of the shelterbelt [35]. The expression is shown as (4), where V0 represents the volume occupied by leaves and branches, and V represents the total volume of the shelterbelt (its length multiplied by its width and height) (Figure 3a).
V p = 1 V 0 V
The variable Vp was standardized in the present study. The existing literature has presented various methods for indicator standardization, including the min–max scaling method, the indication method, and the Z-score transformation method. The min–max scaling method retains the relationships between data values and applies to various distributions [36]. The min–max scaling formula is expressed as follows:
S i j = x i j m i n ( x i ) m a x ( x i ) m i n ( x i )
where Sij and xij represent, respectively, the standardized and original value for the indicator i (i = 1, 2,…, n), referring to the sample case j (j = 1, 2,…, m), and max(xi) and min(xi) denote the maximum and minimum value among all the samples for the indicator i, respectively.
Stratification porosity (Sp) is used to define the distribution of pores of a shelterbelt, calculated vertically, i.e., cutting a shelterbelt into many slices in the vertical direction and computing the stratification porosity. This study employed a volumetric stratification porosity (Vsp) measurement method with 1 m vertical intervals [37].
Scd refers to the surface area of the tree branches and trunks in each cube unit of the shelterbelt space. Vcd refers to the volume of the tree trunks and branches in each cube unit of the shelterbelt space [38]. In this study, the calculation formula of surface area density and volume density of shelterbelts is as follows:
S c d = 1 x y z i = 1 3 S i
V c d = 1 x y z i = 1 3 V i
where Δx, Δy, and Δz are cell resolutions in the direction of the shelterbelt width (x), length (y), and height (z) (Figure 3b). Δx is defined by the rows spacing within the shelterbelt; Δy is defined by the spacing of trees within the shelterbelt. i = 1, 2 and 3, respectively, represent tree trunks, branches, and leaves in each cell. Si and Vi represent the total surface area and total volume of each component of the tree in a particular cell, respectively.

2.3.6. Accuracy Evaluation

Bias (deviation), RMSE (root mean square of error), rBias (relative deviation), and rRMSE (relative root mean square of error) were used to evaluate the accuracy of the obtained DBH, tree height, under-branch height, crown width, branch structure, and leaf structure.
B i a s = 1 n i = 1 n ( y i y ^ i )
r B i a s = B i a s y ^ i ¯ × 100 %
R M S E = 1 n i = 1 n ( y i y ^ i ) 2
r R M S E = R M S E y ^ ¯ i × 100 %
where y i is the calculated value and y ^ i is the measured value.

3. Results

3.1. Single Tree Structure

3.1.1. Integral Structure of Single Tree

We extracted the data on the tree height, DBH, height under branches, and crown width of individual trees in the quadrat (Table 2). P. nigra var. thevestina had the highest average tree height of 20.241 m. P. alba var. pyramidalis had the largest average DBH, and P. popular’s had the smallest. The order of the tree crown widths among tree species was P. popular’s > P. alba var. pyramidalis > P. nigra var. thevestina. Based on the calculations for individual trees in the sampled area, P. alba var. pyramidalis had the largest surface area and volume.

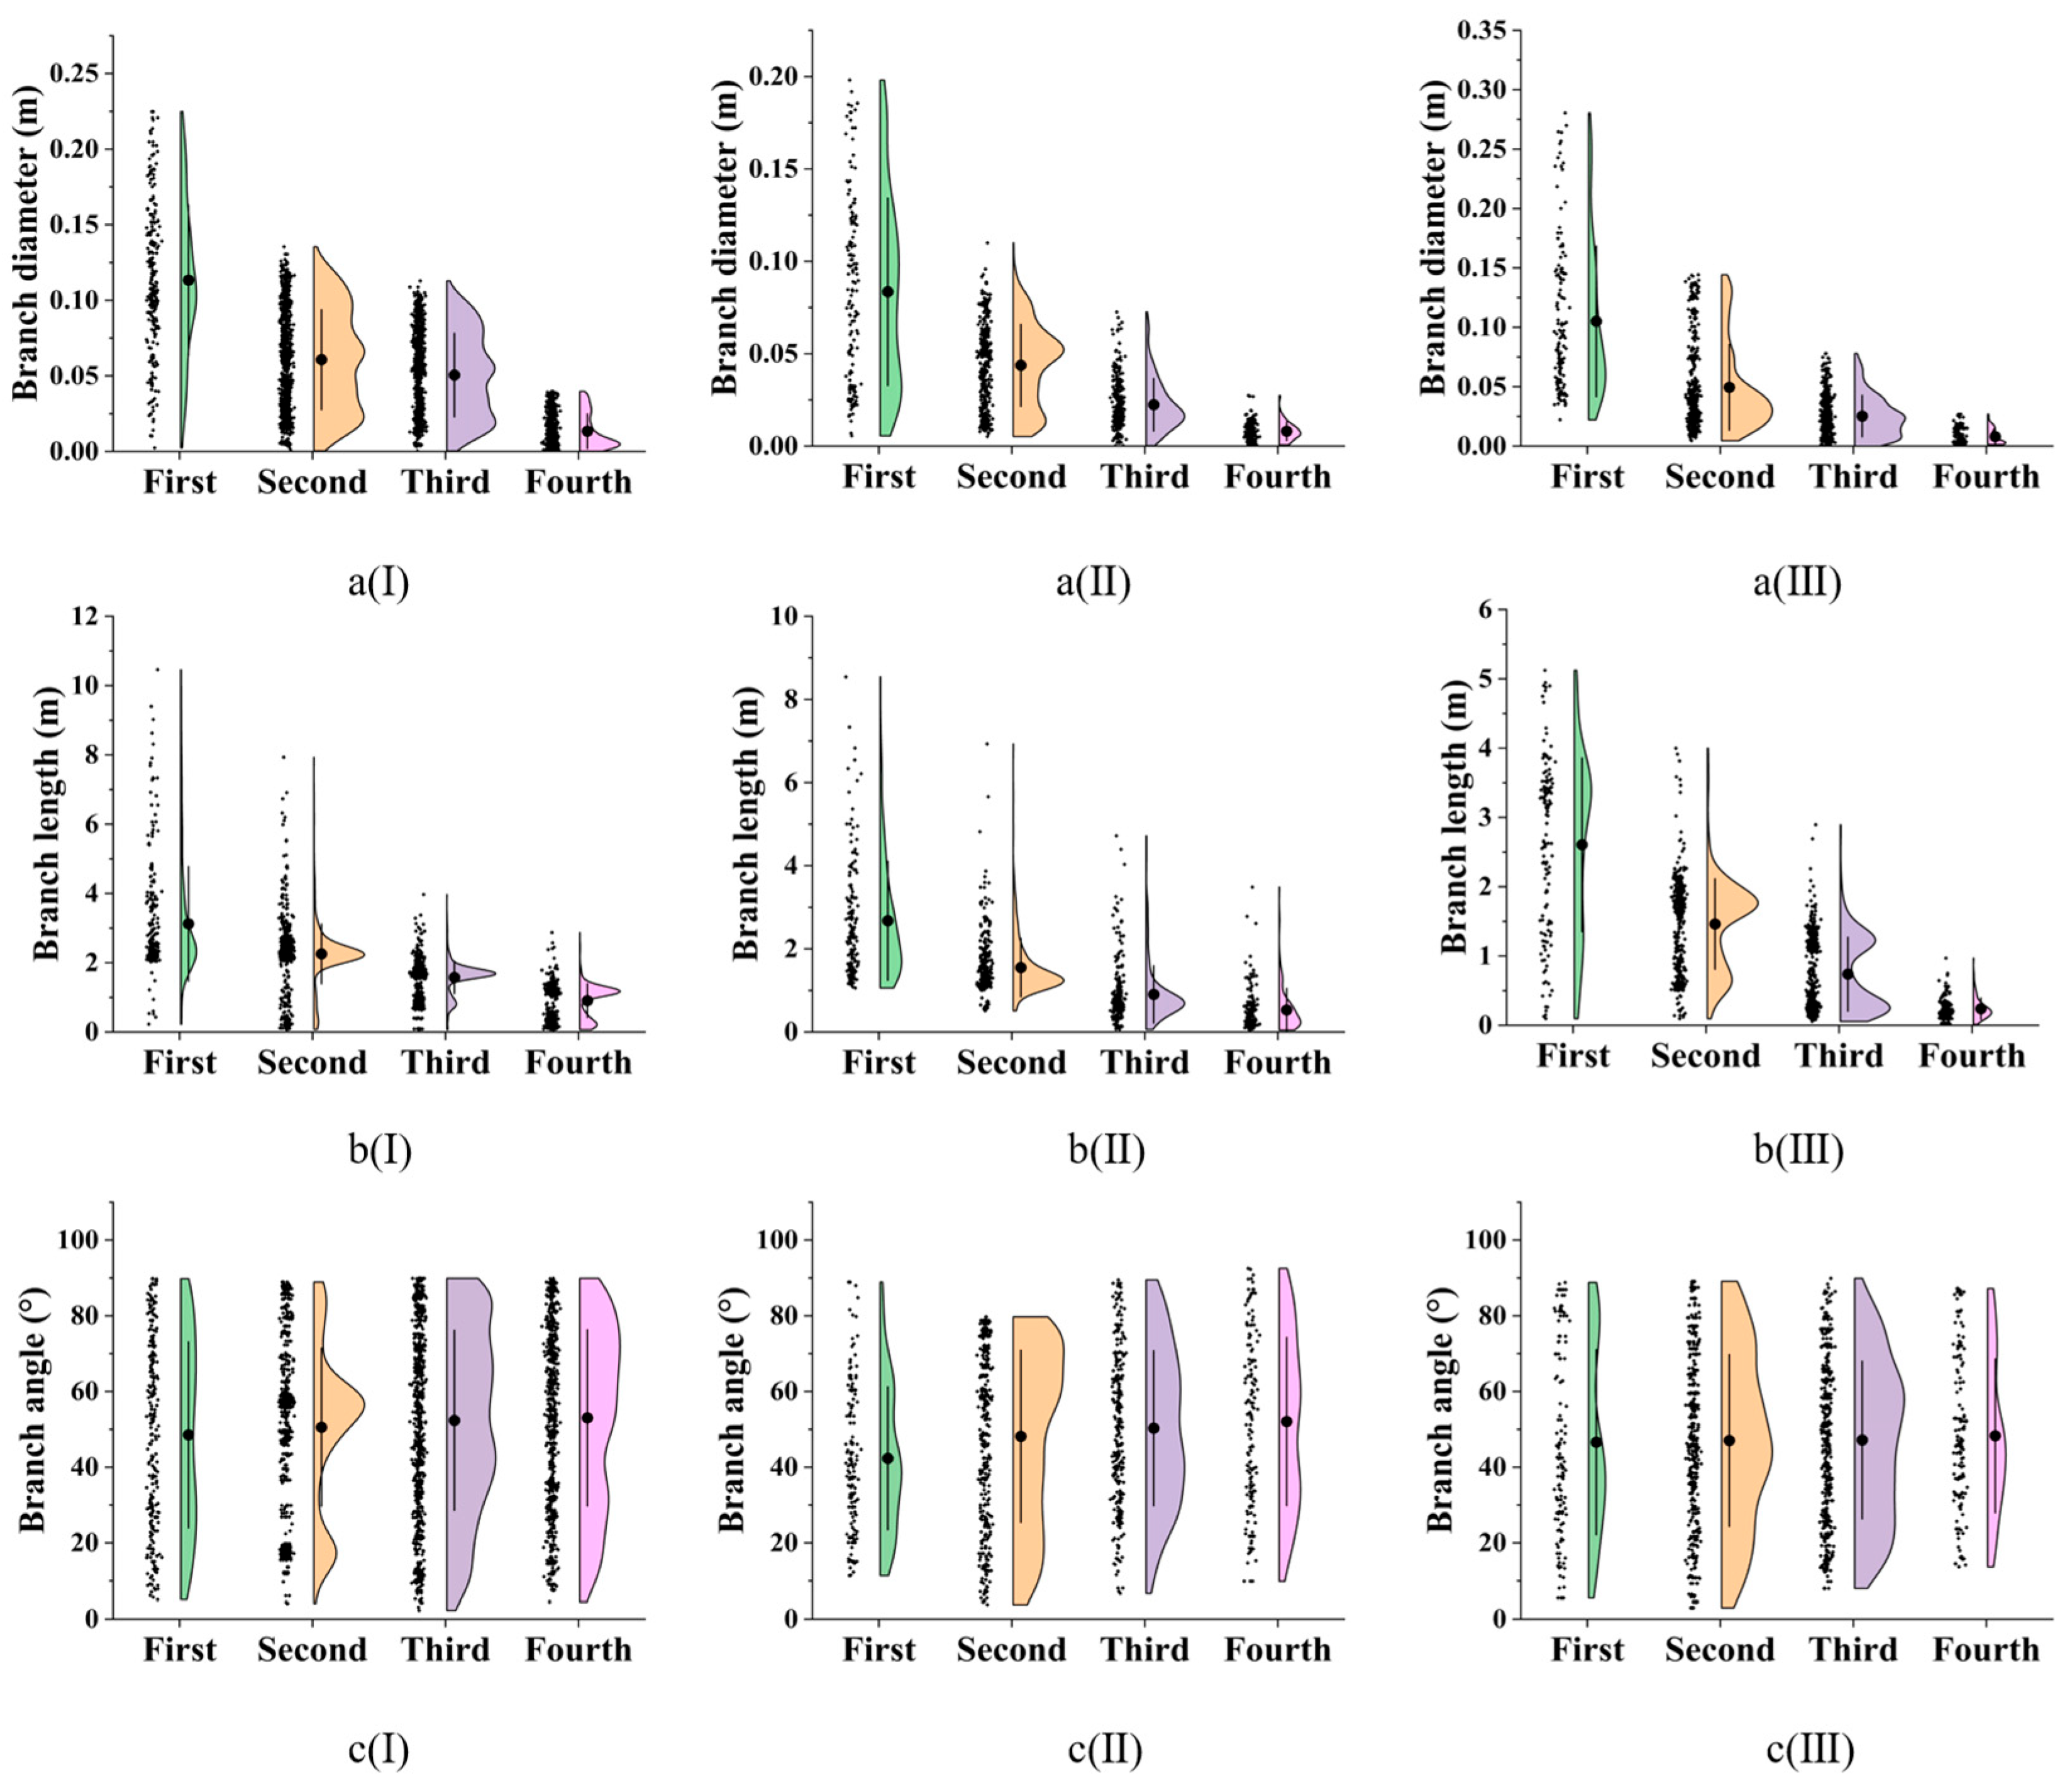
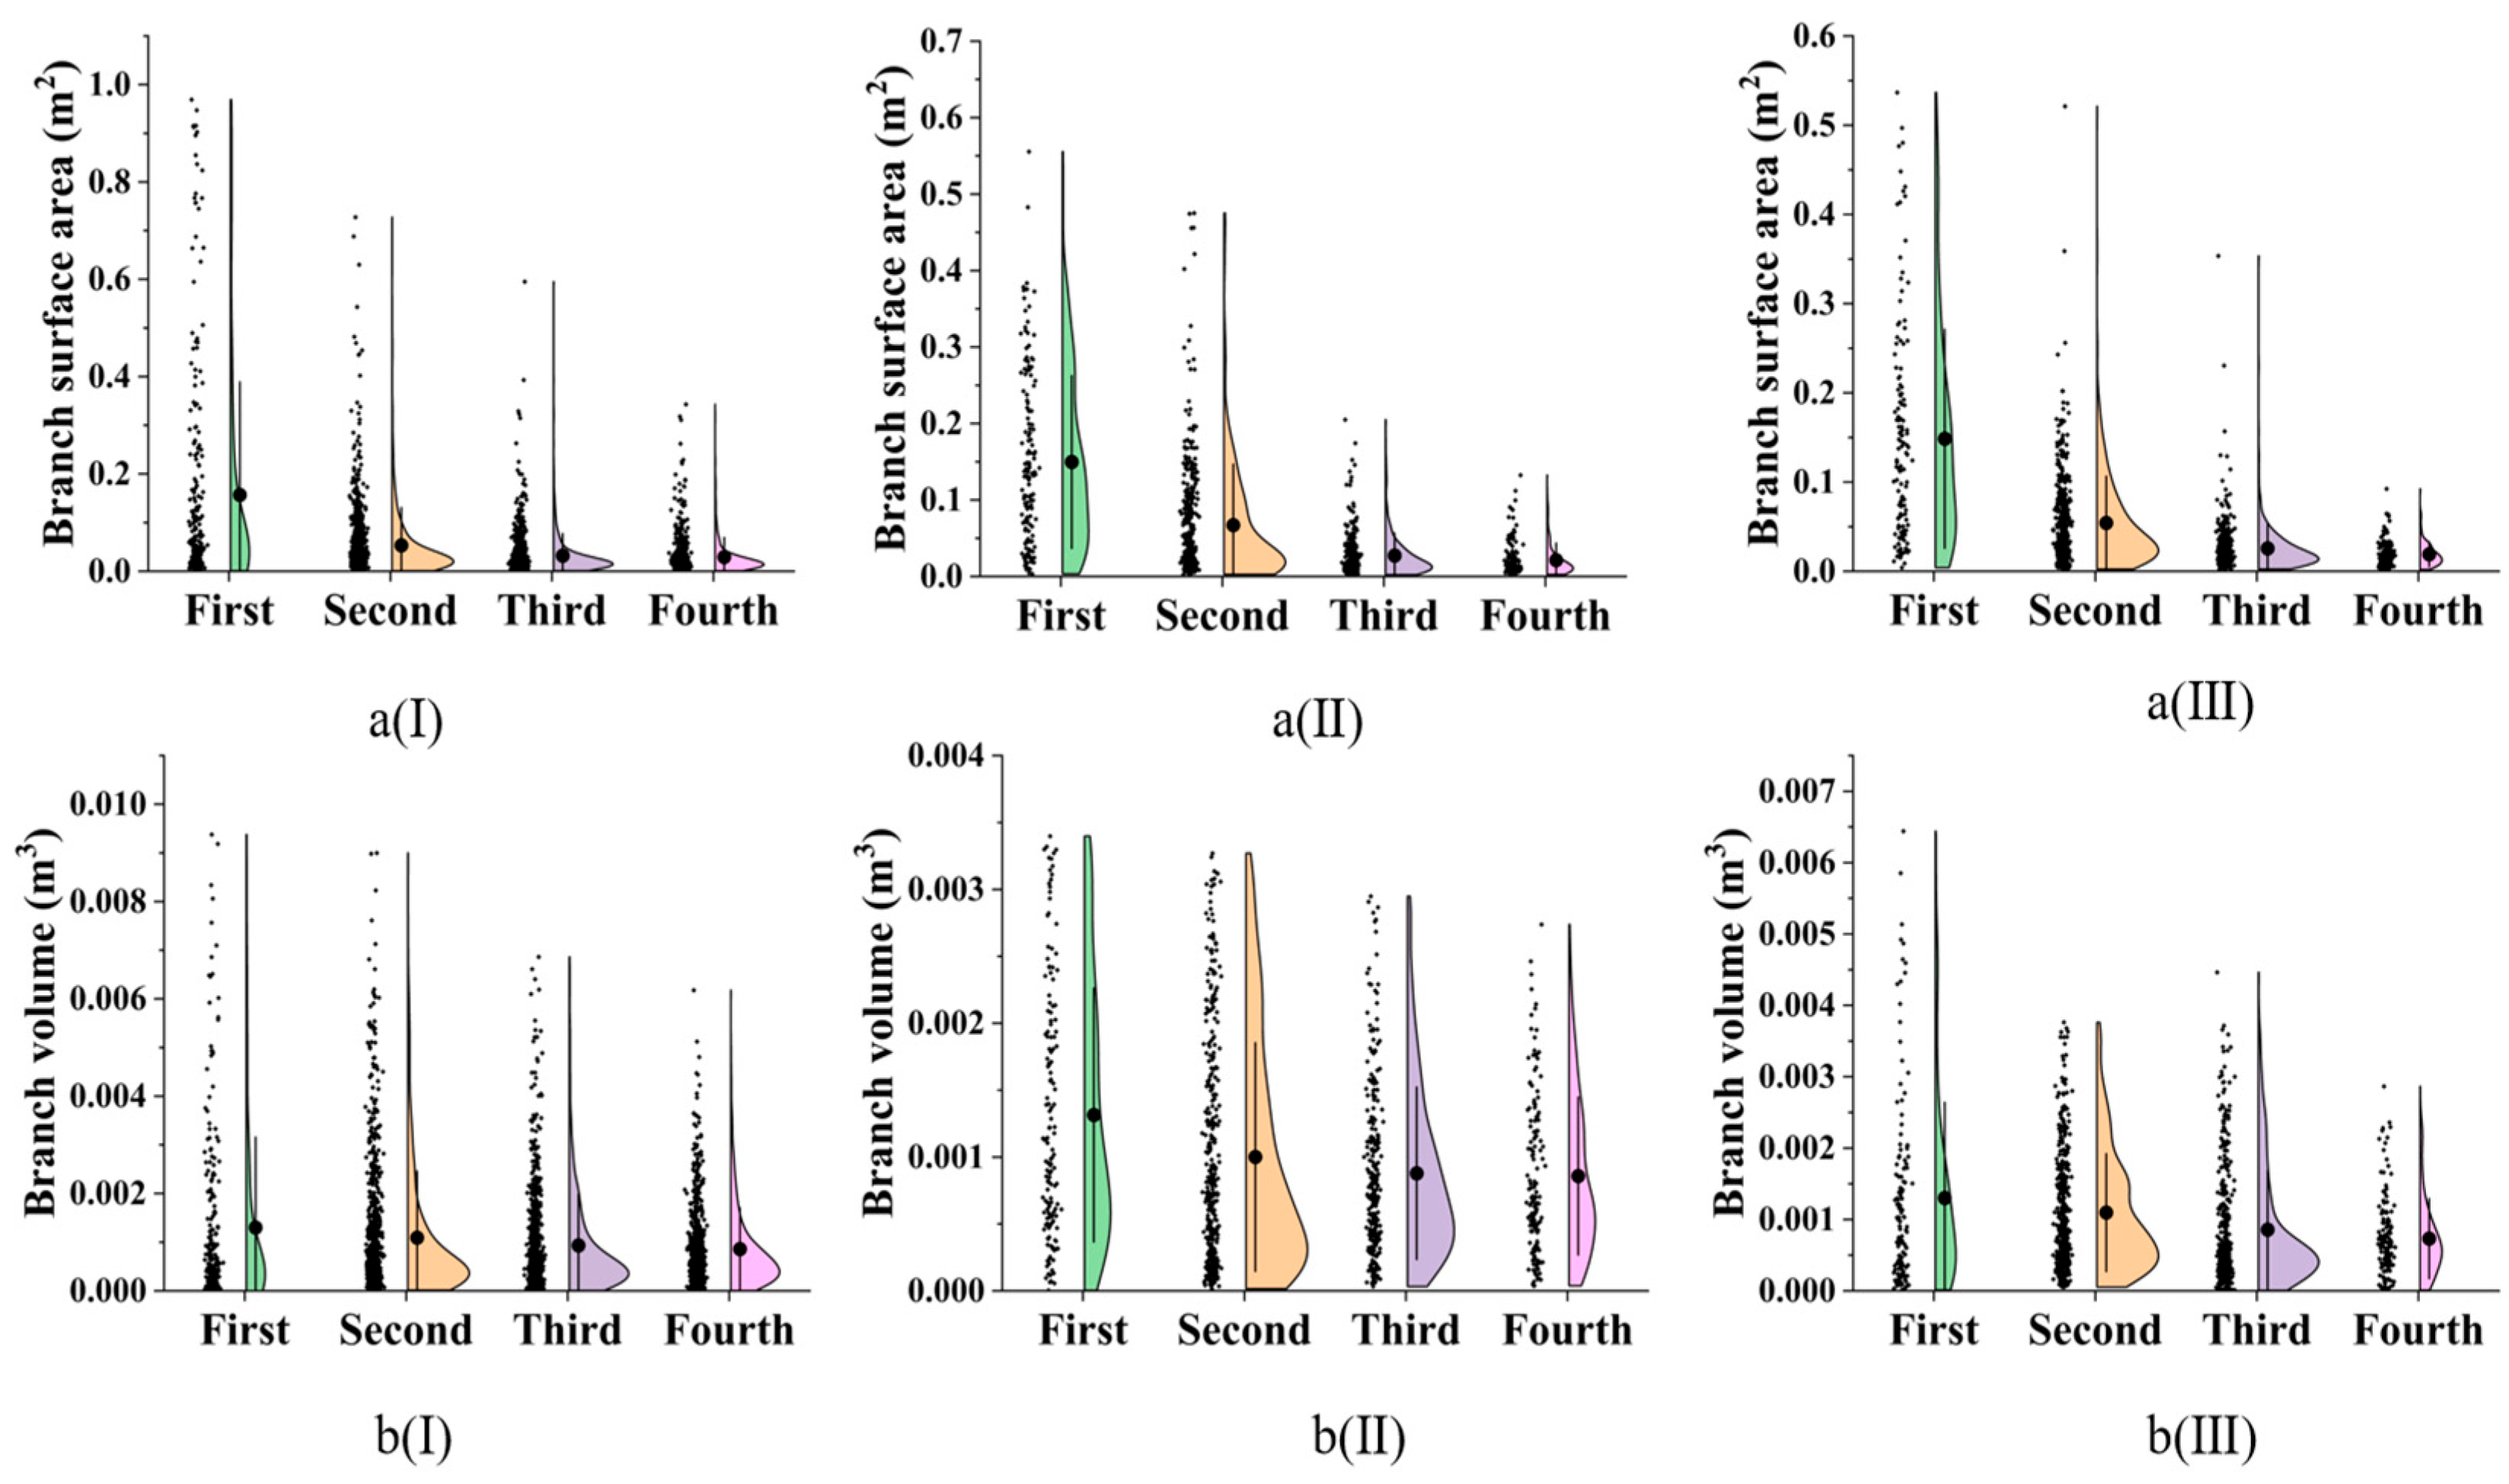
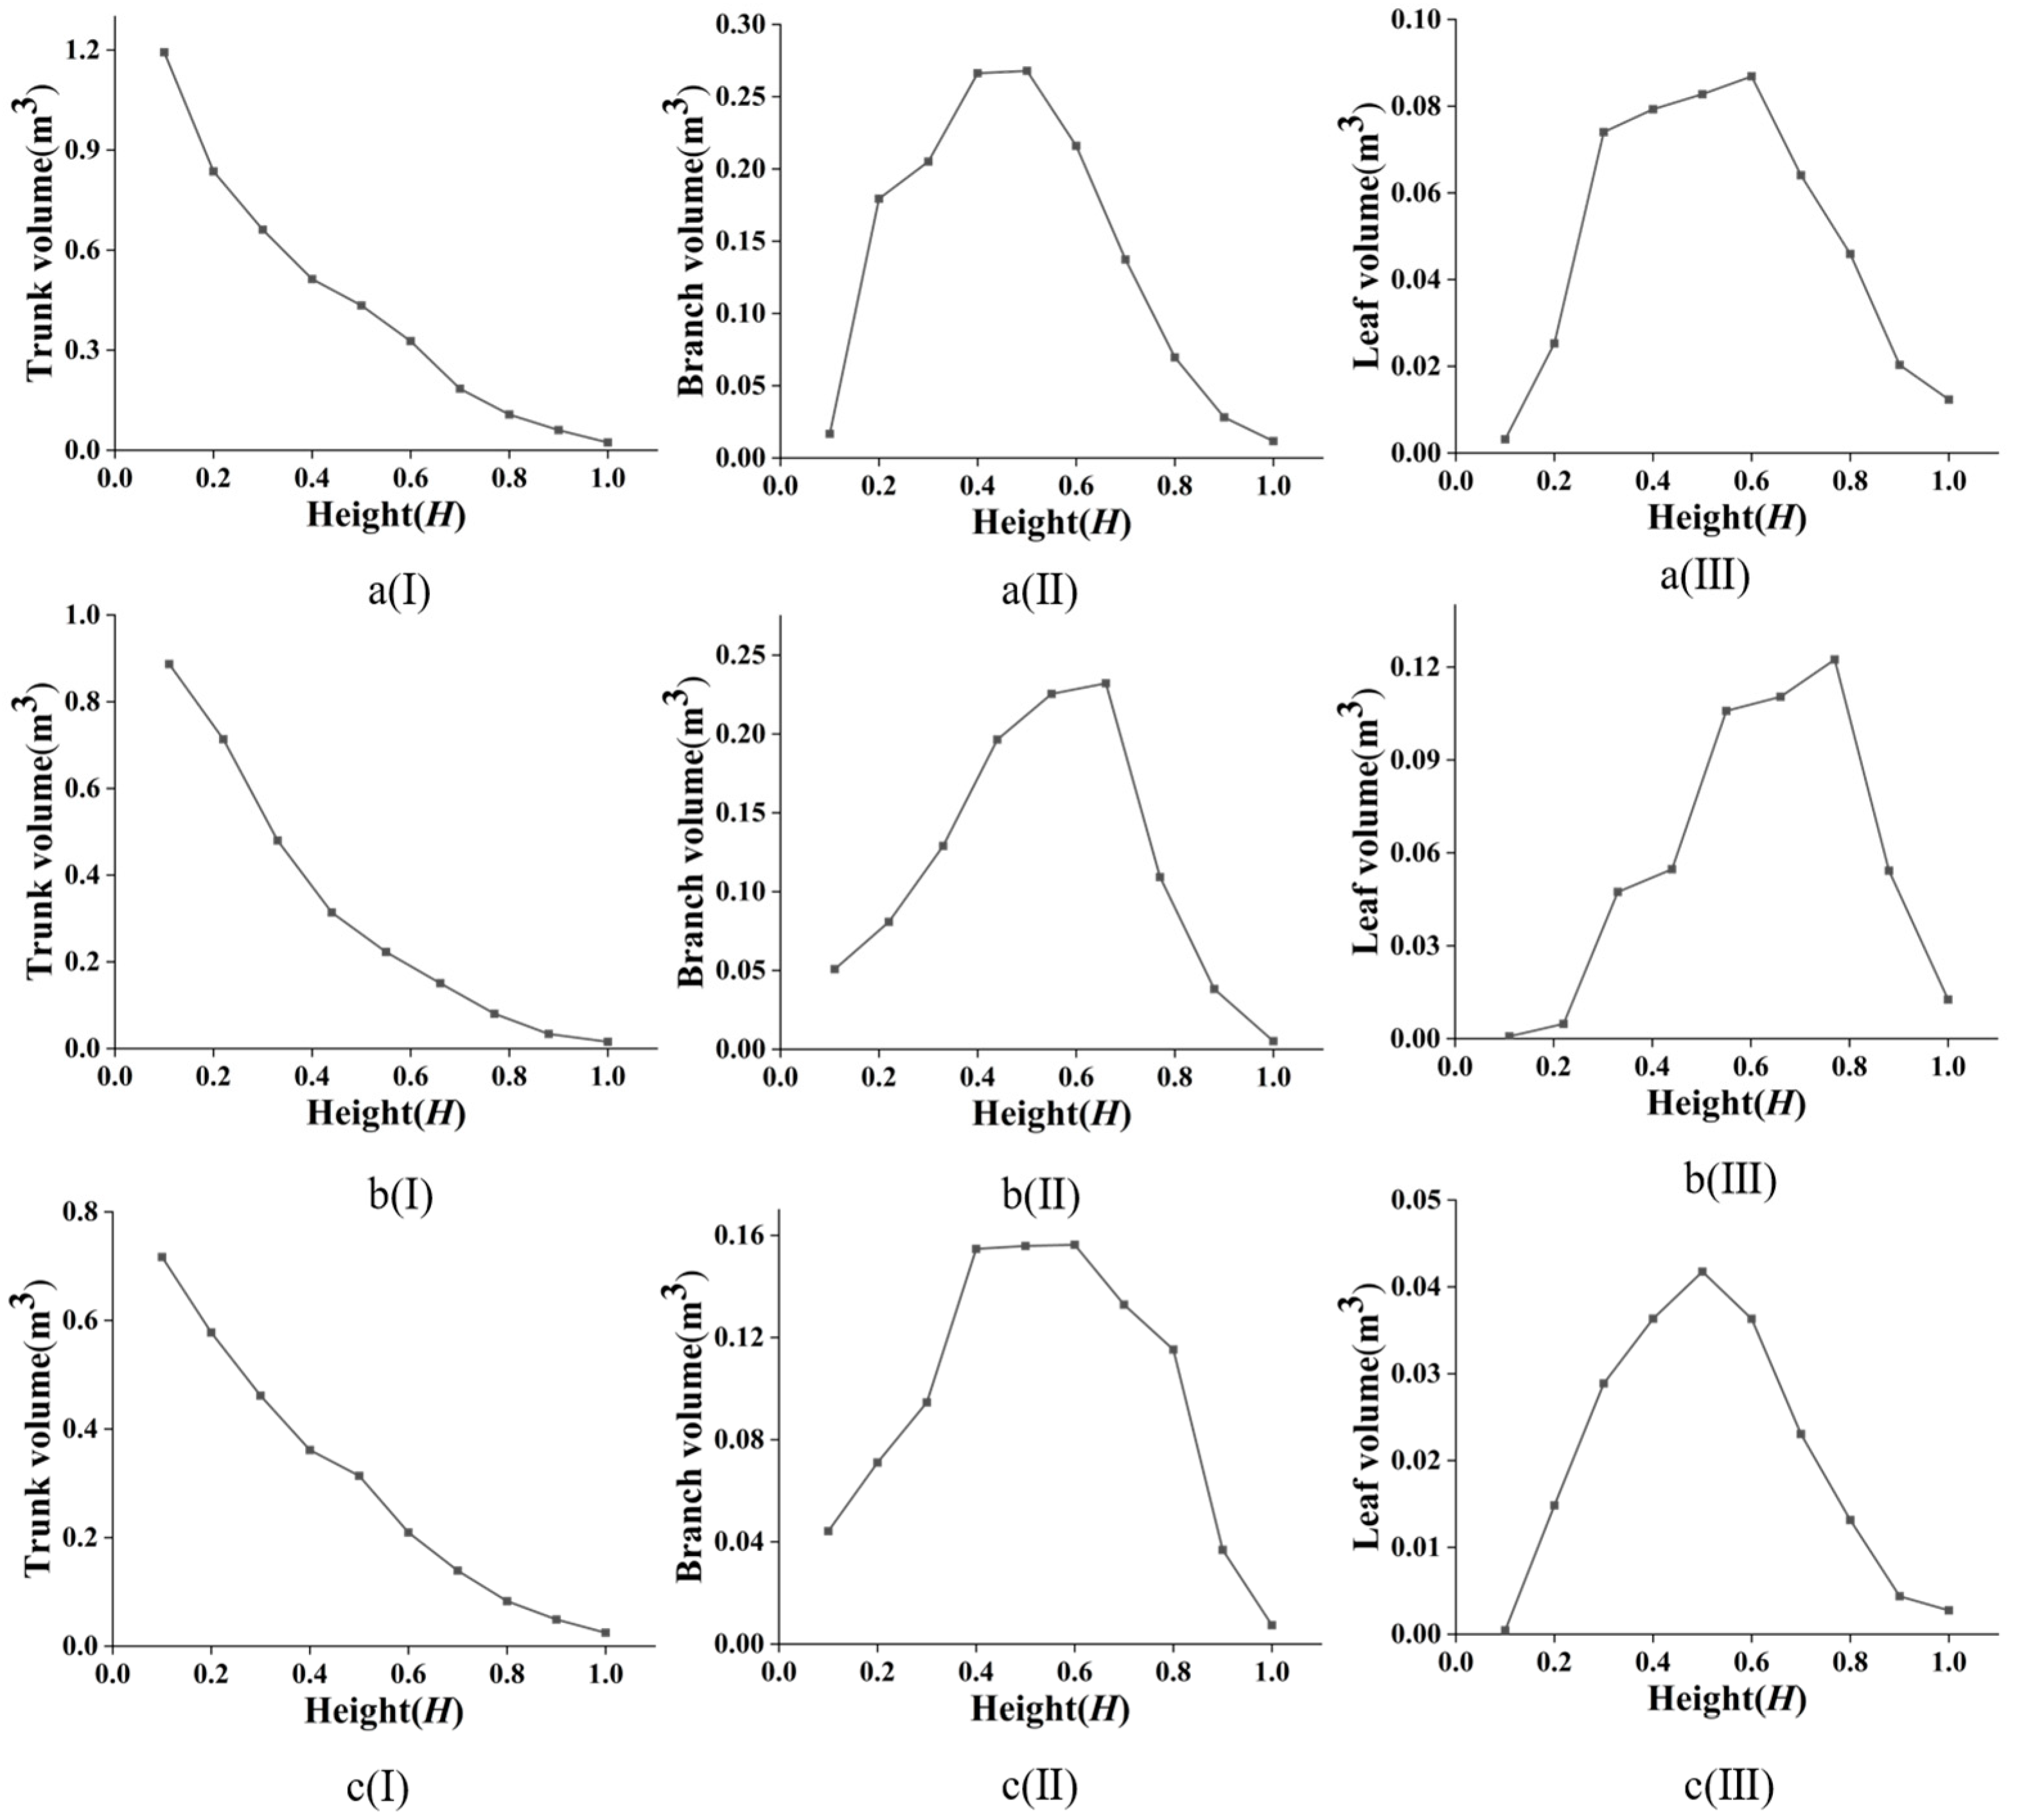
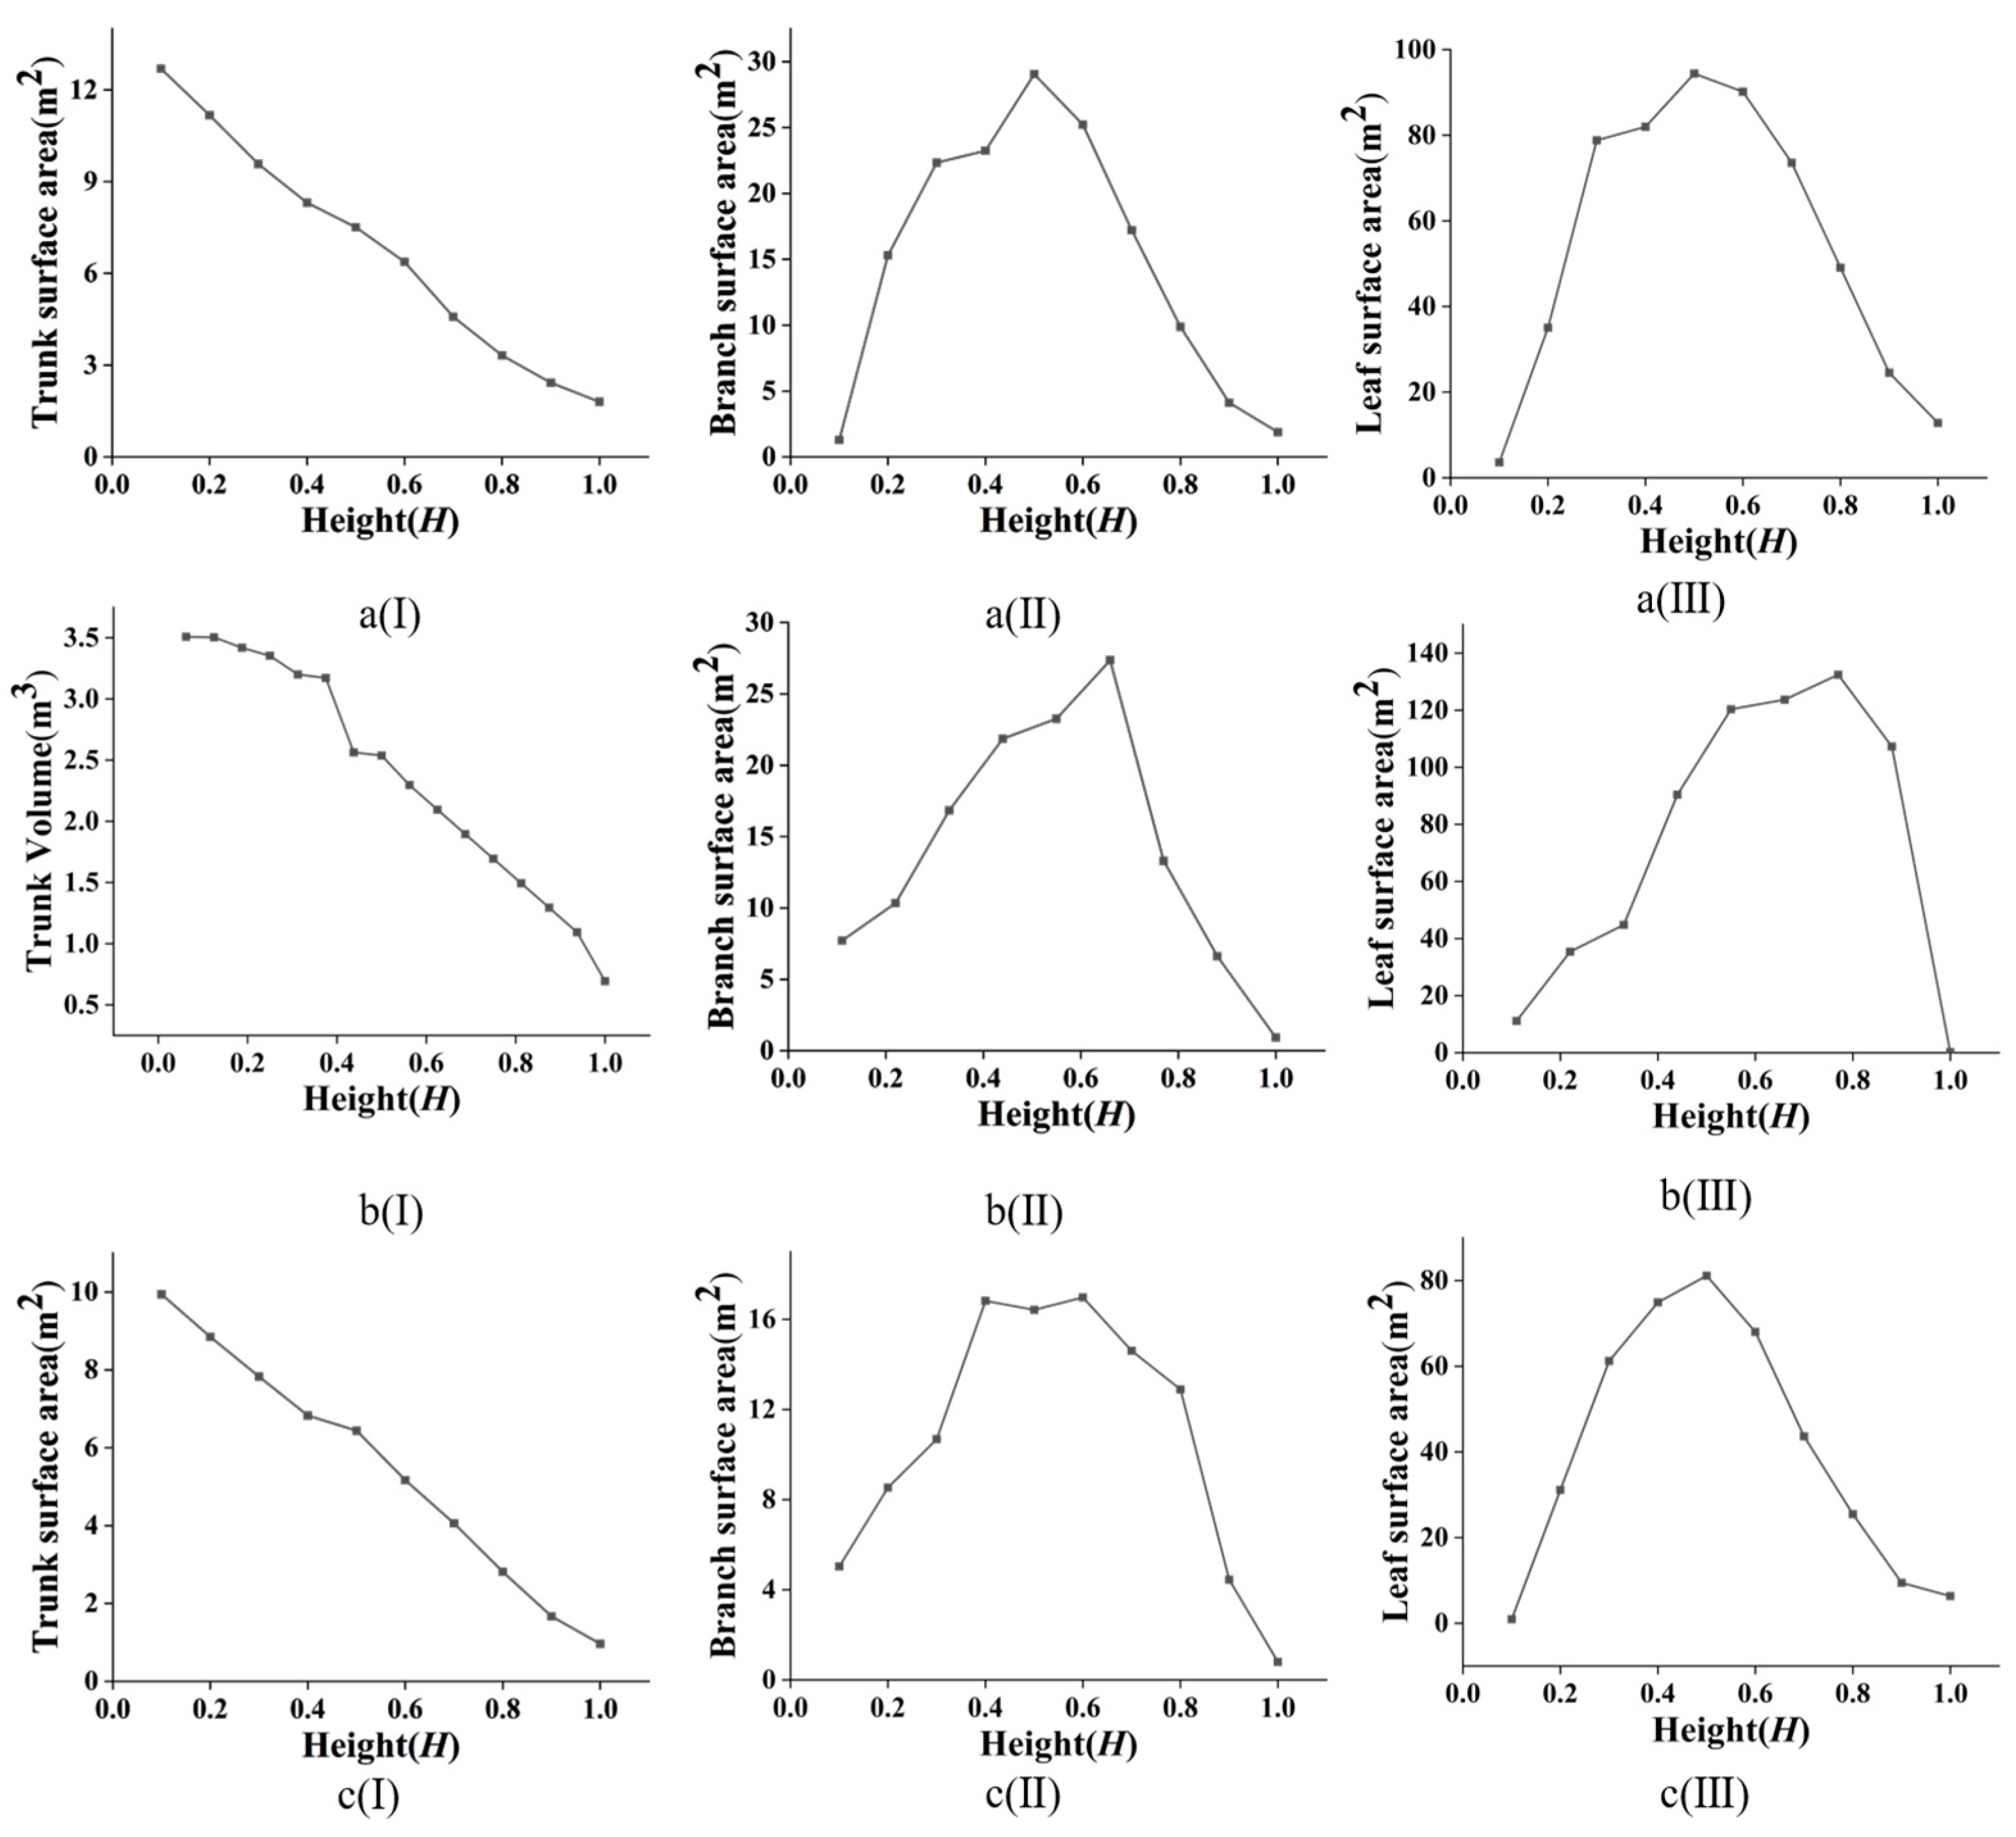
3.1.2. Tree Branch Structure

Branch architecture distribution analysis relied exclusively on TreeQSM-derived metrics. Figure 4a shows that the diameter of each branch decreases with an increase in branch level. On the whole, P. alba var. pyramidalis exhibited the largest mean branch diameters across all orders: 0.113 m (first), 0.061 m (second), 0.029 m (third), and 0.011 m (fourth). In contrast, P. nigra var. thevestina showed the smallest mean branch diameters. The length distribution patterns are consistent with those of branch diameters (Figure 4b), with P. alba var. pyramidalis demonstrating the most extensive length variation in the first branches (0.226–10.457 m).
In terms of average branch angle size, the order of the tree species was P. alba var. pyramidalis (51.131°) > P. popular’s (48.209°) > P. nigra var. thevestina (47.277°). The branch angle of all trees increased gradually from the first to the fourth grade, and that of P. popular’s demonstrated the greatest increase (Δ9.733°, from 42.341° to 52.074°) compared to P. nigra var. thevestina, which showed minimal variation (Δ1.701°, from 46.591° to 48.292°). The patterns of variation in both branch surface area and tree volume with branch level were consistent (Figure 5), that is, the branch surface area and volume decreased gradually from the first to the fourth grade. The mean values of both branch surface area and volume across all orders consistently exhibited the following species ranking: P. alba var. pyramidalis > P. popular’s > P. nigra var. thevestina.
With an increase in the branch level, the number of branches increased first and then decreased. The average BR values of the three species were in the order P. alba var. pyramidalis > P. nigra var. thevestina > P. popular’s. The BR2:1 was highest in P. nigra var. thevestina (3.279), while the BR3:2 was highest in P. alba var. Pyramidalis (0.981). P. popular’s had the highestRBD at all levels.

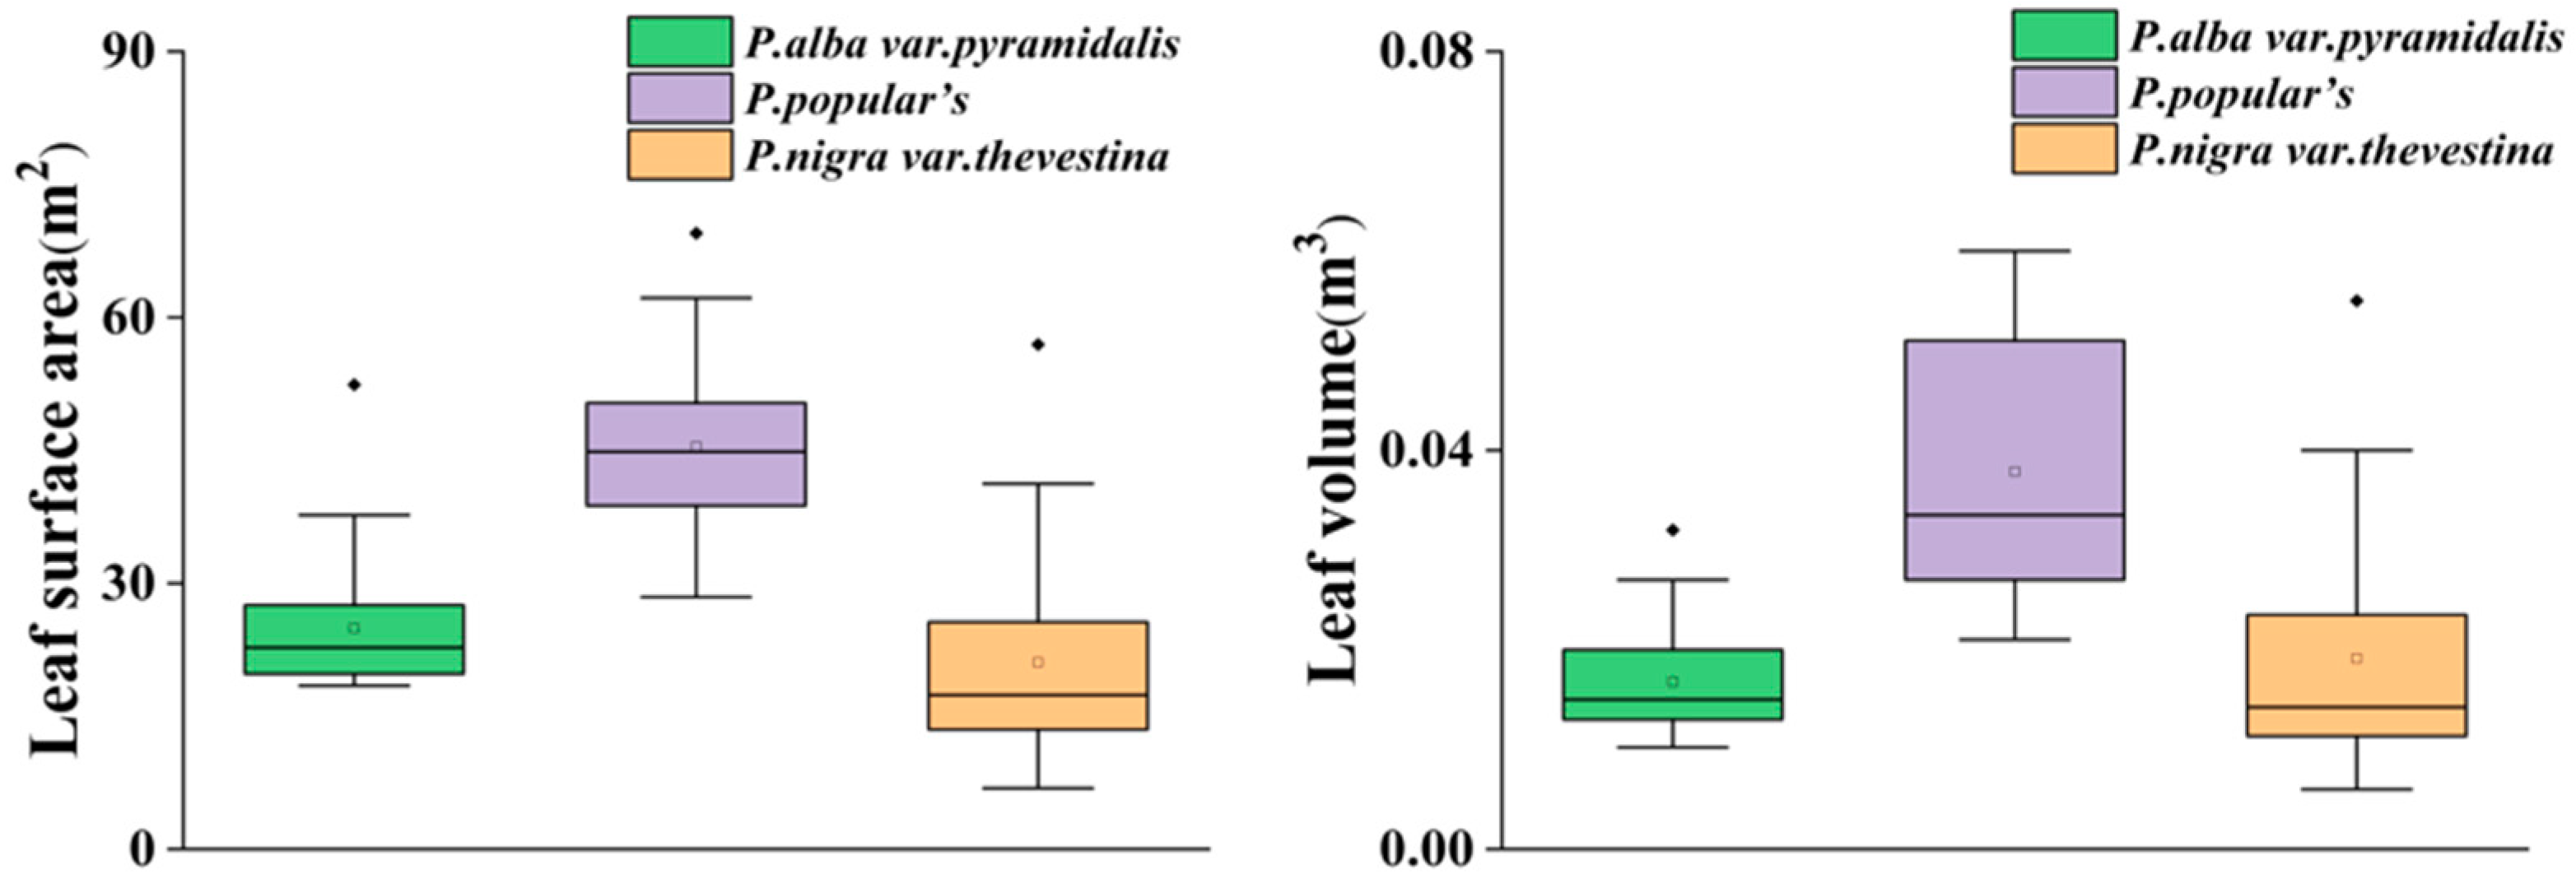
3.1.3. Tree Leaf Structure

As shown in Figure 6, P. nigra var. thevestina had the widest variation in leaf surface area (LS) (6.871–56.954 m2) and volume (LV) (0.006–0.055 m3), while P. alba var. pyramidalis demonstrated more concentrated distributions (18.443–52.421 m2 and 0.010–0.032 m3, respectively). The average leaf surface area and volume of the trees were in the order of P. popular’s > P. alba var. pyramidalis > P. nigra var. thevestina.

3.2. Shelterbelt Structure

3.2.1. Integral Structure of Shelterbelt

Table 3 lists the two-dimensional structural parameters of the shelterbelts, among which P. nigra var. thevestina had the lowest Op (0.424), followed by P. alba var. pyramidalis. P. nigra var. thevestina had the highest Op. On comparing the density of shelterbelts (Table 4), the Scd of P. popular’s was the largest (0.252 m2·m−3), while the Scd of P. alba var. pyramidalis was the smallest (0.205 m2·m−3). Vcd changed consistently with Scd. However, changes between volume porosity (Vp) and Op were inconsistent. The P. alba var. pyramidalis shelterbelt had the highest Vp.

3.2.2. Spatial Distributions of Trunk, Branch, and Leaf in the Shelterbelts

The vertical distribution of the volume and surface area of tree trunks, branches, and leaves in the three shelterbelts is presented in Figure 7 and Figure 8. The volume of the trunk decreases gradually with an increase in height, and the decline rate slows down gradually as height increases. The volume of branches and leaves showed a similar inverted U-shaped distribution with height.
Branch volume was generally higher at medium heights, and the value decreased sharply as height increased. The height segments with maximum branch volumes for the three shelterbelts were P. alba var. pyramidalis (0.40 H–0.50 H), P. popular’s (0.55 H–0.65 H), and P. nigra var. thevestina (0.40 H–0.60 H). For the P. popular’s shelterbelt, branch volume decreased the fastest after reaching the maximum value. The leaves were mostly concentrated in the middle and lower part of the shelterbelt (0.44 H–0.60 H). The leaves of P. alba var. pyramidalis and P. nigra var. thevestina were mostly concentrated at the medium and low heights of the shelterbelt (0.44 H–0.60 H). P. popular’s shelterbelt leaves were mostly concentrated at upper heights (0.75 H–0.82 H).
In the horizontal direction, the overall volume proportion of each component was in the order of trunk > branches > leaves. The proportions of trunks and branches in the P. alba var. pyramidalis shelterbelt were the largest among the three species, at 68.989% and 29.641%, respectively. The proportion of leaves was the largest in the P. popular’s shelterbelt (7.971%). The surface area contribution of each component was in the order leaf > branch > trunk. The P. alba var. pyramidalis shelterbelt had the largest proportions of trunk and branch surface area, at 13.203% and 36.725%, respectively. The P. popular’s shelterbelt had the largest proportion of leaf surface area (79.691%).

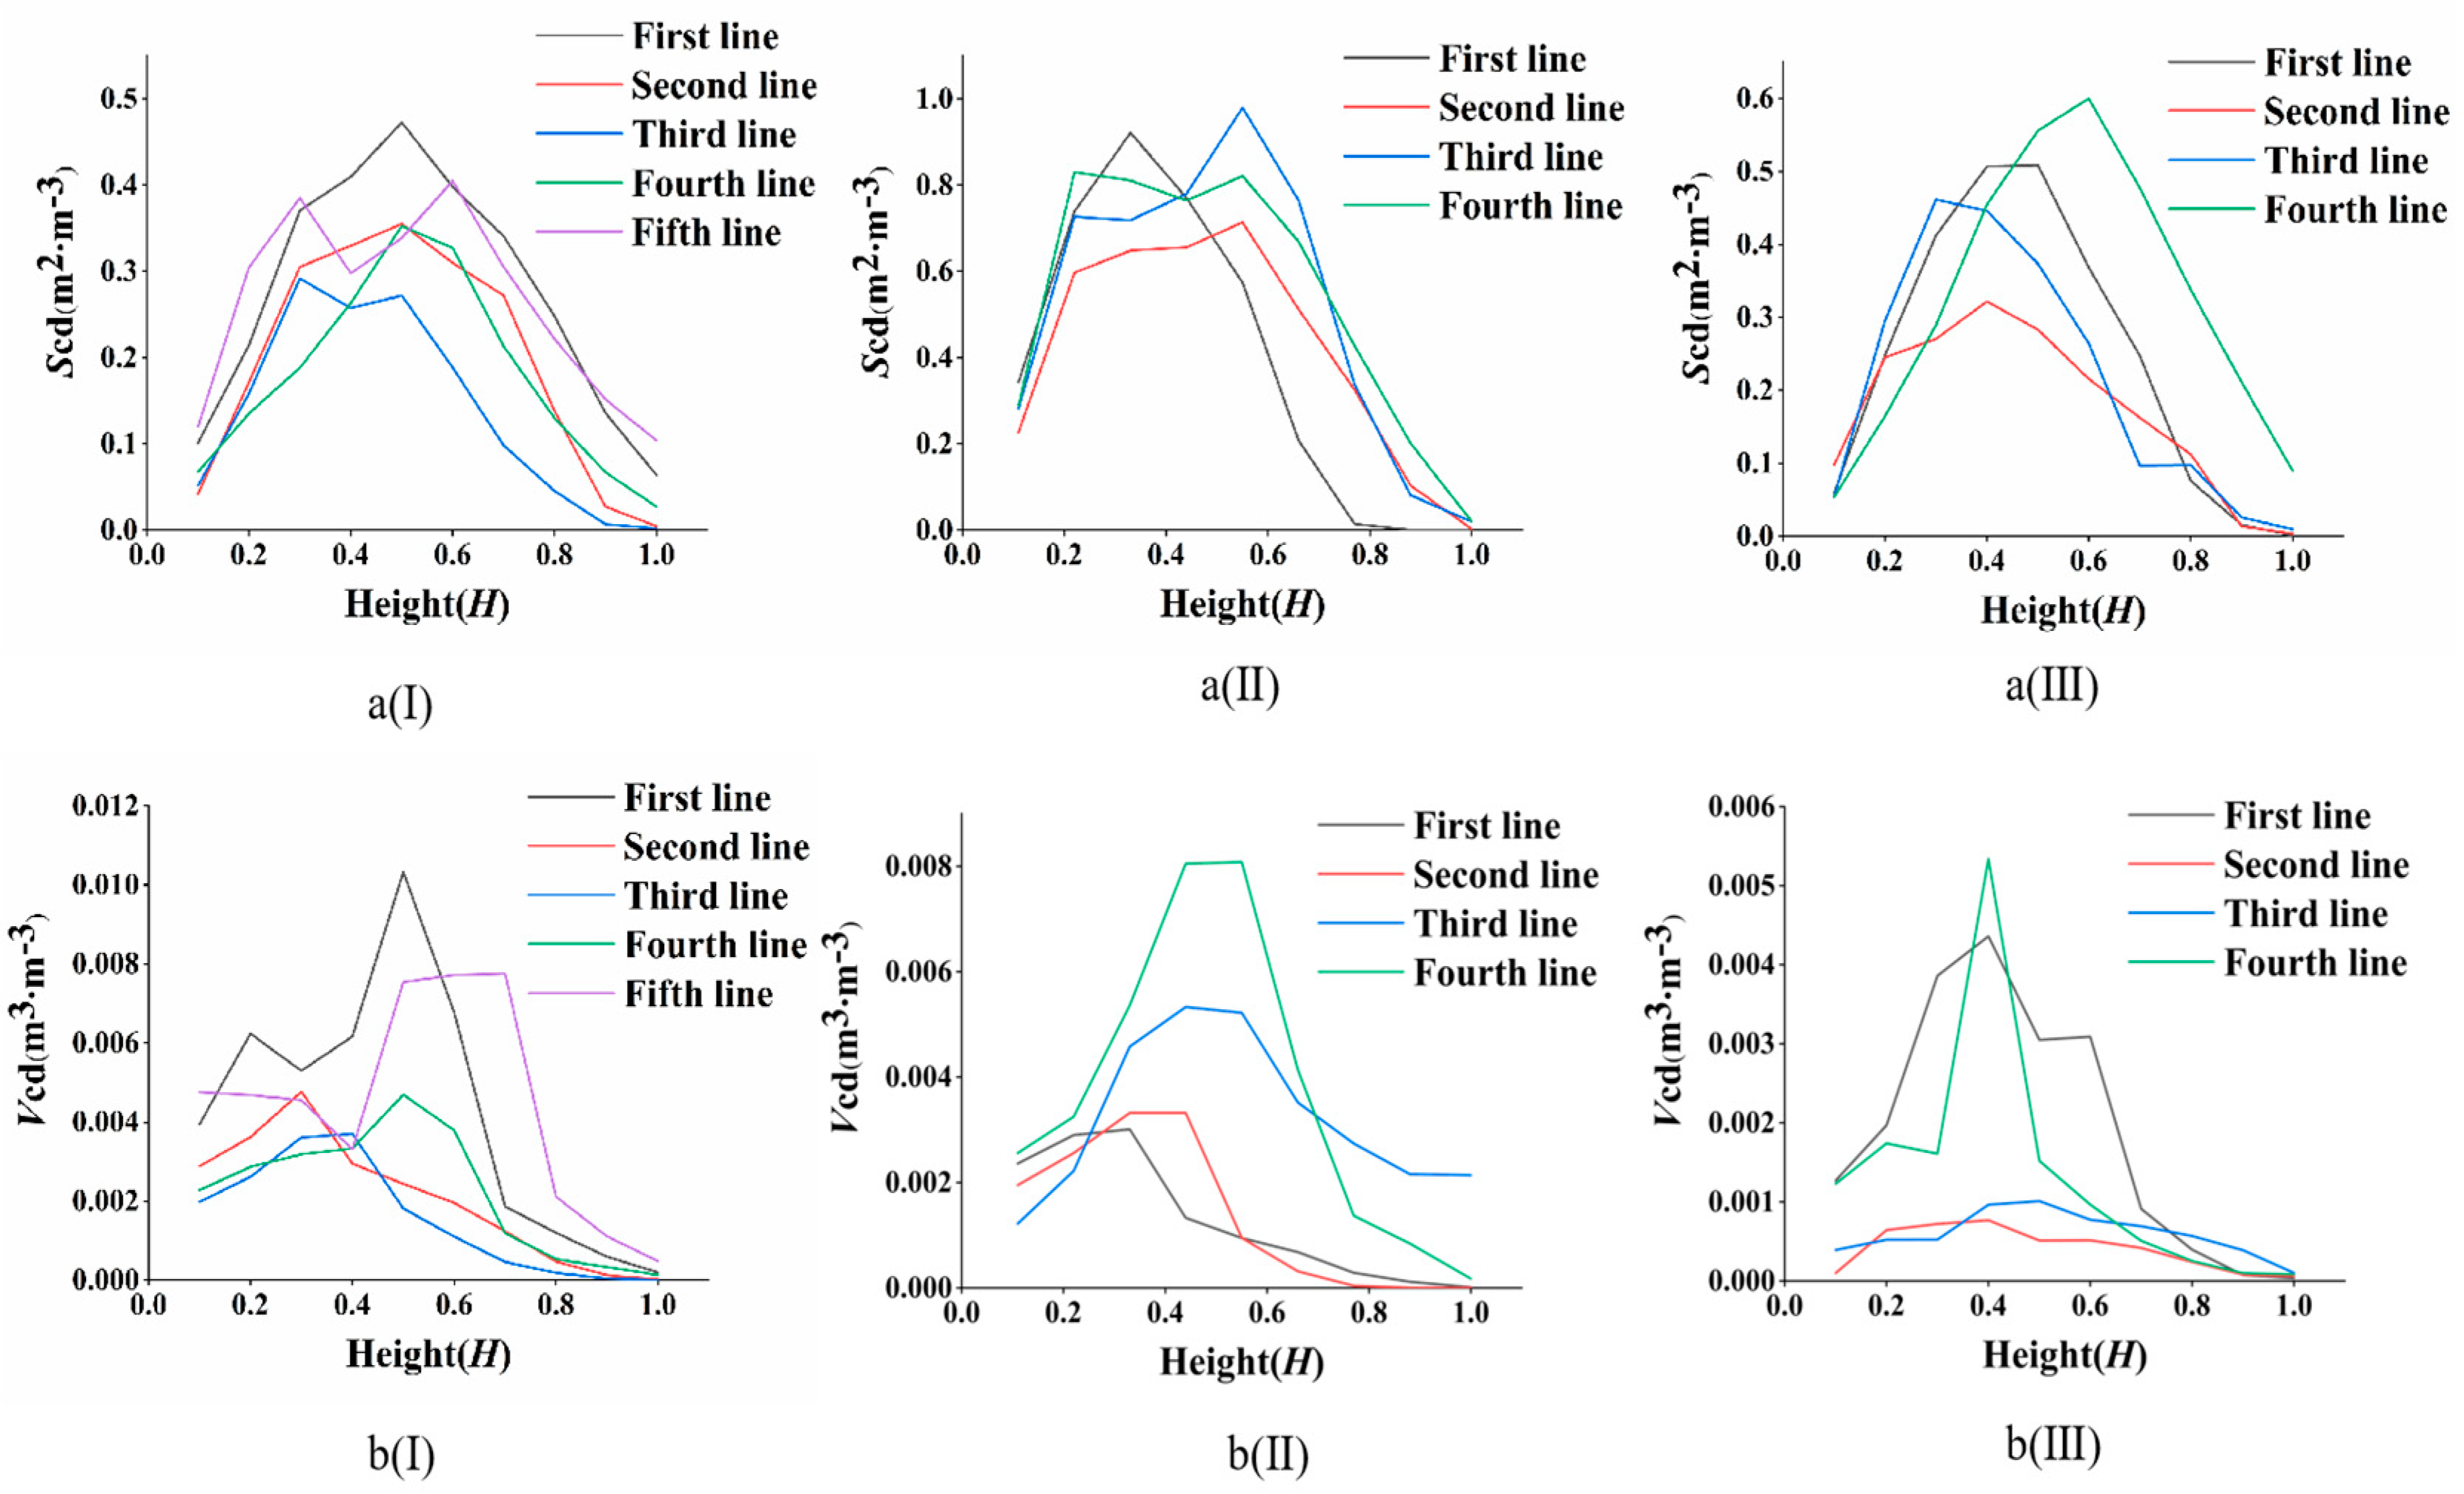
3.2.3. Spatial Distributions of Scd and Vcd in the Shelterbelts

As shown in Figure 9, in the vertical direction, the maximum Vcd and Scd were mostly located at medium and low heights of the shelterbelt (0.33 H–0.60 H). The Scd of the P. alba var. pyramidalis shelterbelt was greatest in the range 0.40 H to 0.60 H, that of the P. popular’s shelterbelt was greatest in the range 0.33 H to 0.60 H, and that of the P. nigra var. thevestina shelterbelt was greatest in the range of 0.40 H to 0.60 H (Figure 9a).
In the horizontal direction, the average Scd of the five-row P. alba var. pyramidalis shelterbelt, running from the first row to the fifth row, showed a trend of first decreasing and then increasing. Similarly, the maximum Vcd appeared in the first row (0.004 m3·m−3) and the fifth row (0.004 m3·m−3) on both sides of the shelterbelt. The minimum Vcd appeared in the third row (0.002 m3·m−3), with an obvious edge effect. The average Scd (0.397 m2·m−3–0.537 m2·m−3) and Vcd (0.001 m3·m−3–0.004 m3·m−3) of the P. popular’s shelterbelt increased gradually from the first row to the fourth row, and the difference in growth between the two marginal rows was large. The average Scd of the four-row P. nigra var. thevestina shelterbelt was higher in the outer two rows (0.244 m2·m−3–0.324 m2·m−3) than in the middle two rows (0.173 m2·m−3–0.213 m2·m−3), while the Vcd increased gradually.

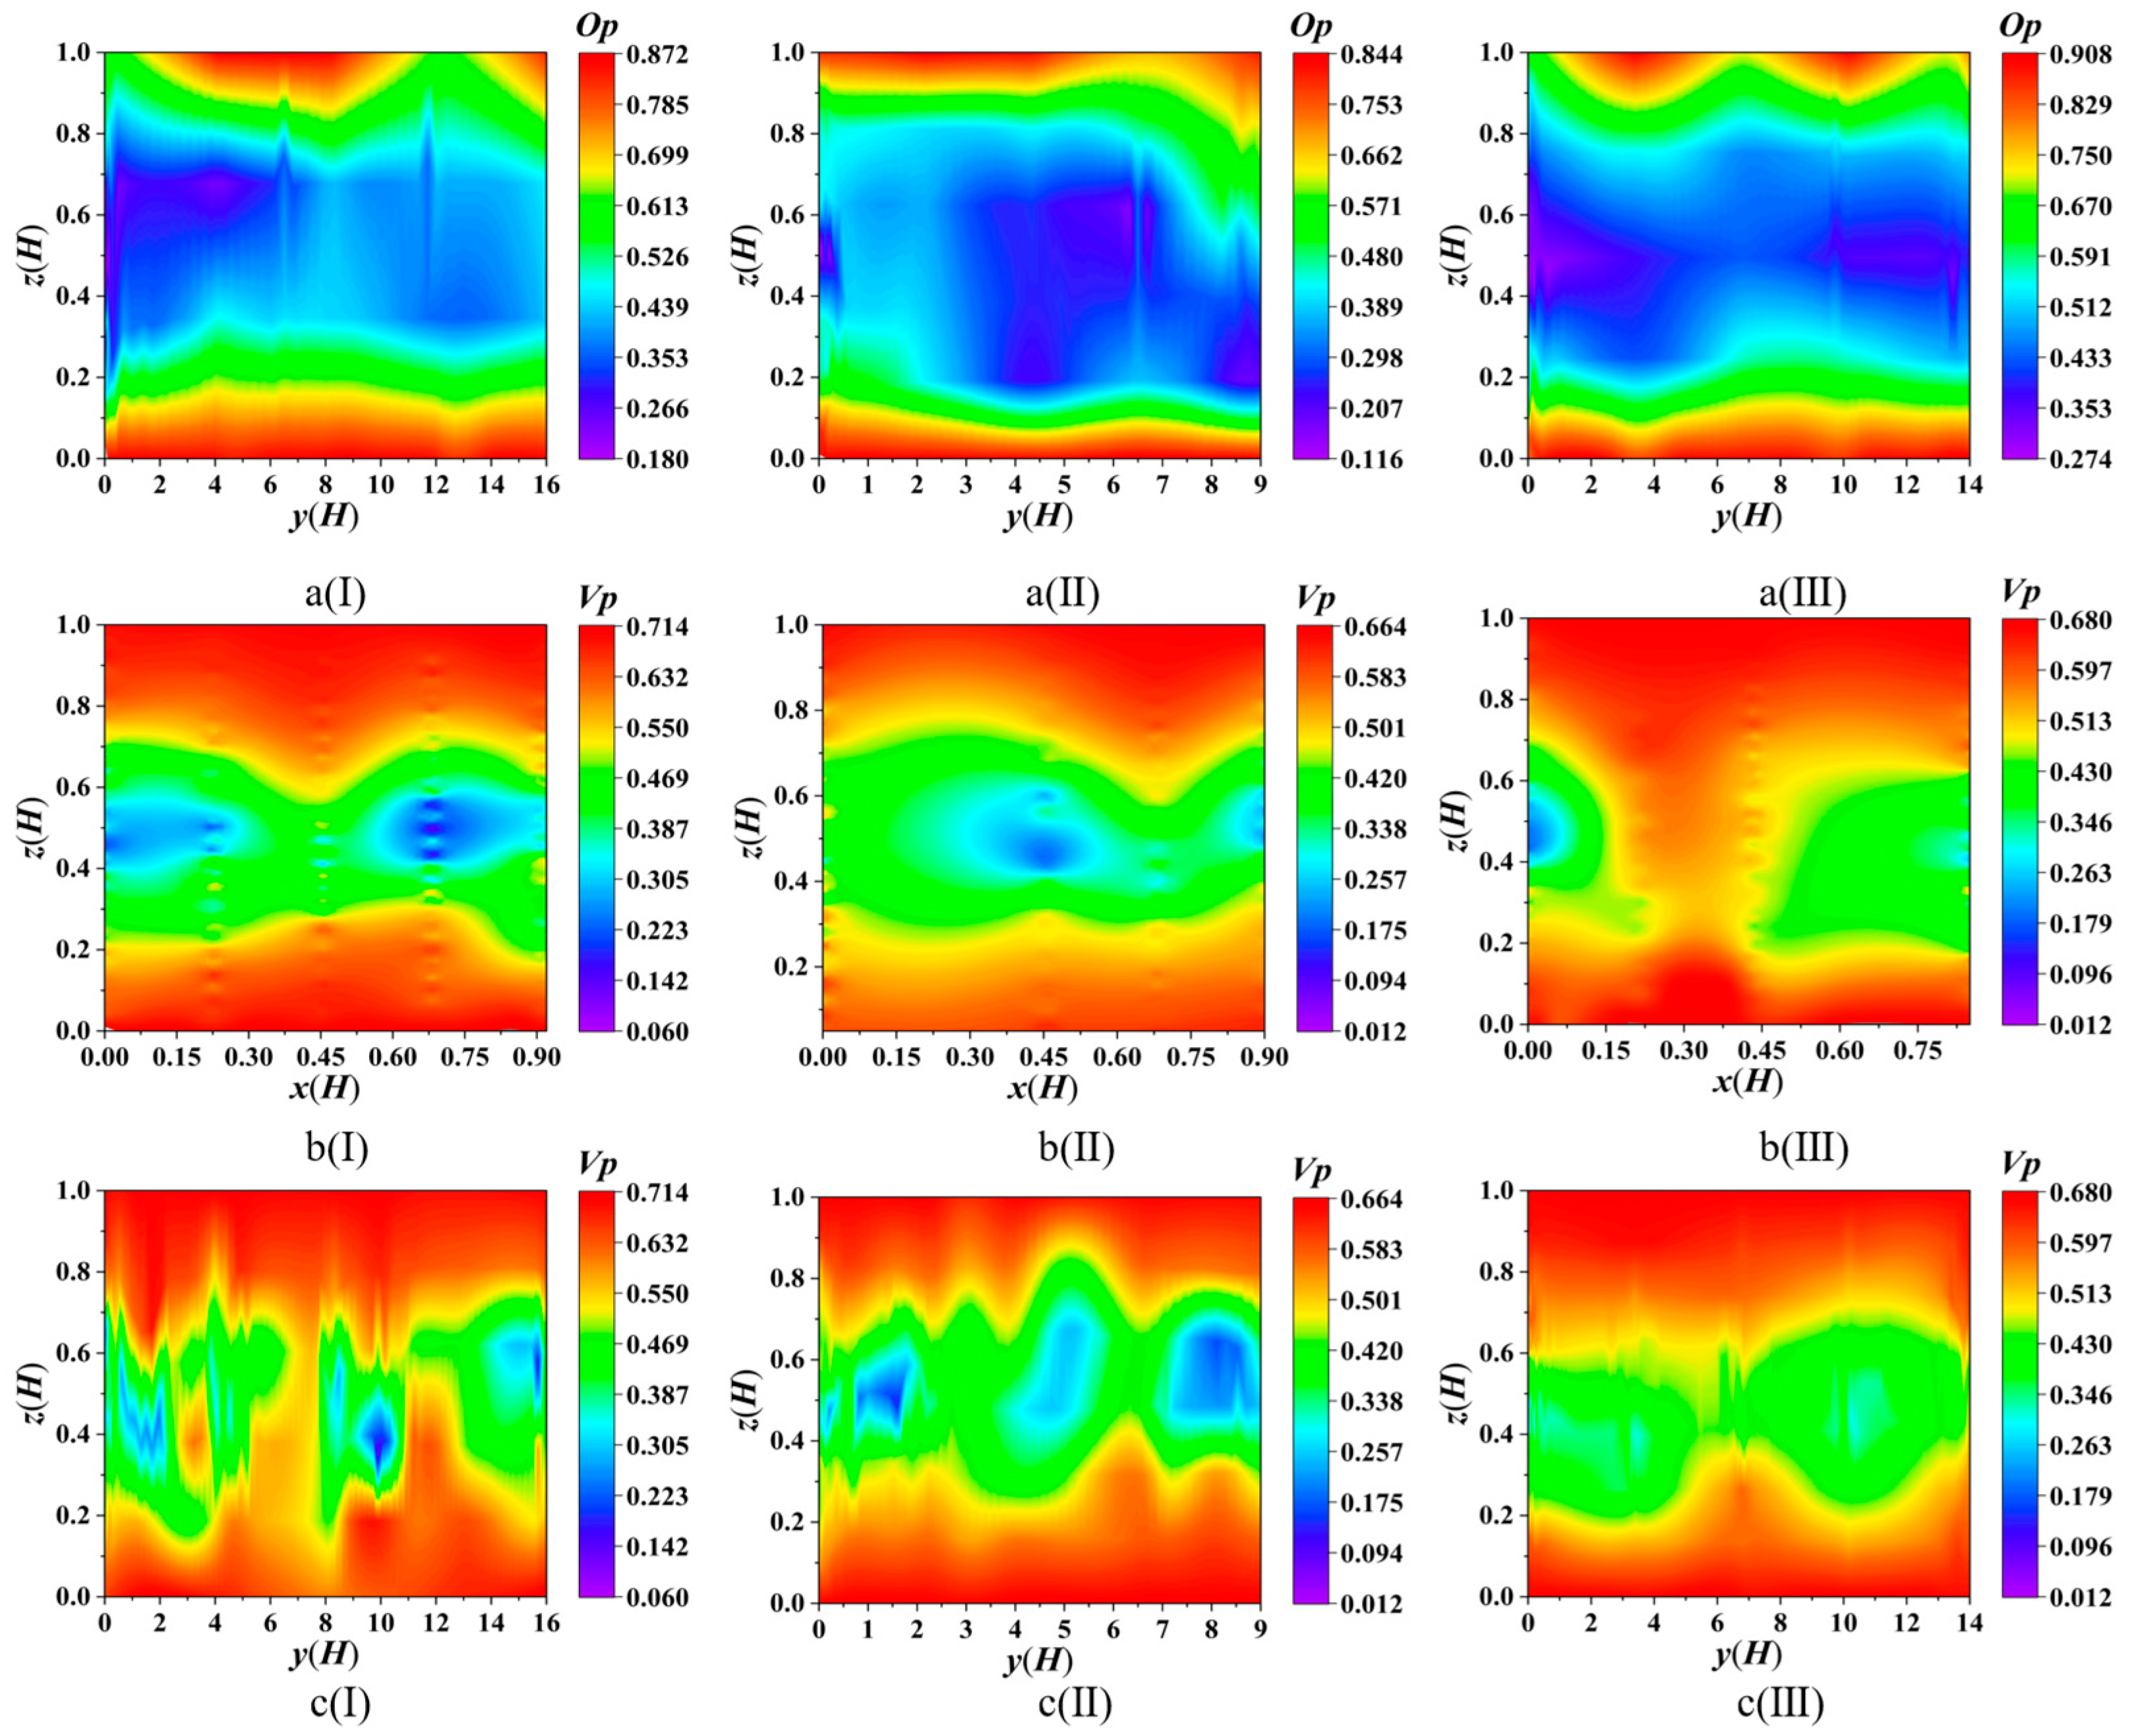
3.2.4. Spatial Distributions of Op and Vp in the Shelterbelts

The results demonstrate heterogeneity in both vertical and horizontal distributions of Op (Figure 10a) and Vp across the shelterbelts. Along the horizontal dimension, variations in Op along the belt length were insignificant at heights below 0.20 H. Within the 0.20 H–0.80 H range, porosity increased markedly in central sections: P. alba var. pyramidalis (6.20 H–9.00 H), P. popular’s (0.50 H–2.00 H) and P. nigra var. thevestina (6.55 H–10.00 H). Above 0.80 H, P. alba var. pyramidalis exhibited pronounced porosity increases in both central (1.85 H–10.93 H) and distal (11.30 H–13.87 H) sections, whereas P. nigra var. thevestina displayed gradual increases along its length and P. popular’s maintained relatively stable values.
The spatial variation in Op in shelterbelts was predominantly vertical. With increasing height, Op initially decreased then increased. Op exceeded 0.800 at z < 0.10 H and 0.700 at z > 0.90 H. Minimum values occurred at P. alba var. pyramidalis (0.181 at 0.67 H), P. popular’s (0.117 at 0.59 H), and P. nigra var. thevestina (0.274 at 0.43 H), all located at medium heights.
Variations in shelterbelt Vp in x, y, and z are presented in Figure 10. Across the shelterbelt width (x, Figure 10b), P. alba var. pyramidalis exhibited lower values in edge rows (0.00 H–0.30 H and 0.65 H–0.90 H). P. popular’s showed reduced levels at 0.30 H–0.50 H and 0.85 H–0.90 H, whereas P. nigra var. thevestina demonstrated minimal measurements in 0–0.15 H zones but higher readings at 0.20 H–0.45 H. Along the shelterbelt length (y, Figure 10c), P. alba var. pyramidalis displayed elevated porosity in central sections (6.01 H–7.98 H and 10.93 H–13.02 H), P. popular’s maintained depressed edge levels (±1.50 H), and P. nigra var. thevestina showed relatively stable distribution.
The change in vertical distributions of Vp was significantly different from that of Op. The value of P. alba var. pyramidalis ranged from 0.062 to 0.714 (minimum 0.45 H), that of P. popular’s ranged from 0.001 to 0.662 (minimum 0.50 H), and that of P. nigra var. thevestina ranged from 0.013 to 0.679 (minimum 0.25 H), with the lowest values seen at mid–low heights.

4. Discussion

4.1. Feasibility Analysis of the Methodology

The proposed LeWoS-TreeQSM-3D alpha-shape integrated method demonstrates outstanding performance in quantifying structural parameters of shelterbelts. Multispecies validation (Table 5) confirms the method’s high reliability in extracting key parameters, including tree height (with a minimal bias of −0.455 m for P. popular’s), DBH (showing the highest accuracy among whole-tree parameters), and tree volume and surface area (all exceeding 91.810% relative accuracy). These findings align with previous studies by Jin et al. [39], reporting high extraction accuracy for tree volumes. Hildebrandt et al. [40] carried out a three-dimensional reconstruction of trees, divided the reconstructed model into several parts according to a certain length, and calculated the volume of each part, and they observed an error within 1% between the obtained result and the measured value.
The further validation of branch parameters (Table 6) demonstrated that P. popular’s exhibited the highest extraction accuracy for branch length and diameter, with mean rRMSE values of 7.575% and 2.087%, respectively. In contrast, P. nigra var. thevestina showed the lowest relative accuracy in branch length (90.774%). This observation aligns with Lau et al. [41], who achieved 95.0% reconstruction accuracy for branches exceeding 30 cm in diameter in their sample of 279 modeled branches. The branch angle error analysis between measurements and extracted values revealed that P. alba var. pyramidalis exhibited the maximum rBias (−4.003%) (Table 6). The lowest relative accuracy of the leaf surface area was 76.870%. This may result from overlapping adjacent canopies leading to incomplete crown segmentation, ultimately affecting the extraction accuracy of individual crown and leaf surface area parameters. As demonstrated by Béland et al. [42], three primary factors influence leaf parameter estimation in TLS measurements: (1) wood–leaf point cloud separation, (2) leaf orientation effects, and (3) mutual occlusion between point clouds. Collectively, these results confirm the method’s high accuracy in measuring tree height, DBH, and branch architecture parameters, demonstrating its strong applicability for the three-dimensional structural quantification of shelterbelts.

4.2. The Significance of Stratified Porosity

Shelterbelt structures exhibit the heterogeneous spatial distribution patterns of their components (branches, trunks, leaves, etc.), demonstrating the limitations of integral parameter characterization. Traditional optical porosity utilizes a single value that cannot capture three-dimensional pore architecture heterogeneity. Notably, shelterbelts with distinct configurations may show identical optical porosity values but differ significantly in ventilation performance [43]. Analysis of the spatial distribution patterns of Op and Vp further reveals pronounced variations along the width dimension (x-axis), which cannot be neglected. Empirical studies demonstrate that the product of width and area density (W·Ad) serves as the dominant predictor of windbreak efficiency [7]. The non-uniform distribution of pores makes it difficult to accurately characterize micro-environmental variations, such as turbulence in wind shadow zones, using optical porosity [44,45].
Stratified porosity analysis reveals distinct vertical structural patterns in shelterbelts, typically showing higher porosity in trunk layers and lower values in lower-to-middle canopies. Wuyts et al. [46] and Lalic et al. [47] demonstrated that sparse trunk layers minimize airflow resistance, sustaining higher wind speeds, whereas dense canopy regions enhance drag forces and reduce wind velocity. Research has demonstrated that shelterbelts with non-uniform density distributions exhibit superior windbreak efficiency in peak-density zones compared to homogeneous structures, highlighting the critical role of internal structural heterogeneity in defensive performance [48,49]. Stratified porosity analysis is scientifically valuable for evaluating farmland shelterbelt ecological functions. It precisely characterizes spatial structural heterogeneity and its mechanistic effects on key processes like windbreak and light penetration.

4.3. Shelterbelt Planning and Management Guidelines

Stratified porosity analysis effectively characterizes shelterbelt pore structure spatiotemporal variations, as demonstrated in this study. The edge rows exhibit significantly reduced porosity due to dense foliage, consequently decreasing light’s availability for adjacent crops. Previous research has established that shelterbelt porosity directly influences inter-row light transmittance [50]. Specifically, photosynthetically active radiation (PAR) in sheltered zones is markedly lower than that in open areas. Field studies have reported 22%–27% yield reductions in edge-row corn fields adjacent to poplar shelterbelts due to shading effects [51]. Computer simulations revealed that shelterbelts in New Zealand kiwifruit orchards can reduce canopy irradiance by up to 40%, with shading intensity showing a significant positive correlation with shelterbelt leaf area index [52]. These findings suggest that pruning interventions should be implemented when edge porosity decreases to optimize both the shelterbelt structure.
The degradation of trees within shelterbelts can trigger a cascade of ecological consequences. As demonstrated by Holzwarth et al. [53] and Buettel et al. [54], tree degradation significantly compromises wood structural integrity, increasing the risks of stem breakage and wind throw, leading to gap formation. These forest gaps substantially alter microclimatic conditions, including light intensity, temperature, and soil moisture. Empirical evidence shows that ecological restoration of degraded farmland shelterbelts can effectively reduce porosity and attenuate wind velocity [55]. Consequently, when monitoring detects abnormal increases in internal shelterbelt porosity, immediate replanting measures are necessary to maintain structural continuity.
The disruption of shelterbelt continuity induces pronounced wind erosion effects. When gaps or broken rows occur between shelterbelt segments, these discontinuous areas create wind acceleration channels, leading to airflow convergence and enhanced turbulence at breakpoints. Studies demonstrate that these structural discontinuities significantly increase local wind energy transport efficiency, causing the abrupt acceleration of field wind speeds and consequently exacerbating wind erosion risks [55,56]. The study employed wooden rectangular barrier models to systematically measure three-dimensional velocity fields across both horizontal and vertical planes, revealing airflow acceleration at gap locations [57]. These findings underscore that restoring continuity through the replacement of degraded tree species is critical for maintaining windbreak ecological functions.

5. Conclusions

This study utilized LiDAR technology to analyze three typical shelterbelts in the Ulan Buh Desert oasis. A point cloud-based method integrating the LeWoS leaf–wood separation algorithm, tree QSM algorithm, and 3D alpha-shape algorithm was developed to enhance the efficiency and accuracy of structural parameter extraction. The results indicate that extraction relative accuracy reached 90.774% for all parameters, except leaf surface area. In branch architecture analysis, P. alba var. pyramidalis exhibited significantly greater branch length, diameter, and branching ratio compared to the other two species. Spatial analysis revealed distinct horizontal edge effects, while vertical profiles indicated higher density distributions in mid-to-lower canopy layers (0.33 H–0.60 H), contradicting the conventional homogeneous canopy assumption. A quantitative assessment of shelterbelt density and porosity led to the proposed use of stratified structural parameters to characterize porosity features, enabling the development of optimized management strategies for regional farmland shelterbelts. Future research will employ computer simulations to analyze how stratified porosity governs windbreak and shading effects, ultimately helping to develop an intelligent system for real-time structural optimization.

Author Contributions

Conceptualization, X.J. and H.X.; methodology, X.J. and Z.X.; software, X.J. and G.F.; validation, X.J.; formal analysis, X.J.; investigation, X.J.; resources, H.X.; data curation, X.J.; writing—original draft preparation, X.J.; writing—review and editing, X.J., H.X. and J.L.; visualization, X.J.; supervision, H.X.; funding acquisition, H.X. All authors have read and agreed to the published version of the manuscript.

Funding

This research was funded by the National Natural Science Foundation of China (32371961), the National Key Research and Development Program of China (2023YFE0121800) and the National Key Research and Development Program of China (2023YFF1304204).

Data Availability Statement

Data available on request due to restrictions, e.g., privacy or ethical.

Acknowledgments

The authors would like to thank Huaiyuan Liu for his coordination and maintenance of the experimental instruments.

Conflicts of Interest

The authors declare no conflicts of interest.

References

  1. Brandle, J.R.; Hodges, L.; Zhou, X.H. Windbreaks in North American agricultural systems. Agrofor. Syst. 2004, 61, 65–78. [Google Scholar] [CrossRef]
  2. Campi, P.; Palumbo, A.D.; Mastrorilli, M. Effects of tree windbreak on microclimate and wheat productivity in a Mediterranean environment. Eur. J. Agron. 2009, 30, 220–227. [Google Scholar] [CrossRef]
  3. Shi, X.; Li, Y.; Deng, R. A method for spatial heterogeneity evaluation on landscape pattern of farmland shelterbelt networks: A case study in midwest of Jilin Province, China. Chin. Geogr. Sci. 2011, 21, 48–56. [Google Scholar] [CrossRef]
  4. Stadnik, A.P. The role of the structure of field shelterbelts in the forming of the agricultural landscape. Lesn. Khoz Yaistvo 1989, 8, 54–56. [Google Scholar]
  5. Heisler, G.M.; Dewalle, D.R. Effects of windbreak structure on wind flow. Agric. Ecosyst. Environ. 1988, 22, 41–69. [Google Scholar] [CrossRef]
  6. Cornelis, W.; Gabriëls, D. 25 years of assessment of erosion-Preface. Catena 2005, 64, 139–141. [Google Scholar] [CrossRef]
  7. Torita, H.; Satou, H. Relationship between shelterbelt structure and mean wind reduction. Agric. For. Meteorol. 2007, 145, 186–194. [Google Scholar] [CrossRef]
  8. Cao, X.S. Shelterbelt for Farmland; China Forestry Publishing House: Beijing, China, 1983. (In Chinese) [Google Scholar]
  9. Loeffler, A.E.; Gordon, A.M.; Gillespie, T.J. Optical porosity and windspeed reduction by coniferous windbreaks in Southern Ontario. Agrofor. Syst. 1992, 17, 119–133. [Google Scholar] [CrossRef]
  10. Zhu, J.J.; Matsuzaki, T.; Gonda, Y. Optical stratification porosity as a measure of vertical canopy structure in a Japanese coastal forest. For. Ecol. Manag. 2003, 173, 89–104. [Google Scholar] [CrossRef]
  11. You, K.P.; Kim, Y.M. Wind Velocity Decreasing Effects of Windbreak Fence for Snowfall Measurement. Adv. Meteorol. 2014, 1, 791256. [Google Scholar] [CrossRef]
  12. Hong, S.W.; Lee, I.B.; Seo, I.H. Modelling and predicting wind velocity patterns for windbreak fence design. J. Wind Eng. Ind. Aerodyn. 2015, 142, 53–64. [Google Scholar] [CrossRef]
  13. Moskal, L.M.; Zheng, G. Retrieving Forest Inventory Variables with Terrestrial Laser Scanning (TLS) in Urban Heterogeneous Forest. Remote Sens. 2012, 4, 1–20. [Google Scholar] [CrossRef]
  14. Zheng, G.; Moskal, L.M.; Kim, S.H. Retrieval of Effective Leaf Area Index in Heterogeneous Forests with Terrestrial Laser Scanning. IEEE Trans. Geosci. Remote Sens. 2013, 51, 777–786. [Google Scholar] [CrossRef]
  15. Hopkinson, C.; Chasmer, L.; Young-Pow, C.; Treitz, P. Assessing forest metrics with a ground-based scanning lidar. Can. J. For. Res. 2004, 34, 573–583. [Google Scholar] [CrossRef]
  16. Palace, M.; Sullivan, F.B.; Ducey, M.; Herrick, C. Estimating tropical forest structure using a terrestrial lidar. PLoS ONE 2016, 11, e0154115. [Google Scholar] [CrossRef] [PubMed]
  17. Gonzalez de Tanago, J.; Lau, A.; Bartholomeus, H.; Herold, M.; Avitabile, V.; Raumonen, P.; Calders, K. Estimation of above-ground biomass of large tropical trees with terrestrial LiDAR. Methods Ecol. Evol. 2018, 9, 223–234. [Google Scholar] [CrossRef]
  18. Calders, K.; Adams, J.; Armston, J.; Bartholomeus, H.; Bauwens, S.; Bentley, L.P.; Chave, J.; Danson, F.M.; Demol, M.; Disney, M.; et al. Terrestrial laser scanning in forest ecology: Expanding the horizon. Remote Sens. Environ. 2020, 251, 112102. [Google Scholar] [CrossRef]
  19. Li, C.P.; Guan, W.B.; Fan, Z.P.; Su, F.X.; Wang, X.L. Advances in studies on the structure of farmland shelterbelt ecosystem. Chin. J. Appl. Ecol. 2003, 11, 2037–2043. (In Chinese) [Google Scholar]
  20. Tao, S.L.; Guo, Q.H.; Xu, S.W.; Su, Y.J.; Li, Y.M.; Wu, F.F. A Geometric Method for Wood-Leaf Separation Using Terrestrial and Simulated Lidar Data. Photogramm. Eng. Remote Sens. 2015, 81, 767–776. [Google Scholar] [CrossRef]
  21. Wang, M.L.; Wong, M.S. A novel geometric feature-based wood-leaf separation method for large and crown-heavy tropical trees using handheld laser scanning point cloud. Int. J. Remote Sens. 2023, 44, 3227–3258. [Google Scholar] [CrossRef]
  22. Vicari, M.B.; Disney, M.; Wilkes, P.; Burt, A.; Calders, K.; Woodgate, W. Leaf and wood classification framework for terrestrial LiDAR point clouds. Methods Ecol. Evol. 2019, 10, 680–694. [Google Scholar] [CrossRef]
  23. Wang, D.; Takoudjou, S.M.; Casella, E. LeWoS: A universal leaf-wood classification method to facilitate the 3D modelling of large tropical trees using terrestrial LiDAR. Methods Ecol. Evol. 2020, 11, 376–389. [Google Scholar] [CrossRef]
  24. Raumonen, P.; Kaasalainen, M.; Åkerblom, M.; Kaasalainen, S.; Kaartinen, H.; Vastaranta, M.; Holopainen, M.; Disney, M.; Lewis, P. Fast Automatic Precision Tree Models from Terrestrial Laser Scanner Data. Remote Sens. 2013, 5, 491–520. [Google Scholar] [CrossRef]
  25. Calders, K.; Newnham, G.; Burt, A.; Murphy, S.; Raumonen, P.; Herold, M.; Culvenor, D.; Avitabile, V.; Disney, M.; Armston, J.; et al. Nondestructive estimates of above-ground biomass using terrestrial laser scanning. Methods Ecol. Evol. 2015, 6, 198–208. [Google Scholar] [CrossRef]
  26. Luo, F.; Xin, Z.; Gao, J.; Ma, Y.; Li, X.; Liu, H. Ecological Effects of Oasis Shelterbelts in Ulan Buh Desert. In Deserts and Desertification; IntechOpen: London, UK, 2021. [Google Scholar]
  27. Feng, T.J.; Wang, D.; Wang, R.; Wang, Y.; Xin, Z.; Luo, F.; Ma, Y.; Li, X.; Xiao, H.; Andres, C.C.; et al. Spatial-temporal heterogeneity of environmental factors and ecosystem functions in farmland shelterbelt systems in desert oasis ecotones. Agric. Water Manag. 2022, 271, 107790. [Google Scholar] [CrossRef]
  28. Cao, B.; Xu, X. Effects of Mixed Forest of Ailanthus altissima and Populus bolleana on Host Choice of Anoplophora glabripennis. Sci. Silvae Sin. 2006, 42, 56–60. (In Chinese) [Google Scholar]
  29. Zhang, Y.; Liu, F.; Genge, B.; Ma, B.; Huang, Y.; Ba, Y. Evaluation of Growth Adaptability of 20 Poplar Species in Oasis Region of Ulan Buh Sandy Land. Bull. Soil Water Conserv. 2015, 35, 117–121. (In Chinese) [Google Scholar]
  30. Zhang, W.M.; Qi, J.B.; Wan, P.; Wang, H.T.; Xie, D.H.; Wang, X.Y.; Yan, G.J. An Easy-to-Use Airborne LiDAR Data Filtering Method Based on Cloth Simulation. Remote Sens. 2016, 8, 501. [Google Scholar] [CrossRef]
  31. Schraik, D.; Wang, D.; Hovi, A.; Rautiainen, M. Quantifying stand-level clumping of boreal, hemiboreal and temperate European forest stands using terrestrial laser scanning. Agric. For. Meteorol. 2023, 339, 109564. [Google Scholar] [CrossRef]
  32. Lau, A.; Calders, K.; Bartholomeus, H.; Martius, C.; Raumonen, P.; Herold, M.; Vicari, M.; Sukhdeo, H.; Singh, J.; Goodman, R.C. Tree Biomass Equations from Terrestrial LiDAR: A Case Study in Guyana. Forests 2019, 10, 527. [Google Scholar] [CrossRef]
  33. Lim, S.P.; Haron, H. Surface reconstruction techniques: A review. Artif. Intell. Rev. 2014, 42, 59–78. [Google Scholar] [CrossRef]
  34. Arias-Castro, E.; Rodríguez-Casal, A. On estimating the perimeter using the alpha-shape. Ann. De L Inst. Henri Poincare-Probab. Stat. 2017, 53, 1051–1068. [Google Scholar] [CrossRef]
  35. Cao, J.X.; Tamura, Y.; Yoshida, A. Wind tunnel study on aerodynamic characteristics of shrubby Specimens of three tree species. Urban For. Urban Green. 2012, 11, 465–476. [Google Scholar] [CrossRef]
  36. Zhang, L.B.; Liang, T.; Wei, X.X.; Wang, H. An improved indicator standardization method for multi-indicator composite evaluation: A case study in the evaluation of ecological civilization construction in China. Environ. Impact Assess. Rev. 2024, 108, 107600. [Google Scholar] [CrossRef]
  37. Liu, X.; Liu, X.; Li, Y.; Yuan, J.; Song, L.; Li, H.; Wu, M. Estimation model of canopy stratification porosity based on morphological characteristics: A case study of cotton. Biosyst. Eng. 2020, 193, 174–186. [Google Scholar] [CrossRef]
  38. Fan, Z.P.; Gao, J.G.; Zeng, D.H.; Zhou, X.H.; Sun, X.K. Three-dimensional (3D) structure model and its parameters for poplar shelterbelts. Sci. China-Earth Sci. 2010, 53, 1513–1526. [Google Scholar] [CrossRef]
  39. Jin, S.; Zhang, W.; Cai, S.; Shao, J.; Cheng, S.; Xie, D.; Yan, G. Stem and branch volume estimation using terrestrial laser scanning data. Natl. Remote Sens. Bull. 2023, 27, 1653–1666. (In Chinese) [Google Scholar] [CrossRef]
  40. Hildebrandt, R.; Iost, A. From points to numbers: A database-driven approach to convert terrestrial LiDAR point clouds to tree volumes. Eur. J. For. Res. 2012, 131, 1857–1867. [Google Scholar] [CrossRef]
  41. Lau, A.; Bentley, L.P.; Martius, C.; Shenkin, A.; Bartholomeus, H.; Raumonen, P.; Malhi, Y.; Jackson, T.; Herold, M. Quantifying branch architecture of tropical trees using terrestrial LiDAR and 3D modelling. Trees 2018, 32, 1219–1231. [Google Scholar] [CrossRef]
  42. Béland, M.; Widlowski, J.-L.; Fournier, R.A.; Côté, J.-F.; Verstraete, M.M. Estimating leaf area distribution in savanna trees from terrestrial LiDAR measurements. Agric. For. Meteorol. 2011, 151, 1252–1266. [Google Scholar] [CrossRef]
  43. Wang, H.; Takle, E.S. On three-dimensionality of shelterbelt structure and its influences on shelter effects. Bound. Layer Meteorol. 1996, 79, 83–105. [Google Scholar] [CrossRef]
  44. Poh, H.; Chan, W.; Wise, D.; Lim, C.; Khoo, B.; Gobeawan, L.; Ge, Z.; Eng, Y.; Peng, J.; Raghavan, V.; et al. Wind load prediction on single tree with integrated approach of L-system fractal model, wind tunnel, and tree aerodynamic simulation. AIP Adv. 2020, 10, 075202. [Google Scholar] [CrossRef]
  45. Mochida, A.; Tabata, Y.; Iwata, T.; Yoshino, H. Examining tree canopy models for CFD prediction of wind environment at pedestrian level. J. Wind Eng. Ind. Aerodyn. 2008, 96, 1667–1677. [Google Scholar] [CrossRef]
  46. Wuyts, K.; Verheyen, K.; De Schrijver, A.; Cornelis, W.M.; Gabriels, D. The impact of forest edge structure on longitudinal patterns of deposition, wind speed, and turbulence. Atmos. Environ. 2008, 42, 8651–8660. [Google Scholar] [CrossRef]
  47. Lalic, B.; Mihailovic, D.T.; Rajkovic, B.; Arsenic, I.D.; Radlovic, D. Wind profile within the forest canopy and in the transition layer above it. Environ. Model. Softw. 2003, 18, 943–950. [Google Scholar] [CrossRef]
  48. Ma, R.; Wang, J.; Qu, J.; Liu, H. Effectiveness of shelterbelt with a non-uniform density distribution. J. Wind Eng. Ind. Aerodyn. 2010, 98, 767–771. [Google Scholar] [CrossRef]
  49. Yuan, W.; Zhu, N.; Zhang, L.; Tong, R.; Miao, Y.; Zhou, F.; Wang, G.G.; Wu, T. Three-dimensional aerodynamic structure estimation and wind field simulation for wide tree shelterbelts. For. Ecol. Manag. 2024, 559, 121813. [Google Scholar] [CrossRef]
  50. Gijzen, H.; Goudriaan, J. A flexible and explanatory model of light distribution and photosynthesis in row crops. Agric. For. Meteorol. 1989, 48, 1–20. [Google Scholar] [CrossRef]
  51. Ding, S.; Su, P. Effects of tree shading on maize crop within a Poplar-maize compound system in Hexi Corridor oasis, northwestern China. Agrofor. Syst. 2010, 80, 117–129. [Google Scholar] [CrossRef]
  52. Palmer, J.W.; Snelgar, W.P.; Manson, P.J. Shade cast by shelterbelts around kiwifruit orchards; validation of a computer model. Agric. For. Meteorol. 1993, 66, 21–30. [Google Scholar] [CrossRef]
  53. Holzwarth, F.; Kahl, A.; Bauhus, J.; Wirth, C. Many ways to die–partitioning tree mortality dynamics in a near-natural mixed deciduous forest. J. Ecol. 2013, 101, 220–230. [Google Scholar] [CrossRef]
  54. Buettel, J.C.; Ondei, S.; Brook, B.W. Look down to see what’s up: A systematic overview of treefall dynamics in forests. Forests 2017, 8, 123. [Google Scholar] [CrossRef]
  55. Kong, T.; Liu, B.; Henderson, M.; Zhou, W.; Su, Y.; Wang, S.; Wang, G. Effects of shelterbelt transformation on soil aggregates characterization and erodibility in China black soil farmland. Agriculture 2022, 12, 1917. [Google Scholar] [CrossRef]
  56. Gupta, J.P.; Rao, G.G.S.N.; Gupta, G.N.; Rao, B.R. Soil drying and wind erosion as affected by different types of shelterbelts planted in the desert region of Western Rajasthan, India. J. Arid Environ. 1983, 6, 53–58. [Google Scholar] [CrossRef]
  57. Luo, W.; Dong, Z.; Qian, G.; Lu, J. Near-wake flow patterns in the lee of adjacent obstacles and their implications for the formation of sand drifts: A wind tunnel simulation of the effects of gap spacing. Geomorphology 2014, 213, 190–200. [Google Scholar] [CrossRef]
Figure 1. Overview of study area.
Forests 16 01221 g001
Figure 2. Point cloud data scanning in shelterbelt. (a): Layout diagram of scanning station; (b): LiDAR data acquisition.
Forests 16 01221 g002
Figure 3. Cell division of shelterbelt space. (a) Three-dimensional structure of shelterbelts; (b) longitudinal section of shelterbelts.
Forests 16 01221 g003
Figure 4. Variation in branching two-dimensional structure parameters. (a) Branch diameter, (b) branch length, (c) branch angle. (I): P. alba var. pyramidalis, (II): P. popular’s; (III): P. nigra var. thevestina.
Forests 16 01221 g004
Figure 5. Variation in branching three-dimensional structure parameters. (a) Branch surface area, (b) branch volume. (I): P. alba var. pyramidalis; (II): P. popular’s; (III): P. nigra var. thevestina.
Forests 16 01221 g005
Figure 6. Variation in leaf structure parameters.
Forests 16 01221 g006
Figure 7. Distribution of trunk branch and leaf volumes with respect to height for each shelterbelt. (a) P. alba var. pyramidalis, (b) P. popular’s, (c) P. nigra var. thevestina. (I): Trunk, (II): branch, (III): leaf.
Forests 16 01221 g007
Figure 8. Distribution of trunk, branch and leaf surface area with respect to height for each shelterbelt. (a) P. alba var. pyramidalis, (b) P. popular’s, (c) P. nigra var. thevestin. (I): Trunk, (II): branch, (III): leaf.
Forests 16 01221 g008
Figure 9. Spatial distributions of Scd and Vcd in shelterbelts. (a) Scd, (b) Vcd. (I): P. alba var. pyramidalis; (II): P. popular’s; (III): P. nigra var. thevestina.
Forests 16 01221 g009
Figure 10. Spatial distributions of Op and Vp in the shelterbelts. (a) Op, (b) Vp along the x-axis, (c) Vp along the y-axis. (I): P. alba var. pyramidalis, (II): P. popular’s, (III): P. nigra var. thevestina.
Forests 16 01221 g010
Table 1. Basic information on shelterbelts.
SpeciesRowAge (a)Spacing (m)Quadrate (m)
Populus alba var. pyramidalis Bunge5284.5 × 520 × 25
Populus popular’s Zhonghua4354 × 520 × 20
Populus nigra var. thevestina (Dode) Bean4335 × 520 × 20
Table 2. Integral structure of single tree.
SpeciesHeight (m)DBH (m)Crown Width (m)Under-Branch Height (m)Surface Area (m2)Volume (m3)
P. alba var. pyramidalis20.1130.3313.2322.171113.9911.411
P. popular’s16.3650.2424.6730.91288.0141.049
P. nigra var. thevestina20.2410.2902.9111.38487.2191.068
Table 3. Two-dimensional structural parameters of the shelterbelt.
SpeciesHeight (m)Width (m)Length (m)Op
P. alba var. pyramidalis20.11325.120450.3400.449
P. popular’s16.36520.041196.5110.424
P. nigra var. thevestina20.24118.114390.3280.492
Table 4. Three-dimensional structure parameters of the shelterbelt.
SpeciesSurface Area (m2)Volume (m3)Scd (m2·m−3)Vcd (m3·m−3)Vp
P. alba var. pyramidalis44,225.921445.2540.2050.0020.532
P. popular’s15,789.813154.8430.2520.0030.490
P. nigra var. thevestina33,068.122314.3420.2350.0020.528
Table 5. Integral parameter extraction accuracy.
Structural ParametersSpeciesEvaluation Indicators
Bias (m)rBias (%)RMSE (m)rRMSE (%)
Tree HeightP. alba var. pyramidalis−1.177−5.8741.4987.471
DBH−0.011−3.4010.0144.360
Crown width−0.077−2.5440.2227.314
Under-branch height0.0532.6210.0984.880
Tree volume0.0051.1720.07816.517
Tree surface area−0.7968.1901.05210.830
Tree HeightP. popular’s−0.455−3.0410.7755.183
DBH−0.021−7.9780.03011.494
Crown width−0.239−4.9460.40058.306
Under-branch
height
−0.007−0.7320.0575.416
Tree volume0.0020.6970.0041.802
Tree surface area−0.0781.3930.1272.278
Tree HeightP. nigra var. thevestina−0.755−3.6691.0054.883
DBH−0.007−2.2600.2227.019
Crown width−0.051−1.6280.1364.327
Under-branch height0.1408.7790.18311.483
Tree volume0.0092.7500.0154.676
Tree surface area−0.0090.1520.0881.484
Table 6. Branch parameter extraction accuracy.
Structural ParametersSpeciesEvaluation Indicators
Bias (m)rBias (%)RMSE (m)rRMSE (%)
Branch lengthP. alba var. pyramidalis0.1405.8120.2068.550
Branch diameter0.0022.6140.0011.832
Branch angle−1.815−4.0032.6875.906
Branch volume0.0064.1220.0085.554
Branch surface area0.1991.0841.1536.272
Leaf volume0.0012.8620.00215.246
Leaf surface area0.8202.9412.96710.642
Branch lengthP. popular’s0.0574.3160.1027.575
Branch diameter0.0011.8430.0022.087
Branch angle−0.656−1.5002.1144.707
Branch volume0.0054.1650.0087.150
Branch surface area0.0350.2250.6924.442
Leaf volume−0.001−4.6920.00526.325
Leaf surface area1.5972.9893.9179.016
Branch lengthP. nigra var. thevestina0.1489.2260.22515.457
Branch diameter0.0032.0590.0064.814
Branch angle1.0672.6121.9264.715
Branch volume0.0032.5130.0076.080
Branch surface area−0.393−2.7651.0387.294
Leaf volume−0.001−0.9460.00110.911
Leaf surface area−2.629−23.1333.30629.087
Disclaimer/Publisher’s Note: The statements, opinions and data contained in all publications are solely those of the individual author(s) and contributor(s) and not of MDPI and/or the editor(s). MDPI and/or the editor(s) disclaim responsibility for any injury to people or property resulting from any ideas, methods, instructions or products referred to in the content.

