Communication

Wildland and Forest Fire Emissions on Federally Managed Land in the United States, 2001–2021

Northern Research Station, USDA Forest Service, Durham, NH 03824, USA
*
Author to whom correspondence should be addressed.
Forests 2025, 16(8), 1205; https://doi.org/10.3390/f16081205
Submission received: 30 May 2025 / Revised: 10 July 2025 / Accepted: 17 July 2025 / Published: 22 July 2025
(This article belongs to the Section Natural Hazards and Risk Management)

Abstract

In the United States, ecosystems regularly experience wildfires and as fire seasons lengthen, fires are becoming a more important disturbance. While all types of disturbance have impacts on the carbon cycle, fires result in immediate emissions into the atmosphere. To assist managers in assessing wildland fire impacts, particularly on federally managed land, we developed estimates of area burned and related emissions for a 21-year period. These estimates are based on wildland fires defined by the interagency Monitoring Trends in Burn Severity database; emissions are simulated through the Wildland Fire Emissions Inventory System; and the classification of public land is performed according to the US Geological Survey’s Protected Areas Database of the United States. Wildland fires on federal land contributed 62 percent of all annual CO2 emissions from wildfires in the United States between 2001 and 2021. During this period, emissions from the forest fire subset of wildland fires ranged from 328 Tg CO2 in 2004 to 37 Tg CO2 in 2001. While forest fires averaged 38 percent of burned area, they represent the majority—59 to 89 percent of annual emissions—relative to fires in all ecosystems, including non-forest. Wildland fire emissions on land belonging to the federal government accounted for 44 to 77 percent of total annual fire emissions for the entire United States. Land managed by three federal agencies—the Forest Service, the Bureau of Land Management, and the Fish and Wildlife Service—accounted for 93 percent of fire emissions from federal land over the course of the study period, but year-to-year contributions varied.

1. Introduction

Forest disturbance events such as disease, management, windthrow, insect outbreaks, and drought are common across the United States and globally. Recently, fires have become a more important disturbance for all forms of wildland (uncultivated land, such as forests, grassland, and shrubland), due in part to the larger extent and number of fires, high fuel loads, and the increased length of the fire season [1,2,3]. Wildland fires have many potential impacts on affected systems, ranging from beneficial to damaging, depending on the severity and behavior of the fire. Lower intensity ground fires can clear competing vegetation and promote the germination of fire-adapted species, while intense fires may result in widespread mortality, regeneration failure, changes in vegetation type, soil damage, and erosion, as well as impacts on water and air quality [4,5,6,7]. These areas of focus have substantial management and economic implications and have received considerable attention, especially in western forests. However, as more attention is paid to the role of natural ecosystems in the carbon cycle, the impact of wildland fires has an added dimension, since a portion of the carbon stored in these systems is immediately released into the atmosphere as CO2 and non-CO2 greenhouse gases. The potential of wildland fires to result in considerable greenhouse gas emissions has implications for the ability of these areas to serve as a carbon sink, as well as on land-based carbon storage projects in affected areas [8].
Because of the importance of wildland fires in the carbon cycle, estimates of carbon emissions and area burned represent essential information for land managers, carbon project developers, researchers, and policymakers. A large proportion of wildland in the United States is publicly owned and managed by a number of federal agencies [9]. Surprisingly, given the impact of these fires on ecosystems and communities, aside from limited summaries of burned area by ownership, little work has been conducted assessing the extent of wildland fires on federal land relative to other ownership groups. Multiple summaries providing the annual area of wildland fires are based on different approaches or designed to meet different needs [10,11,12]. Estimates of emissions from the forest land portion of wildland fires are produced every year to meet international reporting obligations [13]. In addition, fire extent and emissions have been studied at a state or regional level in the western United States (e.g., [2,14]); however, aside from the US EPA [13] and similar previous estimates, annual wildland fire emissions are not consistently available for the entire United States. The US EPA [13] estimates are national totals and do not provide data by ownership type and include forested land only, rather than all wildland. Merrill et al. [15] used a dynamic vegetation model to estimate carbon stocks and fluxes on federal land in the conterminous United States (CONUS). These estimates include modeled emissions from fire but do not distinguish between forest and non-forest land, and while both state and national estimates are provided, they are not disaggregated by ownership group or management agency. Crist [16] quantified the area burned of forest and non-forest land for CONUS from 2000 to 2020, although estimates of burned area on land managed by large federal agencies are only presented for the western United States.
Existing compilations addressing national estimates include the Congressional Budget Office and Congressional Research Service reports [17,18], which describe area burned and include some disaggregation by region and ecosystem type. These documents are more focused on the economic and resource impacts of wildfires than on reporting detailed estimates. A number of studies implement varied approaches to national-level assessments [19,20,21,22,23], and other assessments are published at regional or state levels [24,25,26]. However, these vary considerably in terms of scope and level of resolution; for example, some do not separate forestland from other land, report either emissions or area but not both, account for a short time window, or do not distinguish between wildfires on federal land and those occurring on land owned by other parties. While these reports have some data sources in common, methods and datasets vary based on the specific objectives of each study. This leads to the need to consult multiple studies that are potentially inconsistent to obtain estimates of wildland area burned and emissions by ecosystem type, landowner, and region.
The purpose of this analysis is to address the lack of a consistent set of estimates of wildland area burned and resulting emissions that provides coverage for the entire United States, summarized by multiple categories that allow a broad set of stakeholders to utilize the information for policy, management, or reporting purposes, as well as informing modeling efforts. We achieve this by disaggregating national-scale wildfire data into regional results and further breaking down annual totals by landowner classes and federal land management agency. We also include the important distinction [16] of forest fires versus non-forest ecosystem fires. Information delivered at a higher resolution enables managers and policymakers to recognize potential patterns or trends in area burned or emissions related to region, ecosystem type (forest or non-forest), and ownership or managing agency. This facilitates identifying areas that may present opportunities for fuels reduction, resilience, or restoration treatments. Summaries of area burned and emissions by region and ecosystem type may also help stakeholders to meet data needs for carbon or emissions reporting at levels not included in the EPA reports and assess potential impacts on the ability of wildland to deliver benefits related to wildlife habitat, timber, recreation, and water and air quality, as well as carbon uptake and storage. These data may also be useful in assessing the feasibility of developing carbon offset projects in various regions.
Our primary goal is to provide estimates of area burned and emissions classified at scales that meet the information needs of managers and decisionmakers. Our analysis follows and expands on assessments developed by the Congressional Research Service and Congressional Budget Office [17,18], in order to provide more granular detail on (1) the relative amount of fires and emissions associated with federal land (land owned by major land management agencies) compared to other ownerships; (2) the ecosystem type affected (forest vs. non-forest); (3) regional differences (e.g., western, southern, Alaska); and (4) interannual variability in area burned and CO2 emitted by each of the aforementioned classes.

2. Methods

In this study, annual emissions of wildland fires in the United States were estimated through simulation modeling, and results were summarized for the years 2001 through 2021. This approach was based on spatial wildland burned area data, a system of fire emission simulation models, and spatial data delineating publicly owned land relative to locations of these wildland fires.

2.1. Wildland Fires

Wildland fire locations, start dates, and perimeters were provided by the Monitoring Trends in Burn Severity (MTBS) data layer, an interagency collaboration between the US Forest Service and the US Geological Survey [11,27,28]. Data included fires identified within the 50 states during the 21-year interval of interest here (2001–2021). The minimum thresholds of burned area for inclusion in the MTBS records are approximately 400 or 200 ha (1000 or 500 acres) for western or eastern fires, respectively. The MTBS data were downloaded directly from the MTBS website (the August 2023 update [11]) in the form of a spatial (vector data) layer. See the MTBS website [11] for additional information about how the perimeter records are developed and how the use of Landsat and burn indexes have evolved, as well as evaluations of the burn perimeters.

2.2. Burned Area and Emissions Estimates

For each of the MTBS burn perimeters (defined above), the area burned and CO2 emissions were simulated by the Wildland Fire Emissions Inventory System (WFEIS, [22]). Specifically, this was accomplished through querying the WFEIS calculator [29] for each feature (burn perimeter) in the MTBS data. WFEIS provides a geospatial implementation of the USDA Forest Service’s CONSUME fire consumption model [30], which applies a set of empirically derived fuel consumption equations to a set of fuelbeds that quantify fuel loading inputs. Specific emissions were calculated by multiplying consumption outputs by emissions factors from the Smoke Emissions Reference Application database [31].
The fuel moisture inputs in use by CONSUME within WFEIS are modeled values based on a burned area’s day and location. For CONSUME’s 1000 h fuel moisture inputs, WFEIS uses the daily 4 km dead fuel moisture product gridMET [32,33]. Duff and litter moisture inputs were obtained from daily gridded weather data from the Global Fire WEather Database [34], which provides 0.5-degree-resolution Canada Forest Fire Weather Index (FWI) System data [35]. Duff moisture was obtained from the FWI Duff Moisture Code and litter fuel moisture is from the FWI Fine Fuel Moisture code.
Within the burned area, fuel source information was used to characterize the burn site according to two alternate sources used for the United States estimates. The Fuel Characteristic Classification System (FCCS) layer provides mapped vegetation types [22,36]. The North American Wildland Fuels Database (NAWFD) models variability in mapped fuel type by aggregating fuel loading data from many sites and data sources, which provide mean or quantiles as inputs to WFEIS simulations [37]. The use of the median NAWFD fuel levels here represents a slight change in approach relative to past applications of WFEIS, which applied the mean fuel within the simulation [38]. A limited number of sites appeared to have highly skewed distributions of potential fuel levels, which produced very high fuel and emission levels through NAWFD-based means. Without independent data to evaluate these results, we chose to use medians to limit the influence of extreme values. Each of the two fuelbed sources were provided for the classification of burned area and emissions according to forested and non-forested ecosystems. However, these were nonspatial allocation within burn perimeters.

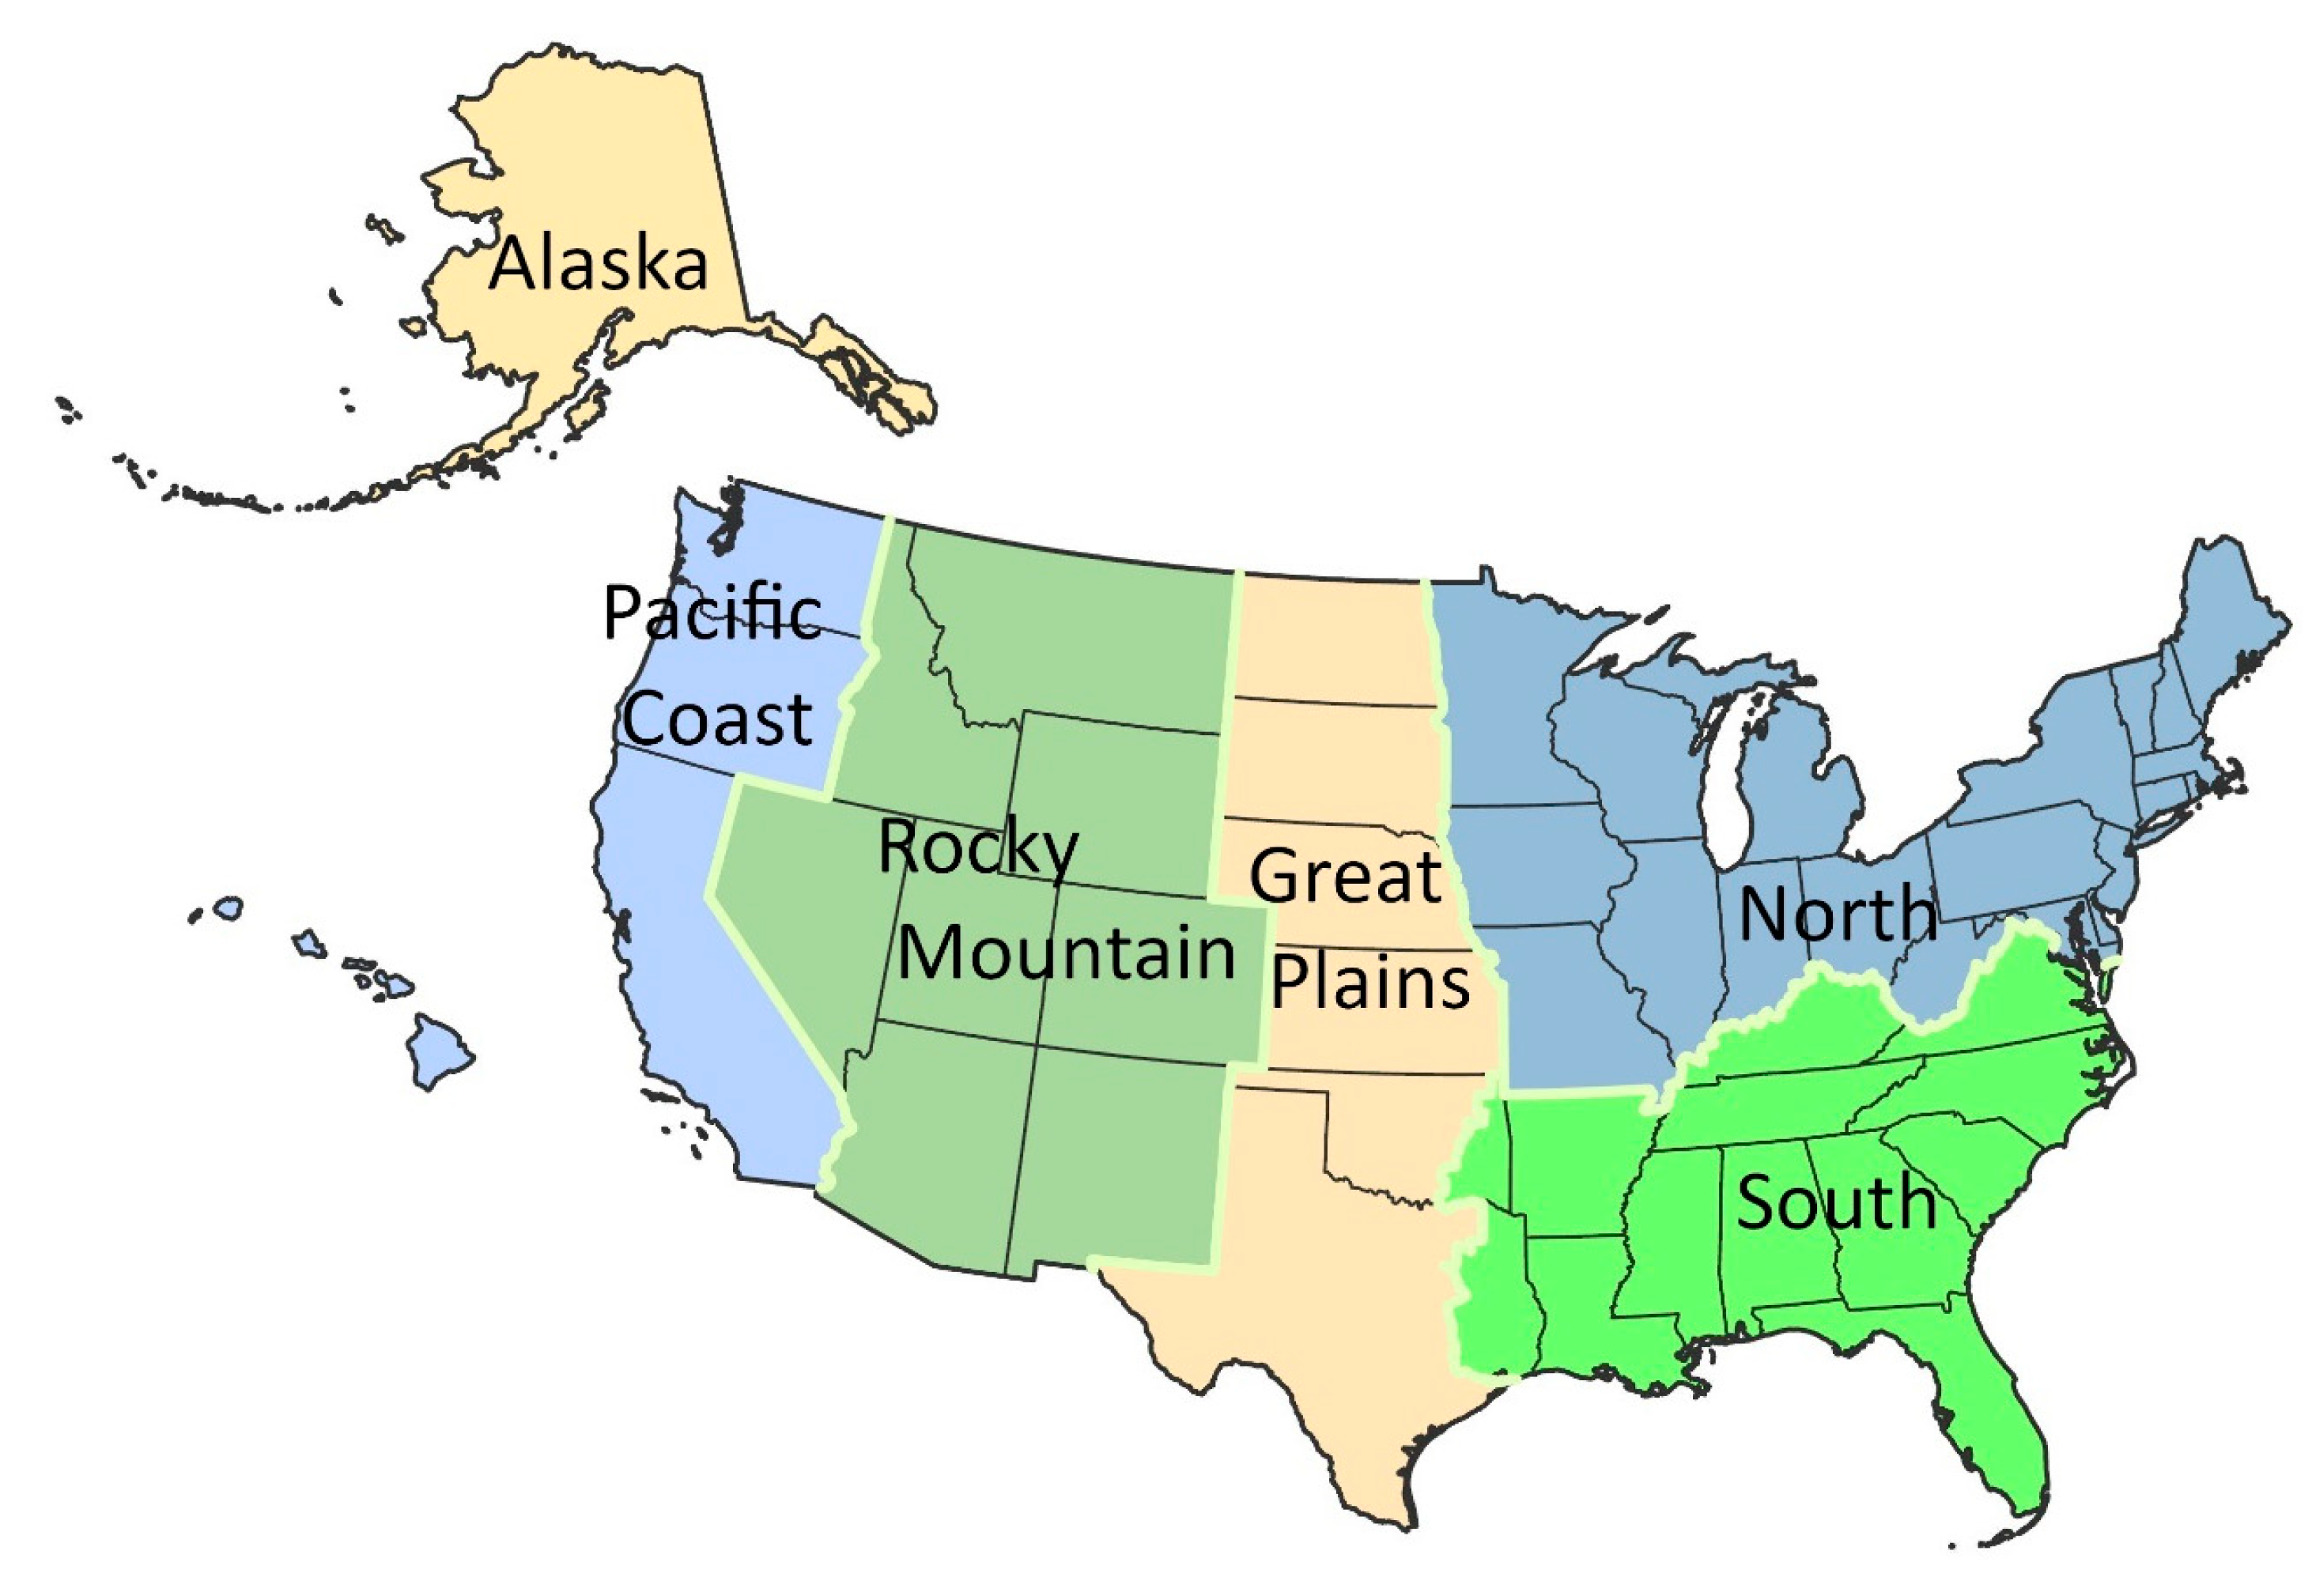
2.3. Allocation to Land Ownership

Wildland fires on federal land as well as on that managed by specific federal agencies with most of the fire activity are the primary interest of this study. We allocated the areas burned and CO2 emissions (as calculated above) according to ownership as delineated in the USGS Protected Areas Database of the United States (PAD-US, [39]). Within these data, the ‘fee’ feature class delineates open space land administered by public federal, state, and local agencies, nonprofits, or privately owned land [39].
The location of all or a portion of each MTBS burn perimeter was identified through a spatial overlay to classify land as (1) public federally owned land, with each agency separately classified according to those identified within the dataset; (2) state-owned public land; and (3) land owned by all other parties. The results were sometimes based on pooling these classifications; for example, federal ownerships with minor amounts of burned area are pooled as ‘Other Federal.’ Additional spatial allocations were performed according to six regions (Figure 1, note that Hawaii is included as part of the Pacific Coast). Allocations effectively clipped MTBS perimeters according to PAD-US and regional classifications.

2.4. Allocation to Forest Versus Non-Forest

Some of the MTBS/WFEIS fires (as classified above) extend to multiple owner or regional classifications. For these fires, the non-spatial forest versus non-forest burned areas and CO2 emissions needed to be allocated to their respective parts. Proportions of fires crossing ownership or regional boundaries were allocated according to proportions of forest versus non-forest land cover classes [40,41] within each subset of each original MTBS burn polygon [38]. While the land cover images are not directly related to components of the CONSUME simulation, they do represent an efficient approach (and the only possible approach) to the necessary spatial allocation.

3. Results

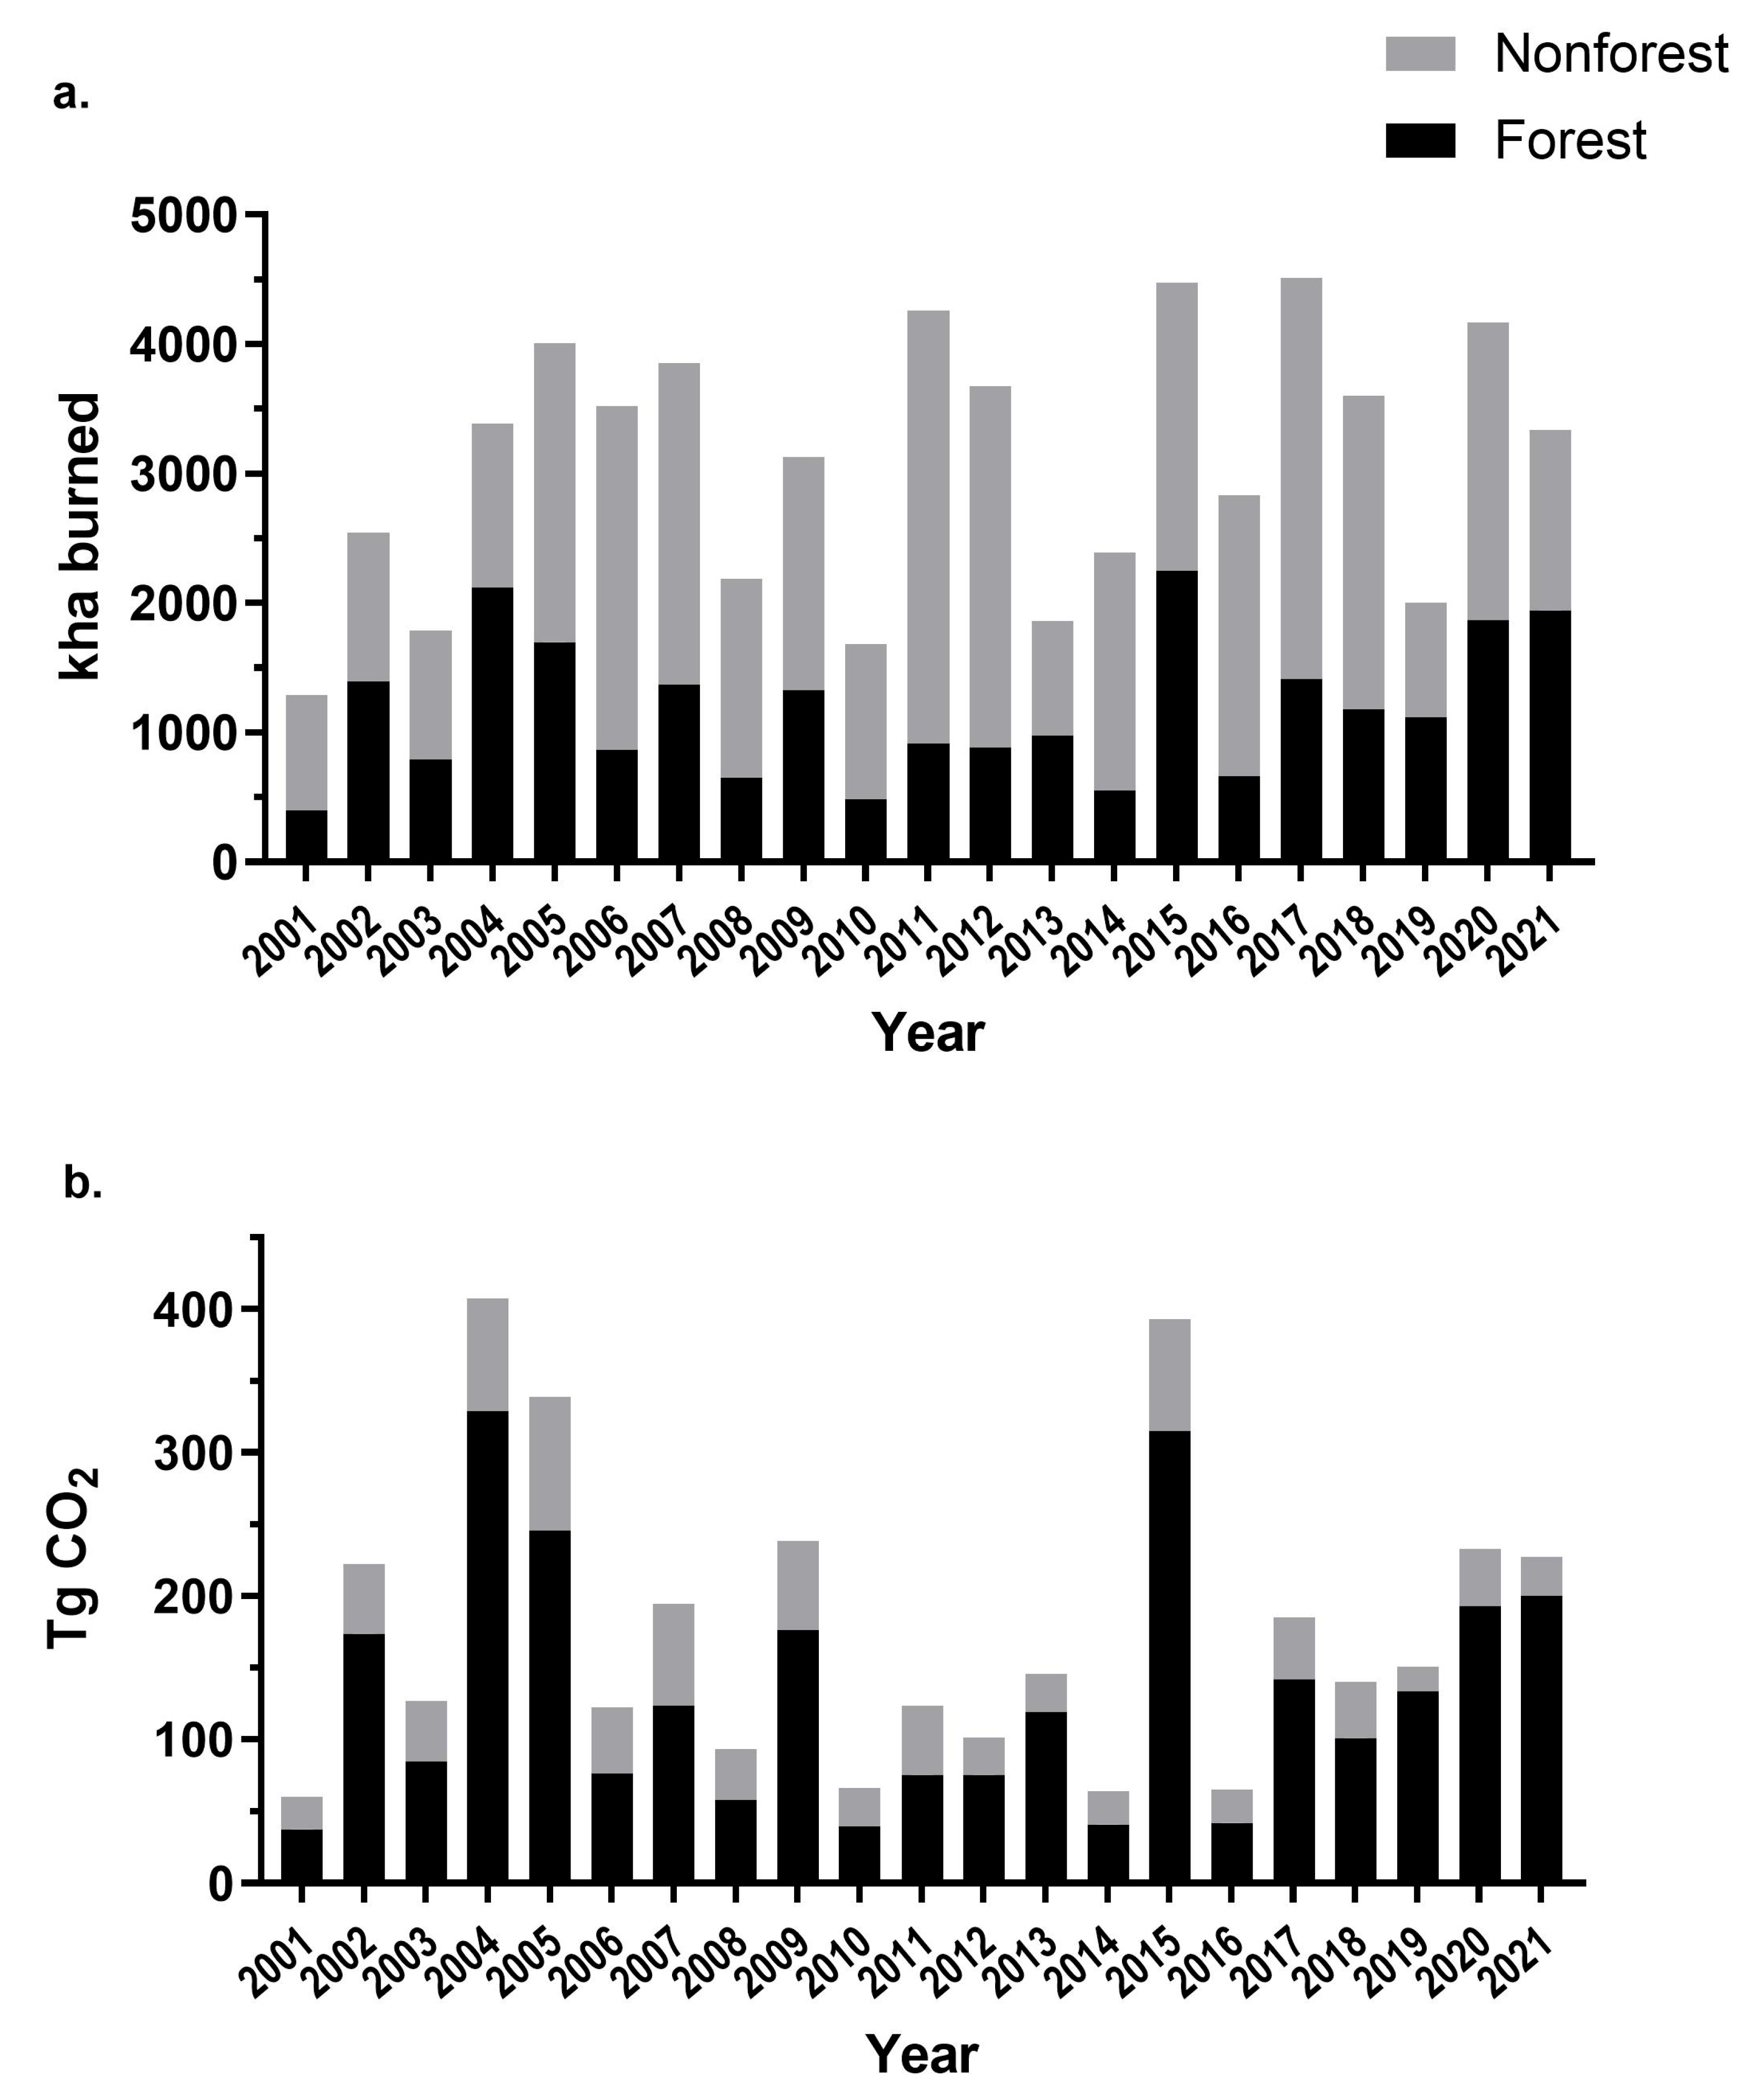
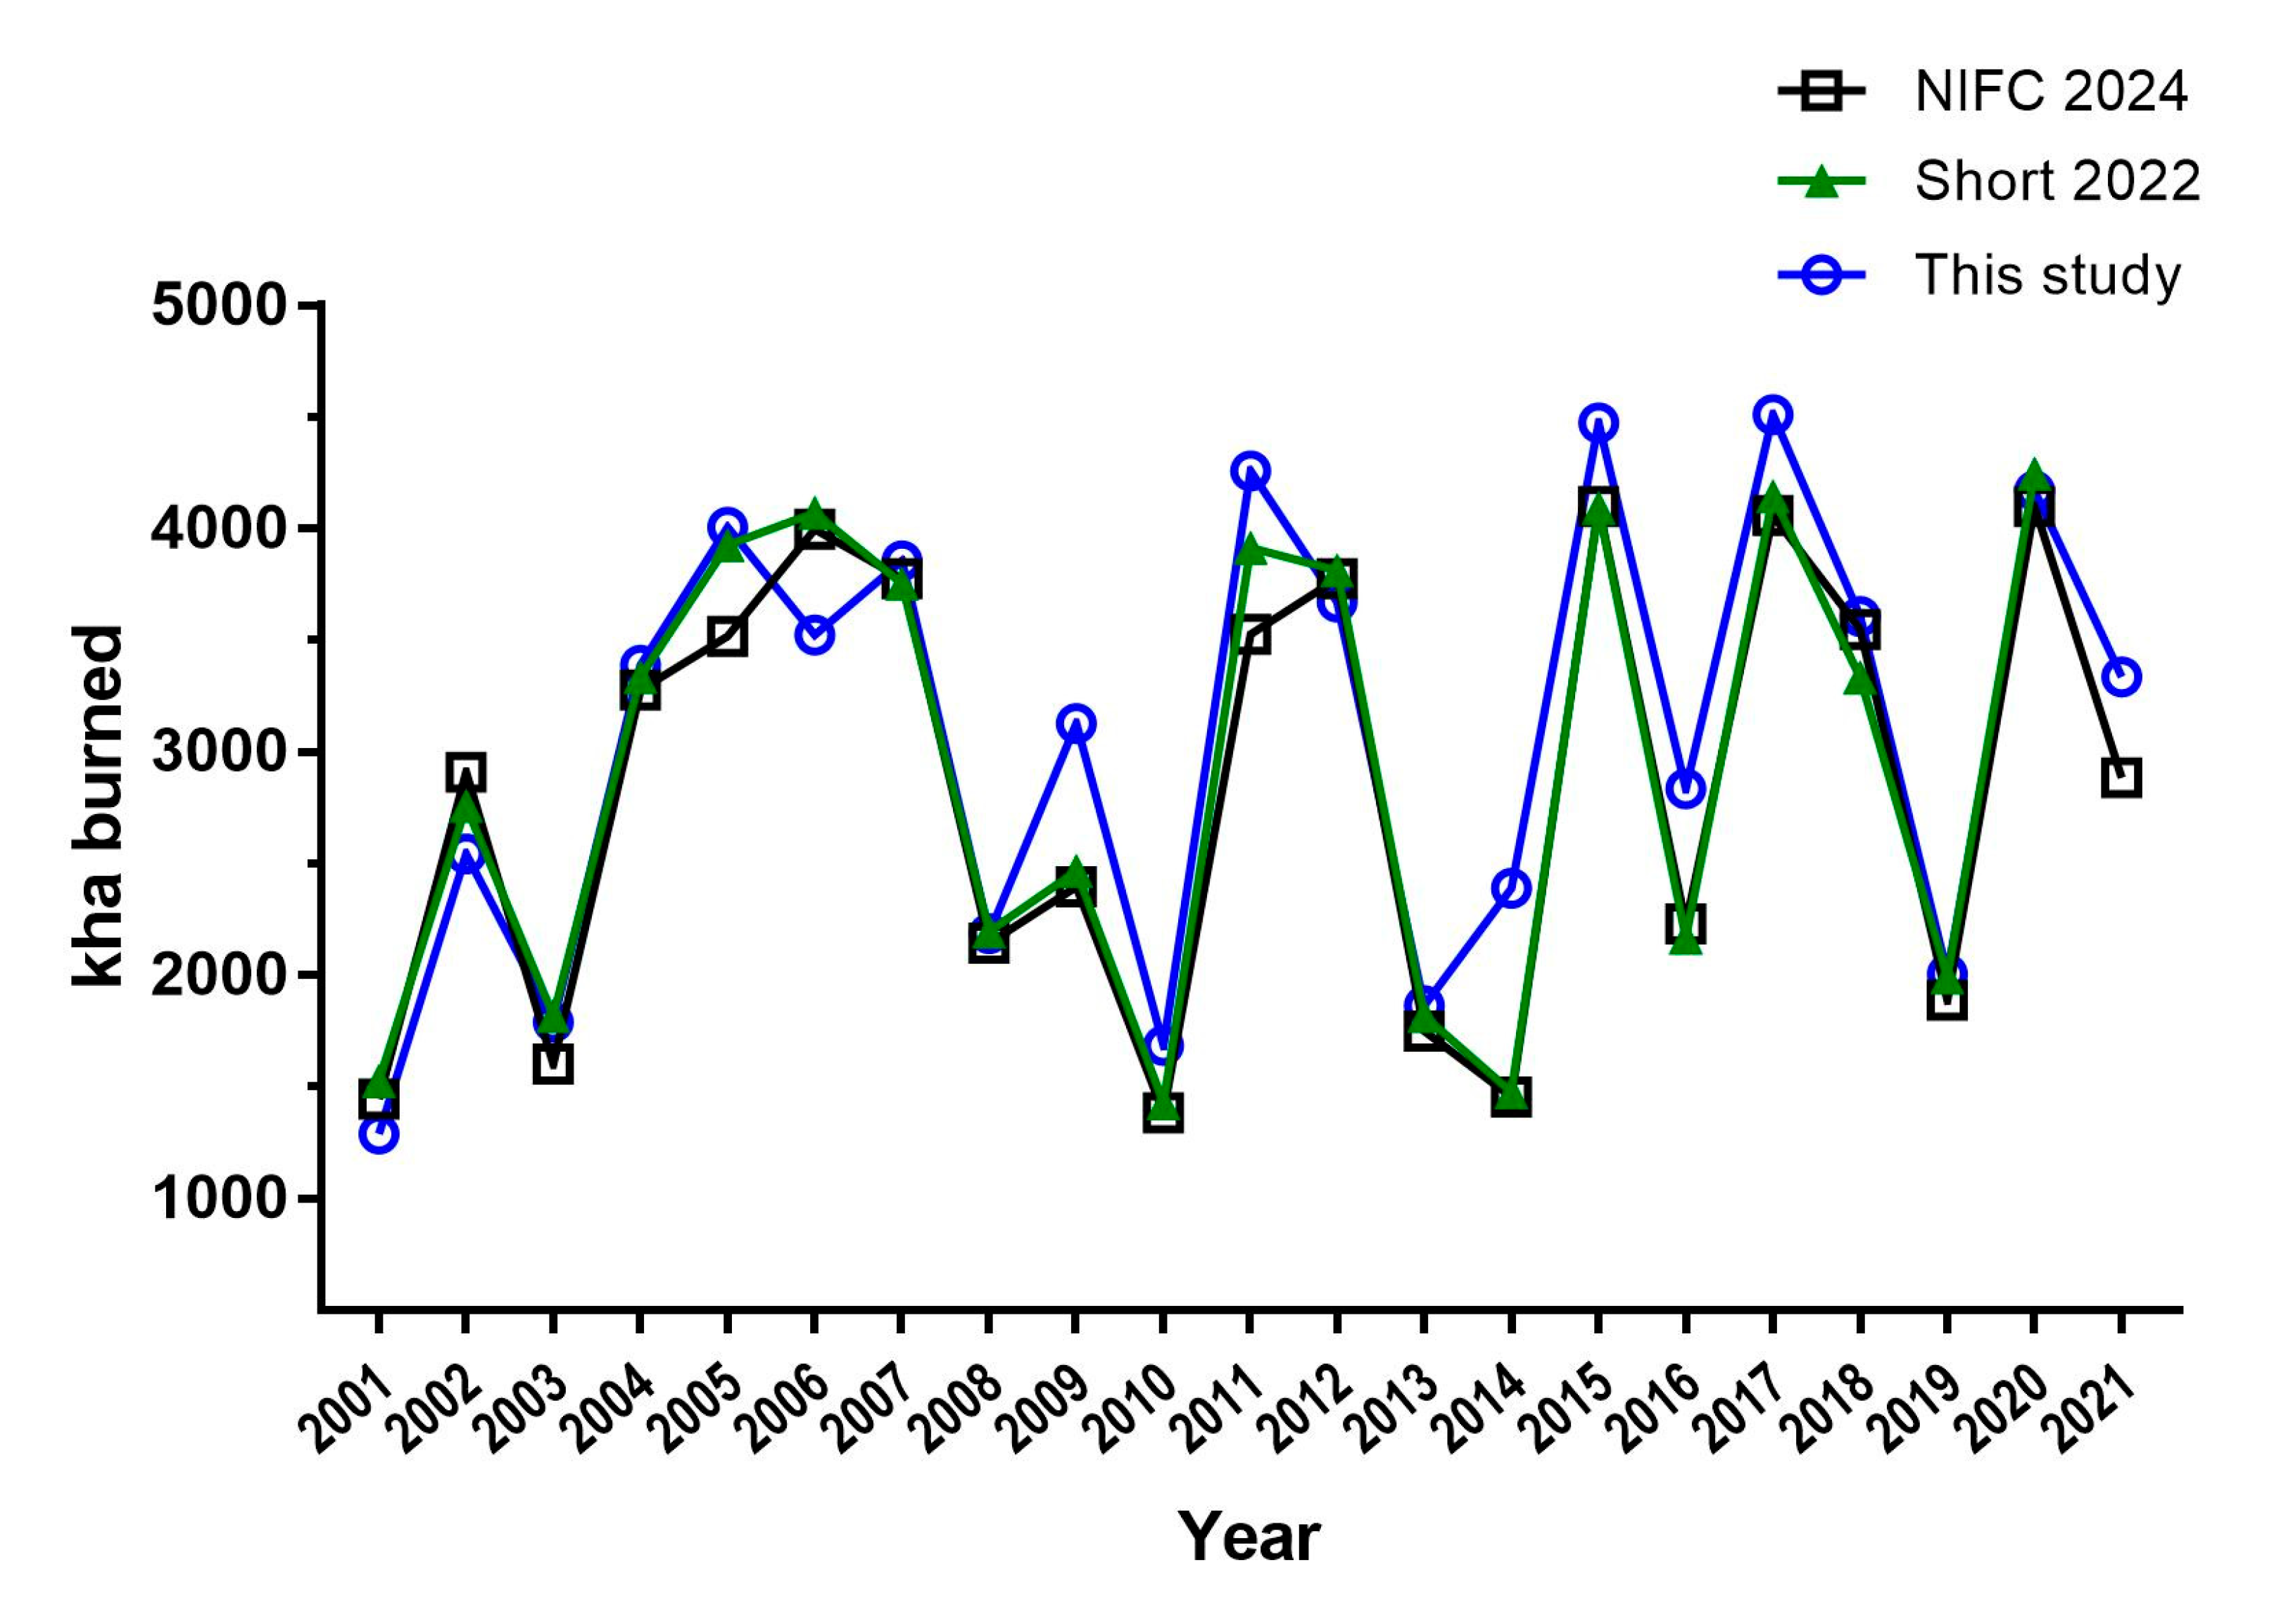
3.1. Annual Wildland and Forest Fires

The annual area burned by wildland fires in the United States averaged 3.07 million ha, with annual burned areas ranging from 1.3 to 4.5 million ha during the period 2001–2021 (Figure 2a). The high interannual variability extends to the proportion of wildland fires that were on forest land, where fires on forest land represented 21 to 62 percent (mean of 39 percent) of the annual area of wildland fires. The annual mean is 1.18 million ha. Forest fires represent over 50 percent of the total wildland area burned in only 6 of the 21 years. The average annual CO2 emissions from wildland fires were 176 Tg CO2, with forest fires’ contribution to total emissions averaging 132 Tg CO2 (Figure 2b). The relative proportions of area burned and CO2 emissions were consistent with greater area-specific emissions from forest fires relative to non-forest wildland systems such as grassland, rangeland, or shrubland. Fire emissions from forest land represent the majority of wildland fire emissions in all years; annually, the proportion of wildland emissions from forestland was 59 to 89 percent of the total for the United States.
Regional differences in average annual forest fire area burned and CO2 emissions (Figure 3) show considerably greater emissions for Alaska and the western-most regions (Pacific Coast and Rocky Mountain) relative to the eastern regions (North and South). The distribution of these fires among the broad ownership categories of federal, state, and all other land also varies by region. The proportions of forest burned vary by region and owner (Figure 3a,c). Table 1 and Table 2 separate forest fires from non-forest fires and fires on land owned by the Forest Service from those on land owned by other federal agencies, and the proportional allocation to each varies by region. Forest fires represent the majority of average annual wildland fire emissions over all regions except for the Great Plains (Table 1 and Table 2).

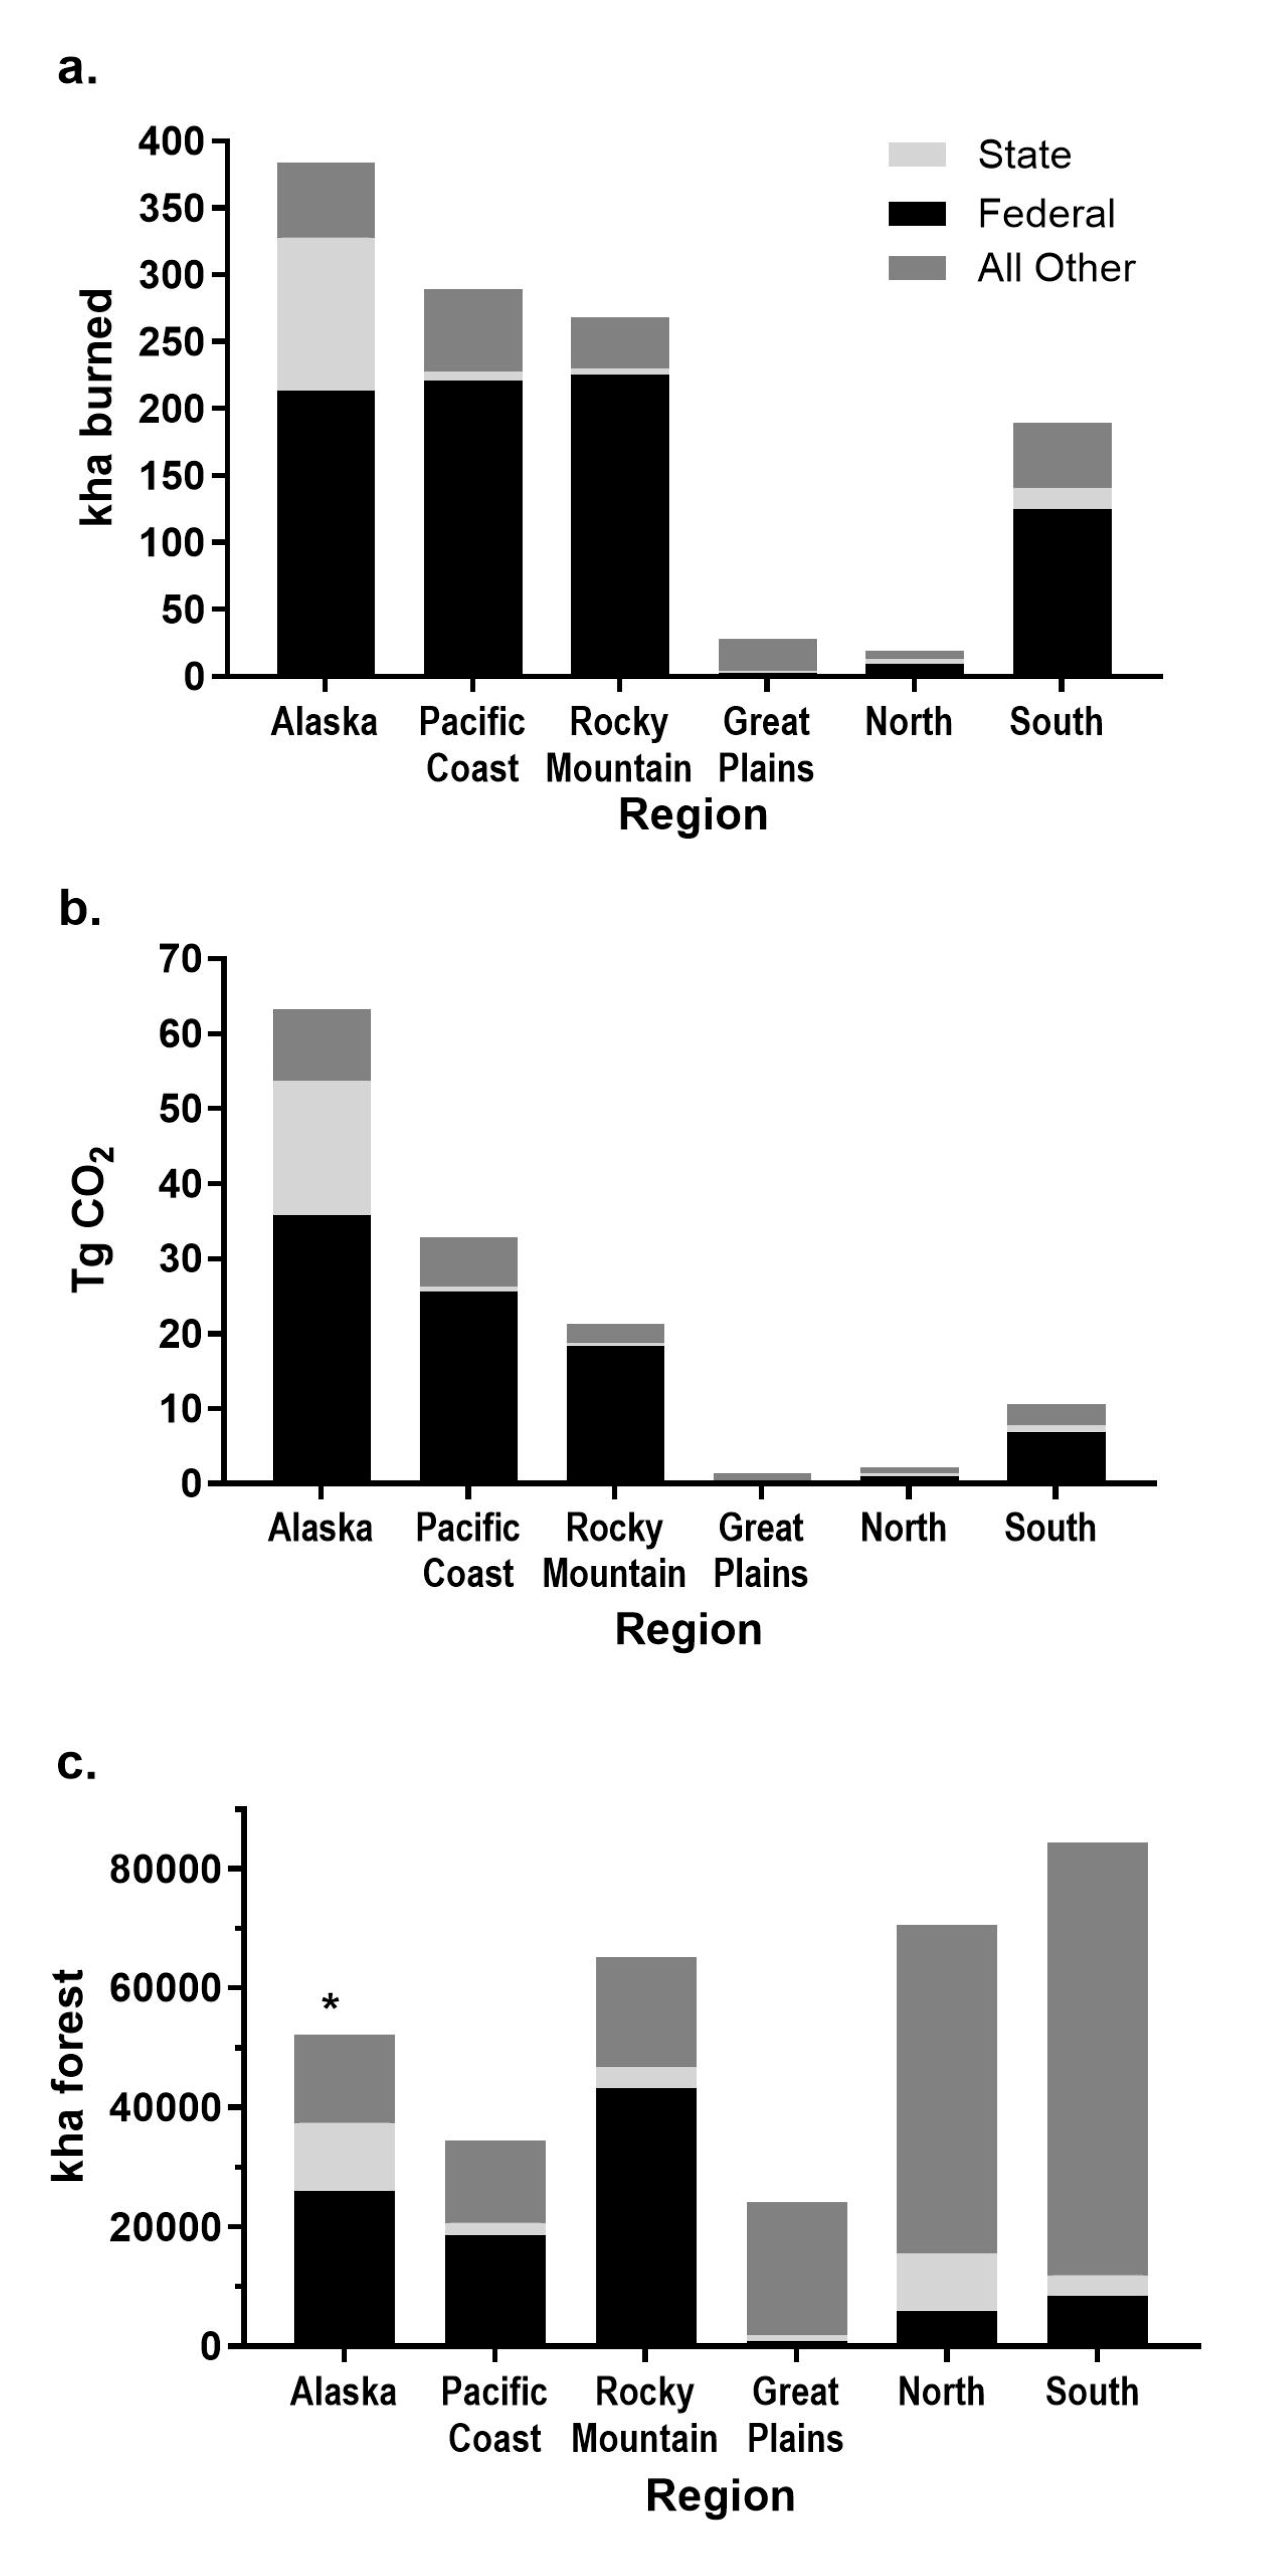
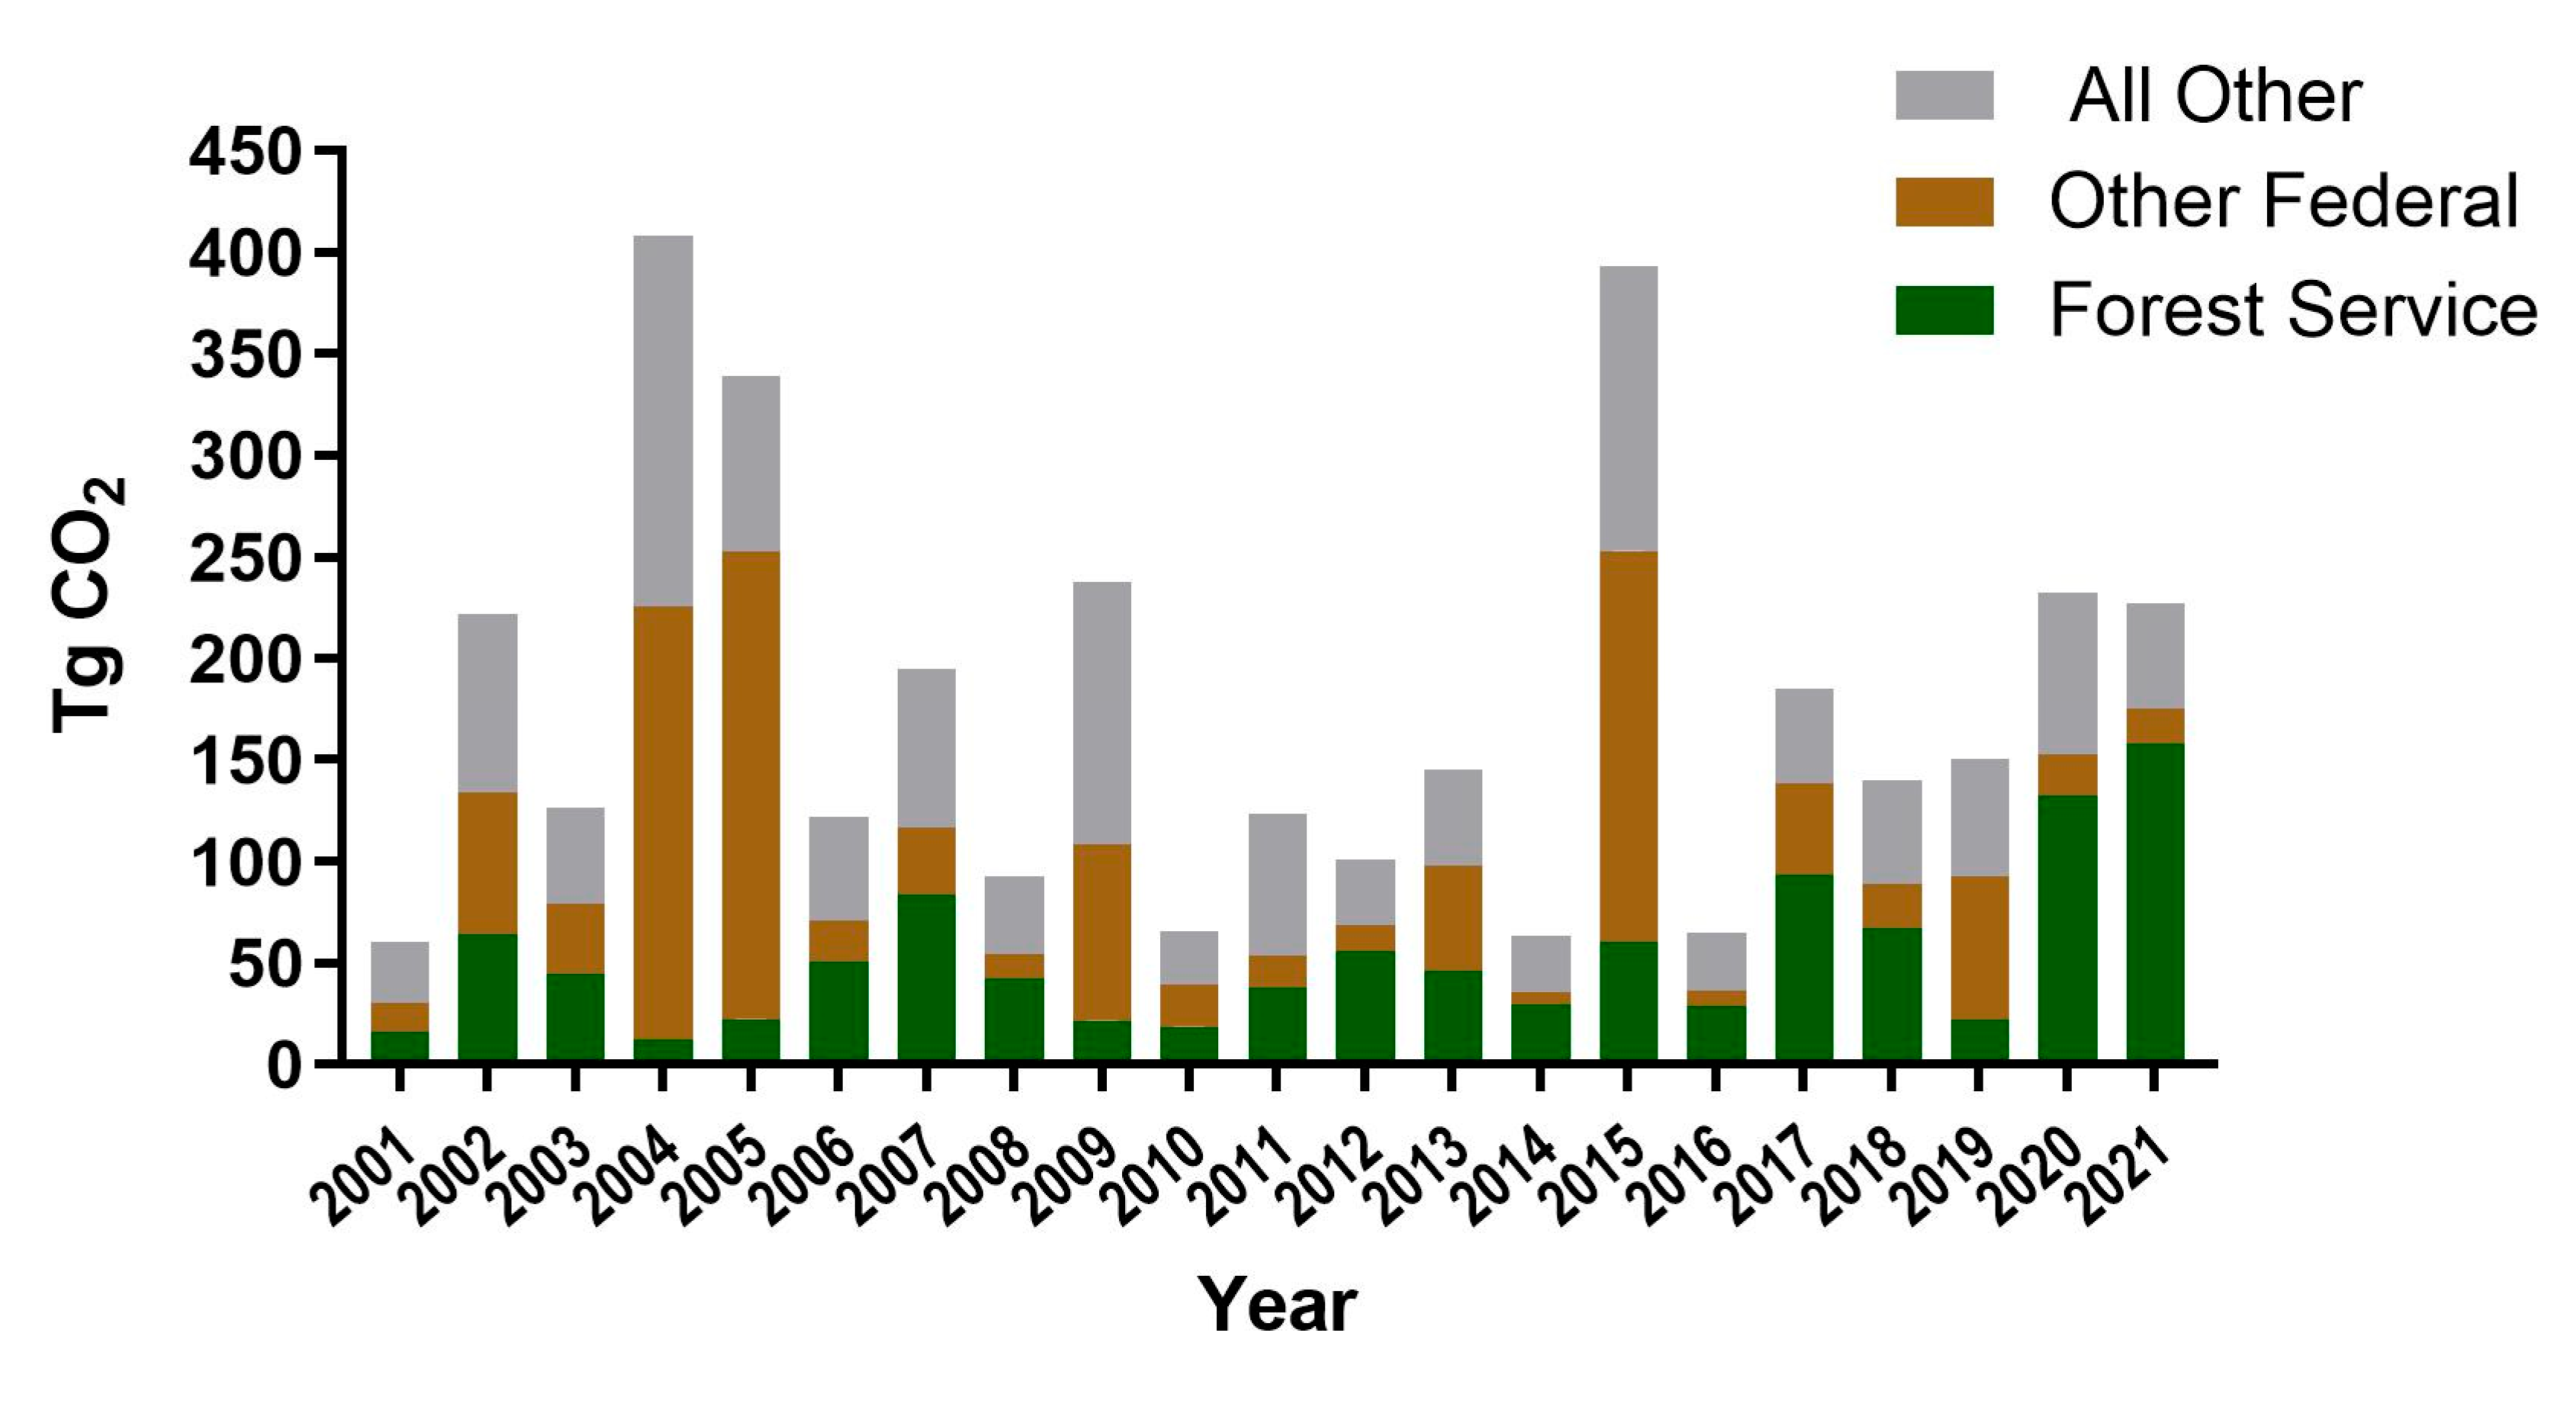
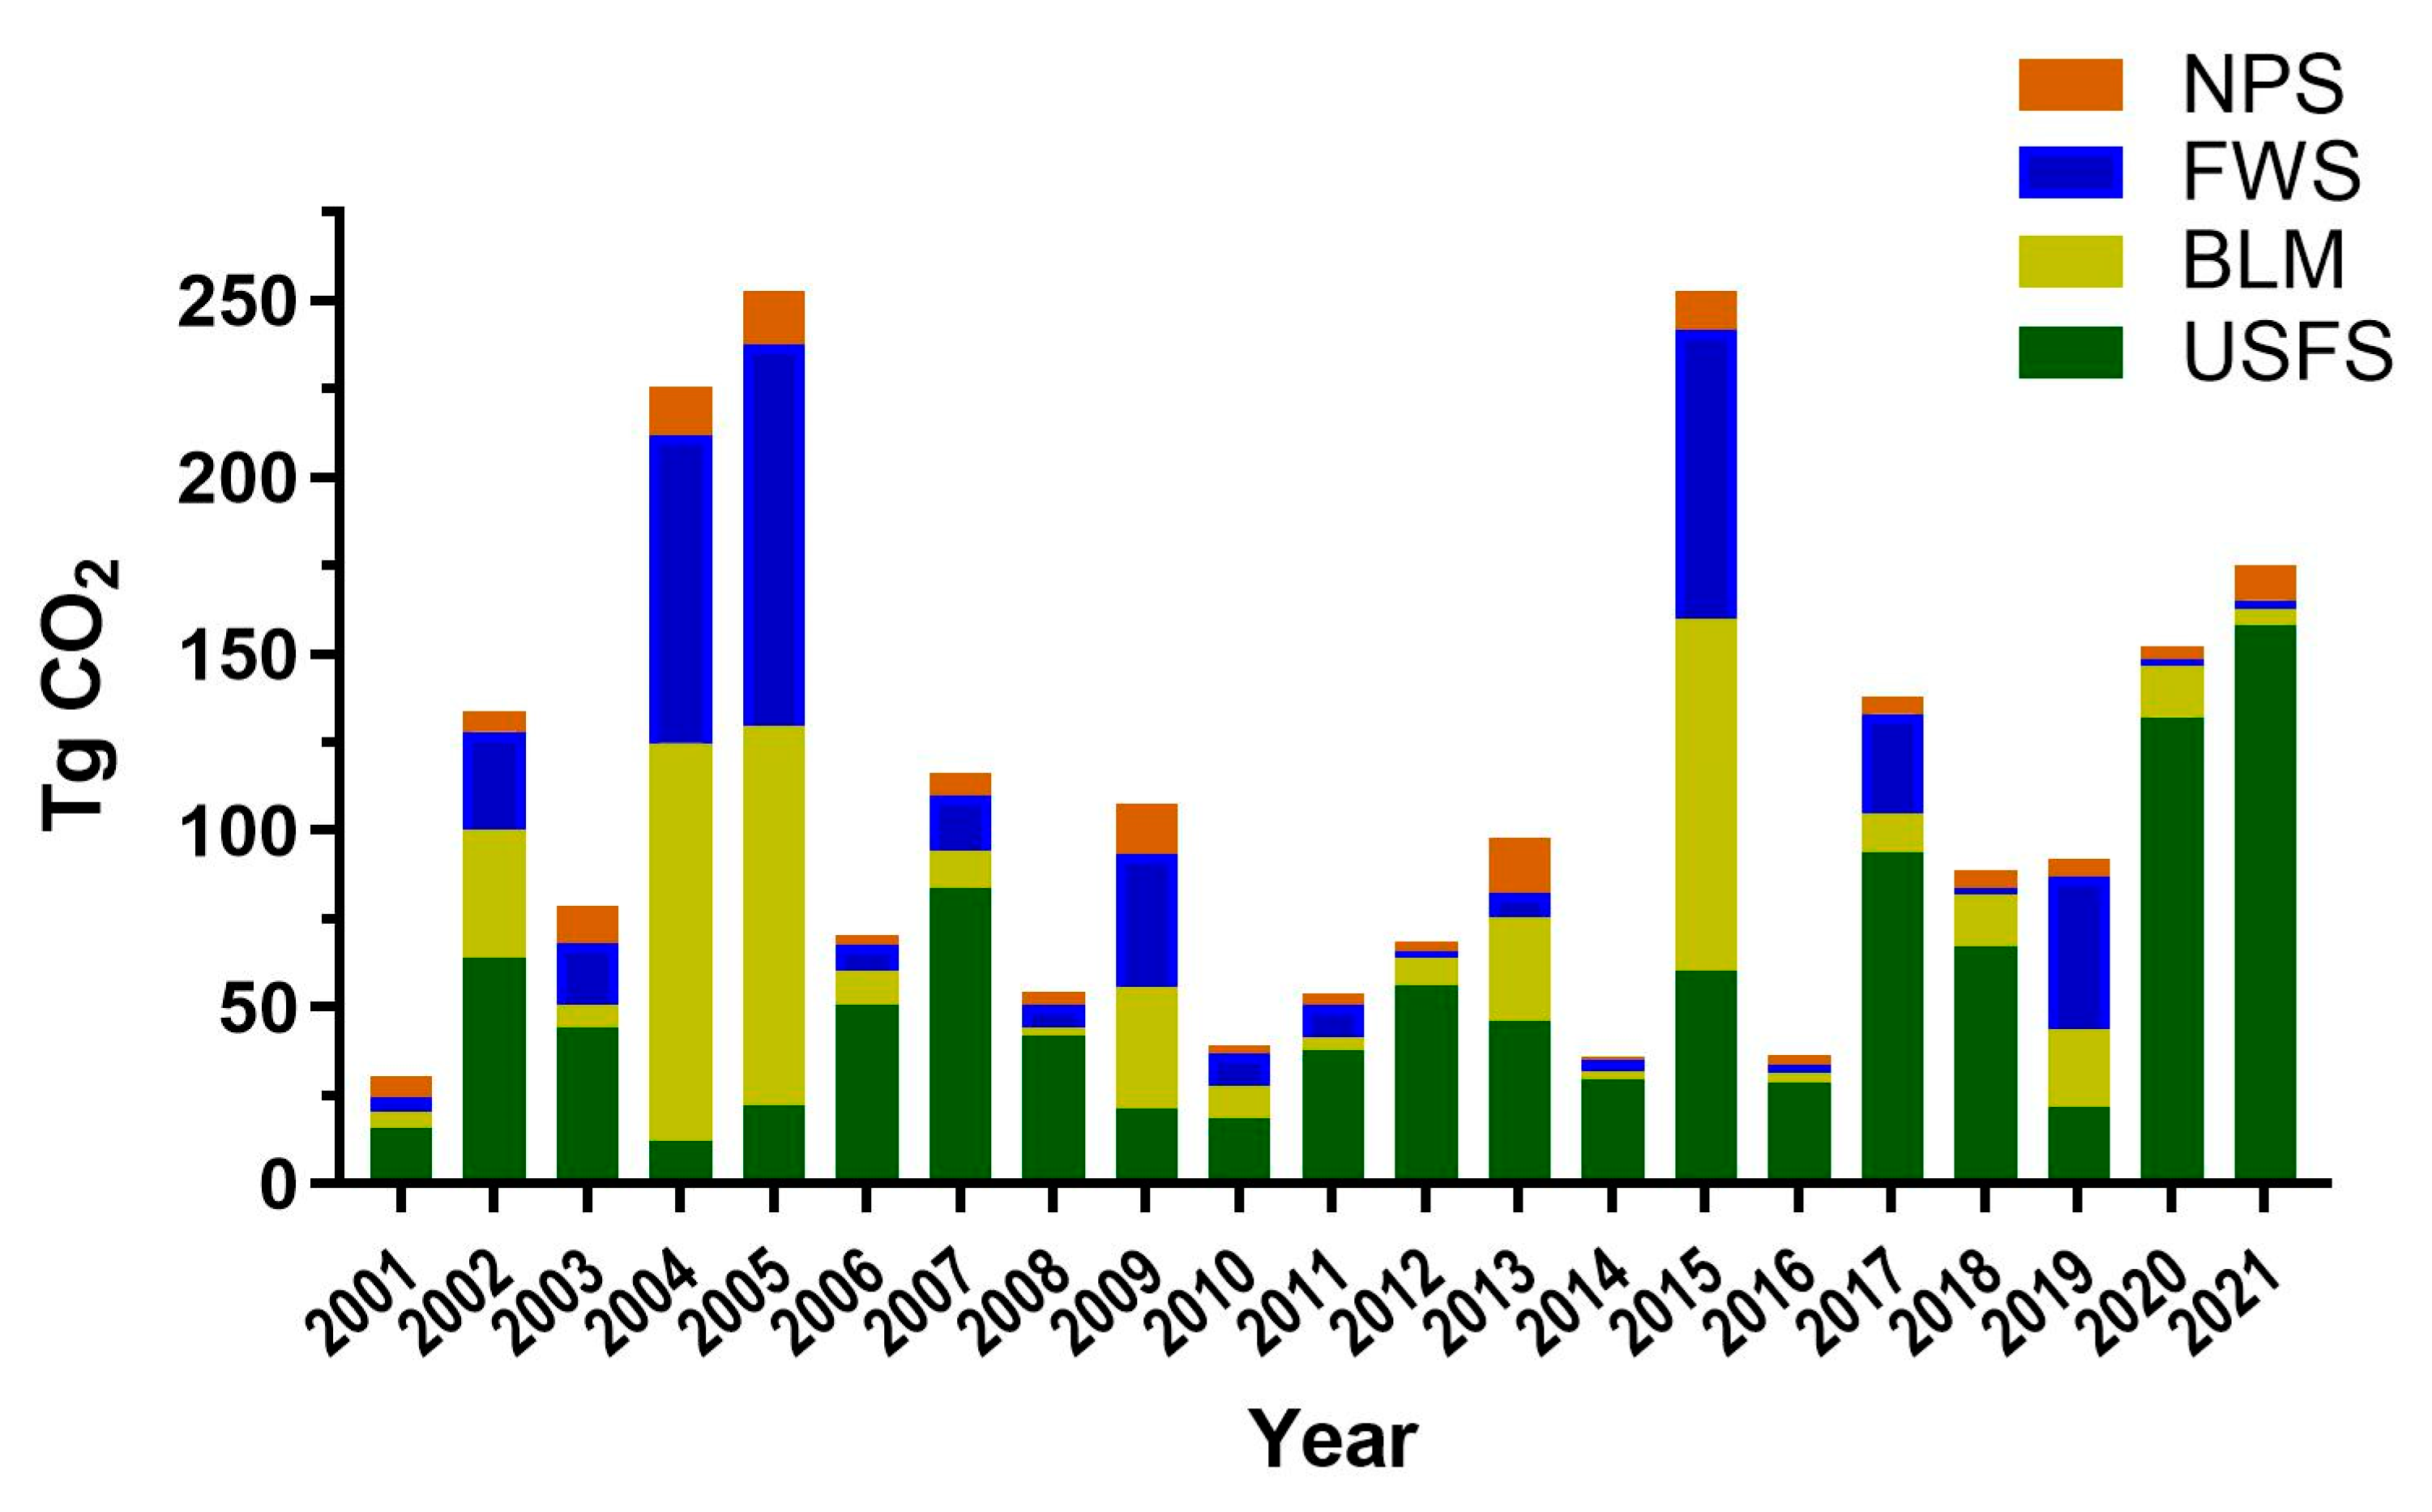
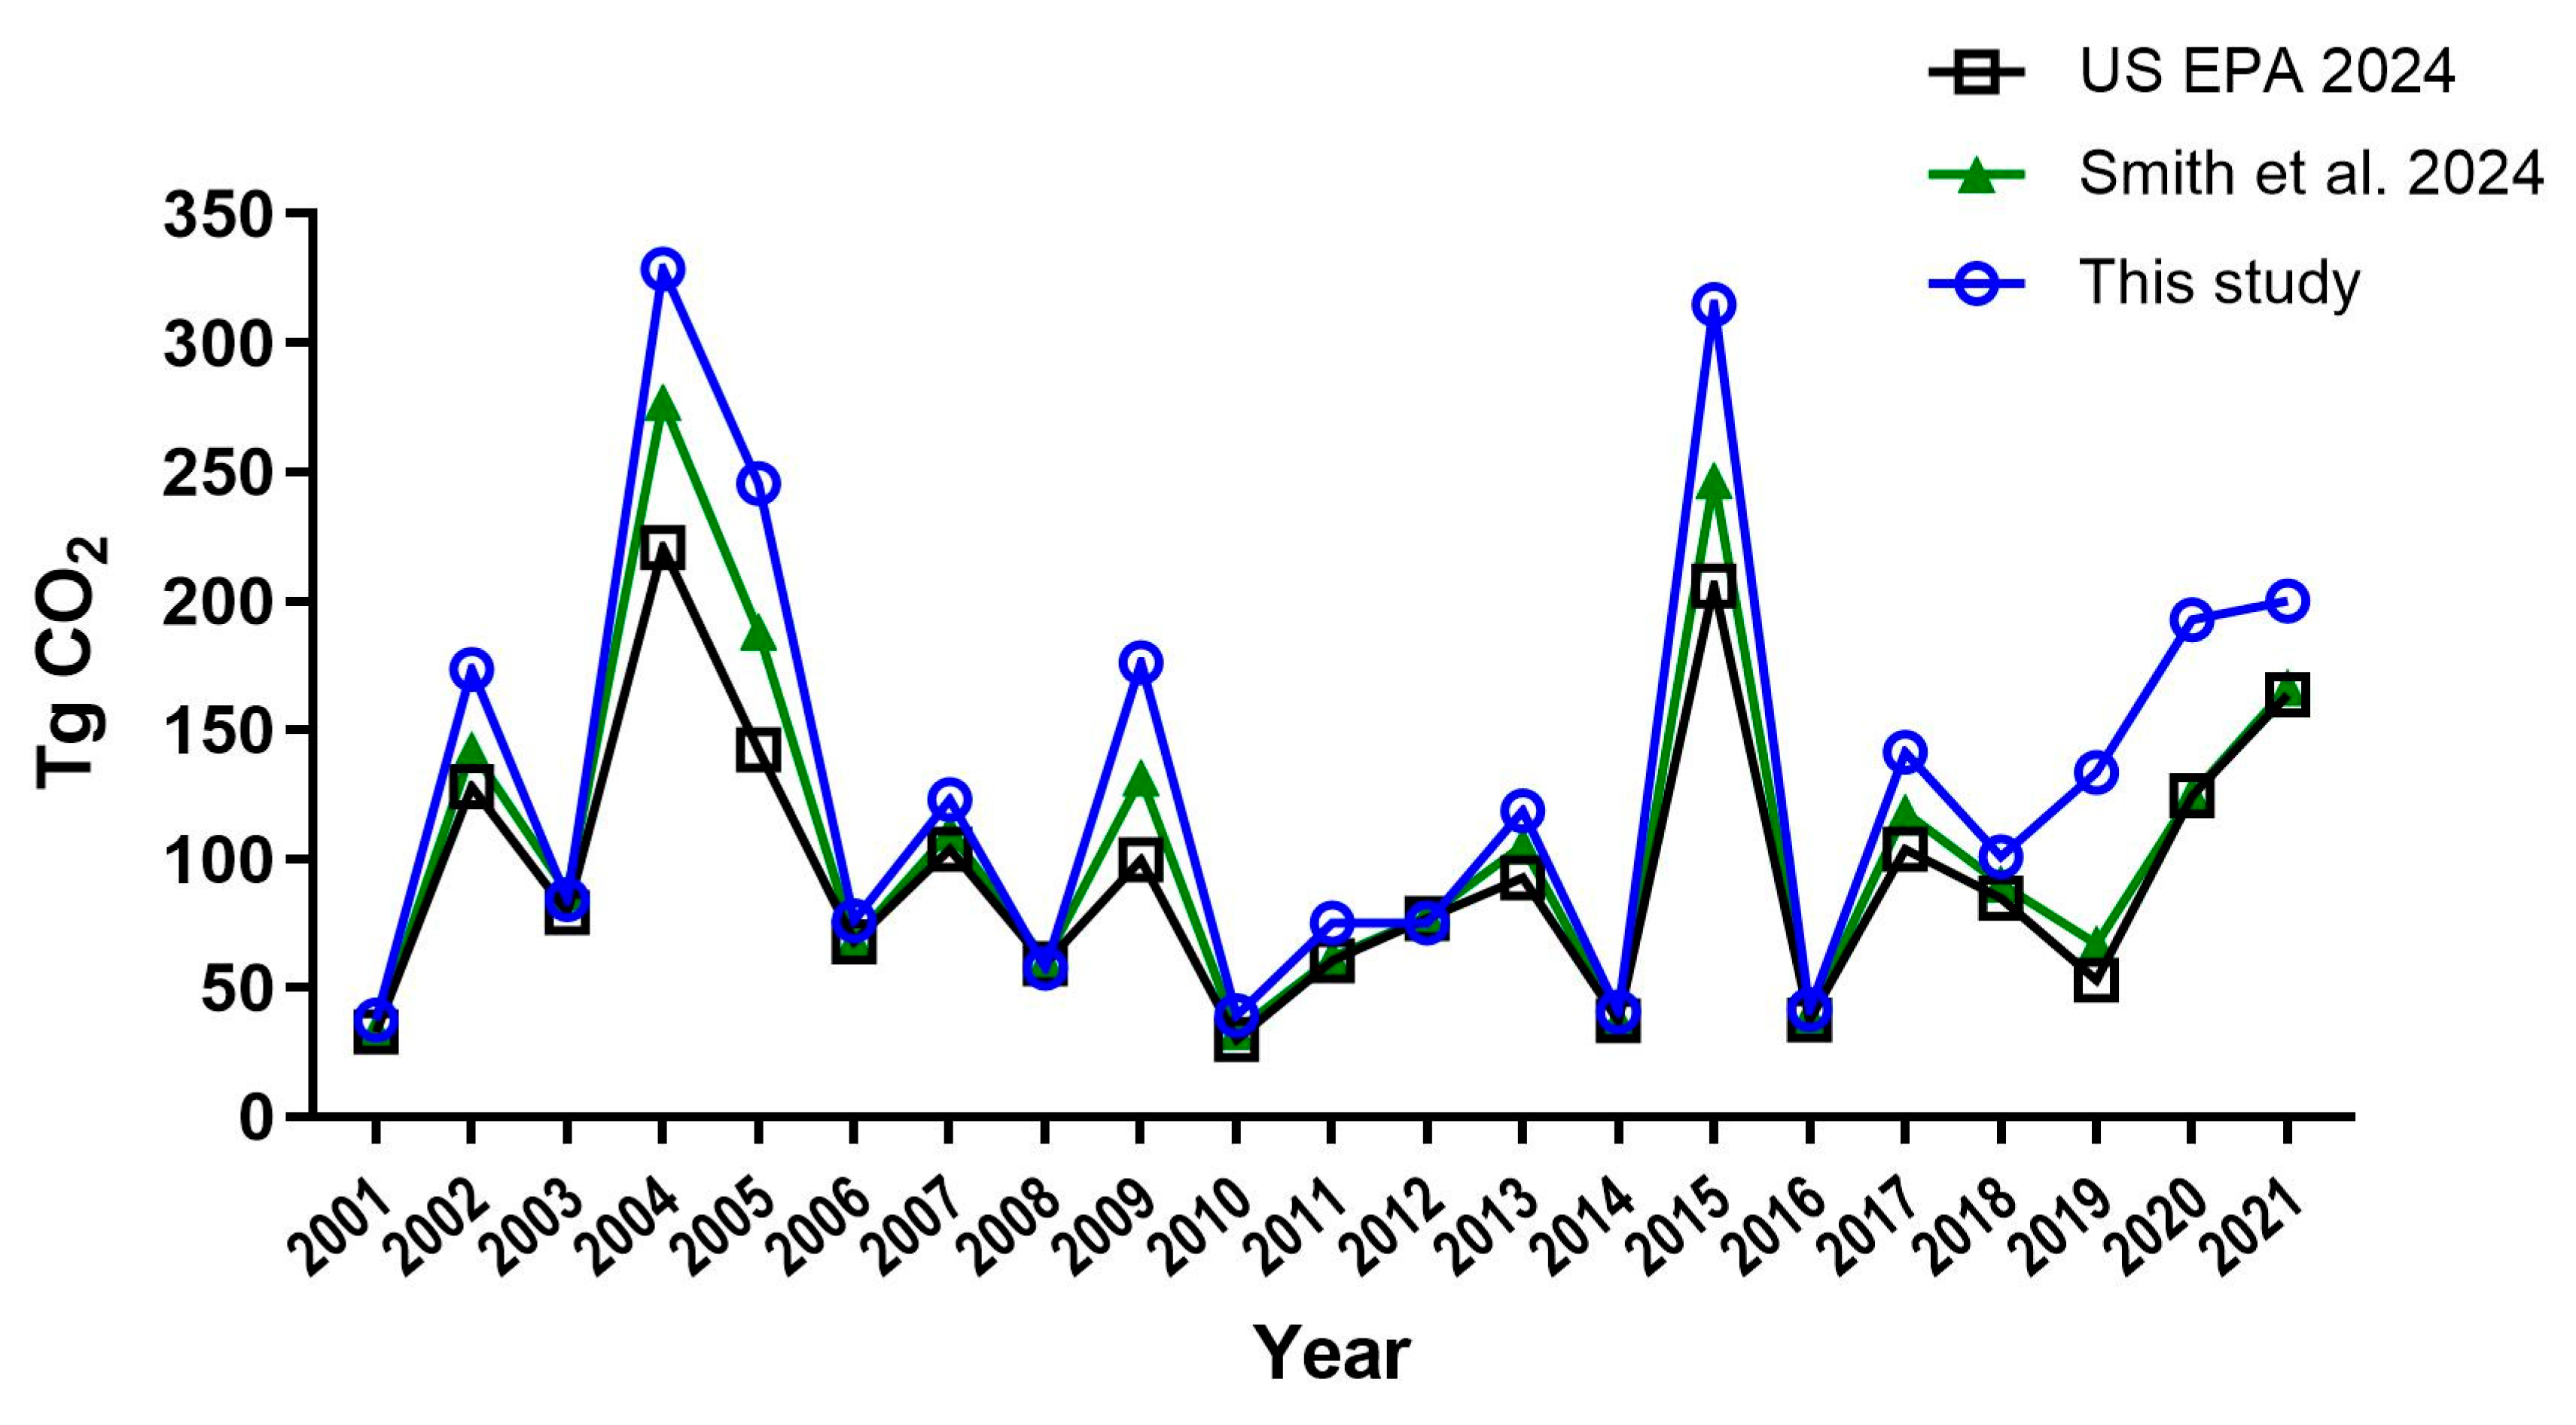
3.2. Emissions on Land Managed by Federal Agencies

Wildland fire emissions on land owned by the federal government accounted for 44 to 77 percent of the annual totals for the entire United States, comprising the majority of emissions in 19 of the 21 years (Figure 4, with the exceptions being 2009 and 2011). The mean proportion of annual emissions from federally managed land was 62 percent. The proportion of wildland emissions attributed to forest fires is higher on federally managed land relative to non-federal land (Table 2).
The higher proportion of federal land associated with forest fire emissions (Figure 3) also extends to most wildland fire emissions originating from federal land, over most regions (Table 1, Table 2, Table S1 and Table S2). Within federally owned land, the four agencies with the greatest average annual emissions from wildland fires were the Forest Service (FS), Bureau of Land Management (BLM), Fish and Wildlife Service (FWS), and National Park Service (NPS) in descending order (Table 3 and Table 4), with other (not listed) federal agencies contributing less than one percent of the mean annual fire emissions. Ninety-three percent of these emissions were from FS, BLM, and FWS (Table 2 and Table 4). The proportions of emissions associated with land managed by these agencies vary annually (Figure 5).
Among these federal agencies, FS-administered land was the greatest single source in 13 of the 21 years for the entire United States; the remaining 8 years (of this study) were characterized by extensive Alaska fires. Among the higher fire years for Alaska, FWS and BLM land was the largest contributor to the United States’ fire emissions in 2004, 2005, 2009, 2015, and 2019, with the majority of land being in Alaska.
Wildland fires on FS land account for 56 percent of federal fire emissions. The majority of the federal-land fire emissions annually were from fires on FS land for four of the six regions (Table 4). The exceptions include the Great Plains, with very little FS land, where most emissions came from FWS land. The other exception was Alaska, where FS land generally comprises wetter ecosystems, and so most fires were on FWS and BLM land.
Emissions from fires on FS land represented 5 to 90 percent of the federal total (mean of 56 percent, as noted above). However (as noted above), the main federal agencies associated with Alaskan fires were the BLM and FWS. From this, if the scope of the United States’ fires is limited to within the CONUS (Hawaii has no FS land), federally managed land constitutes 47 to 83 (with a mean of 65) percent all wildland fire emissions annually (a summary extracted from Tables S1 and S2). Of these federally based emissions, FS fire emissions accounted for 52 to 93 percent of the federal total (with a mean of 77 percent). For reference, fires on FS land produce 29 to 74 percent of all wildland emissions in the CONUS (with a mean of 51 percent).

4. Discussion

Our findings confirm the role of federally managed land as the largest single source of wildland fire emissions in the United States, with most emissions arising from land in the west. These data further highlight the importance of forest fires. Although more non-forested land is burned annually, emissions from wildfires on forested land comprise the most emissions. These findings agree with Crist [16], who reported that over the past two decades, a similar or greater area of non-forest land burned compared to forested land across the CONUS. Crist examined the trends among large land management agencies in western states and found different patterns among agencies, with a larger proportion of non-forest areas burned on land managed by the BLM and, more broadly, on other DOI land, and the opposite pattern was observed on FS-managed land. This is consistent with our results (Figure 2, Table 1). While non-forest land accounts for a larger proportion of burned area, emissions from forested land are higher, due to the composition and quantity of the fuel. While most emissions arise from forested land, the large amount of non-forest area burned annually highlights the role that this land plays in wildfire dynamics.
While federal land was the source of most emissions (Figure 4), the annual quantities of burned area and CO2 emitted did not indicate any consistent ranking of greatest importance for a single agency (also see Tables S1 and S2). However, FS land was the source of most emissions over most years. The exceptions were years with high levels of fires in Alaska, in which case land owned by the BLM and FWS was the primary source of emissions. Note that while Figure 4 and Table 1 and Table 2 include only four agencies, the pooled effect of all other federal government land can be determined (by subtraction) in Tables S1 and S2. The occasional large fires on this land owned by other federal agencies in individual years were not significant enough to affect the general results summarized here.
The total area and emissions of wildland fires provided here are generally consistent with other reports for the entire United States. For example, the total annual area of wildland fires for the United States (Figure 2a) is shown in comparison to two other annual series (Figure 6) of broadly similar scope (i.e., area of wildland fires for the United States). In addition to the MTBS burn perimeters (i.e., this study), the two additional sets in Figure 6 are based on fire statistics obtained from the National Interagency Fire Center website [12] and the spatial Wildfire Occurrence Data [42] (note that these data do not include 2021). The similar-scope comparison of forest fire emissions (Figure 7) includes this study’s forest emissions (Figure 2b) with two closely related (in data and methods) studies. All three are based on WFEIS-based simulations, but the other two sources are based on additional wildland fire perimeter data sources [38] and the slightly different use of fuel data by the model Consume (as described in Section 2. In addition, US EPA [13] totals do not include unmanaged land in Alaska, and Smith et al.’s [38] study does not include Hawaii. Overall, values and trends are similar (see the respective sources for additional details on methodological differences). The estimates of French et al. [22,23] are similar to the results presented here; these employ somewhat similar methodologies but are based on limited fuels and burn data. The whole-United States estimates provided by Urbanski et al. [26] use multiple burn source datasets, including MTBS estimates, similar CONUS burned areas, and somewhat similar fuel and fire simulation methods. The resulting estimates for all CONUS burned areas are consistent with those here, and their results for fuel consumed suggest slightly greater CO2 emissions. The overall estimates of the Congressional Budget Office [17] and Congressional Research Service [18] are also in general agreement with this study.

4.1. Allocation of Area Burned and Emissions

Common trends are apparent in these studies as well as the work reported here. Over the past two decades, while there was considerable year-to-year variability in area burned and emissions, both increased over time and the area burned was greater in the western United States, likely as a result of the combination of greater amounts of dry forest types, higher fuel loads, burn severity (e.g., ground or crown fire), drought, and larger amounts of dryland systems such as shrubland. The proportion of wildfires that occur on federal land, while variable across time, is also consistent across studies; federal land represents ≥50 percent of the area burned in all but a few years between 2001 and 2021 (Figure 4) (see also [17]). The Congressional Research Service report [18] presents the annual area burned from 2018 to 2022 for the following ownership or agency categories: DOI, FS, other federal, and non-federal entities. Among federally managed land, DOI and FS land had the largest percentage area burned, although the relative proportions for each agency varied considerably from year to year. Our analysis further disaggregates the federally managed land to the level of large management agency and broad geographic region. Among the four agencies with the largest area managed, the mean annual area burned was highest for the FS, followed by the BLM (826 and 506 kha, respectively), with the FWS and NPS representing far smaller areas burned. However, there were strong regional differences, most notably in Alaska, where the FWS and BLM account for much of the area burned (160 and 155 kha, respectively); the BLM also manages a large proportion of wildfire affected area in the Rocky Mountain region (Table 3). The ecosystem types managed by each agency play a role; the FS primarily manages forests and some grassland, while the BLM’s portfolio includes a large proportion of rangeland in addition to other systems, and the FWS manages a variety of systems including wetlands, prairies, and forests.
The results are similar for wildland fire emissions; the year-to-year contribution of federally owned land to the total United States wildland fire emissions is apparent in the annual totals (Figure 4). On an average annual basis, FS-managed land accounts for the largest proportion of federal wildland fire emissions (Table 4), although once again considerable interannual variability is present, with several years in which BLM and FWS land accounted for the largest share of federal wildfire emissions (e.g., 2004, 2005, 2015, as shown in Figure 5.) Additionally, geographic region affects the relative amount of fire (e.g., Figure 3, Table 3 and Table 4), with the largest contribution to totals being mostly from western fires. The rates of CO2 emitted per amount of total forest (i.e., effectively Figure 3b divided by 3c) in the three westernmost regions were 0.91 and 0.59 Mg CO2 per hectare for federal and non-federal forestland, respectively. Most of the non-federal rate for these regions is based on the high proportion of non-federal fires in Alaska. In the easternmost regions, overall rates were lower but also exhibit the pattern of higher rates on federal land (Figure 3); CO2 emissions were 0.52 and 0.038 Mg CO2 per hectare for federal and non-federal forest land, respectively. Pacific Coast and Rocky Mountain are the only two regions where FS land was consistently the greatest source of federal-land-based emissions.
The appendix tables are provided to supplement the information presented above; in particular, Tables S1 and S2 provide the annual values that are summarized as 21-year means following the summaries in Figure 3 and Table 1 and Table 2. Tables S3 and S4 provide the mean annual emissions and extent from wildland fires according to state with classifications of federal versus all and forest versus non-forest land. These tables make it possible to recast summaries developed for the entire United States in terms of Alaska-only or the CONUS.

4.2. Implications

Management or policy recommendations are outside the scope of this work, but the data presented here can inform policy or management decisions. While there was considerable variability in emissions and the area burned during the study period, our findings indicate that both increased, and the greatest proportions of wildland area burned and emissions arose from western states. Higher emissions from forest land, particularly in the west, are likely a function of multiple factors including stocking level, forest health, fuel loads, and past fire history, which suggests that there may be opportunities for reducing wildfire impacts through management actions to address those factors. While the bulk of wildland fire emissions arose from forested land, the large amount of non-forest area burned suggests that these areas may warrant consideration when evaluating potential management strategies. For example, additional analysis to distinguish rangeland from grassland may be called for in some regions where fires tend to occur in these ecosystems. The summaries presented, particularly the two-decade-long record of area burned included in the supplemental tables, may also assist in assessing the potential or risks for carbon projects in different regions. While we focus on federally managed land, the supplemental tables provide a greater level of detail including state-level estimates, which may be useful for developing state-level action plans and informing modeling efforts at a variety of scales.

4.3. Limitations

The data sources we use do not include information relevant to addressing peripheral topics such as the mechanisms of fire ignition or the site and weather characteristics affecting fire severity. The same is true for any association of these fires with land management or owner-specific land uses. We do summarize burned areas and emissions on land according to selected entities. When interpreting these data, it is important to not equate fire emissions on land managed by an agency with the assumption that the agency is the source (of ignition) of the fire, because fires often cross jurisdictional boundaries [43]. In other words, ‘ownership’ of emissions is not the same as the ‘origin’ of a burn, and ownership of fire origin is not in proportion to ownership of burned area. While the MTBS data provide numbers and sizes of fires, we do not analyze finer scale details of concern for more local management such as sub-regional summaries or more specific ownership statuses that may be detailed within the PAD-US data. While differences between fuelbed sources can provide an initial very limited level of uncertainty, specific uncertainties within the various model inputs were not readily quantified within our application of the WFEIS calculator. A future improvement would be to address uncertainties within model inputs, both marginal and joint uncertainties where possible. Because our focus was on providing a consistent set of estimates useful to a variety of stakeholders, we did not attempt to quantify uncertainty.

4.4. Future Research Opportunities

The starting points for further analysis include the potential gaps in the MTBS-defined fires as discussed in Smith et al. [38] resulting from differences between MTBS and other burn perimeter sources, such as the burned area mapping product MODIS MCD64A1 [10] or the Wildland Fire Interagency Geospatial Service Interagency Fire Perimeters [44]. These gaps include (1) fires defined by MTBS but not in other burn perimeter datasets; (2) fires defined within other data and not within MTBS; and (3) the mismatches between data directly related to burn size (i.e., fires smaller than the minimum threshold for MTBS fires). The model for producing the fire estimates that we present here is deterministic, with single sources for fires and classification. However, this same approach can lead to quantifying uncertainty through expanding WFEIS calculator inputs for fuelbeds and burn sources. Identifying combinations of multiple alternate inputs from fuelbeds and burn sources and systematically querying the WFEIS calculator for all combinations can be used to build sets of uncertainty in estimates. This is dependent on defining confidence bounds on the FCCS and NAWFD fuels as well as obtaining multiple fire perimeter definitions available through MTBS, MODIS, and WFIGS. However, there are many, including larger, fires that are not consistently represented in the alternate burn source datasets [38], and this challenge is not easily addressed.
An additional direction for continued analysis concerns the two fuelbed sources—FCCS and NAWFD. Obtaining spatial representations of both datasets may make it possible to explicitly allocate forest versus non-forest land within each MTBS burn perimeter instead of using the independent land cover images to allocate such divisions within perimeters. While this approach may or may not affect forest versus non-forest land allocation, it may be useful to better reflect changes in vegetation structure across large-footprint fires. These same spatial data may be useful in evaluating the apparently highly skewed distributions of fuel in some of the NAWFD locations.

5. Conclusions

Key findings from this 21-year summary of wildland fire emissions and area burned include the following: (1) forests account for most wildland fire emissions, despite the greater non-forest area burned annually; (2) federal land is the source of most of annual wildland fire emissions; (3) most of the wildland area burned and fire emissions are in the western United States; and (4) among federal agencies, FS-administered land in CONUS was the greatest single source of the United States’ emissions in 16 of the 21 years. The remaining 5 years were characterized by extensive Alaskan fires, with the majority of federal land fire emissions on BLM and FWS land (recalling that FS-managed land in Alaska consists of wetter forest types). In short, the major contributions to wildland fire emissions in any given year are forest fires occurring on FS land or in Alaska.

Supplementary Materials

The following supporting information can be downloaded at: https://www.mdpi.com/article/10.3390/f16081205/s1, Table S1—Annual wildland fire CO2 emissions by region and manager, 2001–2021; Table S2—Wildland area burned annually by region and manager, 2001–2021; Table S3. Mean wildland fire emissions for forest and non-forest land, on federal land and all land; Table S4. Mean wildland area burned for forest and non-forest land, on federal land and all land.

Author Contributions

Initial concept 30/70 (C.M.H./J.E.S.); analysis 50/50; initial writing 70/30 (C.M.H./J.E.S.); and final manuscript and revisions 90/10 (C.M.H./J.E.S.). All authors have read and agreed to the published version of the manuscript.

Funding

This research received no external funding.

Data Availability Statement

All data were from publicly available spatial datasets obtained prior to determining wildland fire and emissions via WFEIS in mid-2024. Datasets contributing to inputs for the WFEIS calculator—MTBS, PAD-US, NLCD—are cited, with URL and access dates. The intermediate reduced data are available from the authors on request.

Acknowledgments

The authors thank E. Lilleskov and A. Lister for their helpful feedback. We also thank N. French and M. Billmire for developing and maintaining the WFEIS calculator and providing insights that helped us complete this work. The manuscript also benefited from the comments of three anonymous reviewers, and we thank them for their service.

Conflicts of Interest

The authors declare no conflicts of interest. Note: The findings and conclusions in this publication are those of the authors and should not be construed to represent any official USDA or U.S. government determination or policy.

References

  1. Cattau, M.E.; Wessman, C.; Mahood, A.; Balch, J.K. Anthropogenic and lightning-started fires are becoming larger and more frequent over a longer season length in the U.S.A. Glob. Ecol. Biogeogr. 2020, 29, 668–681. [Google Scholar] [CrossRef]
  2. Dennison, P.E.; Brewer, S.C.; Arnold, J.D.; Moritz, M.A. Large wildfire trends in the western United States, 1984–2011. Geophys. Res. Lett. 2014, 41, 2928–2933. [Google Scholar] [CrossRef]
  3. Yang, J.; Tian, H.; Tao, B.; Ren, W.; Pan, S.; Liu, Y.; Wang, Y. A growing importance of large fires in conterminous United States during 1984–2012. J. Geophys. Res. Biogeosci. 2015, 120, 2625–2640. [Google Scholar] [CrossRef]
  4. Stevens-Rumann, C.S.; Morgan, P. Tree regeneration following wildfires in the western US: A review. Fire Ecol. 2019, 15, 15. [Google Scholar] [CrossRef]
  5. Jaffe, D.A.; O’Neill, S.M.; Larkin, N.K.; Holder, A.L.; Peterson, D.L.; Halofsky, J.E.; Rappold, A.G. Wildfire and prescribed burning impacts on air quality in the United States. J. Air Waste Manag. Assoc. 2020, 70, 583–615. [Google Scholar] [CrossRef] [PubMed]
  6. Agbeshie, A.A.; Abugre, S.; Atta-Darkwa, T.; Awuah, R. A review of the effects of forest fire on soil properties. J. For. Res. 2022, 33, 1419–1441. [Google Scholar] [CrossRef]
  7. Smith, H.G.; Sheridan, G.J.; Lane, P.N.J.; Nyman, P.; Haydon, S. Wildfire effects on water quality in forest catchments: A review with implications for water supply. J. Hydrol. 2011, 396, 170–192. [Google Scholar] [CrossRef]
  8. Hurteau, M.D.; Koch, G.W.; Hungate, B.A. Carbon protection and fire risk reduction: Toward a full accounting of forest carbon offsets. Front. Ecol. Env. 2008, 6, 493–498. [Google Scholar] [CrossRef]
  9. Oswalt, S.N.; Smith, W.B.; Miles, P.D.; Pugh, S.A. Forest Resources of the United States, 2017: A Technical Document Supporting the Forest Service 2020 RPA Assessment; Gen. Tech. Rep. WO-97; U.S. Department of Agriculture, Forest Service, Washington Office: Washington, DC, USA, 2020. [CrossRef]
  10. Giglio, L.; Boschetti, L.; Roy, D.P.; Humber, M.L.; Justice, C.L. The Collection 6 MODIS burned area mapping algorithm and product. Remote Sens. Environ. 2018, 217, 72–85. [Google Scholar] [CrossRef] [PubMed]
  11. Monitoring Trend in Burn Severity (MTBS). Website and Data. 2024. Available online: https://www.mtbs.gov/ (accessed on 15 August 2024).
  12. National Interagency Fire Center (NIFC). Fire Information. 2024. Available online: https://www.nifc.gov/fire-information/statistics (accessed on 10 April 2024).
  13. US EPA. Inventory of U.S. Greenhouse Gas Emissions and Sinks: 1990–2022; EPA 430R-24004; U.S. Environmental Protection Agency: Washington, DC, USA, 2024. Available online: https://www.epa.gov/ghgemissions/inventory-us-greenhouse-gas-emissions-and-sinks-1990-2022 (accessed on 22 October 2024).
  14. Weber, K.T.; Yadav, R. Spatiotemporal trends in wildfires across the western United States (1950–2019). Remote Sens. 2020, 12, 2959. [Google Scholar] [CrossRef]
  15. Merrill, M.D.; Sleeter, B.M.; Freeman, P.A. Federal Lands Greenhouse Gas Emissions and Sequestration in the United States—Estimates for 2005–22; U.S. Geological Survey Scientific Investigations Report 2024–5103, [Supersedes USGS Scientific Investigations Report 2018–5131]; U.S. Geological Survey: Reston, VA, USA, 2024. [CrossRef]
  16. Crist, M.R. Rethinking the focus on forest fires in federal wildland fire management: Landscape patterns and trends of non-forest and forest burned area. J. Environ. Manage. 2023, 327, 116718. [Google Scholar] [CrossRef] [PubMed]
  17. Congressional Budget Office. Wildfires, CBO Report. 2022. Available online: www.cbo.gov/publication/57970 (accessed on 13 November 2024).
  18. Congressional Research Service. Wildfire Statistics, CRS Report IF10244. 2023. Available online: https://crsreports.congress.gov/product/pdf/IF/IF10244/69 (accessed on 13 November 2024).
  19. Hawbaker, T.J.; Vanderhoof, M.K.; Schmidt, G.L.; Beal, Y.-J.; Picotte, J.J.; Takacs, J.D.; Falgout, J.T.; Dwyer, J.L. The Landsat Burned Area algorithm and products for the conterminous United States. Remote. Sens. Environ. 2020, 244, 111801. [Google Scholar] [CrossRef]
  20. Xu, Q.; Westerling, A.L.; Notohamiprodjo, A.; Wiedinmyer, C.; Picotte, J.J.; Parks, S.A.; Hurteau, M.D.; Marlier, M.E.; Kolden, C.A.; Sam, J.A.; et al. Wildfire burn severity and emissions inventory: An example implementation over California. Environ. Res. Lett. 2022, 17, 085008. [Google Scholar] [CrossRef]
  21. French, N.H.F.; Hudak, A.T. Biomass burning fuel consumption and emissions for air quality. In Landscape Fire, Smoke and Health: Linking Biomass Burning Emissions to Human Well-Being; Loboda, T.V., French, N.H.F., Puett, R.C., Eds.; Wylie-AGU: Washington, DC, USA, 2023; ISBN 978-1-119-75700-9. [Google Scholar]
  22. French, N.H.F.; McKenzie, D.; Erickson, T.; Koziol, B.; Billmire, M.; Endsley, K.A.; Scheinerman, N.K.Y.; Jenkins, L.; Miller, M.E.; Ottmar, R.; et al. Modeling Regional-Scale Wildland Fire Emissions with the Wildland Fire Emissions Information System*. Earth Interact. 2014, 18, 1–26. [Google Scholar] [CrossRef]
  23. French, N.H.F.; McKenzie, D.; Erickson, T.; Koziol, B.; Billmire, M.; Endsley, K.A.; Scheinerman, N.K.Y.; Jenkins, L.K.; Miller, M.E.; Ottmar, R.; et al. Annual Wildland Fire Emissions (WFEIS v0.5) for Conterminous US and Alaska, 2001–2013; ORNL DAAC: Oak Ridge, TN, USA, 2016. [Google Scholar] [CrossRef]
  24. Wiedinmyer, C.; Quayle, B.; Geron, C.; Belote, A.; McKenzie, D.; Zhang, X.; O’nEill, S.; Wynne, K.K. Estimating emissions from fires in North America for air quality modeling. Atmos. Environ. 2006, 40, 3419–3432. [Google Scholar] [CrossRef]
  25. Wiedinmyer, C.; Neff, J.C. Estimates of CO2 from fires in the United States: Implications for carbon management. Carbon Balance Manag. 2007, 2, 10. [Google Scholar] [CrossRef] [PubMed]
  26. Urbanski, S.P.; Reeves, M.C.; Corley, R.E.; Silverstein, R.P.; Hao, W.M. Contiguous United States wildland fire emission estimates during 2003–2015. Earth Syst. Sci. Data 2018, 10, 2241–2274. [Google Scholar] [CrossRef]
  27. Eidenshink, J.; Schwind, B.; Brewer, K.; Zhu, Z.-L.; Quayle, B.; Howard, S. A Project for Monitoring Trends in Burn Severity. Fire Ecol. 2007, 3, 3–21. [Google Scholar] [CrossRef]
  28. Picotte, J.J.; Bhattarai, K.; Howard, D.; Lecker, J.; Epting, J.; Quayle, B.; Benson, N.; Nelson, K. Changes to the Monitoring Trends in Burn Severity program mapping production procedures and data products. Fire Ecol. 2020, 16, 16. [Google Scholar] [CrossRef]
  29. WFEIS. The Wildland Fire Emission Inventory System Calculator. 2025. Available online: https://wfeis.mtri.org/home (accessed on 11 June 2025).
  30. Prichard, S.J.; Ottmar, R.D.; Anderson, G.K. Consume 3.0 User’s Guide; USDA Forest Service: Seattle, WA, USA; Pacific Northwest Research Station: Seattle, WA, USA; Pacific Wildland Fire Sciences Laboratory: Seattle, WA, USA; Fire and Environmental Research Applications Team: Seattle, WA, USA, 2006; p. 234. Available online: https://www.frames.gov/catalog/1260 (accessed on 3 April 2024).
  31. SERA 2025. The Smoke Emissions Reference Application database (SERA). Available online: https://depts.washington.edu/nwfire/sera/ (accessed on 11 June 2025).
  32. Abatzoglou, J.T. Development of gridded surface meteorological data for ecological applications and modelling. Int. J. Climatol. 2013. [Google Scholar] [CrossRef]
  33. GridMet. Dataset of The Climatology Lab. 2025. Available online: https://www.climatologylab.org/gridmet.html (accessed on 11 June 2025).
  34. GFWED. Global Fire WEather Database (GFWED) of the National Aeronautics and Space Administration. 2025. Available online: https://data.giss.nasa.gov/impacts/gfwed/ (accessed on 11 June 2025).
  35. FWI. Canadian Forest Fire Weather Index (FWI) System. 2025. Available online: https://cwfis.cfs.nrcan.gc.ca/background/summary/fwi (accessed on 11 June 2025).
  36. Ottmar, R.D.; Sandberg, D.V.; Riccardi, C.L.; Prichard, S.J. An overview of the Fuel Characteristic Classification System—Quantifying, classifying, and creating fuelbeds for resource planning. Can. J. For. Res. 2007, 37, 2383–2393. [Google Scholar] [CrossRef]
  37. Prichard, S.J.; Kennedy, M.C.; Andreu, A.G.; Eagle, P.C.; French, N.H.; Billmire, M. Next-Generation Biomass Mapping for Regional Emissions and Carbon Inventories: Incorporating Uncertainty in Wildland Fuel Characterization. J. Geophys. Res. Biogeosci. 2019, 124, 3699–3716. [Google Scholar] [CrossRef]
  38. Smith, J.E.; Billmire, M.; French, N.H.F.; Domke, G.M. Application of the wildland fire emissions inventory system to estimate fire emissions on forest lands of the United States. Carbon Balance Manag. 2024, 19, 26. [Google Scholar] [CrossRef] [PubMed]
  39. U.S. Geological Survey (USGS) Gap Analysis Project (GAP) Protected Areas Database of the United States (PAD-US) 3.0: U.S. Geological Survey. Available online: https://www.sciencebase.gov/catalog/item/65294599d34e44db0e2ed7cf (accessed on 13 March 2024).
  40. Yang, L.; Jin, S.; Danielson, P.; Homer, C.; Gass, L.; Bender, S.M.; Case, A.; Costello, C.; Dewitz, J.; Fry, J.; et al. A new generation of the United States National Land Cover Database: Requirements, research priorities, design, and implementation strategies. ISPRS J. Photogramm. Remote Sens. 2018, 146, 108–123. [Google Scholar] [CrossRef]
  41. NLCD. National Land Cover Database (NLCD) Science Product Images Developed by the Multi-Resolution Land Characteristics (MRLC) Consortium. 2023. Available online: https://www.mrlc.gov/ (accessed on 10 June 2024).
  42. Short, K.C. Spatial Wildfire Occurrence Data for the United States, 1992–2020 [FPA_FOD_20221014], 6th ed.; Forest Service Research Data Archive: Fort Collins, CO, USA, 2022. Available online: https://www.fs.usda.gov/rds/archive/catalog/RDS-2013-0009.6 (accessed on 10 April 2024).
  43. Downing, W.M.; Dunn, C.J.; Thompson, M.P.; Caggiano, M.P.; Short, K.C. Human ignitions on private lands drive USFS cross-boundary wildfire transmission and community impacts in the western US. Sci. Rep. 2022, 12, 2624. [Google Scholar] [CrossRef] [PubMed]
  44. WFIGS 2024. The Wildland Fire Interagency Geospatial Service Interagency Fire Perimeters; National Interagency Fire Center: Boise, ID, USA, 2023. Available online: https://wfigs-nifc.hub.arcgis.com/pages/wfigs-fire-history (accessed on 10 April 2024).
Figure 1. Regions.
Figure 1. Regions.
Forests 16 01205 g001
Figure 2. Annual wildland fire area burned (a) and CO2 emissions (b) for the United States. Burned area and emissions are identified as all wildland or forest land.
Forests 16 01205 g002
Figure 3. Area of forest burned (a); CO2 emissions from forest fires (b); and total forest land (c) by region and broad ownership group (state, federal, and all other owners including private entities, other public entities, and tribes). Based on 21-year mean. * Note: Alaska forest areas are based on Oswalt et al. [9]; see the Methods for more detail.
Forests 16 01205 g003
Figure 4. Annual wildland fire emissions associated with land managed by the Forest Service, all other federal agencies, and all other owners including private entities, other public entities, and tribes.
Forests 16 01205 g004
Figure 5. Annual wildland fire emissions associated with land administered/managed by the four federal agencies with the largest area managed: NPS, FWS, BLM, and USFS.
Forests 16 01205 g005
Figure 6. Wildland fire burned area (thousand hectares) as presented in this study compared to two independent estimates of similar scope (whole of the United States)—data from the National Interagency Fire Center (NIFC 2024, black line) [12], and the Wildland Fire Occurrence Data (Short 2022, green line) [42].
Forests 16 01205 g006
Figure 7. Forest fire emissions for the United States from this study and two separate but related studies (US EPA 2024, black line [13], and Smith et al. 2024, green line [38]). Each study is based on slightly different methods and scopes relative to the others.
Forests 16 01205 g007
Table 1. Mean wildland area burned annually, 2001–2021, in thousands of hectares, by ownership class. All Other includes other public (such as state and county) and all private landowners (including tribes).
RegionUSFSOther FederalAll Other
ForestNon-forestForestNon-forestForestNon-forest
Alaska0.060.13213.14125.29170.4481.26
Pacific Coast200.3199.4920.8096.3668.12207.11
Rocky Mountain204.81143.8620.39268.5142.91232.82
Great Plains1.693.350.9110.1525.01427.56
North8.341.931.313.709.429.36
South105.4856.6619.4736.4764.9484.07
All US520.68305.43276.02540.48380.841042.18
Table 2. Mean CO2 emitted annually from wildland fires, 2001–2021, by ownership class. All Other includes other public (such as state and county) and all private landowners (including tribes). Data are Tg of CO2.
RegionUSFSOther FederalAll Other
ForestNon-forestForestNon-forestForestNon-forest
Alaska0.010.0035.838.4727.404.81
Pacific Coast23.112.552.491.077.243.36
Rocky Mountain16.722.441.652.352.922.12
Great Plains0.100.020.050.521.254.60
North0.900.040.140.441.171.09
South5.831.971.112.653.725.26
All US46.677.0241.2615.5143.7121.24
Table 3. Mean wildland area burned annually, 2001–2021, in thousands of hectares, for four large federal land management agencies. Dash indicates a value of zero.
RegionUSFSFWSBLMNPS
Alaska0.19160.21154.9223.30
Pacific Coast299.792.4395.1918.15
Rocky Mountain348.687.69255.8017.08
Great Plains5.046.510.333.65
North10.274.04-0.69
South162.1434.910.0119.00
All US826.11215.80506.2581.86
Table 4. Mean CO2 emitted annually from wildland fires, 2001–2021, for four large federal land management agencies. Data are in Tg of CO2. Values of 0.00 indicate a very small positive value; a dash indicates a value of zero.
RegionUSFSFWSBLMNPS
Alaska0.0220.3321.033.01
Pacific Coast25.030.092.151.38
Rocky Mountain18.810.112.731.11
Great Plains0.110.430.000.08
North0.920.51-0.05
South7.782.480.001.29
All US52.6723.9525.926.93
Disclaimer/Publisher’s Note: The statements, opinions and data contained in all publications are solely those of the individual author(s) and contributor(s) and not of MDPI and/or the editor(s). MDPI and/or the editor(s) disclaim responsibility for any injury to people or property resulting from any ideas, methods, instructions or products referred to in the content.

