Article

A 36-Year Assessment of Mangrove Ecosystem Dynamics in China Using Kernel-Based Vegetation Index

1
College of Electronic and Information Engineering, Guangdong Ocean University, Zhanjiang 524088, China
2
The State Key Laboratory of Soil and Sustainable Agriculture, Institute of Soil Science Chinese Academy of Sciences, Nanjing 210008, China
3
Academy of Eco-Civilization Development for Jing-Jin-Ji Megalopolis, Tianjin Normal University, Tianjin 300387, China
*
Author to whom correspondence should be addressed.
Forests 2025, 16(7), 1143; https://doi.org/10.3390/f16071143
Submission received: 10 June 2025 / Revised: 2 July 2025 / Accepted: 9 July 2025 / Published: 11 July 2025
(This article belongs to the Section Forest Inventory, Modeling and Remote Sensing)

Abstract

Mangrove forests serve as critical ecological barriers in coastal zones and play a vital role in global blue carbon sequestration strategies. In recent decades, China’s mangrove ecosystems have experienced complex interactions between degradation and restoration under intense coastal urbanization and systematic conservation efforts. However, the long-term spatiotemporal patterns and driving mechanisms of mangrove ecosystem health changes remain insufficiently quantified. This study developed a multi-temporal analytical framework using Landsat imagery (1986–2021) to derive kernel normalized difference vegetation index (kNDVI) time series—an advanced phenological indicator with enhanced sensitivity to vegetation dynamics. We systematically characterized mangrove growth patterns along China’s southeastern coast through integrated Theil–Sen slope estimation, Mann–Kendall trend analysis, and Hurst exponent forecasting. A Deep Forest regression model was subsequently applied to quantify the relative contributions of environmental drivers (mean annual sea surface temperature, precipitation, air temperature, tropical cyclone frequency, and relative sea-level rise rate) and anthropogenic pressures (nighttime light index). The results showed the following: (1) a nationally significant improvement in mangrove vitality (p < 0.05), with mean annual kNDVI increasing by 0.0072/yr during 1986–2021; (2) spatially divergent trajectories, with 58.68% of mangroves exhibiting significant improvement (p < 0.05), which was 2.89 times higher than the proportion of degraded areas (15.10%); (3) Hurst persistence analysis (H = 0.896) indicating that 74.97% of the mangrove regions were likely to maintain their growth trends, while 15.07% of the coastal zones faced potential degradation risks; and (4) Deep Forest regression id the relative rate of sea-level rise (importance = 0.91) and anthropogenic (nighttime light index, importance = 0.81) as dominant drivers, surpassing climatic factors. This study provides the first national-scale, 30 m resolution assessment of mangrove growth dynamics using kNDVI, offering a scientific basis for adaptive management and blue carbon strategies in subtropical coastal ecosystems.

1. Introduction

Mangrove forests, specialized plant communities that thrive at the dynamic interface between tropical and subtropical coastal land and marine environments, play an essential role in coastal protection, nutrient cycling, and biodiversity maintenance [1,2,3]. These ecosystems are renowned for their exceptional carbon sequestration capacity, which is estimated to be four times greater per unit area than that of tropical rainforests [1,4]. As crucial components of global ecological processes, they contribute significantly to climate change mitigation. However, in recent decades, mangrove growth and habitats worldwide have undergone substantial changes due to rapid economic development, urbanization, global climate change, and rising sea levels [5,6]. Globally, mangrove forests have lost about 35% of their horizontal extent, declining at a rate of 1%–2% per year, and 67% have suffered irreversible damage [7,8]. Monitoring the spatial patterns and evolution of mangrove growth is vital for the ecological protection of coastal zones and supports marine resource management and sustainable development in these areas.
Remote sensing technology has significantly improved the ability to monitor mangrove forests by providing extensive spatial coverage, rapid data acquisition, and efficient tracking [9,10]. Advancements in satellite remote sensing have led to the availability of several open-source datasets, including Landsat, MODIS, SPOT, and Sentinel [5,9,11,12,13]. These datasets enable monitoring of mangrove dynamics on global and regional scales at annual, seasonal, and even monthly intervals. Among these, the Landsat series merits particular attention because of its uninterrupted operation since 1972, providing images with low to medium spatial resolutions of 30 m and 15 m, respectively [14]. This makes it particularly effective for capturing long-term changes in mangrove forests, particularly in complex habitats.
Researchers have developed reliable remote sensing indices using satellite data to monitor the spatial and temporal changes in mangrove forests. Among these, the normalized difference vegetation index (NDVI) is widely used because of its ability to minimize irradiance variations caused by instrument calibration, solar angle, topography, cloud shadows, and atmospheric conditions [15]. Its sensitivity to chlorophyll content and vegetation density further enhances its effectiveness in assessing vegetation [16].
However, the conventional NDVI is subject to limitations, particularly in areas with dense vegetation and thick canopies, where it tends to saturate [17]. To address these challenges, the enhanced vegetation index (EVI) was proposed as a solution, offering increased sensitivity in regions with high biomass and reducing atmospheric distortions [18]. EVI enhances atmospheric resistance by using the blue band to correct aerosol effects on the red band, while mitigating saturation via correction factors and a more complex denominator, thus preserving responsiveness to vegetation variations in dense canopy conditions. Other indices, such as the soil-adjusted vegetation index (SAVI) and vegetation cover metrics, provide valuable information on forest spatial extent but lack the detailed insights into vegetation health and productivity that spectral indices offer [19]. Notwithstanding the aforementioned advancements, remote sensing indices remain susceptible to influences such as background soil reflectance and atmospheric conditions [20]. Consequently, their capacity to accurately capture mangrove growth dynamics within complex ecosystems is diminished.
Recent advancements in remote sensing indices have resulted in more reliable methods for measuring vegetation activity. The kernel normalized difference vegetation index (kNDVI), introduced by Camps-Valls et al. [17], enhances sensitivity to changes in dense vegetation and reduces saturation effects, addressing the limitations of traditional indices. Notably, in tropical and subtropical coastal regions and island areas, kNDVI has demonstrated a strong correlation with vegetation’s net primary productivity (NPP), canopy cover, and biomass, making it a valuable tool for accurately assessing vegetation growth and health [17,21]. Nonetheless, the utilization of the advanced kNDVI index in mangrove research is restricted, particularly in the context of long-term spatio-temporal studies [22].
Mangrove forests in China are located along the southern coastline, which constitutes a significant portion of Eastern Asia’s mangrove ecosystems [3]. In recent decades, these forests have undergone dramatic changes due to rapid coastal development, the expansion of aquaculture, and the impacts of climate change [1,6,23]. Although previous studies have explored mangrove dynamics using some remote sensing indices (e.g., NDVI, EVI, and mangrove cover), most have concentrated on short time frames or specific regions [5,9,11,13,24,25,26]. Despite the advances witnessed in the field, significant gaps persist in our understanding of the long-term dynamics of mangrove forests in China. Existing studies are often constrained by short time frames, limited geographic scope, and reliance on conventional indices. Additionally, analyses of the drivers affecting mangrove change often emphasize linear relationships, potentially neglecting complex nonlinear interactions between environmental factors and mangrove health.
To address the aforementioned knowledge gaps, this study aimed to utilize the innovative remote sensing index kNDVI in conjunction with Landsat 5, 7, and 8 satellite data, employing mean synthesis processing. This study comprehensively analyzed the spatial and temporal variations in kNDVI in mangrove forests along China’s coastal zone from 1986 to 2021, providing new insights into the long-term dynamics of these vital ecosystems. The objective of this study is twofold: first, to quantify and map the spatial and temporal patterns of kNDVI in Chinese mangrove forests over a 36-year period using Theil–Sen median slope estimation, Mann–Kendall trend analysis, and the Hurst method; and second, to identify and analyze the drivers affecting changes in kNDVI using the Deep Forest algorithm, exploring potential nonlinear relationships between environmental variables and mangrove sustainability. This study was motivated by the urgent need for a comprehensive, long-term assessment of mangrove health and dynamics amid rapid environmental changes.

2. Materials and Methods
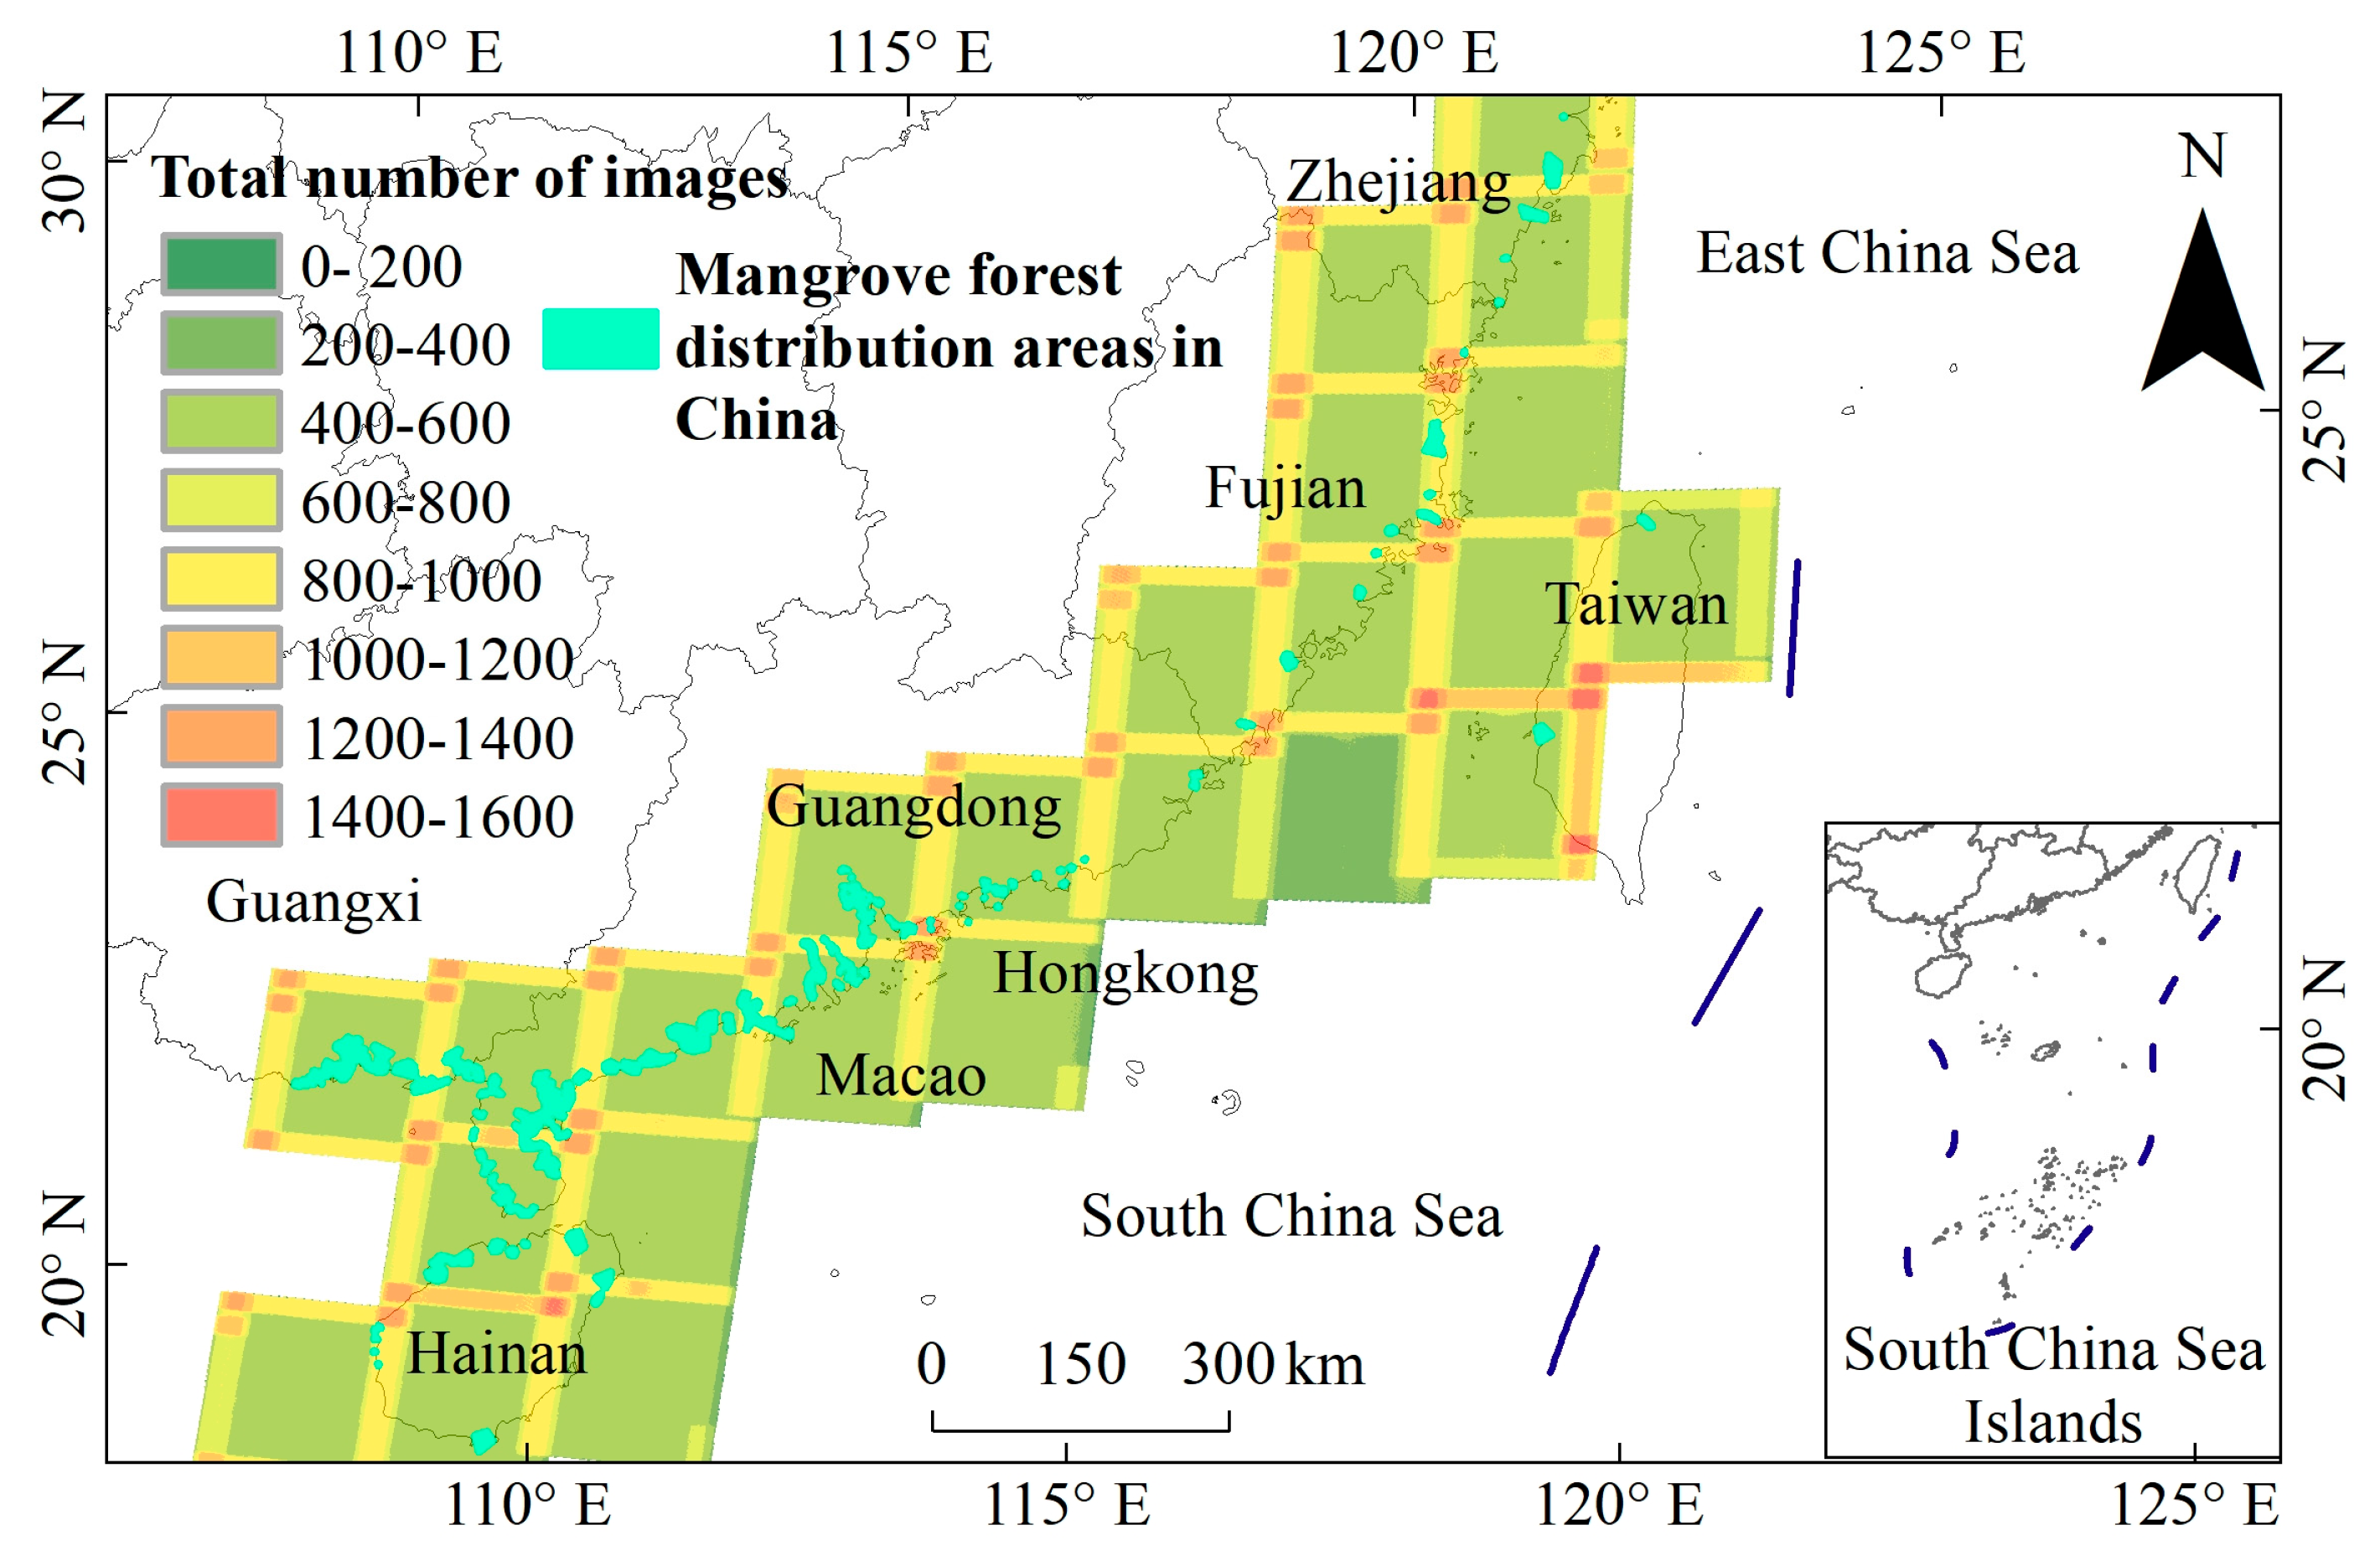
2.1. Study Area

This study focuses on the potential distribution of mangrove ecosystems along the southeast coast of China (18°9′ N–28°25′ N, 108°50′ E–121°10′ E), covering regions such as Hainan, Guangdong, Guangxi, Taiwan, Fujian, Zhejiang, as well as Hong Kong and Macau (Figure 1), excluding the South China Sea islands from the scope of analysis. The total area under consideration spans approximately 340.78 km2, excluding the South China Sea Islands [3]. Mangroves are primarily concentrated in coastal zones, particularly in estuaries, bays, and lagoons. The topography of these regions is predominantly flat, and the landforms are modest in size. The region falls within tropical and subtropical monsoon climates, characterized by warm, humid conditions, with rainfall and heat occurring simultaneously. The average annual precipitation ranges from 1304 to 2170 mm, with a multi-year average temperature between 18 °C and 24 °C, and an average relative humidity of 86% [27]. China’s mangrove ecosystems support a diverse range of species, with dominant ones including Kandelia Candel (Kandelia obovata), White Mangrove (Avicennia marina), River Mangrove (Aegiceruas corniculatum), Blinding Tree (Excoecaria agallocha), and Sea Mango (Cerbera manghas) [28]. In response to the challenges endangering the survival of mangroves, the government has instituted several measures, including the creation of mangrove nature reserves and the implementation of ecological restoration initiatives. However, these ecosystems continue to face dual challenges: increasing pressure from the sea and obstacles to landward adaptation [6,29].
The dynamic monitoring of mangrove ecosystems in the study area and the analysis of influencing factors were conducted following the workflow illustrated in Figure 2.

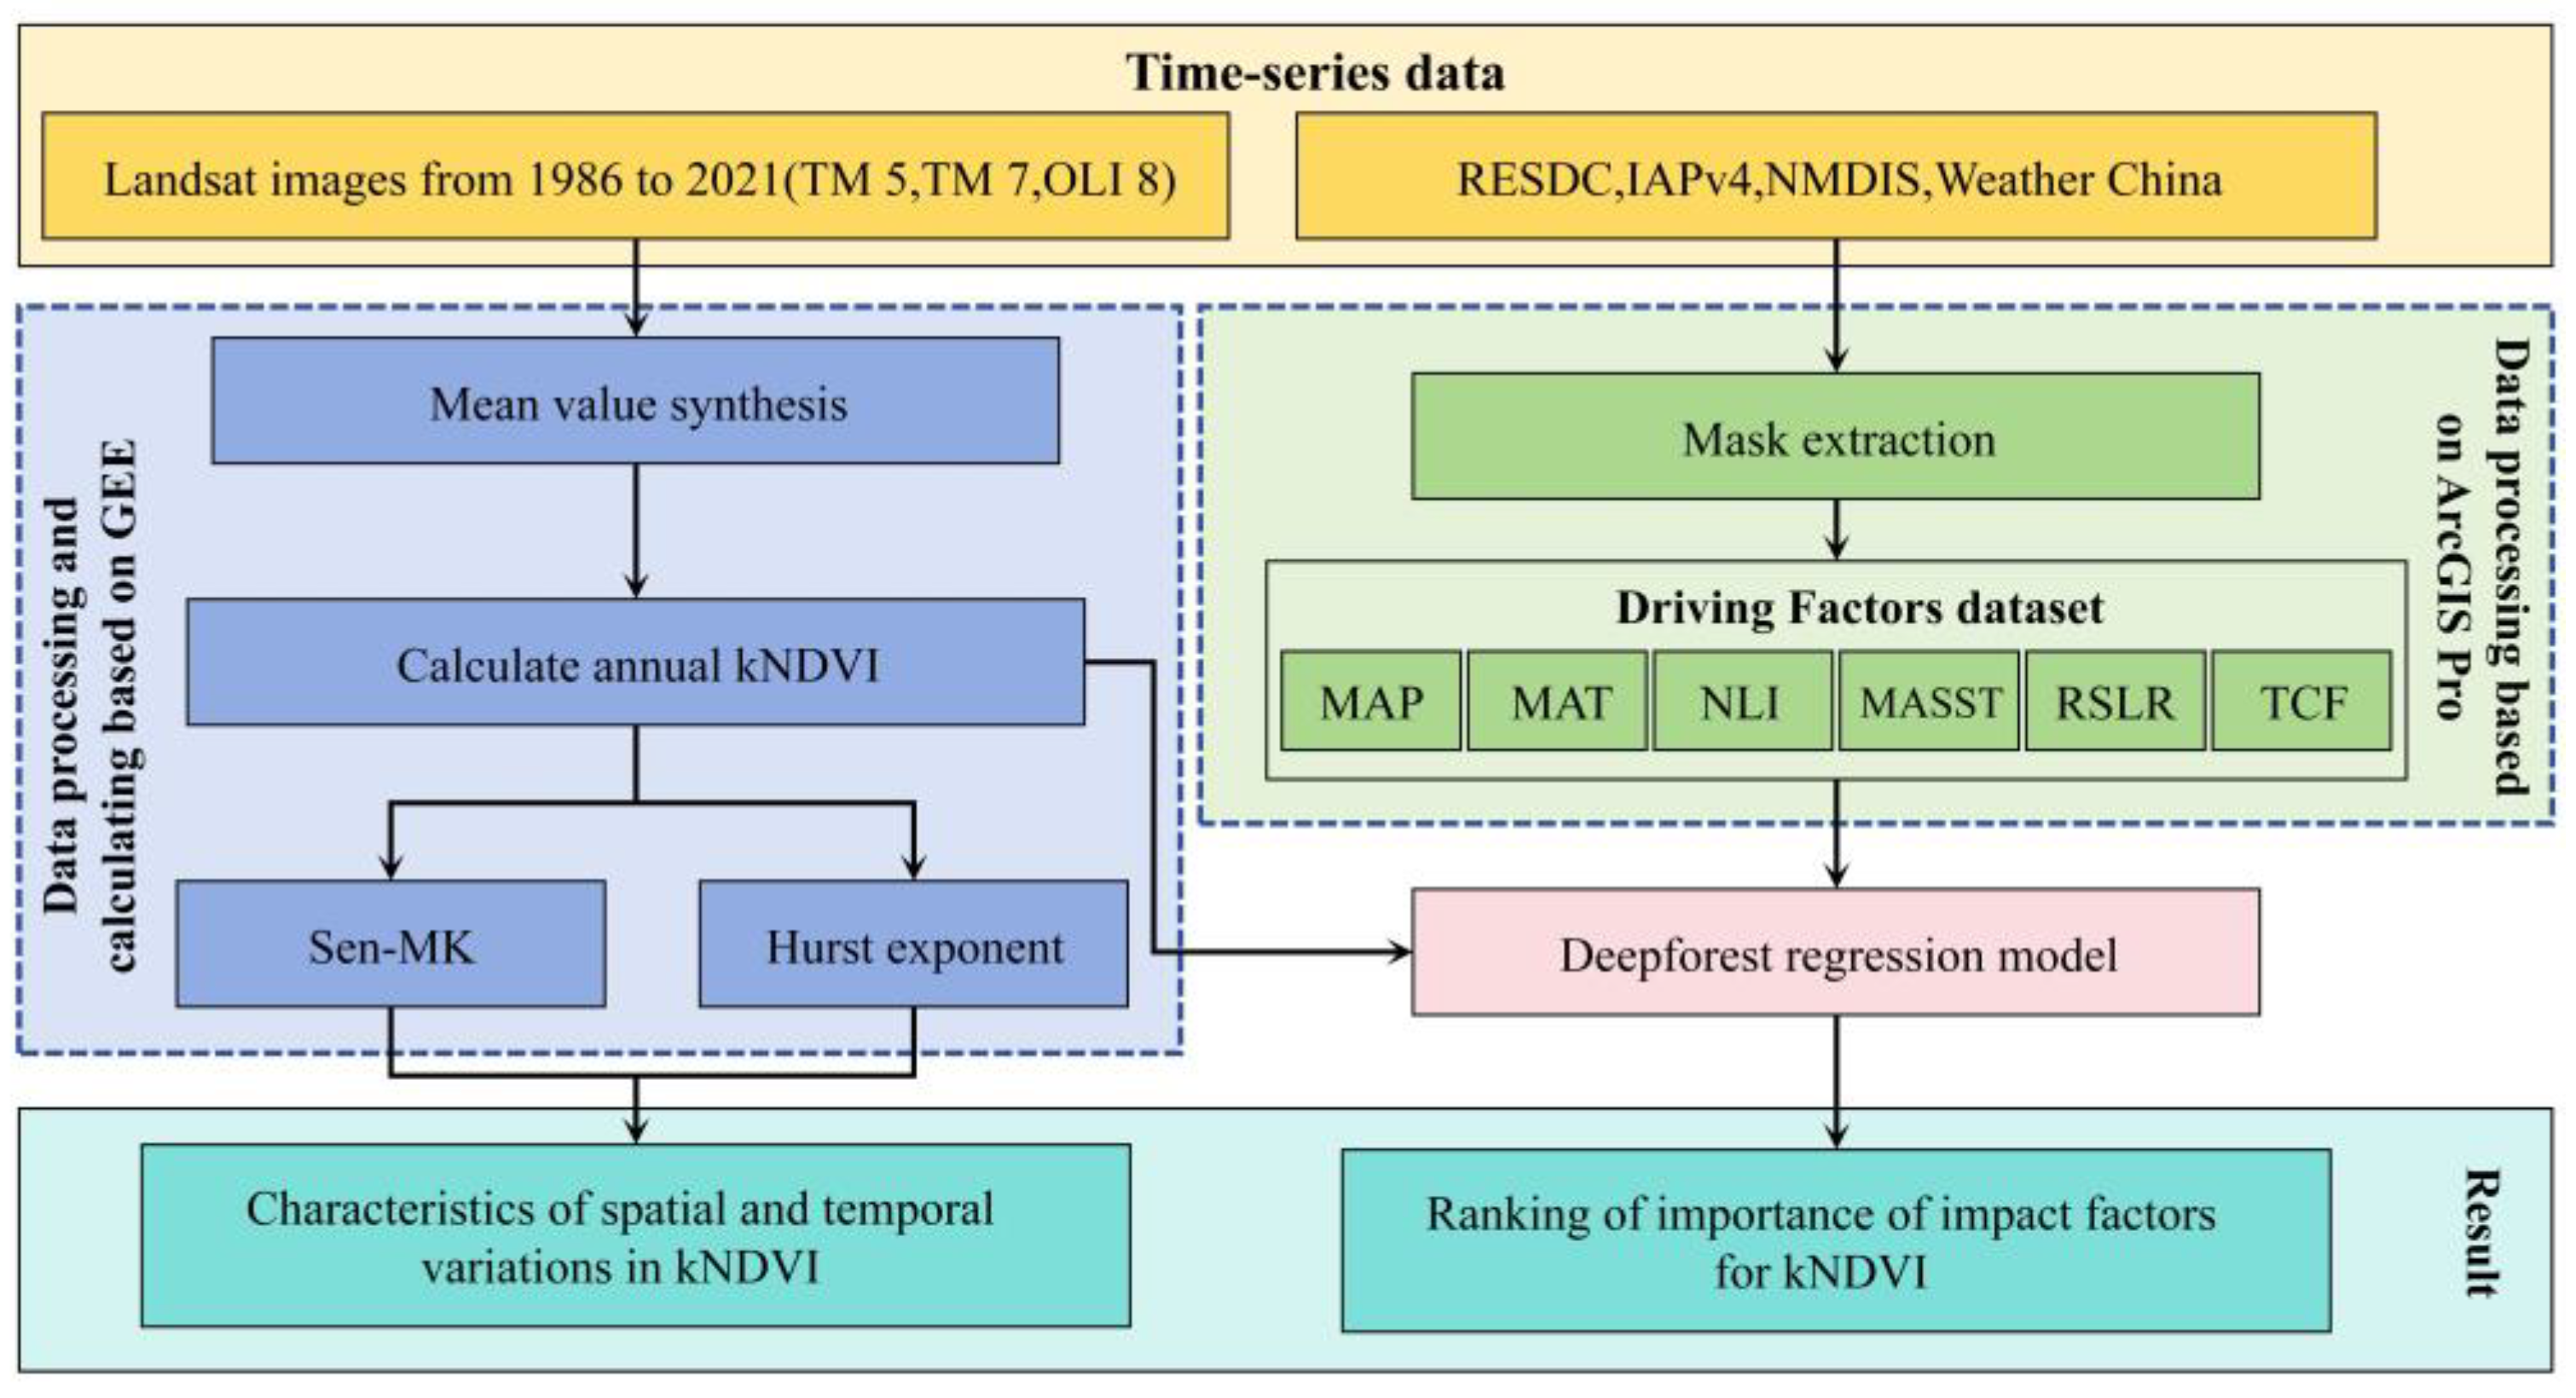
2.2. Data Source and Preprocessing

2.2.1. Landsat Data Collection and Preprocessing

To capture the interannual dynamics of mangrove ecosystems, we used Landsat data (5 TM, 7 ETM+, 8 OLI) from 1986 to 2021, offering long-term Earth observations at 15–30 m spatial and 16–18 day temporal resolutions [14]. A total of 25 WRS-2 tiles covering the study area were acquired via the Google Earth Engine (GEE) platform (https://earthengine.google.org/, accessed on 15 January 2025) (Figure 1). All images underwent Level-1 Terrain Correction (L1T), providing orthorectified TOA reflectance with consistent geometry and radiometry, eliminating the need for further correction (Table 1). Cloud and shadow pixels were masked using QA bands with per-pixel reliability flags, ensuring continuity even in partially cloudy scenes [26]. This filtering produced 12,976 high-quality images without discarding scenes based on fixed cloud thresholds (Figure 1). Annual mean composites at 30 m resolution were then created using a pixel-wise mean, enhancing temporal consistency and reducing noise for later spatiotemporal analysis [27].

2.2.2. Driving Factor Dataset

To investigate the temporal dynamics of mangrove growth and their environmental drivers, a set of key variables was selected based on ecological relevance, data availability, and sensitivity to long-term vegetation change. These include mean annual temperature (MAT), mean annual precipitation (MAP), mean annual sea surface temperature (MASST), rate of relative sea-level rise (RSLR), nighttime light index (NLI), and tropical cyclone frequency (TCF) (Table 2). Together, these variables represent the combined influences of climate conditions, marine processes, anthropogenic disturbance, and extreme weather events, providing a comprehensive basis for analyzing the interannual variation in mangrove kNDVI.
(1)
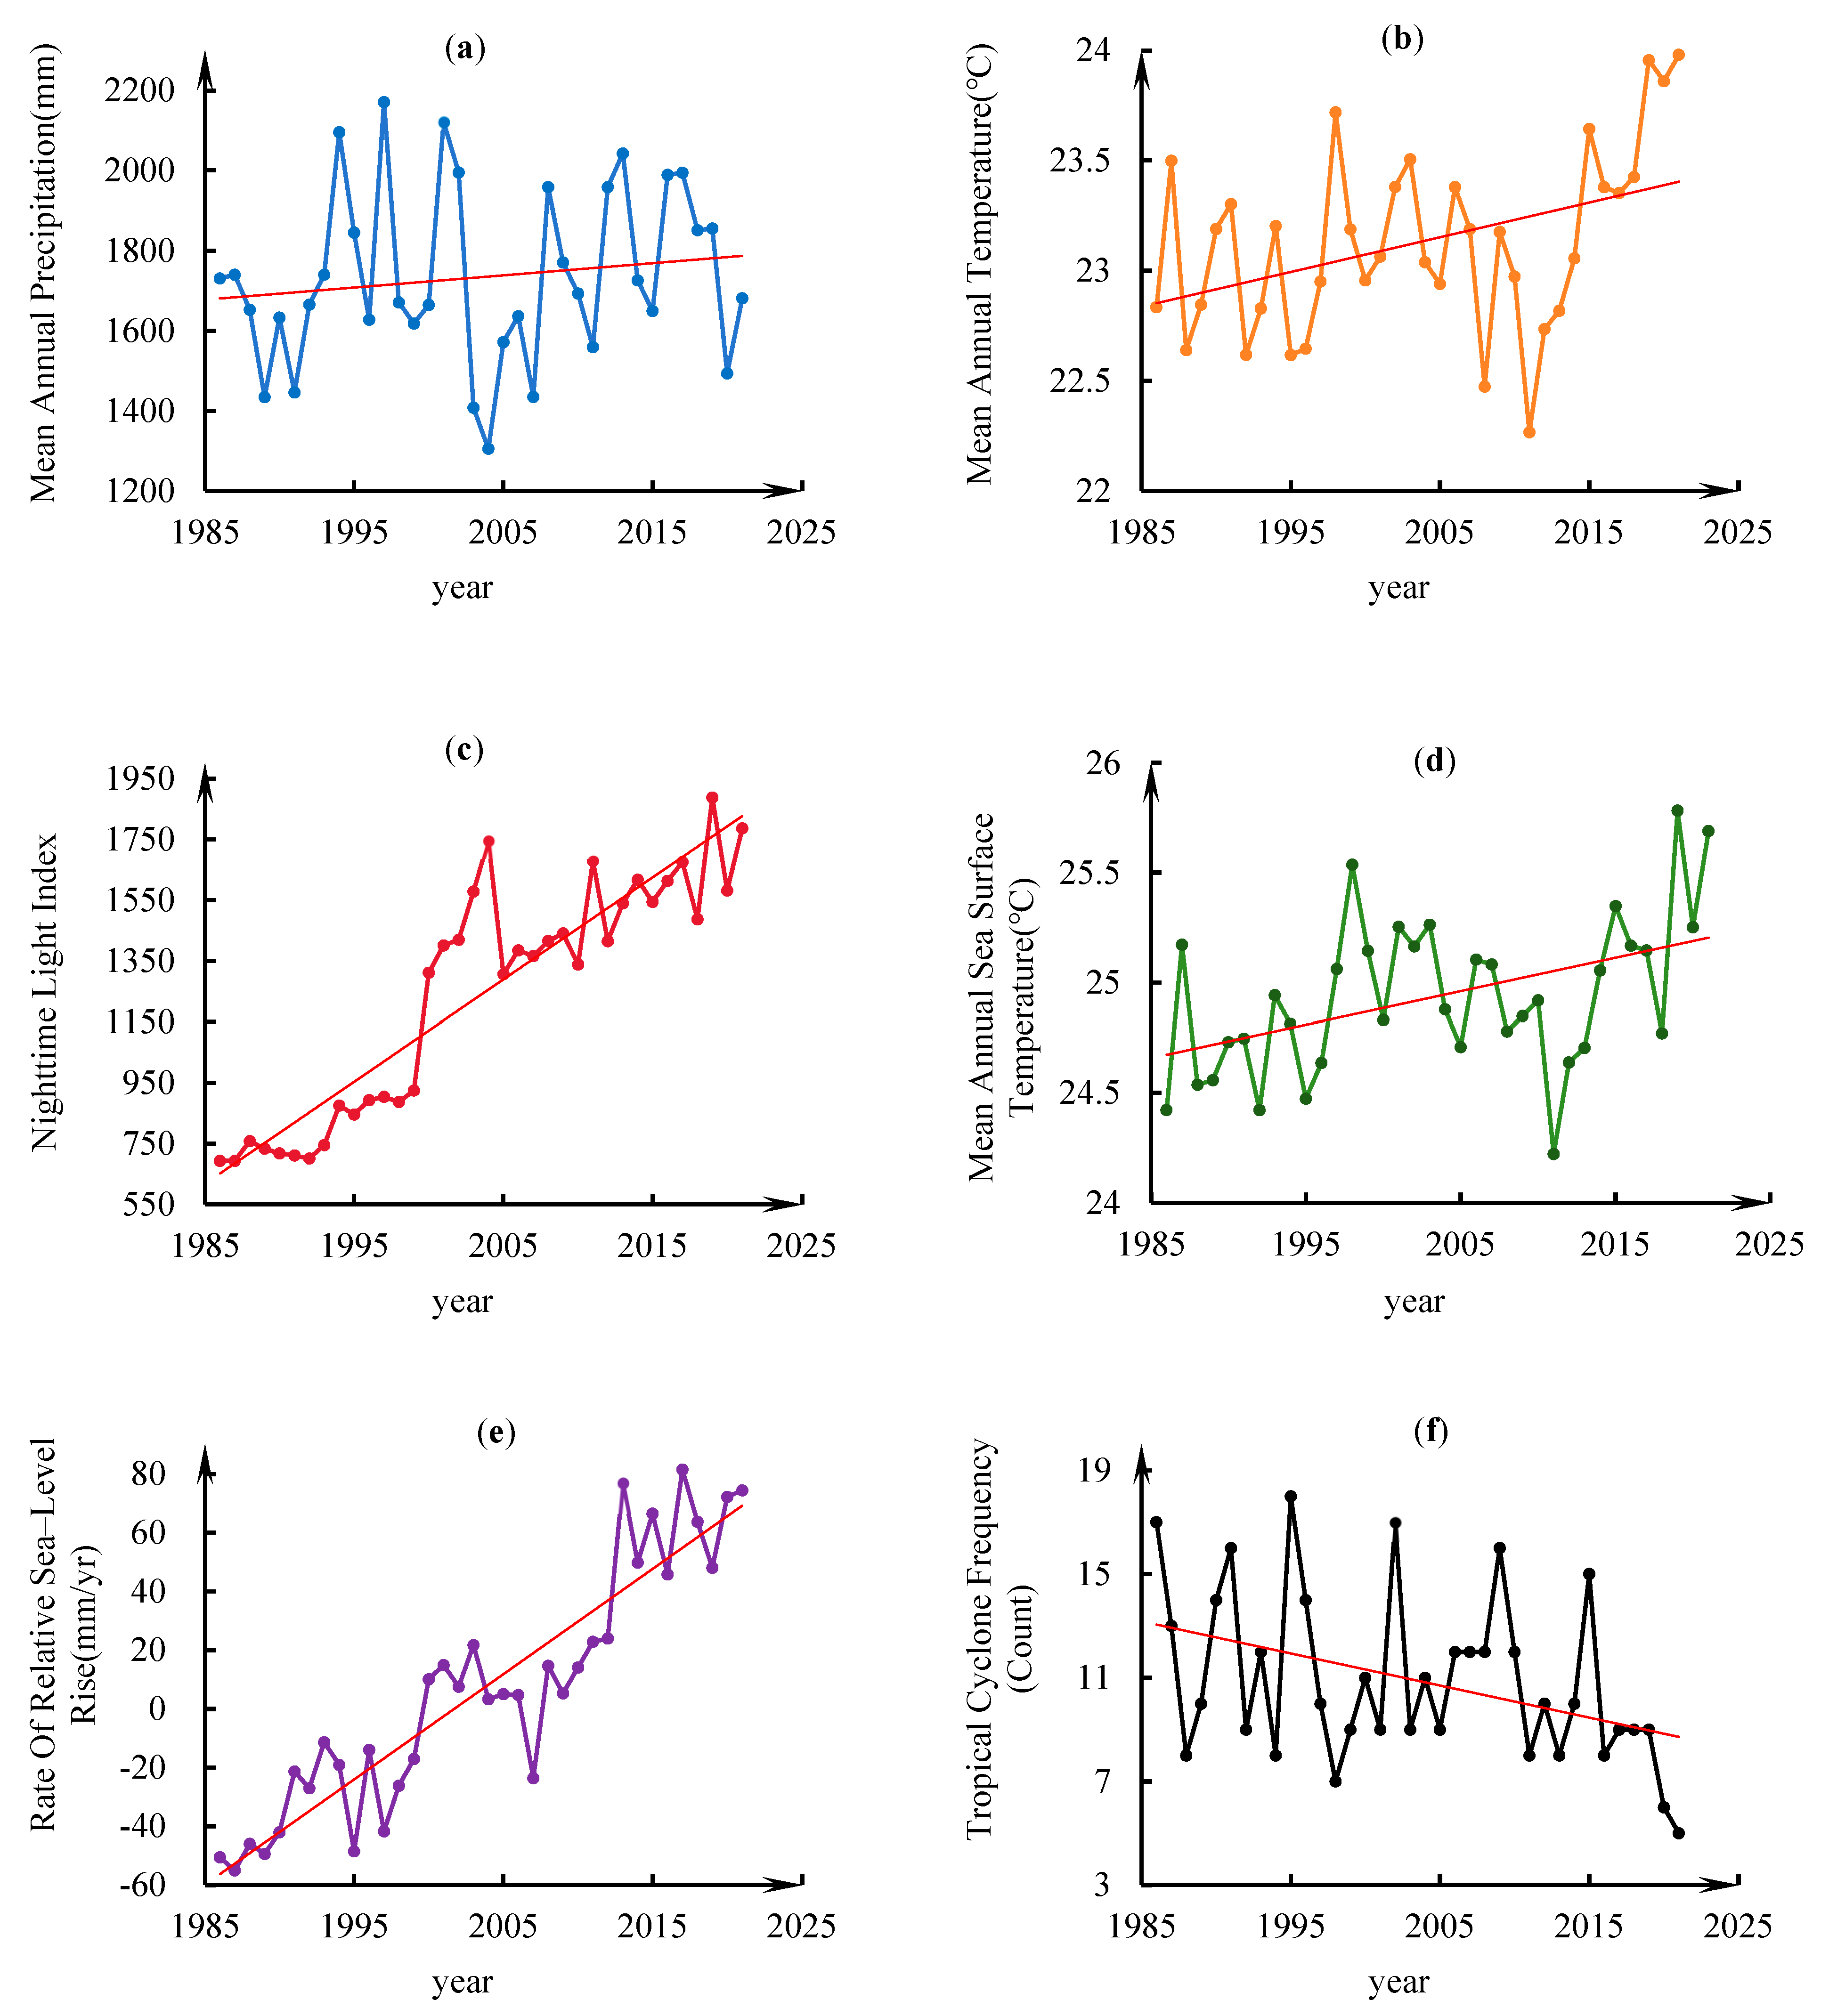
Climatic parameters: Mean annual precipitation (MAP) and mean annual temperature (MAT), gridded datasets at 1 km spatial resolution, were acquired from the Resource and Environment Science and Data Center (RESDC). MAP was selected for its critical role in regulating freshwater input and soil salinity gradients, which directly influence mangrove water balance and salt stress responses. MAT serves as a key thermodynamic control on mangrove photosynthesis efficiency and species distribution thresholds.
(2)
Anthropogenic activity proxy: The nighttime light index (NLI), a 1 km resolution raster covering a continuous inland belt extending 50 km from the coastline, was obtained from RESDC to quantify human settlement intensity. This variable was prioritized as it effectively captures coastal urbanization patterns and land-use changes that induce habitat fragmentation and pollution pressures on mangrove ecosystems.
(3)
Marine environmental drivers: Mean annual sea surface temperature (MASST), derived from the 1°-gridded Global Ocean Temperature and Heat Content Dataset (IAPv4) via the Ocean and Climate Team portal (http://www.ocean.iap.ac.cn, accessed on 18 February 2025), was incorporated as a critical thermal constraint on mangrove growth, aligning with established drivers in coastal biogeographic studies in which sea-level proximity governs thermal exposure. The rate of relative sea-level rise (RSLR), with annual mean values for coastal waters adjacent to the study area, was extracted from the National Marine Data and Information Service (NMDIS; https://mds.nmdis.org.cn, accessed on 18 February 2025), as it governs tidal inundation regimes and sediment dynamics critical for mangrove establishment [30]. The frequency of tropical cyclones (TCF) was determined based on event counts from 1986 to 2021, as reported by the China Meteorological Administration (https://weather.com.cn, accessed on 18 February 2025). This approach was employed to account for extreme climatic disturbances, which have the potential to cause mechanical damage and salinity fluctuations.
All variables were temporally averaged across the 1986–2021 period to mitigate interannual variability (Figure 3). Spatial preprocessing was conducted in ArcGIS 10.8, including coordinate system conversion to the WGS-1984 UTM projection, resampling to a unified 1 km grid using bilinear interpolation, and masking to the study area boundaries.

2.3. Calculation of kNDVI

The kNDVI represents an advanced vegetation metric derived from the conventional NDVI through machine learning-based kernel method theory [17]. This innovative approach involves mapping spectral channels to a high-dimensional feature space, thereby redefining NDVI through nonlinear transformations. The mathematical formulation of kNDVI is expressed as follows:
k N D V I = k ( n , n ) k ( n , r ) k ( n , n ) + k ( n , r )
where n and r denote the reflectance values of the near-infrared (NIR) and red bands, respectively. The kernel function k (⋅) quantifies the similarity between these spectral channels. In accordance with the established methodologies, a radial basis function (RBF) kernel was implemented for the purpose of constructing the feature space.
k ( a , b ) = exp ( ( a b ) 2 / ( 2 σ 2 ) )
Here, the scale parameter σ governs the distance metric between NIR and red band characteristics. By optimizing σ as the mean spectral distance between the NIR and red bands, the equation simplifies to
k N D V I = 1 k ( n , r ) 1 + k ( n , r ) = tanh ( ( n r 2 σ ) 2 )
k N D V I = tanh ( N D V I 2 )
This RBF kernel implementation enables pixel-wise adaptive enhancement of kNDVI while incorporating higher-order spectral relationships [21]. Compared to traditional vegetation indices, kNDVI demonstrates superior robustness against three critical limitations: (1) data saturation in dense vegetation canopies, (2) phenological cycle distortions resulting from seasonal variations, and (3) spectral mixing artifacts in heterogeneous landscapes [17,21].

2.4. Trend Analysis Method

2.4.1. Mann–Kendall Test and Sen’s Slope Estimator Model

Sen + Mann–Kendall analysis was employed to examine the dynamic trends of mangrove forest annual mean kNDVI for each pixel over the study period [31,32]. Benefiting from not requiring the sample to follow a normal distribution, the Sen + Mann–Kendall method is a nonparametric statistical technique with high tolerance for outliers and missing values.

2.4.2. Hurst Exponent

The Hurst exponent (H) is a statistical measure used to assess the degree of long-term memory in time-series data and is, therefore, particularly suitable for analyzing the temporal persistence of ecological variables such as kNDVI [33]. The Hurst exponent was calculated using the rescaled range analysis method (R/S analysis). The Hurst exponent was calculated for each pixel of the study area, thereby generating a spatial map of H values to identify regions with distinct temporal behaviors [34,35]. The value of the Hurst exponent ranges from 0 to 1. When H = 0.5, it indicates that the temporal change in kNDVI is random; when H > 0.5, it is indicative of persistent temporal change in kNDVI, signifying that its trend is likely to persist in the future as it was during the study period; and when H < 0.5, it indicates anti–persistence, meaning the trend of kNDVI change is likely to reverse in the future compared to the study period.

2.5. Detection of Variable Importance Using the Deep Forest Algorithm

The Deep Forest (DF) algorithm, developed by Zhou and Feng [23], offers a robust approach for variable importance detection in environmental remote sensing [36]. This ensemble learning technique integrates multiple layers of decision trees, specifically utilizing Cascade Forest and Multi–Grained Scanning (MGS).
The Cascade Forest comprises layers of parallel forests, with each layer consisting of base estimators that employ algorithms such as random forest (RF) and extremely randomized trees (ERT). This layered architecture facilitates comprehensive analysis of variable interactions and nuanced feature transformation, distinguishing DeepForest from traditional methods (e.g., decision tree-based algorithms and support vector machines) that predominantly rely on original feature representations. Consequently, DeepForest not only exhibits superior predictive performance but also more effectively captures complex nonlinear relationships, thereby enhancing the accuracy of research outcomes [23,36]. Unlike many deep learning models, DF does not require extensive hyperparameter tuning, making it particularly suitable for remote sensing tasks in which labeled data may be limited [23,36].
In the context of variable importance detection, the DF algorithm excels because of its ensemble structure, which allows the generation of class vectors at each layer. This facilitates the identification of significant influencing factors by assessing the relative importance of the input features [23]. The implementation of the DF algorithm for the assessment of variable importance typically involves the utilization of the “CascadeForestRegressor” command from the “deepforest” package in Python 3.9. This approach allows for the effective fitting of the Deep Forest model to datasets, enabling the extraction of insights regarding the importance of various variables.
To quantify driving factors of kNDVI variations in mangrove ecosystems, the Deep Forest algorithm was implemented via the CascadeForestRegressor module from Python’s deepforest package for variable importance assessment, enabling effective model fitting and feature importance extraction. For robust modeling, Bayesian Optimization fine-tuned hyperparameters within predefined ranges: estimators per cascade level (n_estimators: 2–10), trees per forest (n_trees: 50–150), and maximum cascade layers (max_layers: 10–20). The optimal configuration utilized LightGBM predictor (validated superior to “forest” type) with n_estimators = 5, n_trees = 118, max_layers = 11. Model training employed 90% dataset allocation, with the remaining 10% reserved for testing using coefficient of determination evaluation metrics, demonstrating stable predictive performance.

3. Results

Utilizing a continuous 30 m resolution annual kNDVI dataset spanning 1986–2021 (Appendix A), we systematically investigated the spatiotemporal dynamics of Chinese mangrove ecosystems through Theil–Sen slope estimation, Mann–Kendall trend analysis, and Hurst exponent modeling. Four representative mangrove regions—Gaoqiao, Tongming Bay, Zhenhai Bay, and the Zhangjiang Estuary (Figure 4)—were selected as case studies, characterized by extensive mangrove coverage and notable recovery under conservation efforts, and representative of typical mangrove ecosystems in China.

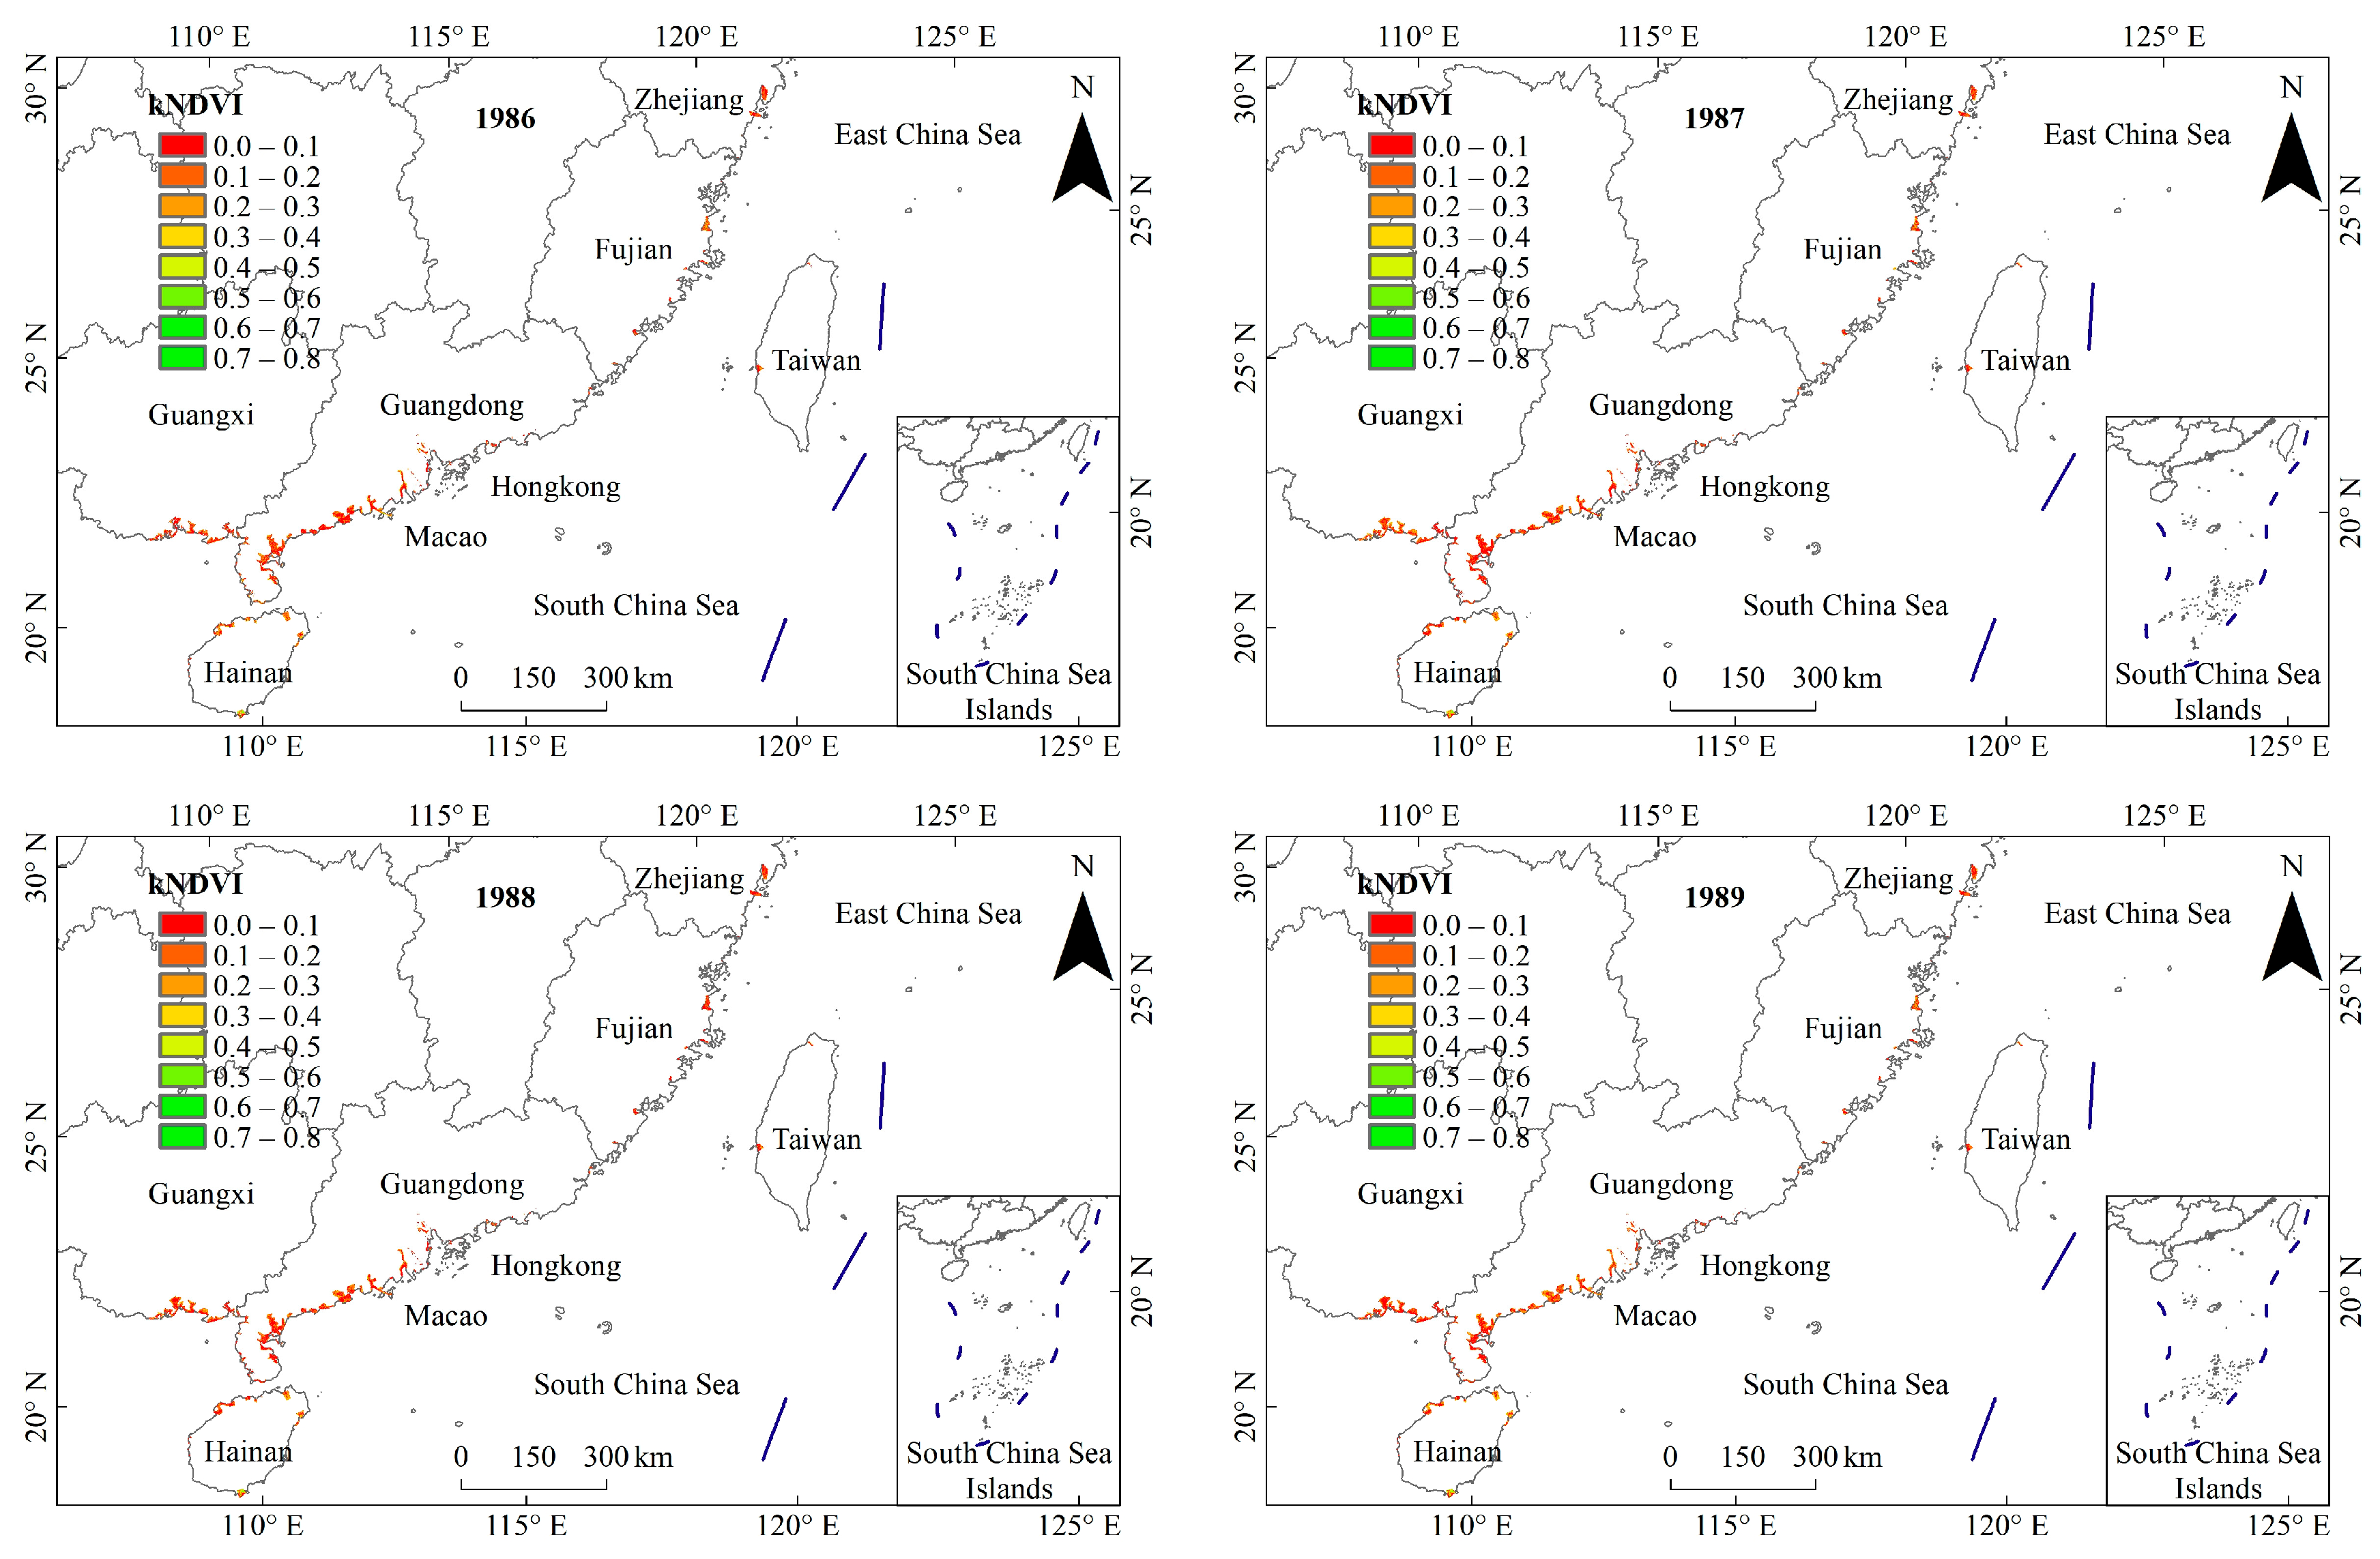
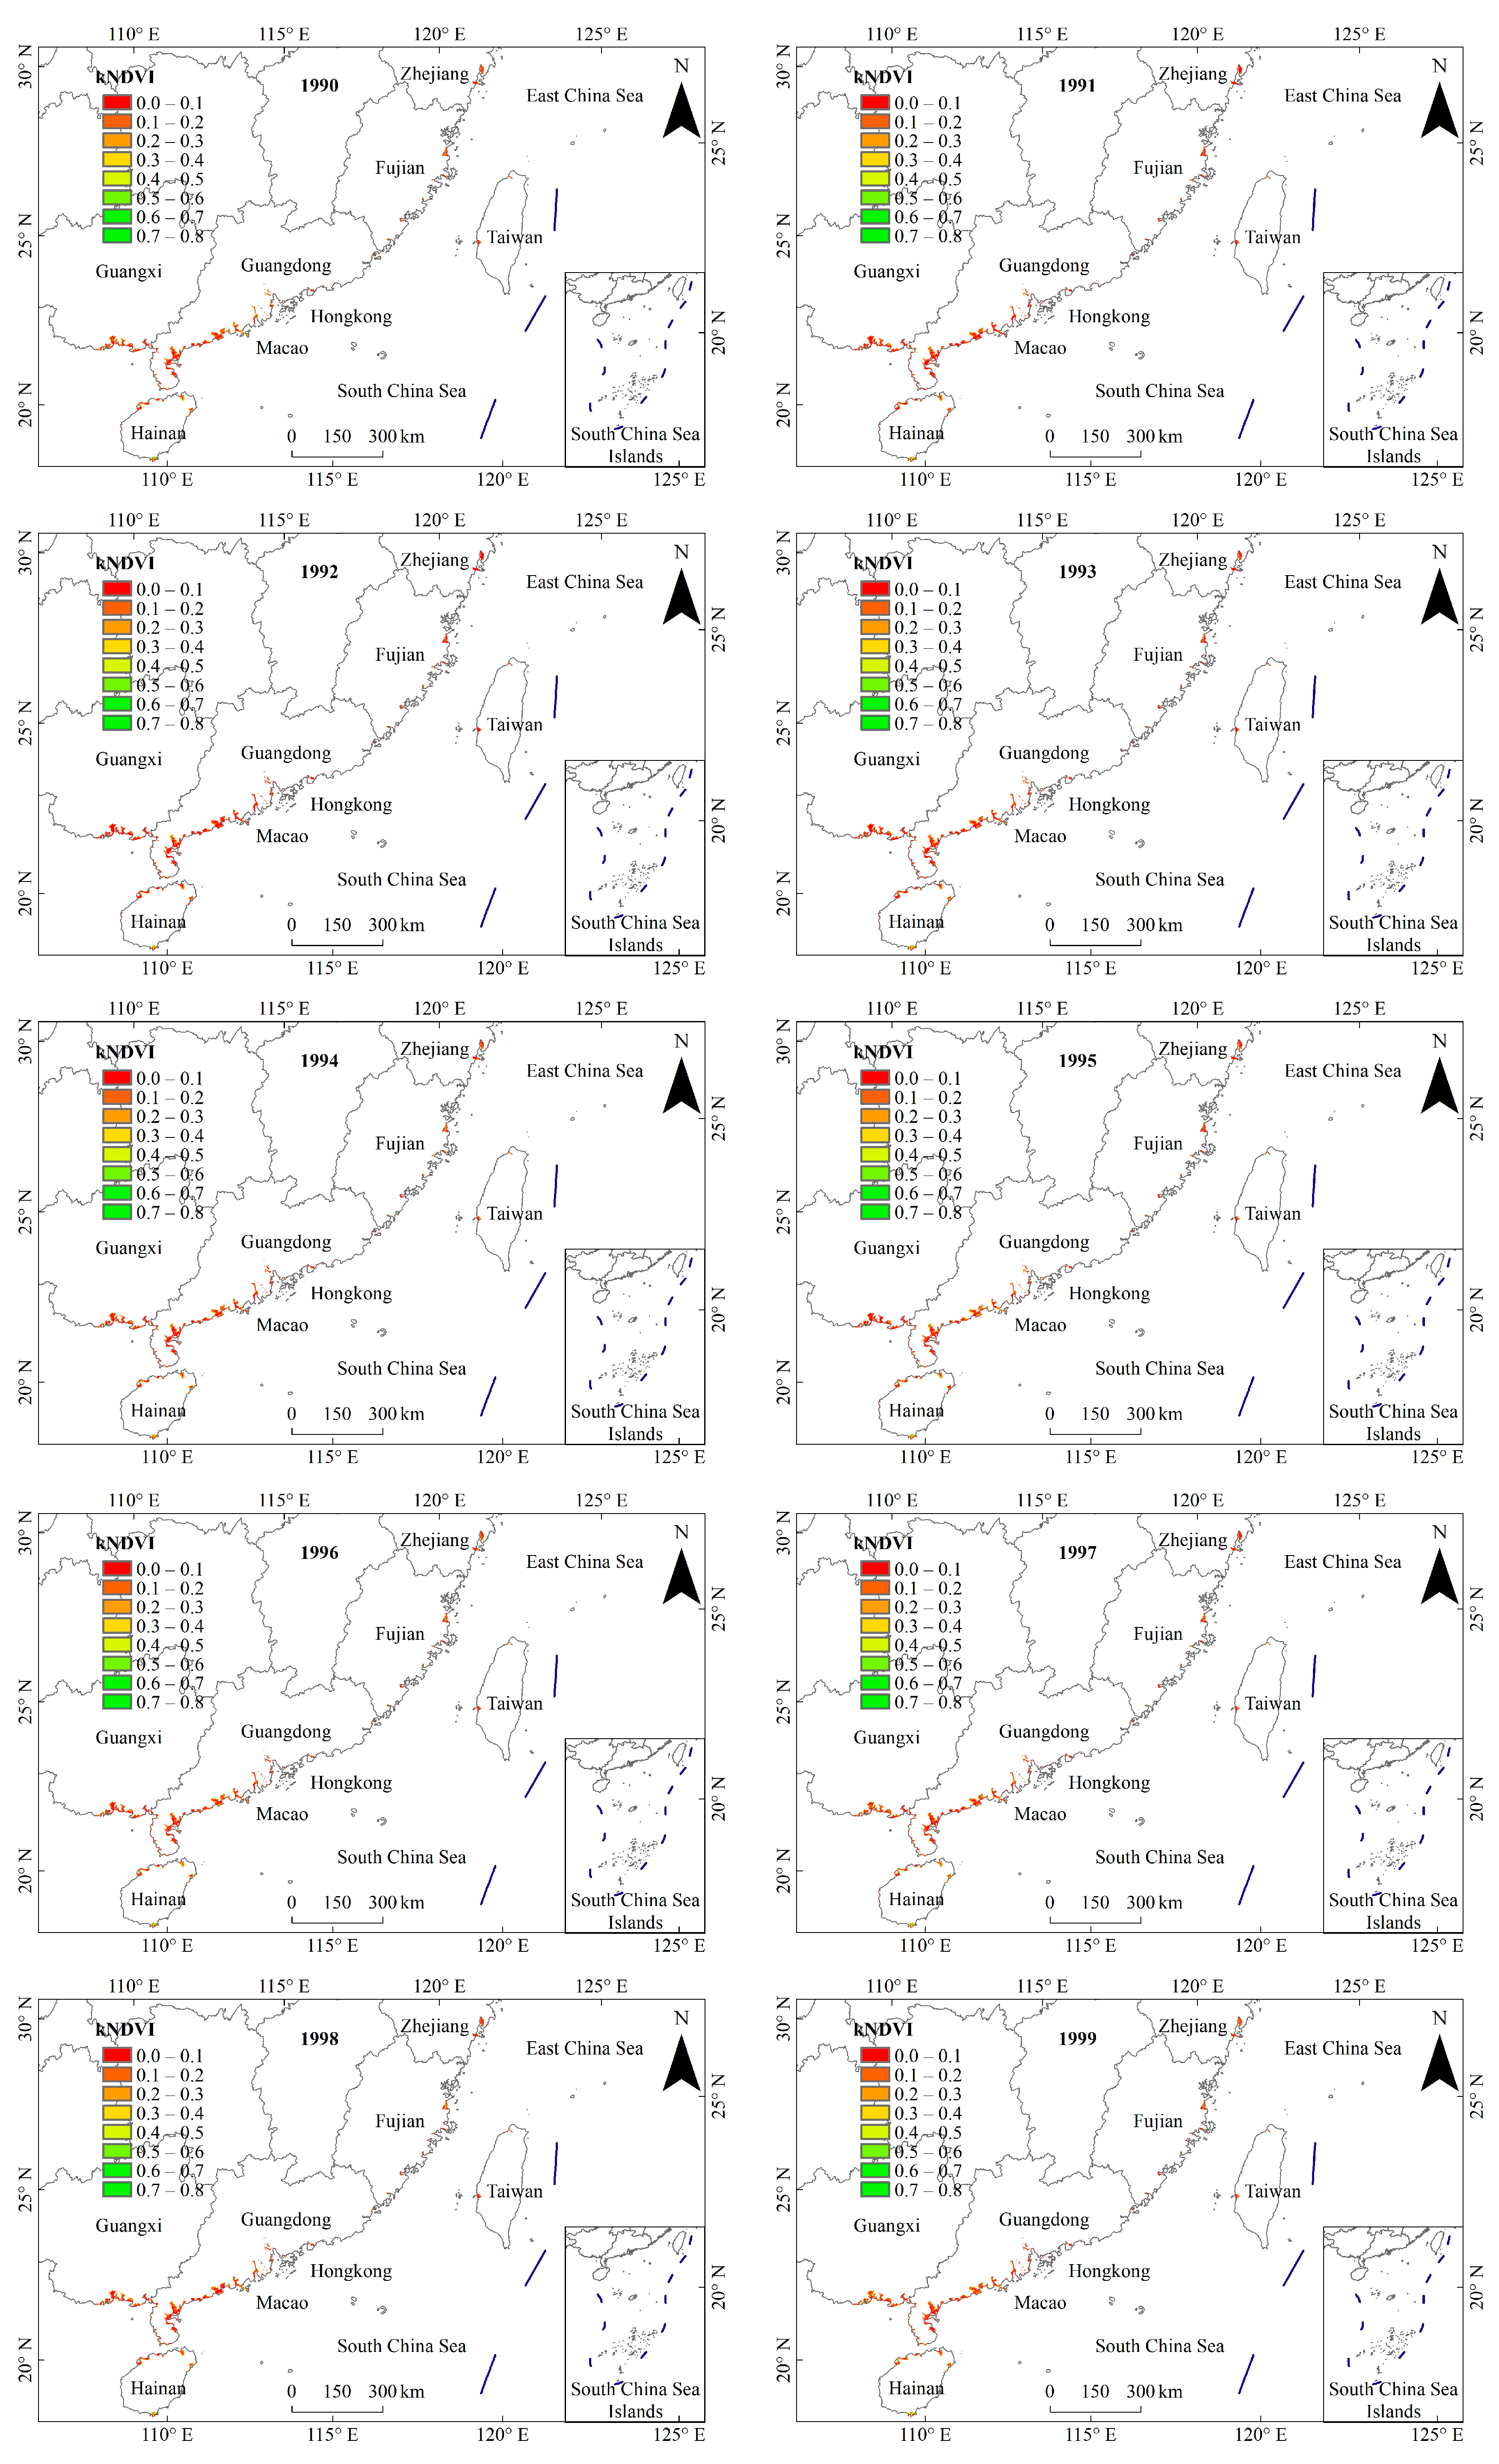
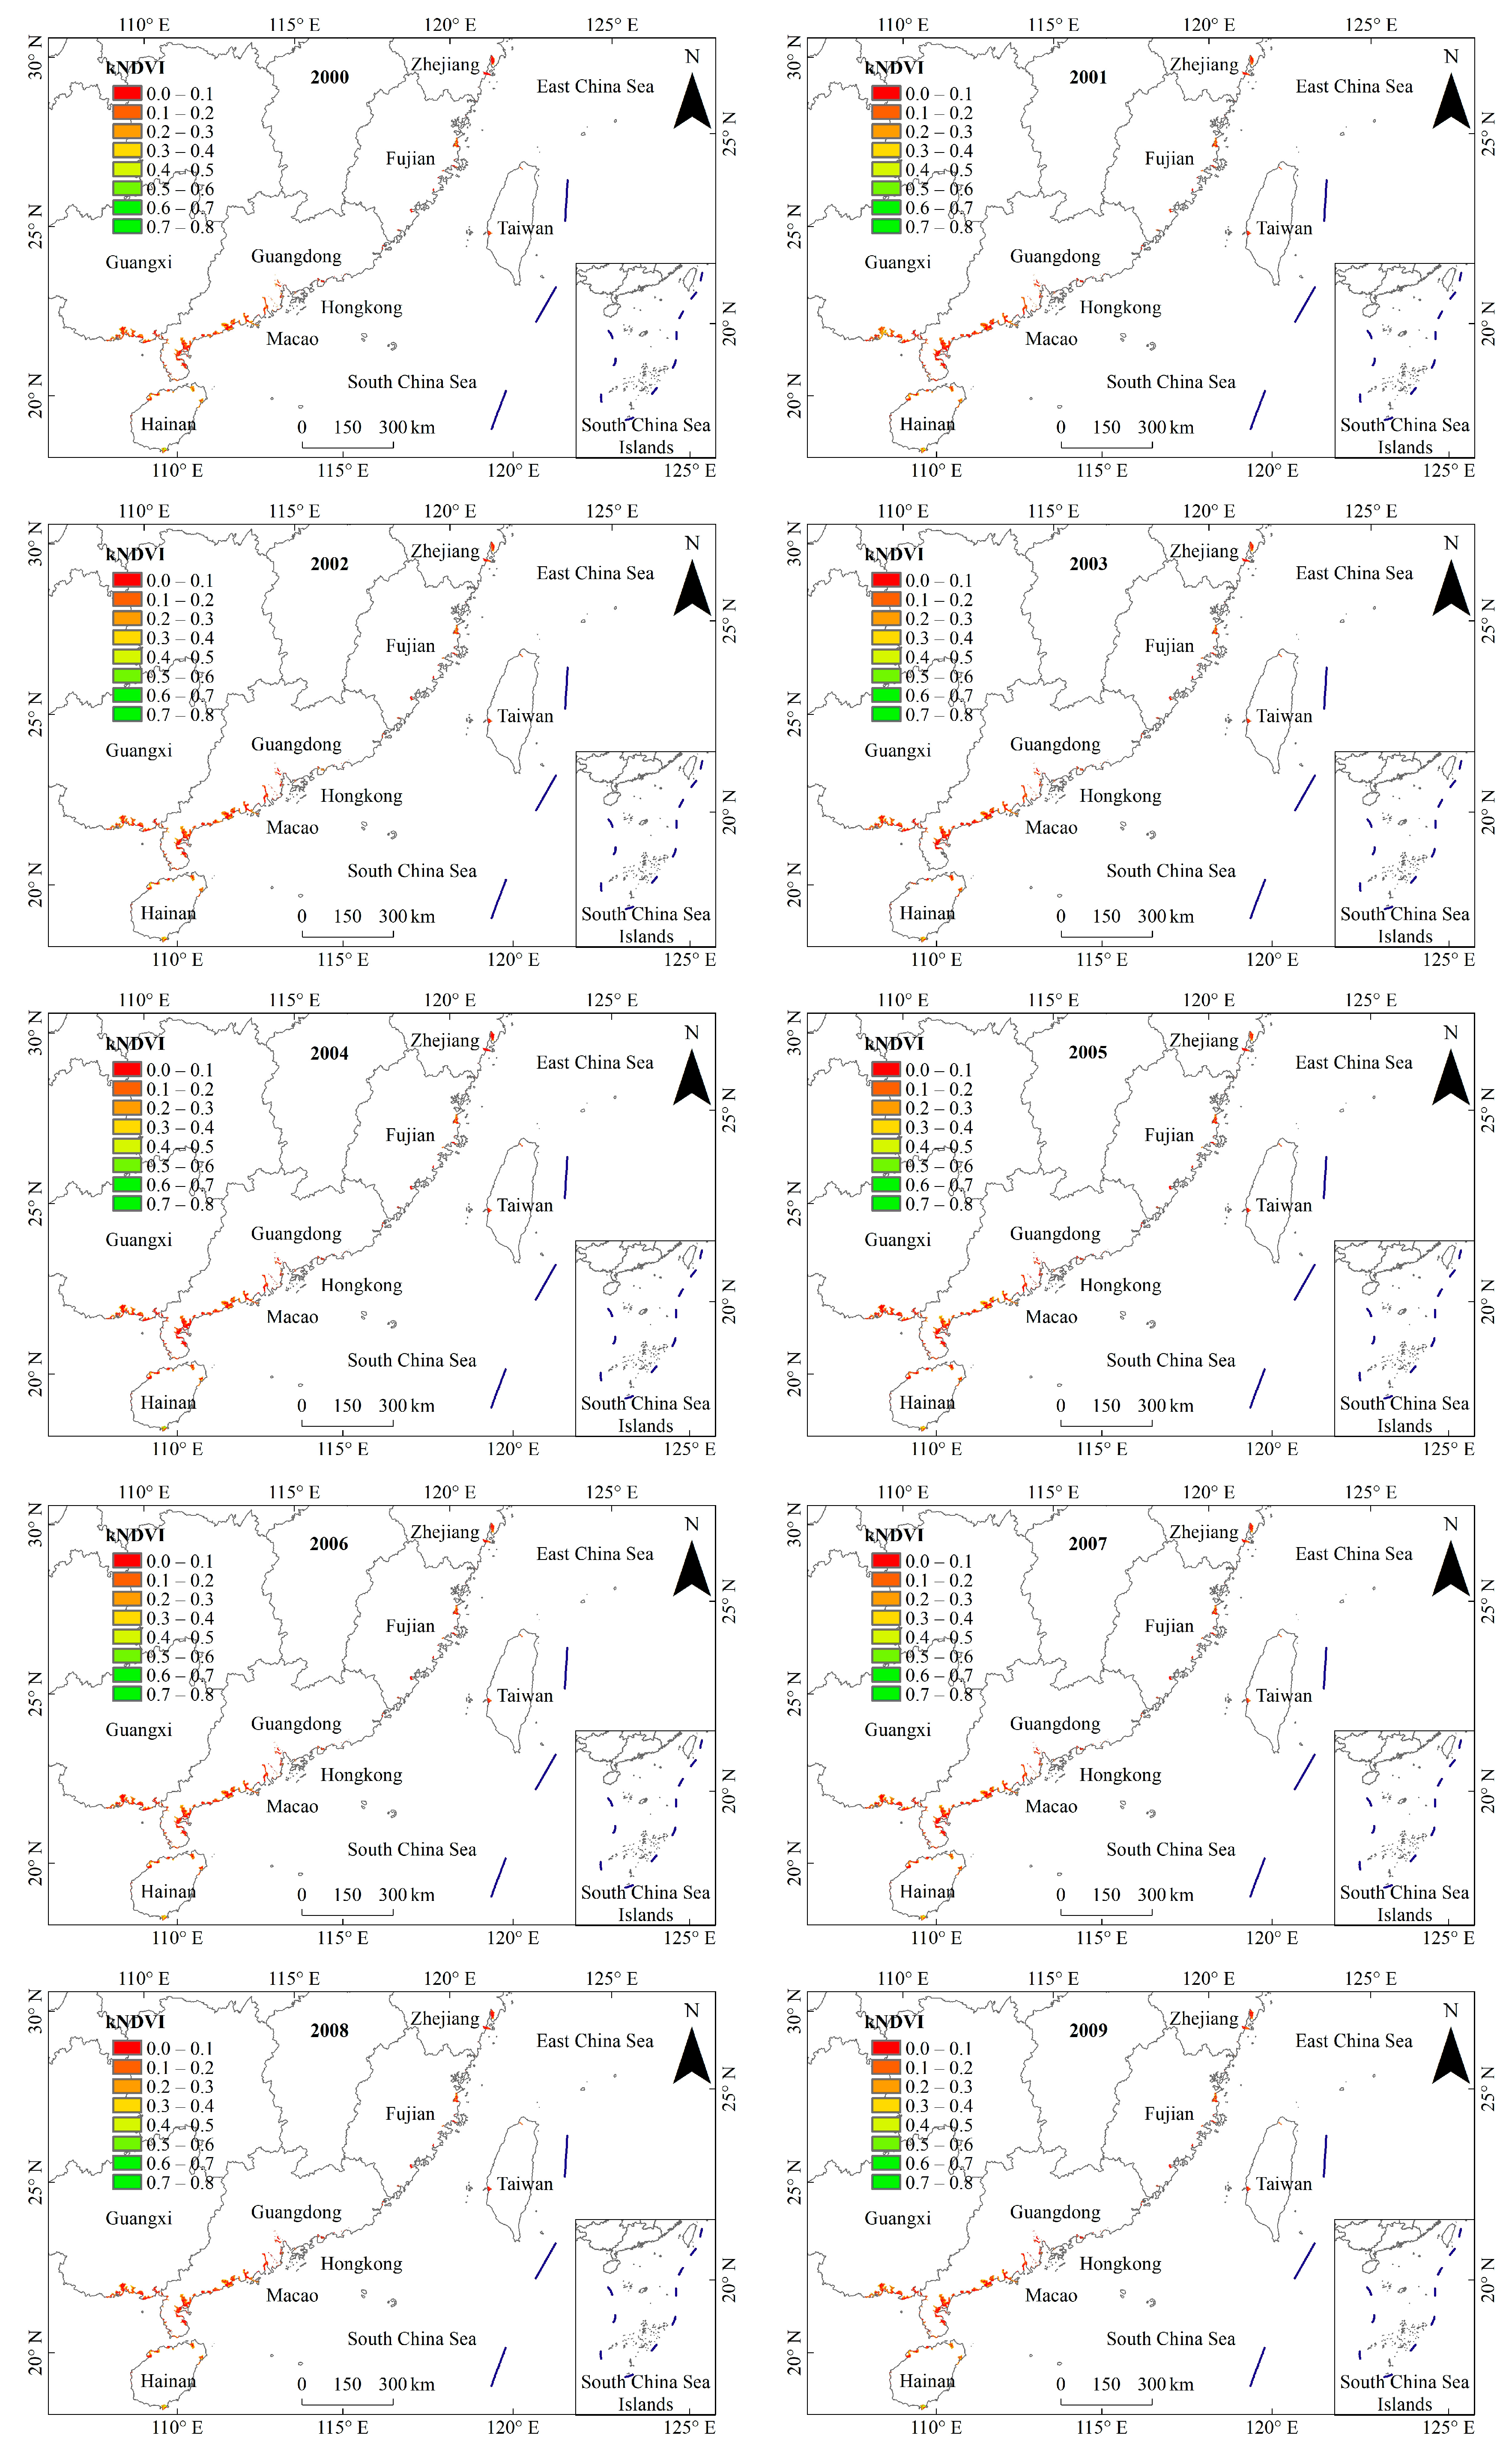
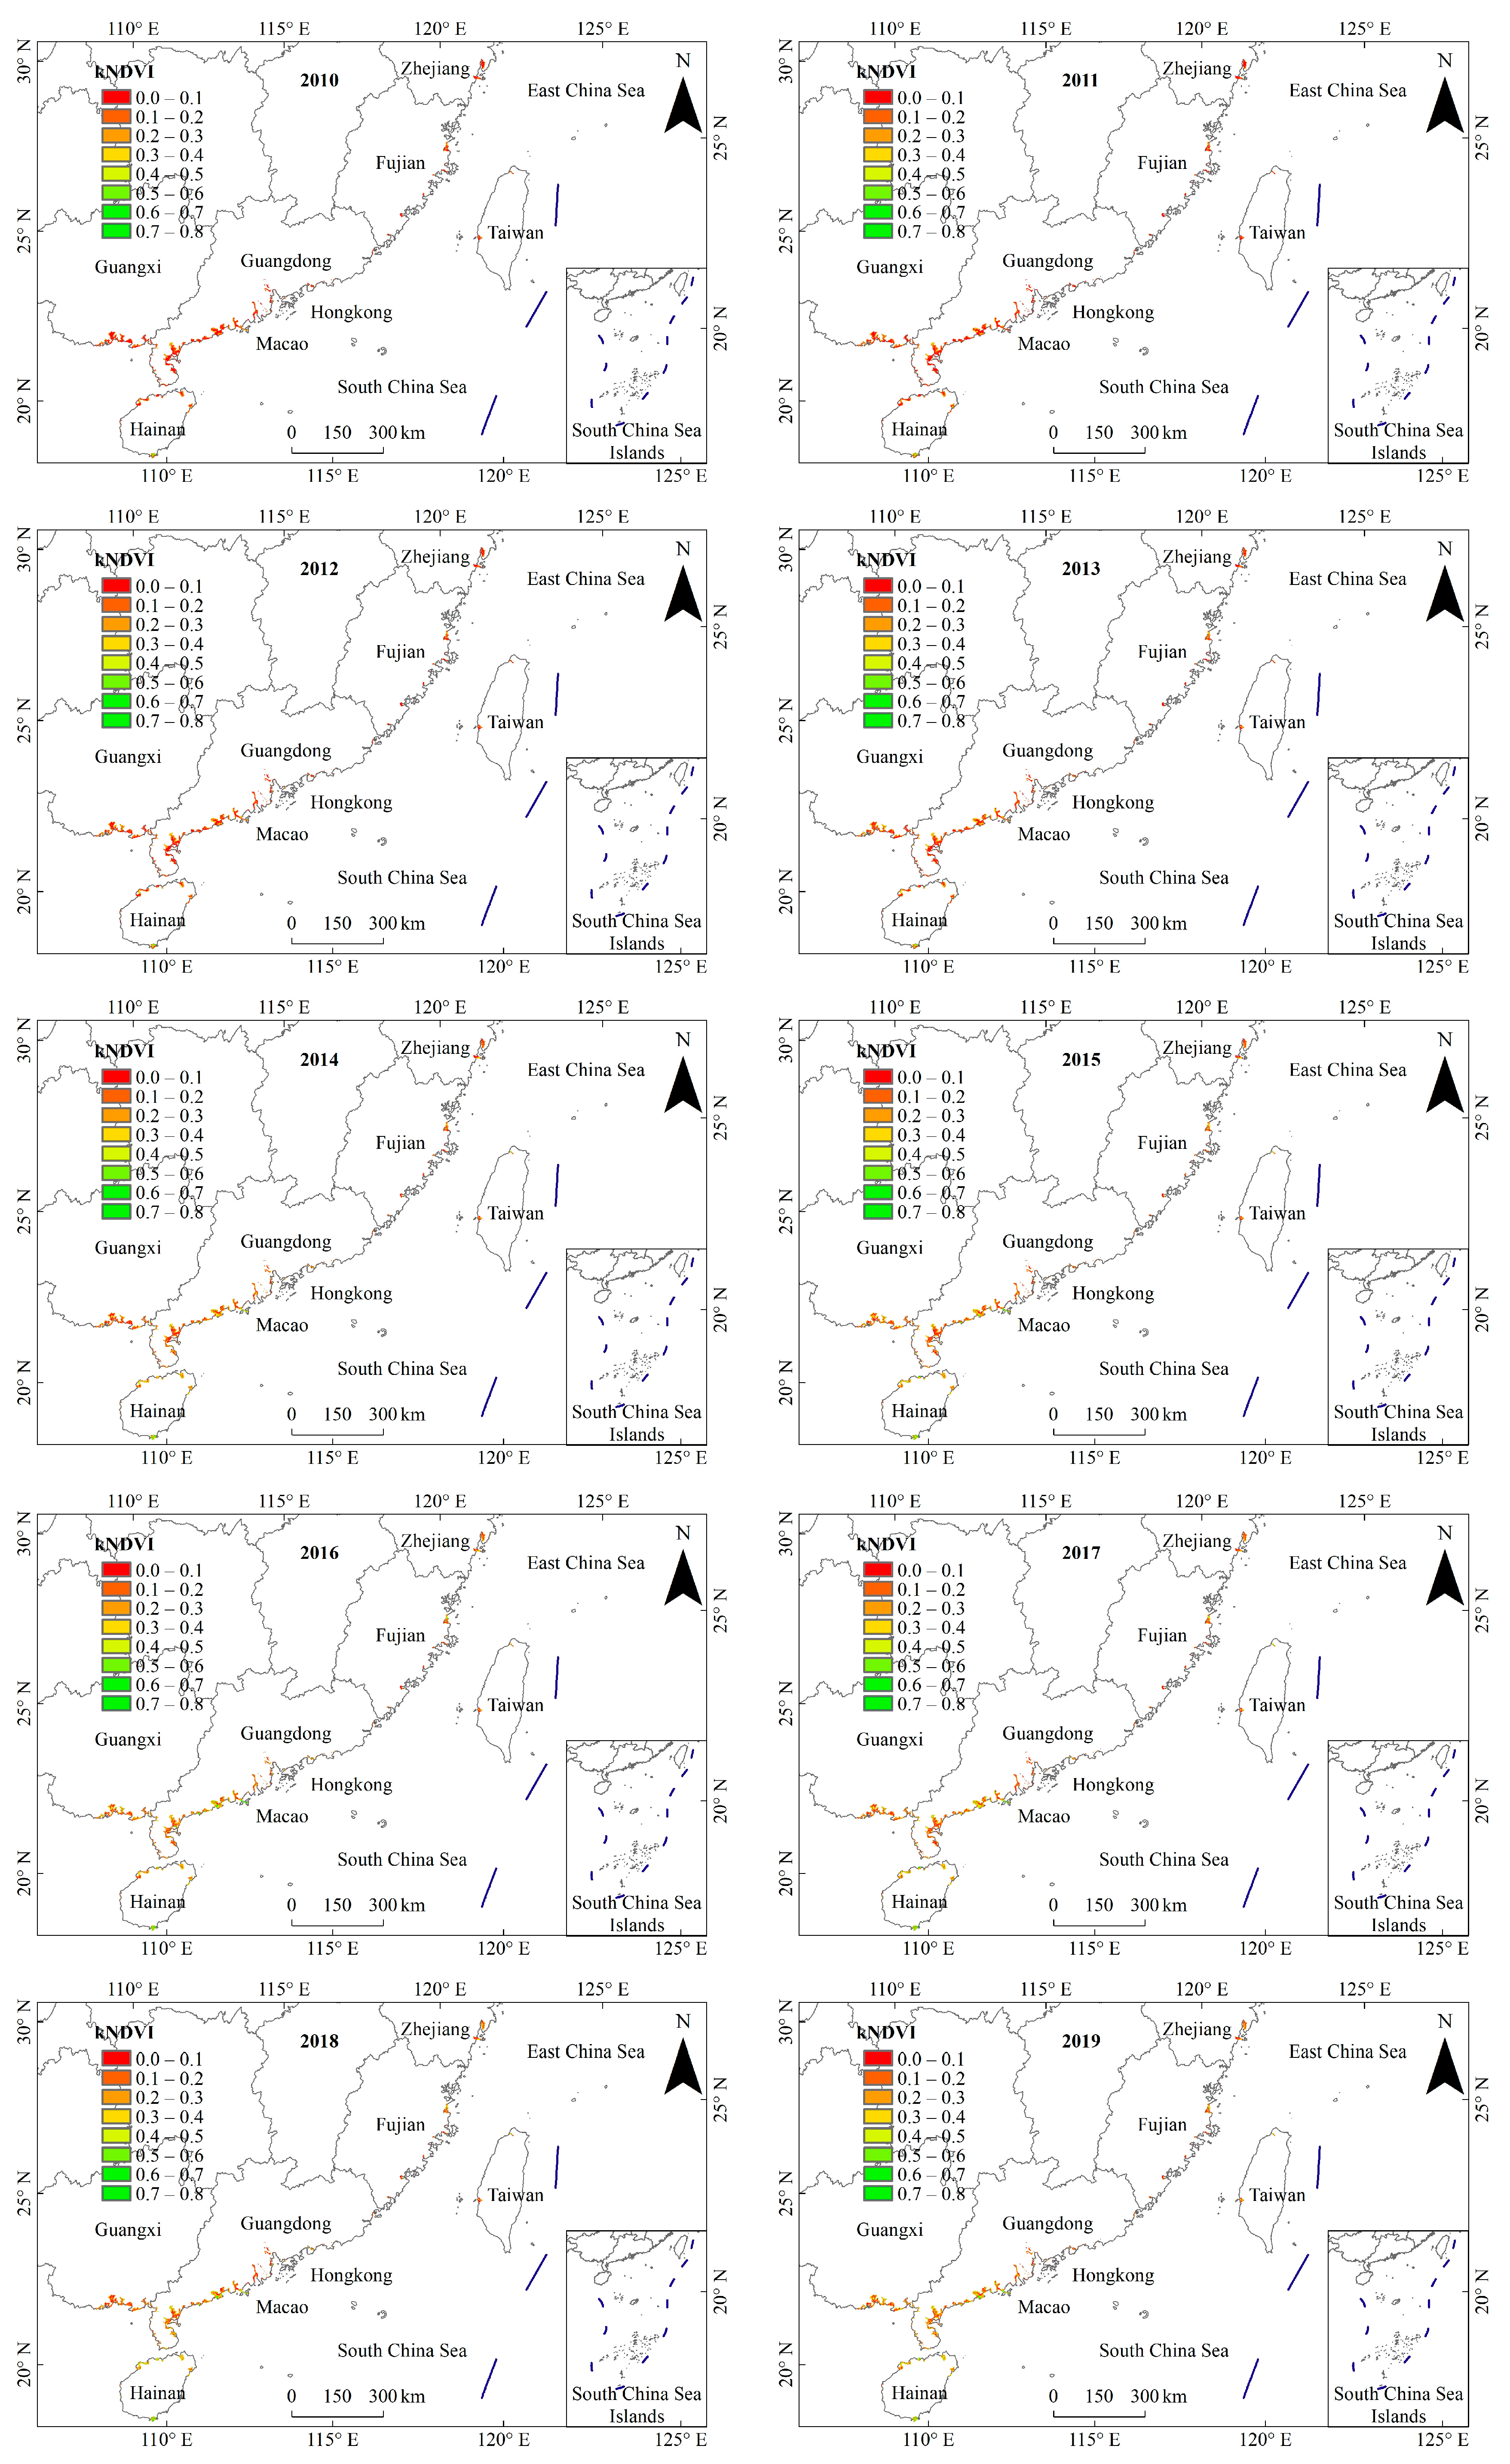
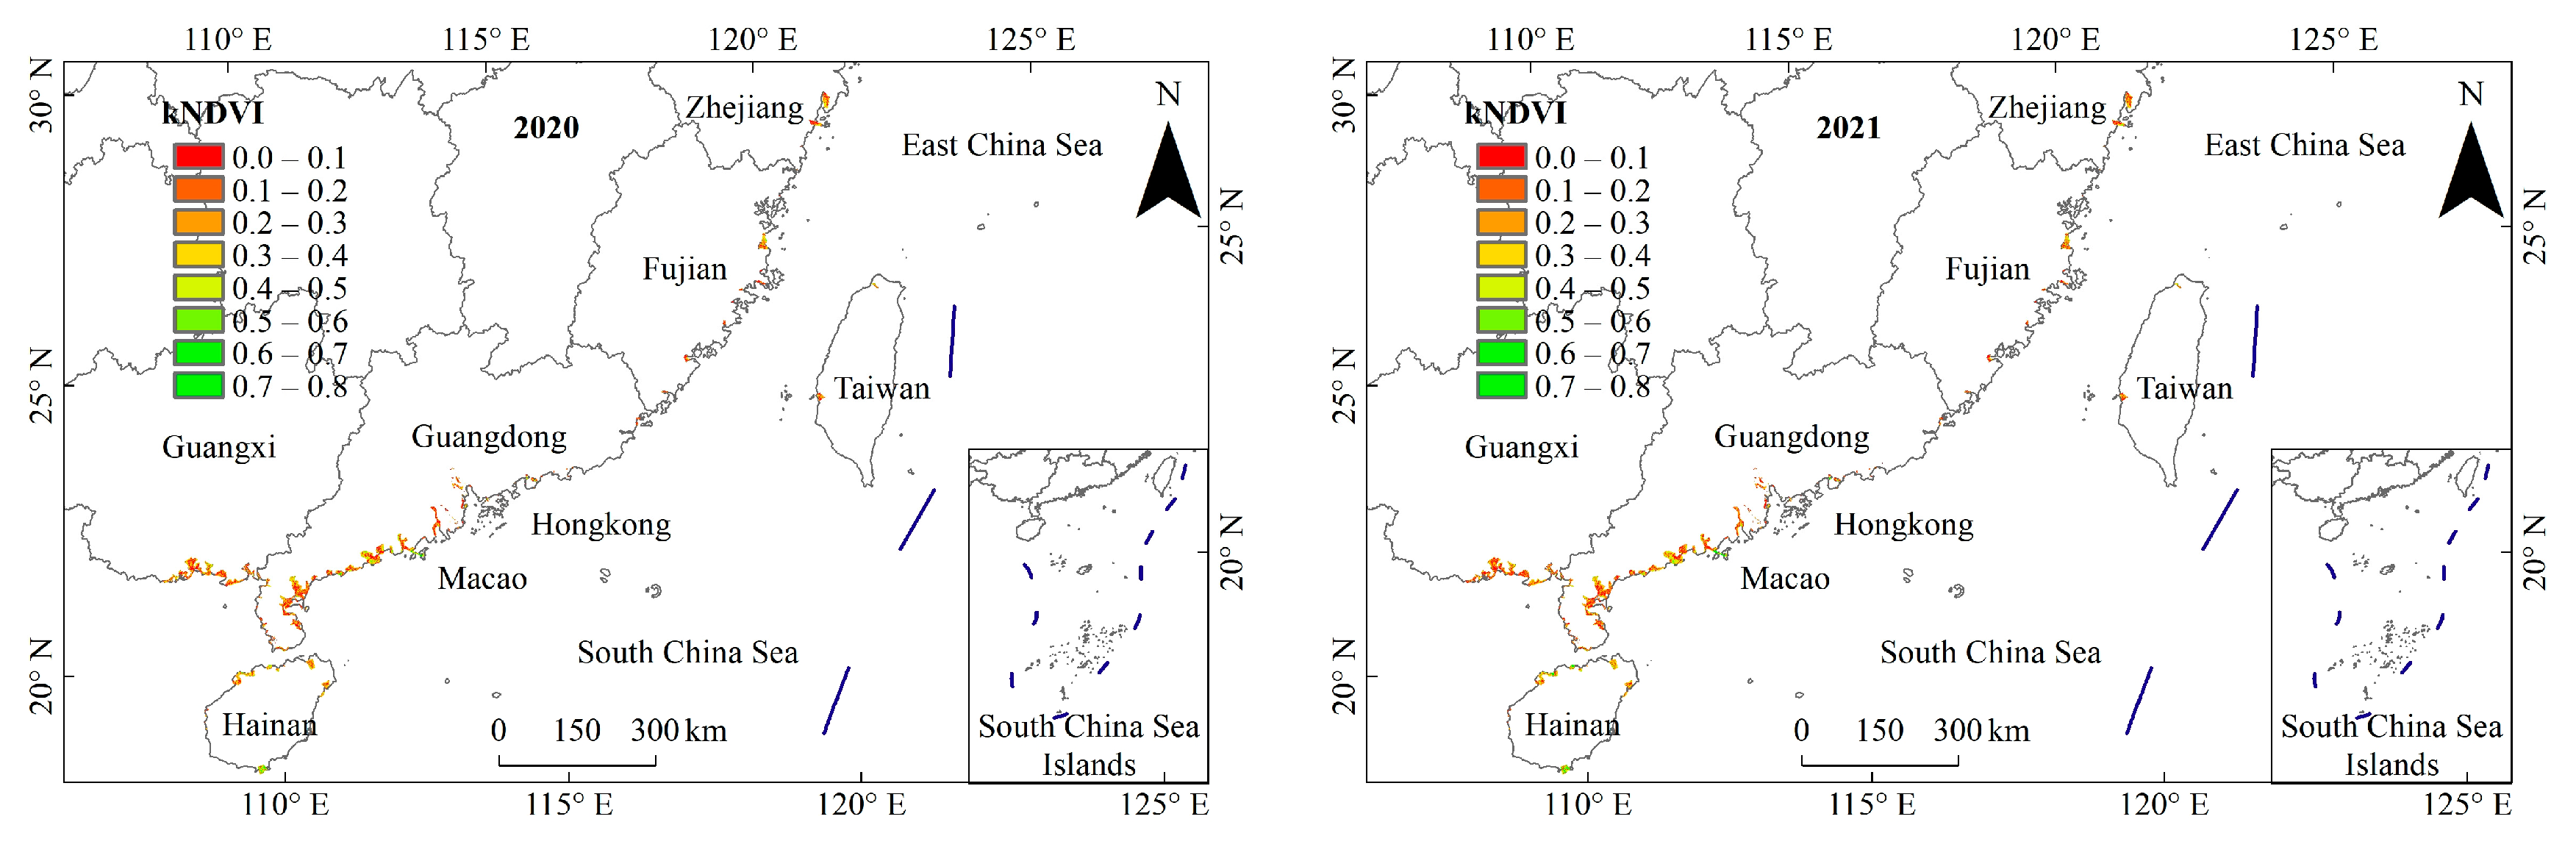
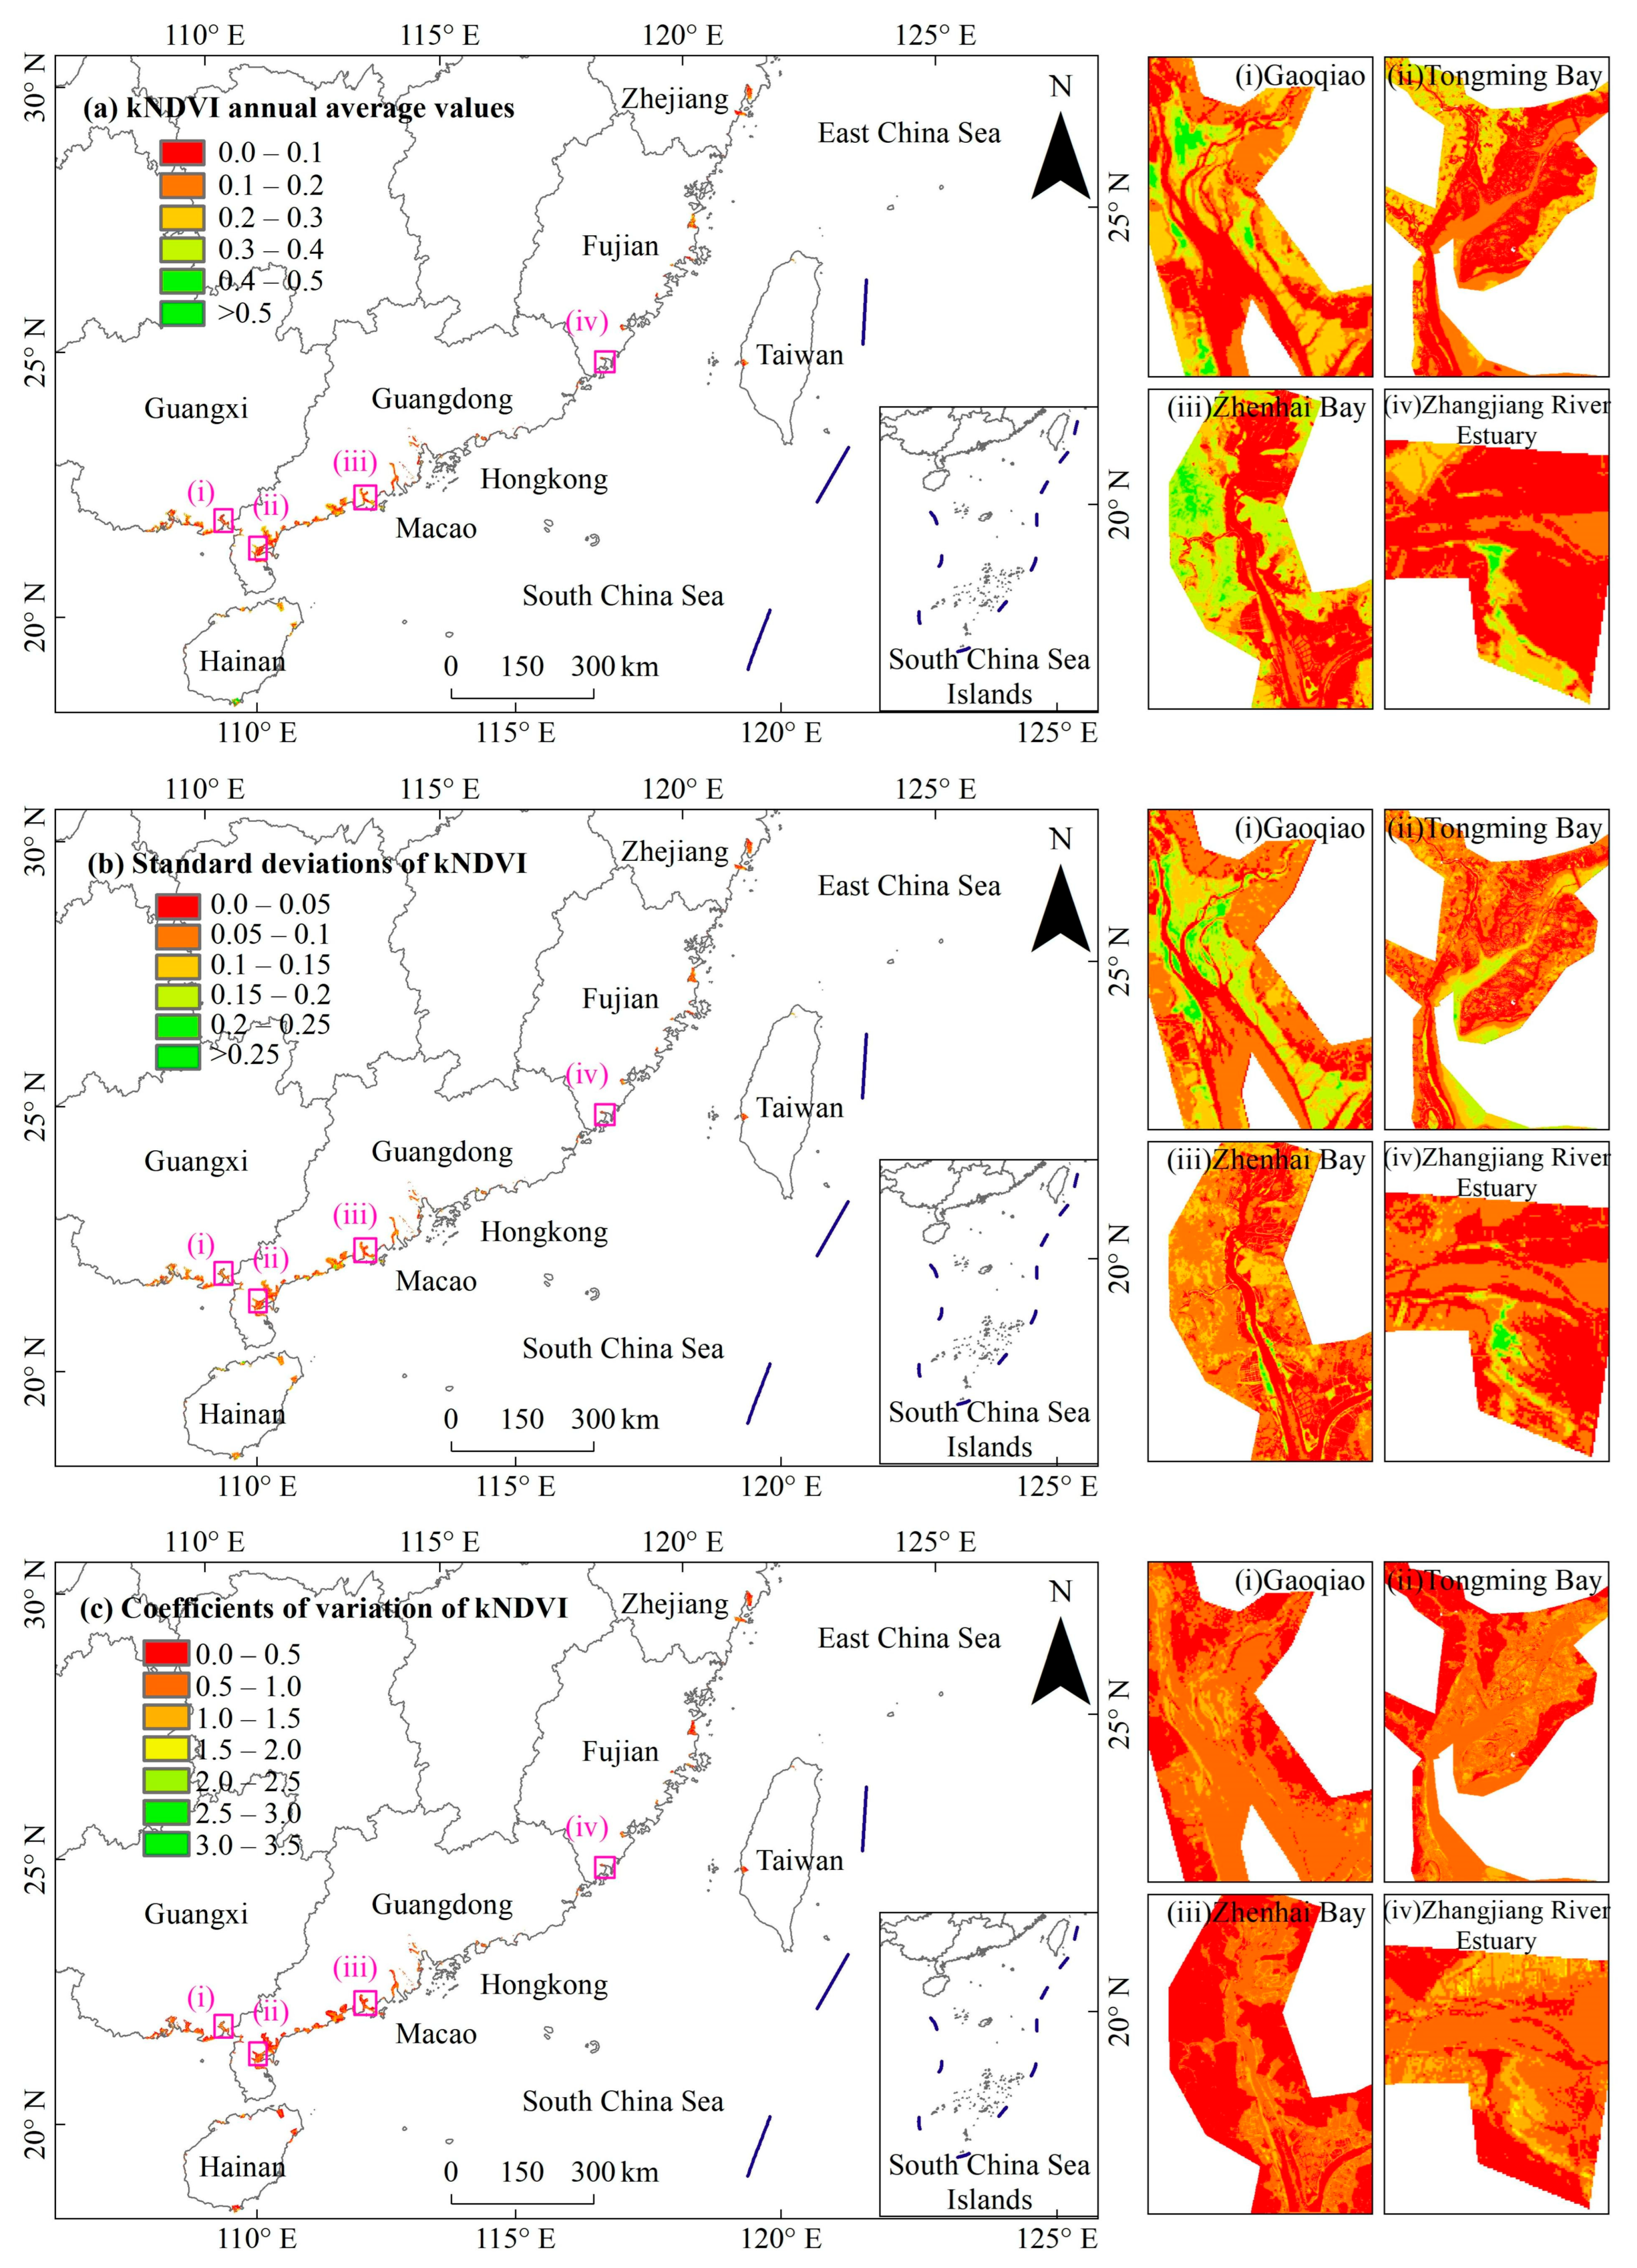
3.1. General Characteristics of Mangrove kNDVI

Figure 4 delineates the spatiotemporal patterns of kNDVI across Chinese mangrove ecosystems from 1986 to 2021, revealing pronounced spatial stratification in vegetation vigor. The kNDVI values ranged from 0.0056 to 0.5710, with 68.01% of the study area characterized by low values (0–0.2), indicative of degraded or fragmented mangrove stands. Intermediate (0.2–0.4) and high–vigor (0.4–0.6) classes occupied 26.85% and 5.14% of the region, respectively. Elevated kNDVI clusters were spatially concentrated in ecologically preserved zones, notably Gaoqiao (Figure 4a-i), Tongming Bay (Figure 4a-ii), Zhenhai Bay (Figure 4a-iii), and the Zhangjiang River Estuary (Figure 4a-iv), demonstrating significant correlations between conservation efficacy and geographic governance frameworks. Spatial heterogeneity was further quantified through standard deviation (SD) values (0–0.275), reflecting differential physiological activity across localities (Figure 4b). Interannual variability, as measured by the coefficient of variation (CV = 0.626 ± 0.412), exhibited irregular fluctuations (0.069–3.927) without discernible zonal distribution patterns (Figure 4c).
Figure 5 synthesizes 36 years (1986–2021) of mangrove recovery trajectories along China’s southern coastline, revealing divergent trends across kNDVI vigor classes. The low-vigor class (0–0.2) experienced a 58.14% areal reduction, transitioning from a gradual decline (−0.919/yr) during 1986–2011 to accelerated loss (−3.258/yr) post-2011. Conversely, the intermediate class (0.2–0.4) expanded by 21.16% through stable accretion (0.805/yr). High-vigor classes exhibited nonlinear recovery dynamics: the 0.4–0.6 range surged by 34.06%, progressing from incremental gains (0.162/yr pre-2011) to exponential growth (3.162/yr post-2011), while the uppermost class (0.6–0.8) demonstrated statistically significant expansion (2.92% areal improvement, 0.356/yr) after 2013.

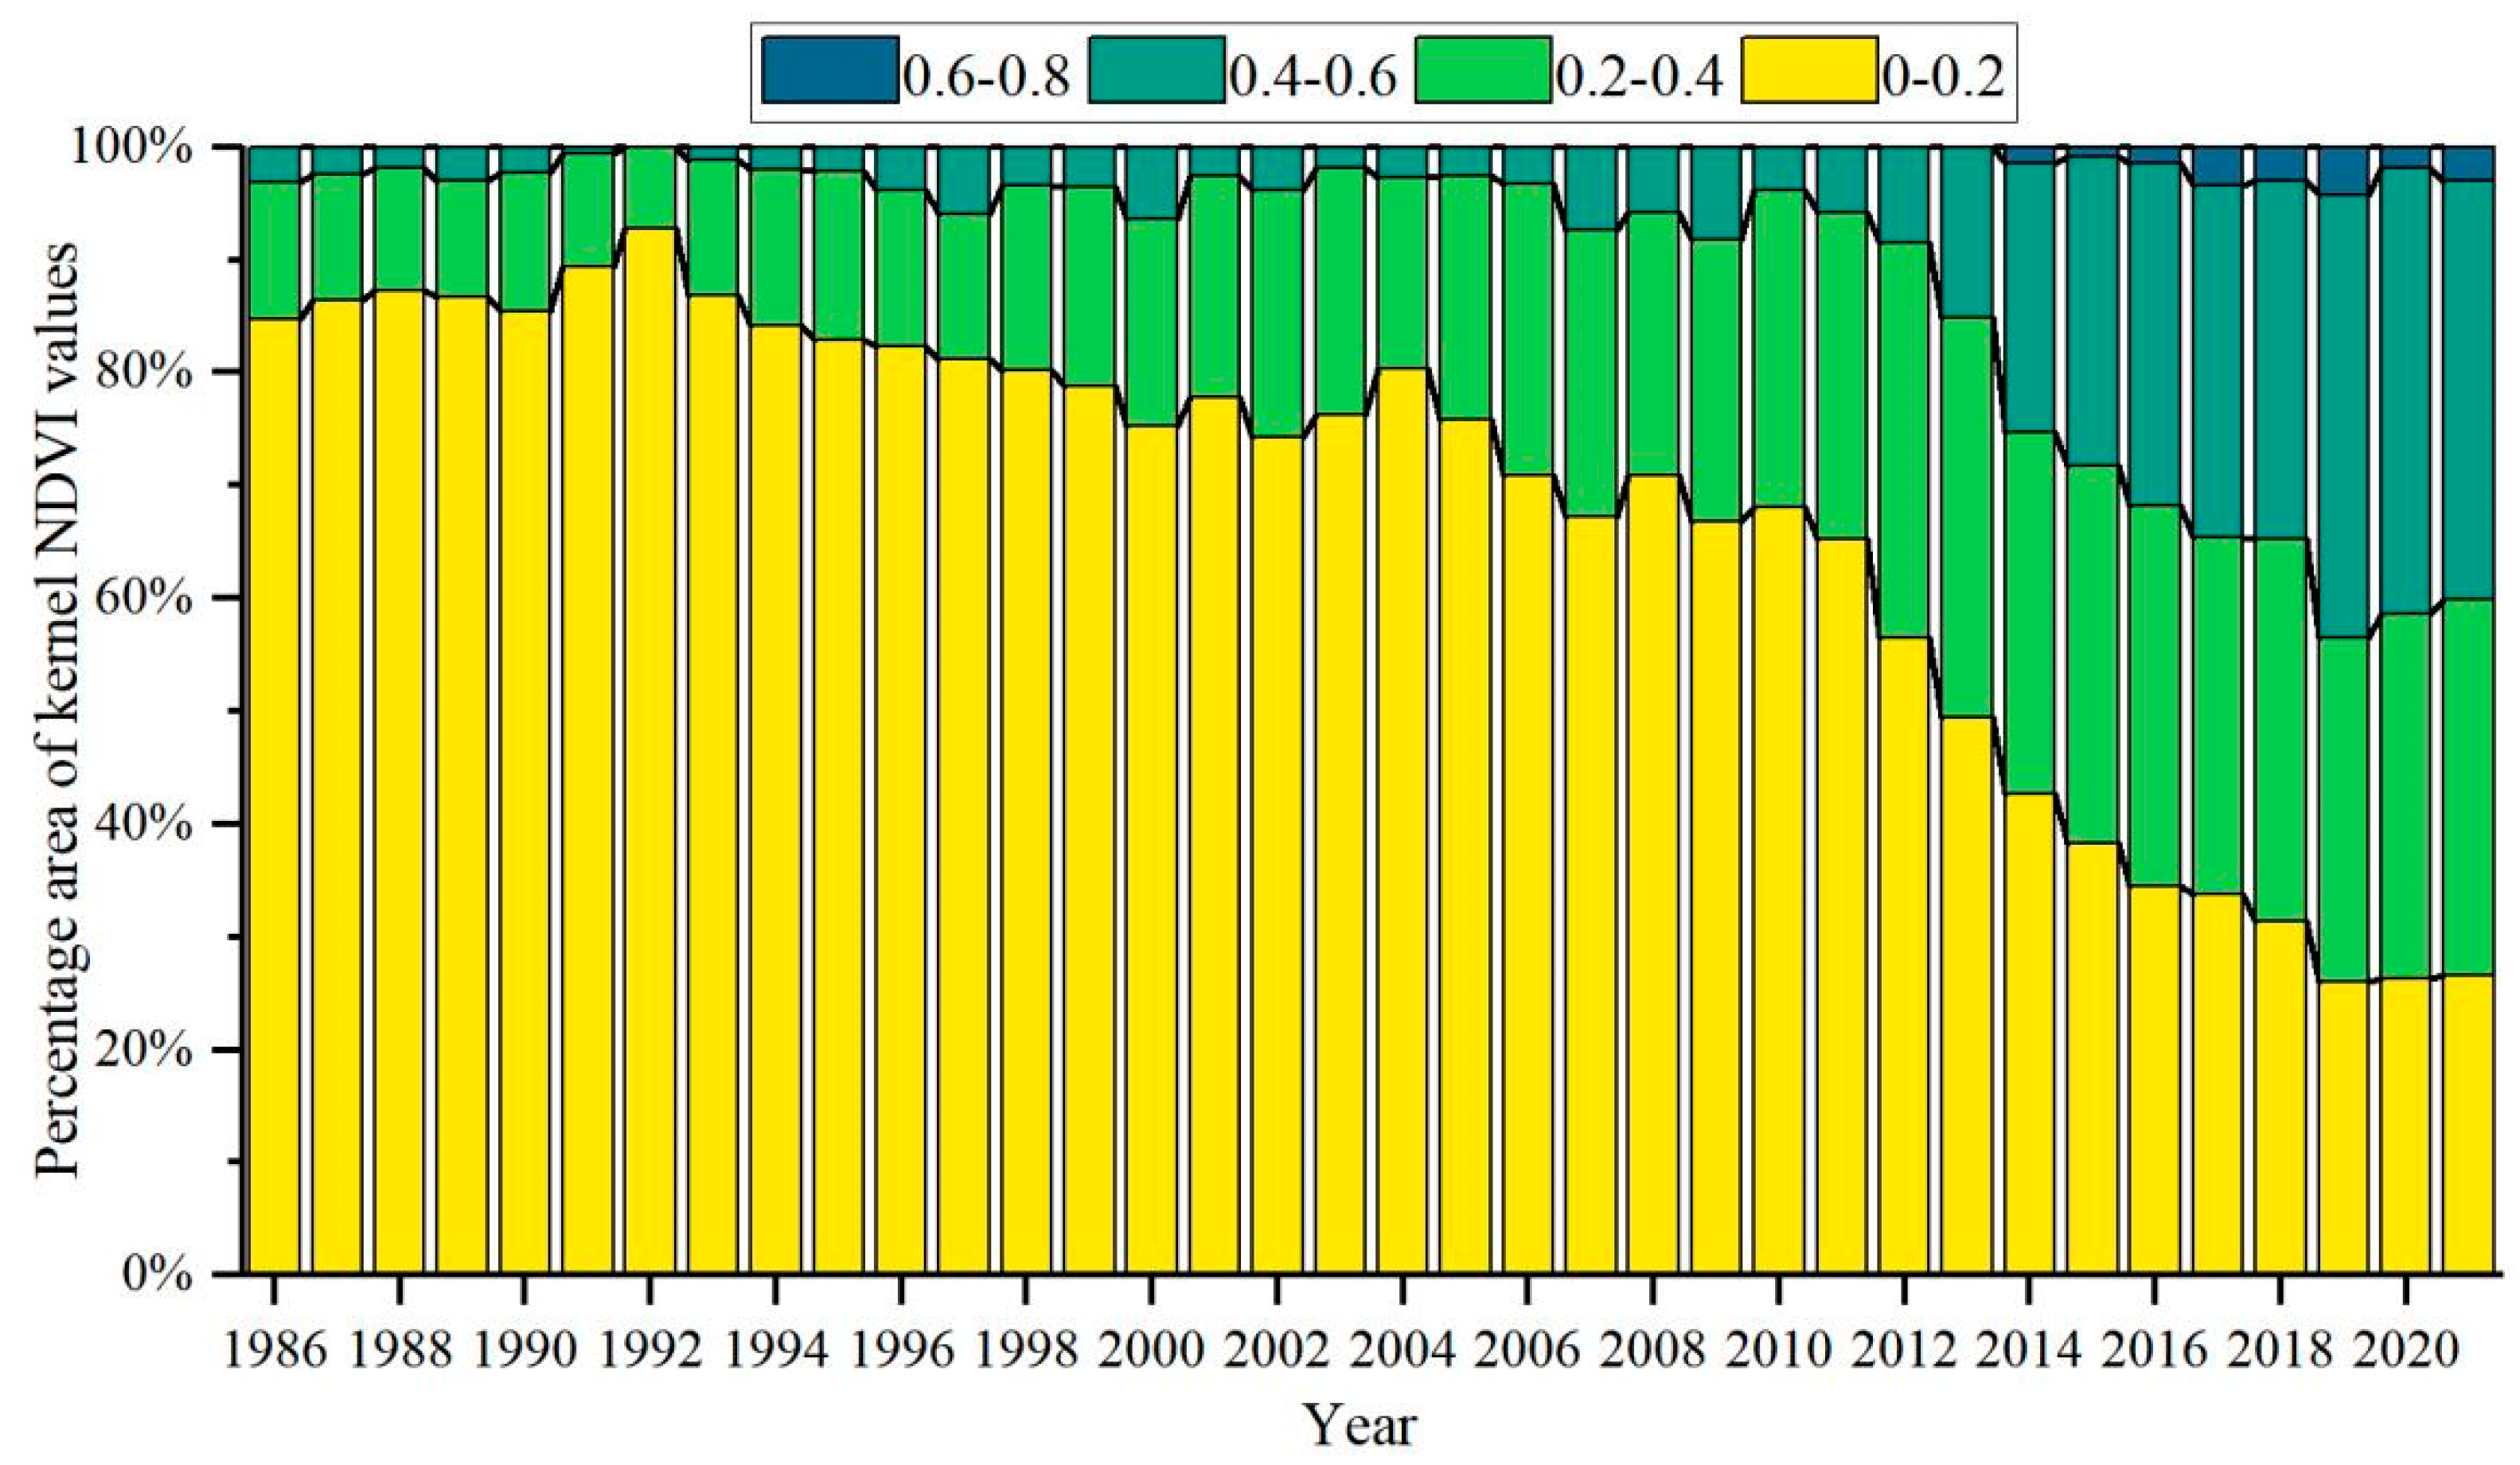
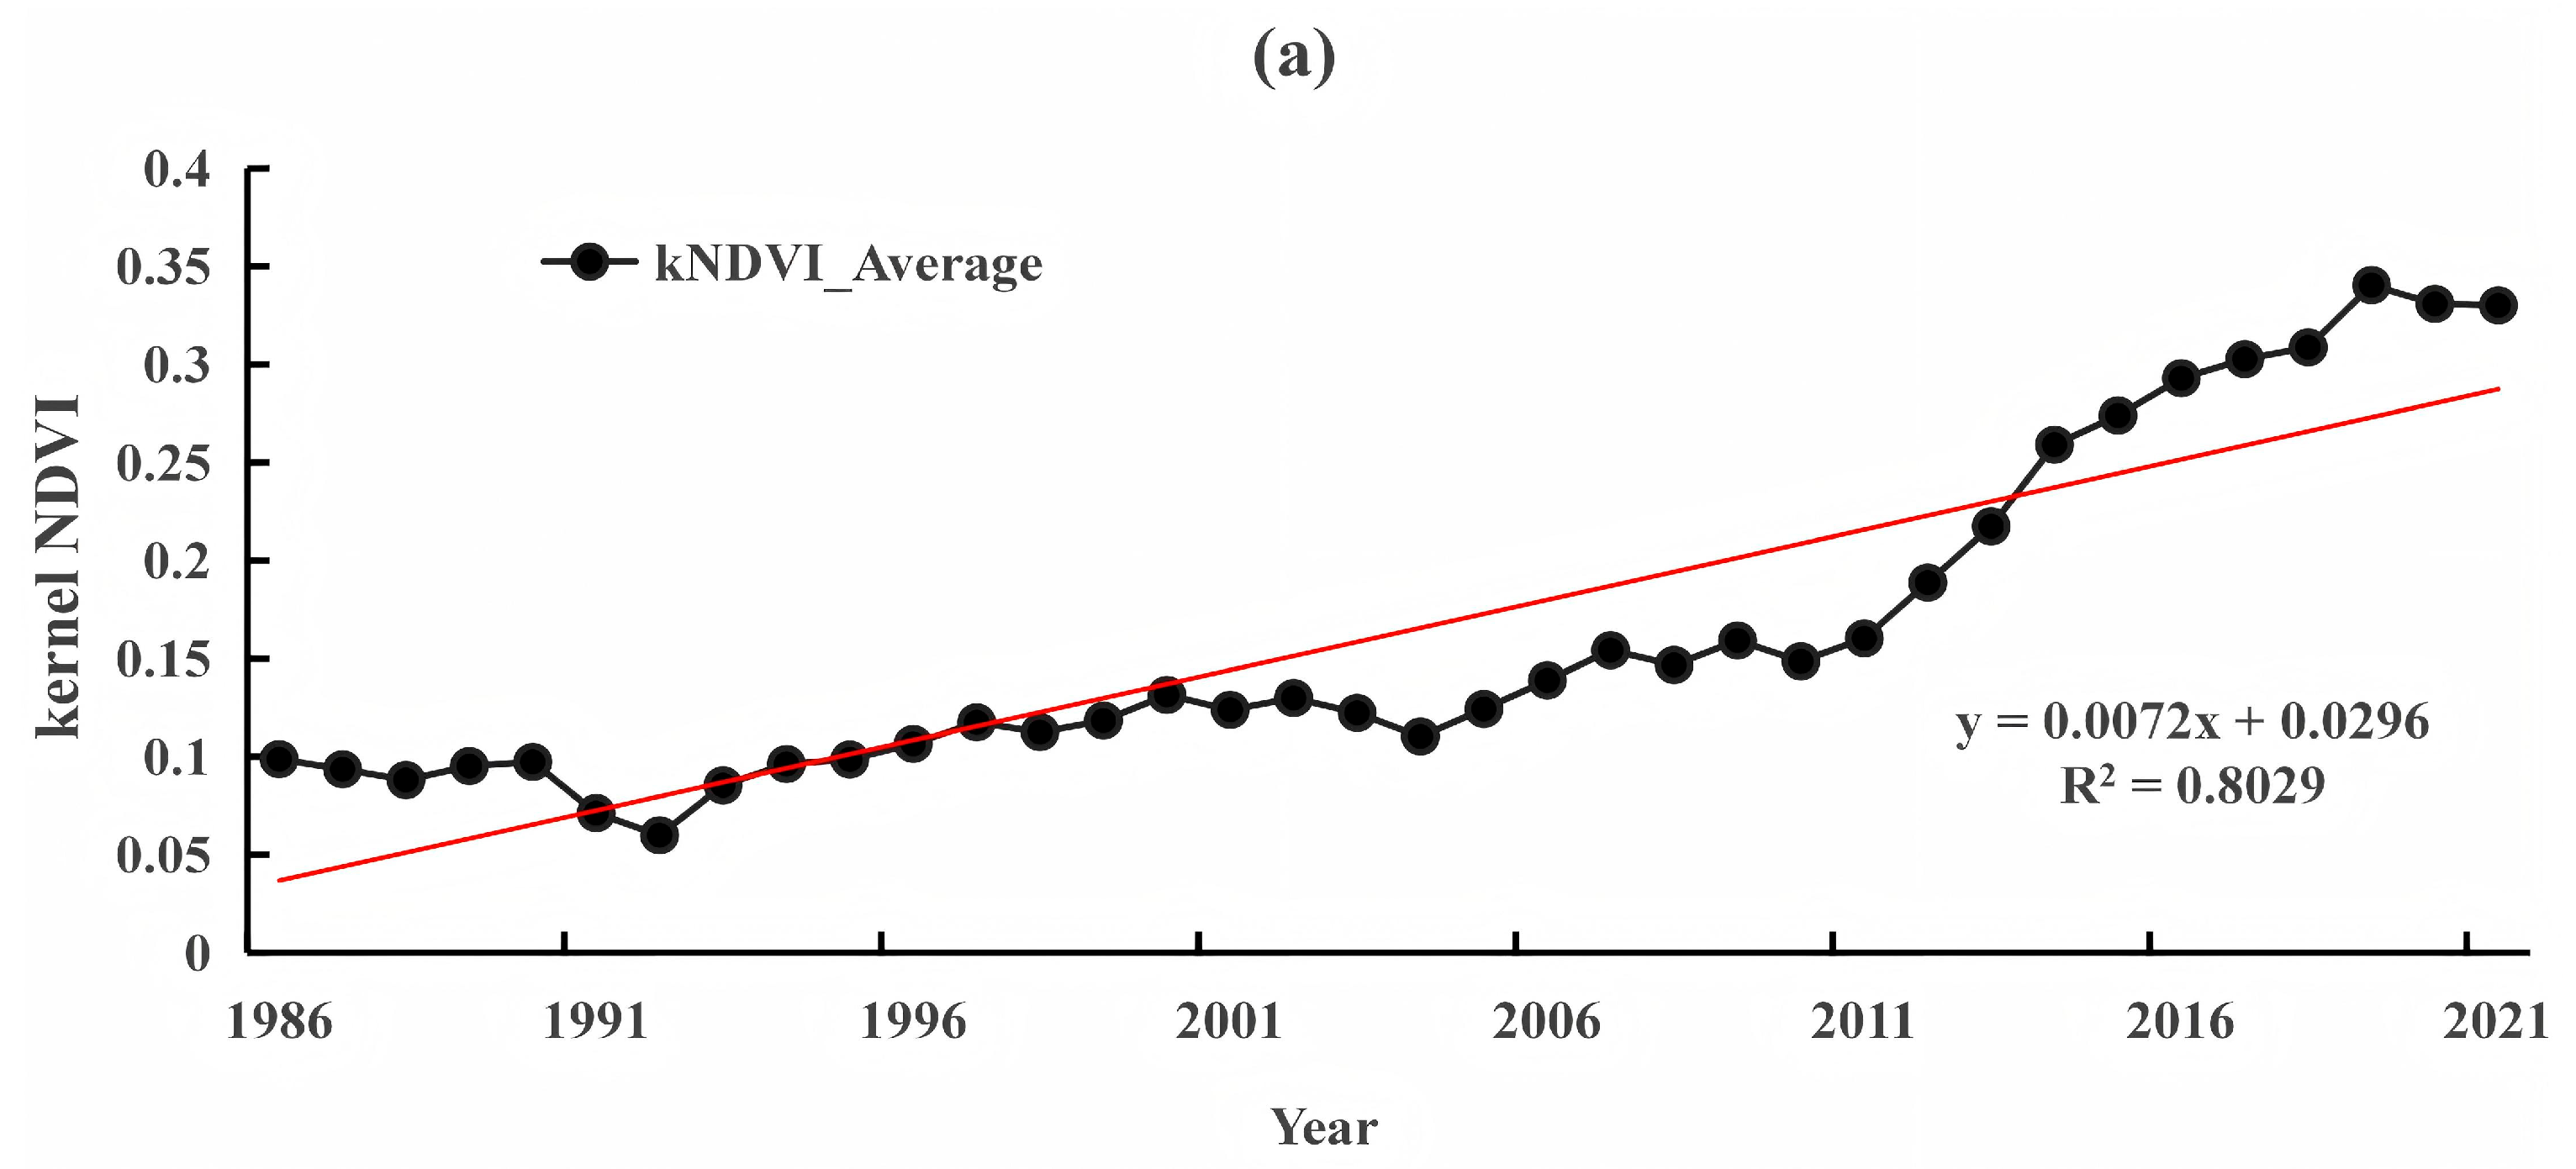
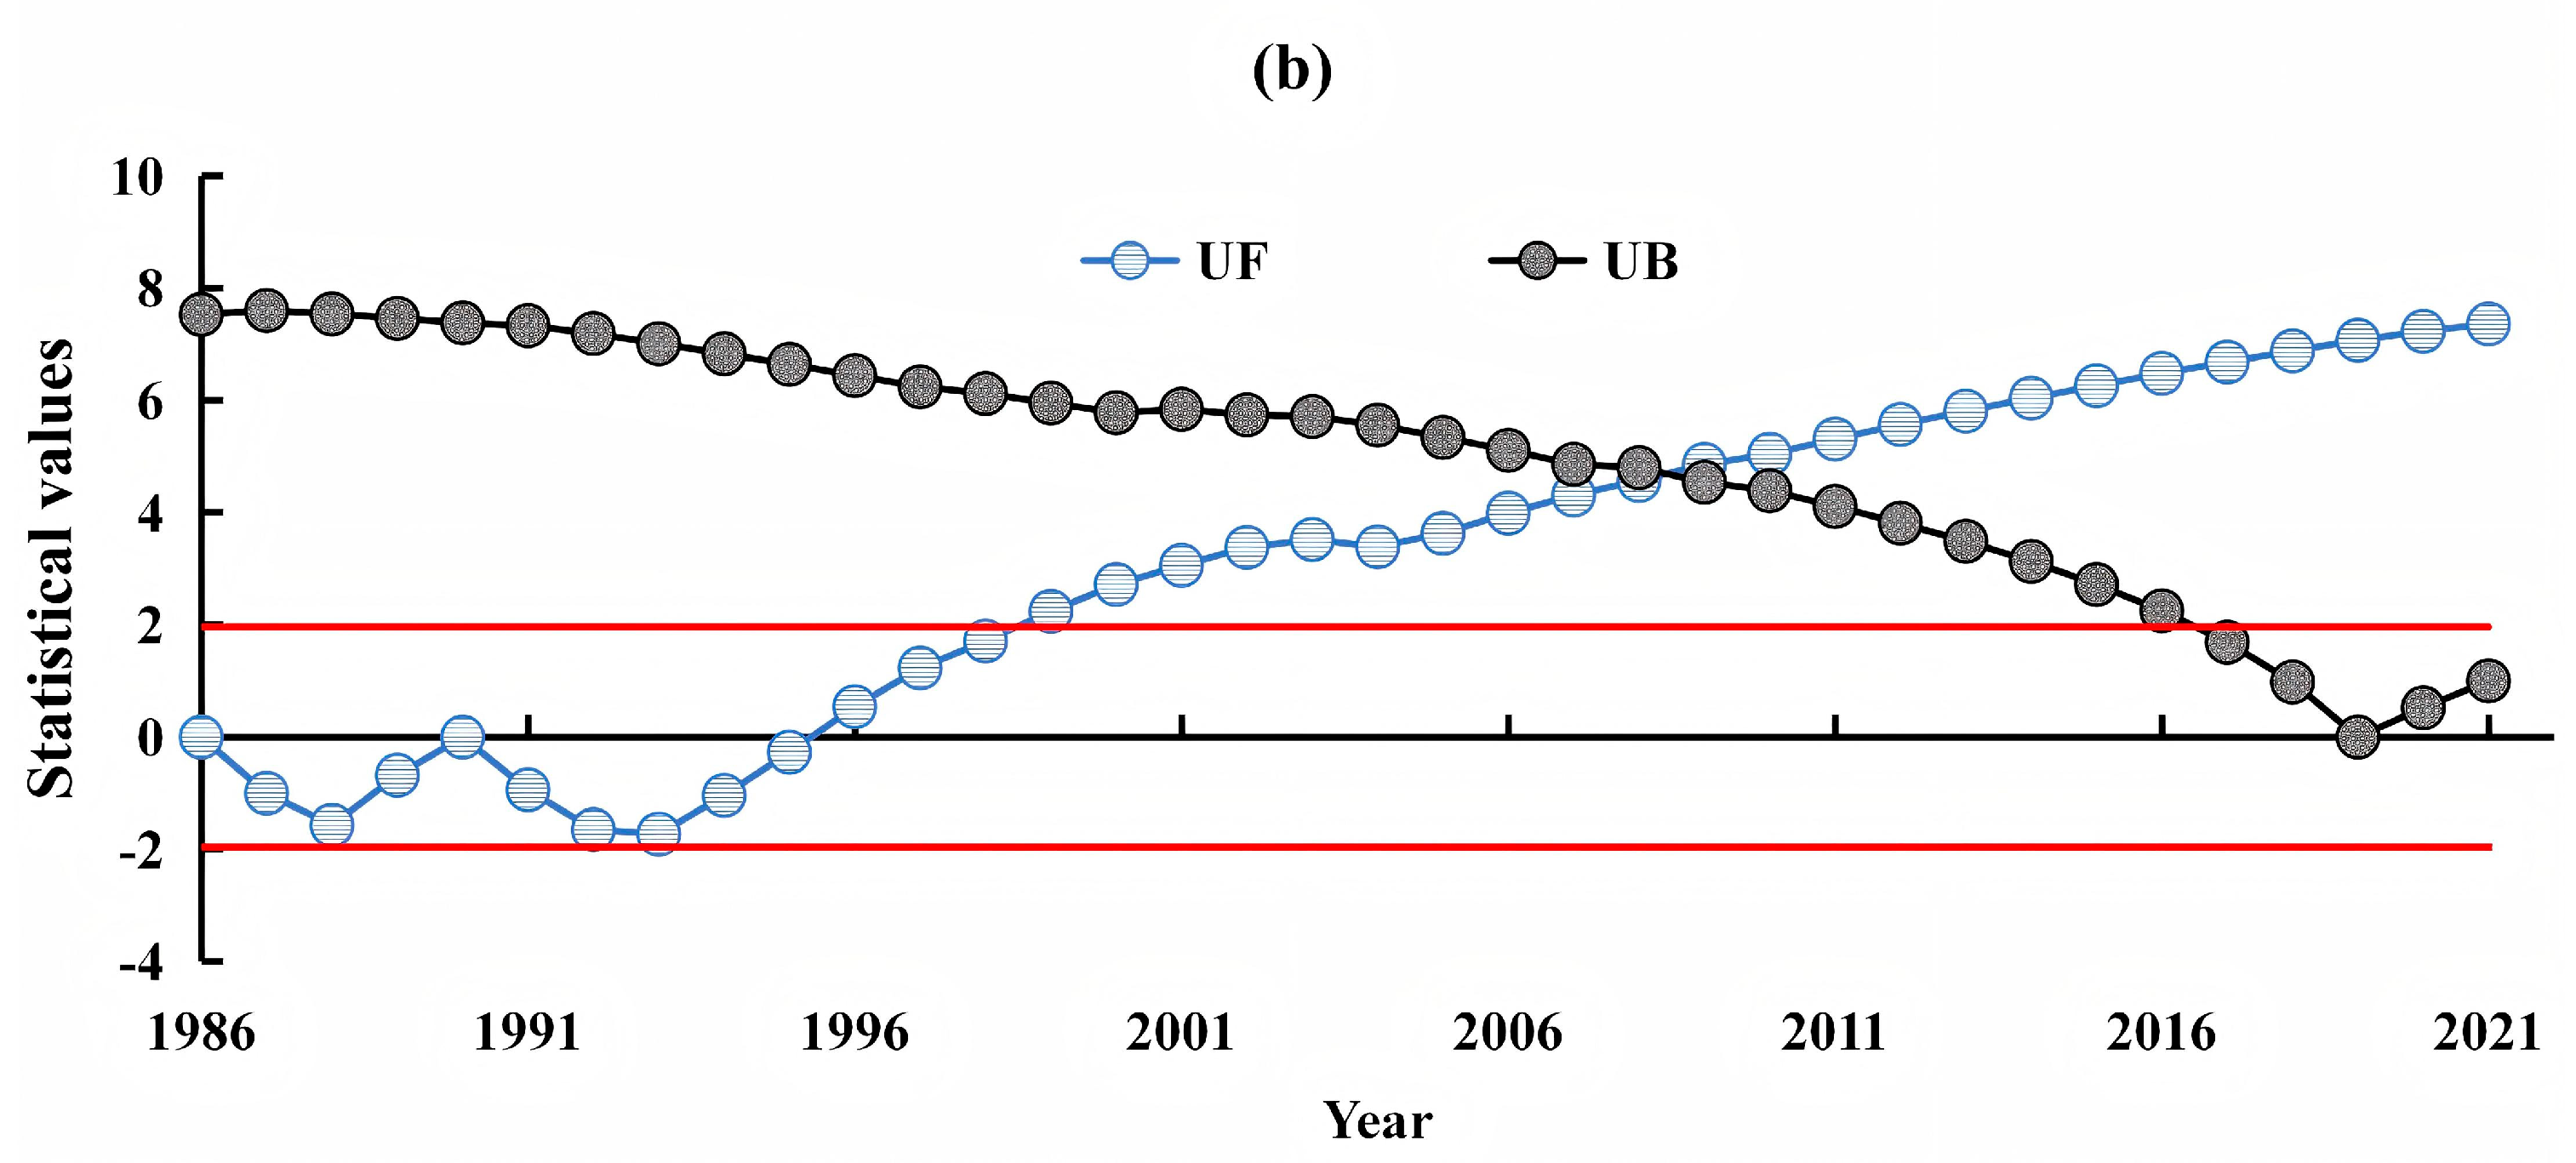
3.2. Dynamic TRENDS in Mangrove kNDVI During 1986–2021

As illustrated in Figure 6a, the mean kNDVI value over the 36-year period was 0.162, exhibiting a significant fluctuating upward trend at a rate of 0.0072/yr (R2 = 0.8029, p < 0.01). During 1986–2003, kNDVI displayed interannual oscillations, with a pronounced transient decline observed between 1990 and 1992, reaching a minimum value of 0.059 in 1992. Subsequently, from 2004 onward, kNDVI demonstrated a marked upward trajectory at an accelerated rate of 0.0149/yr, culminating in a peak value of 0.340 by 2019, representing a cumulative improvement of 234.65% over the study period.
Theil–Sen slope analysis combined with Mann–Kendall trend testing yielded a consistent annual kNDVI slope, corroborating the linear regression results. Mann–Kendall mutation analysis (Figure 6b) revealed that the positive sequence statistic (UFk) remained negative during 1986–1995, subsequently transitioning to positive values. This shift indicates an initial phase of mangrove degradation followed by gradual recovery. Notably, UFk exceeded the 95% confidence threshold (1.96) after 1998. This indicates that there was an acceleration in the post-1998 mangrove restoration efforts.

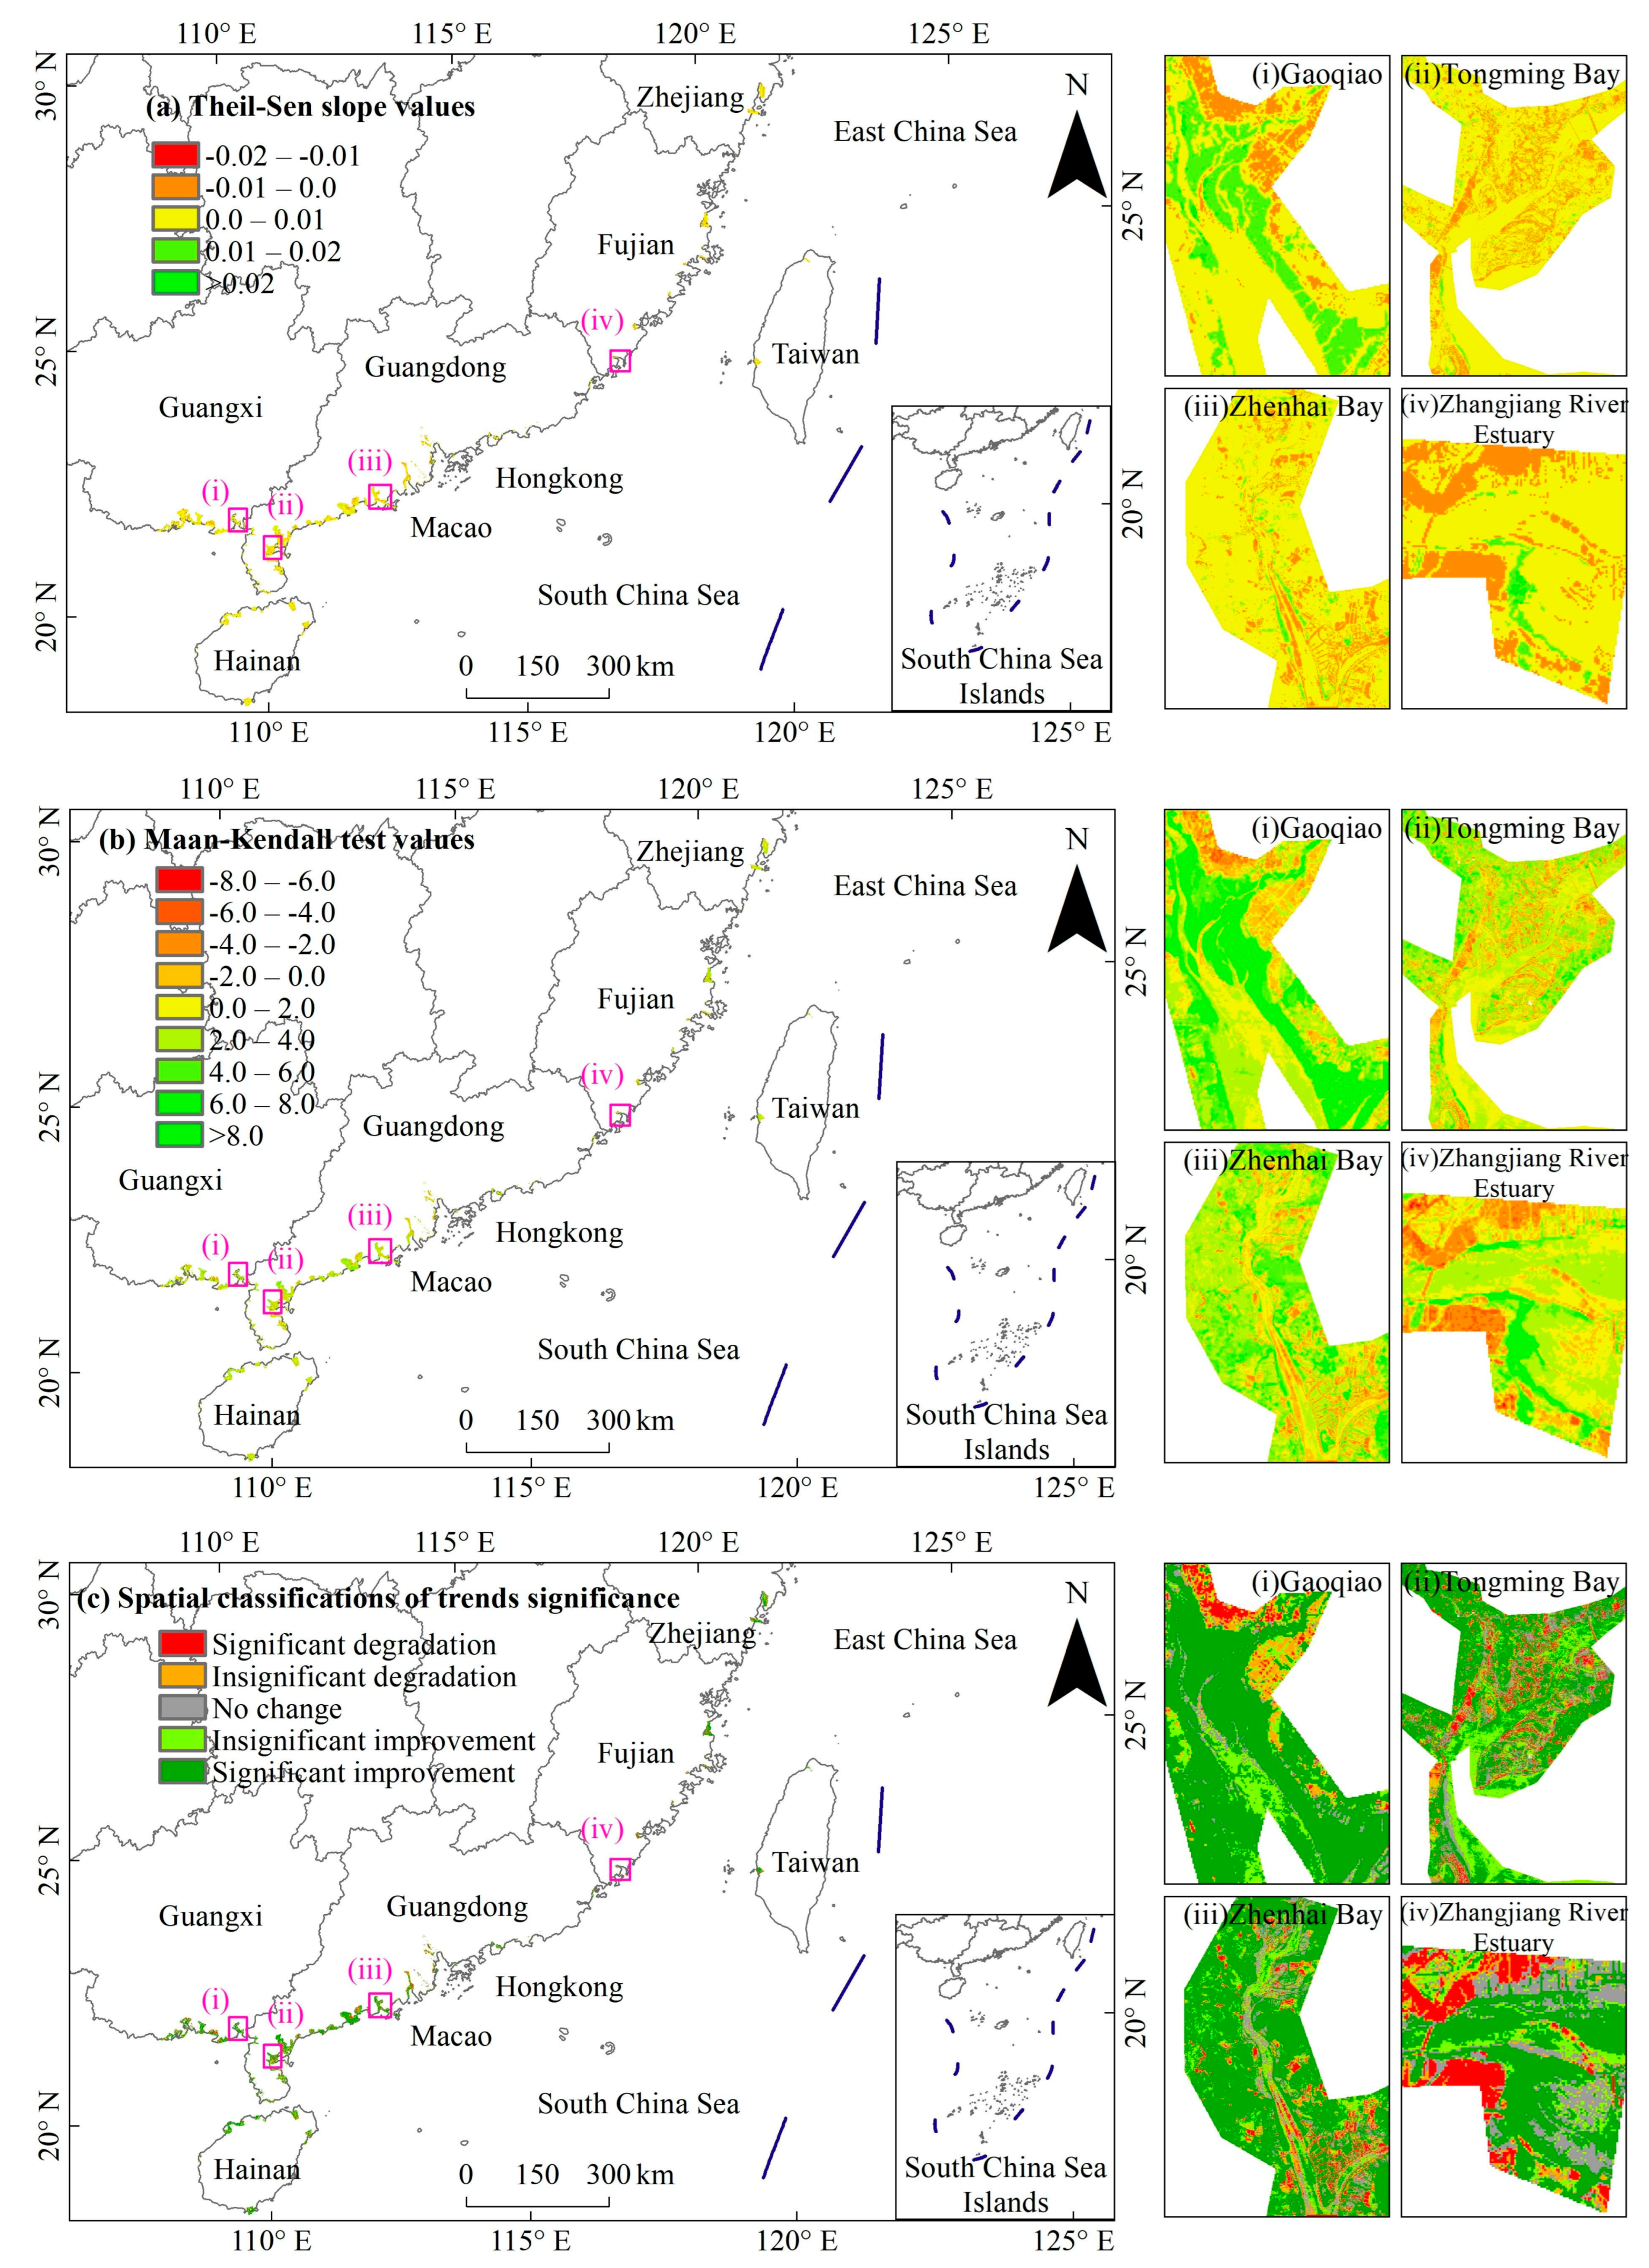
3.3. Spatial Differences in Mangrove kNDVI Dynamics Trends

The integrated Theil–Sen estimator and Mann–Kendall trend analysis revealed pronounced spatiotemporal heterogeneity in mangrove kNDVI dynamics across coastal China between 1986 and 2021 (Figure 7). Theil–Sen slopes ranged from −0.1847 to 0.2395/yr, with 74.99% of mangrove areas exhibiting positive trends (slope > 0), indicative of widespread vegetation improvement. Degradation hotspots (slope < 0) occupied only 15.08% of the total mangrove extent, displaying patchy distributions (Figure 7a). Mann–Kendall test Z-values varied between −7.28 and 7.89, with statistically significant changes (p ≤ 0.05) detected in 67.09% of pixels, confirming the robustness of observed trends over the 36-year study period (Figure 7b).
Spatial classifications of trend significance identified five distinct categories (Figure 7c): (1) significant degradation (slope ≤ 0, p ≤ 0.05), (2) insignificant degradation (slope ≤ 0, p > 0.05), (3) no change (slope = 0), (4) insignificant improvement (slope > 0, p > 0.05), and (5) significant improvement (slope > 0, p ≤ 0.05). Improvement trends dominated 74.99% of mangrove areas, with significant improvements (58.68%) exhibiting broad-scale distribution across all provinces, suggesting systemic recovery likely driven by national conservation policies. Improvements of a negligible nature (16.31%) were more concentrated, which may be indicative of local restoration efforts. The occurrence of degraded areas (15.08%) was associated with intensified aquaculture and urban encroachment. Mangrove communities in the stabilized zone accounted for 9.93%, suggesting they may have reached successional equilibrium.

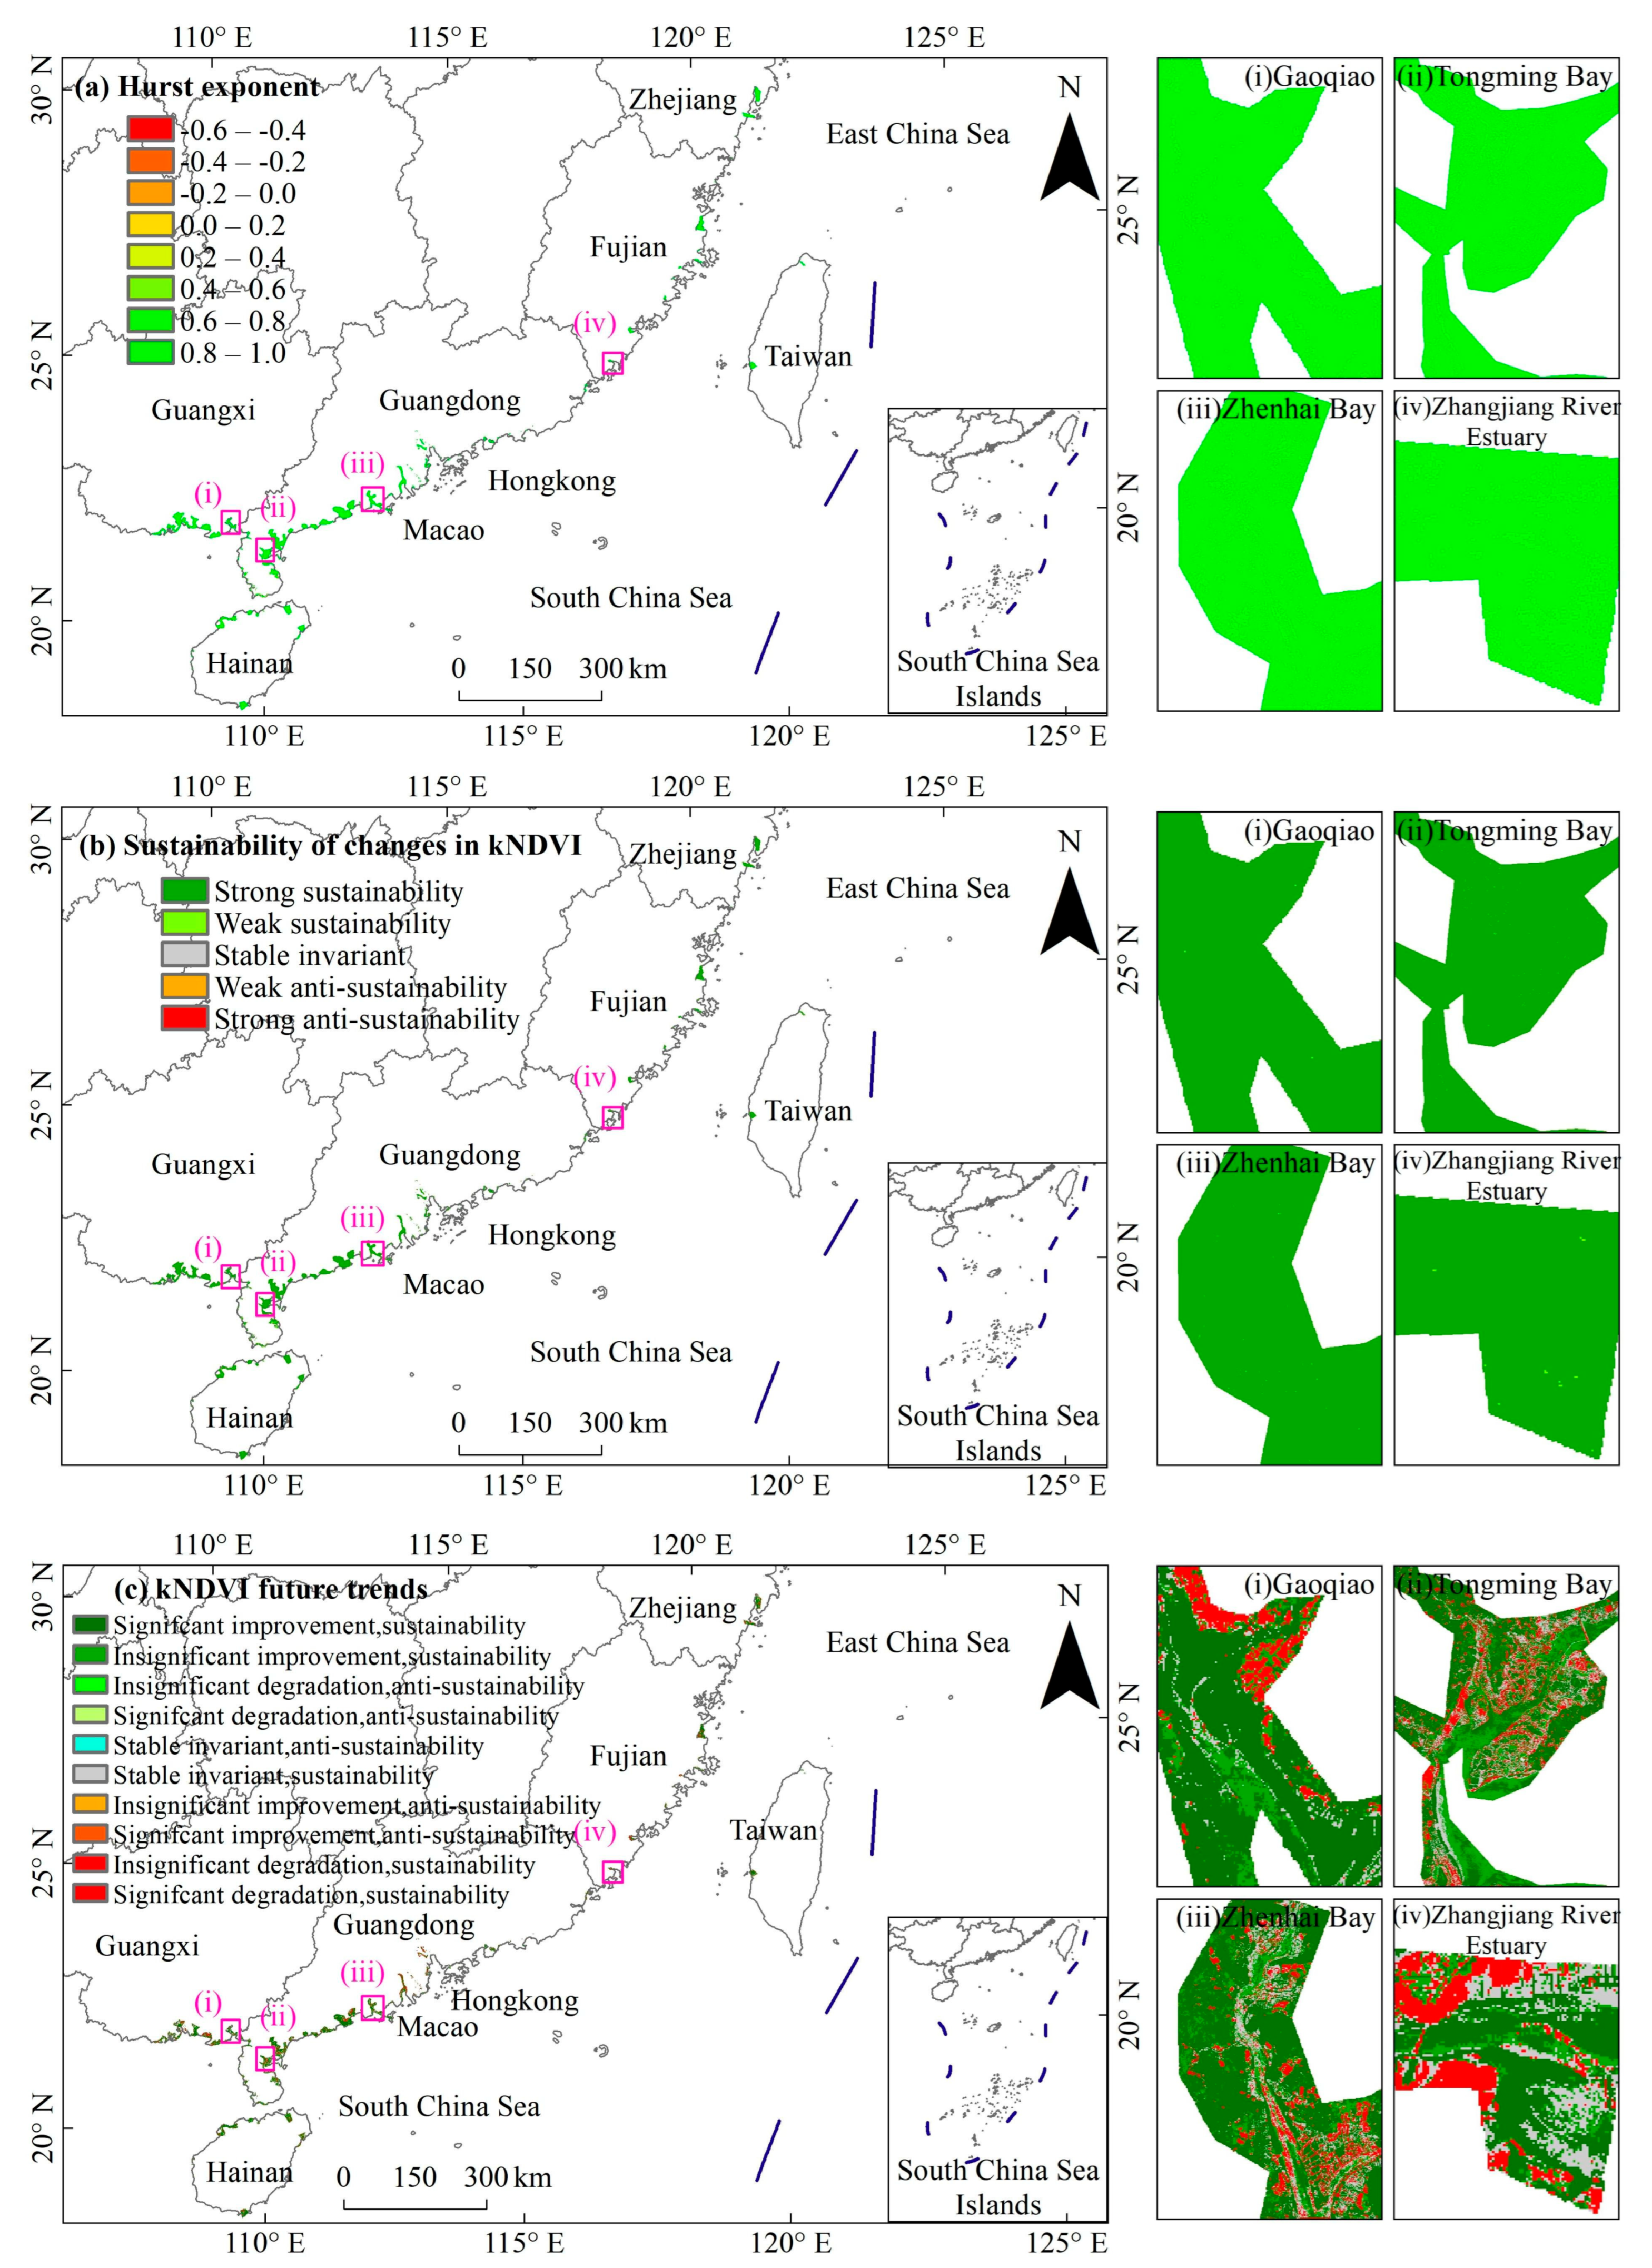
3.4. Consistency of Future Trends in Mangrove kNDVI Dynamics

Spatiotemporal analysis of the Hurst exponent revealed pronounced persistence characteristics in China’s mangrove ecosystems (Figure 8). The computed Hurst values ranged from −0.530 to 1.0, with a mean of 0.896, demonstrating strong temporal autocorrelation in vegetation dynamics (Figure 8a). It is noteworthy that over 99% of the study area exhibited a Hurst exponent greater than 0.5, indicating a high probability of continued adherence to the 1986–2021 kNDVI trajectories. Less than 1% of the area displayed minimal anti-sustainability signatures, suggesting the potential for a localized trend reversal (Figure 8b).
The integrated analysis, combining the reclassified Hurst exponent, the significance values from the Mann–Kendall test, and the slope values from the Theil–Sen trend analysis, reveals projected future trends in kNDVI dynamics across China’s mangrove ecosystems (Figure 8c). The results of the spatial quantification of the patterns indicate that 74.97% of the study area exhibits ecological improvement, primarily driven by sustained and significant improvement (58.67%) that is spatially homogeneous and continuously distributed. Additionally, 16.30% of the area shows insignificant but sustained improvement, while transitional zones shifting from long-term degradation to improvement are found to be negligible (0.0000278%). In contrast, 15.10% of the total area is experiencing degradation, including sustained significant degradation (8.40%), insignificant sustained degradation (6.67%), and critically vulnerable regions transitioning from previous improvement to active degradation (0.025%), characterized by a highly discrete spatial distribution. Notably, 9.93% of the mangrove areas exhibit indeterminate trend signals. This observation underscores the necessity for systematic conservation frameworks and adaptive governance strategies to mitigate potential ecological regression and stabilize these ecotones.

3.5. Analysis of Influencing Factors

The variable importance analysis demonstrated pronounced heterogeneity in the contributions of environmental drivers to mangrove kNDVI dynamics. The rate of relative sea-level rise (RSLR) emerged as the predominant controlling factor with an importance score of 0.91, reflecting its critical role in regulating tidal inundation patterns and sediment accretion processes. The nighttime light index (NLI) was the second-most predictive factor (0.81), revealing the dual impacts of coastal ecological management initiatives and unsustainable development practices on mangrove habitats. Annual mean sea surface temperature (MASST) and ambient temperature exhibited comparable importance scores (0.51 and 0.49, respectively), while tropical cyclone frequency showed equivalent explanatory power (0.48), collectively indicating their synergistic effects on mangrove physiological responses. Precipitation demonstrated minimal contribution (0.19), suggesting limited regulatory capacity over kNDVI variations in comparison to other determinants (Figure 9). The DF regression model accounted for 68% of the observed variance in mangrove kNDVI trajectories over the 36-year period, thereby providing quantitative evidence for the ecosystem’s sensitivity to multi-decadal environmental changes.

4. Discussion

4.1. Spatiotemporal Variation Trends of kNDVI in China’s Mangrove Forests over the Past 36 Years

This study harnessed Landsat multispectral imagery from 1986 to 2021, leveraging the GEE cloud computing platform for processing. With an unprecedented 30 m spatial resolution, it delved into the spatiotemporal evolution of China’s mangrove forests by employing innovative kNDVI. The kNDVI methodology, which is based on radial basis function kernel mapping, overcomes the critical limitations of the conventional NDVI. It effectively alleviates spectral saturation effects in high-density canopy environments and resolves the nonlinear interference caused by mixed pixels in intertidal zones [21]. This methodological breakthrough notably enhances the accuracy of detecting the vertical proliferation dynamics of mangroves [17].
Our longitudinal analysis demonstrated a statistically significant positive trend in the kNDVI values of mangrove forests in China (p < 0.05). Specifically, 67.09% of the pixels showed significance in the Mann–Kendall test (Z > 1.96). The calculated mean annual growth rate reached 0.0072 per year, resulting in a cumulative increase of 0.231 units over the 36-year period. Significantly, this growth rate far exceeds the comparable benchmarks. It is 1.6 times higher than the mangrove NDVI trends in East Asia (0.0045/yr), 2.49 times greater than those in South Asia (0.00289/yr), and 9.56 times higher than the global averages (0.000753/yr) derived from MODIS NDVI analyses [5]. The observed disparities can be primarily attributed to the two-fold technological advantages of Landsat-derived kNDVI. First, the enhanced spatial resolution, with 30 m Landsat images offering an 8.3-fold improvement over 250 m MODIS data. Second, advanced spectral processing through the Kernel Vegetation Index methodology improves the characterization of sparse vegetation in ecotones and suppresses data saturation artifacts [21].
However, the persistent positive trajectory of China’s mangrove ecosystems stands in marked contrast to the declining NDVI trends observed in Western Asia −0.00258/yr, p = 0.079) [5], the Sundarbans of India [26], the Gulf of California [10], and Saudi Arabia [37]. This regional disparity is likely attributable to differential prioritization and implementation intensity of coastal zone governance and conservation strategies. The legal framework established by China’s 1992 Wetland Conservation Law and the 2001 Technical Guidelines for Mangrove Ecological Restoration has driven a 37% expansion in mangrove coverage, increasing from 20,450 ha in 1990 to 28,010 ha in 2020 [38]. The present findings provide scientific corroboration for the enhanced regional biocapacity reported by Huang Fanfei’s research team [29].
The ongoing kNDVI growth trajectory detected in Chinese mangrove ecosystems contrasts with the global trend of mangrove lateral contraction. This phenomenon fulfills two scientific roles: first, it serves as an operational validation of the efficacy of policy-driven conservation measures, and second, it unveils intrinsic phytophysiological resilience mechanisms [1,6,24].

4.2. Driving Factors of kNDVI Changes in China’s Mangrove Forests

This study employed the DF deep learning framework to overcome the linear limitations of traditional statistical methods. Through nonlinear ensemble learning, the framework revealed the drivers of spatiotemporal dynamics in China’s mangrove kernel Normalized Difference Vegetation Index (kNDVI) from 1986 to 2021, achieving a modelperformance with an R2 of 0.68. Despite the DF model’s inherently high capacity due to its cascaded architecture, potential overfitting was rigorously mitigated using three strategies: (1) Bayesian optimization systematically constrained key hyperparameters (e.g., maximum cascade layers, estimators per layer, trees per forest), preventing excessive complexity and yielding an optimally compact structure; (2) Selecting LightGBM as the base predictor enhanced generalization by leveraging its built-in regularization mechanisms, which include Gradient-based One-Side Sampling (GOSS) and Exclusive Feature Bundling (EFB) and accelerate training while suppressing overfitting through efficient feature and sample processing; (3) A stringent independent validation protocol (90% training, 10% testing) coupled with R2 evaluation confirmed stable and reliable predictive performance on unseen data. These measures collectively ensure the model’s robustness for identifying ecological drivers in environmental remote sensing applications.
The factor importance hierarchy (relative sea-level rise [RSLR] > nighttime light index [NLI] > mean annual sea surface temperature [MASST] > mean annual temperature [MAT] > tropical cyclone frequency [TCF] > mean annual precipitation [MAP]) demonstrates that coastal geomorphological processes and human–nature coupled systems jointly dominate kNDVI variation patterns.
Specifically, the persistent RSLR of 3.586 mm/yr systematically modified the tidal inundation regimes and soil salinity gradients (Figure 3e). The positive correlation between RSLR-induced vertical accretion and kNDVI suggests that this vertical accretion is driven by biogeomorphic feedback. In China’s urbanized coasts with limited sediment supply, vertical accretion primarily relies on autochthonous root-derived organic accumulation rather than allochthonous mineral deposition [2,6,39]. Anaerobic soil conditions effectively preserve root-generated organic carbon, sustaining annual elevation gains of 2.1–3.8 mm, exceeding the current RSLR by 31%–58%, and maintaining habitat resilience under sub-critical sea-level rise thresholds (6.1 mm/yr) through biogeochemical feedback loops [6,40]. However, it is important to note that accelerated RSLR alters tidal hydroperiods and soil osmotic pressures, potentially triggering lateral mangrove habitat retreat [30].
Notably, the NLI, as a proxy for human activity, reveals the dual effects of urbanization: while coastal reclamation, marine engineering, and pollution induce habitat fragmentation, enhanced environmental governance and protective awareness facilitate in situ conservation. Concurrently, urban heat island effects elevate winter temperatures, ameliorating cold stress for mangrove growth [41]. The predominance of SST over MAT and MAP in driving kNDVI stems from its direct modulation of root respiratory enzyme activity, which governs the allocation of photosynthate to vertical growth structures [1,42]. Morphophysiological adaptations, such as leaf thickening and salt gland excretion, partially buffer against MAT/MAP fluctuations. Optimal SST ranges (24–28 °C) satisfy oxygen demands for organ maintenance and growth, thereby promoting belowground carbon allocation and aboveground biomass expansion [43]. Typhoon disturbances exhibit multi-scale impacts: although individual events cause transient kNDVI declines, storm-derived nutrient subsidies and canopy gap dynamics initiate 2–3-year compensatory growth cycles, as reflected in the TCF’s lower hierarchical weighting [44].
These findings advocate prioritizing precision management in mangrove conservation: (1) the implementation of RSLR-adaptive strategies combining targeted sediment replenishment (50–100 g/cm2/yr) with tidal creek restoration to enhance geomorphic resilience; (2) the integration of SST monitoring and ecological forecasting into coastal zoning; and (3) the leveraging of urbanization-induced warming to facilitate poleward mangrove migration through the selection of cold-tolerant species.

5. Conclusions

This study utilized long-term Landsat-derived kNDVI data (1986–2021) within the GEE platform to uncover the growth trajectories of mangrove ecosystems along China’s southeastern coast. By integrating trend analysis (Theil–Sen and Mann–Kendall), Hurst exponent modeling, and Deep Forest machine learning, we provided a comprehensive framework for assessing temporal persistence and identifying the dominant drivers of mangrove dynamics.
Over the past 36 years, China’s mangrove ecosystems have exhibited a dominant and statistically significant greening trend (kNDVI increase: 0.0072/yr), with 74.99% of the area showing improvement, despite localized degradation affecting 15.08% of the extent. This study reveals a persistent pattern of mangrove growth dynamics characterized by pronounced spatial heterogeneity and long-term ecological inertia.
Our analysis unequivocally identifies the synergistic interplay of oceanic and anthropogenic stressors as the primary driver of these dynamics. Consequently, these findings provide fundamental insights into the response mechanisms of coastal wetland vegetation under compounded pressures, offering a critical, data-driven foundation for adaptive coastal zone management, spatially targeted restoration strategies, and the effective implementation of blue carbon initiatives.
Future research must prioritize integrating key additional drivers (e.g., soil salinity gradients, tidal regime variations, and land-use change dynamics) to refine mechanistic understanding. Validating the transferability of the proposed analytical framework to other tropical and subtropical coastlines within the Indo-Pacific biogeographic realm is essential. Furthermore, enhancing the temporal resolution of both oceanographic and socioeconomic datasets is imperative to bolster the model’s explanatory power and predictive capability for projecting future mangrove trajectories under evolving environmental and anthropogenic scenarios.

Author Contributions

Conceptualization, Y.P. and Y.C.; methodology, Y.P. and Y.C.; software, Y.P. and M.H.; validation, Y.C.; formal analysis, Y.P.; investigation, M.H.; resources, Y.C.; data curation, Y.P. and M.H.; writing—original draft preparation, Y.P.; writing—review and editing, L.M., D.F. and W.Z.; visualization, M.H. and B.C.; supervision, Y.C.; project administration, Y.C.; funding acquisition, Y.C. All authors have read and agreed to the published version of the manuscript.

Funding

This research was funded by the Guangdong Ocean University Research Start-up Fund Project for Introduced Doctoral Talents (Project No. 060302112313).

Data Availability Statement

All data, models, or code generated or used during the study are available from the author by request (chenyanghyy@gdou.edu.cn).

Acknowledgments

I would like to express our respect and gratitude to the anonymous reviewers and editors for their professional comments and suggestions. I would also like to express my gratitude to Yang Chen for his invaluable guidance in the preparation of this paper.

Conflicts of Interest

The authors declare no conflicts of interest.

Appendix A

Figure A1. A continuous 30 m resolution annual kNDVI dataset spanning 1986–2021.
Forests 16 01143 g0a1aForests 16 01143 g0a1bForests 16 01143 g0a1cForests 16 01143 g0a1dForests 16 01143 g0a1e

References

  1. Atwood, T.B.; Connolly, R.M.; Almahasheer, H.; Carnell, P.E.; Duarte, C.M.; Ewers Lewis, C.J.; Irigoien, X.; Kelleway, J.J.; Lavery, P.S.; Macreadie, P.I. Global patterns in mangrove soil carbon stocks and losses. Nat. Clim. Change 2017, 7, 523–528. [Google Scholar] [CrossRef]
  2. McKee, K.L.; Cahoon, D.R.; Feller, I.C. Caribbean mangroves adjust to rising sea level through biotic controls on change in soil elevation. Glob. Ecol. Biogeogr. 2007, 16, 545–556. [Google Scholar] [CrossRef]
  3. Jia, M.; Wang, Z.; Mao, D.; Ren, C.; Song, K.; Zhao, C.; Wang, C.; Xiao, X.; Wang, Y. Mapping global distribution of mangrove forests at 10-m resolution. Sci. Bull. 2023, 68, 1306–1316. [Google Scholar] [CrossRef] [PubMed]
  4. Sandilyan, S.; Kathiresan, K. Mangrove conservation: A global perspective. Biodivers. Conserv. 2012, 21, 3523–3542. [Google Scholar] [CrossRef]
  5. Ruan, L.; Yan, M.; Zhang, L.; Fan, X.; Yang, H. Spatial-temporal NDVI pattern of global mangroves: A growing trend during 2000–2018. Sci. Total Environ. 2022, 844, 157075. [Google Scholar] [CrossRef] [PubMed]
  6. van Bijsterveldt, C.E.; Herman, P.M.; van Wesenbeeck, B.K.; Ramadhani, S.; Heuts, T.S.; van Starrenburg, C.; Tas, S.A.; Triyanti, A.; Helmi, M.; Tonneijck, F.H. Subsidence reveals potential impacts of future sea level rise on inhabited mangrove coasts. Nat. Sustain. 2023, 6, 1565–1577. [Google Scholar] [CrossRef]
  7. Valiela, I.; Bowen, J.L.; York, J.K. Mangrove Forests: One of the World’s Threatened Major Tropical Environments: At least 35% of the area of mangrove forests has been lost in the past two decades, losses that exceed those for tropical rain forests and coral reefs, two other well-known threatened environments. Bioscience 2001, 51, 807–815. [Google Scholar]
  8. Duke, N.C.; Meynecke, J.-O.; Dittmann, S.; Ellison, A.M.; Anger, K.; Berger, U.; Cannicci, S.; Diele, K.; Ewel, K.C.; Field, C.D. A world without mangroves? Science 2007, 317, 41–42. [Google Scholar] [CrossRef]
  9. Hu, L.; Li, W.; Xu, B. Monitoring mangrove forest change in China from 1990 to 2015 using Landsat-derived spectral-temporal variability metrics. Int. J. Appl. Earth Obs. Geoinf. 2018, 73, 88–98. [Google Scholar] [CrossRef]
  10. Alatorre, L.C.; Sánchez-Carrillo, S.; Miramontes-Beltrán, S.; Medina, R.J.; Torres-Olave, M.E.; Bravo, L.C.; Wiebe, L.C.; Granados, A.; Adams, D.K.; Sánchez, E. Temporal changes of NDVI for qualitative environmental assessment of mangroves: Shrimp farming impact on the health decline of the arid mangroves in the Gulf of California (1990–2010). J. Arid Environ. 2016, 125, 98–109. [Google Scholar] [CrossRef]
  11. Nepita-Villanueva, M.R.; Berlanga-Robles, C.A.; Ruiz-Luna, A.; Morales Barcenas, J.H. Spatio-temporal mangrove canopy variation (2001–2016) assessed using the MODIS enhanced vegetation index (EVI). J. Coast. Conserv. 2019, 23, 589–597. [Google Scholar] [CrossRef]
  12. Pham, L.T.; Brabyn, L. Monitoring mangrove biomass change in Vietnam using SPOT images and an object-based approach combined with machine learning algorithms. ISPRS J. Photogramm. Remote Sens. 2017, 128, 86–97. [Google Scholar] [CrossRef]
  13. Zhang, R.; Jia, M.; Wang, Z.; Zhou, Y.; Mao, D.; Ren, C.; Zhao, C.; Liu, X. Tracking annual dynamics of mangrove forests in mangrove National Nature Reserves of China based on time series Sentinel-2 imagery during 2016–2020. Int. J. Appl. Earth Obs. Geoinf. 2022, 112, 102918. [Google Scholar] [CrossRef]
  14. Wulder, M.A.; Loveland, T.R.; Roy, D.P.; Crawford, C.J.; Masek, J.G.; Woodcock, C.E.; Allen, R.G.; Anderson, M.C.; Belward, A.S.; Cohen, W.B. Current status of Landsat program, science, and applications. Remote Sens. Environ. 2019, 225, 127–147. [Google Scholar] [CrossRef]
  15. Yang, J.; Yan, D.; Yu, Z.; Wu, Z.; Wang, H.; Liu, W.; Liu, S.; Yuan, Z. NDVI variations of different terrestrial ecosystems and their response to major driving factors on two side regions of the Hu-Line. Ecol. Indic. 2024, 159, 111667. [Google Scholar] [CrossRef]
  16. Rouse, J.W., Jr.; Haas, R.H.; Deering, D.; Schell, J.; Harlan, J.C. Monitoring the Vernal Advancement and Retrogradation (Green Wave Effect) of Natural Vegetation; NASA: Washington, DC, USA, 1974.
  17. Camps-Valls, G.; Campos-Taberner, M.; Moreno-Martínez, Á.; Walther, S.; Duveiller, G.; Cescatti, A.; Mahecha, M.D.; Muñoz-Marí, J.; García-Haro, F.J.; Guanter, L. A unified vegetation index for quantifying the terrestrial biosphere. Sci. Adv. 2021, 7, eabc7447. [Google Scholar] [CrossRef]
  18. Huete, A.; Liu, H.; Batchily, K.; Van Leeuwen, W. A comparison of vegetation indices over a global set of TM images for EOS-MODIS. Remote Sens. Environ. 1997, 59, 440–451. [Google Scholar] [CrossRef]
  19. Huete, A.R. A soil-adjusted vegetation index (SAVI). Remote Sens. Environ. 1988, 25, 295–309. [Google Scholar] [CrossRef]
  20. Wannasiri, W.; Nagai, M.; Honda, K.; Santitamnont, P.; Miphokasap, P. Extraction of Mangrove Biophysical Parameters Using Airborne LiDAR. Remote Sens. 2013, 5, 1787–1808. [Google Scholar] [CrossRef]
  21. Wang, Q.; Moreno-Martínez, Á.; Muñoz-Marí, J.; Campos-Taberner, M.; Camps-Valls, G. Estimation of vegetation traits with kernel NDVI. ISPRS J. Photogramm. Remote Sens. 2023, 195, 408–417. [Google Scholar] [CrossRef]
  22. Friess, D.A.; Rogers, K.; Lovelock, C.E.; Krauss, K.W.; Hamilton, S.E.; Lee, S.Y.; Lucas, R.; Primavera, J.; Rajkaran, A.; Shi, S. The State of the World’s Mangrove Forests: Past, Present, and Future. Annu. Rev. Environ. Resour. 2019, 44, 89–115. [Google Scholar] [CrossRef]
  23. Zhou, Z.-H.; Feng, J. Deep forest. Natl. Sci. Rev. 2018, 6, 74–86. [Google Scholar] [CrossRef]
  24. Narváez Salcedo, S. Spatial and Temporal Trend of EVI in Mangrove Forests of Coastal Lagoons in the Colombian Caribbean. Bachelor’s Thesis, Universidad del Norte, Barranquilla, Colombia, 2022. [Google Scholar]
  25. Wang, Z.; Liu, K.; Cao, J.; Peng, L.; Wen, X. Annual change analysis of mangrove forests in China during 1986–2021 based on Google Earth engine. Forests 2022, 13, 1489. [Google Scholar] [CrossRef]
  26. Samanta, S.; Hazra, S.; Mondal, P.P.; Chanda, A.; Giri, S.; French, J.R.; Nicholls, R.J. Assessment and attribution of mangrove Forest changes in the Indian Sundarbans from 2000 to 2020. Remote Sens. 2021, 13, 4957. [Google Scholar] [CrossRef]
  27. Alongi, D.M. Mangrove forests: Resilience, protection from tsunamis, and responses to global climate change. Estuar. Coast. Shelf Sci. 2007, 76, 1–13. [Google Scholar] [CrossRef]
  28. Tomlinson, P.B. The Botany of Mangroves; Cambridge University Press: Cambridge, UK, 2016. [Google Scholar]
  29. Huang, F.; Tang, L.; Li, R. Analysis of Ecological Benefits of Mangrove Protection and RestorationMeasures in the Mainland of China in the Past 40 Years. Acta Sci. Nat. Univ. Pekin. 2023, 59, 813–822. [Google Scholar] [CrossRef]
  30. Krauss, K.W.; McKee, K.L.; Lovelock, C.E.; Cahoon, D.R.; Saintilan, N.; Reef, R.; Chen, L. How mangrove forests adjust to rising sea level. New Phytol. 2014, 202, 19–34. [Google Scholar] [CrossRef]
  31. Kendall, M.G. Rank Correlation Methods; Griffin: Santa Barbara, CA, USA, 1948. [Google Scholar]
  32. Mann, H.B. Nonparametric tests against trend. Econom. J. Econom. Soc. 1945, 13, 245–259. [Google Scholar] [CrossRef]
  33. Hurst, H.E. Long-term storage capacity of reservoirs. Trans. Am. Soc. Civ. Eng. 1951, 116, 770–799. [Google Scholar] [CrossRef]
  34. Zhong, X.; Li, J.; Wang, J.; Zhang, J.; Liu, L.; Ma, J. Linear and nonlinear characteristics of long-term NDVI using trend analysis: A case study of Lancang-Mekong River Basin. Remote Sens. 2022, 14, 6271. [Google Scholar] [CrossRef]
  35. Jiang, W.; Yuan, L.; Wang, W.; Cao, R.; Zhang, Y.; Shen, W. Spatio-temporal analysis of vegetation variation in the Yellow River Basin. Ecol. Indic. 2015, 51, 117–126. [Google Scholar] [CrossRef]
  36. Zhao, H.; Xu, X.; Tang, J.; Wang, Z.; Miao, C. Understanding the key factors and future trends of ecosystem service value to support the decision management in the cluster cities around the Yellow River floodplain area. Ecol. Indic. 2023, 154, 110544. [Google Scholar] [CrossRef]
  37. Al-huqail, A.A.; Islam, Z.; Al-Harbi, H.F. Mangroves trend and their impact on surface temperature in Al-Wajh Lagoon: A study aligned with Saudi Arabia’s vision 2030. Front. Environ. Sci. 2024, 12, 1439425. [Google Scholar] [CrossRef]
  38. Jia, M.; Wang, Z.; Mao, D.; Huang, C.; Lu, C. Spatial-temporal changes of China’s mangrove forests over the past 50years: An analysis towards the Sustainable Development Goals(SDGs). Chin. Sci. Bull. 2021, 66, 3886–3901. [Google Scholar] [CrossRef]
  39. Kirwan, M.L.; Murray, A.B. A coupled geomorphic and ecological model of tidal marsh evolution. Proc. Natl. Acad. Sci. USA 2007, 104, 6118–6122. [Google Scholar] [CrossRef]
  40. Saintilan, N.; Khan, N.; Ashe, E.; Kelleway, J.; Rogers, K.; Woodroffe, C.; Horton, B.P. Thresholds of mangrove survival under rapid sea level rise. Science 2020, 368, 1118–1121. [Google Scholar] [CrossRef]
  41. Wei, S.; Zhang, H.; Xu, Z.; Lin, G.; Lin, Y.; Liang, X.; Ling, J.; Wee, A.K.S.; Lin, H.; Zhou, Y. Coastal urbanization may indirectly positively impact growth of mangrove forests. Commun. Earth Environ. 2024, 5, 608. [Google Scholar] [CrossRef]
  42. Sharifian, S.; Kamrani, E.; Saeedi, H. Global biodiversity and biogeography of mangrove crabs: Temperature, the key driver of latitudinal gradients of species richness. J. Therm. Biol. 2020, 92, 102692. [Google Scholar] [CrossRef]
  43. Ovalle, A.; Rezende, C.; Lacerda, L.; Silva, C.A.R. Factors affecting the hydrochemistry of a mangrove tidal creek, Sepetiba Bay, Brazil. Estuar. Coast. Shelf Sci. 1990, 31, 639–650. [Google Scholar] [CrossRef]
  44. Gao, X.; Leung, F.; Wang, W. Assessing typhoon impacts on mangroves and post-typhoon recovery patterns to inform projects using mangroves as nature-based solutions. Glob. Ecol. Conserv. 2025, 61, e03667. [Google Scholar] [CrossRef]
Figure 1. Location of the study area and spatial distribution of the Landsat images used.
Forests 16 01143 g001
Figure 2. Flowchart for assessing mangrove forest growth dynamics and its drivers.
Forests 16 01143 g002
Figure 3. Driving factors time series diagram (with linear trend fitting), 1986–2021. (a) Mean Annual Precipitation; (b) Mean Annual Temperature; (c) Nighttime Light Index; (d) Mean Annual Sea Surface Temperature; (e) Rate of Relative Sea–level Rise; (f) Tropical Cyclone Frequency.
Forests 16 01143 g003
Figure 4. Annual average values (a), standard deviations of variation (b), and coefficients of variation (c) of mangrove kNDVI in the coastal zone of China, 1986–2021.
Forests 16 01143 g004
Figure 5. Proportion of area between kNDVI value intervals of mangrove forests in China, 1986–2021.
Forests 16 01143 g005
Figure 6. Interannual variation ((a), linear trend in red) and Mann–Kendall test ((b), significance thresholds in red) of the mangrove kNDVI dynamics in coastal China, 1986–2021.
Forests 16 01143 g006aForests 16 01143 g006b
Figure 7. Theil–Sen slope values (a), Mann–Kendall test values (b), and spatial classifications of trends significance (c) of mangrove kNDVI changes in the coastal zone of China, 1986–2021.
Forests 16 01143 g007
Figure 8. Hurst exponent (a), sustainability of changes (b), and future trends (c) of the mangrove kNDVI dynamics in the coastal zone of China, 1986–2021.
Forests 16 01143 g008
Figure 9. Ranking of importance scores of the influencing factors using the Deep forest model.
Forests 16 01143 g009
Table 1. Description of Landsat sequence data used in this study.
SatelliteOperational PeriodSensorSpatial Resolution (m)GEE Collection Identifier
Landsat-51984–2011TM30 mLANDSAT/LT05/C01/T1_SR/TOA
Landsat-71999–2021ETM+30 mLANDSAT_7/02/T1/TOA
Landsat-82013–2021OLI30, 15 mLANDSAT/LC08/C01/T1_TOA
Table 2. Summary of driving factors.
CategoryVariablesSpatial ResolutionUnitData Source
ClimaticMean Annual Precipitation (MAP)1 kmmmResources and Environmental Science and Data Center, Chinese Academy of SciencesAnnual
Mean Annual Temperature (MAT)1 km°CResources and Environmental Science and Data Center, Chinese Academy of SciencesAnnual
Mean Annual Sea Surface Temperature (MASST)°C1°–gridded Global Ocean Temperature and Heat Content Dataset
Marine Environmental DriversRate Of Relative Sea–Level Rise (RSLR)mm/yrNational Marine Science Data Center
Typhoon Frequency
Tropical Cyclone Frequency (TCF)CountChina Meteorological Administration (CMA)
AnthropogenicNighttime Light Index (NLI)1 kmResources and Environmental Science and Data Center, Chinese Academy of Sciences
Disclaimer/Publisher’s Note: The statements, opinions and data contained in all publications are solely those of the individual author(s) and contributor(s) and not of MDPI and/or the editor(s). MDPI and/or the editor(s) disclaim responsibility for any injury to people or property resulting from any ideas, methods, instructions or products referred to in the content.

