How Can Forestry Carbon Sink Projects Increase Farmers’ Willingness to Produce Forestry Carbon Sequestration?

Abstract
1. Introduction
1.1. Research Background
1.2. Development Background of the CCER Mechanism
1.3. Literature Review
2. Materials and Methods
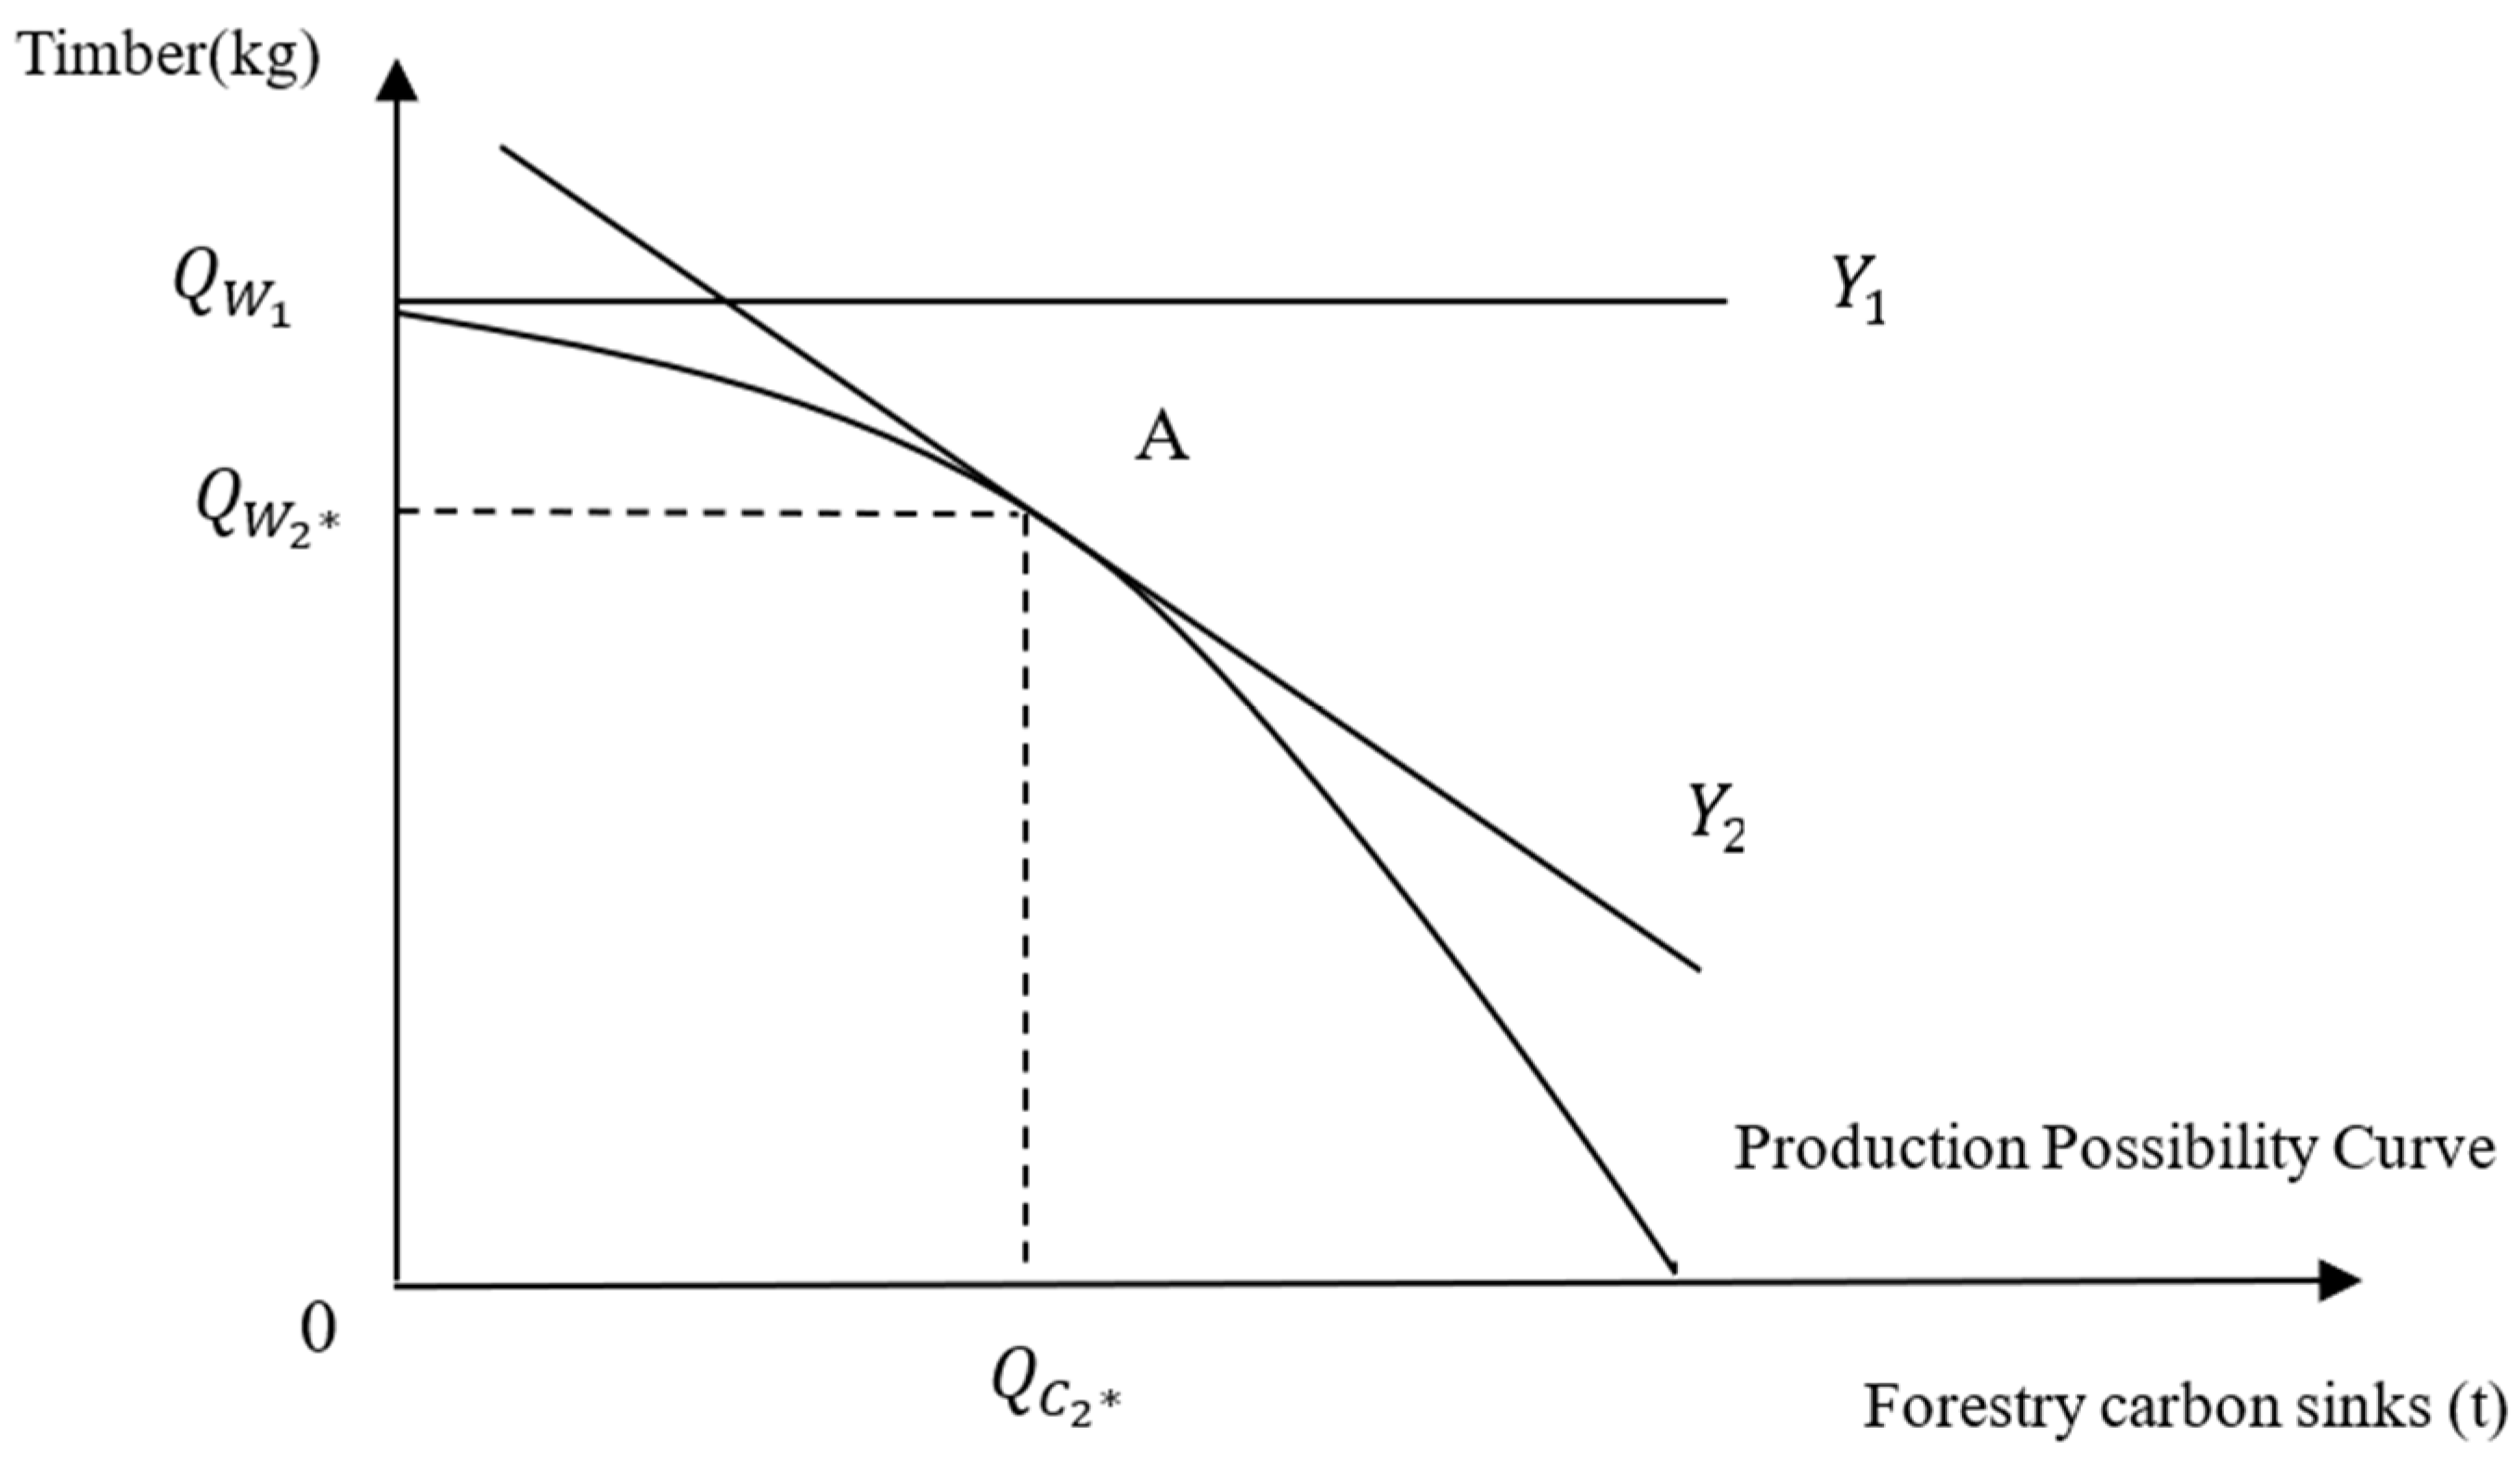
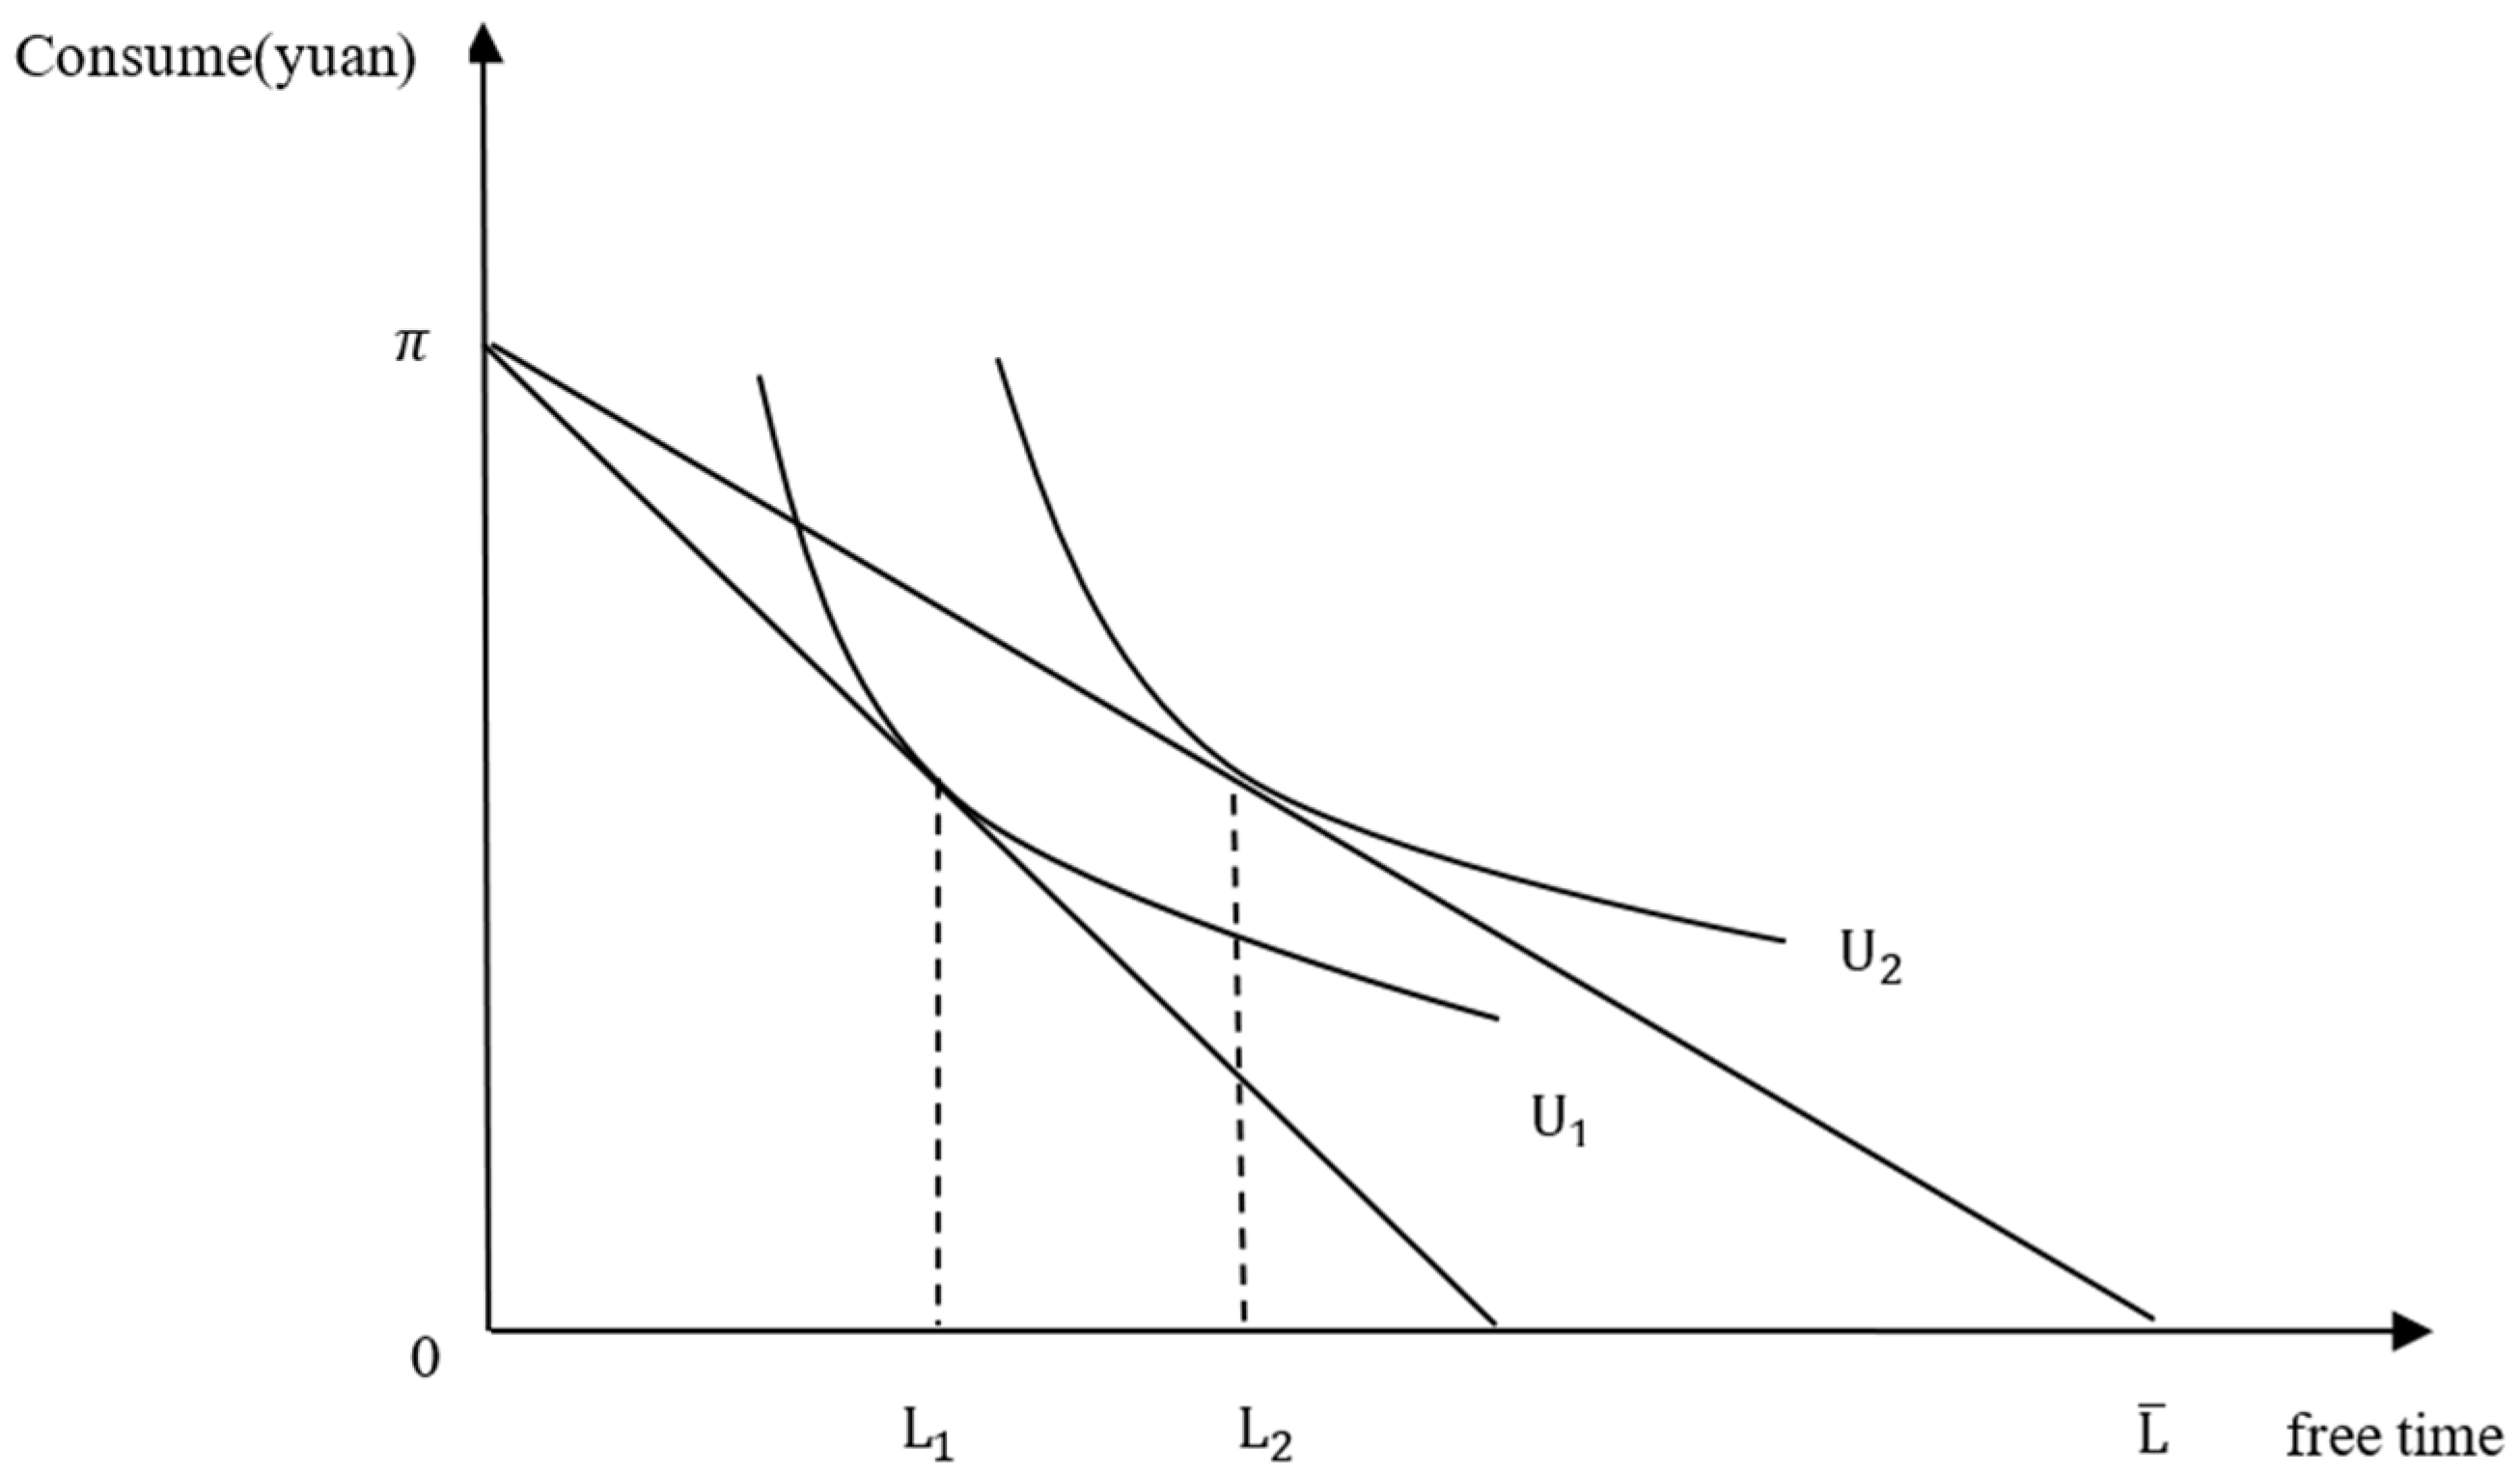
2.1. Theoretical Framework and Research Hypotheses
2.2. Site Selection and Data Sources
2.3. Empirical Model Specification
2.4. Variable Selection and Descriptive Statistics
3. Empirical Results
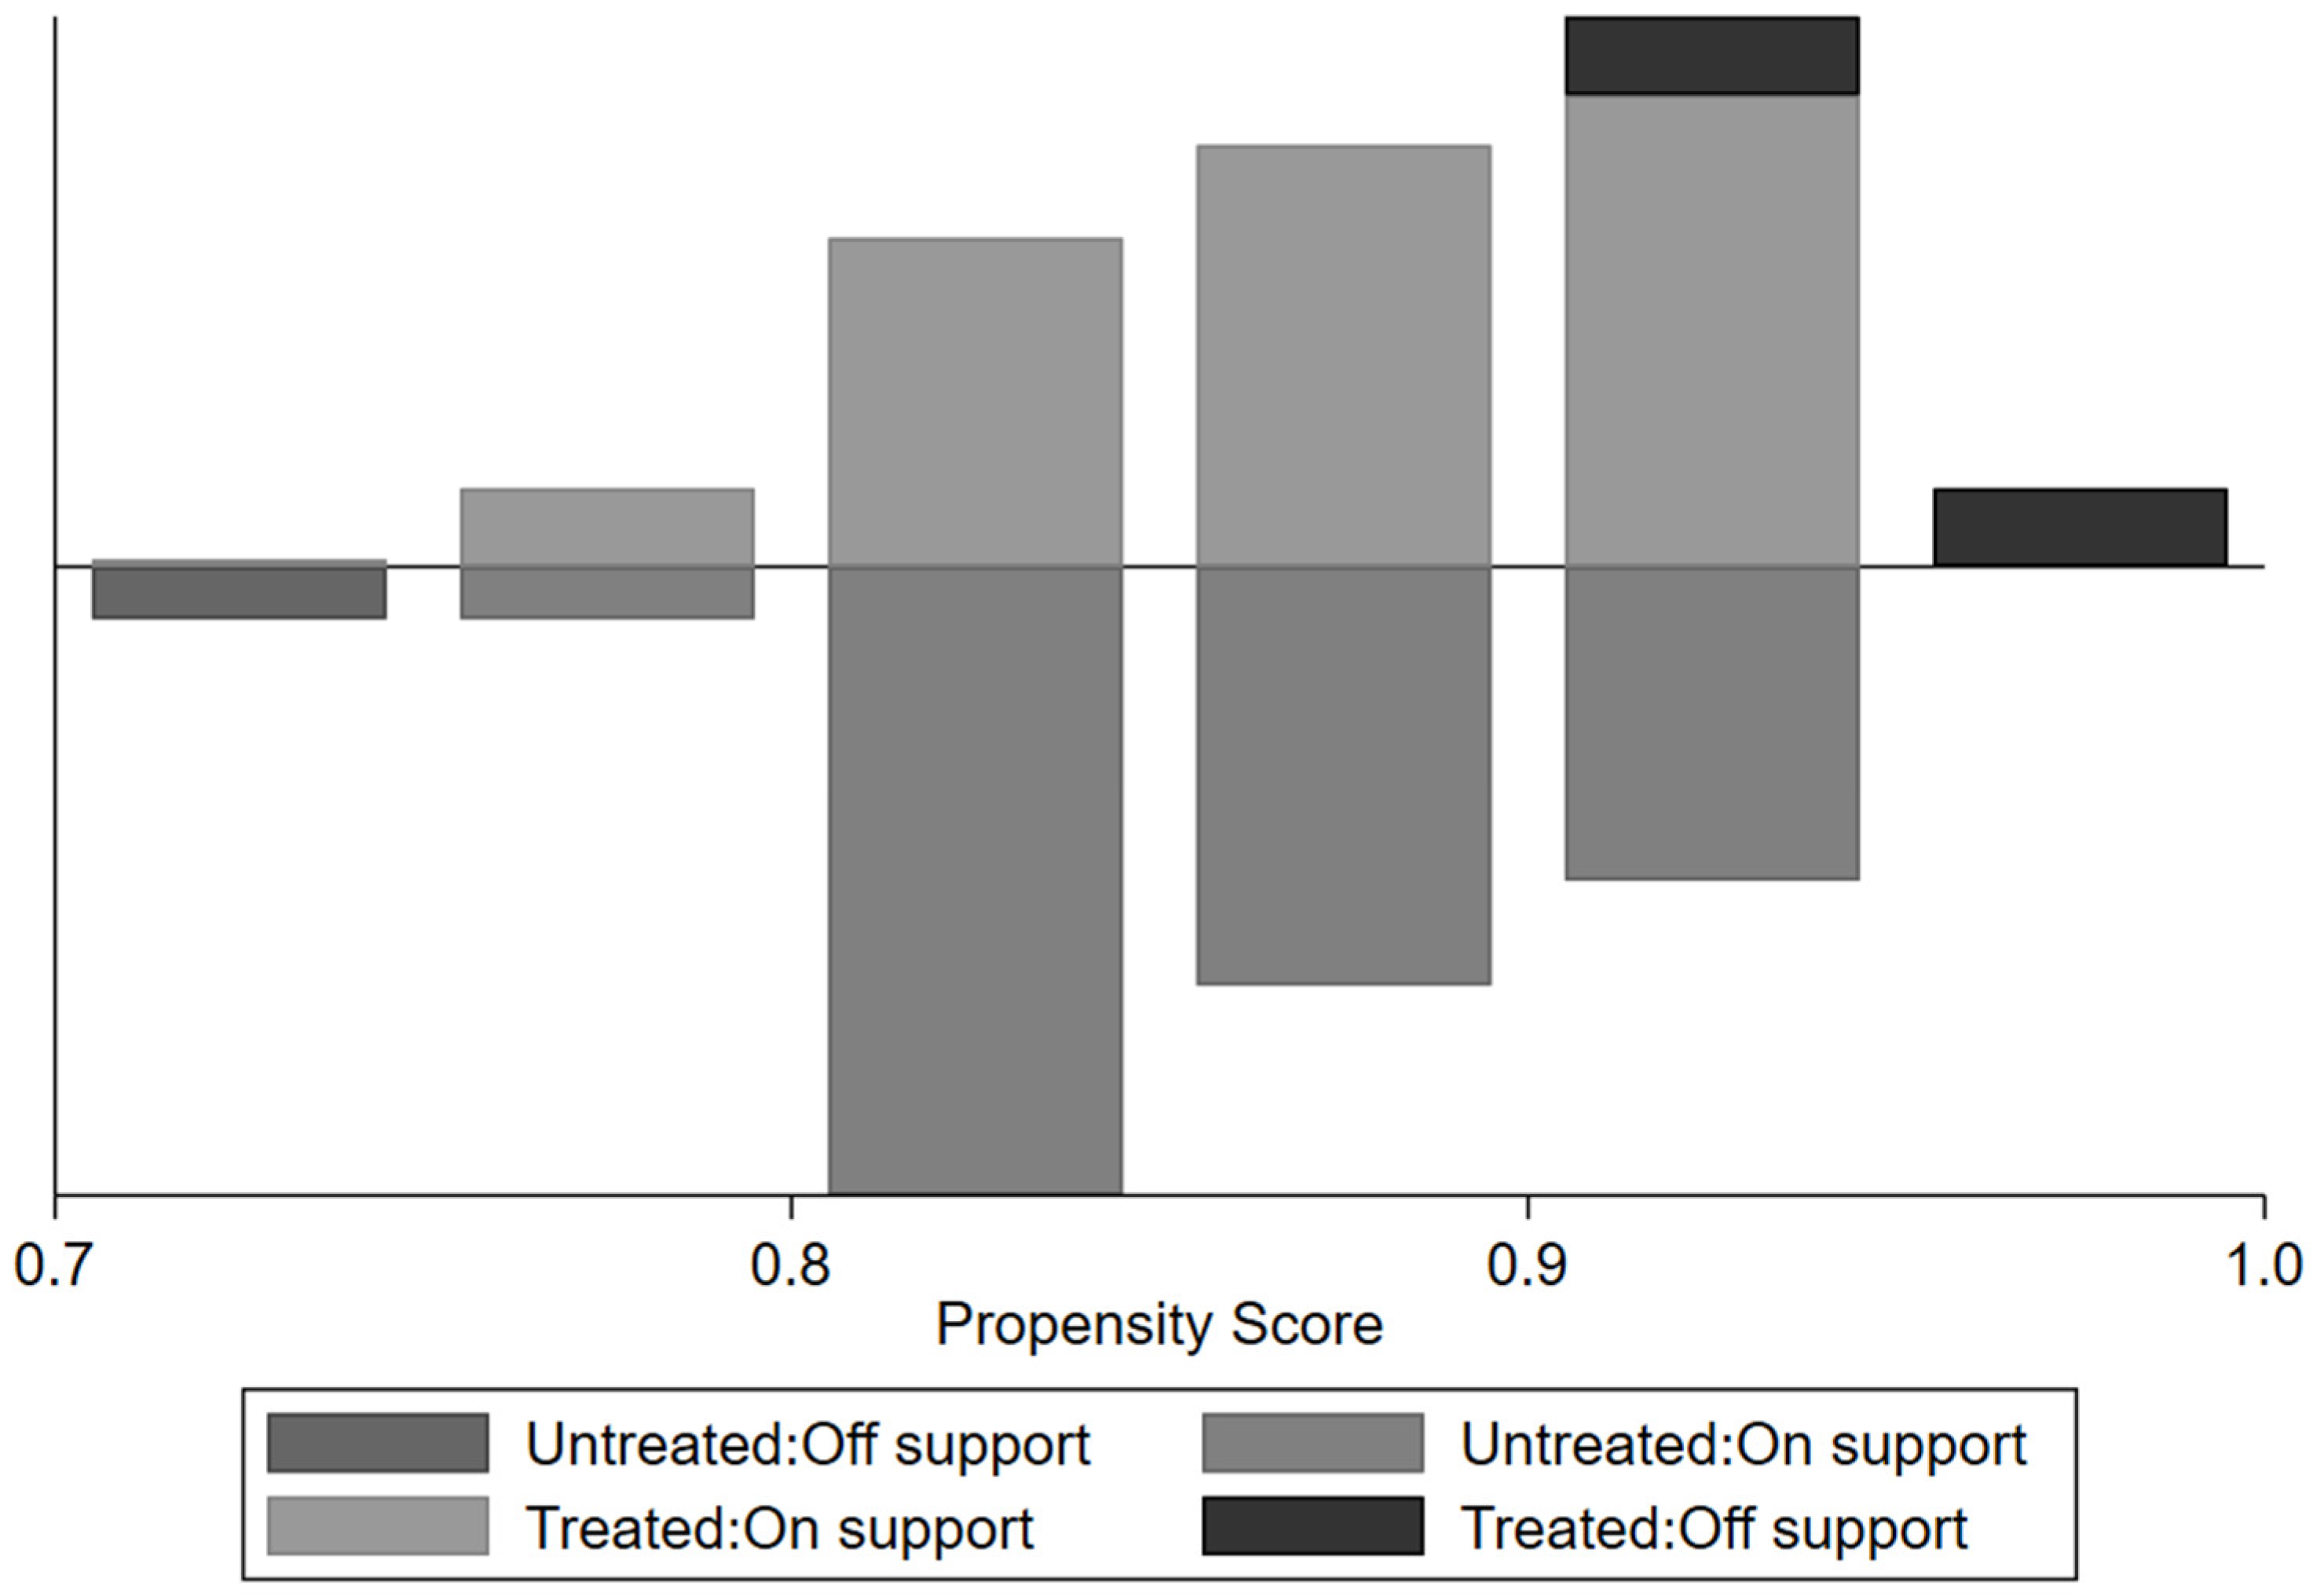
3.1. Propensity Score Matching
3.2. Impact of Participation in Forestry Carbon Sink Projects on Plot Management
3.3. Impact of Participation in Forestry Carbon Sink Projects on Net Forestry Income
3.4. Impact of Participation in Forestry Carbon Sink Projects on Non-Agricultural Net Income
3.5. Impact of Participating in Carbon Sink Projects on Net Income of Rural Households
3.6. Robustness Test
- (1)
- Change the matching method
- (2)
- Placebo test
4. Discussion
5. Conclusions
Author Contributions
Funding
Data Availability Statement
Conflicts of Interest
References
- Andrews, J.; Mulder, M.B. The value of failure: The effect of an expired REDD+ conservation program on residents’ willingness for future participation. Ecol. Econ. 2024, 220, 108155. [Google Scholar] [CrossRef]
- Liu, Z.; Zhang, X.; Wang, Y.; Chen, L. The key factors that influence farmers’ participating behavior in forest management plan formulation based on 1752 households in China. Forests 2025, 16, 73. [Google Scholar] [CrossRef]
- Hounkpati, K.; Moluh Njoya, H.; Adjonou, K.; Kokutse, A.D.; Glèlè Kakaï, R. Drivers affecting adoption of forest landscape restoration among smallholder farmers in Central Togo. Front. Sustain. Food Syst. 2024, 8, 1372951. [Google Scholar] [CrossRef]
- Uisso, A.J.; Chirwa, P.W.; Ackerman, P.A.; Käyhkö, N.; Elias, M. Do community perceptions of forest management and conservation vary across wealth groups? The case of the Kilosa REDD+ initiative in Tanzania. Hum. Ecol. 2023, 51, 251–263. [Google Scholar] [CrossRef]
- Gusti, M.; Di Fulvio, F.; Biber, P.; Korosuo, A.; Camia, A.; Ciaian, P.; Vis, M. The effect of alternative forest management models on the forest harvest and emissions as compared to the forest reference level. Forests 2020, 11, 794. [Google Scholar] [CrossRef]
- Thürig, E.; Kaufmann, E. Increasing carbon sinks through forest management: A model-based comparison for Switzerland with its Eastern Plateau and Eastern Alps. Eur. J. For. Res. 2010, 129, 563–572. [Google Scholar] [CrossRef]
- Assmuth, A.; Tahvonen, O. Optimal carbon storage in even- and uneven-aged forestry. For. Policy Econ. 2018, 87, 93–100. [Google Scholar] [CrossRef]
- Kadavý, J.; Kneifl, M.; Uherková, B. Comparison of selected structural elements of managed and unmanaged forest to guide integrated forest management. For. Ecol. Manag. 2025, 576, 122405. [Google Scholar] [CrossRef]
- Gu, L.; Wu, W.; Ji, W.; Zhou, M.; Xu, L.; Zhu, W. Evaluating the performance of bamboo forests managed for carbon sequestration and other co-benefits in Suichang and Anji, China. For. Policy Econ. 2019, 106, 101976. [Google Scholar] [CrossRef]
- Xu, J.; Liu, Y.; Zhang, W.; Chen, L.; Li, H. Bamboo Forests: Unleashing the Potential for Carbon Abatement and Local Income Improvements. Forests 2024, 15, 1907. [Google Scholar] [CrossRef]
- Yang, H.; Xi, L. Potential variation in opportunity cost estimates for REDD+ and its causes. For. Policy Econ. 2018, 95, 138–146. [Google Scholar] [CrossRef]
- Samuelson, P.A. Foundations of Economic Analysis; Harvard University Press: Cambridge, MA, USA, 1947. [Google Scholar]
- Chambers, R.G. Applied Production Analysis: A Dual Approach; Cambridge University Press: Cambridge, UK, 1988. [Google Scholar]
- Malan, M.; Carmenta, R.; Gsottbauer, E.; Milner-Gulland, E.J.; Ibrahim, F. Evaluating the impacts of a large-scale voluntary REDD+ project in Sierra Leone. Nat. Sustain. 2024, 7, 120–129. [Google Scholar] [CrossRef]
- Roongtawanreongsri, S.; Ho, T.Q.; Tran, P.H.N. Impact of payments for forest environmental services on households’ livelihood: A case study in the Central Highlands of Vietnam. Environ. Dev. Econ. 2022, 27, 1–22. [Google Scholar]
- Aggarwal, A.; Brockington, D. Reducing or creating poverty? Analyzing livelihood impacts of forest carbon projects with evidence from India. Land Use Policy 2020, 95, 104608. [Google Scholar] [CrossRef]
- Chowdhury, P.K.R.; Brown, D.G. Modeling the effects of carbon payments and forest owner cooperatives on carbon storage and revenue in Pacific Northwest forestlands. Land Use Policy 2023, 131, 106725. [Google Scholar] [CrossRef]
- Agbotui, D.K.; Ingold, M.; Wiehle, M.; Reinhard, S.; Asare, R.; Schultze-Kraft, R. Can carbon payments improve profitability of traditional conventional and organic cocoa agroforests? A case study in the Eastern Region of Ghana. Agrofor. Syst. 2023, 97, 813–831. [Google Scholar] [CrossRef]
- Nantongo, M.; Vatn, A.; Soka, G. REDD+: The perfect marriage between conservation and development? A comparative study of the impacts of REDD+ on livelihoods and deforestation in Tanzania. World Dev. 2024, 173, 106432. [Google Scholar] [CrossRef]
- Corbera, E.; Martin, A.; Springate-Baginski, O.; Villaseñor, A. Sowing the seeds of sustainable rural livelihoods? An assessment of Participatory Forest Management through REDD+ in Tanzania. Land Use Policy 2020, 97, 102962. [Google Scholar] [CrossRef]
- de Janvry, A.; Fafchamps, M.; Sadoulet, E. Peasant household behaviour with missing markets: Some paradoxes explained. Econ. J. 1991, 101, 1400–1417. [Google Scholar] [CrossRef]
- Becker, G.S. A theory of the allocation of time. Econ. J. 1965, 75, 493–517. [Google Scholar] [CrossRef]
- Faustmann, M. Calculation of the value which forest land and immature stands possess for forestry. In Economics of Forestry; Gane, M., Ed.; Routledge: Abingdon, UK, 2018; pp. 1–40. [Google Scholar]
- Köthke, M.; Dieter, M. Effects of carbon sequestration rewards on forest management—An empirical application of adjusted Faustmann formulae. For. Policy Econ. 2010, 12, 589–597. [Google Scholar] [CrossRef]
- Chong, L.; Yongjun, S.; Guomo, Z.; Yufeng, Z.; Lin, X.; Liang, T. Effects of different management approaches on soil carbon dynamics in Moso bamboo forest ecosystems. Catena 2018, 169, 59–68. [Google Scholar]
- Liu, C.; Zhang, H. The course, effects, and evolution of the reform of collective forest rights system: 2002–2022. Reform 2023, 8, 140–155. (In Chinese) [Google Scholar]
- Zhang, H.; Zhou, Z.K.; Yang, H.Q.; Liu, C. The impact of increased labor costs on farmers’ input structure of forestland management: An analysis from the perspective of supply constraints of forestry socialized services. Chin. Rural Econ. 2022, 4, 106–125. (In Chinese) [Google Scholar]
- Ge, J.; Zhang, Z.; Lin, B. Towards carbon neutrality: How much do forest carbon sinks cost in China? Environ. Impact Assess. Rev. 2023, 99, 107010. [Google Scholar] [CrossRef]
- Chen, S.; Jiang, H.; Cai, Z.; Zhou, X.; Peng, C. The response of the net primary production of Moso bamboo forest to the on- and off-year management: A case study in Anji County, Zhejiang, China. For. Ecol. Manag. 2018, 409, 1–7. [Google Scholar] [CrossRef]
- Cheng, Y.M.; Liu, Q.; Pan, J.L. Cost-benefit analysis of different types of bamboo forest carbon sequestration projects. J. Zhejiang Agric. Sci. 2021, 2, 421–424, 431. (In Chinese) [Google Scholar]
- Heckman, J.J.; Ichimura, H.; Todd, P.E. Matching as an econometric evaluation estimator: Evidence from evaluating a job training programme. Rev. Econ. Stud. 1997, 64, 605–654. [Google Scholar] [CrossRef]
- Angrist, J.D.; Pischke, J.S. Mostly Harmless Econometrics: An Empiricist’s Companion; Princeton University Press: Princeton, NJ, USA, 2009. [Google Scholar]
- Garrett, R.D.; Koh, I.; Lambin, E.F.; Le, P.W.Y.; Kastens, J.H.; Brown, J.C. Intensification in agriculture–forest frontiers: Land use responses to development and conservation policies in Brazil. Glob. Environ. Change 2018, 53, 233–243. [Google Scholar] [CrossRef]
- Cuni Sanchez, A.; Twinomuhangi, I.; Aneseyee, A.B.; Mwangi, B.W.; Olaka, L.A.; Bitariho, R.; Soromessa, T.; Castro, B.; Zafra Calvo, N. Everyday adaptive practices by coffee farmers in three mountain regions in Africa. Ecol. Soc. 2022, 27, 31. [Google Scholar] [CrossRef]
- Cammarata, M.; Scuderi, A.; Timpanaro, G.; Cascone, G. Factors influencing farmers’ intention to participate in the voluntary carbon market: An extended theory of planned behavior. J. Environ. Manag. 2024, 369, 122367. [Google Scholar] [CrossRef] [PubMed]


| Sample Village | Forest Area | Per Capita Forest Area | Per Capita Net Income | Proportion of Rural Households Mainly Engaged in Forestry Operations in Total Households | Sample Size |
|---|---|---|---|---|---|
| ZYL Village | 563.87 | 2.33 | 15,000 | 38.0% | 45 |
| Yan Village | 616.77 | 1.86 | 21,000 | 58.7% | 73 |
| Lf Village | 347.02 | 0.84 | 21,500 | 50.8% | 69 |
| ZKK Village | 340.33 | 1.32 | 26,000 | 27.0% | 46 |
| Total | 1867.99 | - | - | - | 233 |
| Variable Type | Variable Name | Variable Declaration | Mean Value | Standard Deviation |
|---|---|---|---|---|
| Explained variable | Net forestry income | Forestry Net Income = Total Forestry Income − Forestry Production Expenditures | 6785 | 15,277.34 |
| Non-agricultural net income | Non-agricultural net income = Non-agricultural − Non-agricultural Expenditures | 48,737 | 55,025.17 | |
| Net income of rural households | Rural Household Net Income = Total Rural Household Income − Household Operating Expenses − Human Costs-Other Expenses. | 60,875 | 101,840.1 | |
| Average input per hectare of forest land | Farmers’ input to forest land = (Total number of workers × labor price of different plots + capital input)/land area | 23.22 | 338.76 | |
| Average profit per hectare of forest land | Average profit per hectare of forest land = average income per hectare of forest land − average input per hectare of forest land | 10.62 | 401.76 | |
| Key explanatory variables | Participation of farmers in forestry carbon sink projects | policyit × yearit interaction item, the 2023 data of the experimental group is 1, and the rest is 0 | 0.44 | 0.50 |
| Control variables | Plot area | The area of the largest forest land plots | 1.04 | 28.52 |
| Height of forest land | The height of the largest forest land: low = 0, medium = 1, high = 2 | 2.05 | 0.82 | |
| Slope of forest land | Slope of the largest forest plots: flat = 0, gentle = 1, steep = 2 | 2.33 | 0.72 | |
| Soil fertility | Soil fertility of the largest forest plots: poor = 0, medium = 1, good = 2 | 2.39 | 0.72 | |
| Age of head of household | Age of head of household | 66 | 9.42 | |
| Human favor expenditure | Total household human expenditure | 9336 | 7758.43 | |
| Village collective financial income | Research village collective financial income | 452,600 | 12.32 |
| Variable | Survey Question | Response Options | Percentage (%) |
|---|---|---|---|
| Participation | Through what channel did you learn about the forest carbon sink project? | (1) Promotion by village cadres; (2) Friends and relatives; (3) Internet, TV, etc.; (4) Enterprises operating carbon sink projects; (5) Others, please specify | (1) 100%; (2) 0%; (3) 0%; (4) 0%; (5) 0% |
| What is your mode of participation in the carbon sink forest project? | (1) Self-management; (2) Leasing forestland to the project; (3) Working for the project; (4) Others, please specify | (1) 100%; (2) 0%; (3) 0%; (4) 0% | |
| Changes in Management | Have you changed your forest management practices? | Yes/No | Yes: 87.98%/No: 12.02% |
| Compared to non-carbon sink forests, how has the profitability of carbon sink forests changed? | (1) Profit increased; (2) Profit decreased; (3) No change | (1) 37%; (2) 36%; (3) 27% | |
| Input Adjustments | Compared to non-carbon sink forests, how has the use of fertilizer changed? | (1) Increased; (2) Decreased | (1) 76%; (2) 24% |
| Compared to non-carbon sink forests, how has labor input changed? | (1) Increased; (2) Decreased | (1) 17%; (2) 83% | |
| Output Changes | Compared to non-carbon sink forests, how has the output (e.g., volume of timber) changed? | (1) Increased; (2) Decreased | (1) 43%; (2) 57% |
| Future Participation Willingness | What factors influence your willingness to participate in future forest carbon sink projects? Please rank the following. | (1) The forest designated as carbon sink is commercial forest; (2) Higher technical requirements and supervision than non-carbon forests; (3) High operating cost; (4) Long operating cycle; (5) Difficult to obtain carbon revenue; (6) Uncertain prospects of carbon sink forestry | The proportion of respondents who ranked each item as the most important factor: (1) 12%; (2) 17%; (3) 23%; (4) 27%; (5) 15%; (6) 6% |
| Number of Plots | Average Plot Area | Average Labor Input per Hectare of Forest Land | Average Capital Input per Hectare of Forest Land | Average Input per Hectare of Forest Land | Average Income per Hectare of Forest Land | Average Profit per Hectare of Forest Land | Species of Trees | ||||||
|---|---|---|---|---|---|---|---|---|---|---|---|---|---|
| Pre-project | Post-project | Pre-project | Post-project | Pre-project | Post-project | Pre-project | Post-project | Pre-project | Post-project | Moso bamboo | |||
| Experimental group | 205 | 1.07 | 5641.65 | 2151.60 | 847.65 | 91.50 | 6489.30 | 2242.95 | 8299.95 | 4734 | 1810.50 | 2491.5 | |
| Control group | 28 | 0.89 | 6748.35 | 6559.80 | 1130.10 | 1024.80 | 7878.60 | 7585.50 | 11,109.45 | 10,114.65 | 3231 | 2529.15 | |
| Grand mean | 233 | - | 5774.70 | 3469.65 | 881.55 | 327 | 6656.25 | 3796.50 | 8637.60 | 6596.10 | 1981.50 | 2799 | - |
| Sample Household | Average Net Forestry Income | Average Non-Agricultural Net Income | Average Net Income of Rural Households | ||||
|---|---|---|---|---|---|---|---|
| Pre-Project | Post-Project | Pre-Project | Post-Project | Pre-Project | Post-Project | ||
| Experimental group | 205 | 7249 | 6569 | 49,550 | 52,620 | 58,666 | 68,286 |
| Control group | 28 | 5818 | 5940 | 33,109 | 29,983 | 42,745 | 40,921 |
| Grand mean | 233 | 7077 | 6494 | 47,574 | 49,900 | 56,753 | 64,998 |
| Variable | Type | Mean Value | Standardization Deviation | Variation of Standardization Deviation | T-Value | |
|---|---|---|---|---|---|---|
| Experimental Group | Control Group | |||||
| Plot area | Before matchmaking | 16.0 | 13.3 | 12.3 | 93.1 | 0.47 |
| After matchmaking | 12.6 | 12.8 | −0.8 | −0.14 | ||
| Height of forest land | Before matchmaking | 2.03 | 2.14 | −12.5 | 28.0 | −0.66 |
| After matchmaking | 2.09 | 2.17 | −9.0 | −0.86 | ||
| Slope of forest land | Before matchmaking | 2.32 | 2.39 | −9.8 | 17.8 | −0.49 |
| After matchmaking | 2.36 | 2.41 | −8.0 | −0.79 | ||
| Soil fertility | Before matchmaking | 2.38 | 2.43 | −7.0 | −21.2 | −0.33 |
| After matchmaking | 2.40 | 2.35 | 8.5 | 0.83 | ||
| Age of head of household | Before matchmaking | 65.2 | 66.5 | −13.2 | −40.3 | −0.69 |
| After matchmaking | 65.7 | 63.7 | 18.6 | 1.66 * | ||
| Human favor expenditure | Before matchmaking | 8962.0 | 8137.5 | 15.5 | 96.6 | 0.62 |
| After matchmaking | 8464.2 | 8436.2 | 0.5 | 0.05 | ||
| Village collective financial income | Before matchmaking | 45.7 | 41.2 | 38.7 | 90.2 | 1.78 * |
| After matchmaking | 43.8 | 43.4 | 3.8 | 0.37 | ||
| Type | Pseudo R2 | LR Statistic | p-Value |
|---|---|---|---|
| Before matchmaking | 0.033 | 5.70 | 0.575 |
| After matchmaking | 0.01 | 4.94 | 0.667 |
| Average Input per Hectare of Forest Land | Average Profit per Hectare of Forest Land | |||
|---|---|---|---|---|
| (1) | (2) | (3) | (4) | |
| Participation of farmers in forestry carbon sink projects | −4083.6 *** (−5.11) | −3840 *** (−4.28) | 1306.5 (1.23) | 1298.7 (1.09) |
| Control variable | Out of control | Controlled | Out of control | Controlled |
| Constant | 6843.2 *** | 76,539.9 *** | 2031.6 | 88,857.8 |
| (36.15) | (0.71) | (8.05) | (−0.62) | |
| Individual effect | Controlled | Controlled | Controlled | Controlled |
| Time effect | Controlled | Controlled | Controlled | Controlled |
| Net Forestry Income | PSM-DID | |
|---|---|---|
| (1) | (2) | |
| Whether farmers participate in forestry carbon sequestration projects | −939.07 | −2856.87 |
| (−0.57) | (−1.58) | |
| Control variables | Out of control | Controlled |
| Constant | 6534.55 *** | −221,954.90 |
| (16.85) | (−1.02) | |
| Individual effect | Controlled | Controlled |
| Time effect | Controlled | Controlled |
| Non-Agricultural Net Income | PSM-DID | |
|---|---|---|
| (1) | (2) | |
| Whether farmers participate in forestry carbon sequestration projects | 6781.35 *** | 6761.03 *** |
| (4.01) | (2.17) | |
| Control variables | Out of control | Controlled |
| Constant | 45,500.03 *** | 483,281.20 ** |
| (113.66) | (2.26) | |
| Individual effect | Controlled | Controlled |
| Time effect | Controlled | Controlled |
| Net Income of Rural Households | PSM-DID | |
|---|---|---|
| (1) | (2) | |
| Whether farmers participate in forestry carbon sequestration projects | 4099.27 ** | 3849.34 ** |
| (2.17) | (1.82) | |
| Control variables | Out of control | Controlled |
| Constant | 53,692.29 *** | 30,7164.3 |
| (119.85) | (1.21) | |
| Individual effect | Controlled | Controlled |
| Time effect | Controlled | Controlled |
| Caliper Matching | Nuclear Matching | |||
|---|---|---|---|---|
| Together Support the Test Results of the Hypothesis | Match Failure | Match Successfully | Match Failure | Match Successfully |
| Control group | 1 | 27 | 1 | 27 |
| Experimental group | 29 | 176 | 25 | 180 |
| Total | 30 | 203 | 26 | 207 |
| Balance test results | There were no significant variables after matching, and the absolute value of the standardization deviation of all variables after matching was less than 20% | None of the variables were significant before matching, and the absolute value of the standardization deviation of all variables was less than 20% after matching | ||
| Matching Method | Average Input per Hectare of Forest Land | Average Profit per Hectare of Forest Land | Net Forestry Income | Non-Agricultural Net Income | Net Income of Rural Households |
|---|---|---|---|---|---|
| Caliper matching | −3959.10 *** (−4.44) | 1351.95 (0.26) | −2929.34 (−1.60) | 6834.02 ** (3.77) | 3960.60 ** (1.86) |
| Nuclear matching | −11,249.25 *** (−10.63) | 168.15 (0.12) | −2701.24 (−1.51) | 6828.04 *** (3.82) | 4066.69 ** (1.95) |
| Individual effect | Controlled | Controlled | Controlled | Controlled | Controlled |
| Time effect | Controlled | Controlled | Controlled | Controlled | Controlled |
| Constant | Controlled | Controlled | Controlled | Controlled | Controlled |
| Research Hypothesis (H) | Method (S) | Empirical Results (RC) | Conclusions (A) |
|---|---|---|---|
| H1: The participation of farmers in forestry carbon sink projects can lead to a transformation in forest management practices, resulting in reduced production costs for forestry activities. | PSM-DID | RC1: At the 99% confidence level, compared to plots that do not adhere to the guidelines of forestry carbon sequestration projects, the average investment per hectare for carbon sequestration forest plots decreased significantly by CNY 3840, while the average profit per hectare remained largely unchanged. | H1 passed the test. A1: after participating in forestry carbon sequestration projects, farmers can modify their forest management practices and reduce land management costs. |
| H2: Subsidies for forestry carbon sink projects and forestry production costs saved by farmers can make up for the loss of timber income, so that the average profit per hectare of forest land and net forestry income will not change significantly. | RC2: Participation in forestry carbon sequestration projects has no significant impact on forestry net income. | H2 passed the test. A2: the subsidies received from forestry carbon sequestration projects, combined with the savings in forestry production costs, can compensate for the loss of timber income, ensuring that farmers’ net forestry income remains unaffected. | |
| H3: After participating in a forestry carbon sink project, farmers’ non-agricultural net income and farmers’ net income increased significantly. | RC3: Participation in forestry carbon sequestration projects has a significant positive impact on farmers’ non-agricultural net income and farmers’ net income, with confidence intervals of 99% and 95%, respectively. | H2 passed the test. A3: the conserved production resources can be redirected towards non-agricultural sectors, thereby enhancing non-agricultural income and ultimately increasing the net income of farmers involved in the forestry carbon sink initiative. |
Disclaimer/Publisher’s Note: The statements, opinions and data contained in all publications are solely those of the individual author(s) and contributor(s) and not of MDPI and/or the editor(s). MDPI and/or the editor(s) disclaim responsibility for any injury to people or property resulting from any ideas, methods, instructions or products referred to in the content. |
© 2025 by the authors. Licensee MDPI, Basel, Switzerland. This article is an open access article distributed under the terms and conditions of the Creative Commons Attribution (CC BY) license (https://creativecommons.org/licenses/by/4.0/).
Share and Cite
Hou, Y.; He, A.; Zhang, H.; Hu, C.; Li, Y. How Can Forestry Carbon Sink Projects Increase Farmers’ Willingness to Produce Forestry Carbon Sequestration? Forests 2025, 16, 1135. https://doi.org/10.3390/f16071135
Hou Y, He A, Zhang H, Hu C, Li Y. How Can Forestry Carbon Sink Projects Increase Farmers’ Willingness to Produce Forestry Carbon Sequestration? Forests. 2025; 16(7):1135. https://doi.org/10.3390/f16071135
Chicago/Turabian StyleHou, Yi, Anni He, Hongxiao Zhang, Chen Hu, and Yunji Li. 2025. "How Can Forestry Carbon Sink Projects Increase Farmers’ Willingness to Produce Forestry Carbon Sequestration?" Forests 16, no. 7: 1135. https://doi.org/10.3390/f16071135
APA StyleHou, Y., He, A., Zhang, H., Hu, C., & Li, Y. (2025). How Can Forestry Carbon Sink Projects Increase Farmers’ Willingness to Produce Forestry Carbon Sequestration? Forests, 16(7), 1135. https://doi.org/10.3390/f16071135