Article

Allometric Growth and Carbon Sequestration of Young Kandelia obovata Plantations in a Constructed Urban Costal Wetland in Haicang Bay, Southeast China

1
Key Laboratory of Estuarine Ecological Security and Environmental Health, Education Department of Fujian, Tan Kah Kee College, Xiamen University, Zhangzhou 363105, China
2
State Key Laboratory of Marine Environmental Science, Xiamen University, Xiamen 361105, China
*
Author to whom correspondence should be addressed.
Forests 2025, 16(7), 1126; https://doi.org/10.3390/f16071126
Submission received: 25 May 2025 / Revised: 29 June 2025 / Accepted: 7 July 2025 / Published: 8 July 2025
(This article belongs to the Section Forest Ecology and Management)

Abstract

The focus of this study was on young populations of Kandelia obovata within a constructed coastal wetland in Haicang Bay, Xiamen, Southeast China. The objective was to systematically examine their allometric growth characteristics and carbon sequestration potential over an 8-year monitoring period (2016–2024). Allometric equations were developed to estimate biomass, and the spatiotemporal variation in both plant and soil carbon stocks was estimated. There was a significant increase in total biomass per tree, from 120 ± 17 g at initial planting to 4.37 ± 0.59 kg after 8 years (p < 0.001), with aboveground biomass accounting for the largest part (72.2% ± 7.3%). The power law equation with D2H as an independent variable yielded the highest predictive accuracy for total biomass (R2 = 0.957). Vegetation carbon storage exhibited an annual growth rate of 4.2 ± 0.8 Mg C·ha−1·yr−1. In contrast, sediment carbon stocks did not show a significant increase throughout the experimental period, although long-term accumulation was observed. The restoration of mangroves in urban coastal constructed wetlands is an effective measure to sequester carbon, achieving a carbon accumulation rate of 21.8 Mg CO2eq·ha−1·yr−1. This rate surpasses that of traditional restoration methods, underscoring the pivotal role of interventions in augmenting blue carbon sinks. This study provides essential parameters for allometric modeling and carbon accounting in urban mangrove afforestation strategies, facilitating optimized restoration management and low-carbon strategies.

1. Introduction

Human-induced climate change is a critical and complex environmental issue [1,2]. The substantial increase in greenhouse gas emissions, notably carbon dioxide (CO2), since the mid-20th century has largely contributed to the unparalleled warming and heightened volatility of the climate system witnessed in the last five decades [3,4]. The adverse effects of climate change-induced extreme weather events are already evident and are projected to have dramatic effects on both human habitats and ecological systems [5,6]. To mitigate these risks, the global community must expedite the enforcement and implementation of agreements and plans aimed at reducing greenhouse gas emissions [7,8]. China, which is still the country with the highest annual CO2 emissions globally [9], must implement more proactive measures to attain its goal of carbon neutrality [10]. Currently, the main strategies for attaining carbon neutrality involve the reduction in CO2 emissions and the enhancement in CO2 sequestration [11,12]. In this regard, natural carbon sinks play crucial roles [13,14,15].
Mangrove systems, although they only account for approximately 0.5% of all global coastal ecosystems, play a substantial role in carbon sequestration [16,17] and account for approximately 10% to 15% of global coastal carbon sequestration [18]. In view of this, the conservation and restoration of mangroves are potential measures for climate change mitigation [19]. The carbon pool of mangrove systems consists of plant and soil carbon, with primary productivity levels comparable to those of tropical forests [20,21]. Throughout the growing season, mangrove systems have the capacity to absorb 1000 kg·ha−1 of CO2 daily [22]. Recent studies have shown that the amount of aboveground carbon stored by mangroves and other coastal ecosystems is equivalent to that of carbon-dense terrestrial ecosystems such as tropical and subtropical forests [23,24,25]. Moreover, the highest documented organic carbon stock in mangroves (692.8 ± 23.1 Mg C·ha−1) [26] surpasses that found in tropical rainforests (241 Mg C·ha−1) [27]. Positioned in the intertidal zone, mangroves receive organic carbon from both the sea and the land [28]. Decomposing mangrove litter and roots are significant sources of soil organic carbon and facilitate the sequestration of particulate carbon from tidal waters [18,29]. The anoxic conditions in such systems, resulting from extended tidal inundation, impede the breakdown of organic carbon, such as mangrove litter [22]. Consequently, specific microorganisms can use hydrogen sulfide in the reduction of CO2 to organic carbon [19], thereby facilitating soil carbon retention [18,30]. In mangroves, approximately 49% to 98% of carbon is stored in the soil, making the soil carbon pool the primary component of mangrove carbon storage [31].
The average global carbon stock in mangrove systems is 450.6 Mg·ha−1, ranging from 272 to 703 Mg·ha−1, with most of the carbon occurring as sediment and biomass carbon [32]. With mangroves demonstrating an average annual carbon sequestration rate of 194 ± 15 g C·m−2·yr−1 [19], the restoration of mangrove ecosystems is a viable strategy for mitigating carbon emissions [33,34]. For example, the conversion of the Yandina Wetlands in the Maroochy River watershed of Queensland, Australia, from sugarcane plantations to mangrove forests resulted in a carbon emission reduction of 11.0 Mg CO2eq·ha−1·yr−1 [35]. Likewise, the restoration of mangroves on Tanakeke Island, Indonesia, in abandoned aquaculture ponds, led to a decrease in greenhouse gas emissions of 17.9 ± 1.5 Mg CO2eq·ha−1·yr−1 [36]. The Indonesian government strongly emphasizes the protection and restoration of mangroves as a key component of its national agenda to effectively manage such ecosystems and comply with national climate commitments [37]. Similarly, China has outlined an agenda to establish and restore 18,800 hectares of mangroves by 2025 [38]. Notably, the carbon stocks resulting from mangrove afforestation, restoration, and forest management can be used in carbon markets as forestry carbon sink projects, with both ecological and economic advantages. For instance, the carbon trading value of 323 hectares of healthy mangrove stands in Kuala Selangor Nature Park, Malaysia, is within the range of USD 5389.83–17,229.59 per hectare [39]. China’s inaugural blue carbon trading initiative, the Zhanjiang Mangrove Afforestation Project in Zhanjiang, was officially registered in April 2021 and has an approximate value of nearly USD 800,000 [40]. This highlights the considerable promising results of mangrove restoration in urban coastal regions. In addition to improving environmental aesthetics and controlling microclimates, these restoration initiatives can generate tradable carbon sink assets for local communities, with significant overall advantages [41].
The contemporary methodologies applied for evaluating carbon sequestration in mangrove forests closely resemble those employed in terrestrial ecosystems, encompassing sample plot surveys, eddy covariance techniques, and ecological process models [42]. Of these, the sample plot survey stands out for its straightforward approach to assessing carbon sequestration and its ability to yield highly precise data. Nevertheless, the method’s efficacy is contingent upon the substantial inherent spatial variability in ecosystems, necessitating a high number of samples and considerable efforts [43,44]. Consequently, this method is mostly suited for calculating carbon sinks in small areas.
The eddy covariance method is the only method applied to the direct quantification of the cycling of materials and the exchange of energy among the atmosphere, the canopy, and the soil [45]. Via the deployment of eddy covariance flux towers, this method enables the direct measurement and computation of the net ecosystem CO2 exchange (NEE) within a specified spatial extent from scales of several m2 to several km2 [46]. It comes with several advantages, such as its high resolution and its capacity to capture the effects of extreme weather events, such as meteorological droughts, on NEE [47]. Nevertheless, the efficacy of this approach is constrained by the substantial expenses associated with infrastructure development and upkeep, resulting in its limited adoption [48]. Ecological process models evaluate the efficiency of terrestrial ecosystems by analyzing the interactions among factors such as temperature, precipitation, elevation, slope, aspect, latitude/longitude, and vegetation biomass and stocks [49]. To address the challenges of estimating carbon sequestration in large-scale terrestrial ecosystems, scientists have developed various methods using satellite remote sensing data [50]. In medium- to large-scale mangrove carbon sink research, remote sensing data integrated with model analysis are predominantly used [51]. Conversely, for smaller areas such as artificial mangrove wetland restoration sites, carbon sink assessment continues to heavily depend on the sample plot survey method [52].
The allometric equation constitutes a significant empirical formula used for the quantification of plant biomass [53]. Researchers frequently integrate this equation with remote sensing data to extensively apply it in the estimation of biomass for mangrove forests on a global scale [54,55], facilitating the investigation of mangrove carbon storage and the carbon cycle [56,57]. Nonetheless, the parameter values of the allometric growth equation can exhibit considerable variability caused by factors such as mangrove species, growth region, and climatic conditions [58,59]. Therefore, when conducting biomass calculations, it is imperative to select an equation tailored to the plant species specific to the target area or to develop a new equation to ensure the accuracy of the estimation results. This study focused on the mangrove species Kandelia obovata planted in an artificially restored coastal wetland in southeastern China. From 2016 to 2024, the biomass of Kandelia obovata at different growth stages was measured periodically, at 2-year intervals after planting. The objectives of this study were to develop an allometric equation for Kandelia obovata cultivated in restored urban wetlands and to estimate the carbon storage capacity and carbon sequestration rate during the early afforestation period. The results provide empirical support for the assessment and quantification of carbon sinks in restored artificial Kandelia obovata forests and scientific evidence to augment the “carbon” value of related mangrove afforestation strategies.

2. Materials and Methods
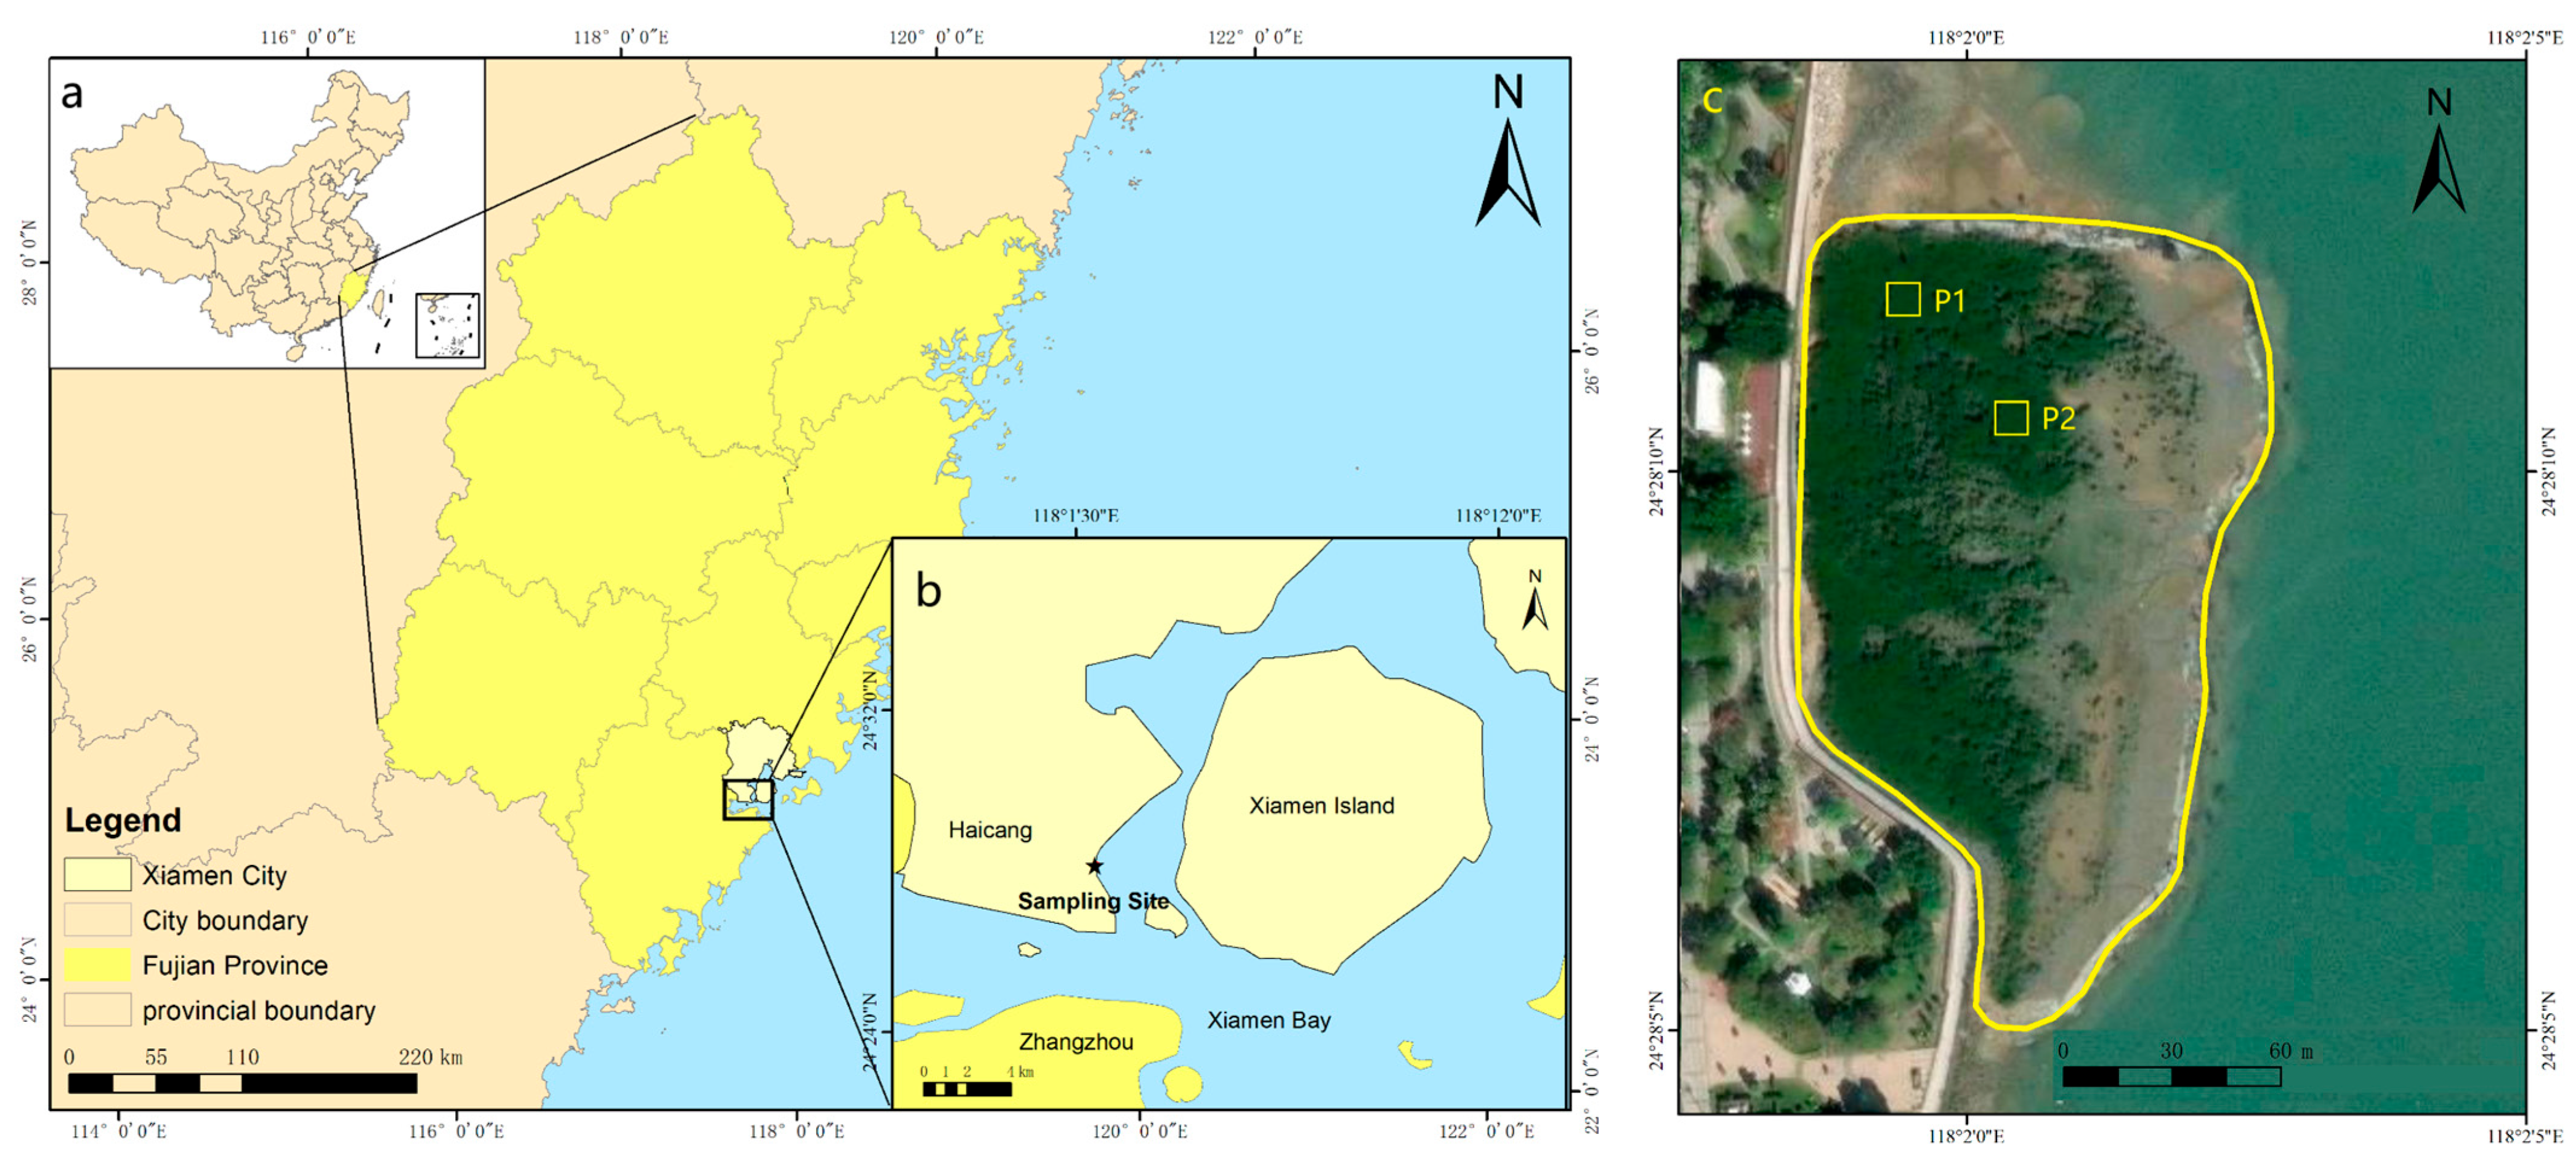
2.1. Study Area

The investigated mangrove stand is located along the western coastline of Haicang Bay in Xiamen, Fujian Province, China, at 118.0380° E and 24.4644° N. The site has an average elevation of approximately 1.8 m above sea level and covers an area of approximately 25.6 hectares (Figure 1). The area has a subtropical maritime monsoon climate, and the tidal regime is characterized by a regular semi-diurnal tide, with a tidal range of approximately 4 m. The long-term average annual precipitation is 1249.28 mm, with an average annual sunshine duration of 2233 h [60]. During the sampling period from 2017 to 2024, the average annual temperature in the study area was 21.8 °C. The highest temperatures were observed during the summer months (June to August), averaging 31.4 °C, followed by spring (March to May), with an average temperature of 21.8 °C, and autumn (September to November), with an average temperature of 22.2 °C. The lowest temperatures were recorded in winter (December to February), with an average of 12.0 °C. Originally a subtidal zone seaward of the urban seawall, with a mean elevation of −0.5 m, the site was transformed into a coastal wetland under China′s ‘Blue Bay Remediation Action’ program in 2016. This was achieved by first constructing perimeter sandbag cofferdams to enclose the area, then hydraulically filling the enclosed space with sediment dredged from the adjacent subtidal zone. The landform stabilized at a mean elevation of 1.8 m, creating an engineered substrate that subsequently supported the establishment of a mangrove plantation. Subsequently, 11- to 16-month-old Kandelia obovata propagules were planted at a density of 49,500 individuals per hectare, resulting in the establishment of a plant community with a well-defined structure (See Table 1 for details) [61].

2.2. Sample Collection and Preparation

Within the narrow, spatially constrained Kandelia obovata plantation, two 10 × 10 m quadrats were established along a land–sea gradient to capture topographic variability: P1 (24.4670° N, 118.0379° E) positioned landward and P2 (24.4672° N, 118.0381° E) seaward. This paired design enabled the examination of population characteristics across stand ages while accounting for coastal environmental gradients. In 2016, the quadrats were surveyed and marked to identify Kandelia obovata individuals at an initial stand age of 1 year. Follow-up surveys were conducted biennially in 2018, 2020, 2022, and 2024, collecting data corresponding to stand ages of 3, 5, 7, and 9 years, respectively (Table 2). During each survey, three or four individuals of Kandelia obovata per quadrat were selected as representative individuals, with height and canopy width values close to the average. To minimize the disturbance to unsampled trees, standard tree collections were systematically rotated across quadrat margins in a clockwise sequence: north (2016), east (2018), south (2020), west (2022), and north again (2024). For these standard trees, height and diameter at one-tenth of the trunk length from the ground (D) were recorded [62], and subsequently, they were carefully excavated to preserve the integrity of the root system. Following the removal of attached sediment, each tree was dissected into roots, stems, and leaves and transported to the laboratory. The different compounds were weighed to determine their fresh biomass and subsequently dried to a constant weight. The dried samples were stored at −4 °C for future analysis. Litterfall production was systematically monitored from July 2024 to April 2025 within plot P1. Three litterfall traps were deployed, each comprising a square PVC frame measuring 80 cm × 80 cm, holding nylon mesh, and suspended from tree branches. Litterfall was collected on a monthly basis across all community types within the plot. The collected samples were processed in accordance with the protocol applied to whole-plant samples.

2.3. Biomass Estimation

The allometric method was employed to estimate the biomass of the mangrove forests in the sample plots. Parameters that include stem diameter (D), stem height (H), and wood density (ρ) are frequently used as independent variables in the development of allometric equations for trees [55]. For mangrove species, the power function is the most common form of an allometric equation [53] and was therefore adopted here, using the following equations [63]:
B = a D b ,
B = a ( D 2 H ) b .
Here, B is the dependent variable, representing the biomass of Kandelia obovata (kg); D and H are independent variables, representing the diameter (cm) measured from the ground level to one-tenth of the stem length, and tree height (m), respectively. The parameters a and b are the fitting coefficients.
The fitted allometric equations were then evaluated by assessing and comparing their goodness of fit and prediction accuracy to identify the optimal model. The coefficient of determination (R2) is the indicator of goodness of fit, quantifying the degree of alignment between the equation’s predicted values and the observed data. Prediction accuracy was assessed using the root mean square error (RMSE), measuring the magnitude of deviation between the predicted and actual biomass values. The equations used are as follows [63]:
R 2 = 1 i = 1 n B i B i p 2 i = 1 n B i B ¯ i 2
R M S E = i = 1 n B i p B i 2 n .
Here, B i is the measured biomass value (kg), B i p is the biomass value predicted by the equation (kg), B ¯ i is the mean of the measured biomass value (kg), and n is the number of Kandelia obovata samples used for fitting the equation.

2.4. Carbon Stock Estimation

The carbon stocks of mangrove ecosystems mainly comprise vegetation and soil carbon [25]. The vegetation carbon stock encompasses the carbon sequestered in both the aboveground and belowground plant components [64]. In this study, the sample plot inventory method was employed to estimate the vegetation carbon stocks of the investigated sites, using the following equation:
C p l a n t = ρ i = 1 n B ¯ i · P i  
Here, C p l a n t represents the carbon stock of all plants (Mg C·ha−1), B ¯ i denotes the average biomass of the i-th tissue of Kandelia obovata, P i signifies the carbon content coefficient for the i-th tissue of Kandelia obovata, n is the number of tissue types of Kandelia obovata included in the calculation, and ρ indicates the wood density of Kandelia obovata in the sample plot. The carbon content coefficients for the various tissues of Kandelia obovata were derived by dividing the carbon content value of each tissue by its respective biomass. The carbon content of the plant tissues was quantified using a total organic carbon analyzer (TOC-LCPH, Shimadzu, Kyoto, Japan). Due to pronounced tidal activity, the accumulation of litter beneath the Kandelia obovata forest was minimal, and the litter was difficult to collect, which hampered the carbon storage analysis [25]. Consequently, only the 2024 litter data were obtained and utilized for the total carbon storage assessment. Furthermore, natural regeneration within the forest was minimal, with a low biomass of spontaneously regenerated shrubs and herbaceous plants, justifying the classification of the stand as a single-species forest.
Soil carbon is mainly concentrated within the uppermost 1 m of the soil profile, with lower amounts beyond this depth [64]. Consequently, tidal flat sediment samples were collected to this depth. In plots P1 and P2, two 1 m soil cores were extracted and stratified into three distinct layers: 0–30 cm, 30–60 cm, and 60–100 cm. The fresh mass of each layer was recorded, and the soil from the corresponding layers of the two cores was homogenized. Subsequently, two groups of soil samples, each consisting of two replicates, were obtained from each layer to determine soil bulk density and the organic carbon content. Soil bulk density was measured via the cutting ring method, and the soil organic carbon content was quantified using a total organic carbon analyzer (TOC-LCPH, Shimadzu, Japan) [63], using the following equation:
C s o i l = S O C × ρ B × h
Here, SOC represents the soil organic carbon content (g·kg−1), ρB denotes the soil bulk density (Mg·m−3), and h is the soil thickness (m). The aggregate carbon stock of the mangrove forest C t o t a l was determined as the sum of the total plant carbon stock C p l a n t and the soil carbon stock C s o i l .

2.5. Statistical Analysis

Normality tests were performed on all datasets, and the results are expressed as mean ± standard deviation (SD) values derived from three replicates. To test for significant differences among the values of the various parameters across different ages of the Kandelia obovata forests, Pearson’s correlation analysis and the Kruskal–Wallis test were employed. Furthermore, both bivariate and multiple linear regression analyses were conducted in the SPSS 22.0 statistical software package (IBM Corp., Armonk, NY, USA).

3. Results

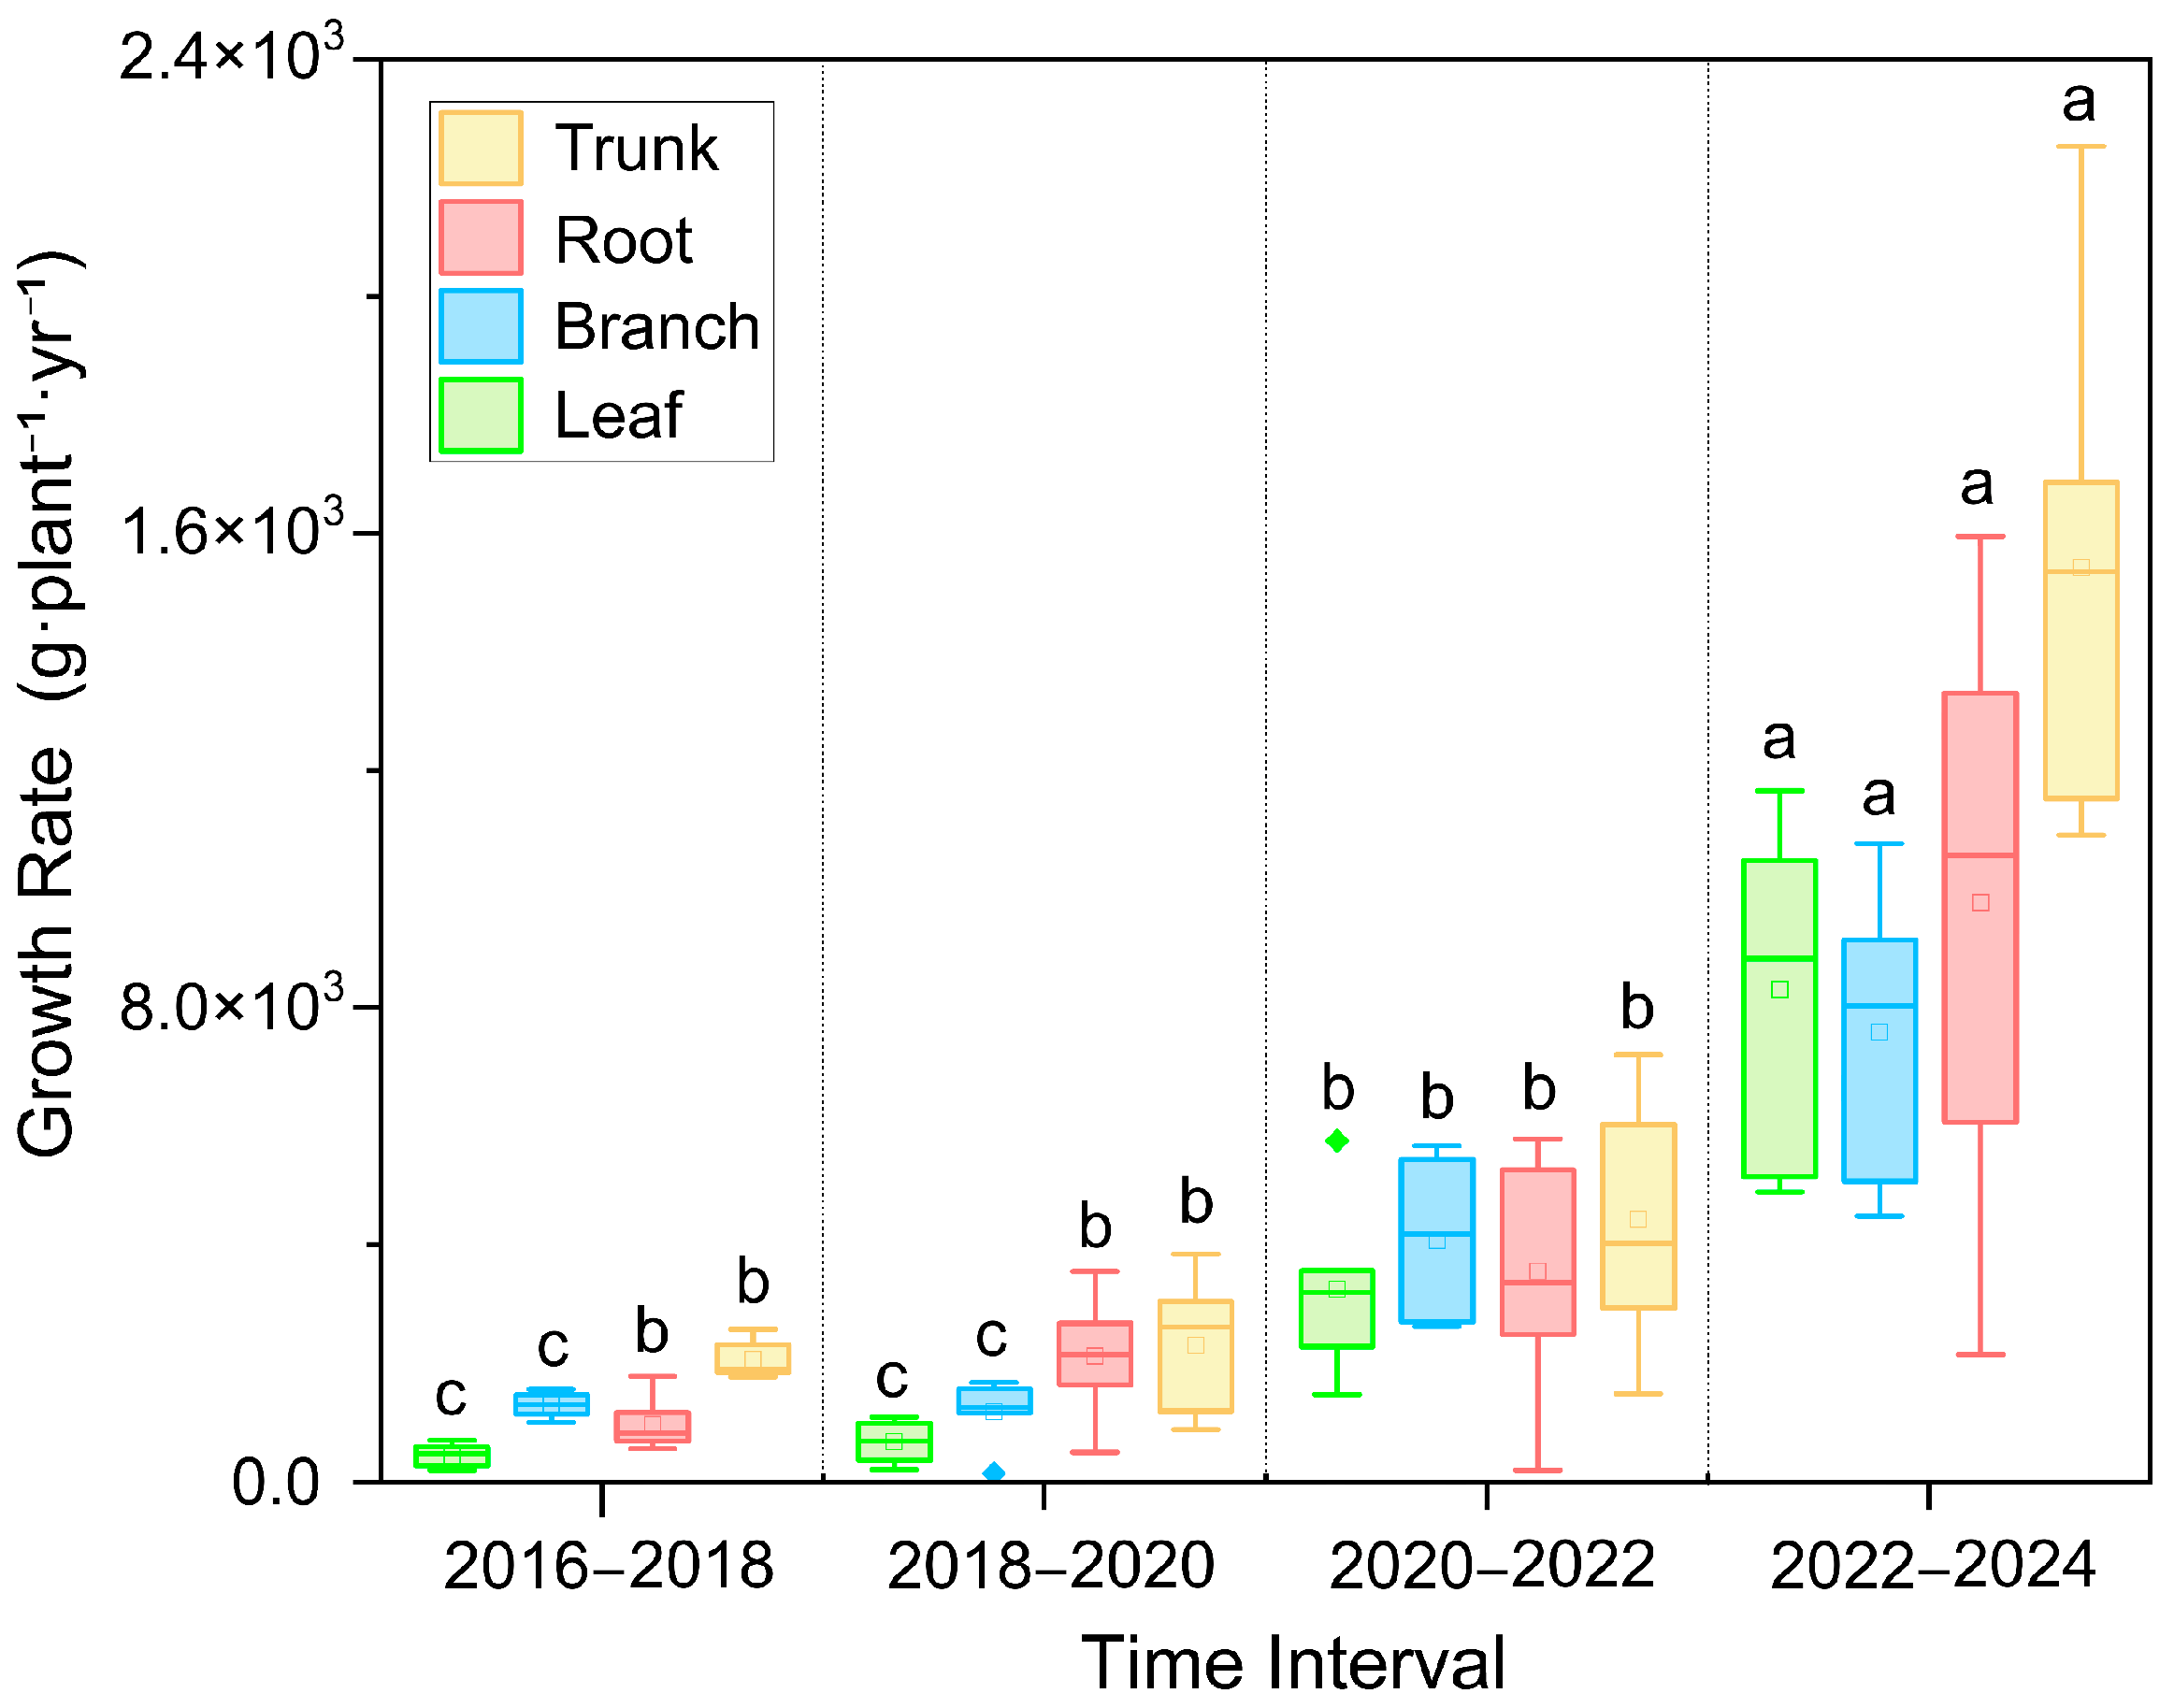
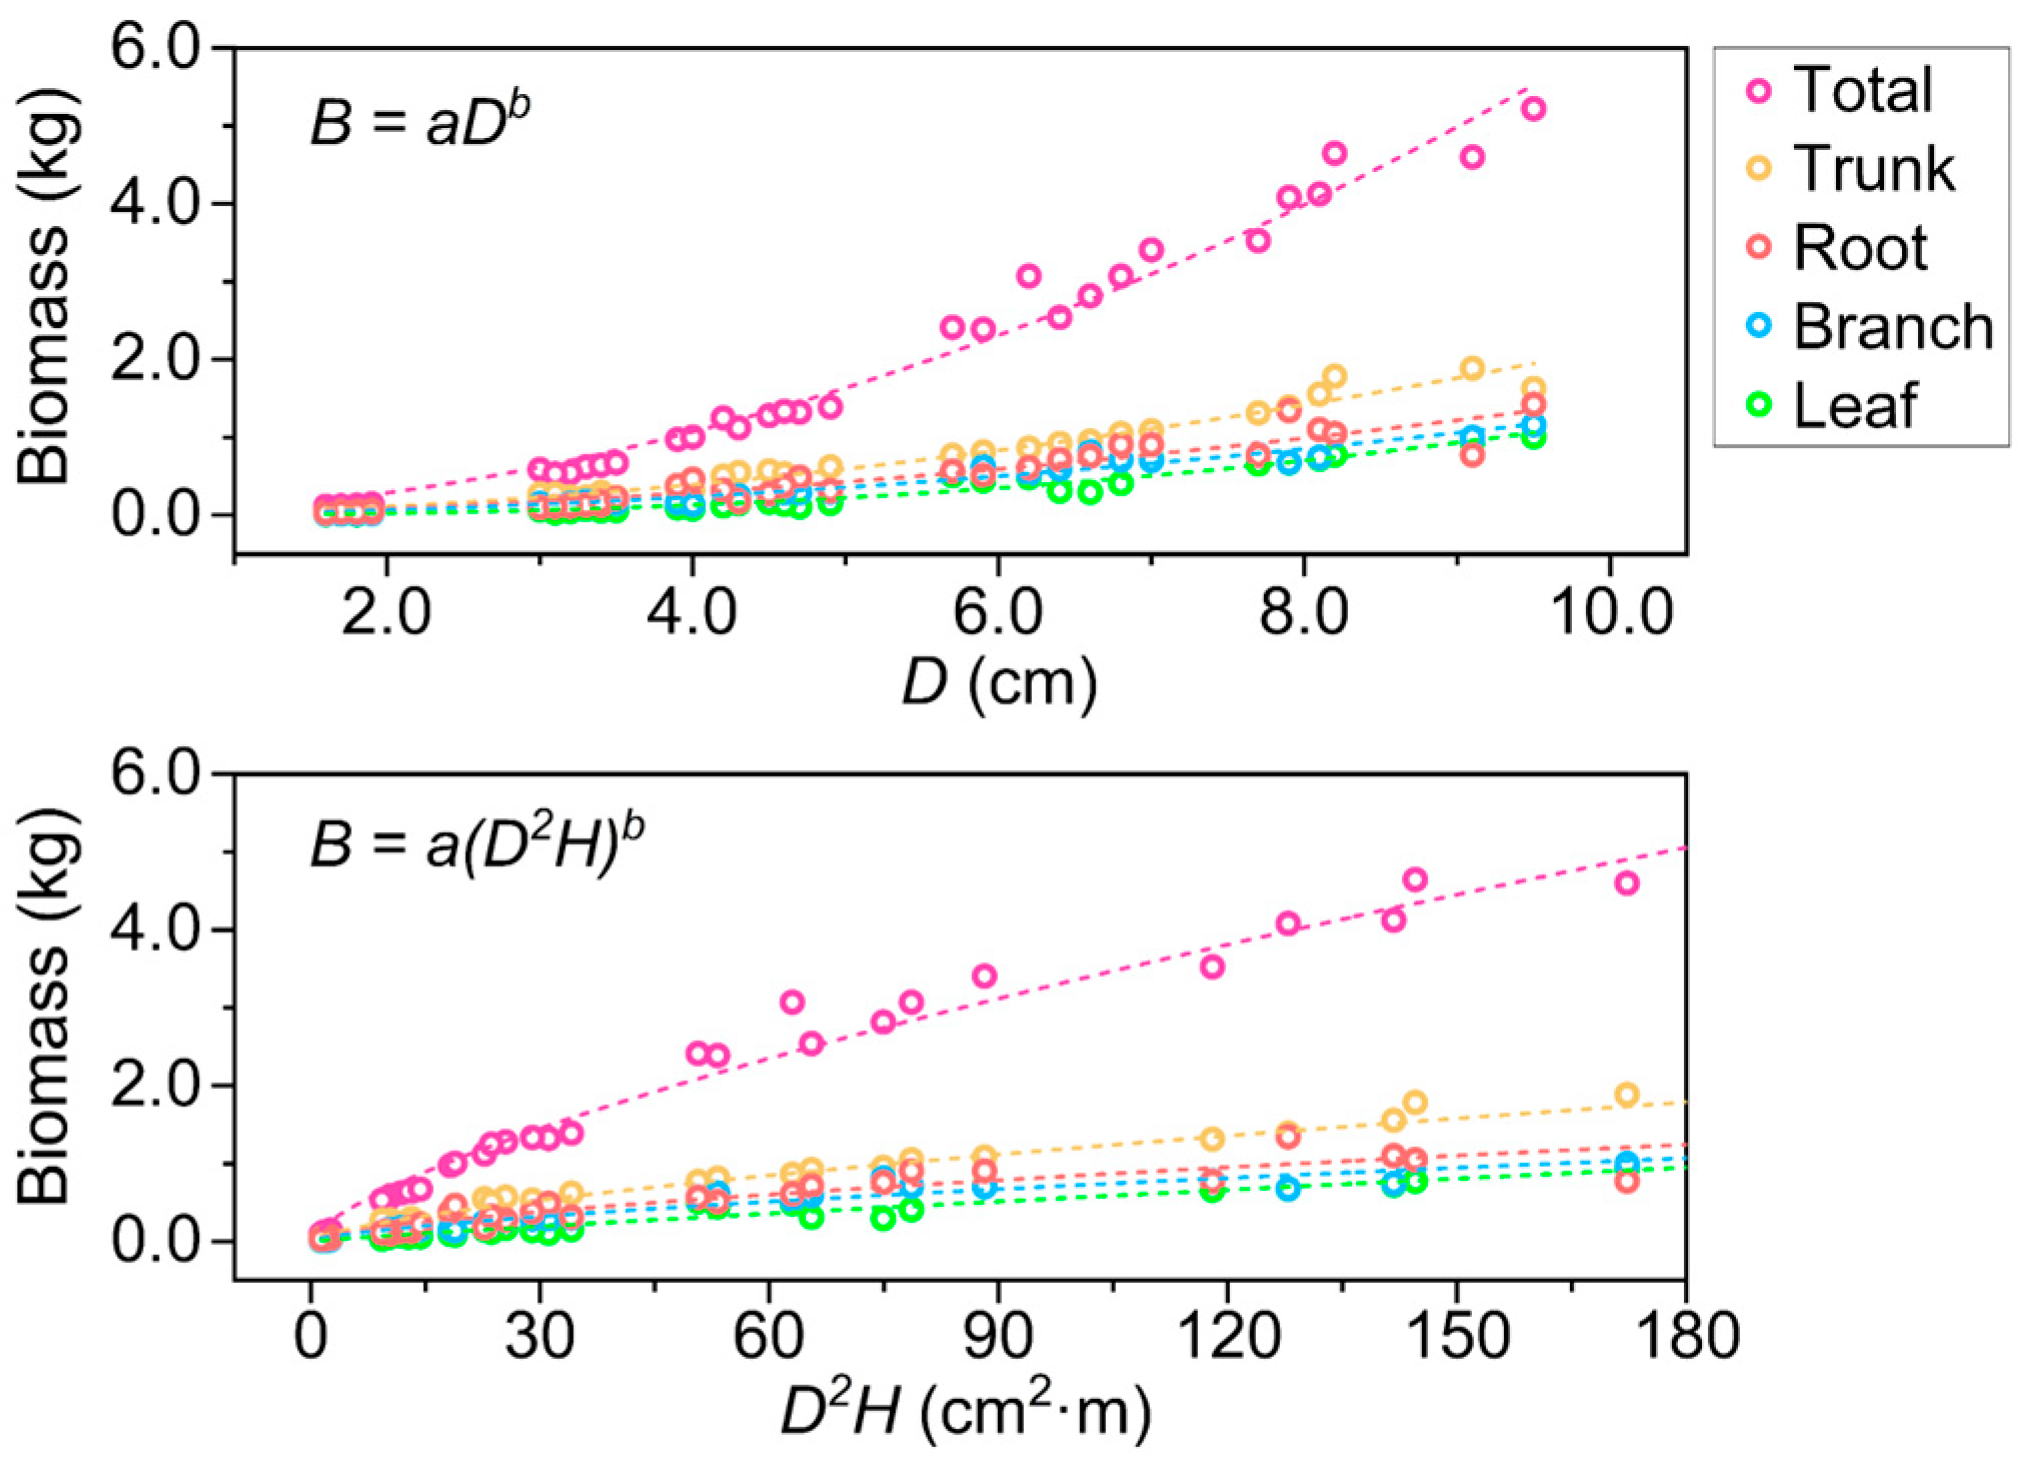
3.1. Biomass Growth and Allometric Equations

Table 3 shows the biomass measurements for the young Kandelia obovata stands at various growth stages. Throughout the 8-year study period, 37 intact sample trees were collected, with D values increasing from 1.6 to 9.5 cm and H values from 52 to 224 cm. Both D and H showed significant positive correlations with plant biomass as stand age increased (p < 0.001). The total biomass increased significantly from 120 ± 17 g (n = 8) at the time of planting to 4.37 ± 0.59 kg (n = 6) after 8 years of growth (p < 0.001). Aboveground biomass (AGB) and belowground biomass (BGB) showed similar growth patterns, increasing from 78 ± 11 g and 42 ± 10 g (n = 8) to 3.29 ± 0.47 kg and to 1.08 ± 0.27 kg (n = 6), respectively. Similarly, stand density (ρ) decreased from 4.46 ± 0.10 × 10⁴ ha−1 to 1.88 ± 0.04 × 10⁴ ha−1, indicating pronounced self-thinning. Notably, the annual biomass increment rates showed an increasing trend (Figure 2), with particularly significant acceleration between years 4 and 6 post planting (2020–2022) for leaf and branch biomass increases (p < 0.01). During years 6 to 8 (2022–2024), the most rapid growth phase was observed for all plant components, with total biomass accumulation reaching 1.7 ± 0.4 kg plant−1·yr−1.
The biomass allocation among young Kandelia obovata tissues varied only slightly, without any consistent trends (Table 4). In general, the trunk had the highest average biomass proportion (38.3% ± 5.3%), followed by the roots (27.8% ± 7.3%), branches (20.9% ± 4.2%), and leaves (13.1% ± 4.3%). Aboveground biomass (AGB, 72.2% ± 7.3%) was approximately 2.5 times the belowground biomass (BGB, 27.8% ± 7.3%). The root-to-shoot ratio (0.303–0.539) surpassed the average values for all forest types in mainland China (0.233) [65], indicating an emphasis on root development in mangrove plants.
Allometric models using the independent variables D and D2H were developed (Figure 3 and Table 5). The power law equations, expressed as B = aDᵇ and B = a(D2H), both demonstrated strong predictive capabilities, with R2 values ranging from 0.896 to 0.984 and RMSE values between 0.068 and 0.206 kg. These results indicate robust mathematical relationships between the predictors (D or D2H) and plant biomass. Importantly, the explanatory power of both models had a consistent ranking among different tissues, with the following descending order: whole plant and AGB, trunk, branch, leaf, and root (BGB). The lower R2 values observed for leaf and root biomass, when compared with those of the other tissues, may be attributed to sampling issues, as these tissues are more difficult to collect intact during fieldwork [66].

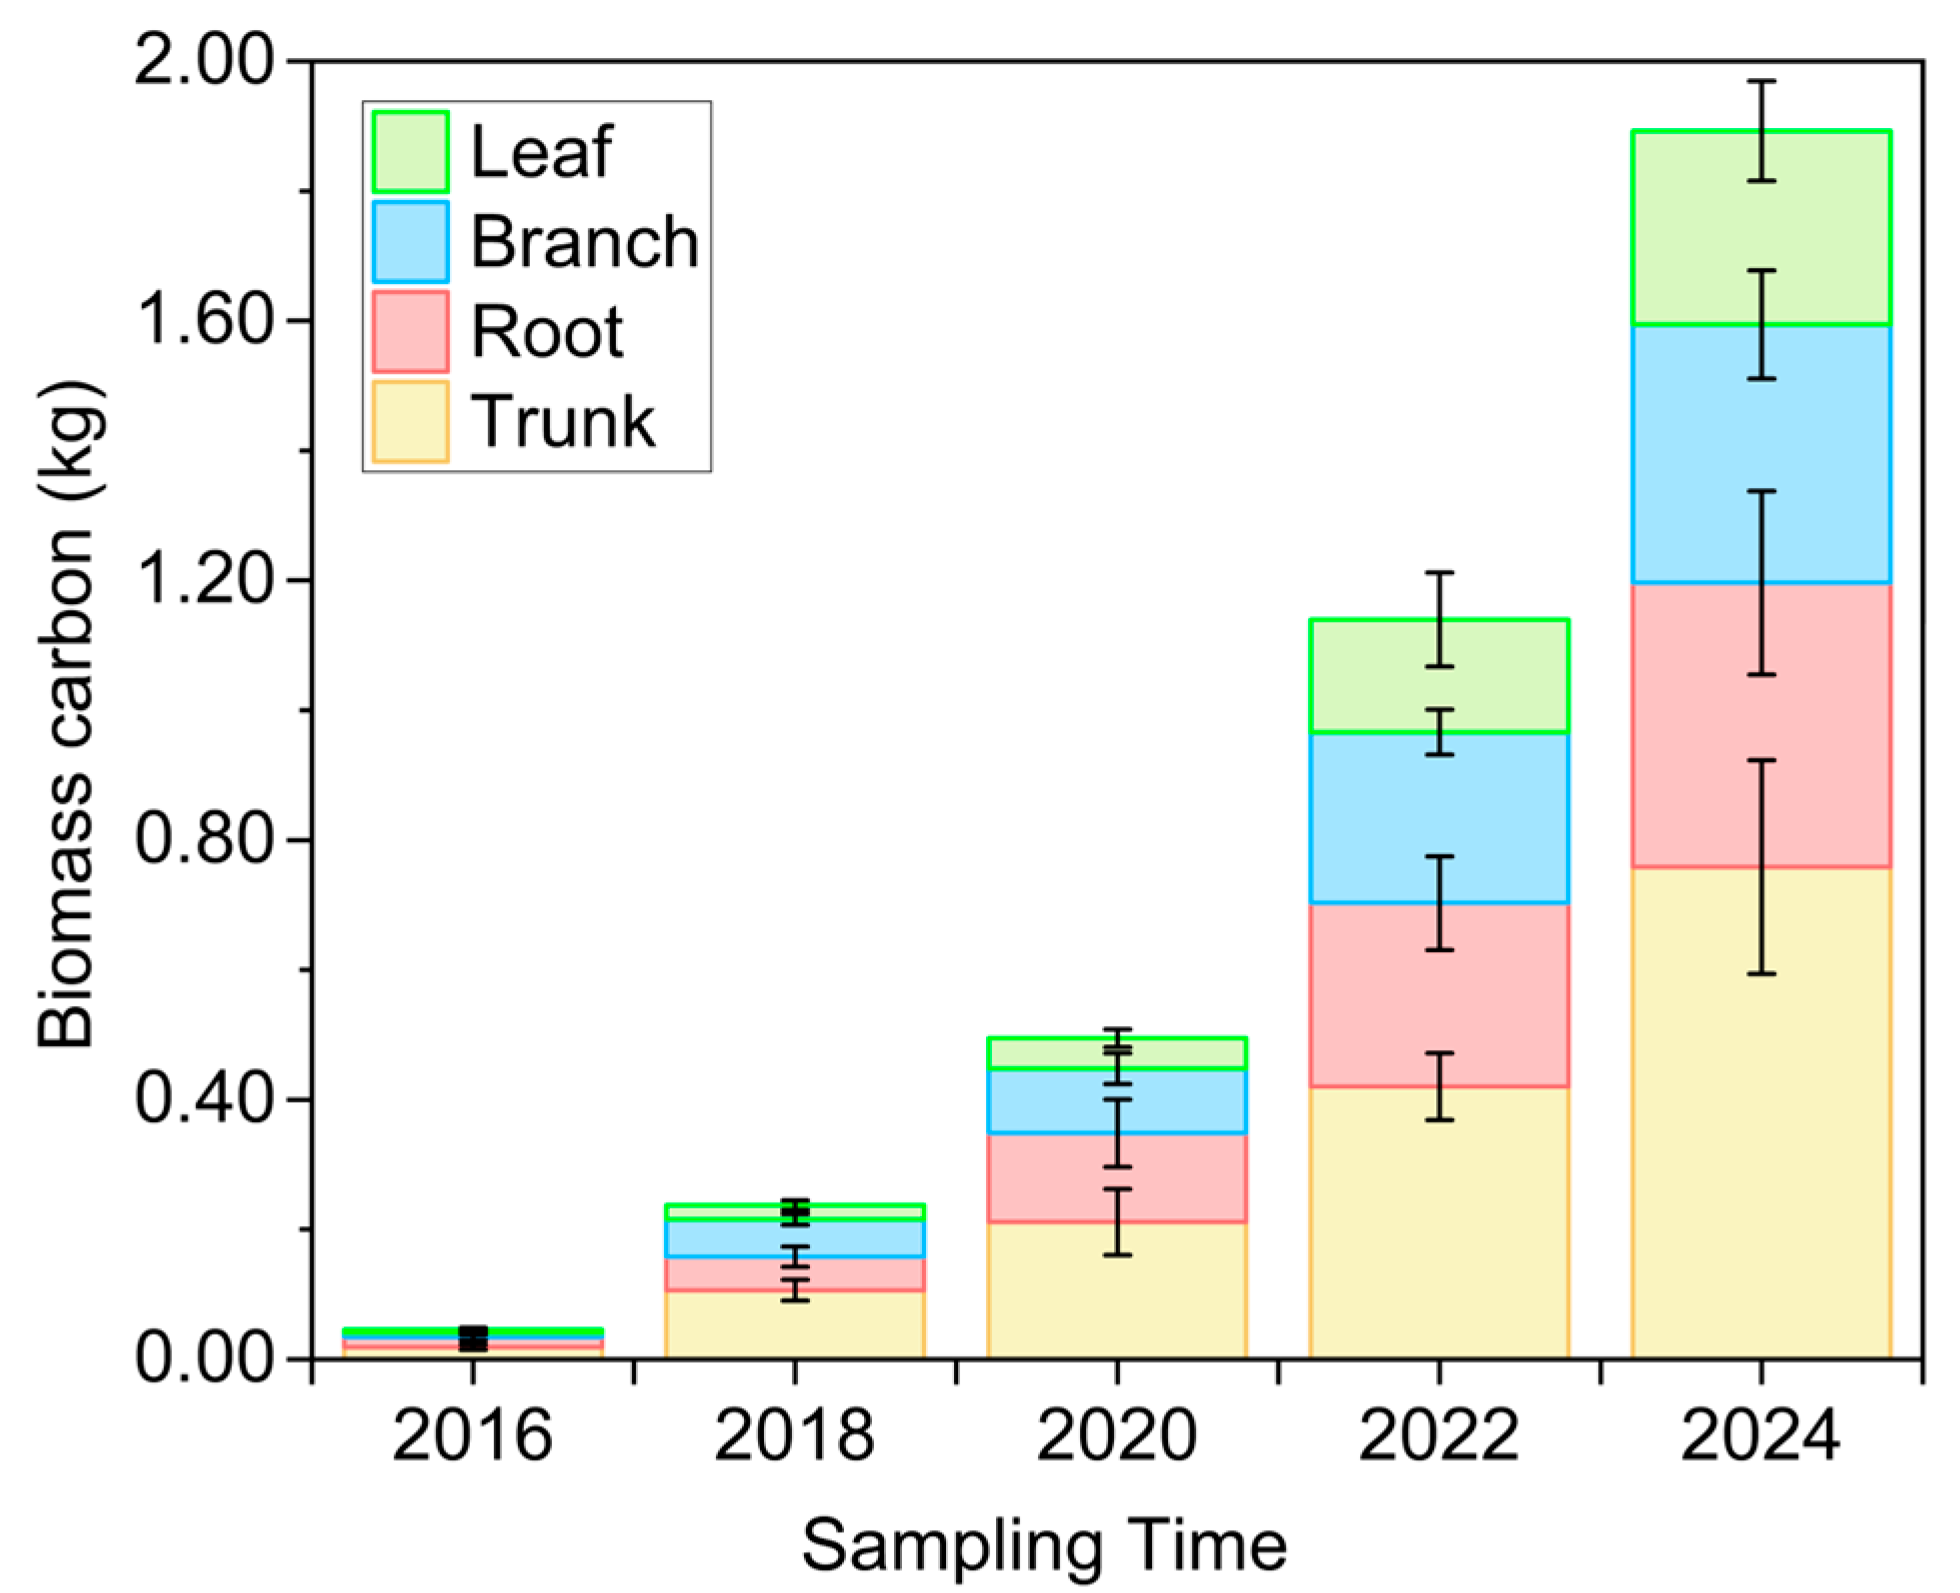
3.2. Plant Carbon Stock

The carbon content within the various tissues of Kandelia obovata showed significant dynamic changes correlated with stand age, indicating an exponential increase in carbon stock across all plant components. The total carbon content increased markedly from 0.046 ± 0.008 kg·plant−1 (n = 8, ±SD) at 1 year to 1.893 ± 0.334 kg·plant−1 (n = 6, ±SD) at 9 years (Figure 4), representing a 40-fold increase with an annual growth rate of 52.3%. The average annual carbon increment was recorded at 0.231 kg·plant−1·yr−1, with phase-specific increments of 0.057 kg·plant−1·yr−1 during years 1–3, 0.187 kg·plant−1·yr−1 during years 3–5, 0.342 kg·plant−1·yr−1 during years 5–7, and 0.239 kg·plant−1·yr−1 during years 7–9. These findings demonstrate consistently substantial increases in absolute carbon stock at the individual plant level throughout the middle and late phases of observation.
The aboveground components, i.e., leaves, trunk, and branches, consistently functioned as the primary carbon sinks. Their contribution to carbon sequestration increased from 67.4% (0.031 ± 0.006 kg·plant−1) in 1-year-old stands to 76.9% (1.455 ± 0.250 kg·plant−1) in 9-year-old stands, indicating an annual accumulation rate of 0.178 kg·plant−1·yr−1. In contrast, the relative contribution of the belowground component (roots) decreased from 32.6% (0.015 ± 0.004 kg·plant−1) to 23.1% (0.438 ± 0.142 kg·plant−1), although it exhibited a 29-fold increase in absolute terms, with an annual growth rate of 0.053 kg·plant−1·yr−1. Notably, the trunk showed the most significant carbon accumulation, with an annual growth rate of 0.094 kg·plant−1·yr−1, followed by those of the roots, branches, and leaves. This hierarchical pattern is consistent with the findings of previous studies conducted in Qinzhou Bay [67]. The relative contributions of various tissues to the overall carbon contents of young Kandelia obovata plants largely remained stable across different stand ages. The trunk consistently constituted the largest carbon reservoir, comprising 40.1% of the total carbon amount (0.759 ± 0.165 kg·plant−1) in 9-year-old stands. This was followed by the roots, which contributed 23.1%, and the branches, which accounted for 21.0%. In contrast, the leaves represented the smallest proportion, comprising 15.8% (0.298 ± 0.077 kg·plant−1) at the same developmental stage.

3.3. Soil Carbon Stock

The total organic carbon (TOC) content of the sediment significantly increased over time and decreased with depth (Figure 5). This can be attributed to the planting of Kandelia obovata, which significantly enhanced sediment TOC accumulation [39]. In particular, the progressive development of the root systems from shallow to deeper layers resulted in more rapid TOC accumulation in surface sediments compared with subsurface layers [64].
In 2016, immediately after planting, the average TOC content was 8.05 ± 0.33 g·kg−1 (n = 9), with minimal vertical variation (surface layer, 8.20 ± 0.11; intermediate layer, 8.12 ± 0.09; and deep layer, 7.82 ± 0.37 g·kg−1), indicating a homogeneous distribution in newly established tidal flats. By 2024, the surface TOC peaked at 10.13 ± 0.31 g·kg−1, most likely because of the growth of Kandelia obovata and its associated biotic communities [18]. In contrast, the subsurface sediment layers were characterized by stable TOC dynamics, characterized by only minor fluctuations throughout the study period. The TOC concentrations in 2018 (7.23 ± 0.14 g·kg−1) and 2020 (7.24 ± 0.07 g·kg−1) were marginally lower than the initial ones in 2016 (7.82 ± 0.37 g·kg−1). A gradual recovery was observed in the subsequent years, with TOC levels reaching 7.80 ± 0.09 g·kg−1 in 2022 and 7.72 ± 0.08 g·kg−1 in 2024, comparable to the baseline 2016 measurements (p > 0.05, Kruskal–Wallis test). The observed TOC pattern resulted from the tidal carbon removal and limited root input in young stands, causing slower subsurface carbon accumulation.

3.4. Litter Carbon Stock

The litter collection analysis indicated that the leaves and branches were the predominant litter components, with respective yields of 86.7 ± 13.6 g·m−2·yr−1 and 330.3 ± 71.9 g·m−2·yr−1 (n = 3, ±SD). As the Kandelia obovata stands matured, a minor quantity of propagules was collected, with a yield of 9.3 ± 3.7 g·m−2·yr−1 (n = 3, ±SD). According to Table 6, the carbon content across different litter types did not show significant seasonal variation (p > 0.05), with the exception of the leaves during the winter season. Additionally, the variation in carbon content among the litter components was minimal. The branches exhibited the highest carbon content (453.2 ± 27.6 g·kg−1), followed by the leaves (437.1 ± 59.2 g·kg−1), while the propagules had the lowest carbon content (416.2 ± 33.3 g·kg−1).

4. Discussion

4.1. Biomass Allocation and Growth Benefits of Kandelia obovata in Constructed Wetlands

Growth performance is influenced by climatic conditions and site characteristics. As shown in Table 7, stands located at lower latitudes, ranging from 27°35′ N to 20°36′ N, with more light and warmer temperatures showed higher biomass levels at similar ages [66,68]. At similar latitudes, naturally occurring stands of Kandelia obovata demonstrated a superior performance compared with that of planted stands [69]. Notably, both the Yundang Lagoon [70] and the Haicang Bay sites examined in the present study are constructed wetlands. The stands aged 10 and 9 years, with higher planting densities of 6.67 and 1.88 × 10⁴ ha−1, respectively, exhibited significantly greater AGB values of 136.8 and 61.83 Mg·ha−1, respectively, compared with the plantations in natural wetlands listed in Table 5, with 37.96 Mg·ha−1 for 10-year-old stands [68]. Similarly, the BGB values observed in this study (20.2 ± 5.2 Mg·ha−1) were significantly higher than those reported for the plantations in natural wetlands at Shacheng Bay (10.65 Mg·ha−1) [71] and Pingtan Island (10.11 Mg·ha−1) [72] but lower than that of the higher-density Yundang Lagoon constructed wetland (77.65 Mg·ha−1). This indicates that the growth of Kandelia obovata in constructed wetlands is higher, particularly in terms of aboveground development, when compared with that of plantations in natural tidal flats.
Constructed wetlands offer the advantage of allowing for precise engineering designs that are specifically tailored to the growth characteristics of the planted species. The sites investigated in the present study are located in fully developed, economically prosperous regions, which facilitates routine maintenance. This suggests that establishing constructed wetlands and planting mangroves along appropriate coastal urban shorelines can create favorable conditions for mangrove forests. This is particularly evident in the survival rates under high-density planting conditions, with greater biomass accumulation per unit area relative to that of natural wetlands planted with Kandelia obovata. Nonetheless, as a species native to the study area, Kandelia obovata demonstrates a substantially lower per-tree biomass compared with non-native species with typical arborescent characteristics, such as Sonneratia apetala, Avicennia alba, and Rhizophora apiculata, as indicated in Table 5. Even when planted at densities exceeding those of native species by up to ten times, the AGB of Kandelia obovata only approaches the levels observed for Sonneratia apetala stands in Leizhou Bay, China (79.0 Mg·ha−1) and Avicennia alba stands in the Chao Phraya River Mouth, Thailand (116.1 Mg·ha−1). Although successful introductions of such non-native mangrove species have been reported for some regions [76], species selection for afforestation requires the careful balancing between reforestation needs and the risks of biological invasion.

4.2. Allometric Model Selection for Young Kandelia obovata Stands in Constructed Wetlands

The comparison of the R2 and RMSE metrics indicated negligible differences in explanatory power between the power law equations using D2H and D as independent variables for estimating biomass across the various tissues of young Kandelia obovata specimens (Table 4). Specifically, when compared with the D-based power equations, the D2H-based equations exhibited only slight improvements in the R2 values of 0.21%, 0.90%, and 0.20% for the trunk, root (BGB), and total biomass, respectively, but showed a 0.42% reduction for the branches. The RMSE values showed similar trends, with variation ranging from −4.17% to 5.34%. According to previous studies, incorporating both D and H as predictors can enhance the performance of biomass equations for mangrove species, although this improvement is less pronounced for shorter, multi-stemmed varieties [77]. Considering the marginally superior performance of the D2H-based power equations for estimating total biomass, AGB, and BGB, we opted to use this model for subsequent biomass calculations. Allometric biomass equations are subject to considerable interspecific variation. Traditional methodologies employing DBH and tree height are highly effective for tall, single-stemmed species such as Bruguiera gymnorrhiza and Sonneratia apetala [78,79]. However, shorter mangrove species, such as Kandelia obovata and Avicennia marina, pose unique challenges owing to their low branches and minimal differentiation between the main and lateral stems, particularly in higher latitudes, where they exhibit more shrub-like growth forms [80]. Furthermore, Kandelia obovata individuals over 5 years of age often develop arched prop roots originating from the basal stems or lower branches, which decreases the proportion of trunk height and complicates DBH measurement. To address this issue, researchers often substitute basal diameter (D) for diameter (DBH) [62,69]. Whilst according to some authors, the recommended measuring height is 0.3 m [81], others suggest using one-tenth of the tree’s height [82]. In our study, given the wide range of plant heights (63.1 ± 7.2 cm to 211.2 ± 8.9 cm for plants aged 1 to 9 years), the 0.3 m measurement point frequently coincided with branching points in younger specimens or with prop root junctions in mature plants. We therefore adopted the one-tenth height measurement protocol, which was fully adequate for modeling purposes. Nevertheless, the multi-stemmed growth habit of Kandelia obovata introduces additional complexity—some individuals branch below a height of 1.3 m, suggesting that treating each stem as an independent measurement unit could result in a higher accuracy [66].

4.3. Carbon Content Variation in Plants and Sediment in the Constructed Wetland

The carbon content coefficients significantly increased with stand age, irrespective of the tissues (Figure 6). The trunk displayed the highest carbon content, which significantly increased (p < 0.01) from 41.0% ± 3.9% in 1-year-old stands to 47.3% ± 5.3% in 9-year-old stands, which corresponds to an annual increase of 0.79%. Similarly, the branches exhibited an annual increase of 0.83%, with a significant increase (p < 0.01) from 38.0% ± 4.3% to 44.6% ± 5.2% over the same period. These trends indicate more pronounced carbon density in trunk and branch biomass, most likely because of progressive lignification as the stands mature [51]. Conversely, the root carbon content coefficients demonstrated more modest variation, increasing from 36.1% ± 5.4% to 40.2% ± 5.2%, with an annual increase of only 0.51%. This lower carbon accumulation can be attributed to the species’ adaptive root architecture: the development of prop roots with extensive aerenchyma tissue facilitates the formation of longitudinal air channels for hypoxia adaptation, resulting in porous root structures with reduced carbon density [64]. Moreover, the presence of numerous fine roots with low lignification contributes to the overall reduced carbon content in the root systems. The leaf carbon content remained consistent across all age classes (p = 0.12), ranging from 35.9% ± 5.1% to 37.4% ± 5.0%, with the lowest values among all tissues. When compared with previously published values for 7-year-old plantations in Shacheng Bay (trunk, 51.5% ± 1.06%) [71], our values are slightly lower. However, they are similar to those reported for 10-year-old natural stands on Okinawa Island (45.6%–48.6%) [69]. This indicates that whilst Kandelia obovata in constructed mudflats shows good growth and biomass accumulation, the degree of lignification—or the efficiency of carbon conversion into biomass—during the observed growth period does not align with the rate of biomass accumulation observed in natural wetlands.
The constructed mudflat sediments investigated in this study had a significantly lower TOC content compared with that of natural tidal flats. This reduction is primarily attributed to the absence of long-term stable inputs from plants and allochthonous sources [29]. Specifically, the TOC levels were not only lower than those found for highly productive, Rhizophoraceae-dominated true mangrove mixed forests (20.57–570.3 g·kg−1 at 0–30 cm depth) following a decade of restoration on Pasarbanggi Island [25] but also marginally lower than those observed for 5-year-old Kandelia obovata plantations at the higher-latitude Yueqing Bay site (10.8–16.3 g·kg−1 at a depth of 0–100 cm depth) [83]. The TOC values were comparable to those recorded in 10-year-old Kandelia obovata plantations in Yundang Lagoon (5.3–12.1 g·kg−1 at a depth of 0–30 cm), another site with constructed mudflats [70]. Moreover, vegetation restoration in the study area affected both the sediment TOC content and the bulk density. The development of root systems contributes to the amount of low-density organic matter and enhances microbial and faunal activity, which increases the sediment water content and reduced sediment compression [84], as also indicated by the pronounced negative correlation between TOC and bulk density as well as the observed temporal decline in bulk density (Figure 7). These findings align with the results from previous studies on mangrove sediments [25,83].

4.4. Carbon Sequestration Potential and Offset Valuation

The carbon stock of young Kandelia obovata specimens at the study site significantly increased from an initial 2.1 ± 0.4 Mg C·ha−1 to 35.6 ± 6.3 Mg C·ha−1 over a period of 8 years, with an average annual accumulation rate of 4.2 Mg C·ha−1·yr−1 (Table 8). This growth trajectory demonstrated a strong correlation with biomass development, as evidenced by a coefficient of determination of R2 = 0.9978. Across all years, the aboveground biomass consistently represented the predominant portion (67.2%–78.3%) of the total plant carbon stock, with no significant interannual variation (p > 0.05). Similar to the trends observed for biomass accumulation, the carbon sequestration rates increased annually, reaching a plateau after the sixth year. Specifically, there was an increase from 2.5 Mg C·ha−1·yr−1 during the initial 2 years to 5.9 Mg C·ha−1·yr−1 in stands aged 7–9 years. This corresponds to an increase in CO2 sequestration from 9.2 to 21.8 Mg CO2eq·ha−1·yr−1, which is higher than the values reported from the restored Melaleuca spp. sites in the wetlands of Yandina, Australia (11.0 Mg CO2eq·ha−1·yr−1) [35], and in the Rhizophora-dominated restored mangrove sites on Indonesia’s Tanakeke Island (17.9 ± 1.5 Mg CO2eq·ha−1·yr−1) [36]. This indicates that, although constructed mangrove stands currently exhibit a lower carbon sequestration capacity compared with that of natural stands [27], active planting methods achieve greater carbon efficiency than passive restoration strategies.
Litterfall is acknowledged as a pivotal element of carbon flux within mangrove ecosystems, acting as a substantial carbon source for both the underlying sediments and adjacent coastal waters [85]. In the examined 9-year-old Kandelia obovata stand, the total litterfall carbon stock was quantified at 1.87 ± 0.16 Mg C·ha−1·yr−1, with contributions from leaf litter (1.44 ± 0.20 Mg C·ha−1·yr−1), branch litter (0.39 ± 0.02 Mg C·ha−1·yr−1), and propagule litter (0.04 ± 0.01 Mg C·ha−1·yr−1). The annual litterfall production at the study site (426.17 g·m−2·yr−1) was significantly lower than that observed in mature Kandelia obovata forests (stand age > 20 years) in nearby regions, such as Huludao in the Minjiang Estuary (618.79 g·m−2·yr−1) [86] and Fugong in the Jiulongjiang Estuary (862.9 g·m−2·yr−1) [87], and constituted less than 30% of that observed in Futian, Shenzhen (1520 g·m−2·yr−1) [88]. Although the carbon content of the litterfall at the study site was comparable to previously reported values, its carbon stock remained relatively low [86,87,88]. This discrepancy can be attributed to two primary factors: first, the stand had not yet reached full maturity, thereby limiting litter production; second, the intense tidal flushing in the study area likely resulted in incomplete litterfall collection. Thus, the actual carbon sequestration capacity and growth potential of the litterfall were likely substantially higher than the measured values.
On a global scale, mangroves sequester an average of 194 g C·m−2·yr−1, mainly because of the high sediment accumulation rates [19]. However, in our constructed mudflat, the sediment carbon stocks did not increase significantly (p > 0.05) because the initial loss of TOC counterbalanced the gains from restoration. Despite accounting for 73.6% of the total ecosystem carbon (99.5 ± 9.2 vs. 135.1 ± 15.5 Mg C·ha−1 in 2024), the primary increase in the carbon stock was attributed to vegetation rather than sediment. There is evidence that mangrove sediments typically store approximately 1000 Mg C·ha−1 (at a depth of 1 m), more than tropical forests (197–518 Mg C·ha−1) and saltmarshes (593 Mg C·ha−1) [89]. This is largely owing to the anaerobic conditions in mangrove stands, which slow down the decomposition of litter, root exudates, and tidal particulate carbon [32]. These findings indicate substantial potential for future sediment carbon storage through continued management, although this potential is currently limited in constructed systems.
Current mangrove restoration efforts frequently conflict with local traditions by displacing aquaculture, agriculture, or fisheries [33], whilst alternative income streams such as ecotourism or carbon markets remain underdeveloped. These challenges are particularly pronounced in economically disadvantaged regions, where suitable restoration sites are typically located [90]. In contrast, urban coastal afforestation in developed areas [91] provides multiple co-benefits, including enhanced urban greening, improved shoreline view quality, increased climate resilience, biodiversity conservation, and progress towards carbon neutrality goals [92]. Our calculations indicate that these urban plantations could sequester 16.9 Mg C ha−1·yr−1 (equivalent to 62.0 Mg CO2eq ha−1·yr−1) within 8 years, suggesting that economically advanced regions could alleviate conservation–development tensions by spearheading restoration initiatives.

5. Conclusions

This study provides a comprehensive analysis of the growth dynamics and carbon sequestration potential of young Kandelia obovata stands in constructed coastal wetlands through extensive long-term monitoring and data analysis. There were significant age-dependent increases in both biomass and carbon stocks, with particularly rapid growth observed between 4 and 8 years post planting. Aboveground components, especially trunks, were the primary carbon sinks, whereas belowground carbon accumulation occurred at a slower rate. The allometric equations developed here, notably the power law model using D2H as the independent variable, were reliable tools for accurate biomass estimation. Although the sediment carbon stocks in the constructed mudflat did not significantly increase during the study period, their long-term sequestration potential remains substantial. In comparison to natural wetlands, the constructed mangrove system demonstrated a higher carbon sequestration efficiency, with particularly notable multifunctional benefits, such as landscape enhancement and climate adaptation, in urban coastal environments. These findings offer a scientific foundation for carbon accounting in urban mangrove afforestation and a framework for aligning mangrove restoration initiatives with carbon neutrality objectives.

Author Contributions

Conceptualization, J.Z. and L.S.; methodology, J.Z. and L.S.; software, J.Z.; validation, L.Z., Y.Y. and X.W.; formal analysis, Y.W.; investigation, L.Z., Y.Y., X.W., S.X. and Y.S.; resources, C.L.; data curation, L.S.; writing—original draft preparation, J.Z.; writing—review and editing, L.S.; visualization, L.Z.; supervision, L.S. and C.L.; project administration, L.S.; funding acquisition, L.S. All authors have read and agreed to the published version of the manuscript.

Funding

This research was funded by the Natural Science Foundation of China (No.41406120 and 42006123), the Natural Science Foundation of Xiamen, China (No. 3502Z20227320), and the Natural Science Foundation of Zhangzhou, China (No. ZZ2023J17).

Data Availability Statement

Data will be made available on request.

Acknowledgments

The authors thank everyone who helped with the field survey and the anonymous reviewers for their valuable comments.

Conflicts of Interest

The authors declare no conflicts of interest. The funders had no role in the design of the study; in the collection, analyses, or interpretation of data; in the writing of the manuscript; or in the decision to publish the results.

References

  1. Wei, Y.M.; Chen, K.Y.; Kang, J.N.; Chen, W.M.; Zhang, X.Y.; Wang, X.Y. Policy and management of carbon peaking and carbon neutrality: A literature review. Engineering 2022, 14, 52–63. [Google Scholar] [CrossRef]
  2. Wei, Y.M.; Han, R.; Liang, Q.M.; Yu, B.Y.; Yao, Y.F.; Xue, M.M.; Zhang, K.; Liu, L.J.; Peng, J.; Yang, P.; et al. An integrated assessment of INDCs under shared socioeconomic pathways: An implementation of C3IAM. Nat. Hazards 2018, 92, 585–618. [Google Scholar] [CrossRef]
  3. Scandolera, T.; Teano, G.; Naderpour, M.; Geffroy, V.; Pflieger, S. Insights into the effects of elevated atmospheric carbon dioxide on plant-virus interactions: A literature review. Environ. Exp. Bot. 2024, 221, 105737. [Google Scholar] [CrossRef]
  4. Intergovernmental Panel on Climate Change (IPCC). Climate Change 2022: Impacts, Adaptation and Vulnerability; Cambridge University Press: Cambridge, UK, 2022. [Google Scholar]
  5. Li, H.M.; Wang, X.C.; Zhao, X.F.; Qi, Y. Understanding systemic risk induced by climate change. Adv. Clim. Chang. Res. 2021, 12, 384–394. [Google Scholar] [CrossRef]
  6. Liao, H.Y.; Lyon, C.J.; Ying, B.W.; Hu, T.Y. Climate change, its impact on emerging infectious diseases and new technologies to combat the challenge. Emerg. Microbes Infect. 2024, 13, 2356143. [Google Scholar] [CrossRef]
  7. Black, R.; Cullen, K.; Fay, B.; Hale, T.; Lang, J.; Mahmood, S.; Smith, S. Taking Stock: A Global Assessment of Net Zero Targets; Energy & Climate Intelligence Unit and Oxford Net Zero: London, UK, 2021; p. 23. [Google Scholar]
  8. Keysser, L.T.; Lenzen, M. 1.5 degrees C degrowth scenarios suggest the need for new mitigation pathways. Nat. Commun. 2021, 12, 2676. [Google Scholar] [CrossRef]
  9. Liu, L.W.; Chen, C.X.; Zhao, Y.F.; Zhao, E.D. China’s carbon-emissions trading: Overview, challenges and future. Renew. Sustain. Energ Rev. 2015, 49, 254–266. [Google Scholar] [CrossRef]
  10. Schenuit, F.; Brutschin, E.; Geden, O.; Guo, F.; Mohan, A.; Fiorini, A.C.O.; Saluja, S.; Schaeffer, R.; Riahi, K. Taking stock of carbon dioxide removal policy in emerging economies: Developments in Brazil, China, and India. Clim. Policy 2024, 25, 89–108. [Google Scholar] [CrossRef]
  11. Leung, D.Y.C.; Caramanna, G.; Maroto-Valer, M.M. An overview of current status of carbon dioxide capture and storage technologies. Renew. Sustain. Energ Rev. 2014, 39, 426–443. [Google Scholar] [CrossRef]
  12. Davis, S.J.; Lewis, N.S.; Shaner, M.; Aggarwal, S.; Arent, D.; Azevedo, I.L.; Benson, S.M.; Bradley, T.; Brouwer, J.; Chiang, Y.M.; et al. Net-zero emissions energy systems. Science 2018, 360, 6396. [Google Scholar] [CrossRef]
  13. Yang, Y.H.; Shi, Y.; Sun, W.J.; Chang, J.F.; Zhu, J.X.; Chen, L.Y.; Wang, X.; Guo, Y.P.; Zhang, H.T.; Yu, L.F.; et al. Terrestrial carbon sinks in China and around the world and their contribution to carbon neutrality. Sci. China Life Sci. 2022, 65, 861–895. [Google Scholar] [CrossRef] [PubMed]
  14. Alexandrov, G.; Yamagata, Y. Verification of carbon sink assessment: Can we exclude natural sinks? Clim. Chang. 2004, 67, 437–447. [Google Scholar] [CrossRef]
  15. Taillardat, P.; Friess, D.A.; Lupascu, M. Mangrove blue carbon strategies for climate change mitigation are most effective at the national scale. Biol. Lett. 2018, 14, 20180251. [Google Scholar] [CrossRef]
  16. Sasmito, S.D.; Sillanpää, M.; Hayes, M.A.; Bachri, S.; Saragi-Sasmito, M.F.; Sidik, F.; Hanggara, B.B.; Mofu, W.Y.; Rumbiak, V.I.; Hendri; et al. Mangrove blue carbon stocks and dynamics are controlled by hydrogeomorphic settings and land-use change. Glob. Change Biol. 2020, 26, 3028–3039. [Google Scholar] [CrossRef]
  17. Donato, D.C.; Kauffman, J.B.; Murdiyarso, D.; Kurnianto, S.; Stidham, M.; Kanninen, M. Mangroves among the most carbon-rich forests in the tropics. Nat. Geosci. 2011, 4, 293–297. [Google Scholar] [CrossRef]
  18. Sasmito, S.D.; Kuzyakov, Y.; Lubis, A.A.; Murdiyarso, D.; Hutley, L.B.; Bachri, S.; Friess, D.A.; Martius, C.; Borchard, N. Organic carbon burial and sources in soils of coastal mudflat and mangrove ecosystems. Catena 2020, 187, 104414. [Google Scholar] [CrossRef]
  19. Wang, F.M.; Sanders, C.J.; Santos, I.R.; Tang, J.W.; Schuerch, M.; Kirwan, M.L.; Kopp, R.E.; Zhu, K.; Li, X.Z.; Yuan, J.C.; et al. Global blue carbon accumulation in tidal wetlands increases with climate change. Natl. Sci. Rev. 2021, 8, nwaa296. [Google Scholar] [CrossRef]
  20. Christianson, A.B.; Cabre, A.; Bernal, B.; Baez, S.K.; Leung, S.; Perez-Porro, A.; Poloczanska, E. The promise of blue carbon climate solutions: Where the science supports ocean-climate policy. Front. Mar. Sci. 2022, 9, 851448. [Google Scholar] [CrossRef]
  21. Cui, X.W.; Liang, J.; Lu, W.Z.; Chen, H.; Liu, F.; Lin, G.X.; Xu, F.H.; Luo, Y.Q.; Lin, G.H. Stronger ecosystem carbon sequestration potential of mangrove wetlands with respect to terrestrial forests in subtropical China. Agric. For. Meteorol. 2018, 249, 71–80. [Google Scholar] [CrossRef]
  22. Zhu, J.J.; Yan, B. Blue carbon sink function and carbon neutrality potential of mangroves. Sci. Total Environ. 2022, 822, 153438. [Google Scholar] [CrossRef]
  23. Chen, S.; Chen, B.; Sastrosuwondo, P.; Dharmawan, I.W.E.; Ou, D.; Yin, X.; Yu, W.; Chen, G. Ecosystem carbon stock of a tropical mangrove forest in North Sulawesi, Indonesia. Acta Oceanol. Sin. 2018, 37, 85–91. [Google Scholar] [CrossRef]
  24. Charles, N. The role of mangroves forests in decarbonizing the atmosphere. In Carbon-Based Material for Environmental Protection and Remediation; Mattia, B., Marco, F., Luca, R., Eds.; IntechOpen: Rijeka, Croatia, 2020; pp. 123–145. [Google Scholar]
  25. Soeprobowati, T.R.; Sularto, R.B.; Hadiyanto, H.; Puryono, S.; Rahim, A.; Jumari, J.; Gell, P. The carbon stock potential of the restored mangrove ecosystem of Pasarbanggi, Rembang, Central Java. Mar. Environ. Res. 2024, 193, 106257. [Google Scholar] [CrossRef] [PubMed]
  26. Alongi, D.M. Impacts of climate change on blue carbon stocks and fluxes in mangrove forests. Forests 2022, 13, 149. [Google Scholar] [CrossRef]
  27. Alongi, D.M. Carbon cycling and storage in mangrove forests. Annu. Rev. Mar. Sci. 2014, 6, 195–219. [Google Scholar] [CrossRef]
  28. Fu, C.C.; Li, Y.; Zeng, L.; Zhang, H.B.; Tu, C.; Zhou, Q.; Xiong, K.X.; Wu, J.P.; Duarte, C.M.; Christie, P.; et al. Stocks and losses of soil organic carbon from Chinese vegetated coastal habitats. Glob. Change Biol. 2021, 27, 202–214. [Google Scholar] [CrossRef]
  29. Xiong, Y.M.; Liao, B.W.; Wang, F.M. Mangrove vegetation enhances soil carbon storage primarily through in situ inputs rather than increasing allochthonous sediments. Mar. Pollut. Bull. 2018, 131, 378–385. [Google Scholar] [CrossRef]
  30. McLeod, E.; Chmura, G.L.; Bouillon, S.; Salm, R.; Björk, M.; Duarte, C.M.; Lovelock, C.E.; Schlesinger, W.H.; Silliman, B.R. A blueprint for blue carbon: Toward an improved understanding of the role of vegetated coastal habitats in sequestering CO2. Front. Ecol. Environ. 2011, 9, 552–560. [Google Scholar] [CrossRef]
  31. Wu, M.X.; He, Z.Y.; Fung, S.T.; Cao, Y.J.; Guan, D.S.; Peng, Y.S.; Lee, S.Y. Species choice in mangrove reforestation may influence the quantity and quality of long-term carbon sequestration and storage. Sci. Total Environ. 2020, 714, 136742. [Google Scholar] [CrossRef]
  32. Ouyang, X.G.; Lee, S.Y. Improved estimates on global carbon stock and carbon pools in tidal wetlands. Nat. Commun. 2020, 11, 317. [Google Scholar] [CrossRef]
  33. Su, J.; Friess, D.A.; Gasparatos, A. A meta-analysis of the ecological and economic outcomes of mangrove restoration. Nat. Commun. 2021, 12, 5050. [Google Scholar] [CrossRef]
  34. Soares, M.O.; Bezerra, L.E.A.; Copertino, M.; Lopes, B.D.; Barros, K.V.d.S.; Rocha-Barreira, C.A.; Maia, R.C.; Beloto, N.; Cotovicz, L.C. Blue carbon ecosystems in Brazil: Overview and an urgent call for conservation and restoration. Front. Mar. Sci. 2022, 9, 797411. [Google Scholar] [CrossRef]
  35. Iram, N.; Maher, D.T.; Lovelock, C.E.; Baker, T.; Cadier, C.; Adame, M.F. Climate change mitigation and improvement of water quality from the restoration of a subtropical coastal wetland. Ecol. Appl. 2022, 32, e2620. [Google Scholar] [CrossRef] [PubMed]
  36. Cameron, C.; Hutley, L.B.; Friess, D.A.; Munksgaard, N.C. Hydroperiod, soil moisture and bioturbation are critical drivers of greenhouse gas fluxes and vary as a function of landuse change in mangroves of Sulawesi, Indonesia. Sci. Total Environ. 2019, 654, 365–377. [Google Scholar] [CrossRef]
  37. Arifanti, V.B.; Sidik, F.; Mulyanto, B.; Susilowati, A.; Wahyuni, T.; Subarno; Yulianti; Yuniarti, N.; Aminah, A.; Suita, E.; et al. Challenges and strategies for sustainable mangrove management in Indonesia: A review. Forests 2022, 13, 695. [Google Scholar] [CrossRef]
  38. Yang, F.; Wang, M.; Wang, W.Q.; Li, R.L.; Chen, G.G.; Chen, H.Z. Development technology and carbon trading strategies of mangrove carbon sink. Acta Sci. Nat. Univ. Pekin. 2024, 60, 723–731. [Google Scholar]
  39. Hong, L.C.; Hemati, Z.; Zakaria, R. Carbon stock evaluation of selected mangrove forests in Peninsular Malaysia and its potential market value. J. Environ. Sci. Manag. 2017, 20, 77–87. [Google Scholar] [CrossRef]
  40. Lin, C.Y.; Fu, C.Y.; Liu, Y.; Zhang, M.Q.; Liu, Y.; Wu, W.Y.; Wang, L.X.; Lin, X.H.; Fu, X.M. Assessing the changes of the monetary value of mangrove ecosystem services in China and its application. Front. Environ. Sci. 2022, 10, 1018801. [Google Scholar] [CrossRef]
  41. Sumarga, E.; Sholihah, A.; Srigati, F.A.E.; Nabila, S.; Azzahra, P.R.; Rabbani, N.P. Quantification of ecosystem services from urban mangrove forest: A case study in Angke Kapuk Jakarta. Forests 2023, 14, 1796. [Google Scholar] [CrossRef]
  42. Villa, J.A.; Bernal, B. Carbon sequestration in wetlands, from science to practice: An overview of the biogeochemical process, measurement methods, and policy framework. Ecol. Eng. 2018, 114, 115–128. [Google Scholar] [CrossRef]
  43. Grüneberg, E.; Ziche, D.; Wellbrock, N. Organic carbon stocks and sequestration rates of forest soils in Germany. Glob. Change Biol. 2014, 20, 2644–2662. [Google Scholar] [CrossRef]
  44. Ouyang, M.; Yang, C.; Tian, D.; Pan, J.; Chen, G.; Su, H.; Yan, Z.; Ji, C.; Tang, Z.; Fang, J. A field-based estimation of moso bamboo forest biomass in China. For. Ecol. Manag. 2022, 505, 119885. [Google Scholar] [CrossRef]
  45. Li, H.; Chen, H.; Huang, J.J. Partitioning urban forest evapotranspiration based on integrating eddy covariance of water vapor and carbon dioxide fluxes. Sci. Total Environ. 2024, 935, 173201. [Google Scholar] [CrossRef] [PubMed]
  46. Rebmann, C.; Aubinet, M.; Schmid, H.; Arriga, N.; Aurela, M.; Burba, G.; Clement, R.; De Ligne, A.; Fratini, G.; Gielen, B.; et al. ICOS eddy covariance flux-station site setup: A review. Int. Agrophysics 2018, 32, 471–494. [Google Scholar] [CrossRef]
  47. Frank, D.; Reichstein, M.; Bahn, M.; Thonicke, K.; Frank, D.; Mahecha, M.D.; Smith, P.; Van der Velde, M.; Vicca, S.; Babst, F.; et al. Effects of climate extremes on the terrestrial carbon cycle: Concepts, processes and potential future impacts. Glob. Change Biol. 2015, 21, 2861–2880. [Google Scholar] [CrossRef]
  48. Baldocchi, D.D. How eddy covariance flux measurements have contributed to our understanding of global change biology. Glob. Change Biol. 2020, 26, 242–260. [Google Scholar] [CrossRef]
  49. Schwalm, C.R.; Williams, C.A.; Schaefer, K. Carbon consequences of global hydrologic change, 1948–2009. J. Geophys. Res. 2011, 116, 42. [Google Scholar] [CrossRef]
  50. Tian, H.; Melillo, J.; Lu, C.; Kicklighter, D.; Liu, M.; Ren, W.; Xu, X.; Chen, G.; Zhang, C.; Pan, S.; et al. China’s terrestrial carbon balance: Contributions from multiple global change factors. Glob. Biogeochem. Cycle 2011, 25, GB1007. [Google Scholar] [CrossRef]
  51. Liu, H.X.; Ren, H.; Hui, D.F.; Wang, W.Q.; Liao, B.W.; Cao, Q.X. Carbon stocks and potential carbon storage in the mangrove forests of China. J. Environ. Manag. 2014, 133, 86–93. [Google Scholar] [CrossRef]
  52. Hredoy, R.R.; Islam, M.T.; Kamruzzaman, M. Variation in soil organic carbon with structural composition of mangrove species in the Sundarbans. Reg. Stud. Mar. Sci. 2024, 77, 103651. [Google Scholar] [CrossRef]
  53. Abdul-Hamid, H.; Mohamad-Ismail, F.-N.; Mohamed, J.; Samdin, Z.; Abiri, R.; Tuan-Ibrahim, T.-M.; Mohammad, L.-S.; Jalil, A.-M.; Naji, H.-R. Allometric equation for aboveground biomass estimation of mixed mature mangrove forest. Forests 2022, 13, 325. [Google Scholar] [CrossRef]
  54. Aslan, A.; Aljahdali, M.O. Characterizing global patterns of mangrove canopy height and aboveground biomass derived from SRTM data. Forests 2022, 13, 1545. [Google Scholar] [CrossRef]
  55. Banerjee, K.; Sahoo, C.K.; Bal, G.; Paul, R. Allometric model based on dendrometrical measurements in mangroves of western Bay of Bengal. Trop. Ecol. 2022, 63, 351–364. [Google Scholar] [CrossRef]
  56. Fatoyinbo, T.E.; Simard, M. Height and biomass of mangroves in Africa from ICESat/GLAS and SRTM. Int. J. Remote Sens. 2013, 34, 668–681. [Google Scholar] [CrossRef]
  57. Tang, W.W.; Zheng, M.R.; Zhao, X.; Shi, J.Y.; Yang, J.X.; Trettin, C.C. Big geospatial gata analytics for global mangrove biomass and carbon estimation. Sustainability 2018, 10, 472. [Google Scholar] [CrossRef]
  58. Banerjee, K.; Sengupta, K.; Raha, A.; Mitra, A. Salinity based allometric equations for biomass estimation of Sundarban mangroves. Biomass Bioenergy 2013, 56, 382–391. [Google Scholar] [CrossRef]
  59. Saenger, P.; Snedaker, S.C. Pantropical trends in mangrove aboveground biomass and annual litterfall. Oecologia 1993, 96, 293–299. [Google Scholar] [CrossRef]
  60. Zhang, F.; Jin, L.; Ye, Y. Spatial and temporal variations of phytoplankton community structure and species diversity in mangrove restoration area of Haicang Bay, Xiamen. Chin. J. Ecol. 2023, 42, 1604–1609. [Google Scholar]
  61. Ye, Y.; Sun, L.; Zhou, L.; Lu, C.; Yao, Y.; Chen, W. Mercury release flux and its influencing factors from urban tidal flat of young Kandelia candel plantation. Chin. J. Ecol. 2020, 39, 3817–3828. [Google Scholar]
  62. Khan, M.N.I.; Suwa, R.; Hagihara, A. Biomass and aboveground net primary production in a subtropical mangrove stand of Kandelia obovata (S., L.) Yong at Manko Wetland, Okinawa, Japan. Wetl. Ecol. Manag. 2009, 17, 585–599. [Google Scholar] [CrossRef]
  63. Kusmana, C.; Hidayat, T.; Tiryana, T.; Rusdiana, O.; Istomo. Allometric models for above- and below-ground biomass of Sonneratia spp. Glob. Ecol. Conserv. 2018, 15, e00417. [Google Scholar]
  64. Perera, K.A.R.S.; de Silva, W.; Amaransinghe, M.D. Carbon stocks in mangrove ecosystems of Sri Lanka: Average contributions and determinants of sequestration potential. Ocean Coast. Manag. 2024, 257, 107357. [Google Scholar] [CrossRef]
  65. Luo, Y.; Wang, X.; Zhang, X.; Booth, T.H.; Lu, F. Root:shoot ratios across China’s forests: Forest type and climatic effects. For. Ecol. Manag. 2012, 269, 19–25. [Google Scholar] [CrossRef]
  66. Jin, C.; Wang, J.W.; Zheng, J.; Chen, Q.X.; Li, J.Q.; Lu, X. An assessment method of Kandelia obovata population biomass. Acta Ecol. Sin. 2012, 32, 3414–3422. [Google Scholar]
  67. He, Q.F.; Zheng, W.; Huang, X.R.; Liu, X.; Shen, W.H.; He, F. Carbon storage and distribution of mangroves at Qinzhou bay. J. Cent. South Univ. For. Technol. 2017, 37, 121–126. [Google Scholar]
  68. Thi Kim Cuc, N.; Thi Hien, H. Stand structure and above ground biomass of Kandelia obovata Sheue, H.Y. Liu & J. Yong mangrove plantations in Northern, Viet Nam. For. Ecol. Manag. 2021, 483, 118720. [Google Scholar]
  69. Khan, M.N.I.; Suwa, R.; Hagihara, A. Carbon and nitrogen pools in a mangrove stand of Kandelia obovata (S., L.) Yong: Vertical distribution in the soil–vegetation system. Wetl. Ecol. Manag. 2007, 15, 141–153. [Google Scholar] [CrossRef]
  70. Wu, K.L.; Qiu, Y.; Wu, J.J.; Lu, C.Y.; Ye, Y. Carbon storage of artificial Kandelia obovata forest in different restorationtime at Yundang Lake of Xiamen. J. Appl. Oceanogr. 2024, 43, 744–752. [Google Scholar]
  71. Yan, J.Y.; He, D.J.; Li, X.J.; Wang, R.; Cai, J.B.; You, W.B.; Su, S.C.; Zhang, Z.R.; Xiao, S.H. Comparative studies on the carbon storage between the Kandelia candel natural forests and plantations in north mangrove forests of China. Chin. J. Trop. Crops 2013, 34, 1395–1401. [Google Scholar]
  72. Lin, J.S. Studies on biomass of Kandelia candel community in Pingtan coast of Fujian Province. Prot. For. Sci. Technol. 2005, 65, 6–8. [Google Scholar]
  73. Ren, H.; Chen, H.; Li, Z.A.; Han, W.D. Biomass accumulation and carbon storage of four different aged Sonneratia apetala plantations in Southern China. Plant Soil 2010, 327, 279–291. [Google Scholar] [CrossRef]
  74. Ohtsuka, T.; Umnouysin, S.; Suchewaboripont, V.; Yimatsa, N.; Rodtassana, C.; Kida, M.; Iimura, Y.; Yoshitake, S.; Fujitake, N.; Poungparn, S. Biomass recovery of coastal young mangrove plantations in Central Thailand. Sci. Rep. 2024, 14, 11359. [Google Scholar] [CrossRef] [PubMed]
  75. Vinh, T.V.; Marchand, C.; Linh, T.V.K.; Vinh, D.D.; Allenbachd, M. Allometric models to estimate above-ground biomass and carbon stocks in Rhizophora apiculata tropical managed mangrove forests (Southern Viet Nam). For. Ecol. Manag. 2019, 434, 131–141. [Google Scholar] [CrossRef]
  76. Wang, X.; Zhou, L.; Lu, C. Do environmental factors affect the male frequency of exotic mangrove species Laguncularia racemosa (Combretaceae) along the southeast coast of China? Aquat. Ecol. 2018, 52, 235–244. [Google Scholar] [CrossRef]
  77. Clough, B.; Dixon, P.; Dalhaus, O. Allometric relationships for estimating biomass in multi-stemmed mangrove trees. Aust. J. Bot. 1997, 45, 1023–1031. [Google Scholar] [CrossRef]
  78. Hoque, A.; Sharma, S.; Deshar, R.; Analuddin, K.; Hagihara, A. Allometric relationships for estimating the aboveground mass and leaf area of mangrove Bruguiera gymnorrhiza trees in Manko Wetland, Okinawa Island, Japan. In Proceedings of the 2010 International Conference on Environmental Science and Development, Singapore, Singapore, 26–28 February 2010; pp. 441–446. [Google Scholar]
  79. Zhu, D.H.; Hui, D.F.; Wang, M.Q.; Yang, Q.; Li, Z.; Huang, Z.J.; Yuan, H.M.; Yu, S.X. Allometric growth and carbon storage in the mangrove Sonneratia apetala. Wetl. Ecol. Manag. 2021, 29, 129–141. [Google Scholar] [CrossRef]
  80. Dahdouh-Guebas, F.; Koedam, N. Empirical estimate of the reliability of the use of the Point-Centred Quarter Method (PCQM): Solutions to ambiguous field situations and description of the PCQM plus protocol. For. Ecol. Manag. 2006, 228, 1–18. [Google Scholar] [CrossRef]
  81. Cuc, N.T.K.; Lkuo, N. Allometric relations for young Kandelia candel (L.) Blanco plantation in northern Vietnam. J. Biol. Sci. 2007, 7, 539–543. [Google Scholar]
  82. Suwa, R.; Analuddin, K.; Khan, M.N.I.; Hagihara, A. Structure and productivity along a tree height gradient in a Kandelia obovata mangrove forest in the manko wetland, Okinawa Island, Japan. Wetl. Ecol. Manag. 2008, 16, 331–343. [Google Scholar] [CrossRef]
  83. Wu, X.; Zhao, X.; Gu, W.F.; Zhu, K.H.; Ge, Z.M. Comparative study on soil carbon sinks of artificial Kandelia obovate mangrove and Spartina alterniflora salt marsh in southern Zhejiang coastal zone. J. Trop. Oceanogr. 2025, 44, 172–181. [Google Scholar]
  84. Bhomia, R.; Kauffman, J.; McFadden, T. Ecosystem carbon stocks of mangrove forests along the Pacific and Caribbean coasts of Honduras. Wetl. Ecol. Manag. 2016, 24, 187–201. [Google Scholar] [CrossRef]
  85. Lin, W.J.; Lin, C.W.; Wu, H.H.; Kao, Y.C.; Lin, H.J. Mangrove carbon budgets suggest the estimation of net production and carbon burial by quantifying litterfall. Catena 2023, 232, 107421. [Google Scholar] [CrossRef]
  86. Zhang, Y.X.; Hu, W.F.; Luo, M.; Tong, C.; Zhao, L.L.; Chen, K.L.; Huang, J.F. Litter production and decomposition dynamics of Kandelia obovate from a mangrove swamp in Min River estuary. Acta Sci. Circumstantiae 2019, 39, 1312–1323. [Google Scholar]
  87. Zheng, F.Z.; Lin, P.; Lu, C.Y.; Zheng, W.J. Interannual dynamic of litter fall of Kandelia candel mangrove and energy flow through the litter in Jiulongjiang Estuary, Fujian Province, China. Acta Ecol. Sin. 1998, 18, 113–118. [Google Scholar]
  88. Liu, L.N.; Li, F.L.; Yang, Q.; Tam, N.F.Y.; Liao, W.B.; Zan, Q.J. Long-term differences in annual litter production between alien (Sonneratia apetala) and native (Kandelia obovata) mangrove species in Futian, Shenzhen, China. Mar. Pollut. Bull. 2014, 85, 747–753. [Google Scholar] [CrossRef]
  89. Kauffman, J.B.; Adame, M.F.; Arifanti, V.B.; Schile-Beers, L.M.; Bernardino, A.F.; Bhomia, R.K.; Donato, D.C.; Feller, I.C.; Ferreira, T.O.; Jesus Garcia, M.d.C.; et al. Total ecosystem carbon stocks of mangroves across broad global environmental and physical gradients. Ecol. Monogr. 2020, 90, e01405. [Google Scholar] [CrossRef]
  90. Lovelock, C.E.; Brown, B.M. Land tenure considerations are key to successful mangrove restoration. Nat. Ecol. Evol. 2019, 3, 1135. [Google Scholar] [CrossRef]
  91. Qiao, P.; Meng, Y.; Liu, C.; Zhang, T.; Li, M.; Feng, L.; Chen, Q.; Zhang, J.; Lin, C.; Gu, X.; et al. Blue carbon potential from rehabilitating urban mangrove forests in coastal city. Estuar. Coast. Shelf Sci. 2025, 316, 109200. [Google Scholar] [CrossRef]
  92. Tan, J.; Wang, R. Research on evaluation and influencing factors of regional ecological efficiency from the perspective of carbon neutrality. J. Environ. Manag. 2021, 294, 113030. [Google Scholar] [CrossRef]
Figure 1. (a) Map of China, with the yellow mark highlighting the location of Fujian Province. (b) Map of Fujian Province. The box represents a portion of Xiamen, and the five-pointed star represents the sampling area. (c) The satellite photo of the sampling area, showing the two sampling plots (P1 and P2).
Forests 16 01126 g001
Figure 2. Growth rate of biomass in different tissues of Kandelia obovata. Boxes shown in the same color but with different letters are significantly different (p < 0.05, Kruskal–Wallis test).
Forests 16 01126 g002
Figure 3. Comparison of two allometric models for Kandelia obovata biomass.
Forests 16 01126 g003
Figure 4. Interannual variation in biomass carbon content in Kandelia obovata tissues.
Forests 16 01126 g004
Figure 5. Profile distribution of sediment carbon content over different years. Different letters in black text mark differences among bars at the same depth; colored letters denote differences among bars from the same sampling year (p < 0.05, Kruskal–Wallis test).
Forests 16 01126 g005
Figure 6. Carbon content coefficients in young Kandelia obovata tissues (±SD).
Forests 16 01126 g006
Figure 7. Carbon content coefficients in young Kandelia obovata tissues (1 SD).
Forests 16 01126 g007
Table 1. Initial conditions of the constructed wetland with a Kandelia obovata plantation.
Site Characteristics Planting Conditions
Area25.6 haSoil depth2.5–3.5 mSeedling height55–75 cm
(Rooted seedlings)
Elevation1.8 mSalinity13.6‰Seedling age11–16 months
Soil typeSaline–alkali marshElectrical conductivity
(EC)
21.4 dS/mPlanting density49,500 plants·ha−1
Table 2. Sampling and growth information of the Kandelia obovata samples (±SD).
Sampling TimeAge
(Years)
Sample PlotnTree NumberH (cm)D (cm)
2016111P1422863.1 ± 7.21.74 ± 0.13
P24218
2018103P14152107.2 ± 8.73.26 ± 0.17
P24146
2020115P14124130.1 ± 9.64.39 ± 0.35
P24118
2022097P14100165.0 ± 9.66.37 ± 0.47
P23108
2024109P1392211.2 ± 8.98.42 ± 0.72
Table 3. Biomass of the Kandelia obovata samples (unit, g, ±SD).
Age (Years)nTotalLeafTrunkBranchAboveground BiomassBelowground Biomass
18120 ± 1715 ± 645 ± 718 ± 278 ± 1142 ± 10
38597 ± 5460 ± 16251 ± 25148 ± 20459 ± 33139 ± 39
581209 ± 158128 ± 30481 ± 111249 ± 64858 ± 182351 ± 101
772732 ± 386453 ± 142921 ± 117648 ± 992022 ± 228710 ± 158
964365 ± 585797 ± 1451593 ± 221900 ± 1933289 ± 4661077 ± 274
Table 4. Biomass allocation of Kandelia obovata at different stand ages (unit, %, ±SD).
Age (Years)nLeafTrunkBranchBelowground BiomassAboveground Biomass
1812.0 ± 3.9 (b) 138.1 ± 5.1 (ab)15.2 ± 1.2 (c)34.7 ± 5.1 (a)65.3 ± 4.7 (b)
389.9 ± 2.2 (b)42.3 ± 5.5 (a)24.7 ± 2.5 (a)23.0 ± 4.8 (b)77.0 ± 4.5 (a)
5810.5 ± 1.9 (b)39.5 ± 6.3 (ab)20.3 ± 3.4 (b)29.6 ± 10.3 (ab)70.4 ± 9.7 (ab)
7716.6 ± 4.5 (a)33.8 ± 1.6 (b)23.8 ± 2.9 (ab)25.8 ± 2.8 (ab)74.2 ± 2.6 (ab)
9618.2 ± 1.6 (a)36.6 ± 3.5 (ab)20.5 ± 2.5 (b)24.7 ± 5.5 (b)75.3 ± 5.0 (a)
Mean 13.1 ± 4.338.3 ± 5.320.9 ± 4.227.8 ± 7.372.2 ± 7.3
1 Lowercase letters denote significant differences between values in the same column (p < 0.05) according to a Kruskal–Wallis test.
Table 5. Summary of the allometric equations describing total biomass of Kandelia obovata.
ComponentEquationR2RMSE
(kg)
Leaf0.0046D2.4200.9460.068
0.0093(D2H)0.8900.9460.068
Trunk0.0305D1.8470.9730.087
0.0524(D2H)0.6800.9750.083
Branch0.0185D1.8420.9510.072
0.0324(D2H)0.6730.9480.075
Root
(BGB)
0.0244D1.7800.8960.125
0.0403(D2H)0.6610.9040.121
AGB0.0499D1.9660.9820.150
0.0895(D2H)0.7220.9820.151
Total0.0774D1.8960.9820.206
0.1350(D2H)0.6980.9840.195
Table 6. Litter carbon stock of Kandelia obovata in the constructed wetland (unit, g·kg−1, n = 3, ±SD).
SeasonLeafBranchPropagule
Summer (202407)484.5 ± 47.2 (a) 1443.7 ± 10.6 (a)0
Autumn (202410)437.2 ± 66.4 (a)473.5 ± 38.3 (a)0
Winter (202501)367.9 ± 8.9 (b)468.5 ± 29.4 (a)385.7 ± 31.9 (a)
Spring (202504)458.7 ± 36.1 (a)440.6 ± 31.0 (a)436.6 ± 12.4 (a)
Mean437.1 ± 59.2453.2 ± 27.6416.2 ± 33.3
1 Lowercase letters denote significant differences between values in the same column (p < 0.05).
Table 7. Comparison of mangrove growth and aboveground biomass by different locations.
LocationLatitudeSpeciesρ
(×104 ha−1)
Age
(Years)
Forest TypeHeight
(m)
Aboveground Biomass
(Mg·ha−1)
Aboveground Biomass Increase
(Mg·ha−1·yr−1)
Reference
Aojiang Estuary, China27°35′ NKandelia
obovata
2.005Plantation0.735.59 [66]
0.96101.5315.05
Shacheng Bay, China27°16′ NKandelia
obovata
1.207Plantation1.8014.57 [71]
Okinawa Island, Japan26°11′ NKandelia
obovata
10Primary2.8275.105.35–5.98[69]
Pingtan Island, China25°31′ NKandelia
obovata
0.959Plantation1.9210.73 [72]
Yundang Lagoon, China24°29′ NKandelia
obovata
6.6710Plantation on constructed wetland2.10136.8 [70]
Qinzhou Bay, China21°48′ NKandelia
obovata
0.407Plantation1.346.15 [67]
Thai Binh River and Red River Mouths, Viet Nam20°36′ NKandelia
obovata
1.225Plantation1.1715.373.07[68]
1.0171.3921.012.85
2.5691.7237.964.21
Leizhou Bay, China20°30′ NSonneratia apetala0.1310Plantation13.379.08.4[73]
Chao Phraya River Mouth, Thailand13°31′ NAvicennia alba0.149Plantation8.58116.1 [74]
Mekong Delta, Viet Nam8°35′ NRhizophora apiculata1.1010Plantation13.6372.337.2[75]
Haicang Bay, China24°28′ NKandelia
obovata
2.425Plantation on constructed wetland1.3020.763.54This study
2.0871.6542.0510.66
1.8892.1161.8314.31
Table 8. Carbon stocks in vegetation and sediments of young Kandelia obovata plantations (Mg C·ha−1, 1 SD).
Age
(Years)
Total WetlandSedimentTotal PlantLitterρ (×104 ha−1)
198.2 ± 1.596.1 ± 1.12.1 ± 0.4N.D.4.46 ± 0.10
399.5 ± 4.192.4 ± 3.37.1 ± 0.8N.D.2.98 ± 0.06
5107.6 ± 9.795.6 ± 8.212.0 ± 1.5N.D.2.42 ± 0.06
7121.1 ± 5.897.4 ± 1.823.7 ± 4.0N.D.2.08 ± 0.08
9135.1 ± 15.5 199.5 ± 9.235.6 ± 6.31.9 ± 0.21.88 ± 0.04
1 This value excludes litter; when included, the value becomes 137 Mg C·ha−1.
Disclaimer/Publisher’s Note: The statements, opinions and data contained in all publications are solely those of the individual author(s) and contributor(s) and not of MDPI and/or the editor(s). MDPI and/or the editor(s) disclaim responsibility for any injury to people or property resulting from any ideas, methods, instructions or products referred to in the content.

