Article

Stem Heating Enhances Growth but Reduces Earlywood Lumen Size in Two Pine Species and a Ring-Porous Oak

by
J. Julio Camarero
1,*,
Filipe Campelo
2,
Jesús Revilla de Lucas
1,
Michele Colangelo
3 and
Álvaro Rubio-Cuadrado
1,4
1
Instituto Pirenaico de Ecología (IPE-CSIC), Avda. Montañana 1005, 50192 Zaragoza, Spain
2
Centre for Functional Ecology, Department of Life Sciences, University of Coimbra, Calçada Martim de Freitas, 3000-456 Coimbra, Portugal
3
Scuola di Scienze Agrarie, Forestali, Alimentari e Ambientali, Università della Basilicata, Viale dell’Ateneo Lucano 10, 85100 Potenza, Italy
4
Departamento de Sistemas y Recursos Naturales, Escuela Técnica Superior de Ingeniería de Montes, Forestal y del Medio Natural, Universidad Politécnica de Madrid, Ciudad Universitaria s/n, 28040 Madrid, Spain
*
Author to whom correspondence should be addressed.
Forests 2025, 16(7), 1080; https://doi.org/10.3390/f16071080
Submission received: 26 May 2025 / Revised: 22 June 2025 / Accepted: 24 June 2025 / Published: 28 June 2025
(This article belongs to the Special Issue Drought Tolerance in ​Trees: Growth and Physiology)

Abstract

Climate models forecast warmer winter conditions, which could lead to an earlier spring xylem phenology in trees. Localized stem heat experiments mimic this situation and have shown that stem warming leads to an earlier cambial resumption in evergreen conifers. However, there are still few comprehensive studies comparing the responses to stem heating in coexisting conifers and hardwoods, particularly in drought-prone regions where temperatures are rising. We addressed this issue by comparing the responses (xylem phenology, wood anatomy, growth, and sapwood concentrations of non-structural carbohydrates—NSCs) of two pines (the Eurosiberian Pinus sylvestris L., and the Mediterranean Pinus pinaster Ait.) and a ring-porous oak (Quercus pyrenaica Willd.) to stem heating. We used the Vaganov-Shashkin growth model (VS model) to simulate growth phenology considering several emission scenarios and warming rates. Stem heating in winter advanced cambial phenology in P. pinaster and Q. pyrenaica and enhanced radial growth of the three species 1–2 years after the treatment, but reduced the transversal lumen area of earlywood conduits. P. sylvestris showed a rapid and high growth enhancement, whereas the oak responded with a 1-year delay. Heated P. pinaster and Q. pyrenaica trees showed lower sapwood starch concentrations than non-heated trees. These results partially agree with projections of the VS model, which forecasts earlier growth onset, particularly in P. pinaster, as climate warms. Climate-growth correlations show that growth may be enhanced by warm conditions in late winter but also reduced if this is followed by dry-warm growing seasons. Therefore, forecasted advancements of xylem onset in spring in response to warmer winters may not necessarily translate into enhanced growth if warming reduces the hydraulic conductivity and growing seasons become drier.

1. Introduction

Wood formation is a complex process that is of utmost importance for the functioning of the biosphere, influencing carbon sequestration by forests and mitigation of climate change [1]. Understanding how wood formation is driven by climate is essential for predicting how trees will respond to climate warming, particularly if warmer winter conditions lead to an earlier cambial resumption and enhanced radial growth, as has been observed in temperate and boreal forests [2]. Furthermore, insufficient winter chilling due to warmer conditions could also predispose to climate hazards, including droughts or late frosts [3]. Several studies have investigated how an earlier cambial onset in spring could be linked to advanced leaf bursting and higher growth rates, but it is still unclear if an earlier start of the growing season leads to improved wood production and how these impacts tree functioning [4,5].
During winter dormancy (endodormancy), when chilling requirements are accumulated, the resumption of cambial activity is not responsive to higher temperatures [6]. However, ecodormancy starts when chilling requirements are fulfilled and the persistence of low temperatures maintains the tree in an apparent dormant state, the so-called quiescent stage. During this phase, warmer temperatures can trigger the resumption of cambial activity [7]. Increased temperatures in winter and early spring are closely associated with the onset of cambial activity and the start of xylem differentiation [8]. Previous studies have suggested that localized heating of stems during winter can trigger the breaking of cambial dormancy in evergreen conifers and enhance growth [9,10,11,12,13,14,15].
However, other external factors in addition to temperature, such as photoperiod, may also influence cambial reactivation and xylem differentiation in evergreen conifers and deciduous hardwoods [16]. In addition, changes in concentrations of non-structural carbohydrates (NSC) within the cambial zone are linked to growth demand, i.e., sink activity [17]. For instance, heating triggered localized reactivation of cambial activity, but cambial divisions stopped after producing a few cells due to the depletion of sucrose and starch from the closest storage tissues [11]. In addition, freeze-resistant soluble sugars increase in winter, probably acting as osmolytes, whereas concentrations of stored sugars such as starch decrease [17].
Understanding the environmental drivers impacting early-season aboveground phenology and wood formation, such as photoperiod and temperature [16], is crucial for assessing correctly forest productivity under changing climatic conditions. The timing of bud burst in spring and the beginning of the growing season are particularly important due to their impact on carbon sequestration and growth [16,18]. Nevertheless, recent analyses have shown that leaf and wood phenology are decoupled [4,19].
In addition to experimental approaches, process-based models allow growth forecasting, which is a crucial need as the climate keeps warming. Here, we used a refined version of the process-based Vaganov-Shashkin (hereafter VS) model to model radial growth as a function of local climate conditions (air temperature, soil moisture) and solar radiation [20,21]. This model has been successfully used to simulate the growth of Mediterranean conifer and oak species, the focus species of this study [22,23,24]. We follow an approach to forecast changes in the early growing-season phenology and growth length in response to future climate scenarios.
The main objective of this study is to investigate the effect of localized stem heating on wood anatomy (lumen area and cell-wall thickness) and the growth (tree-ring width) in two pines (Pinus sylvestris and Pinus pinaster) coexisting with a ring-porous oak species (Quercus pyrenaica). This will allow elucidating potential differences in their responses to stem heating and provide insight into the strategies employed by different functional types (evergreen conifer and deciduous hardwood) in response to warmer conditions. We hypothesize that stem heating will impact differently wood anatomy, phenology, and growth in pine and oak species. Warmer late winter and early spring temperatures induce earlier differentiation of overwintering cambial derivatives [25], which leads to the formation of narrower earlywood vessels in ring-porous species [26,27]. This has been observed in Mediterranean ring-porous oaks [28]. Therefore, we expect that the stem heating will trigger the formation of earlywood vessels with smaller lumen area, at least in the oak species. We also expect that heating will advance cambial resumption, enhance growth, and increase the concentration of soluble sugars, thus decreasing starch concentrations, to sustain more active growth.

2. Materials and Methods

2.1. Study Area

The study area is located in the Valonsadero forest (41°47′30″–41°50′10″ N and 2°35′20”–2°29′40″ W, 1060–1095 m a.s.l.), near Soria, central Spain (Figure 1). It is a woodland dominated by coppices and formerly pollarded Pyrenean oak (Quercus pyrenaica Willd.) and by natural and planted stands of Scots pine (Pinus sylvestris L.) and Maritime pine (Pinus pinaster Ait.). There are also small stands of poplar species (Populus tremula L. and Populus nigra L.) and some isolated stands of Portuguese oak (Quercus faginea Lam.). The study stands have not been managed (thinned, pruned, or pollarded) since the 1970s. The study sites are located on an almost flat terrain. Soils are deep and acidic.
The climate in the study area is Mediterranean with continental influence. Climate variables at daily and monthly resolutions (mean temperature, mean maximum and minimum temperatures, and total rainfall) from the Soria weather station (41°27′36″ N, 02°16′48″ W, 1082 m; located at a similar elevation as the study site at only 5 km away) were used. The average annual temperature of the study area is 11.4 °C, with the average temperatures of the coldest and warmest months being 2.9 °C (January) and 20.0 °C (July), respectively (data for the period 1950–2011). There are at least 3 months when frosts occur (December, January, and February). The total annual precipitation is 539 mm. There is a precipitation peak in spring (142 mm), and a seasonal minimum value is recorded in summer (110 mm). According to the climate diagram (Figure S1, Supplementary Data), the dry period lasts from July to August. The annual climatic water deficit (difference between precipitation and potential evapotranspiration), estimated using the Penman-Monteith method [29], was 169 mm. Monthly soil water content was calculated using a hydrological sub-model based on temperatures and precipitation as input data and considered interception, evaporation, transpiration, surface runoff, soil infiltration, and snow dynamics [30].
To characterize the climatic conditions during the study year (2012), daily data from the Fuentecantos station (41°50′55″ N, 2°25′43″ W, 1029 m), located about 11 km from the study site, were used. Data from the period 2002–2013 were also used for comparison with the Soria station, and significant (p < 0.01) correlations were obtained for temperature (r = 0.97) and precipitation data (r = 0.81).

2.2. Study Tree Species

Both study pines are evergreen species. Scots pine (P. sylvestris) shows a wide distribution across Eurasia, extending from Spain to Siberia. It is a shade-intolerant pioneer species that reduces its transpiration under drought conditions, and such isohydric behavior results in low carbon acquisition during dry periods [31].
Maritime pine (P. pinaster) is a common species native to seasonally dry areas of the western Mediterranean Basin and showing large ecological amplitude from continental to maritime influence, but mainly in sites with acid soils. Pinus sylvestris is less drought tolerant than P. pinaster, which shows a higher growth responsiveness to changes in precipitation and soil moisture [32].
The Spanish oak (Q. pyrenaica) is a winter-deciduous species with ring-porous wood that occurs mainly in continental areas of the western Mediterranean basin with deep, acid soils showing high water availability [33]. This oak species has a deep taproot, which allows access to deep soil water under drought conditions following an anisohydric strategy [34,35]. It can form pure or mixed stands with the study pine species.

2.3. Climate Data

Daily climatic data (precipitation and minimum and maximum temperature) were downloaded from the Soria meteorological station for the period between 1 January 1956 and 31 December 2013. The daily climate was used to estimate monthly climatic data (mean temperature, precipitation, and soil water content).

2.4. Growth and Phenology Monitoring

To investigate spring phenology and xylogenesis, four dominant and apparently healthy trees of the three species were selected in March 2012 and randomly assigned to heating (n = 2 individuals per species) or non-heating (n = 2 individuals per species) treatments. The diameters at breast height (dbh) and total height were measured for each selected tree (Table 1). One 3-year-old branch from the upper, sunniest third of the canopy was collected every week with a stick for bud and leaf development monitoring. Sampling was carried out from early March, when trees were dormant, to early June 2023, when trees were actively producing wood.
In addition to spring phenology monitoring, xylogenesis during the early growing season was also monitored on the same sampling dates in heated and non-heated trees. Specifically, we focused on the onset date of xylem formation, which depends on prior winter conditions [7]. Wood microcores of a 2 mm diameter were extracted with a Trephor microborer from the stem, at a height range between 1.0 and 1.5 m, of four individuals per species [36]. Samples were extracted following a spiral along the stem and separated by at least 10–15 cm from the previous sampling to prevent the influence of reaction wood. The microcores were processed as follows: embedding, cutting them on a sliding microtome (10–20 μm thickness), and staining the resulting cross-sections [36]. Sections of pine species were stained with cresyl fast violet (1.5%) and observed with visible and polarized light to differentiate the developing xylem cells, whereas oak samples were stained with safranin (1%) and astra blue (0.5%). The xylem onset date was considered when at least two radially enlarging cells were observed in two different radial lines of the microcore.

2.5. Stem Heating Experiment

Flexible silicone heater sheets (200 mm × 2000 mm, Urrutia 2000, Spain) were wrapped around the trunk of two trees per species in two locations (Figure S2). Localized heat treatment started in October 2012 and continued until May 2013. The heating treatment was carried out in two sites where stems of P. sylvestris-Q. pyrenaica (“Centro” site) and P. pinaster (“Vivero” site) were heated (see Figure 1). In each site, meteorological conditions (air and soil temperatures, precipitation, relative humidity, and soil moisture at 15 cm depth) were recorded by different sensors (CS650 water content reflectometers and CS215 L temperature and relative humidity probes) every 15 min and stored in a data logger (Campbell Scientific CR1000, North Logan, UT, USA). Heating sheets were placed at a 1.3 m height. The heating wire covered the whole perimeter of the trunk of each tree across a 20 cm high area, and this region was used as the locally heated stem area after carefully removing the dead bark. An alternating current of 220 V was passed through the heating sheet to heat the stem surface. A platinum resistance temperature sensor (RS PRO PT1000 RTD Detector, 2 Wire, Chip, Class A +500 °C Max; RS, London, UK) was connected to the datalogger. This sensor was used to measure the temperature of the heated xylem area, located between the outer bark and the heating tape. A temperature controller (Carel IR33A9MR20, Padova, Italy) was used to keep the temperature between 18 and 22 °C, i.e., from +10 to 12 °C above air temperature (Figure S3). Temperature control was achieved using a solid-state relay (Crydom CN240A05B, Attleboro, MA, USA) and another temperature controller (Carel IR33W7LR20, Padova, Italy) as a security system in case of failure. Both controllers use platinum resistance temperature sensors to measure xylem temperature. Two nearby individuals per species, of similar diameter at 1.3 m as heated trees, were kept without electric heaters to be used as non-heated or control trees. Xylem temperatures were measured with thermocouples and stored every 15 min in data loggers.

2.6. Field Sampling and Dendrochronological Data

For each tree species, 20 mature individuals were selected and sampled. First, their diameter at breast height was measured using tapes (Table 2). Second, two cores were taken with a 5 mm Pressler increment borer at 1.3 m from each tree. Coring was conducted in 2009 and 2020. Wood cores were air-dried, glued onto supports, and sanded with progressively finer sandpaper. Tree rings were visually cross-dated under the stereomicroscope and measured to the nearest 0.01 mm using a LINTAB-TSAP measuring system (Rinntech, Heidelberg, Germany). Cross-dating quality of tree-ring series was evaluated using the COFECHA program, which calculated moving correlations between ring-width series and pinpointed the dates showing the highest correlation [37]. We also measured the earlywood and latewood widths in the pine species. The age at 1.3 m was estimated by counting the number of rings from bark to pith.
Size-related, ontogenetic growth trends were removed from ring-width series through detrending using the dplR [38] and detrendeR packages [39]. Cubic smoothing splines with a 50% frequency-response cut-off equal to 30 years were used to remove part of the low- to medium-frequency variability. First-order autocorrelation was partially eliminated by fitting autoregressive models. Finally, mean series of residual ring-width indices (TRWi) and also of earlywood and latewood width indices were obtained by averaging the resulting pre-whitened TRWi series using a bi-weight robust mean.
The statistical quality of each chronology was assessed by calculating several statistics: first-order autocorrelation (AR1), mean sensitivity (MSx), mean correlation between series (Rbar), and Expressed Population Signal (EPS). The EPS shows how well the built chronologies represent a coherent, well-replicated chronology [40]. We considered a threshold of EPS > 0.85 to determine the reliable, best-replicated common period. Mean annual tree-ring width, MS, and AR1 were calculated on raw data, whereas indexed-TRWi series were used to calculate Rbar and EPS (Table 2).

2.7. Changes in Concentrations of Non-Structural Carbohydrates (NSCs)
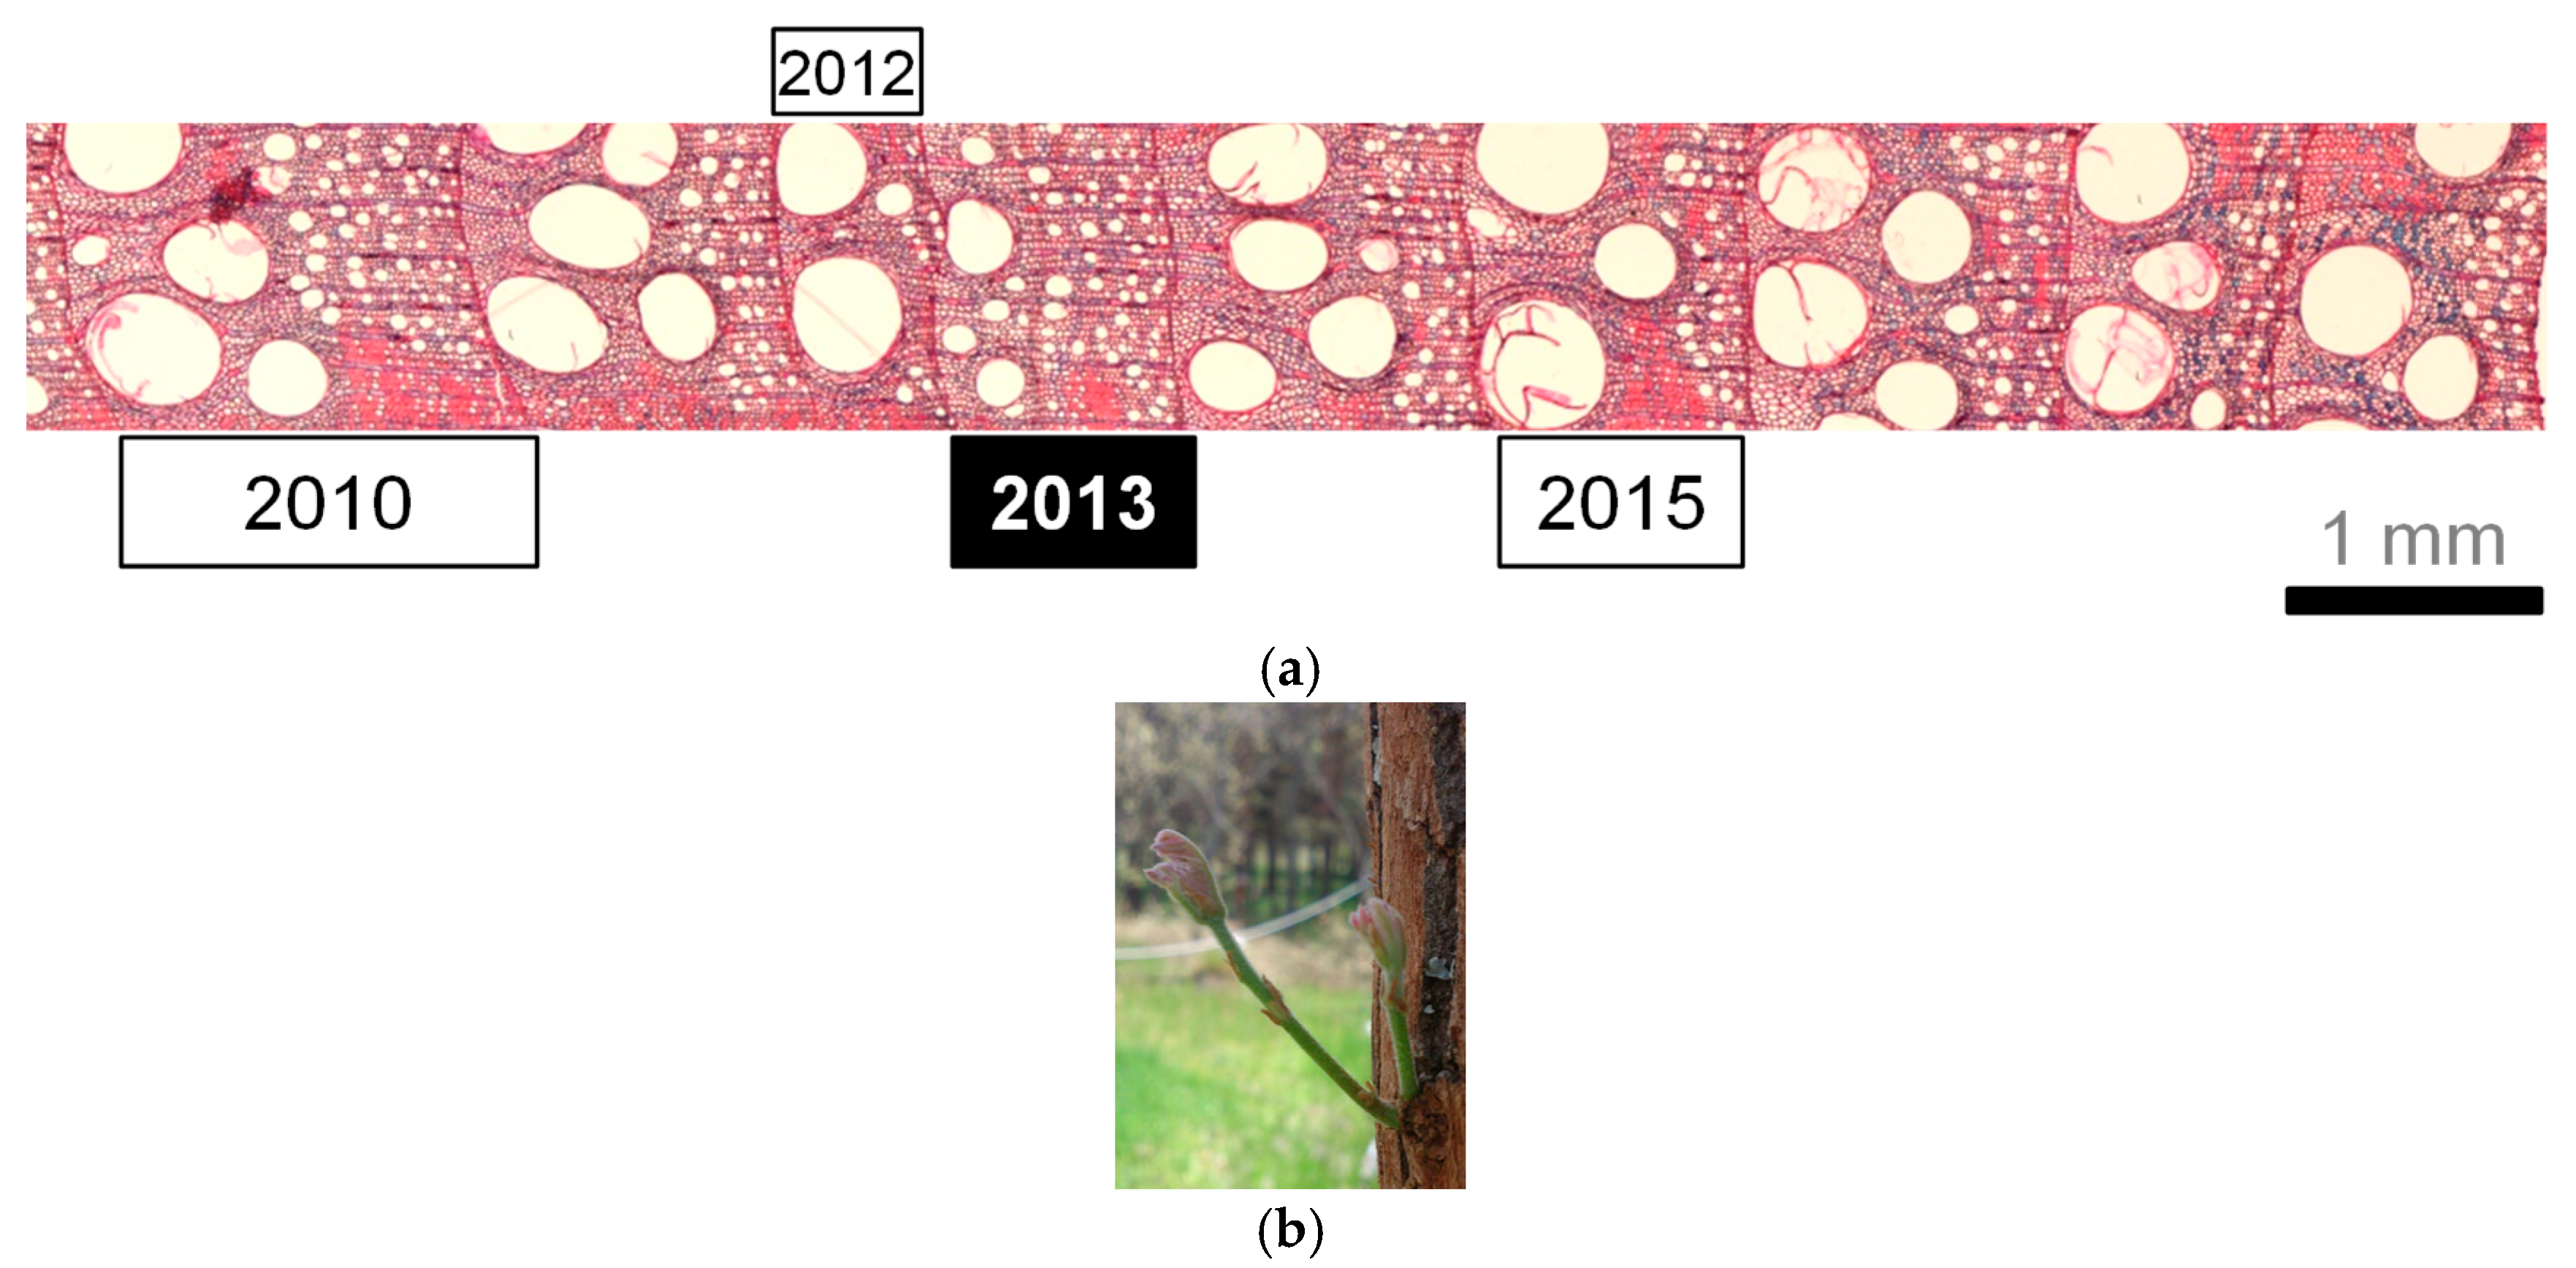
To evaluate the impacts of stem heating on NSC dynamics, we measured the concentrations of starch and soluble sugars (% dry matter) in stem sapwood during the 2013 growing season. We extracted cores of 5 mm diameter from the stem in heated and non-heated trees. This was carried out on the following dates (DOYs, day of the year): 14 April (105), 29 April (120), 14 May (135), and 29 May (150). Sapwood samples were taken to the laboratory in a portable cooler after carefully removing the bark and phloem. They were subsequently frozen and stored at −20 °C until freeze-dried. All dried samples were weighed and milled to a fine powder in a ball mill (Retsch Mixer MM301, Leeds, UK) prior to chemical analyses.
Soluble sugars were extracted with 80% (v/v) ethanol. Their concentration was determined using the phenol–sulfuric method [41]. Starch and complex sugars remaining after ethanol extractions were enzymatically reduced to glucose and analyzed [42]. To gelatinize starch, samples were incubated in a 4 cm3 sodium acetate buffer in a shaking water bath at 100 °C for 1 h. After cooling to room temperature, 1 cm3 of amyloglucosidase solution (0.5% amyloglucosidase 73.8 U/mg, Fluka 10,115, in acetate buffer) was added. Then, samples were incubated for 16 h at 50 °C. After centrifugation, the concentration of starch and complex sugars was determined colorimetrically using a spectrophotometer (Bio-Tek Instruments, Colmar, France). The coefficient variation of the extraction and measurement procedures was below 5%. NSCs measured after ethanol extraction are regarded as soluble sugars, and carbohydrates measured after enzymatic digestion are considered starch. The summed soluble sugars and starch are the total NSCs.

2.8. Wood Anatomy

Wood anatomy was measured in the rings formed from 2008 to 2018 to include the heating treatment. This was carried out in 5 mm cores extracted from heated stems and in nearby non-heated trees of similar diameter, height, and age. Cores were sectioned using a sledge microtome [43]. Images of sections along the rings formed in the period 2000–2020 were taken at 40–100× magnification with a digital camera mounted on a light microscope (Olympus BH2, Olympus, Tokyo, Japan). The images were stitched with the ICE software version 2.0 (Microsoft©) and analyzed using the ImageJ image analysis software version 1.54m [44]. In the case of pines, earlywood lumen area and cell-wall thickness (CWT) were measured using the AutoCellRow software version 1.3 [45]. These analyses provided measurements of transversal conduit area and double cell-wall thickness of tracheids along the radial direction within annual rings. In the oak, earlywood vessel diameter and density, hydraulic diameter (Dh), and potential hydraulic conductivity (Kp) were calculated following [46]. To emphasize relative changes in vessel lumen area, z-scores of the 20 largest earlywood vessels were calculated for heated and non-heated oak trees. In addition, we measured the earlywood vessel diameter along the rings formed in the period 2000–2020 in 10 oaks sampled near the experimental stand. Again, 1 core per tree was extracted, transversally cut, cross-dated, and the processed to obtain images of sections.

2.9. Vaganov-Shashkin Process-Based Model of Radial Growth

A recent improved version of the VS model tuned for Mediterranean tree species was used to simulate tree-ring formation [21]. This updated version of the VS model considers both temperature and photoperiod to determine the start of the growing season. This model was used to simulate daily relative growth rates for the common period (1965–2009). For each tree species, the TRWi series was used as input to adjust the VS model. Then, the model was applied to simulate TRWi as a function of daily temperature (GrT) and precipitation or soil moisture (GrW) [20]. A simple optimization algorithm was used to adjust 9 parameters, while the remaining parameters were kept constant (Table S1). Due to the short common period (n = 45 years), no calibration-verification analysis was performed on an independent period. Therefore, a restricted and realistic range of values was defined for each parameter to limit model overfitting (Table S1). Differences in radial growth phenology and root system depth among species were considered to define species-specific values for these parameters. All models were fitted under similar conditions (random seed = 999, same initial values, number of iterations = 100). Each parameter was optimized one by one, while the remaining parameters were kept constant at their previously optimized values. The daily growth rates simulated by the VS model were used to estimate the dates of growth onset, growth peak, and growth cessation.

2.10. Projecting Spring Phenology Variations in Response to Climate Scenarios

To assess the future evolution of spring phenology, a historical time period (1970–1999) and two future periods were considered (2030–2069 and 2070–2099) using two emission scenarios. These RCP4.5 and RCP8.5 scenarios correspond to moderate- and high-emission pathways and radiative forcing of 4.5 and 8.5 W m−2 in the year 2100, respectively [47,48]. For these three periods, we used historical and projected climate data for the 21st century (model EC-Earth3; [49]) from the Coupled Model Intercomparison Project Phase 6 [50].

2.11. Statistical Analyses

A comparison of variables (NSCs, wood anatomy) between heated and non-heated trees was carried out using Mann–Whitney U tests. Trends in monthly climate variables were assessed using Kendall tests. Climate-growth associations were investigated by calculating bootstrapped Pearson correlations, with 999 replicates, between series of ring-width indices (residual chronologies) and monthly climatic variables (mean temperatures, precipitation, and soil water content) from the previous October to the current November of the year of tree-ring formation and also considering seasonal variables during the growing season (May–June, June–July). A similar analysis was conducted for the mean series of oak earlywood vessel diameter considering monthly climate variables during the period 2000–2020. This was carried out using the treeclim R package version 4.4.3 [51]. To pinpoint the main climate drivers of seasonal wood formation, an additional analysis was carried out using mean maximum and minimum temperatures and total precipitation. We used the climwin R package to analyze the relationships between daily climate data and seasonal growth indices (earlywood and latewood widths), assuming linear relationships [52,53,54]. These analyses were carried out for the common period 1961–2009. Briefly, all the possible climate windows were tested, and the model with the best climate window that minimized the difference between the corrected Akaike Information Criterion (AICc) of the selected model and the AICc of the null model (only with intercept) was selected [55]. Therefore, the lower the ΔAICc values, the better the fit. Randomization tests were based on 1000 repetitions, which allowed us to obtain a probability value (pAICc) determining the likelihood that the ΔAICc value of the selected model was found by chance [53]. Climwin analyses were carried out using the “Magerit” High Performance Computer (Universidad Politécnica de Madrid, Madrid, Spain).

3. Results

3.1. Leaf Phenology

Leaf flushing occurred earlier in the oak (middle May) than in the two pine species (late May) (Table 1). Fully unfolded leaves were observed in late May and mid- to late June in the oak and pine species, respectively. The onset of xylem activity was observed from early to mid-April in P. pinaster and Q. pyrenaica, respectively, to early May in P. sylvestris. We did not find significant differences in leaf phenophases between heated and non-heated individuals, but heated P. pinaster and Q. pyrenaica trees presented significantly (p < 0.05) earlier onsets of xylem formation, 8 and 5 days earlier on average, than their non-heated conspecifics (Table 1).

3.2. Growth, Wood Anatomy, and Responses to Climate

Since the 1950s, both monthly minimum and maximum temperatures have significantly increased (Kendall t-tests, p < 0.05), whereas precipitation showed no significant trend. The 2012–2013 winter was preceded by very warm and dry spring conditions (Figures S4 and S5). The year 2012 was characterized by a very dry spring with a cumulative water balance from January to April of −147 mm, whereas the mean value for the period 2002–2011 was −25 mm.
The two pine species, maritime pine (2.8 mm) and Scots pine (3.1 mm), exhibited wider average ring widths compared to Spanish oak (1.9 mm) (Table 2). Maritime pine also showed the highest values for first-order autocorrelation (AR1), mean sensitivity (MS), and mean correlation among ring-width series, indicating strong environmental sensitivity, while Spanish oak had the lowest AR1 and MS. All three species showed high EPS values above 0.95, reflecting strong intraspecific growth coherence. Significant correlations between residual chronologies included Q. pyrenaica with P. pinaster (r = 0.69), Q. pyrenaica with P. sylvestris (r = 0.67), and a particularly strong correlation between pines (r = 0.89), highlighting their similar growth responses to environmental conditions.
At monthly to seasonal scales, climate-growth correlations revealed that growth was constrained by low temperatures in February and by high temperatures in June and July (Table 3). For both pine species, the highest correlation between temperature and growth was found in February (r = 0.52–0.58), whereas the strongest correlation in absolute terms was found in June–July (r = −0.52) for Q. pyrenaica. The highest correlations for precipitation (r = 0.60–0.68) were found in May–June. The highest climate–growth correlation was found for soil water content in July (r = 0.77–0.84). Significant positive correlations between soil water content and growth were found from the previous December until the current November.
Climwin analyses revealed that precipitation from the prior winter to June was the main driver of earlywood production in the two pine species, whereas latewood width was enhanced by high precipitation from May to September in the three species (Table 4). In fact, the longest climate windows corresponded to the relationships between precipitation and earlywood width in the pine species (P. sylvestris, 161 days; P. pinaster, 270 days). High minimum temperatures from January to March enhanced earlywood production in pines, but this effect was not significant in the oak. In contrast, elevated maximum temperatures during the growing season reduced earlywood and latewood production in both pine species. Finally, earlywood vessel diameter showed a negative correlation with minimum February temperatures (r = −0.57, p = 0.007; Figure S6).

3.3. Responses to Stem Heating: Growth, Sapwood NSCs, and Wood Anatomy

In all species, the ring width was narrow during the dry-warm 2012, as happened in previous dry years such as 2005 (Figure 2). In 2013, heated pines showed wider rings than non-heated trees (P. sylvestris, U = 0.03, p = 0.002; P. pinaster, U = 0.06, p = 0.008), a difference that amplified the following year (U = 0.01, p = 0.001; Figure 2). In contrast, Q. pyrenaica showed no significant differences in ring-width between heated and non-heated trees in 2013, but it did in 2014, when heated oaks produced wider rings compared to non-heated trees (U = 0.01, p < 0.001), suggesting a one-year lag in the growth response to increased stem temperature (Figure 2).
Sapwood NSC concentrations varied between species (Figure 3). In P. sylvestris, soluble sugar concentrations generally increased over time, but no significant differences were observed between heated and non-heated trees (Figure 3). In P. pinaster, soluble sugar concentrations were consistently higher in heated trees compared to non-heated trees (U = 0.10, p = 0.029). No significant difference was found in Q. pyrenaica, which showed a decline in sugar concentrations prior to leaf flushing. In the case of starch concentrations, P. sylvestris remained relatively stable throughout the growing season, with no significant differences between treatments. In P. pinaster, starch concentrations were lower in heated than in non-heated trees (U = 1.75, p = 0.044). In Q. pyrenaica, starch concentrations declined slightly over time, with non-heated trees showing again higher values than heated trees (U = 2.00, p = 0.032).
In Q. pyrenaica, local stem heating triggered the formation of smaller earlywood vessels and epicormic shoots the following growing season in the heated stem portion (Figure 4). Earlywood vessel features such as diameter (U = 0.03, p = 0.002), density (U = 0.05, p = 0.007), Dh (U = 0.06, p = 0.008), and Kp (U = 0.10, p = 0.009) were affected by the stem heating (Figure 4). All variables decreased in 2013, except vessel density, which increased. These differences were amplified when considering the lumen area of the largest earlywood vessels, which was smaller in heated than in non-heated trees (U = 0.01, p = 0.001), while no differences were observed before and after the treatment (Figure S7). The heating treatment significantly reduced the lumen area in both pine species, with the effect being more pronounced in P. pinaster than in P. sylvestris (Figure 5 and Figure 6). In contrast, the response of CWT to stem heating differed between the pine species. In P. pinaster, the CWT was significantly lower in heated trees compared to non-heated trees. Conversely, in P. sylvestris, the CWT increased significantly in heated trees as compared to their non-heated counterparts.

3.4. Models of Radial Growth

The Vaganov-Shashkin (VS) model successfully reproduced the growth variability of the studied tree species, with significant correlations ranging from r = 0.79 to r = 0.87 between observed and simulated ring-width chronologies (Table S2). Simulated growth onset, using the refined VS model, shifted earlier in both emission scenarios for the studied species (Figure 7). For P. pinaster, the shift was most pronounced, with the density peaks moving earlier into the growing season, particularly under the high-emission RCP 8.5 scenario for the 2070–2099 period (Figure 7). In the case of P. sylvestris, it exhibited a smaller shift but still showed earlier growth onset under both future scenarios. Quercus pyrenaica showed intermediate shifts between the two pine species, with the RCP 4.5 distribution staying closer to historical patterns, while the RCP 8.5 scenario led to a more substantial advance.

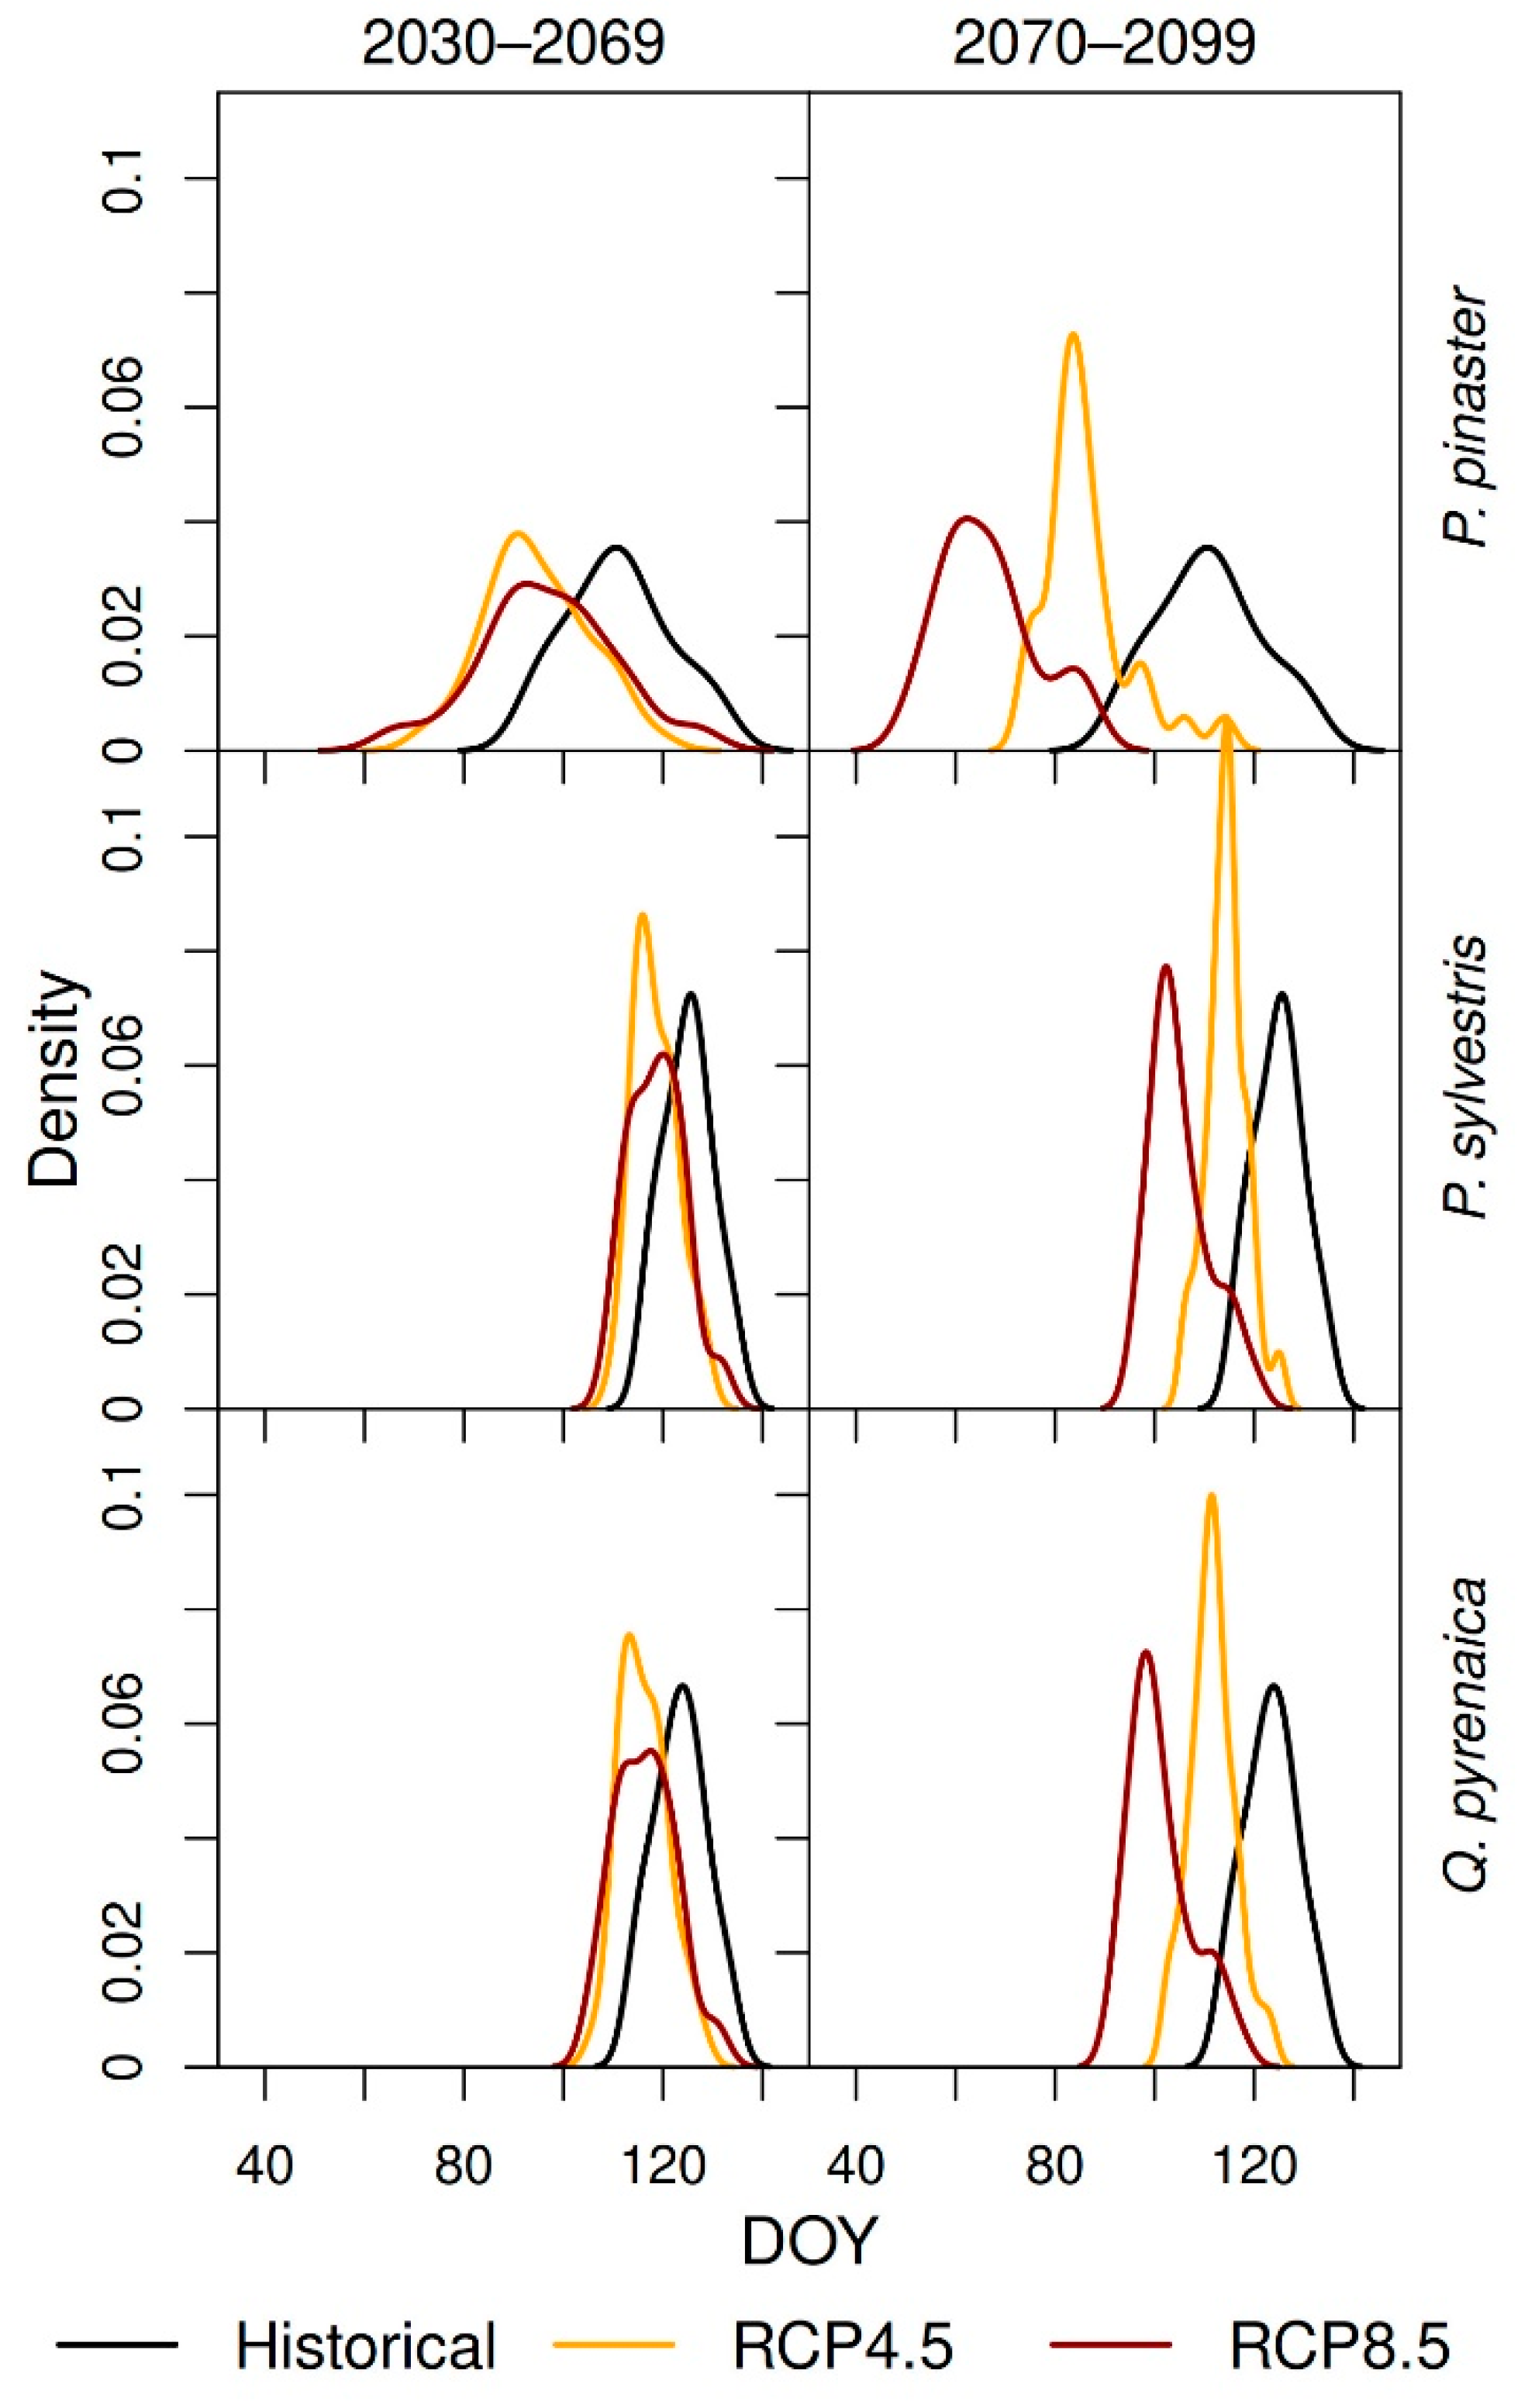
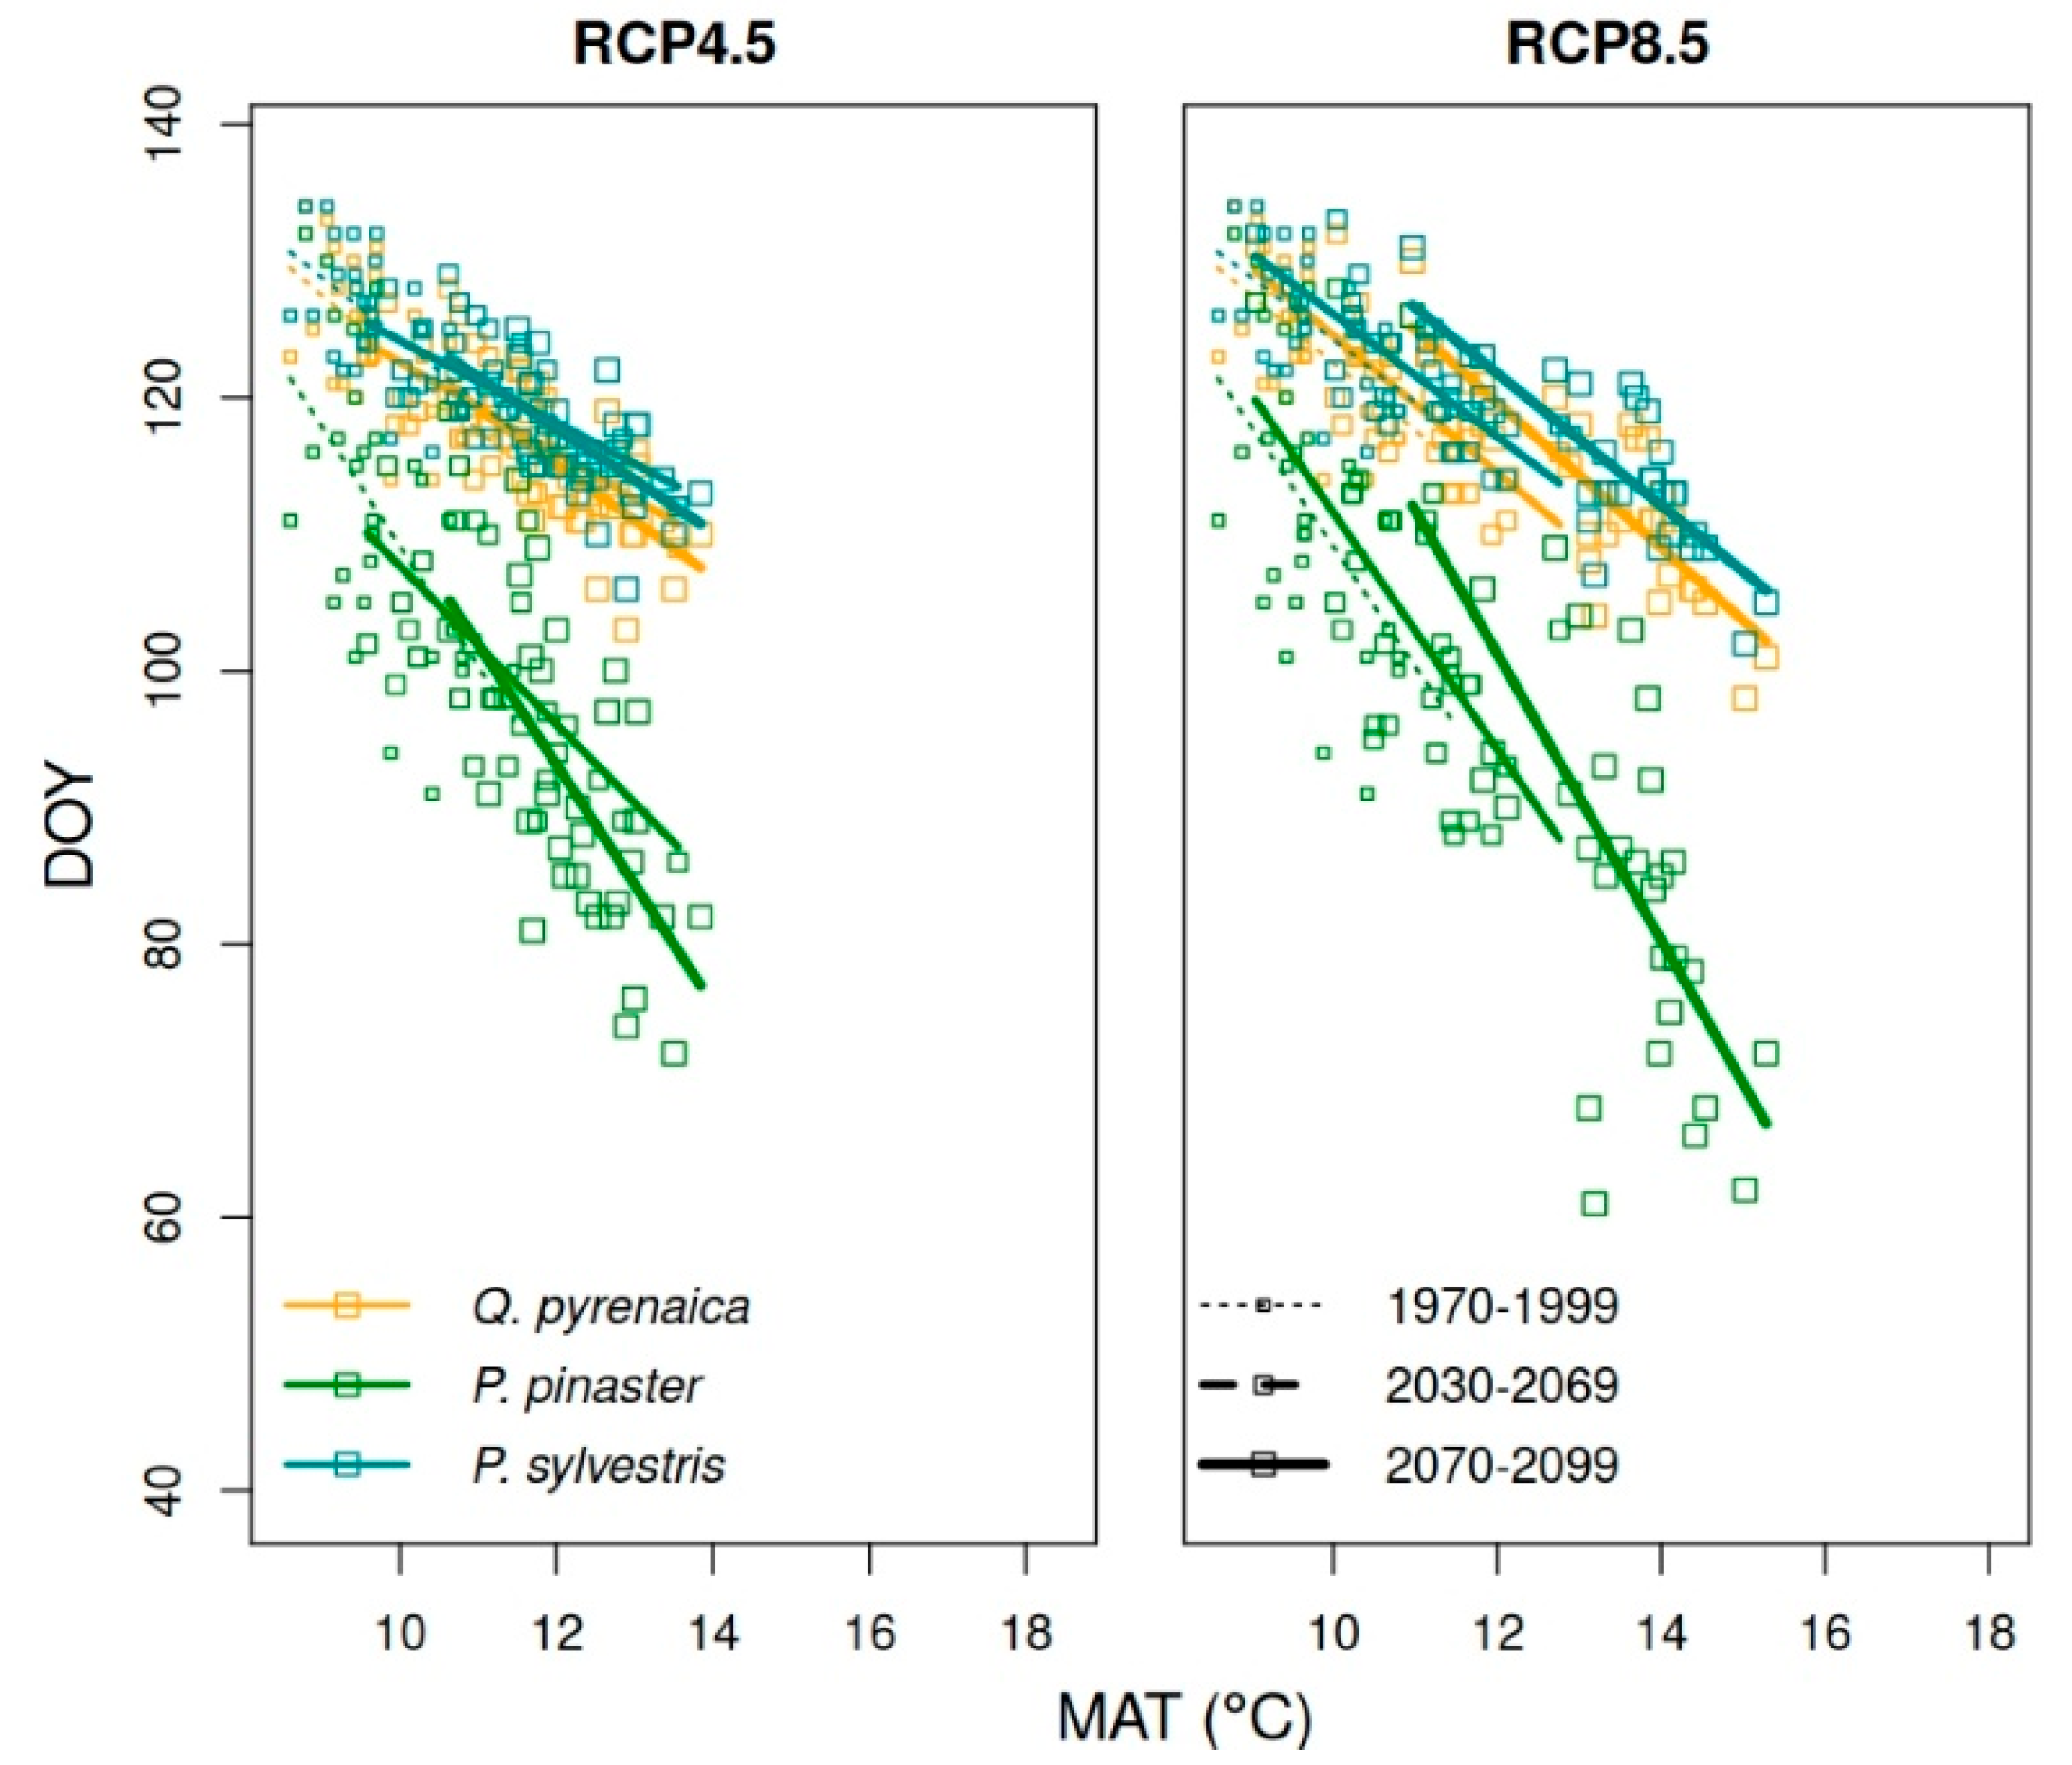
3.5. Forecasting Changes in Growth Phenology

Regression analysis confirmed earlier growth onset with increasing mean annual temperature (Figure 8). Under historical conditions, P. pinaster exhibited the greatest advancement in growth onset, with an average advance of 8.78 days/°C, followed by Q. pyrenaica (4.95 days/°C) and P. sylvestris (4.58 days/°C) (Table 5). This trend was consistent across both emission scenarios. The largest advancements were observed for P. pinaster in the period 2070–2099 under RCP 8.5, with a maximum shift of 10.49 days/°C (Figure 8). In contrast, P. sylvestris showed the smallest advancements under future emission scenarios, ranging from 3.01 days/°C during 2030–2069 under RCP 4.5 to a maximum of 4.83 days/°C under RCP 8.5 in 2070–2099. The oak species showed intermediate advancements, with values ranging from 3.33 days/°C (RCP 4.5, 2030–2069) to 5.32 days/°C (RCP 8.5, 2070–2099).

4. Discussion

Our results show that the responses to winter stem heating treatments and future climatic scenarios differ among the coexisting pine and oak species, which may be explained by their different leaf habits and wood anatomy. Species-specific differences in climate-growth relationships and anatomical responses to stem heating highlight distinct adaptations to warmer winter-to-spring conditions. However, the similar climate-growth relationships in the Mediterranean (P. pinaster) and Eurosiberian (P. sylvestris) pine species also suggest a partial overlap in their ecological niches.
As expected, stem heating advanced cambial resumption and enhanced radial growth but also triggered the formation of earlywood conduits of smaller transversal lumen area, a response that was more noticeable in the ring-porous oak species. Furthermore, this was supported by the negative association between the oak earlywood vessel diameter and minimum February temperatures, a finding that agrees with a previous study. Stem heating also reduced the concentrations of sapwood soluble sugars and increased that of starch, but the response was only significant in P. pinaster.
We are fully aware that the heating setting, just including two heated trees against two control non-heated trees per species for only one growing season (2013 spring), greatly limited the robustness of our conclusions. However, similar studies based on localized stem treatments were based on similar replication efforts due to the logistic complexity and cost of these settings (e.g., 2–3 trees [9,10,11,12]). Further studies could be based on more replicated treatments using seedlings or saplings, but this seems to be unfeasible when dealing with mature trees growing in the field, as in this study.

4.1. Species-Specific Responses to Stem Heating

Stem heating advanced the onset of xylem formation in P. pinaster and Q. pyrenaica individuals, but dates of leaf unfolding were similar and comparable with climatically normal years [21,56]. Interestingly, the most responsive species were those showing forecasted advancements of xylem growth in response to warmer climate scenarios, particularly P. pinaster, which is characterized by a very plastic growth response to climate [57]. The decoupling between leaf and wood phenology may explain why longer growing seasons do not necessarily translate into enhanced growth [4,19]. For instance, in the seasonally dry study site, soil water availability from winter to early summer seems to be the main driver of radial growth [56], as the obtained climate-growth correlations corroborate.
The formation of epicormic shoots in portions of heated stem oaks indicates these trees responded to stress signals associated with warmer and unusual temperatures during the early growing season [58]. This response could also be linked to the decrease in sapwood starch concentrations, being transformed into soluble sugars used for bud reactivation under stress conditions [59].
In both pine species, heating triggered the formation of wider rings in the year (2013) following the winter heating (2012–2013) and also in the following year (2014), indicating a very fast growth response. In contrast, the oak exhibited a delayed but more pronounced response, possibly reflecting a lower mobilization of NSCs, at least as compared with P. pinaster, or a trade-off with other processes, including bud development. The physiological processes involved in carbon allocation in Q. pyrenaica may result in a delayed response to environmental stressors [60]. Notably, the apparent lack of growth response to the stem heat treatment in Q. pyrenaica was followed by a fast recovery and positive legacy effects in heated trees. This finding is in line with previous studies showing that Mediterranean oaks quickly recover after climate extremes such as droughts [61], but in our study such extremes would correspond to winter high temperatures.
Quercus pyrenaica flushed earlier than pines, and its earlywood and leaf relied on stored starch, which might explain the decrease in sapwood starch concentrations observed in heated stems. In this species, starch reserves accumulated during the previous growing season are crucial for supporting earlywood vessel formation and leaf flushing in spring [60]. Therefore, starch decreases as the growing season progresses. The lower starch concentrations in heated trees may reflect an active mobilization of starch into soluble sugars to meet increased energy demands under elevated temperatures [62].
In the case of P. sylvestris, its higher responsiveness to moderate heat stress in terms of growth enhancement but more limited sensitivity in terms of lumen area increase may be due to its adaptation to cooler climates [63,64]. The relative stability of carbohydrate reserves suggests a conservative strategy that can mitigate the responses to short-term climatic fluctuations through rapid recovery [65]. In P. sylvestris, sapwood NSCs were not significantly affected by the heating and peaked just before the onset of latewood formation in mid-July, allowing growth and xylogenesis (tracheid maturation and lignification) to occur during the dry summer [66]. This suggests a conservative carbon use strategy, focusing on long-term reserve maintenance rather than rapidly reallocating resources in response to heat. In contrast, P. pinaster is well-adapted to Mediterranean and temperate climates, showing flexibility in resource allocation that is crucial for coping with the expected fluctuations in temperature and water availability [57]. This species may allocate more carbon toward soluble sugars under warm conditions to support growth, osmotic regulation, or respiration, leading to an increase in soluble sugar concentrations and reduced starch levels. The decrease in starch concentrations was also observed in heated Abies sachalinensis stems [1]. However, the relative increase in growth was higher in P. sylvestris, suggesting that sapwood NSCs in heated P. pinaster are used for other metabolic adjustments or that P. sylvestris legacy effects of the 2012 droughts were stronger. This second explanation is supported by climate-growth relationships assessed in the two pine species along altitudinal gradients [32]. Overall, P. pinaster seems to mobilize or transform sapwood NSCs in response to changing environmental conditions better than P. sylvestris [67].

4.2. Climatic Influences on Radial Growth

Temperature and precipitation exhibited contrasting effects on tree growth for the three species. While February temperatures, May–June precipitation, and July soil water content positively influenced growth, high summer temperatures constrained growth. This aligns with the need to surpass a temperature threshold to initiate cambial activity in spring [68] and the requirement of sufficient soil moisture to maintain cambial activity during summer [69]. Thus, elevated February temperatures may accelerate the onset of growth, leading to wider rings, particularly in P. sylvestris. Conversely, high June-July temperatures can increase evapotranspiration rates, reducing the turgor of cambial cells and cambial activity [56]. These findings are further supported by the strongest positive climate-growth correlations observed in May–June for precipitation and in July for soil water content, which agree with previous studies [21,22,23].
Soil water content consistently enhanced growth throughout the growing season in the three studied species, demonstrating the high dependence of radial growth on water availability. The positive correlation between Q. pyrenaica growth indices and soil water content in November suggests a lengthening of the growing season, enabling the utilization of late-season resources and potentially leading to bimodal growth patterns with growth peaking in spring and autumn (cf. [69]), which may confer resilience after the water-limited summer. Thus, future research could also investigate if stem heating after summer prolongs the growing season whenever summer conditions are not too dry.

4.3. Responses of Earlywood Anatomy to Stem Heating: Hydraulic Adjustments

The adjustment of tracheid features in response to stem heating was species-specific, perhaps reflecting trade-offs between hydraulic efficiency and mechanical support. In P. pinaster, the main adjustment was the reduction in lumen diameter, whilst cell-wall thickness showed a smaller but significant decrease. The reduction in tracheid lumen area may represent an adaptive strategy to maintain water transport efficiency while minimizing the risk of cavitation, ultimately allowing P. pinaster to sustain growth and productivity under water-limited conditions, which is crucial in the Mediterranean climate [57]. By contrast, P. sylvestris also exhibited a reduction in lumen area, albeit smaller, but an increase in cell-wall thickness, enhancing the resistance to xylem implosion but at the cost of reduced hydraulic capacity [70]. This response may be driven by a reduction in turgor of cambial cells and would prevent xylem collapse under low water potentials associated with warmer temperatures [71,72]. Similar responses were observed under experimental drought, where P. sylvestris showed increases in tracheid cell-wall thickness [73], whilst long-term analyses of quantitative wood anatomy usually revealed a reduction in lumen area due to drought stress either in pines [74] or in oaks [75].
In Q. pyrenaica, the decrease in earlywood vessel diameter disproportionately reduced theoretical hydraulic conductivity. As a winter-deciduous ring-porous species, Q. pyrenaica develops earlywood vessels before bud break, and localized stem heating can trigger cambial reactivation and the differentiation of initial vessel elements. However, maintaining the formation of wide vessel elements also depends on bud development, potentially through the increased supply of auxins [13,21], while latewood development is driven by an adequate soil water supply later in the growing season [76]. According to these authors, thinning coppiced Q. pyrenaica stems enhances growth and latewood formation. Therefore, warmer winter climate conditions leading to reduced earlywood hydraulic conductivity could condition the positive effect of thinning on formerly coppiced stands of this oak.
Previous studies found an inverse relationship between vessel size in ring-porous species and late winter temperatures [27,28,77]. High temperatures during quiescence may alter auxin sensitivity, allowing early-formed vessels to record thermal effects [78]. This differs from the responses of earlywood tracheids to climate in the study species [74], explaining why some wood types may respond more easily to warmer conditions than others [79]. Nevertheless, we acknowledge four limitations of our approach. First, the localized stem heating did not impact other major organs such as twigs, leaves, or roots. Heating a part of the stem at 1.3 m is a very simple approach to mimic the exposure of entire trees to warmer conditions. Nonetheless, this approach has been proven to be efficient for advancing xylem phenology, which is one of the main focuses of our study [6]. In addition, the heating treatment lasted the entire winter and involved high stem temperatures (18−22 °C), which may not be realistic given that low cold temperatures are common in the study area during winter. Such exceptionally warmer conditions could explain the changes observed in NSCs such as the increase in soluble sugars in P. pinaster because of starch use for respiration or as a source for osmolytes. In the future, more realistic heating treatments could be applied by keeping cold night temperatures or just applying the heating in late winter, prior to xylem onset. Second, the reduced number of heated stems, imposed by evident logistic restrictions linked to working with adult trees in the field, limits the robustness and replicability of our conclusions. Third, there could be some mechanical and non-mechanical effects (increase in humidity or CO2) on the stem and cambium from the heating devices (heater sheets) wrapped around the stem. However, we think the influences of these artifacts can be ruled out because we used flexible silicone, which did not exert strong pressure or compression on the stem surface, and heaters were checked and ventilated biweekly. Fourth, we did not measure several wood anatomical and chemical variables, which would be interesting to consider in further research (e.g., number and area occupied by vessels, content of structural polysaccharides and lignin).

4.4. Implications for Spring Phenology and Tree Growth Under Warmer Climate Scenarios

The projections based on the Vaganov-Shashkin model suggest significant shifts in spring phenological events under future warming scenarios. These forecasts agree with observed advances in spring leaf onset [80,81] and with the expectation of a longer vegetative season [82]. From the three studied species, P. pinaster is the most responsive to temperature rise since it is expected that it can advance growth onset by ca. 10 days under RCP 8.5. Furthermore, the forecasted advancement of the xylem onset date was supported by the stem heating experiment. The advance of spring phenology in P. pinaster may allow it to take advantage of a longer thermal growing season but also raises concerns about increased exposure to late-spring frost and drought risks. In contrast, P. sylvestris showed smaller phenological shifts, potentially limiting its capacity to benefit from extended growing seasons. This low responsiveness of P. sylvestris may be a consequence of its wide latitudinal distribution and the need for longer photoperiods to reduce the risk of frost, which also depends on previous chilling [21]. The advances in spring phenology for Q. pyrenaica demonstrated intermediate shifts in comparison with the two pine species, highlighting its potential as a resilient species under moderate winter-spring warming scenarios.

5. Conclusions

The responses of radial growth to stem heating indicate that pines may show a rapid and more sustained growth enhancement from heating, while the oak species presented a delayed but potentially stronger response in terms of growth rate. Xylem onset occurred earlier in response to winter stem heating in the case of P. pinaster and Q. pyrenaica, which also induced the formation of epicormic shoots in the oak. Our findings highlight species-specific responses of wood anatomy to stem heating, with P. pinaster showing reductions in both lumen area and cell-wall thickness, while P. sylvestris exhibited a trade-off between reduced lumen area and increased cell-wall thickness. In general, stem heating reduced the lumen area of earlywood conduits, which would lead to a decrease in the stem’s theoretical hydraulic conductivity. Projections indicating earlier xylem growth onset in spring in response to warmer winter-spring conditions should be critically viewed by considering experimental findings, as those presented here, which indicate growth increases but negative impacts on theoretical hydraulic conductivity.

Supplementary Materials

The following supporting information can be downloaded at: https://www.mdpi.com/article/10.3390/f16071080/s1, Table S1. Description, initial values, and range of allowed values for each parameter of the Vaganov-Shashkin (VS) model; Table S2. Parameters of the Vaganov-Shashkin model estimated for the common period 1965–2009; Figure S1. Climate diagram of the Soria meteorological station; Figure S2. Schematic view of the stem heating system based on heater sheets; Figure S3. Comparison of stem temperatures in heated and non-heated trees with air and soil temperatures during a winter day; Figure S4. In the late winter of 2011–2012 and 2012 early growing season, temperatures were significantly (p < 0.05) higher in March, May, and June, but lower in February, than in the 1950–2011 period; Figure S5. The late winter and early spring of 2012 was very dry in the study site, as shown by the cumulative precipitation and water balance from January to March; Figure S6. Negative correlation found between February minimum temperature and Q. pyrenaica earlywood vessel diameter (period 2000–2020); Figure S7. Temporal variation in vessel lumen area (z-scores) of the largest earlywood vessels for heated (orange) and non-heated (green) Quercus pyrenaica trees from 2008 to 2018.

Author Contributions

J.J.C. and J.R.d.L. designed the experiment. J.J.C., supported by J.R.d.L., F.C., M.C., and Á.R.-C., performed the measurements. F.C., Á.R.-C., and J.J.C. analyzed the data and wrote the manuscript, with input and approval from all authors. All authors have read and agreed to the published version of the manuscript.

Funding

This research was funded by the Science and Innovation Ministry of Spain with projects PID2021-123675OB-C43 and TED2021-129770B-C21. ARC also acknowledges support by the “Margarita Salas” postdoctoral fellowship (reference RCMS-22-G1T6IW-17-NLHJ80) of the Universidad Politécnica de Madrid, Spain.

Data Availability Statement

The data used in this study are available upon request.

Acknowledgments

We thank the Valonsadero personnel (Junta de Castilla y León) for providing sampling permissions and Elena Lahoz for her valuable help with laboratory analyses. We sincerely thank M. Dolores García González, Alberto Salar Marzal, and Ángela Blázquez Casado for their collaboration to study leaf and xylem phenology. The authors gratefully acknowledge the UPM for providing computing resources on the Magerit Supercomputer (www.cesvima.upm.es, accessed on 1 February 2025).

Conflicts of Interest

The authors declare no conflicts of interest.

References

  1. Canadell, J.G.; Raupach, M.R. Managing forests for climate change mitigation. Science 2008, 320, 1456–1457. [Google Scholar] [CrossRef] [PubMed]
  2. Harvey, J.E.; Smiljanić, M.; Scharnweber, T.; Buras, A.; Cedro, A.; Cruz-García, R.; Drobyshev, I.; Janecka, K.; Jansons, Ā.; Kaczka, R.; et al. Tree growth influenced by warming winter climate and summer moisture availability in northern temperate forests. Glob. Change Biol. 2020, 26, 2505–2518. [Google Scholar] [CrossRef] [PubMed]
  3. Charrier, G.; Martin-StPaul, N.; Damesin, C.; Delpierre, N.; Hänninen, H.; Torres-Ruiz, J.M.; Davi, H. Interaction of drought and frost in tree ecophysiology: Rethinking the timing of risks. Ann. For. Sci. 2021, 78, 40. [Google Scholar] [CrossRef]
  4. Camarero, J.J.; Campelo, F.; Colangelo, M.; Valeriano, C.; Knorre, A.; Solé, G.; Rubio-Cuadrado, Á. Decoupled leaf-wood phenology in two pine species from contrasting climates: Longer growing seasons do not mean more radial growth. Agric. For. Meteorol. 2022, 327, 109223. [Google Scholar] [CrossRef]
  5. Dox, I.; Mariën, B.; Zuccarini, P.; Marchand, L.J.; Prislan, P.; Gričar, J.; Flores, O.; Gehrmann, F.; Fonti, P.; Lange, H.; et al. Wood growth phenology and its relationship with leaf phenology in deciduous forest trees of the temperate zone of Western Europe. Agric. For. Meteorol. 2022, 327, 109229. [Google Scholar] [CrossRef]
  6. Begum, S.; Nakaba, S.; Yamagishi, Y.; Oribe, Y.; Funada, R. Regulation of cambial activity in relation to environmental conditions: Understanding the role of temperature in wood formation of trees. Physiol. Plant. 2013, 147, 46–54. [Google Scholar] [CrossRef]
  7. Funada, R.; Yamagishi, Y.; Begum, S.; Kudo, K.; Nabeshima, E.; Nugroho, W.; Rahman, M.H.; Oribe, Y.; Nakaba, S. Xylogenesis in Trees: From Cambial Cell Division to Cell Death. In Secondary Xylem Biology; Kim, Y.S., Funada, R., Singh, A.P., Eds.; Academic Press: Cambridge, MA, USA, 2016; pp. 25–43. [Google Scholar] [CrossRef]
  8. Begum, S.; Kudo, K.; Rahman, M.H.; Nakaba, S.; Yamagishi, Y.; Nabeshima, E.; Nugroho, W.D.; Oribe, Y.; Kitin, P.; Jin, H.-O.; et al. Climate change and the regulation of wood formation in trees by temperature. Trees Struct. Funct. 2018, 32, 3–15. [Google Scholar] [CrossRef]
  9. Oribe, Y.; Kubo, T. Effect of heat on cambial reactivation during winter dormancy in evergreen and deciduous conifers. Tree Physiol. 1997, 17, 81–87. [Google Scholar] [CrossRef]
  10. Oribe, Y.; Funada, R.; Shibagaki, M.; Kubo, T. Cambial reactivation in locally heated stems of the evergreen conifer Abies sachalinensis (Schmidt) Masters. Planta 2001, 212, 684–691. [Google Scholar] [CrossRef]
  11. Oribe, Y.; Funada, R.; Kubo, T. Relationships between cambial activity, cell differentiation and the localization of starch in storage tissues around the cambium in locally heated stems of Abies sachalinensis (Schmidt) Masters. Trees Struct. Funct. 2003, 17, 185–192. [Google Scholar] [CrossRef]
  12. Gričar, J.; Zupancic, M.; Čufar, K.; Oven, P. Regular cambial activity and xylem and phloem formation in locally heated and cooled stem portions of Norway spruce. Wood Sci. Technol. 2007, 41, 463–475. [Google Scholar] [CrossRef]
  13. Kudo, K.; Nabeshima, E.; Begum, S.; Yamagishi, Y.; Nakaba, S.; Oribe, Y.; Yasue, K.; Funada, R. The effects of localized heating and disbudding on cambial reactivation and formation of earlywood vessel in seedlings of the deciduous ring-porous hardwood, Quercus serrate. Ann. Bot. 2014, 113, 1021–1027. [Google Scholar] [CrossRef] [PubMed]
  14. Rahman, M.H.; Kudo, K.; Yamagishi, Y.; Nakamura, Y.; Nakaba, S.; Begum, S.; Nugroho, W.D.; Arakawa, I.; Kitin, P.; Funada, R. Winter-spring temperature pattern is closely related to the onset of cambial reactivation in stems of the evergreen conifer Chamaecyparis pisifera. Sci. Rep. 2020, 10, 14341. [Google Scholar] [CrossRef] [PubMed]
  15. Giovannelli, A.; Mattana, S.; Emiliani, G.; Anichini, M.; Traversi, M.L.; Pavone, F.S.; Cicchi, R. Localized stem heating from the rest to growth phase induces latewood-like cell formation and slower stem radial growth in Norway spruce saplings. Tree Physiol. 2022, 42, 1149–1163. [Google Scholar] [CrossRef]
  16. Huang, J.-G.; Ma, Q.; Rossi, S.; Biondi, F.; Deslauriers, A.; Fonti, P.; Liang, E.; Mäkinen, H.; Oberhuber, W.; Rathgeber, C.B.K.; et al. Photoperiod and temperature as dominant environmental drivers triggering secondary growth resumption in Northern Hemisphere conifers. Proc. Natl. Acad. Sci. USA 2020, 117, 20645–20652. [Google Scholar] [CrossRef] [PubMed]
  17. Simard, S.; Giovannelli, A.; Treydte, K.; Traversi, M.L.; King, G.M.; Frank, D.; Fonti, P. Intra-annual dynamics of non-structural carbohydrates in the cambium of mature conifer trees reflects radial growth demands. Tree Physiol. 2013, 33, 913–923. [Google Scholar] [CrossRef]
  18. Yu, B.; Rossi, S.; Su, H.; Zhao, P.; Zhang, S.; Hu, B.; Li, X.; Chen, L.; Liang, H.; Huang, J.-G. Mismatch between primary and secondary growth and its consequences on wood formation in Qinghai spruce. Tree Physiol. 2023, 43, 1886–1902. [Google Scholar] [CrossRef]
  19. Stridbeck, P.; Björklund, J.; Fuentes, M.; Gunnarson, B.E.; Jönsson, A.M.; Linderholm, H.W.; Ljungqvist, F.C.; Olsson, C.; Rayner, D.; Rocha, E.; et al. Partly decoupled tree-ring width and leaf phenology response to 20th century temperature change in Sweden. Dendrochronologia 2022, 75, 125993. [Google Scholar] [CrossRef]
  20. Vaganov, E.A.; Hughes, M.K.; Shashkin, A.V. Growth Dynamics of Conifer Tree Rings; Springer: Berlin/Heidelberg, Germany, 2006. [Google Scholar] [CrossRef]
  21. Campelo, F.; Camarero, J.J. Temperature-photoperiod interactions improve simulations of early xylem phenology: Refining the Vaganov-Shashkin growth model. Dendrochronologia 2024, 85, 126215. [Google Scholar] [CrossRef]
  22. Tumajer, J.; Serra-Maluquer, X.; Gazol, A.; González de Andrés, E.; Colangelo, M.; Sangüesa-Barreda, G.; Olano, J.M.; Rozas, V.; García-Plazaola, J.I.; Fernández-Marín, B.; et al. Bimodal and unimodal radial growth of Mediterranean oaks along a coast-inland gradient. Agric. For. Meteorol. 2022, 327, 109234. [Google Scholar] [CrossRef]
  23. Campelo, F.; Ribas, M.; Gutiérrez, E. Plastic bimodal growth in a Mediterranean mixed-forest of Quercus ilex and Pinus halepensis. Dendrochronologia 2021, 67, 125836. [Google Scholar] [CrossRef]
  24. Valeriano, C.; Tumajer, T.; Gazol, A.; González de Andrés, E.; Sánchez-Salguero, R.; Colangelo, M.; Linares, J.C.; Valor, T.; Sangüesa-Barreda, G.; Camarero, J.J. Delineating vulnerability to drought using a process-based growth model in Pyrenean silver fir forests. For. Ecol. Manag. 2023, 541, 121069. [Google Scholar] [CrossRef]
  25. Aloni, R. Wood formation in deciduous hardwood trees. In Physiology of Trees; Raghavendra, A.S., Ed.; Wiley: New York, NY, USA, 1991; pp. 75–197. [Google Scholar]
  26. García-González, I.; Eckstein, D. Climatic signal of earlywood vessels of oak on a maritime site. Tree Physiol. 2003, 23, 497–504. [Google Scholar] [CrossRef]
  27. Fonti, P.; Solomonoff, N.; García-González, I. Earlywood vessels size of Castanea sativa records temperature before their formation. New Phytol. 2007, 173, 562–570. [Google Scholar] [CrossRef]
  28. Alla, A.Q.; Camarero, J.J. Contrasting responses of radial growth and wood anatomy to climate in a Mediterranean ring-porous oak: Implications for its future persistence or why the variance matters more than the mean. Eur. J. For. Res. 2012, 131, 1537–1550. [Google Scholar] [CrossRef]
  29. Penman, H.L. Natural evaporation from open water, bare soil and grass. Proc. R. Soc. Lond. Ser. A 1948, 194, 120–145. [Google Scholar]
  30. Willmott, C.J.; Rowe, C.M.; Mintz, Y. Climatology of the terrestrial seasonal water cycle. J. Climatol. 1985, 5, 589–606. [Google Scholar] [CrossRef]
  31. Zweifel, R.; Rigling, A.; Dobbertin, M. Species-specific stomatal response of trees to drought—A link to vegetation dynamics? J. Veg. Sci. 2009, 20, 442–454. [Google Scholar] [CrossRef]
  32. Camarero, J.J.; Gazol, A.; Tardif, J.C.; Conciatori, F. Attributing forest responses to global-change drivers: Limited evidence of a CO2-fertilization effect in Iberian pine growth. J. Biogeogr. 2015, 42, 2220–2233. [Google Scholar] [CrossRef]
  33. Mediavilla, S.; Escudero, A. Stomatal responses to drought at a Mediterranean site: A comparative study of co-occurring woody species differing in leaf longevity. Tree Physiol. 2003, 23, 987–996. [Google Scholar] [CrossRef]
  34. Fernández-de-Uña, L.; McDowell, N.G.; Cañellas, I.; Gea-Izquierdo, G. Disentangling the effect of competition, CO2 and climate on intrinsic water-use efficiency and tree growth. J. Ecol. 2016, 104, 678–690. [Google Scholar] [CrossRef]
  35. Rubio-Cuadrado, A.; Montes, F.; Pardos, P.; Camarero, J.J. Differences in hydrological niche and tree size explain growth resilience to drought in three Mediterranean oaks. Agric. For. Meteorol. 2024, 359, 110291. [Google Scholar] [CrossRef]
  36. Rossi, S.; Anfodillo, T.; Menardi, R. Trephor: A New Tool for Sampling Microcores from tree stems. IAWA J. 2006, 27, 89–97. [Google Scholar] [CrossRef]
  37. Holmes, R. Computer-assisted quality control in tree-ring dating and measurement. Tree-Ring Bull. 1983, 43, 69–78. [Google Scholar]
  38. Bunn, A.G. A dendrochronology program library in R (dplR). Dendrochronologia 2008, 26, 115–124. [Google Scholar] [CrossRef]
  39. Campelo, F.; García-González, I.; Nabais, C. detrendeR—A Graphical User Interface to process and visualize tree-ring data using R. Dendrochronologia 2012, 30, 57–60. [Google Scholar] [CrossRef]
  40. Wigley, T.; Briffa, K.; Jones, P. On the average value of correlated time series, with applications in dendroclimatology and hydrometeorology. J. Clim. Appl. Meteorol. 1984, 23, 201–213. [Google Scholar] [CrossRef]
  41. Buysse, J.; Merckx, R. An improved colorimetric method to quantify sugar content of plant tissue. J. Exp. Bot. 1993, 44, 1627–1629. [Google Scholar] [CrossRef]
  42. Palacio, S.; Hernández, R.; Maestro-Martínez, M.; Camarero, J.J. Fast replenishment of initial carbon stores after defoliation by the pine processionary moth and its relationship to the regrowth ability of trees. Trees Struct. Funct. 2012, 26, 1627–1640. [Google Scholar] [CrossRef]
  43. Gärtner, H.; Nievergelt, D. The core-microtome, a new tool for surface preparation on cores and time series analysis of varying cell parameters. Dendrochronologia 2010, 28, 85–92. [Google Scholar] [CrossRef]
  44. Schneider, C.; Rasband, W.; Eliceiri, K. NIH Image to ImageJ: 25 years of image analysis. Nat. Methods 2012, 9, 671–675. [Google Scholar] [CrossRef]
  45. Dyachuk, P.; Arzac, A.; Peresunko, P.; Videnin, S.; Ilyin, V.; Assaulianov, R.; Babushkina, E.A.; Zhirnova, D.; Belokopytova, L.; Vaganov, E.A.; et al. AutoCellRow (ACR)—A new tool for the automatic quantification of cell radial files in conifer images. Dendrochronologia 2020, 60, 125687. [Google Scholar] [CrossRef]
  46. Scholz, A.; Klepsch, M.; Karimi, Z.; Jansen, S. How to quantify conduits in wood? Front. Plant Sci. 2013, 4, 56. [Google Scholar] [CrossRef] [PubMed]
  47. Thomson, A.M.; Calvin, K.V.; Smith, S.J.; Kyle, G.P.; Volke, A.; Patel, P.; Delgado-Arias, S.; Bond-Lamberty, B.; Wise, M.A.; Clarke, L.E.; et al. RCP4.5: A pathway for stabilization of radiative forcing by 2100. Clim. Change 2011, 109, 77–94. [Google Scholar] [CrossRef]
  48. Riahi, K.; Rao, S.; Krey, V.; Cho, C.; Chirkov, V.; Fischer, G.; Kindermann, G.; Nakicenovic, N.; Rafaj, P. RCP 8.5—A scenario of comparatively high greenhouse gas emissions. Clim. Change 2011, 109, 33–57. [Google Scholar] [CrossRef]
  49. Döscher, R.; Acosta, M.; Alessandri, A.; Anthoni, P.; Arneth, A.; Bergman, T.; Bernardello, R.; Boussetta, S.; Caron, L.-P.; Carver, G.; et al. The EC-Earth3 Earth System Model for the Climate Model Intercomparison Project 6. Geosci. Model Dev. 2022, 15, 2973–3020. [Google Scholar] [CrossRef]
  50. Eyring, V.; Bony, S.; Meehl, G.A.; Senior, C.A.; Stevens, B.; Stouffer, R.J.; Taylor, K.E. Overview of the coupled model intercomparison project phase 6 (CMIP6) experimental design and organization. Geosci. Model Dev. 2016, 9, 1937–1958. [Google Scholar] [CrossRef]
  51. Zang, C.; Biondi, F. Treeclim: An R package for the numerical calibration of proxy-climate relationships. Ecography 2015, 38, 431–436. [Google Scholar] [CrossRef]
  52. Bailey, L.D.; van de Pol, M. Climwin: An R Toolbox for Climate Window Analysis. PLoS ONE 2016, 11, e0167980. [Google Scholar] [CrossRef]
  53. van de Pol, M.; Bailey, L.D.; McLean, N.; Rijsdijk, L.; Lawson, C.R.; Brouwer, L. Identifying the Best Climatic Predictors in Ecology and Evolution. Methods Ecol. Evol. 2016, 7, 1246–1257. [Google Scholar] [CrossRef]
  54. Rubio-Cuadrado, Á.; Camarero, J.J.; Bosela, M. Applying climwin to dendrochronology: A breakthrough in the analyses of tree responses to environmental variability. Dendrochronologia 2022, 71, 125916. [Google Scholar] [CrossRef]
  55. Burnham, K.P.; Anderson, D.R. Model Selection and Multimodel Inference: A Practical Information-Theoretic Approach; Springer: New York, NY, USA, 2004. [Google Scholar]
  56. Campelo, F.; Rubio-Cuadrado, Á.; Montes, F.; Colangelo, M.; Valeriano, C.; Camarero, J.J. Growth phenology adjusts to seasonal changes in water availability in coexisting evergreen and deciduous Mediterranean oaks. For. Ecosyst. 2023, 10, 100134. [Google Scholar] [CrossRef]
  57. Campelo, F.; Vieira, J.; Nabais, C. Tree-ring growth and intra-annual density fluctuations of Pinus pinaster responses to climate: Does size matter? Trees Struct. Funct. 2013, 27, 763–772. [Google Scholar] [CrossRef]
  58. Alla, A.Q.; Camarero, J.J.; Palacio, S.; Montserrat-Martí, G. Revisiting the fate of buds: Size and position drive bud mortality and bursting in two coexisting Mediterranean Quercus species with contrasting leaf habit. Trees Struct. Funct. 2013, 27, 1375–1386. [Google Scholar] [CrossRef]
  59. Meier, A.R.; Saunders, M.R.; Michler, C.H. Epicormic buds in trees: A review of bud establishment, development and dormancy release. Tree Physiol. 2012, 32, 565–584. [Google Scholar] [CrossRef] [PubMed]
  60. Fernández-de-Uña, L.; Aranda, I.; Rossi, S.; Fonti, P.; Cañellas, I.; Gea-Izquierdo, G. Divergent phenological and leaf gas exchange strategies of two competing tree species drive contrasting responses to drought at their altitudinal boundary. Tree Physiol. 2018, 38, 1152–1165. [Google Scholar] [CrossRef] [PubMed]
  61. Gazol, A.; Camarero, J.J.; Vicente-Serrano, S.M.; Sánchez-Salguero, R.; Gutiérrez, E.; de Luis, M.; Sangüesa-Barreda, G.; Novak, K.; Rozas, V.; Tíscar, P.A.; et al. Forest resilience to drought varies across biomes. Glob. Change Biol. 2018, 24, 2143–2158. [Google Scholar] [CrossRef]
  62. Fernández-de-Uña, L.; Rossi, S.; Aranda, I.; Fonti, P.; González-González, B.D.; Cañellas, I.; Gea-Izquierdo, G. Xylem and Leaf Functional Adjustments to Drought in Pinus sylvestris and Quercus pyrenaica at Their Elevational Boundary. Front. Plant Sci. 2017, 8, 1200. [Google Scholar] [CrossRef]
  63. Martín, J.A.; Esteban, L.G.; de Palacios, P.; Fernández, F.G. Variation in wood anatomical traits of Pinus sylvestris L. between Spanish regions of provenance. Trees Struct. Funct. 2010, 24, 1017–1028. [Google Scholar] [CrossRef]
  64. Gazol, A.; Oliva, J.; Valeriano, C.; Colangelo, M.; Camarero, J.J. Mixed Pine Forests in a Hotter and Drier World: The Great Resilience to Drought of Aleppo Pine Benefits It Over Other Coexisting Pine Species. Front. For. Glob. Change 2022, 5, 899425. [Google Scholar] [CrossRef]
  65. Schönbeck, L.; Gessler, A.; Hoch, G.; McDowell, N.G.; Rigling, A.; Schaub, M.; Li, M. Homeostatic levels of nonstructural carbohydrates after 13 yr of drought and irrigation in Pinus sylvestris. New Phytol. 2018, 219, 1314–1324. [Google Scholar] [CrossRef] [PubMed]
  66. Oberhuber, W.; Swidrak, I.; Pirkebner, D.; Gruber, A. Temporal dynamics of nonstructural carbohydrates and xylem growth in Pinus sylvestris exposed to drought. Can. J. For. Res. 2011, 41, 1590–1597. [Google Scholar] [CrossRef] [PubMed]
  67. Matías, L.; Castro, J.; Villar-Salvador, P.; Quero, J.L.; Jump, A.S. Differential impact of hotter drought on seedling performance of five ecologically distinct pine species. Plant Ecol. 2017, 218, 201–212. [Google Scholar] [CrossRef]
  68. Rossi, S.; Deslauriers, A.; Griçar, J.; Seo, J.-W.; Rathgeber, C.B.; Anfodillo, T.; Morin, H.; Levanic, T.; Oven, P.; Jalkanen, R. Critical temperatures for xylogenesis in conifers of cold climates. Glob. Ecol. Biogeogr. 2008, 17, 696–707. [Google Scholar] [CrossRef]
  69. Camarero, J.J.; Olano, J.M.; Parras, A. Plastic bimodal xylogenesis in conifers from continental Mediterranean climates. New Phytol. 2010, 185, 471–480. [Google Scholar] [CrossRef]
  70. Hacke, U.G.; Sperry, J.S.; Pockman, W.T.; Davis, S.D.; McCulloh, K.A. Trends in wood density and structure are linked to prevention of xylem implosion by negative pressure. Oecologia 2001, 126, 457–461. [Google Scholar] [CrossRef]
  71. Pittermann, J.; Sperry, J.S.; Wheeler, J.K.; Hacke, U.G.; Sikkema, E.H. Mechanical reinforcement of tracheids compromises the hydraulic efficiency of conifer xylem. Plant. Cell Environ. 2006, 29, 1618–1628. [Google Scholar] [CrossRef]
  72. Poyatos, R.; Aguadé, D.; Galiano, L.; Mencuccini, M.; Martínez-Vilalta, J. Drought-induced defoliation and long periods of near-zero gas exchange play a key role in accentuating metabolic decline of Scots pine. New Phytol. 2013, 200, 388–401. [Google Scholar] [CrossRef]
  73. Eilmann, B.; Zweifel, R.; Buchmann, N.; Graf Pannatier, E.; Rigling, A. Drought alters timing, quantity, and quality of wood formation in Scots pine. J. Exp. Bot. 2011, 62, 2763–2771. [Google Scholar] [CrossRef]
  74. Martin-Benito, D.; Beeckman, H.; Cañellas, I. Influence of drought on tree rings and tracheid features of Pinus nigra and Pinus sylvestris in a mesic Mediterranean forest. Eur. J. For. Res. 2013, 132, 33–45. [Google Scholar] [CrossRef]
  75. Corcuera, L.; Camarero, J.J.; Gil-Pelegrín, E. Effects of a severe drought on growth and wood-anatomical properties of Quercus faginea. IAWA J. 2004, 25, 185–204. [Google Scholar] [CrossRef]
  76. Corcuera, L.; Camarero, J.J.; Sisó, S.; Gil-Pelegrín, E. Radial-growth and wood-anatomical changes in overaged Quercus pyrenaica coppice stands: Functional responses in a new Mediterranean landscape. Trees Struct. Funct. 2006, 20, 91–98. [Google Scholar] [CrossRef]
  77. González-González, B.D.; Vázquez-Ruiz, R.A.; García-González, I. Effects of climate on earlywood vessel formation of Quercus robur and Q. pyrenaica at a site in the northwestern Iberian Peninsula. Can. J. For. Res. 2015, 45, 698–709. [Google Scholar] [CrossRef]
  78. Souto-Herrero, M.; Rozas, V.; García-González, I. Earlywood vessels and latewood width explain the role of climate on wood formation of Quercus pyrenaica Willd. across the Atlantic-Mediterranean boundary in NW Iberia. For. Ecol. Manag. 2018, 425, 126–137. [Google Scholar] [CrossRef]
  79. McCulloh, K.A.; Petitmermet, J.; Stefanski, A.; Rice, K.E.; Rich, R.L.; Montgomery, R.A.; Reich, P.B. Is it getting hot in here? Adjustment of hydraulic parameters in six boreal and temperate tree species after 5 years of warming. Glob. Change Biol. 2016, 22, 4124–4133. [Google Scholar] [CrossRef]
  80. Fu, Y.H.; Piao, S.; Op de Beeck, M.; Cong, N.; Zhao, H.; Zhang, Y.; Menzel, A.; Janssens, I.A. Recent spring phenology shifts in western Central Europe based on multiscale observations. Glob. Ecol. Biogeogr. 2014, 23, 1255–1263. [Google Scholar] [CrossRef]
  81. Chen, L.; Huang, J.; Ma, Q.; Hänninen, H.; Tremblay, F.; Bergeron, Y. Long-term changes in the impacts of global warming on leaf phenology of four temperate tree species. Glob. Change Biol. 2018, 25, 997–1004. [Google Scholar] [CrossRef]
  82. Körner, C.; Möhl, P.; Hiltbrunner, E. Four ways to define the growing season. Ecol. Lett. 2023, 26, 1277–1292. [Google Scholar] [CrossRef]
Figure 1. (a) Views of the heated stems in the Valonsadero “Centro” study site, (b) approximate locations of the “Centro” (Pinus sylvestris and Quercus pyrenaica trees) and “Vivero” (Pinus pinaster trees) heating sites, and (c) location of Soria province (red polygon) in Spain.
Forests 16 01080 g001
Figure 2. Series of tree-ring widths in the three study species considering heated (filled symbols) and non-heated (empty symbols) individuals. Values are means ± standard error (SE). The vertical dashed line indicates the stem heating during the 2012–2013 winter.
Forests 16 01080 g002
Figure 3. Concentrations of sapwood soluble sugars and starch during the growing season (DOYs 105–150) in heated (filled bars) and non-heated (empty bars) individuals. Values are means ± SE. Plots filled in grey indicate significant (p < 0.05) differences between heated and non-heated trees. Arrows show the flushing dates.
Forests 16 01080 g003
Figure 4. (a) Impact of local stem heating on earlywood anatomy of the 2013 ring in Quercus pyrenaica, which was characterized by smaller earlywood vessels, and (b) view of an epicormic shoot developed in the heated portion of the stem. In the upper plot, some narrow (2012), normal (2015), and wide (2010) rings are indicated in addition to the 2013 post-heating ring.
Forests 16 01080 g004
Figure 5. Changes of several earlywood (EW) anatomical parameters measured in the Quercus pyrenaica individuals after localized stem heating during the winter-spring 2012 season: (a) vessel diameter, (b) vessel density, (c) hydraulic diameter, and (d) potential hydraulic conductivity (Kp). Values are means ± SE.
Forests 16 01080 g005
Figure 6. Comparison of lumen area (left panels) and cell-wall thickness (CWT; right panels) in heated and non-heated trees for Pinus pinaster (a) and Pinus sylvestris (b). Boxplots display the median (horizontal line), interquartile range (boxes), and outliers (dots). Significant differences between heated and non-heated trees are indicated by U and p values (Mann–Whitney tests).
Forests 16 01080 g006
Figure 7. Density distribution of growth onset timing (day of the year; DOY) simulated by the refined Vaganov-Shashkin model for Quercus pyrenaica, Pinus pinaster, and Pinus sylvestris under historical (1970–1999; black) and future climate scenarios for two time periods (2030–2069 and 2070–2099). Future scenarios include the RCP 4.5 moderate (orange lines) and RCP 8.5 high emissions (red lines), respectively.
Forests 16 01080 g007
Figure 8. Relationship between the timing of growth onset (day of the year, DOY) and mean annual temperature (MAT) simulated by the refined Vaganov-Shashkin model for the three studied tree species. Results are shown for the moderate (RCP4.5—left plot) and high emission (RCP8.5—right plot) scenarios. Solid, dashed, and dotted lines represent the historical period (1970–1999), mid-century future (2030–2069), and late-century future (2070–2099), respectively.
Forests 16 01080 g008
Table 1. Characteristics of the study trees and onset dates of the main phenophases recorded during spring 2013 after stem heating in the winter 2012–2013 in heated (H) and non-heated (NH) individuals.
SpeciesHeat TreatmentDbh (cm)Height (m)Age at 1.3 m (Years)Leaf Flushing, DOY (Date)First Visible Leaves, DOY (Date)Fully Unfolded Leaves, DOY (Date)Onset Date of Xylem Formation, DOY (Date)
P. sylvestrisNH51.0 ± 1.1 a12.8 ± 0.7 a52 ± 1 a150 ± 2 a (29 May)158 ± 3 a (6 June)180 ± 4 a (28 June)128 ± 3 a (7 May)
H49.8 ± 0.9 a12.3 ± 0.9 a50 ± 1 a148 ± 3 a (27 May)156 ± 3 a (4 June)181 ± 4 a (29 June)125 ± 2 a (4 May)
P. pinasterNH57.2 ± 1.0 a12.1 ± 0.6 a50 ± 1 a148 ± 2 a (27 May)161 ± 2 a (9 June)180 ± 4 a (28 June)106 ± 4 b (15 April)
H58.0 ± 1.2 a11.9 ± 0.5 a53 ± 2 a145 ± 2 a (24 May)158 ± 3 a (6 June)176 ± 3 a (24 June)98 ± 4 a (7 April)
Q. pyrenaicaNH25.0 ± 0.5 a11.8 ± 2.0 a48 ± 3 a140 ± 2 a (19 May)147 ± 3 a (26 May)154 ± 3 a (2 June)113 ± 2 b (22 April)
H29.6 ± 0.8 a11.4 ± 1.9 a52 ± 2 a138 ± 2 a (17 May)145 ± 3 a (24 May)152 ± 3 a (31 May)108 ± 2 a (17 April)
DBH is the diameter at breast height (1.3 m). Values are means ± SE. Significant (p < 0.05) differences between heated and non-heated trees of the same species, and after the heating treatment, are based on Mann–Whitney U tests and indicated by different letters. Different letters indicate significant (p < 0.05) differences.
Table 2. Dendrochronological statistics obtained for the three studied tree species considering the common interval 1965–2009.
SpeciesNo. Trees (No. Cores)Mean Ring Width (mm)AR1Mean SensitivityRbarEPS
Pinus pinaster20 (35)2.76 ± 1.180.68 ± 0.150.33 ± 0.050.620.98
Pinus sylvestris20 (35)3.05 ± 1.120.62 ± 0.130.31 ± 0.070.510.96
Quercus pyrenaica20 (35)1.92 ± 0.470.47 ± 0.160.30 ± 0.040.540.97
Abbreviations: AR1, first-order autocorrelation; Rbar, mean inter-series correlation; EPS, Expressed Population Signal. The Rbar and the EPS values were calculated using residual ring-width series for the 1965–2009 period. Values are means ± SE.
Table 3. Bootstrapped Pearson correlation coefficients calculated between ring-width chronologies and monthly climate variables (Tmean, mean temperature; Pre, total precipitation; SWC, soil water content) for the period 1965–2009. Correlations were obtained from November of the previous year (in lowercase) to current November (in uppercase) and for May–July (MJ) and June–July (JJ).
VariableSpeciesnov.dec.Jan.Feb.Mar.Apr.MayJun.Jul.Aug.Sep.Oct.Nov.MJJJ
TmeanP. pinaster0.190.31 *0.220.52 ***0.080.14−0.24−0.36 *−0.40 **−0.020.170.00−0.25−0.42 **−0.44 **
P. sylvestris0.190.240.100.58 ***0.000.12−0.27 *−0.34 *−0.48 ***−0.020.25 *0.06−0.35 **−0.45 ***−0.46 ***
Q. pyrenaica0.100.090.110.38 **−0.020.13−0.08−0.47 ***−0.42 **0.000.15−0.14−0.23−0.41 ***−0.52 ***
PreP. pinaster0.25 *0.31 *0.39 **0.22−0.070.37 **0.48 ***0.43 ***0.36 **−0.01−0.10−0.11−0.070.64 ***0.51 ***
P. sylvestris0.180.33 *0.39 **0.140.010.30 *0.53 ***0.43 **0.41 ***−0.03−0.23−0.12−0.080.68 ***0.54 ***
Q. pyrenaica0.25 *0.33 *0.320.13−0.030.32 *0.37 ***0.50 ***0.35−0.09−0.060.030.070.60 ***0.55 ***
SWCP. pinaster0.110.29 *0.41 **0.41 ***0.33 **0.48 ***0.68 ***0.74 ***0.80 ***0.68 ***0.54 ***0.30 *0.200.78 ***0.79 ***
P. sylvestris0.100.30 *0.41 ***0.39 **0.34 **0.46 ***0.69 ***0.74 ***0.84 ***0.69 ***0.47 ***0.240.150.80 ***0.81 ***
Q. pyrenaica0.180.37 **0.42 **0.39 **0.34 *0.46 ***0.59 ***0.70 ***0.77 ***0.60 ***0.49 ***0.37 ***0.34 *0.73 ***0.76 ***
Significant (p < 0.05) correlations are shown in bold with a grey background, and asterisks indicate the significance levels (* p < 0.05; ** p < 0.01; *** p < 0.001). The underlined values indicate the highest correlation for each variable and species.
Table 4. Climwin analyses between seasonal growth (earlywood and latewood width indices) and daily climate variables (Tmin, mean minimum temperature; Tmax, mean maximum temperature; Prec, total precipitation).
SpeciesVariableClimate VariableΔAICcWindows OpenWindows Closep-ValueCoefficientR2pAICc
P. sylvestrisEarlywood widthTmin−11.6411630.0000.0880.2470.035
Tmax−15.12782110.000−0.0970.2990.005
Prec−28.84131740.0000.2920.470<0.001
Latewood widthTmin−13.2716770.0000.1190.2720.023
Tmax−20.681772070.000−0.0840.3740.002
Prec−20.091412460.0000.3170.3660.004
P. pinasterEarlywood widthTmin−19.297640.0000.1280.356<0.001
Tmax−18.481442110.000−0.0910.3450.003
Prec−41.02275 (t − 1)1800.0000.5210.587<0.001
Latewood widthTmin−16.1915770.0000.1240.3140.008
Tmax−8.661772090.001−0.0610.2000.140
Prec−29.731792620.0000.3450.480<0.001
Q. pyrenaicaEarlywood widthTmin−10.2327570.0010.0550.1670.105
Tmax−7.31081600.003−0.0490.6400.394
Prec−6.651872290.0040.3760.6180.681
Latewood widthTmin−8.571052660.0010.0550.7240.160
Tmax−9.121622050.001−0.0490.1750.097
Prec−26.341401790.0000.1480.3840.001
∆AICc is the difference between the AICc of the fitted linear model and the null model; windows open and close to show the selected climate window (in days of the year) from the prior (t−1) to the current or growth (t) year; p is the probability value of the fitted model; coefficient and R2 refer to the model values; and pAICc is the p-value of the randomization test (probability of obtaining a similar ∆AICc value by chance). R2 values of those models where the randomization test is significant are marked in bold with a grey background.
Table 5. Average advancement in days for growth onset per °C increase in mean annual temperature for the three studied species (Quercus pyrenaica, Pinus pinaster, and Pinus sylvestris) under the historical period (1970–1999) and two emission scenarios (RCP 4.5 and RCP 8.5) and for the periods 2030–2069 and 2070–2099.
HistoricalRCP 4.5RCP 8.5
1970–19992030–20692070–20992030–20692070–2099
Q. pyrenaica4.953.334.095.025.32
P. pinaster8.785.788.788.6710.49
P. sylvestris4.583.013.774.494.83
Disclaimer/Publisher’s Note: The statements, opinions and data contained in all publications are solely those of the individual author(s) and contributor(s) and not of MDPI and/or the editor(s). MDPI and/or the editor(s) disclaim responsibility for any injury to people or property resulting from any ideas, methods, instructions or products referred to in the content.

