Article

Fire and Logging Decrease Soil CO2 Efflux in Siberian Central Taiga Forests

by
Elena A. Kukavskaya
1,
Alexey V. Panov
1,
Anastasia V. Makhnykina
1,2 and
Pavel Y. Groisman
3,*
1
V.N. Sukachev Institute of Forest of the Siberian Branch of the Russian Academy of Sciences—Separate Subdivision of the Federal Research Center “Krasnoyarsk Science Center SB RAS”, Akademgorodok 50/28, 660036 Krasnoyarsk, Russia
2
Institute of Ecology and Geography, Siberian Federal University, Svobodny Prospect 79, 660041 Krasnoyarsk, Russia
3
North Carolina State University at NOAA National Centers for Environmental Information, Asheville, NC 28801, USA
*
Author to whom correspondence should be addressed.
Forests 2025, 16(7), 1057; https://doi.org/10.3390/f16071057
Submission received: 30 April 2025 / Revised: 23 June 2025 / Accepted: 24 June 2025 / Published: 25 June 2025

Abstract

Extensive wildfires and logging have affected the Russian boreal forests in recent decades. Scots pine (Pinus sylvestris L.) forests are widespread in Russia and are one of the most disturbed tree species in Siberia. However, the effects of disturbance on soil CO2 efflux in the vast Siberian forests are still poorly understood. We used the LI 8100A infrared gas analyzer to study changes in soil CO2 efflux into the atmosphere in mature Scots pine forests in the Siberian central taiga five–six years following fires and logging. Measurements of soil CO2 efflux rates were performed on sites where automatic weather stations have been continuously operational since 2022, which gives us temporal patterns of meteorological fluctuations across forests with different disturbance histories. We found significant differences in soil efflux rates depending on the site and disturbance characteristics. In the undisturbed dry lichen-dominated forest, CO2 efflux was 4.8 ± 2.1 µmol m−2 s−1, while in the wet moss-dominated forest it was 2.3 ± 1.3 µmol m−2 s−1, with soil efflux in Sphagnum sp. being twofold of that in feather moss. Both fire and logging significantly reduced CO2 efflux, with a smaller reduction in soil CO2 efflux observed in the moss-dominated plots (5%–40%) compared to the lichen-dominated plots (36%–55%). The soil efflux rate increased exponentially with increasing topsoil temperatures in lichen-dominated Scots pine sites, with disturbed plots showing less dependence compared to undisturbed forest. In the wet moss-dominated Scots pine forest, we found no significant dependence of soil efflux on temperature for all disturbance types. We also found a positive moderate relationship between soil efflux and forest floor depth in both lichen- and moss-dominated Scots pine forests across all the plots studied. Our findings advance the understanding of the effects of fire and logging on the carbon cycle and highlight the importance of accounting for disturbance factors in Earth system models due to changing climate and anthropogenic patterns.

1. Introduction

Boreal forests play a considerable role in planetary health and ecosystem services for humanity [1]. They contain a globally significant amount of carbon [2] that is vulnerable to release into the atmosphere in a warming climate [3,4]. The warmer climate increases the fire activity [5], the risk of insects’ outbreaks [6], and leads to the growing risks of permanent forest loss [7]. Boreal forests in Siberia are already exhibiting trends of increasing fire frequency and severity [8] which leads to a substantial rise in carbon emissions [9]. Commercial logging is widespread in boreal forests, and several forested areas in Siberia are identified as “hot spots” of land cover change [10,11]. Higher fire activity and intensifying of anthropogenic pressure on forest ecosystems could disrupt the historical disturbance regimes and forest resilience [12,13].
Carbon dioxide (CO2) emissions from the soil surface to the atmosphere (commonly referred to as soil respiration) are responsible for the second largest CO2 flux in the terrestrial ecosystem after gross primary production and play a crucial role in regulating climate warming [14,15]. Although a few studies have examined soil respiration at local and global scales [16,17,18,19], the magnitude and patterns of spatial variation in CO2 fluxes within forest ecosystems and the factors that control them remain unexplored [20].
The Siberian boreal zone stores globally significant long-term carbon pools [21] and is subject to the greatest climate-induced changes [22]. The wide range of climatic and vegetation conditions across Siberia leads to large variations in CO2 flux estimates [23]. The lowest values of soil respiration are found in the northernmost tundra ecosystems [24] and the southern forest-steppe zone [23]. Soil respiration is stand age-, forest type-, soil temperature-, and moisture-dependent [20,23,25].
Wildfires and forest management potentially alter rates of soil respiration. Wildfires in boreal forests mainly decrease soil CO2 fluxes [26,27,28]. Greater reductions in soil efflux are observed in forests burned by high-severity fires compared to low-severity fires [29,30], and in newly burned sites compared to old burns [31]. The impact of logging on carbon fluxes is mainly determined by climatic conditions, ecosystem type, and harvesting method [14]. Research findings vary widely on how the effects of harvesting alter soil respiration [14,32]. A comprehensive understanding of soil CO2 efflux dynamics in response to forest logging remains elusive due to the large variability in results obtained across individual studies [33]. Thus, while some researchers found an increase in soil efflux following logging [32,34], others revealed a significant decrease [35,36]. Kulmala et al. [37] found that logging reduced soil efflux only in the first year, while CO2 efflux was significantly higher in the following two years compared to undisturbed mature spruce forests in Finland. Furthermore, the effect of logging on post-fire carbon fluxes is poorly studied. No recovery of soil respiration after fire and post-fire salvage logging in the first two–four years was found in mature Scots pine-dominated forests of Sweden [38] and the Russian southern taiga [30].
In our work, we measured in situ soil CO2 efflux in undisturbed stands and similar forests disturbed by logging and fire in Scots pine forests with contrasting dominant living surface vegetation (lichens vs. mosses). The objective of our research was to assess the effects of clearcut logging and wildfires on CO2 efflux from soils to the atmosphere in Scots pine forests of the Siberian central taiga. We tested the hypothesis that the variability in CO2 efflux is driven by both vegetation and disturbance types, with the greatest reduction in CO2 efflux in drier lichen Scots pine forests following the dual effects of logging and fire.

2. Materials and Methods
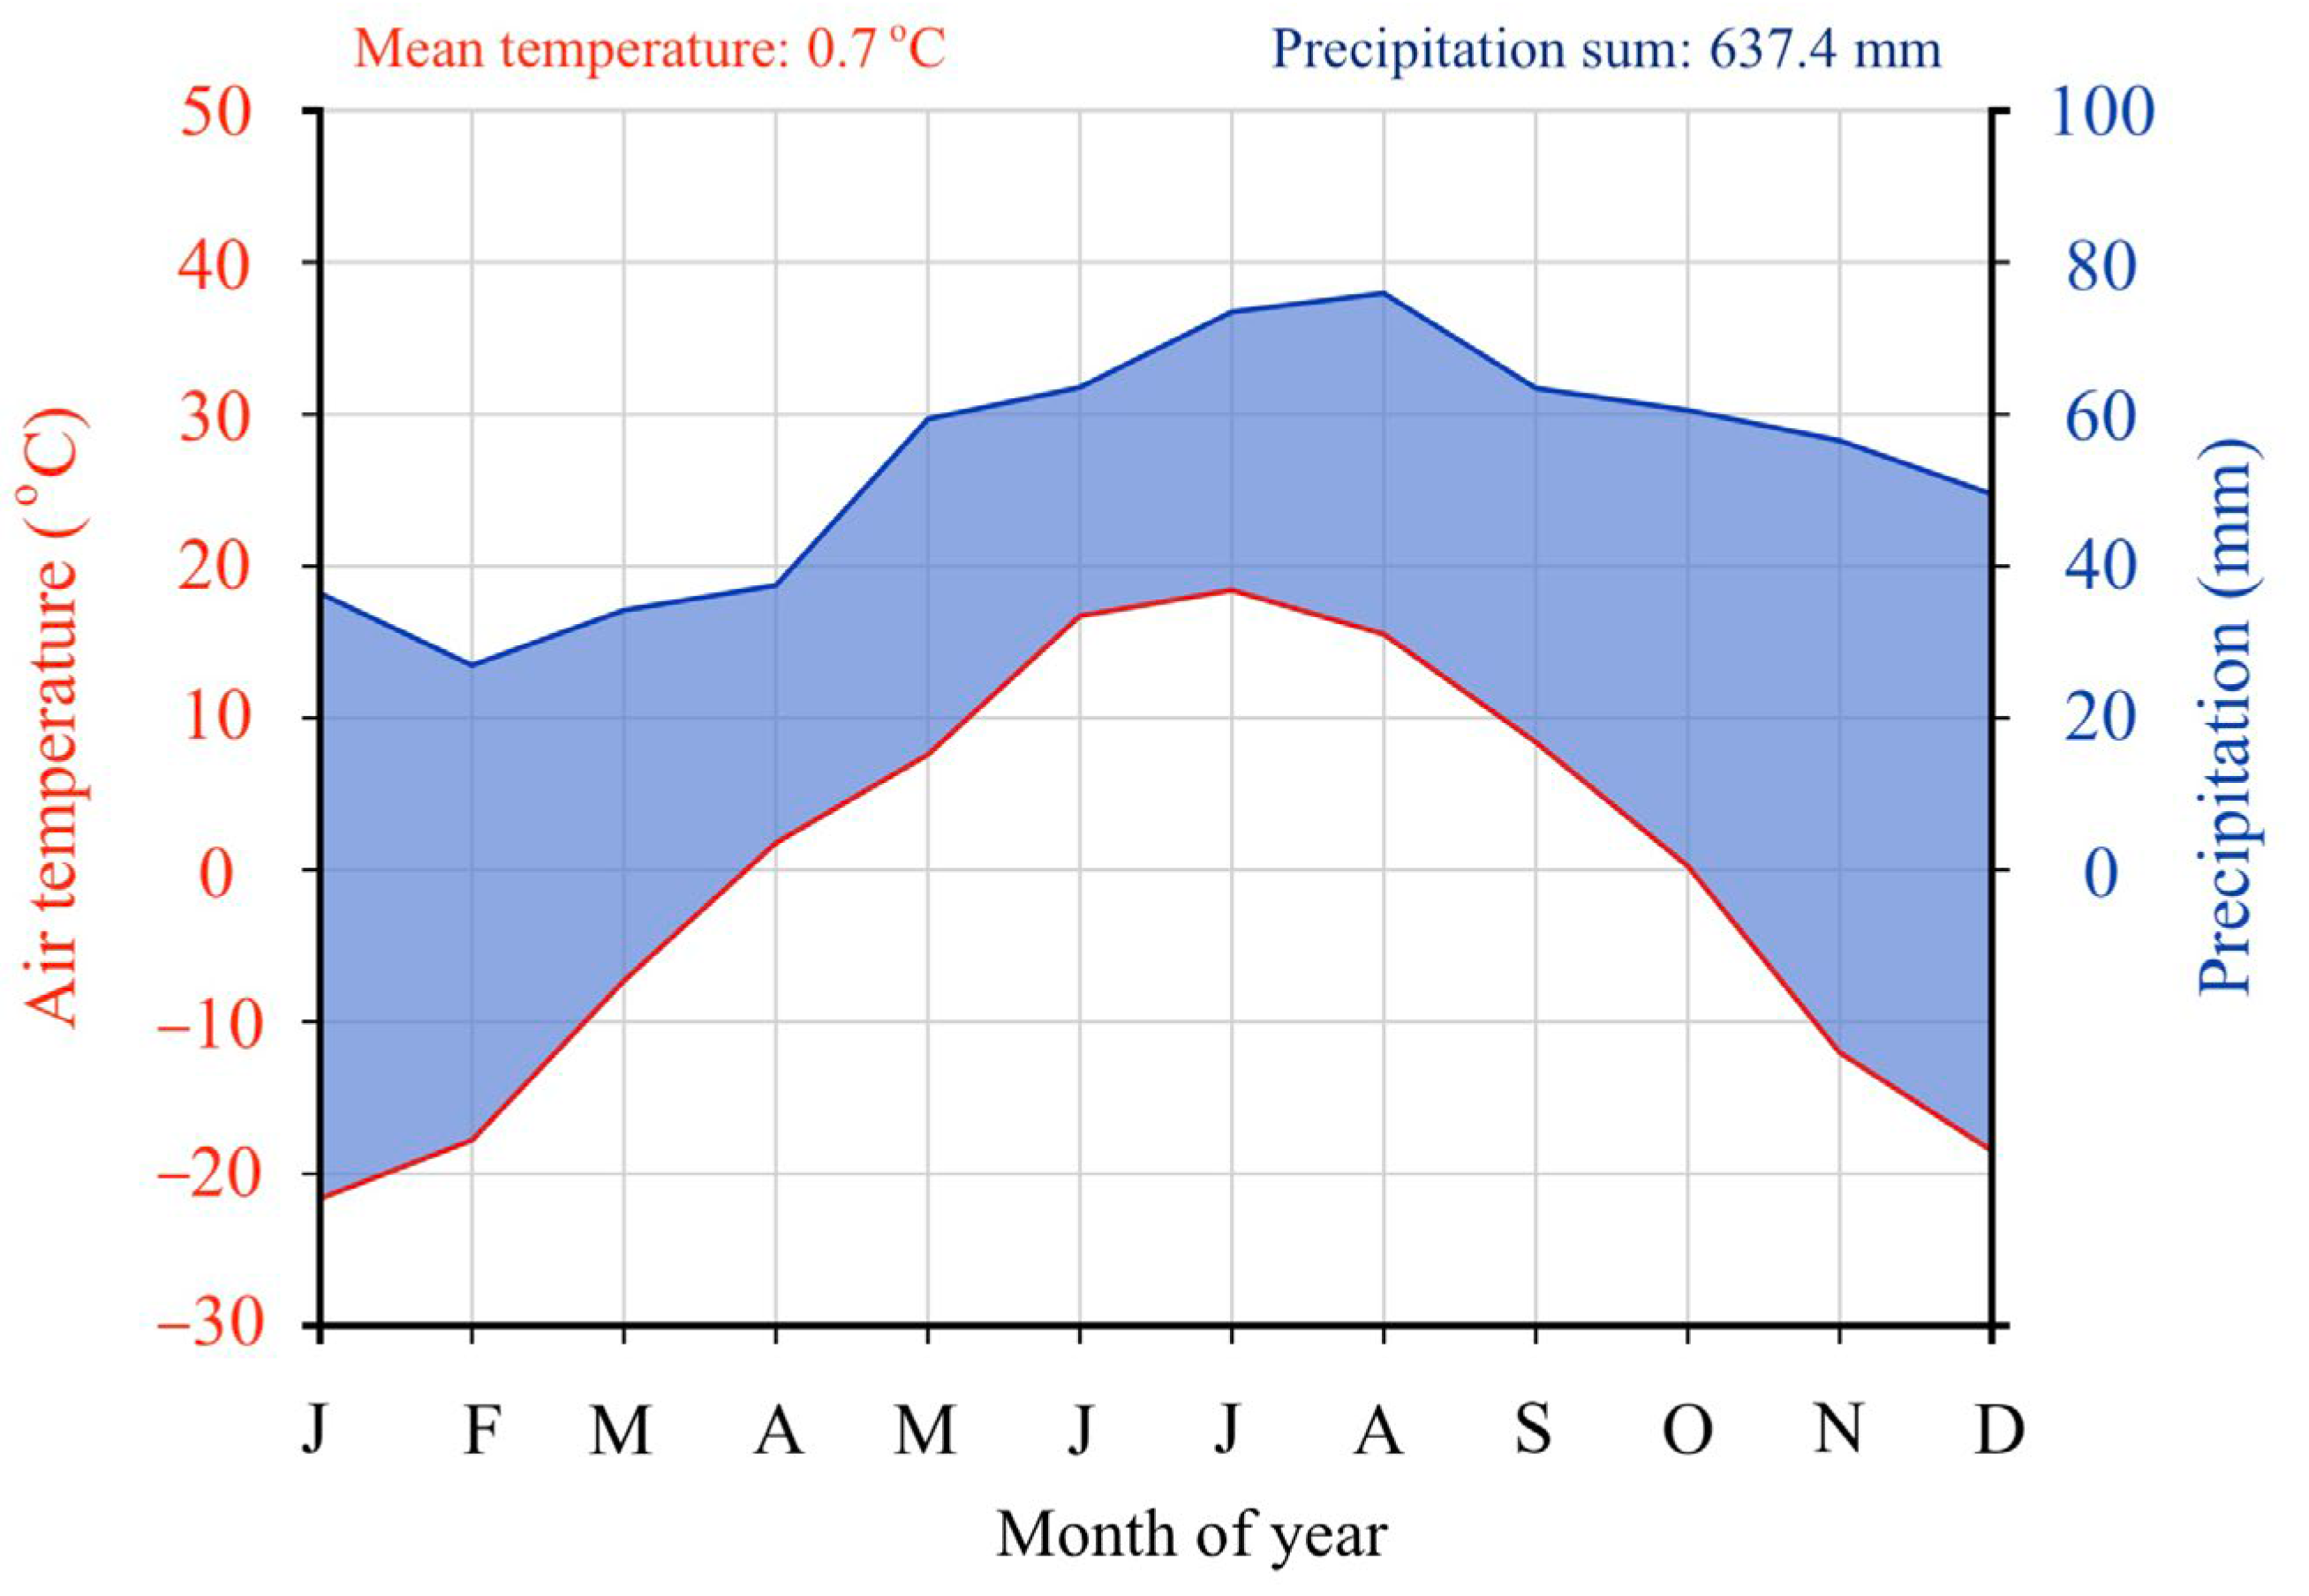
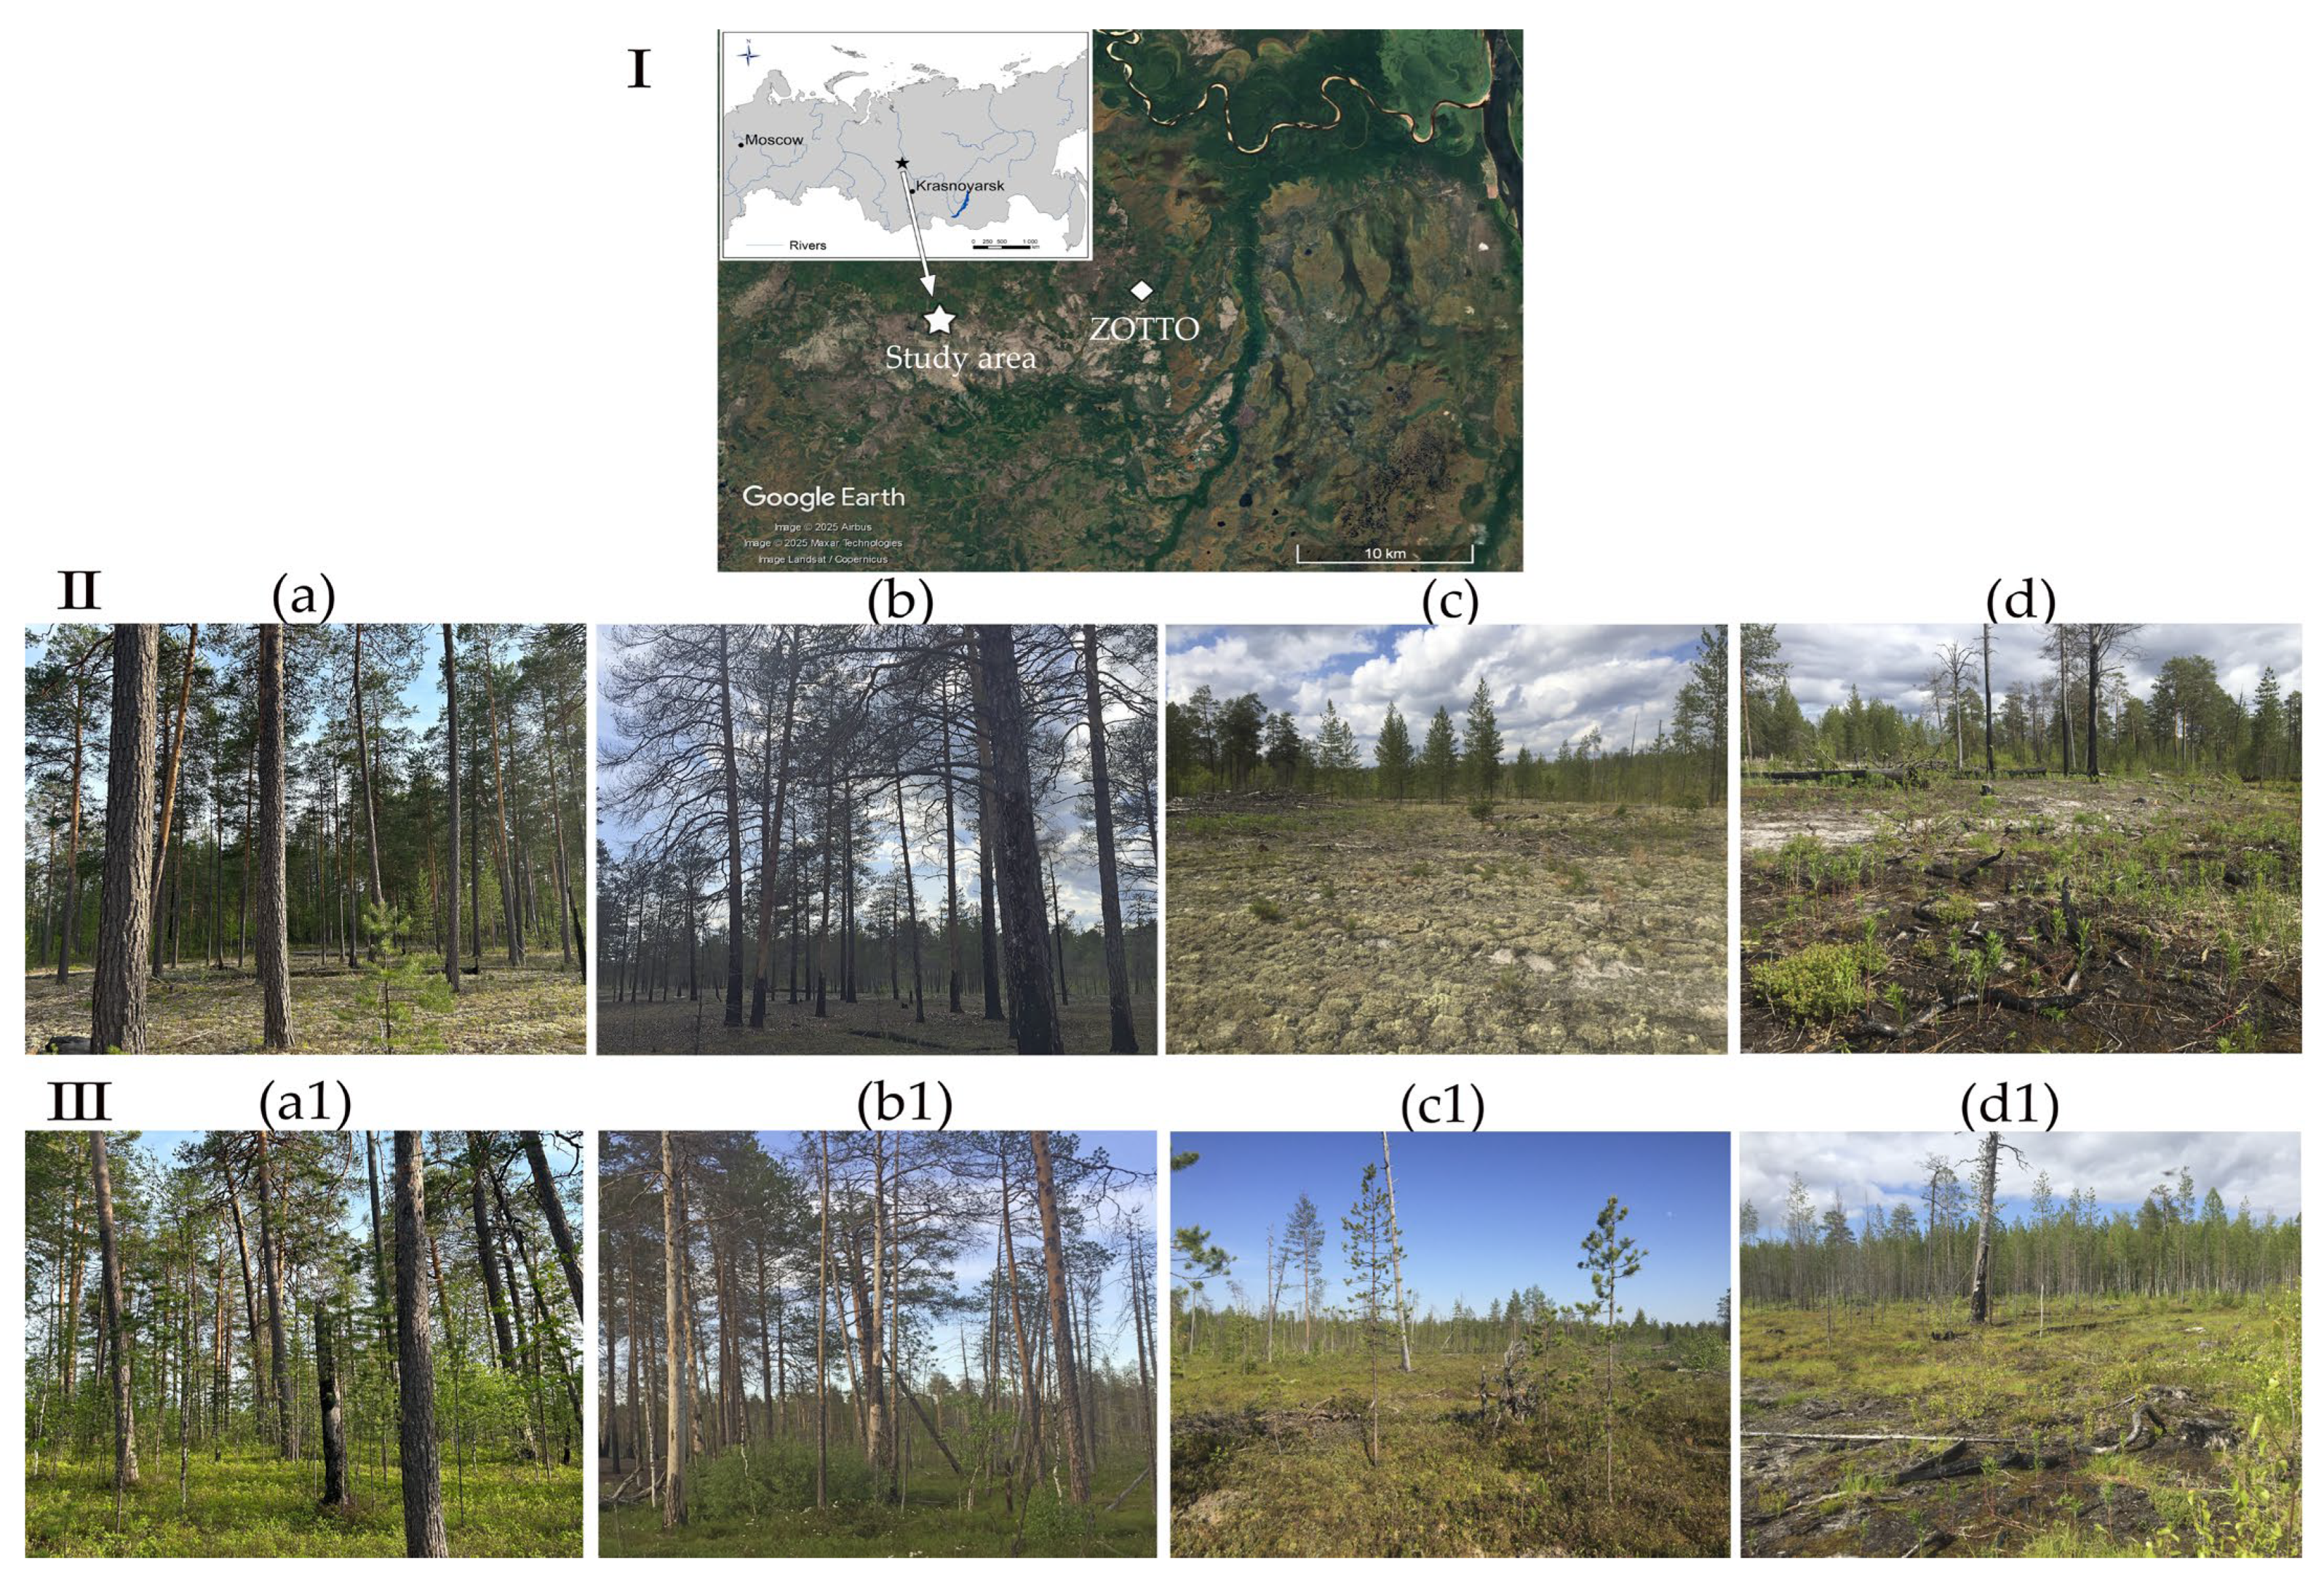
2.1. Study Sites

The investigations of fire and logging impacts on CO2 efflux were carried out in the central taiga where the northernmost commercial logging in the Krasnoyarsk Krai is conducted. The region is highly disturbed by both fires and logging [39]. The study area (60°46′ N 89°08′ E; 80 m a.s.l.) was located near the Zotino Tall Tower Observatory (ZOTTO) in Central Siberia (http://www.zottoproject.org/, accessed on 1 March 2025). According to the Köppen–Geiger classification [40], the region is characterized by a Dfc subarctic climate with long, cold winters and short summers. The Walter and Lieth climate diagram for 2010–2024 (Figure 1) illustrates precipitation and air temperature seasonal records for the study area: the precipitation graph lies above air temperature indicating comparatively humid conditions in the area throughout the year.
The mean annual temperature over the last fifteen years (2010–2024) achieved +0.7 °C, with mean minimum and maximum values of −21.6 and 18.4 °C in January and July, respectively. The annual precipitation is 637.4 mm (Figure 1). Average snow depth ranged from 43 to 70 cm as reported by the weather station in Bor, WMO ID: 23884 (https://rp5.ru; accessed on 1 March 2025).
Scots pine (Pinus sylvestris L.) forests with a dominance of lichens and mosses in the ground cover are widespread in the study region [39]. The open forest structure, flammable surface vegetation, and summer drought typical for Scots pine forests result in moderately frequent low-to-moderate-severity surface fires with occasional severe crown fires [41]. We examined four study sites representing different histories of logging and fire: unlogged/unburned (Figure 2(a,a1)); unlogged/burned (Figure 2(b,b1)); logged/unburned (Figure 2(c,c1)); and logged/burned (Figure 2(d,d1)). The sites were located close to each other, and selected stands at each site had comparable characteristics prior to fire and logging disturbance. The pure Scots pine forest stands were of fire origin and included several age groups: 275, 235, 80, and 40 years. The average tree diameter at breast height (DBH) was 40.8 cm and the height was 19.3 m. The logged sites were formed because of clearcutting in the winter of 2017–2018. In July 2018, severe surface fires spread across the study area spreading through both forest and logged areas. At each of the four sites, in 2022 we identified two study plots (located in proximity to each other) depending on the pre-disturbance dominant living ground vegetation: (i) lichens (Cladonia rangiferina (L.) Web. ex Wigg, C. arbuscula (Wallr.) Flot., C. stellaris (Opiz) Pouzar & Vezda) and (ii) mosses (Pleurozium schreberi (Willd. ex Brid.) Mitt., Sphagnum fuscum (Schimp.) H. Klinggr., Sphagnum palustre L.). Vaccinium vitis-idaea L. prevailed among small shrubs in lichen-dominated Scots pine forests. In the wetter plot, dominated by Sphagnum sp. and feather moss, Ledum palustre L., V. myrtillus L., V. vitis-idaea L., V. uliginosum L., and Empetrum nigrum L. were among the living ground vegetation.
The soil types were Albic Podzols in Scots pine forests with lichens as dominant ground cover and Histic Podzols in the sites dominated by mosses [42]. As the clearcutting was conducted in winter, the living ground cover was not severely disturbed at all logged sites (Figure 2). In the plots dominated by lichens, fire resulted in their total consumption in both forest and logged sites. In the moss-dominated plots, only the upper layer of mosses and duff was consumed, with the depth of burn being greater in logged sites than in forest. Both fire and logging resulted in the proliferation of Calamagrostis epigejos (L.) Roth, Chamaenerion angustifolium (L.) Scop., and Carex spp. along disturbed sites. Haircap moss (Polytrichum commune Hedw.) invaded exposed areas of mineral soil by the car tracks where lichens had dominated.

2.2. Soil CO2 Efflux Measurements

We measured CO2 efflux from the soil to atmosphere in 2023 and 2024 in June–July, the season that corresponds to the maximum air and soil temperatures as well as soil flux rates in the study region [43]. Chamber measurements were performed in 9–12 replicates in each sample site using an LI 8100A infrared gas analyzer (LI-COR Biosciences Inc., Lincoln, NE, USA). The polyvinylchloride collars (inner diameter 20 cm) were inserted to the mineral layer to a depth of 2–3 cm to reduce air leakage from below the collar. The vegetation inside the chamber was not removed during the measurements. In lichen-dominated sites, the offset (the distance from the top of the collar to the dense forest-floor layer) was 7–9 cm, whereas in moss-dominated sites, it varied between 10 and 15 cm. The instrument measured and logged CO2 concentrations for two minutes in each collar. CO2 fluxes were further calculated in relationship to CO2 concentration values using linear regression (R2 > 0.85) in software provided by LI-COR Biosciences Inc. (LI8100, Lincoln, NE, USA).
CO2 efflux measurements were coupled with topsoil temperature records at 10 cm depth using a Temperature Probe Type E (Omega Engineering Inc., Norwalk, CT, USA). Topsoil water content was measured using a Theta Probe Model ML soil moisture sensor (Delta T Devices Ltd., Cambridge, UK) at a depth of 5 cm. In addition, the depth of ground cover (litter, moss, lichen, and duff) was measured near all collars.

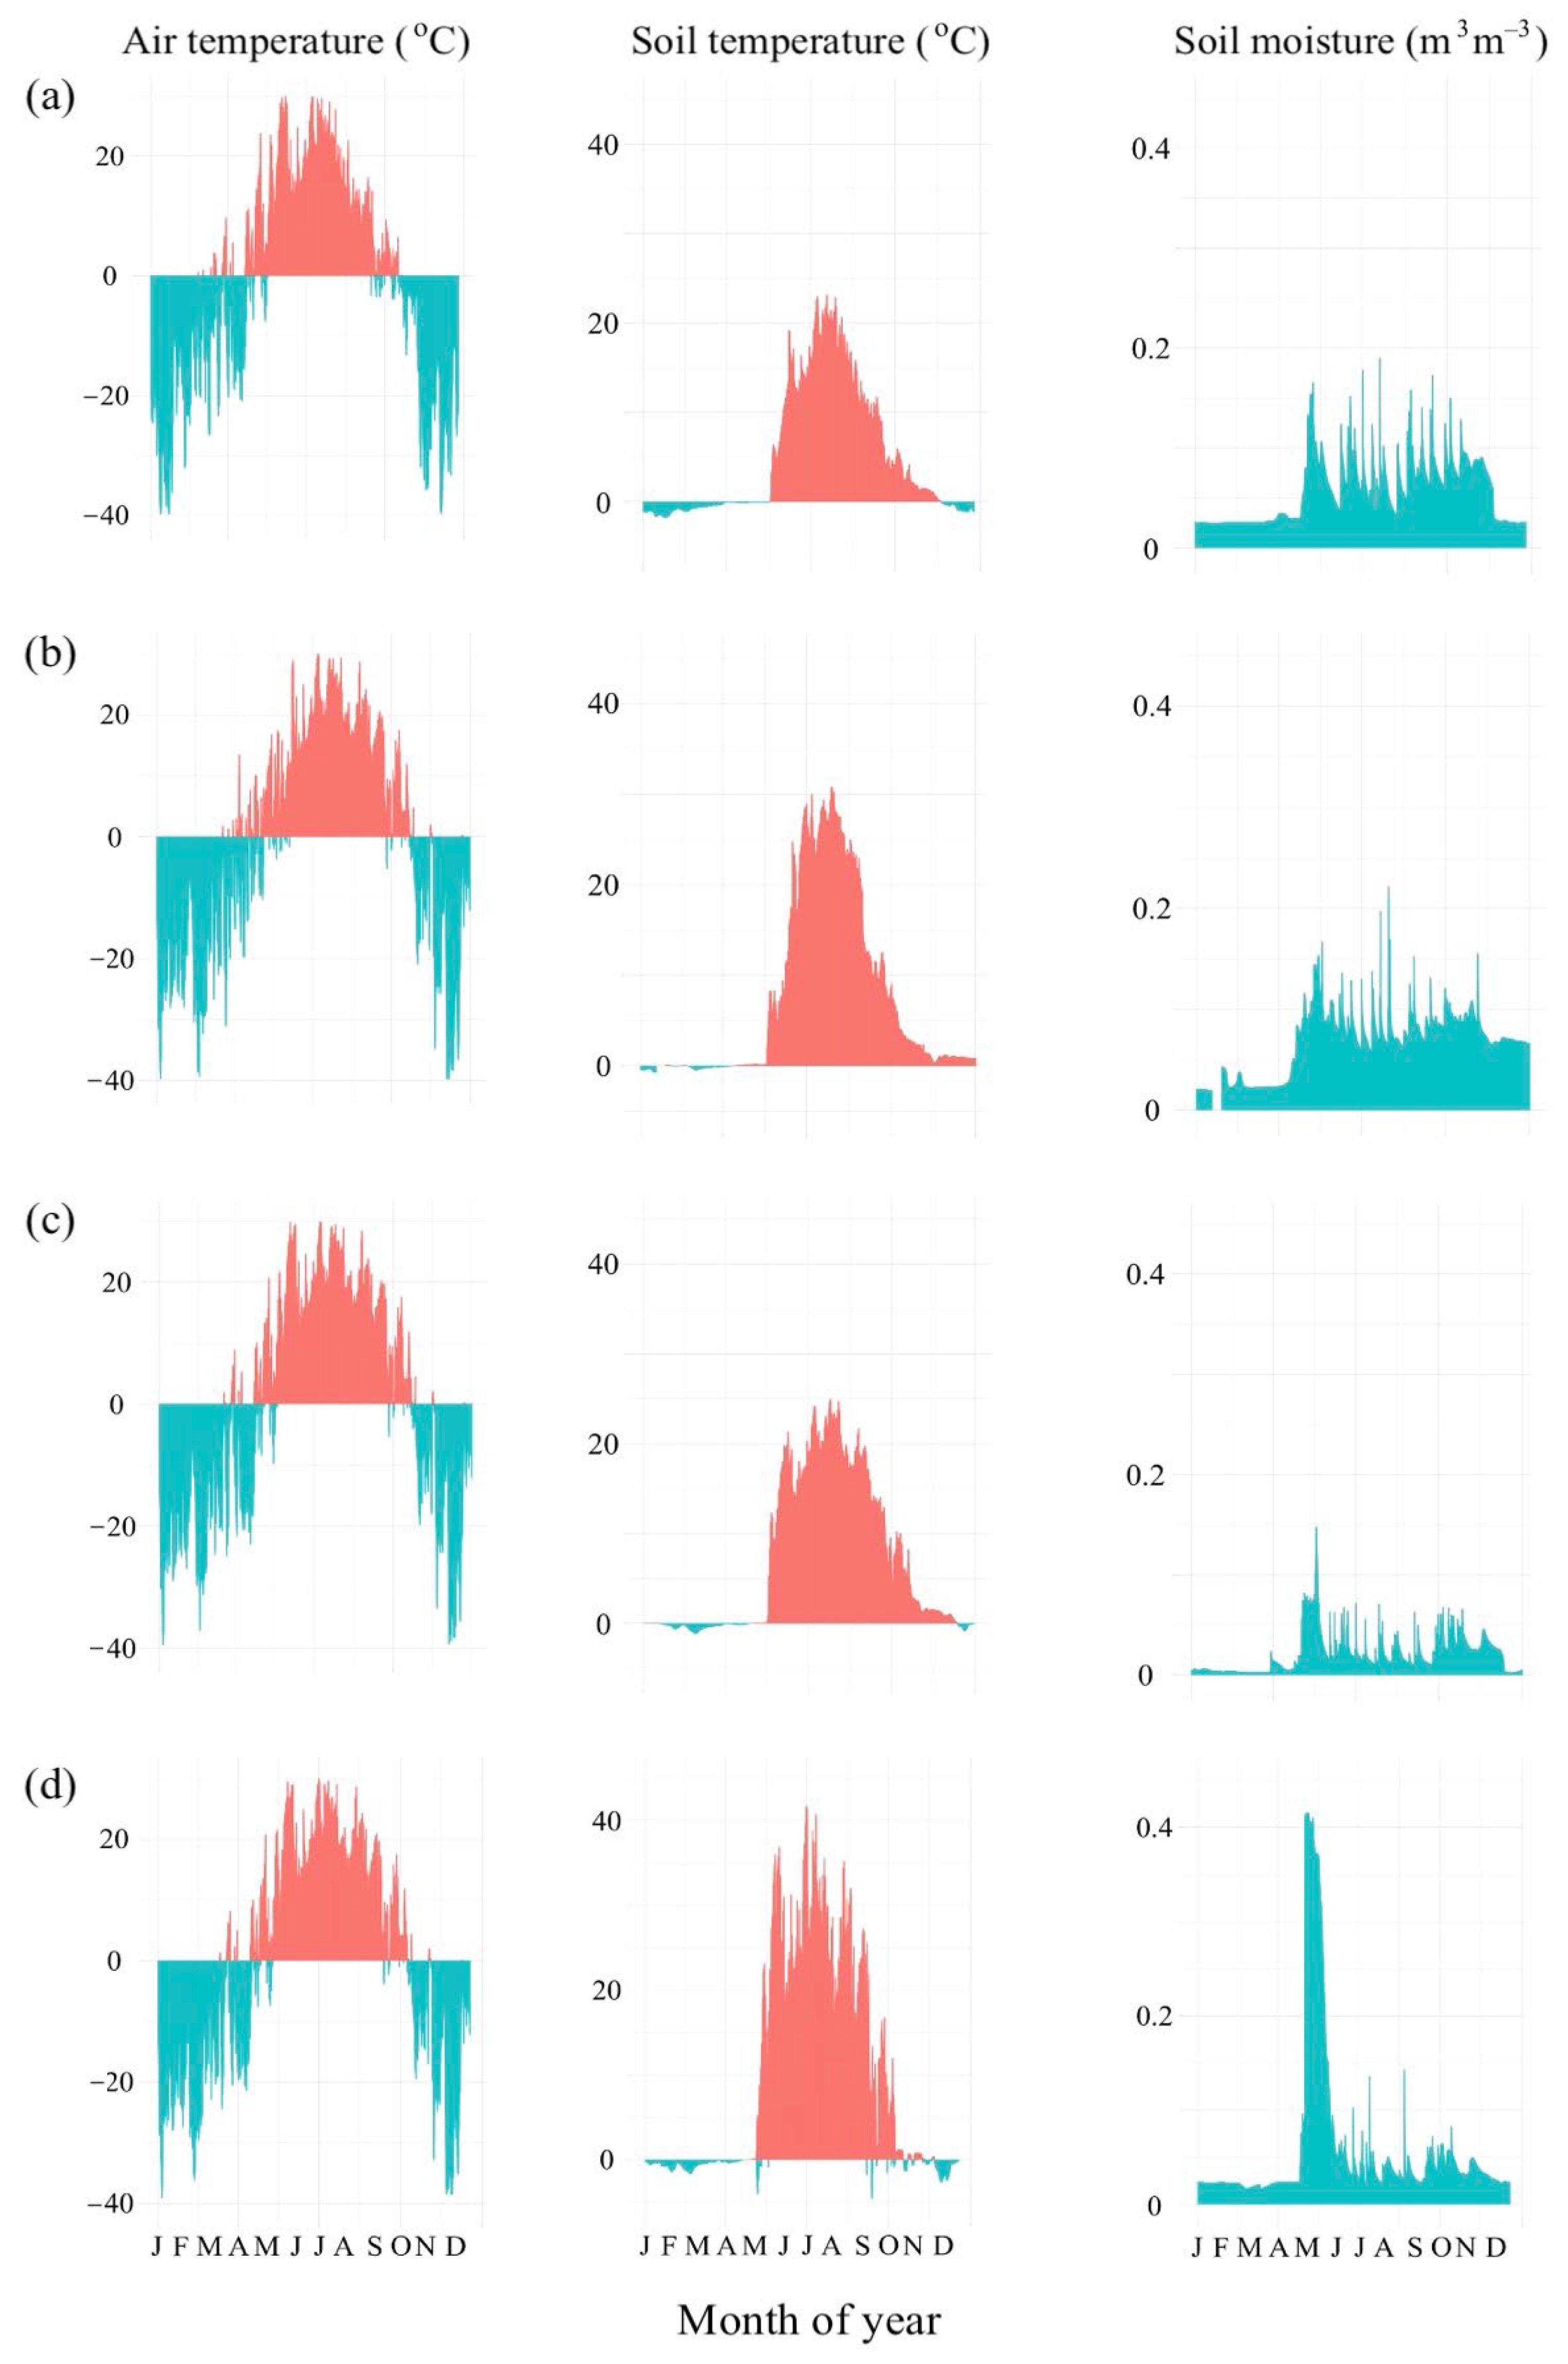
2.3. Weather Station Data

To evaluate the effect of meteorological and soil conditions on soil CO2 efflux, four automatic weather stations were mounted in 2022 across a Scots pine forest with lichens as the dominant living vegetation, within sites with different disturbance histories: unlogged/unburned, unlogged/burned, logged/unburned, and logged/burned. The Campbell Scientific weather stations are powered by solar panels and batteries and run continuously throughout the year. Weather variables recorded by meteorological sensors installed at 2 m above ground level and inside the soil surface include the following: wind parameters, atmospheric pressure, air temperature, relative humidity, solar radiation, precipitation, soil temperature, soil heat flux, and soil moisture at different depths. In this paper, we used air temperature records (HC2S3 Rotronic Hygroclip 2 temperature and relative humidity probe with RAD10 10 Plate Unaspirated Radiation Shield, Campbell Scientific Inc., Logan, UT, USA) and soil temperature and moisture records at 10 cm depth (CS650 Soil Moisture and Temperature Sensor, Campbell Scientific Inc., Logan, UT, USA). The recording of meteorological variables was operated by the CR-1000 data logger (Campbell Scientific Inc., Logan, UT, USA) every 30 min.

2.4. Data Analysis

Statistical analyses of the data were performed using R, version 4.2.1 [44]. Graphs were generated using the R package ‘ggplot2’, version 3.4.1 [45]. Means and standard deviations were calculated for the studied parameters. Repeated-measures ANOVA, followed by a Tukey HSD test, were performed to assess whether soil CO2 fluxes for different sites were significantly different. Differences were considered significant at p < 0.05. Exponential models were implemented to describe the relationship between CO2 efflux and soil temperature. The dependence of soil efflux on forest floor depth and moisture was described using linear regressions. Furthermore, we employed the structural equation model (SEM) to establish relationships between the different parameters studied and CO2 fluxes. We constructed our SEM in the R package ‘lavaan’, version 0.6–19 [46].

3. Results

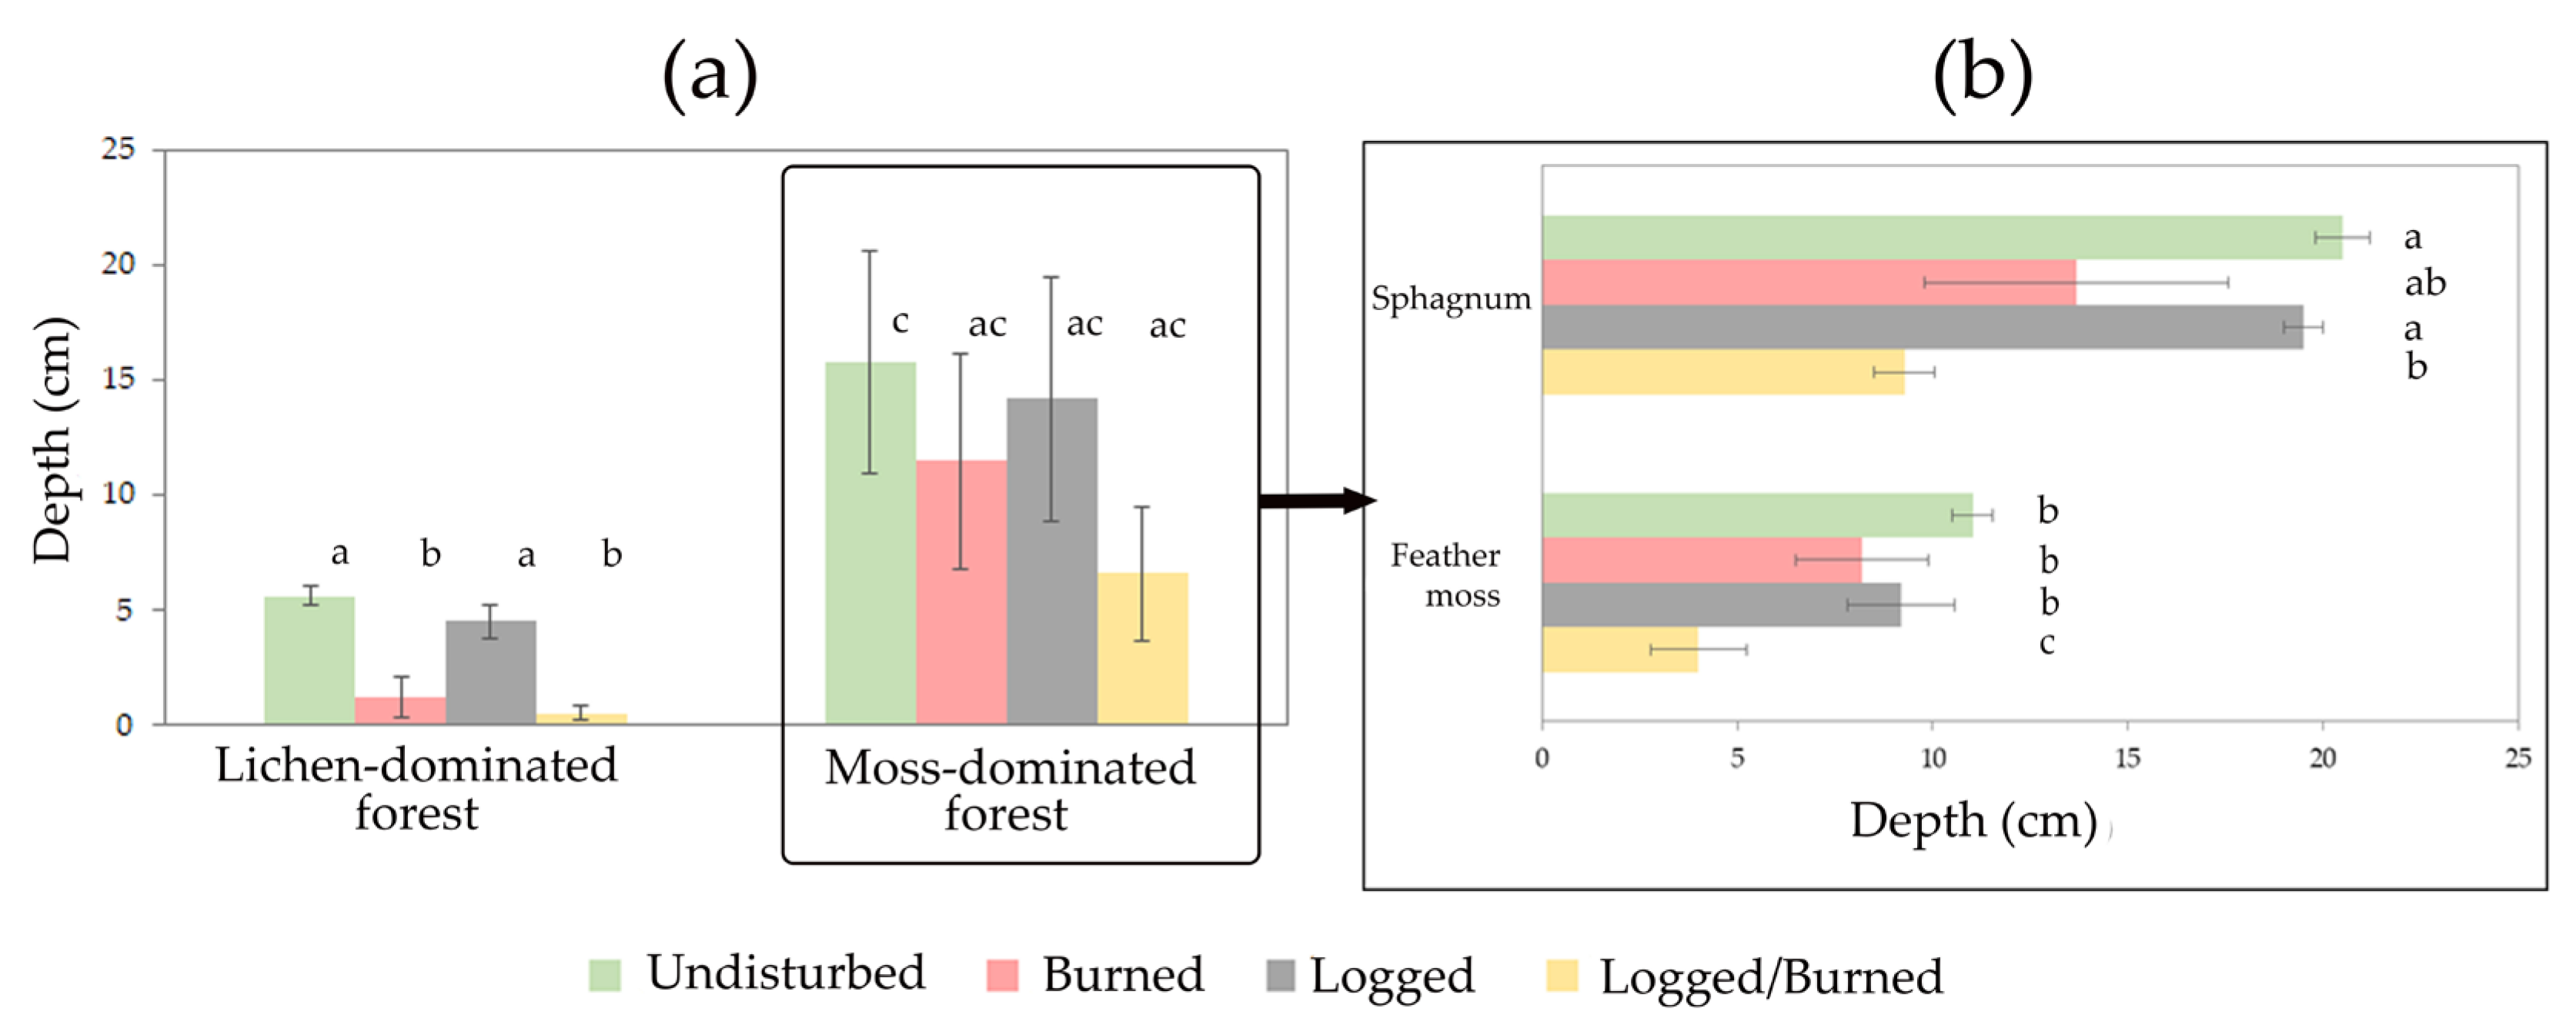
3.1. Weather and Soil Characteristics of the Scots Pine Forests with Different Disturbance Histories

Seasonal patterns of weather and soil characteristics in lichen-dominated Scots pine forests differed significantly depending on the disturbance type (Figure 3). The mean annual air temperature in the undisturbed forest (−2.2 °C) was lower than in the disturbed sites (−1.2 °C). The colder winter (December–February) temperatures were observed in the undisturbed site (−20.2 °C) rather than in the disturbed sites (−18.7 °C). In turn, mean summer (June–August) temperatures across the sites demonstrated rather similar records (15.9 °C), except for the logged site where the value was higher (16.9 °C). The mean annual soil temperature at 10 cm depth within the unlogged/unburned forest demonstrated lower values (about 4.5 °C) compared to the disturbed sites (6.3 °C). We observed substantially colder winter soil temperatures in the undisturbed forest (−1.1 °C) compared to the disturbed sites (−0.3 °C). Summer soil temperatures achieved 14.8 °C and 18.4 °C for the unlogged/unburned forest and disturbed sites, respectively.
The mean annual soil moisture at 10 cm was ~50% higher (Figure 3) in undisturbed and burned forests throughout the year, compared to logged sites. In turn, during the spring snow thaw (May), logged sites demonstrated strong pulse-like enhancements in soil moisture with an eventual drop back to much lower values, while unlogged sites demonstrated smoother spring melt peaks and further higher moisture records throughout the growing season.
The depth of ground cover consisting of lichens, mosses, litter, and duff varied across our plots as a function of vegetation and disturbance type. It was 5.6 ± 0.4 cm (mean ± standard deviation) in the undisturbed lichen-dominated Scots pine forest, while in the burned forest it decreased by 78% (Figure 4a). The logged site was characterized by a slightly lower depth of ground cover, while in the repeatedly disturbed site it was 0.5 cm.
The depth of the forest floor in the moss-dominated Scots pine forest was at least three times greater than in the lichen forest (Figure 4a). It showed a similar trend with respect to disturbance type as in the lichen-dominated forest, but the variation within plots was large. This was due to the dominance of two vegetation communities—Sphagnum sp. and feather moss (Pleurozium schreberi)—which differed significantly in ground cover depth (Figure 4b). In the undisturbed Sphagnum-dominated communities it was twice as high (20.5 ± 0.7 cm) as in the areas occupied by feather moss (11.0 ± 0.6 cm). In the burned forest, the depth in the Sphagnum and feather moss was 33% and 25% lower than in the undisturbed forest, while in the repeatedly disturbed plots it was 55% and 65% lower, respectively.

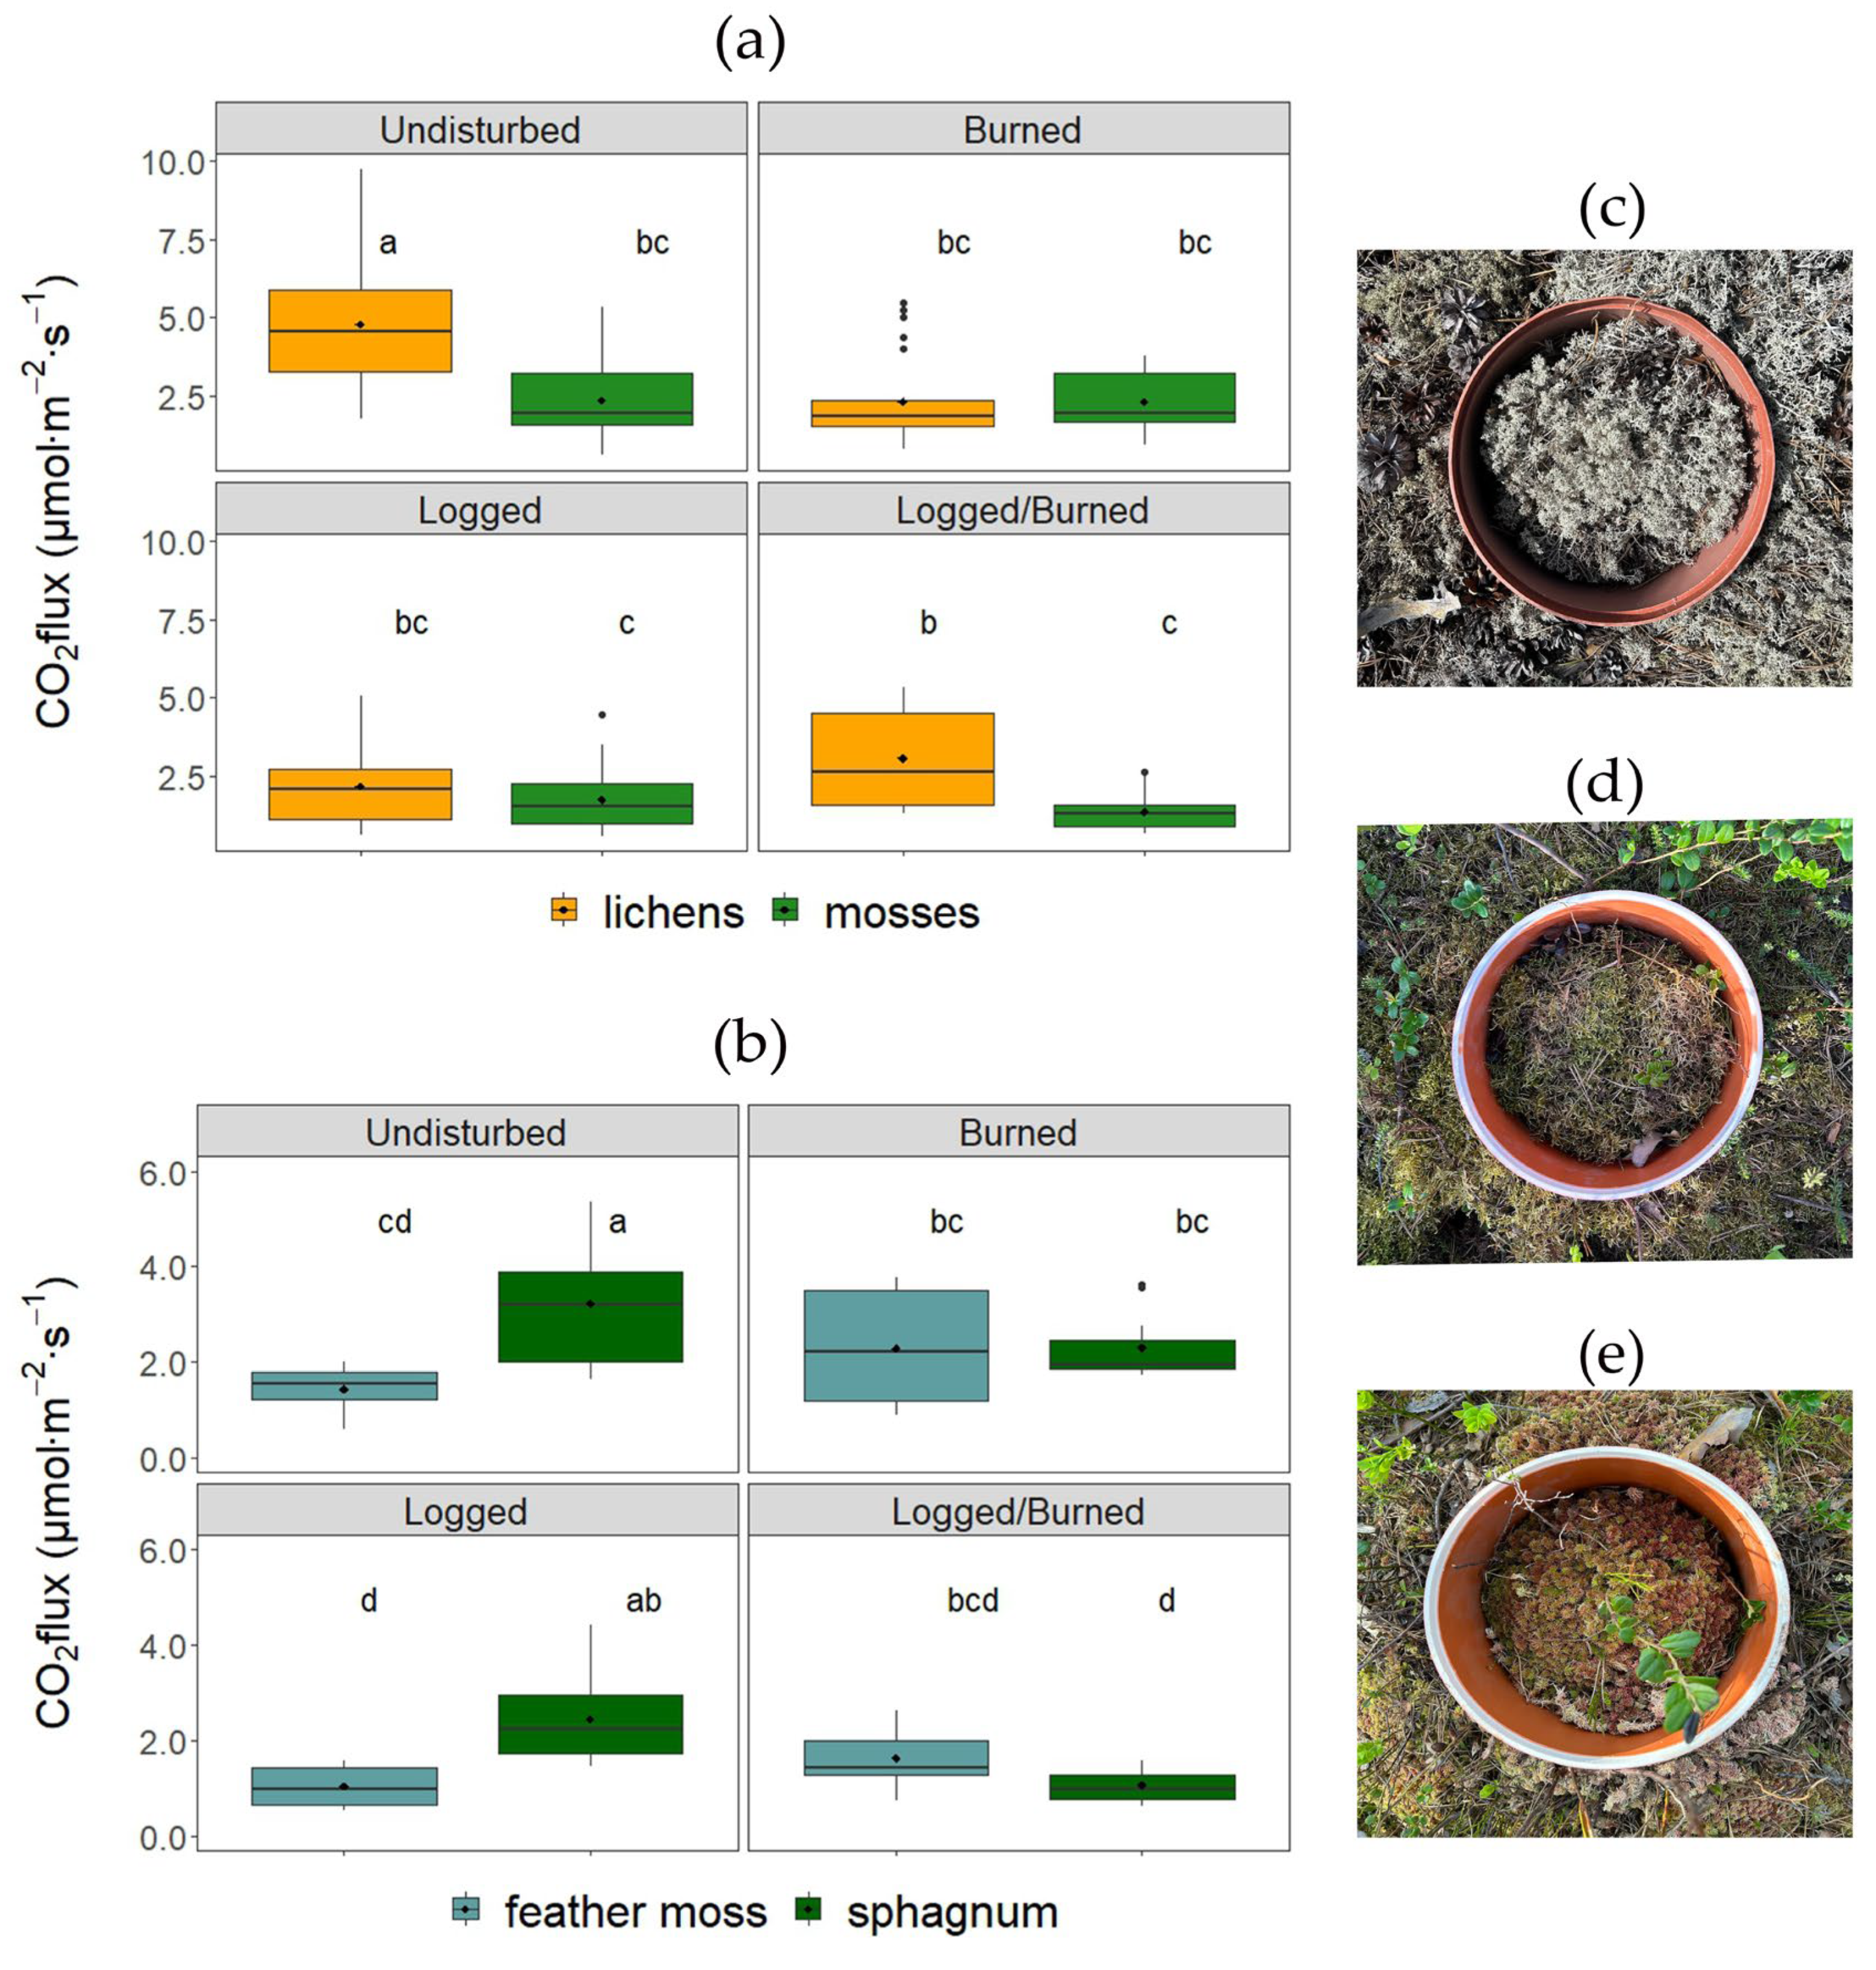
3.2. Wildfire and Clearcut Logging Impact on Soil CO2 Efflux

In the undisturbed mature Scots pine forests of the central Siberian taiga, soil CO2 efflux was 4.8 ± 2.1 µmol m−2 s−1 (mean ± standard deviation) in the lichen-dominated plot and 2.3 ± 1.3 µmol m−2 s−1 in the plot dominated by mosses (Figure 5).
Wildfires and clearcut logging significantly reduced soil CO2 fluxes in the lichen-dominated Scots pine forest. Five to six years after the disturbance, the greatest reduction (by 55%) was observed in the severely burned forest. A similar decrease in soil efflux was found in the logged site. In the logged/burned site, the efflux decreased by 36% with a large variability in efflux (Figure 5).
In the wetter Scots pine forest with a dominance of mosses, soil CO2 efflux 6 years after fire did not differ from the efflux in the undisturbed site. The clearcut logging plot in the moss-dominated Scots pine forest demonstrated 25% lower CO2 efflux. The lowest efflux (1.4 ± 0.6 µmol m−2 s−1) was recorded on the repeatedly disturbed (logged and burned) site (Figure 5).
We also found significant differences in soil CO2 efflux rates between feather moss and Sphagnum sp. vegetation in the moss-dominated Scots pine forest (Figure 5b). In the undisturbed forest, soil efflux was twice as high in Sphagnum as in feather moss (3.2 ± 1.2 vs. 1.5 ± 0.4 µmol m−2 s−1). In the burned forest, CO2 efflux did not differ significantly in respect to dominant vegetation. Logged sites in both feather moss and Sphagnum showed 25% lower soil efflux rates compared to the undisturbed forest. Five–six years after the dual effect of fires and logging, CO2 efflux in feather moss did not differ significantly (p > 0.05) from undisturbed forest, while in Sphagnum it still demonstrated 65% lower values (Figure 5).

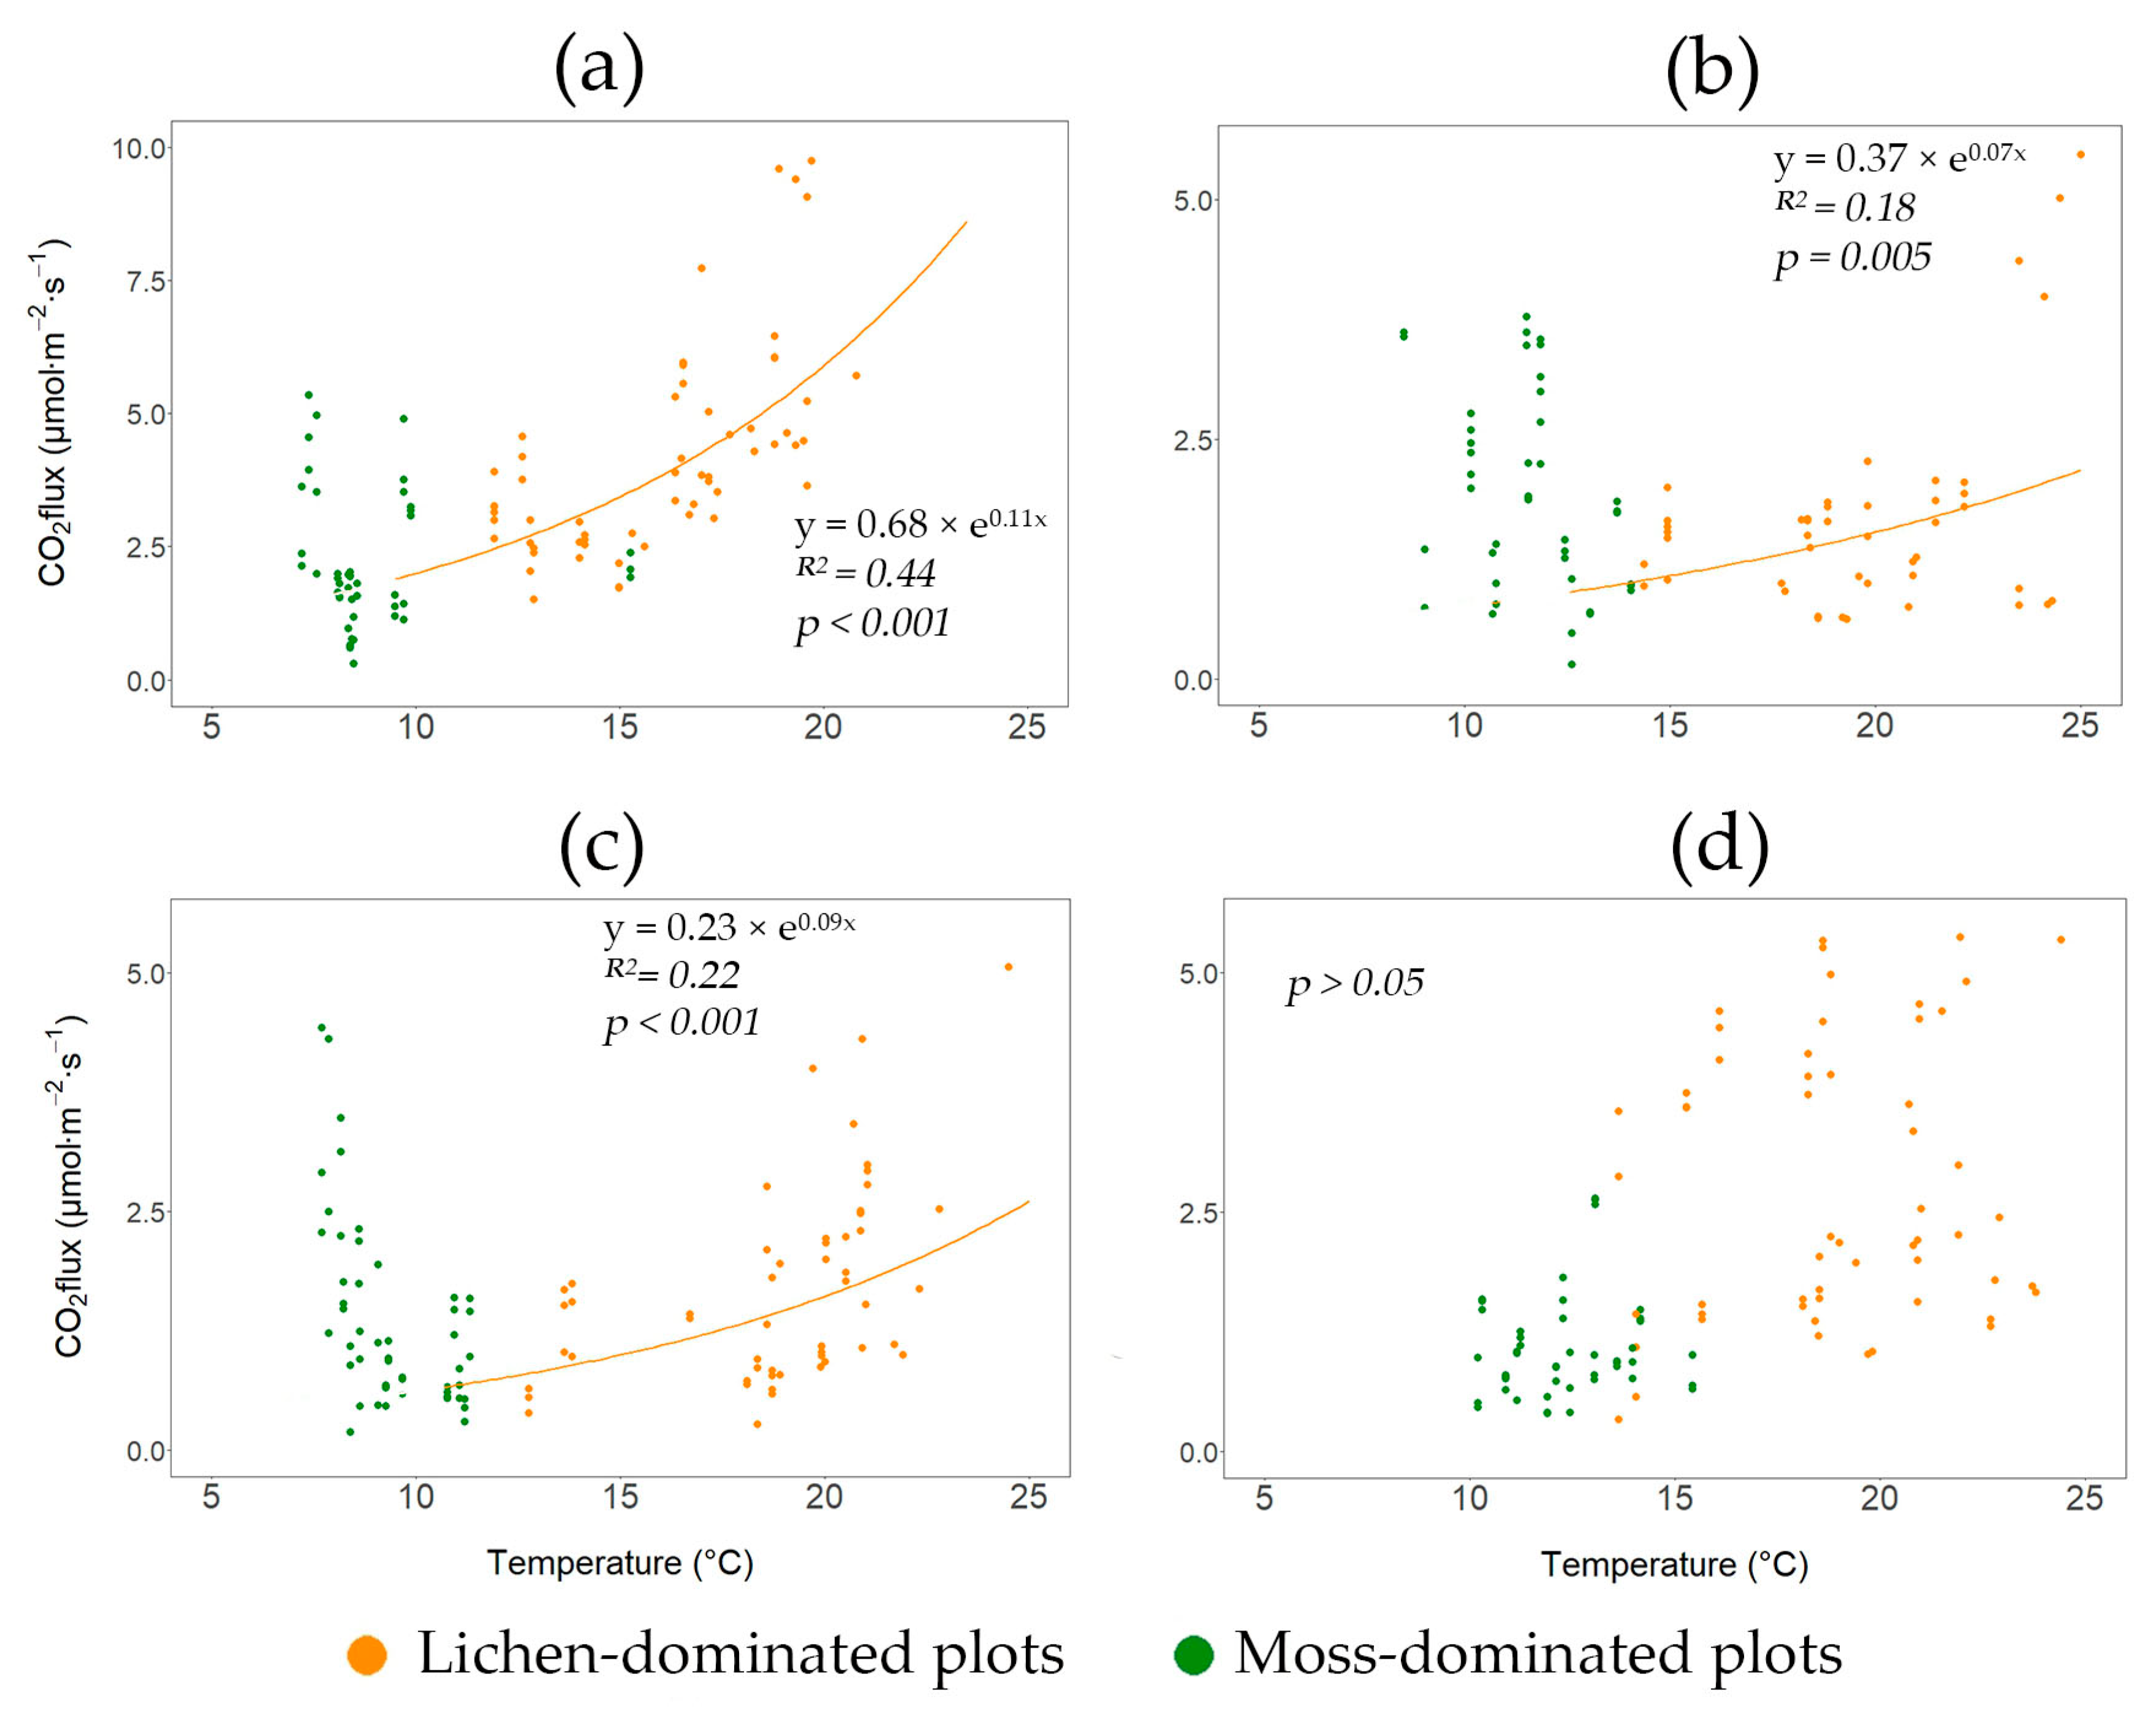
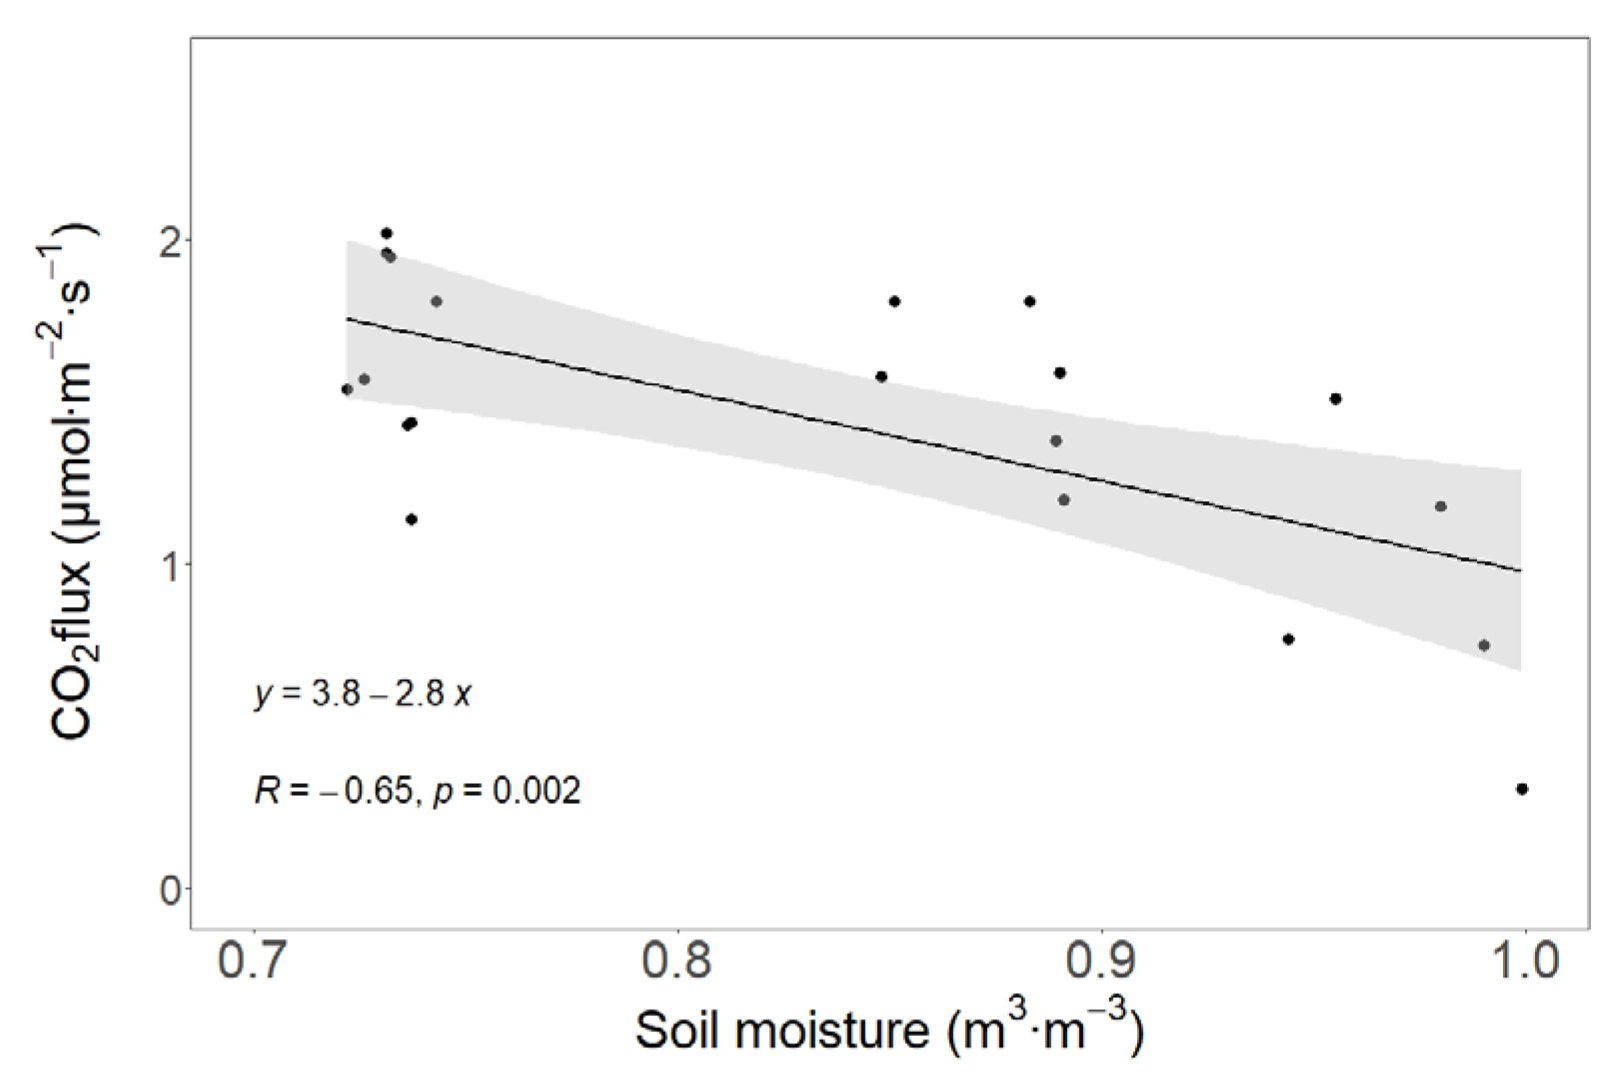
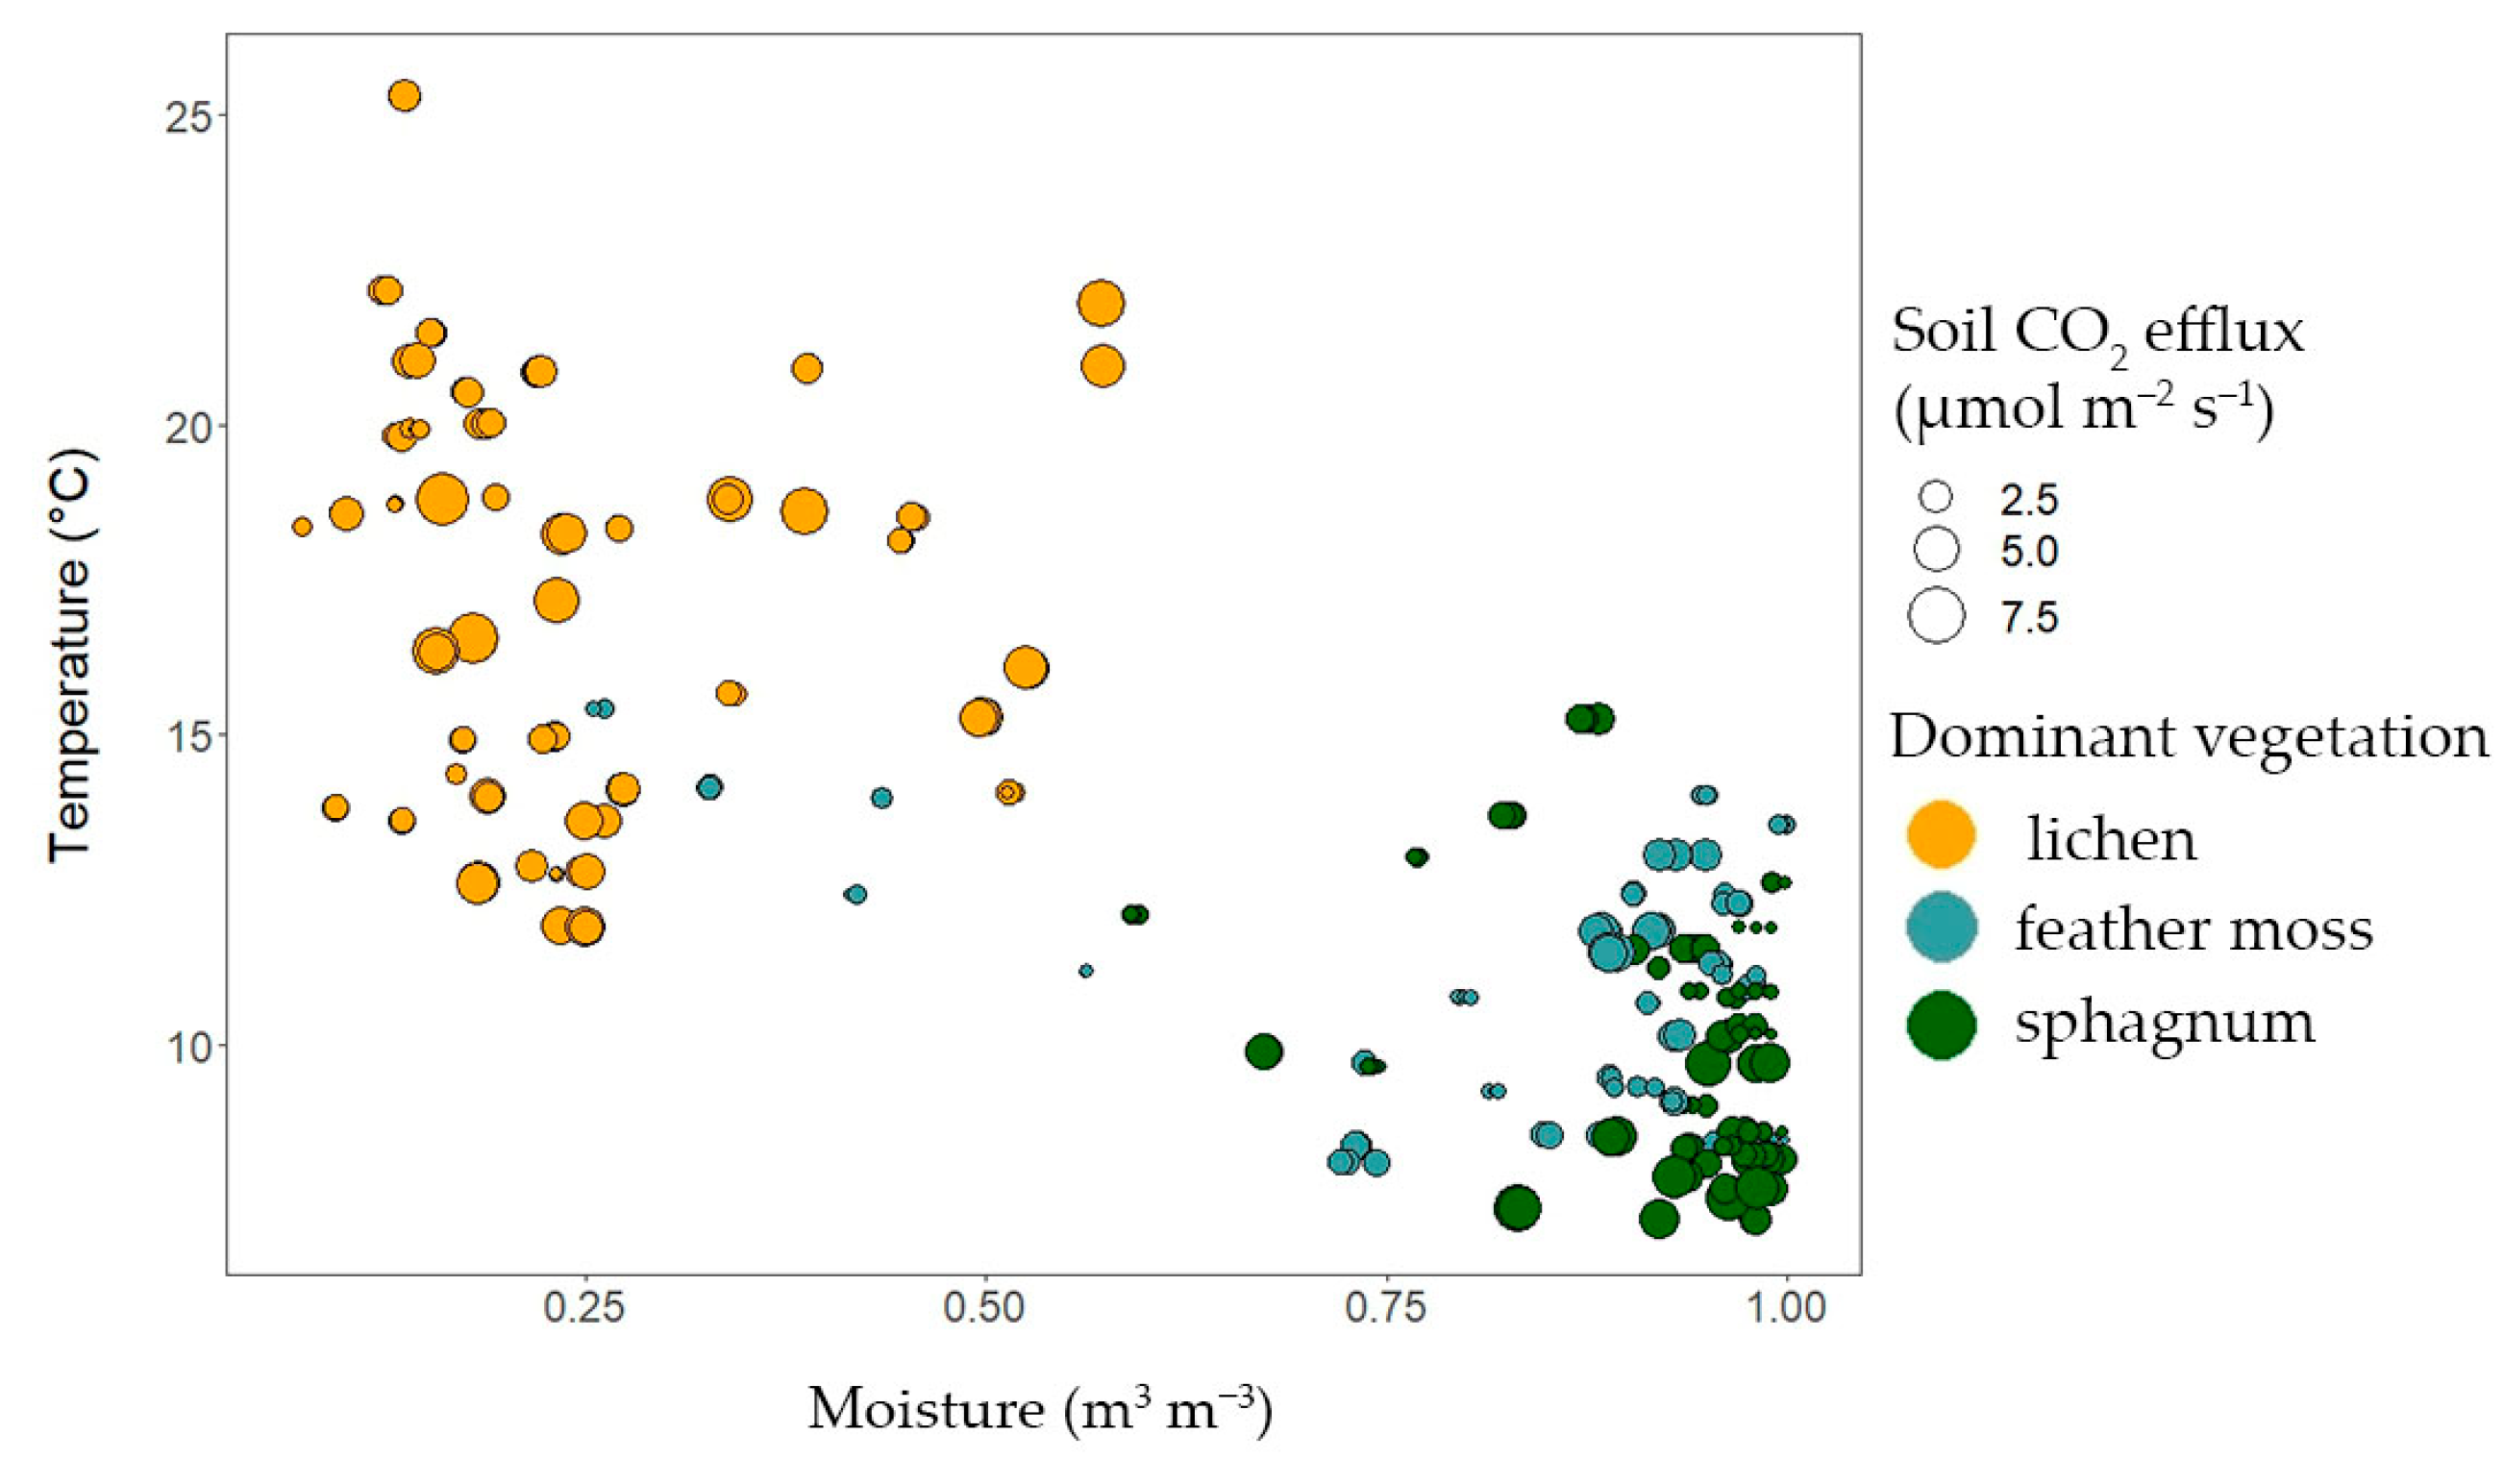
3.3. The Dependences of Soil CO2 Efflux on Soil Temperature, Moisture, and Forest Floor Depth

The soil CO2 efflux rate increased exponentially with rising topsoil temperature in the lichen-dominated Scots pine forest (Figure 6). The greatest effect of soil temperature on CO2 efflux was found in the undisturbed forest (R = 0.66, p < 0.001). Disturbances increase the variability of site characteristics and the importance of other factors, leading to a decrease in the significance of the effect of soil temperature on CO2 efflux. The dependence was low in the burned forest and in the logged site, while no significant relationship between soil efflux and temperature was found in the repeatedly disturbed site. Overall, the soil temperature at 10 cm depth was 20% higher in the burned and logged sites compared to the undisturbed lichen-dominated Scots pine forest. In the Scots pine forest with the surface cover dominated by mosses, soil efflux showed no significant dependence on temperature regardless of disturbance type (Figure 6).
We found no significant dependence of CO2 efflux on soil moisture in any of the plots studied, except for feather moss in the moss-dominated undisturbed Scots pine forest (Figure 7). There was a decreasing CO2 efflux trend along with increasing soil moisture.
Overall, the moss- and lichen-dominated Scots pine forests differed significantly in soil temperature and moisture ranges (Figure 8). The lichen-dominated plots had the highest soil temperature and the lowest moisture, whereas the moss-dominated plots were characterized by high moisture and twice-as-low temperature as lichen-dominated plots. Sphagnum sp. had 8%–20% lower temperatures and 5%–35% higher moisture than feather moss (Figure 8).
Soil CO2 efflux had a moderate positive correlation (R = 0.36–0.48, p < 0.001) with forest floor depth in both lichen- and moss-dominated Scots pine forests (Figure 9). Higher soil efflux was associated with greater fuel depth in undisturbed forests. In contrast, decreased values of fuel depth and soil efflux were observed across the sites that had been disturbed by logging and fire.
The structural equation model (SEM) revealed complex cause–effect interactions among the studied parameters and soil CO2 efflux across all sites examined (Figure 10). Topsoil temperature and moisture exhibited strong correlations with the dominant vegetation type, while the type of site (i.e., disturbance) significantly influenced the depth of the forest floor. Furthermore, CO2 efflux was consistently controlled by all factors studied (vegetation and site types, soil temperature, and ground cover depth), whereas soil moisture did not have a significant effect on the efflux rate.

4. Discussion

Soil efflux is highly variable as a function of ecosystem and forest type [20,47,48]. It is also highly dependent on weather conditions such as temperature, moisture, and precipitation [49,50,51]. To obtain an overview of the seasonal patterns for the basic climatic variables across lichen-dominated Scots pine forests of the central taiga, Krasnoyarsk Krai, for 2024, we analyzed air temperature, topsoil temperature, and moisture records for four study sites: unlogged/unburned, unlogged/burned, logged/unburned, and logged/burned (Figure 3). In general, the mean annual air temperature across the sites demonstrated significantly lower records for the undisturbed forest compared to disturbed sites. The colder winter temperatures observed in the undisturbed forest than in the disturbed sites seem to contribute significantly to the mean annual values and are mainly related to the different insolation of the sites with and without tree canopy and the stronger temperature inversions expected under the lower turbulence within the forest stand. In turn, topsoil temperature (at 10 cm depth), which is sensitive to seasonality and air temperature extremes, showed a higher seasonal discrepancy across the sites. Similar to the air temperature records, the mean annual soil temperature within the unlogged/unburned forest illustrated a lower value compared to the disturbed sites, which could be attributed to essentially colder winter and much lower summer soil temperatures observed in the undisturbed forest than across the disturbed sites, respectively. Along with temperature, topsoil moisture (at 10 cm depth) in the lichen-dominated Scots pine forest gives details on shallow soil hydrology that is mostly related to the variety of above-surface processes and vegetation dynamics. Hence, the hydrological differences mainly reflect the evapotranspiration processes of tree canopies and functionality of root systems. In general, the mean annual soil moisture was ~50% higher in undisturbed and burned forests throughout the year compared to logged/burned and logged/unburned sites.
Based on the temperature variables for the presented period of observations, the growing season in the study area generally starts earlier across the burned sites (first decade of May) compared to the undisturbed and logged forest (second decade of May) due to the lower albedo of the burned area and earlier snow melt in spring. However, for the burned/unlogged site air temperature fluctuations were very high during the whole of May, so a stable start of the growing season can only be expected from late May–early June. The end of the growing season occurred earlier in the undisturbed lichen-dominated Scots pine forest (middle of September), while on disturbed sites the season ends within the third week of September.
Vegetation affects soil CO2 efflux by influencing the soil’s microclimate and structure, the quantity and quality of detritus supplied to it, and the overall rate of root respiration [52]. We found significant differences in CO2 efflux rates between undisturbed Scots pine forests dominated by lichens and mosses. Our estimate of soil efflux in the undisturbed lichen-dominated plot was similar to that obtained for the same forest type close to our study area, while it was completely different for the moss-dominated plots [53]. Here we obtained a twice-as-low CO2 efflux as in the lichen-dominated forest, whereas Makhnykina et al. [53] found significantly higher soil emissions in feather moss compared to lichens. We believe this is due to differences in soil properties and vegetation characteristics. Both lichen- and feather moss-dominated Scots pine forests studied in [53] had the same podzol soils with relatively low average soil water content, not exceeding 0.3 m3 m−3, whereas our plots had contrasting soil characteristics (Figure 8). Specifically, soil moisture averaged 0.24 m3 m−3 in our lichen-dominated forest and 0.82 m3 m−3 in the moss-dominated forest, where Sphagnum sp. grew along with feather moss. Other studies have also reported the lower soil respiration in wet poorly drained forests compared to well-drained sites [25,54,55], mainly due to reduced extracellular enzyme activity affecting the accessibility of soil organic carbon [56] and oxygen limitations for aerobic decomposition [57].
Overall, our estimates of soil CO2 efflux in the undisturbed lichen- and moss-dominated Scots pine forests of the central Siberian taiga were consistent with those obtained for Scots pine forests in the Russian European central taiga [25] and Lithuanian [58] and Swedish [38] boreal zones, and they were 50%–75% lower than in the southern Siberia [30].
Changes in vegetation resulting from human activities or global environmental change have the potential to modify the flux of CO2 from the soil to atmosphere [52]. Overall, our disturbed sites were characterized by lower ground cover depth, higher soil temperatures, and lower moisture levels due to tree death and combustion of the forest floor in a fire. At the same time, the impact of fire and logging on the tree stand, ground cover, and soil characteristics was greater in the drier lichen-dominated Scots pine forest than in the wet moss-dominated forest. These factors simultaneously influence the production and consumption of organic matter, controlling the overall rate of soil efflux. Repeated disturbances, such as fire and logging, seem to have a greater impact on reducing soil efflux due to the destruction of both the tree canopy and the forest floor [30]. As hypothesized, soil CO2 efflux decreased significantly at all disturbed sites in a lichen-dominated Scots pine forest 5–6 years after wildfire and logging. Root respiration is a primary contributor to the soil carbon pool, and therefore a major factor influencing CO2 rates [52], accounting for up to 90% of total soil efflux [59]. The reduced CO2 efflux in our burned and logged sites was associated with decreased root and rhizosphere respiration and root exudates, which provide readily available carbon to soil biota [60]. A recent global meta-analysis of the numerous ecosystems affected by fire, including boreal forests, showed that the decrease in soil respiration was largely due to the changes in soil organic carbon (C), dissolved C, microbial biomass C, and below-ground biomass [61]. In the lichen-dominated Scots pine forest, however, we did not confirm our hypothesis that soil efflux is lowest at the repeatedly disturbed (logged and burned) site. We found the greatest reduction in CO2 efflux in the burned plot, which had been exposed to a high-severity fire. This fire resulted in the death of almost all the trees and the complete consumption of the forest floor. In general, high-severity fires have stronger effects on carbon fluxes than low-severity fires [62] as they result in a significant decrease in autotrophic respiration due to high tree mortality, the death of most ground vegetation, and a high-to-total consumption of the forest floor. We believe that the higher soil efflux in our logged/burned site was attributed to the decomposition of dead roots and slash after logging and the proliferation of ground vegetation such as Calamagrostis epigejos, Chamaenerion angustifolium, and Carex sp. 5–6 years after disturbance. We did not measure CO2 efflux in the first four years after disturbance but expected them to be lowest in the first year after repeated disturbance (logging and fire), as previously reported for the logged southern taiga Scots pine forests that burned in the year of the survey [30].
In the moss-dominated Scots pine forest, wetter soil conditions partially mitigated disturbance effects and resulted in a significantly smaller reduction in soil CO2 efflux compared to the drier lichen-dominated forest (Figure 5). The greatest decrease in soil efflux was observed in the repeatedly disturbed (logged and burned) site (Figure 5), where the forest floor was most affected (Figure 2 and Figure 4). Meanwhile, the two-fold difference in CO2 efflux rates in feather moss and Sphagnum sp. in the moss-dominated plot emphasizes the need to account for microrelief [63] and vegetation characteristics [25] for accurate assessment of soil respiration. Overwatering reduces soil efflux, as we observed in feather moss (Figure 7), where a significant decrease in CO2 efflux was associated with increasing soil moisture.
Overall, while some studies show an increase in soil respiration after disturbances such as clearcutting [14,64], our findings align with the studies showing that disturbances lead to a reduction in soil efflux in the first years after their impact [14,28,30,38]. Soil efflux increases as a function of time after disturbance, with reestablishment of vegetation cover and recovery of trees [31,62].
CO2 efflux is positively related to soil temperature in many ecosystems, with changes in temperature tending to increase soil respiration by altering the rate of consumption of carbon sources [58,65,66]. While we found a good relationship between CO2 efflux and topsoil temperature in the lichen-dominated Scots pine forest, the significance of soil temperature effects on CO2 efflux appears to be reduced in the disturbed sites due to increased variability in site characteristics and a high decrease of soil carbon in disturbed sites (Figure 6). Meanwhile, we found no significant dependence of soil efflux on temperature in the moss-dominated sites (Figure 6). The deep ground fuel depth in moss-dominated sites (Figure 4) prevents sharp temperature changes in the topsoil. The temperature range in the moss-dominated sites did not exceed 8 °C, while in the lichen-dominated sites it was almost 15 °C over the same time period (Figure 6). Collecting more seasonal soil efflux data under higher weather variability might improve the relationship between CO2 efflux and temperature, but this seems to be more limited by high soil moisture in this forest type. This corresponds well with a recent analysis performed in Alaskan ecosystems, which demonstrated a descending response of CO2 efflux to soil temperature in wetter sites [67]. Clearcutting and wildfires often lead to waterlogging in poorly drained soils [68,69]. This in turn can impede oxygen diffusion, thereby reducing rates of decomposition and microbial production of CO2 [54] and limiting plant nutrient uptake and growth [70]. Meanwhile, predicted increases in temperature due to climate change [71] would lead to the drying of such wet sites, which could enhance microbial and root respiration and result in the release of larger amounts of CO2 into the atmosphere.
Although our research has some limitations due to the experimental design and the limited study period, the findings emphasize the importance of accounting for disturbance factors when assessing CO2 efflux rates in Siberian boreal forests. We could neither control nor influence the wildfires or forest management treatments. The sites we studied were burned by a high-severity fire, which has a more severe impact on the soil properties, resulting in a greater decrease in microbial activity [72] and a higher decline in CO2 efflux [29]. However, although low-severity fires are more frequent in Russian Scots pine forests [41], intensification of fire regimes due to climate change leads to higher fire severity [8] and a more drastic change in soil efflux. Additionally, the responses of soil efflux to fire and logging may be time-dependent, as post-disturbance soil microbial activity and vegetation communities vary over time [28,31,33,37,61]. Since we only measured soil efflux five–six years after the disturbance, we could not record any short-lived changes in soil CO2 efflux, such as, for example, the increase in CO2 emissions observed by some researchers in the first hours after a fire [73]. The structural equation model presented in this study elucidated the multiple causal relationships that govern the variability of environmental, weather, and soil parameters (Figure 10). However, a substantial portion of the variance in soil CO2 efflux remained unexplained. Future work is necessary to assess diurnal, seasonal, and annual CO2 efflux rates and to link these results with weather data to better understand how climatic conditions and disturbance characteristics can affect soil respiration after wildfire and logging.

5. Conclusions

Soil CO2 efflux into the atmosphere in the Siberian central taiga Scots pine forests varied significantly depending on the site characteristics. Wet moss-dominated forests showed a lower efflux compared to dry lichen-dominated forests. Wildfires and clearcut logging significantly reduced CO2 efflux rates five–six years after the disturbance. The magnitude of decrease depended on site and disturbance characteristics. The greatest reduction in soil efflux was observed in lichen-dominated Scots pine forests that had been disturbed by a high-severity fire. In the moss-dominated Scots pine forest, wetter soil conditions partially mitigated the effects of disturbance to some extent, resulting in a smaller reduction in soil CO2 efflux with a greatest decrease observed in the repeatedly disturbed (logged and burned) site. The reduction in soil efflux suggests that soil carbon lost during a fire may be partially offset by fire-induced decreases in respiration rates. Meanwhile, high-severity wildfires and clearcut logging remove the main carbon sink from the forest ecosystem, turning these areas into carbon sources. Our results highlight the importance of assessing the effects of anthropogenic and natural disturbances on the carbon fluxes. The data we obtained are needed to predict the ecological consequences of logging and fire, and to model the dynamics of forest ecosystems under conditions of climate change and increasing anthropogenic impacts on ecosystems. As wildfire regimes shift towards more frequent and severe fires and the drastic effects of fire and logging on soil flux rates become clearer, there is an urgent demand for more data on soil efflux in various ecosystems to support multiple regression analyses and structural function models. This will improve our understanding of and ability to predict the impact of disturbance on carbon cycling.

Author Contributions

Conceptualization, E.A.K. and A.V.P.; methodology, E.A.K. and A.V.P.; formal analysis, E.A.K. and A.V.P.; investigation, E.A.K. and A.V.P.; resources, E.A.K. and A.V.P.; data curation, E.A.K., A.V.P. and A.V.M.; writing—original draft preparation, E.A.K., A.V.P., A.V.M. and P.Y.G.; visualization, E.A.K. and A.V.P.; supervision, E.A.K.; funding acquisition, E.A.K. and A.V.P. All authors have read and agreed to the published version of the manuscript.

Funding

This research was funded by the Russian Science Foundation, Krasnoyarsk Territory, and the Krasnoyarsk Regional Fund of Science, project no. 24-27-20064.

Data Availability Statement

The original fieldwork data presented in this study are available on request from the corresponding and first authors.

Conflicts of Interest

The authors declare no conflicts of interest.

References

  1. Frelich, L.E.; Johnstone, J.; Kuuluvainen, T. Boreal Forests. In Future Forests; Elsevier: Amsterdam, The Netherlands, 2024. [Google Scholar] [CrossRef]
  2. Pan, Y.; Birdsey, R.A.; Fang, J.; Houghton, R.; Kauppi, P.E.; Kurz, W.A.; Phillips, O.L.; Shvidenko, A.; Lewis, S.L.; Canadell, J.G.; et al. A large and persistent carbon sink in the world’s forests. Science 2011, 333, 988–993. [Google Scholar] [CrossRef]
  3. Liang, G.; Stefanski, A.; Eddy, W.C.; Bermudez, R.; Montgomery, R.A.; Hobbie, S.E.; Rich, R.L.; Reich, P.B. Soil respiration response to decade-long warming modulated by soil moisture in a boreal forest. Nat. Geosci. 2024, 17, 905–911. [Google Scholar] [CrossRef]
  4. Yuan, X.; Chen, X.; Ochege, F.U.; Hamdi, R.; Tabari, H.; Li, B.; He, B.; Zhang, C.; De Maeyer, P.; Luo, G. Weakening of global terrestrial carbon sequestration capacity under increasing intensity of warm extremes. Nat. Ecol. Evol. 2025, 9, 124–133. [Google Scholar] [CrossRef] [PubMed]
  5. Descals, A.; Gaveau, D.L.; Verger, A.; Sheil, D.; Naito, D.; Peñuelas, J. Unprecedented fire activity above the Arctic Circle linked to rising temperatures. Science 2022, 378, 532–537. [Google Scholar] [CrossRef]
  6. Venäläinen, A.; Lehtonen, I.; Laapas, M.; Ruosteenoja, K.; Tikkanen, O.-P.; Viiri, H.; Ikonen, V.; Peltola, H. Climate change induces multiple risks to boreal forests and forestry in Finland: A literature review. Glob. Change Biol. 2020, 26, 4178–4196. [Google Scholar] [CrossRef]
  7. Burrell, A.L.; Sun, Q.; Baxter, R.; Kukavskaya, E.A.; Zhila, S.; Shestakova, T.; Rogers, B.M.; Kaduk, J.; Barrett, K. Climate change, fire return intervals and the growing risk of permanent forest loss in boreal Eurasia. Sci. Total Environ. 2022, 831, 154885. [Google Scholar] [CrossRef]
  8. Tian, J.; Chen, X.; Cao, Y.; Chen, F. Satellite Observational evidence of contrasting changes in Northern Eurasian wildfires from 2003 to 2020. Remote Sens. 2022, 14, 4180. [Google Scholar] [CrossRef]
  9. Zheng, B.; Ciais, P.; Chevallier, F.; Yang, H.; Canadell, J.G.; Chen, Y.; van der Velde, I.R.; Aben, I.; Chuvieco, E.; Davis, S.J.; et al. Record-high CO2 emissions from boreal fires in 2021. Science 2023, 379, 912–917. [Google Scholar] [CrossRef]
  10. Achard, F.; Mollicone, D.; Stibig, H.-J.; Aksenov, D.; Laestadius, L.; Li, Z.; Popatov, P.; Yaroshenko, A. Areas of rapid forest-cover change in boreal Eurasia. For. Ecol. Manag. 2006, 237, 322–334. [Google Scholar] [CrossRef]
  11. Kukavskaya, E.A.; Shvetsov, E.G.; Buryak, L.V.; Tretyakov, P.D.; Groisman, P.Y. Increasing fuel loads, fire hazard, and carbon emissions from fires in Central Siberia. Fire 2023, 6, 63. [Google Scholar] [CrossRef]
  12. Gauthier, S.; Bernier, P.; Kuuluvainen, T.; Shvidenko, A.Z.; Schepaschenko, D.G. Boreal forest health and global change. Science 2015, 349, 819–822. [Google Scholar] [CrossRef] [PubMed]
  13. Johnstone, J.F.; Allen, C.D.; Franklin, J.F.; Frelich, L.E.; Harvey, B.J.; Higuera, P.E.; Mack, M.C.; Meentemeyer, R.K.; Metz, M.R.; Perry, G.L. Changing disturbance regimes, ecological memory, and forest resilience. Front. Ecol. Environ. 2016, 14, 369–378. [Google Scholar] [CrossRef]
  14. Luo, Y.; Zhou, X. Soil Respiration and the Environment; Elsevier Academic Press: San Diego, CA, USA, 2006. [Google Scholar]
  15. IPCC. Climate Change. 2021: The Physical Science Basis. Contribution of Working Group I to the Sixth Assessment Report of the Intergovernmental Panel on Climate Change; Masson-Delmotte, V., Zhai, P., Pirani, A., Connors, S.L., Péan, C., Berger, S., Caud, N., Chen, Y., Goldfarb, L., Gomis, M.I., et al., Eds.; Cambridge University Press: Cambridge, UK; New York, NY, USA, 2021. [Google Scholar] [CrossRef]
  16. Bond-Lamberty, B.; Thomson, A. A global database of soil respiration data. Biogeosciences 2010, 7, 1915–1926. [Google Scholar] [CrossRef]
  17. Kelsey, K.; Wickland, K.; Striegl, R.; Neff, J. Variation in soil carbon dioxide efflux at two spatial scales in a topographically complex boreal forest. Arct. Antarct. Alp. Res. 2012, 44, 457–468. [Google Scholar] [CrossRef]
  18. Wood, T.E.; Detto, M.; Silver, W.L. Sensitivity of soil respiration to variability in soil moisture and temperature in a humid tropical forest. PLoS ONE 2013, 8, e80965. [Google Scholar] [CrossRef]
  19. Cai, Y.; Nishimura, T.; Ida, H.; Hirota, M. Spatial variation in soil respiration is determined by forest canopy structure through soil water content in a mature beech forest. For. Ecol. Manag. 2021, 501, 119673. [Google Scholar] [CrossRef]
  20. Cai, Y.; Sawada, K.; Hirota, M. Spatial variation in forest soil respiration: A systematic review of field observations at the global scale. Sci. Total Environ. 2023, 874, 162348. [Google Scholar] [CrossRef]
  21. Hugelius, G.; Strauss, J.; Zubrzycki, S.; Harden, J.W.; Schuur, E.A.G.; Ping, C.-L.; Schirrmeister, L.; Grosse, G.; Michaelson, G.J.; Koven, C.D.; et al. Estimated stocks of circumpolar permafrost carbon with quantified uncertainty ranges and identified data gaps. Biogeosciences 2014, 11, 6573–6593. [Google Scholar] [CrossRef]
  22. Callaghan, T.V.; Shaduyko, O.; Kirpotin, S.N.; Gordov, E. Siberian environmental change: Synthesis of recent studies and opportunities for networking. Ambio 2021, 50, 2104–2127. [Google Scholar] [CrossRef]
  23. Masyagina, O.V.; Menyailo, O.V.; Prokushkin, A.S.; Matvienko, A.I.; Makhnykina, A.V.; Evgrafova, S.Y.; Mori, S.; Koike, T.; Prokushkin, S.G. Soil respiration in larch and pine ecosystems of the Krasnoyarsk region (Russian Federation): A latitudinal comparative study. Arab. J. Geosci. 2020, 13, 954. [Google Scholar] [CrossRef]
  24. Panov, A.; Prokushkin, A.; Korets, M.; Putilin, I.; Zrazhevskaya, G.; Kolosov, R.; Bondar, M. Variation in soil CO2 fluxes across land cover mosaic in typical tundra of the Taimyr Peninsula, Siberia. Atmosphere 2024, 15, 698. [Google Scholar] [CrossRef]
  25. Osipov, A.F. Influence of forest growth conditions on the CO2 emissions from the soil surface in the middle taiga pine forests of the Komi Republic, Russia. Russ. J. Ecol. 2023, 54, 632–639. [Google Scholar] [CrossRef]
  26. Masyagina, O.V. Carbon dioxide emissions and vegetation recovery in fire-affected forest ecosystems of Siberia: Recent local estimations. Curr. Opin. Environ. Sci. Health 2021, 23, 100283. [Google Scholar] [CrossRef]
  27. Zhou, L.; Liu, S.; Gu, Y.; Wu, L.; Hu, H.-W.; He, J.-Z. Fire decreases soil respiration and its components in terrestrial ecosystems. Funct. Ecol. 2023, 37, 3124–3135. [Google Scholar] [CrossRef]
  28. Makhnykina, A.; Panov, A.; Prokushkin, A. The impact of wildfires on soil CO2 emission in middle taiga forests in Central Siberia. Land 2023, 12, 1544. [Google Scholar] [CrossRef]
  29. Kelly, J.; Ibáñez, T.S.; Santín, C.; Doerr, S.H.; Nilsson, M.-C.; Holst, T.; Lindroth, A.; Kljun, N. Boreal forest soil carbon fluxes one year after a wildfire: Effects of burn severity and management. Glob. Chang. Biol. 2021, 27, 4181–4195. [Google Scholar] [CrossRef]
  30. Kukavskaya, E.A.; Bogorodskaya, A.V.; Buryak, L.V.; Kalenskaya, O.P.; Conard, S.G. Effects of wildfire and logging on soil CO2 efflux in Scots Pine forests of Siberia. Atmosphere 2024, 15, 1117. [Google Scholar] [CrossRef]
  31. Köster, K.; Köster, E.; Orumaa, A.; Parro, K.; Jõgiste, K.; Berninger, F.; Pumpanen, J.; Metslaid, M. How time since forest fire affects stand structure, soil physical-chemical properties and soil CO2 efflux in hemiboreal Scots pine forest fire chronosequence? Forests 2016, 7, 201. [Google Scholar] [CrossRef]
  32. Molchanov, A.G.; Kurbatova, Y.A.; Olchev, A.V. Effect of clear-cutting on soil CO2 emission. Biol. Bull. Russ. Acad. Sci. 2017, 44, 218–223. [Google Scholar] [CrossRef]
  33. Chen, L.F.; Xiang, Y.Z.; He, Z.B.; Du, J.; Lin, P.F.; Zhu, X. A meta-analysis of the impacts of forest logging on soil CO2 efflux. Sci. Cold Arid. Reg. 2020, 12, 165–179. [Google Scholar]
  34. Lytle, D.E.; Cronan, C.S. Comparative soil CO2 evolution, litter decay, and root dynamics in clearcut and uncut spruce-fir forest. For. Ecol. Manag. 1998, 103, 121–128. [Google Scholar] [CrossRef]
  35. Laporte, M.F.; Duchesne, L.C.; Morrison, I.K. Effect of clearcutting, selection cutting, shelterwood cutting and microsites on soil surface CO2 efflux in a tolerant hardwood ecosystem of northern Ontario. For. Ecol. Manag. 2003, 174, 565–575. [Google Scholar] [CrossRef]
  36. Pridacha, V.B.; Semin, D.E.; Ekimov, D.A. Dynamics of soils properties in disturbed forest ecosystems of southern Karelia. In XV Siberian Meeting and School of Young Scientists on Climate-Ecological Monitoring, Proceedings of the All-Russian Conference with International Participation, Tomsk, Russia, 17–20 October 2023; Golovatskaya, E.A., Ed.; Institute of Monitoring of Climatic and Ecological Systems SB RAS: Tomsk, Russia, 2023; pp. 171–173. (In Russian) [Google Scholar]
  37. Kulmala, L.; Aaltonen, H.; Berninger, F.; Kieloaho, A.-J.; Levula, J.; Bäck, J.; Hari, P.; Kolari, P.; Korhonen, J.F.J.; Kulmala, M.; et al. Changes in biogeochemistry and carbon fluxes in a boreal forest after the clear-cutting and partial burning of slash. Agric. For. Meteorol. 2014, 188, 33–44. [Google Scholar] [CrossRef]
  38. Kelly, J.; Doerr, S.H.; Ekroos, J.; Ibáñez, T.S.; Islam, M.R.; Santín, C.; Soares, M.; Kljun, N. No recovery of soil respiration four years after fire and post-fire management in a Nordic boreal forest Agric. For. Meteorol. 2025, 364, 110454. [Google Scholar] [CrossRef]
  39. Koshurnikova, N.; Verkhovets, S.; Antamoshkina, O.; Trofimova, N.; Zlenko, L.; Zhuikov, A. Assessment of Central Siberia forest ecosystems sustainability to forest fires: Academic research outcomes. Procedia Soc. Behav. Sci. 2015, 214, 1008–1018. [Google Scholar] [CrossRef]
  40. Peel, M.C.; Finlayson, B.L.; McMahon, T.A. Updated world map of the Köppen-Geiger climate classification. Hydrol. Earth Syst. Sci. 2007, 11, 1633–1644. [Google Scholar] [CrossRef]
  41. Kharuk, V.I.; Ponomarev, E.I.; Ivanova, G.A.; Dvinskaya, M.L.; Coogan, S.C.P.; Flannigan, M.D. Wildfires in the Siberian taiga. Ambio 2021, 50, 1953–1974. [Google Scholar] [CrossRef]
  42. IUSS Working Group WRB. World Reference Base for Soil Resources. In International Soil Classification System for Naming Soils and Creating Legends for Soil Maps, 4th ed.; International Union of Soil Sciences (IUSS): Vienna, Austria, 2022. [Google Scholar]
  43. Makhnykina, A.V.; Tychkov, I.I.; Prokushkin, A.S.; Pyzhev, A.I.; Vaganov, E.A. Factors of soil CO2 emission in boreal forests: Evidence from Central Siberia. iForest 2023, 16, 86–94. [Google Scholar] [CrossRef]
  44. R Core Team. R: A Language and Environment for Statistical Computing; R Foundation for Statistical Computing: Vienna, Austria, 2022; Available online: https://www.R-project.org/ (accessed on 1 March 2025).
  45. Wickham, H. ggplot2. Elegant Graphics for Data Analysis; Springer: Cham, Switzerland, 2016; 260p. [Google Scholar] [CrossRef]
  46. Rosseel, Y. lavaan: An R Package for Structural Equation Modeling. J. Stat. Softw. 2012, 48, 1–36. [Google Scholar] [CrossRef]
  47. Díaz-Pinés, E.; Schindlbacher, A.; Godino, M.; Kitzler, B.; Jandl, R.; Zechmeister-Boltenstern, S.; Rubio, A. Effects of tree species composition on the CO2 and N2O efflux of a Mediterranean mountain forest soil. Plant Soil. 2014, 384, 243–257. [Google Scholar] [CrossRef]
  48. Koptsik, G.N.; Kupriianova, Y.V.; Kadulin, M.S. Spatial variability of carbon dioxide emission by soils in the main types of forest ecosystems at the Zvenigorod biological station of Moscow State University. Mosc. Univ. Soil. Sci. Bull. 2018, 73, 81–88. [Google Scholar] [CrossRef]
  49. Lopes De Gerenyu, V.O.; Kurganova, I.N.; Rozanova, L.N.; Kudeyarov, V.N. Effect of temperature and moisture on CO2 evolution rate of cultivated Phaeozem: Analyses of long-term field experiment. Plant Soil. Environ. 2005, 51, 213–219. [Google Scholar] [CrossRef]
  50. Chen, S.; Huang, Y.; Zou, J.; Shen, Q.; Hu, Z.; Qin, Y.; Chen, H.; Pan, G. Modeling interannual variability of global soil respiration from climate and soil properties. Agric. For. Meteorol. 2010, 150, 590–605. [Google Scholar] [CrossRef]
  51. Dyukarev, E.A.; Kurakov, S.A. Response of bare soil respiration to air and soil temperature variations according to different models: A case study of an urban grassland. Land. 2023, 12, 939. [Google Scholar] [CrossRef]
  52. Raich, J.W.; Tufekciogul, A. Vegetation and soil respiration: Correlations and controls. Biogeochemistry 2000, 48, 71–90. [Google Scholar] [CrossRef]
  53. Makhnykina, A.; Vaganov, E.; Panov, A.; Polosukhina, D.; Prokushkin, A. An Interseasonal comparison of soil respiration in xeric and mesic pine forest ecosystems in Central Siberia. Atmosphere 2024, 15, 988. [Google Scholar] [CrossRef]
  54. Davidson, E.A.; Belk, E.; Boone, R.D. Soil water content and temperature as independent or confounded factors controlling soil respiration in a temperate mixed hardwood forest. Glob. Change Biol. 1998, 4, 217–227. [Google Scholar] [CrossRef]
  55. Ivanov, D.; Tatarinov, F.; Kurbatova, J. Soil respiration in paludified forests of European Russia. J. For. Res. 2020, 31, 1939–1948. [Google Scholar] [CrossRef]
  56. Baldrian, P.; Merhautová, V.; Petránková, M.; Cajthaml, T.; Šnajdr, J. Distribution of microbial biomass and activity of extracellular enzymes in a hardwood forest soil reflect soil moisture content. Appl. Soil. Ecol. 2010, 46, 177–182. [Google Scholar] [CrossRef]
  57. Sierra, C.A.; Malghani, S.; Loescher, H.W. Interactions among temperature, moisture, and oxygen concentrations in controlling decomposition rates in a boreal forest soil. Biogeosciences 2017, 14, 703–710. [Google Scholar] [CrossRef]
  58. Kucinskas, O.; Marozas, V. Diurnal and seasonal soil CO2 efflux variation in Scots pine (Pinus sylvestris L.) forests in the European hemi-boreal zone. Lith. J. Elem. 2021, 26, 731–754. [Google Scholar] [CrossRef]
  59. Hanson, P.J.; Edwards, N.T.; Garten, C.T.; Andrews, J.A. Separating root and soil microbial contributions to soil respiration: A review of methods and observations. Biogeochemistry 2000, 48, 115–146. [Google Scholar] [CrossRef]
  60. Högberg, P.; Nordgren, A.; Buchmann, N.; Taylor, A.F.S.; Ekblad, A.; Högberg, M.N.; Nyberg, G.; Read, D.J. Large-scale forest girdling shows that current photosynthesis drives soil respiration. Nature 2001, 411, 789–792. [Google Scholar] [CrossRef]
  61. Gui, H.; Wang, J.; Hu, M.; Zhou, Z.; Wan, S. Impacts of fire on soil respiration and its components: A global meta-analysis. Agric. For. Meteorol. 2023, 336, 109496. [Google Scholar] [CrossRef]
  62. Ribeiro-Kumara, C.; Köster, E.; Aaltonen, H.; Köster, K. How do forest fires affect soil greenhouse gas emissions in upland boreal forests? A review. Environ. Res. 2020, 184, 109328. [Google Scholar] [CrossRef]
  63. Glukhova, T.V.; Vompersky, S.E.; Kovalev, A.G. Emission of CO2 from the surface of oligotrophic bogs with due account for their microrelief in the southern taiga of European Russia. Eurasian Soil. Sc. 2013, 46, 1172–1181. [Google Scholar] [CrossRef]
  64. Pumpanen, J.; Westman, C.J.; Ilvesniemi, H. Soil CO2 efflux from a podzolic forest soil before and after forest clear-cutting and site preparation. Boreal. Environ. Res. 2004, 9, 199–212. [Google Scholar]
  65. Knapp, A.K.; Conard, S.L.; Blair, J.M. Determinants of soil CO2 flux from a sub-humid grassland: Effect of fire and fire history. Ecol. Appl. 1998, 8, 760–770. [Google Scholar] [CrossRef]
  66. Fenn, K.M.; Malhi, Y.; Morecroft, M.D. Soil CO2 efflux in a temperate deciduous forest: Environmental drivers and component contributions. Soil. Biol. Biochem. 2010, 42, 1685–1693. [Google Scholar] [CrossRef]
  67. Hashemi, J.; Zona, D.; Arndt, K.; Kalhori, A.; Oechel, W. Seasonality buffers carbon budget variability across heterogeneous landscapes in Alaskan Arctic Tundra. Environ. Res. Lett. 2021, 16, 035008. [Google Scholar] [CrossRef]
  68. Dymov, A.A. The impact of clearcutting in boreal forests of Russia on soils: A review. Eurasian Soil. Sc. 2017, 50, 780–790. [Google Scholar] [CrossRef]
  69. Desyatkin, A.; Okoneshnikova, M.; Fedorov, P.; Ivanova, A.; Filippov, N.; Desyatkin, R. The Impact of catastrophic forest fires of 2021 on the light soils in Central Yakutia. Land 2024, 13, 1130. [Google Scholar] [CrossRef]
  70. Prior, L.D.; Nichols, S.C.; Foyster, S.M.; Ondei, S.; Bowman, D.M.J.S. Soil not fire: Field, glasshouse and dendrochronology studies show how edaphic factors control post-fire woody plant growth across a sedgeland—forest boundary in Tasmania. For. Ecol. Manag. 2024, 553, 121639. [Google Scholar] [CrossRef]
  71. Sayedi, S.S.; Abbott, B.W.; Vannière, B.; Leys, B.; Colombaroli, D.; Romera, G.G.; Slowinski, M.; Aleman, J.C.; Blarquez, O.; Feurdean, A.; et al. Assessing changes in global fire regimes. Fire Ecol. 2024, 20, 18. [Google Scholar] [CrossRef]
  72. Holden, S.R.; Rogers, B.M.; Treseder, K.K.; Randerson, J.T. Fire severity influences the response of soil microbes to a boreal forest fire. Environ. Res. Lett. 2016, 11, 035004. [Google Scholar] [CrossRef]
  73. Köster, K.; Kohli, J.; Lindberg, H.; Pumpanen, J. Post-fire soil greenhouse gas fluxes in boreal Scots pine forests—Are they affected by surface fires with different severities? Agric. For. Meteorol. 2024, 349, 109954. [Google Scholar] [CrossRef]
Figure 1. Walter and Lieth climate diagram for the study area (2010–2024), built based on the climate database at https://climatecharts.net/ (accessed on 1 March 2025).
Forests 16 01057 g001
Figure 2. Location of study area (I) and view of study sites in lichen (II) and moss (III) Scots pine forests with different disturbance histories: (a,a1) unlogged/unburned; (b,b1) unlogged/burned; (c,c1) logged/unburned; and (d,d1) logged/burned.
Forests 16 01057 g002
Figure 3. Seasonal patterns of air temperature at a height of 200 cm, and of soil temperature and moisture at a depth of 10 cm, for the following sites: (a) unlogged/unburned, (b) unlogged/burned, (c) logged/unburned, and (d) logged/burned sites. The data are presented as averages for 30 min periods for 2024. Red color indicates values above zero, while turquoise color indicates values below zero. The months of the year are given by the first letter of each month.
Forests 16 01057 g003
Figure 4. The depth of forest floor (litter, moss, lichen, and duff) in lichen- and moss-dominated Scots pine forests (a) and in moss-dominated Scots pine forest depending on the dominant vegetation (Sphagnum sp. vs. feather moss) (b) in relation to disturbance types. The bars show standard deviation. The letters indicate significant differences (Tukey HSD test, p < 0.05) between the depth values of different vegetation- and disturbance-type groups.
Forests 16 01057 g004
Figure 5. Soil CO2 efflux rates in two Scots pine study plots with lichens and mosses as dominant ground cover and various disturbance types (a). Soil CO2 efflux in moss-dominated Scots pine study plot as a function of living vegetation (feather moss vs. sphagnum) (b). The box denotes 25th–75th percentiles, the center line indicates the median, the dot inside the box stands for the mean value, the whiskers indicate minimum/maximum values, and dots outside the whiskers show outliers. The letters indicate significant differences (Tukey HSD test, p < 0.05) between the soil efflux values of different vegetation- and disturbance-type groups. View of the collars for the chamber measurements with lichen (c), feather moss (d), and sphagnum (e) vegetation.
Forests 16 01057 g005
Figure 6. Soil CO2 efflux as a function of soil temperature in the lichen- and moss-dominated Scots pine forests with different disturbance types: undisturbed forest (a), burned forest (b), logged site (c), and logged/burned site (d). The regressions and functions are provided for lichen-dominated plots. No significant dependences (p > 0.05) found for the moss-dominated Scots pine forest.
Forests 16 01057 g006
Figure 7. The relationship between CO2 efflux and soil moisture in feather moss in the undisturbed moss-dominated Scots pine forest.
Forests 16 01057 g007
Figure 8. Soil CO2 efflux as a function of soil temperature and moisture in all sites studied, depending on the dominant ground vegetation (lichen, feather moss, sphagnum).
Forests 16 01057 g008
Figure 9. Relationship between soil CO2 efflux and forest floor (litter, lichen, moss, duff) depth in lichen- (a) and moss- (b) dominated Scots pine forest in respect to disturbance types.
Forests 16 01057 g009
Figure 10. Structural equation model (SEM) results of the relationship between soil CO2 efflux and dominant vegetation, site type with respect to disturbances, depth of ground cover, and topsoil moisture and temperature. The path coefficients (values) represent standardized regression coefficients. p-values are shown for the following significant pathways: * p < 0.001 and ** p < 0.01.
Forests 16 01057 g010
Disclaimer/Publisher’s Note: The statements, opinions and data contained in all publications are solely those of the individual author(s) and contributor(s) and not of MDPI and/or the editor(s). MDPI and/or the editor(s) disclaim responsibility for any injury to people or property resulting from any ideas, methods, instructions or products referred to in the content.

