Abstract
Arid regions face multiple challenges such as population expansion, water scarcity, land degradation, and biodiversity reduction. Understanding temporal and spatial patterns of ecosystem service trade-offs and synergies is critical for sustainable development and effective ecosystem service management in arid regions under environmental stress. Taking the Tarim River Basin in China as an example, five ecosystem services (carbon sequestration, water yield, sediment delivery ratio, habitat quality, and food production) were studied at different scales in 1990, 2000, 2010, and 2020 in the inland arid region. Spearman correlation, geographical weighted regression, and self-organizing mapping were used to analyze the ecosystem service trade-offs and synergies. The results showed that the ecosystem services in the basin increased gradually; in particular, the water yield increased from 15.38 × 10⁹ m3 to 29.8 × 10 m3, and the food production increased from 11.03 × 10⁶ t to 29.26 × 10⁶ t. There was a significant positive correlation between carbon sequestration, water yield, and habitat quality, but a negative correlation between sediment delivery ratio and food production. The spatial distribution of trade-offs and synergies of ecosystem services varies in different years and on different scales. The area change in ecosystem service bundles at the pixel scale is relatively small, while the area change at the sub-basin scale is relatively large. This paper provides policy suggestions for the ecological management and sustainable development of the Tarim River Basin through the analysis of ecosystem service trade-offs and synergies.
1. Introduction
Ecosystem services (ESs) are the various benefits provided by natural ecosystems for human beings, including supply services, regulation services, cultural services, and support services [1,2,3,4]. These services constitute the material basis of human existence and development, and play an irreplaceable role in maintaining the Earth’s life support system [5,6]. However, with the pressure of population growth and economic development, the global ecosystem is facing the threat of unprecedented degradation [7,8]. Problems such as deforestation, biodiversity loss, and environmental pollution have severely weakened the ability of ecosystems to provide services, directly threatening human well-being and sustainable development [9,10]. Such crises have prompted the international community to re-examine the relationship between man and nature, and incorporate ESs and conservation into the decision-making system [11,12]. An in-depth study of the formation mechanism and interaction of ESs and its impact on human activities is of great theoretical and practical significance for formulating scientific ecological protection policies and realizing harmonious coexistence between man and nature [13,14,15].
The structure, process, and function of ecosystem form a dynamic network through complex interactions, and these correlations directly or indirectly produce ESs. Temporal–spatial correlation integrates these elements into a whole through scale-dependent feedback mechanism [14]. The interaction between ESs is mainly manifested in two modes of trade-off and synergy, and this complex relationship directly affects the management decision-making and sustainable development process of the ecosystem [11,16,17,18,19]. The protection of forest and grassland ecosystems will increase carbon fixation and biodiversity, showing a synergistic effect [17], but the increase in forest area in arid areas may aggravate vegetation transpiration and reduce water conservation capacity, showing a trade-off effect [18]. The expansion of cultivated land area may also fix carbon and conserve water in a short time period, but in the long term it will lead to soil erosion and form a trade-off relationship [19,20].
Correlation analysis, as the basic statistical method of trade-off and synergy, quantifies the linear or monotone relationship of ESs by using correlation coefficients among ESs, such as the Pearson correlation coefficient and Spearman rank correlation coefficient, and reveals the linear correlation characteristics among services, but it is difficult to explain the spatial heterogeneity [20,21,22]. The geographical weighted regression (GWR) spatial analysis method can reveal the interaction relationship in the ES space, and by introducing a spatial weight matrix, it effectively solves the problem of traditional regression methods ignoring spatial autocorrelation, and it can accurately depict the spatial differentiation law of ES relations [22]. Self-organized mapping (SOM), as an unsupervised neural network method, can process high-dimensional nonlinear data, and has shown unique advantages in identifying an ecosystem services bundle (ESB) and its spatial pattern [23,24]. Random Forest and principal component analysis are used to analyze the nonlinear relationships among ESs and their driving factors [25,26]. Clustering methods (such as K-means, hierarchical clustering) identify spatial combination patterns of ESs [26].
The research on the effective integration of ESs into spatial planning is both challenging and lacking [27,28]. At present, many studies are still limited to the static assessment of a single time or spatial scale, which fails to fully reflect the dynamic and complex nature of ESs [29,30]. Although spatiotemporal analysis and cross-scale research have gradually deepened in the field of ESs, the research on how to systematically integrate spatiotemporal change characteristics of ES interactions and their multi-scale effects to clearly support spatial planning decisions is still insufficient, and is neither systematic or representative [31,32]. This research gap limits the understanding of the dynamic changes in an ES, and also affects its practical application in spatial planning [33]. Therefore, it is urgent to strengthen the study of ES interactions at multiple spatiotemporal scales, so as to provide more scientific and comprehensive decision support for spatial planning [34,35].
We selected the Tarim River Basin (TRB) in China as the study area. This area is located in the middle of the Eurasia continental area. The Tarim River, the longest inland river in China, is the key lifeline for maintaining ecological security and economic development in the arid region of the southern Xinjiang Uygur Autonomous Region [34]. The TRB has formed a unique ecosystem under the influence of its unique landform, climate, and other natural factors. However, under the dual pressure of climate change and human activities, inhabitants of the TRB are faced with severe challenges such as water shortages, land degradation, and ecological function degradation, resulting in increasingly complex trade-offs and synergies among ESs [35]. Agricultural water expansion may weaken ecological water demand, while the overexploitation of groundwater may exacerbate soil erosion and desertification risks [36]. Meanwhile, previous studies on the TRB have mainly focused on land use changes and ecological restoration, with few studies on ES trade-offs and synergies. Therefore, in-depth research on the trade-offs and synergies of TRB ESs is of great significance for optimizing water resource allocation and coordinating ecological protection and economic development [20,37,38].
This study aims to reveal the trade-offs and synergies of ES interactions on multiple time scales, and provide information for spatial planning and conservation management strategies of the TRB in Northwest China. The main goals of this study were as follows: (1) How does the spatiotemporal distribution pattern of ESs in the inland arid region evolve? (2) Are there significant differences in the trade-off and synergy relationships among ESs at different spatiotemporal scales? This study can provide a scientific basis for the trade-offs in the rational utilization of synergies, regional environmental protection, and sustainable development decision-making of the TRB. At the same time, it can provide a reference for measuring ES trade-offs/synergies in other arid ecological functional areas in the world [36].
2. Materials and Methods
2.1. Study Area
The TRB (34°55′~43°48′ N, 73°10′~94°05′ E), located in the center of Eurasia, is an independent catchment area with a closed inland water circulation and water balance. With an area of about 1.02 × 10⁶ km2, it is the largest inland river basin in the world [38]. The TRB is a typical ecologically fragile region with a continental arid climate. The climate is extremely arid, the temperature difference between day and night is large, and evaporation is strong. The annual average temperature is 10.6~11.5 °C. The annual evaporation is 800~2200 mm, and the annual precipitation is about 120 mm [39]. The TRB consists of nine river systems, including the main stream of the Tarim River, and the Aksu River, Hetian River and Weigan River around the Tarim Basin [40]. The Tarim River, with a total length of 1321 km, is the largest inland river in China. It is mainly supplied by the melting water from ice and snow in the high mountainous areas of its source and the seasonal precipitation [40].
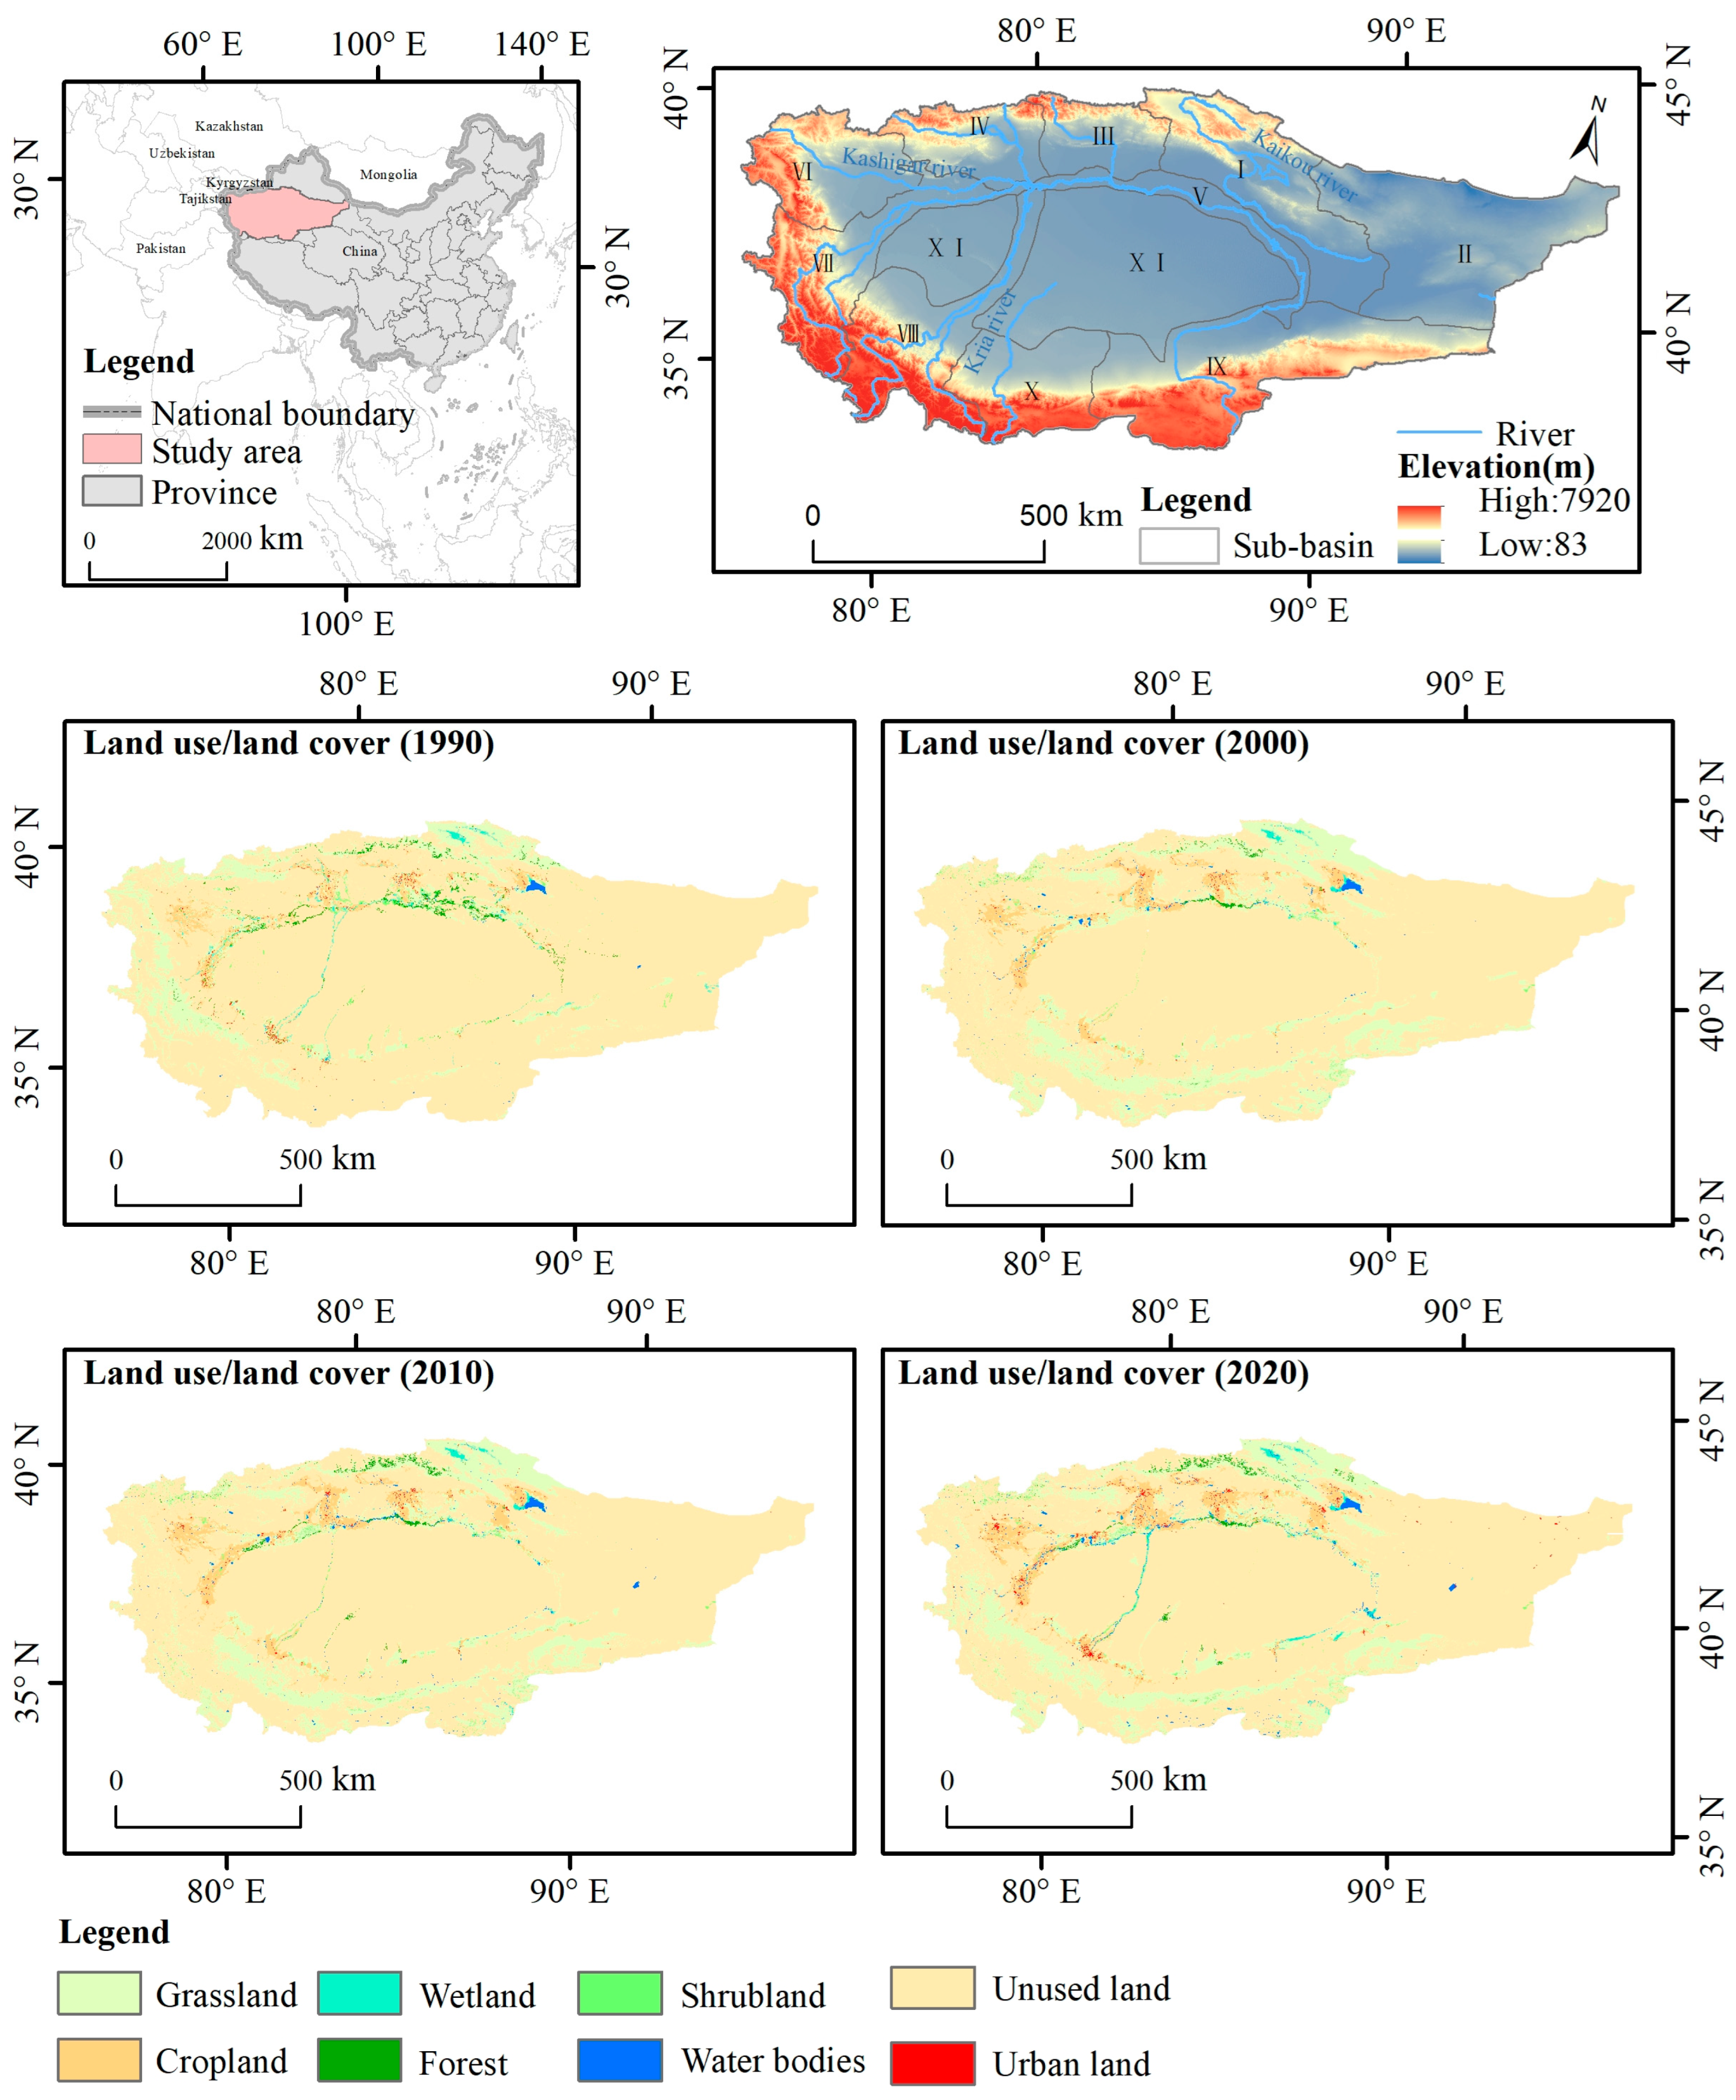
The basin is composed of three major geomorphic units: mountain, plain, and desert, which account for 47%, 22%, and 31% of the total area of the basin, respectively. The northern part of the basin is dominated by mountain glaciers and forest steppes, while the western part of Henan is dominated by oases and deserts. The Taklimakan Desert, the second-largest floating desert in the world, is located in the middle, with an annual rainfall of less than 100 mm, and only 5 mm in extreme areas. The Tarim River and its tributaries form a unique “oasis–desert” ecosystem, providing an important habitat for regional biodiversity [41]. The TRB is an important agricultural production base in the Xinjiang Uygur Autonomous Region, with cotton, fruit, and grain cultivation as the main areas [36,38]. However, with population growth and economic development, problems such as the over-utilization of water resources, land degradation, and the degradation of ecological functions have become increasingly prominent, threatening the sustainable development of the region [42,43,44]. The entire TRB is divided into 11 sub-basins. The locations of each sub-basin are shown in Figure 1 and Figure S1.
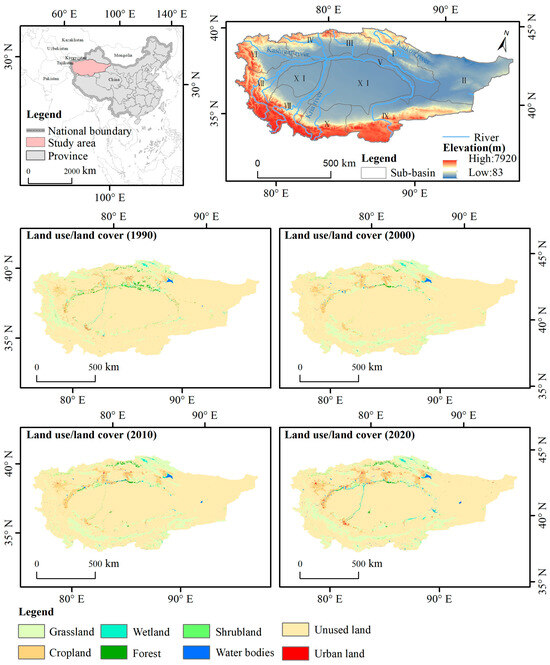
Figure 1.
Geographical location and land use of the Tarim River basin (TRB).
2.2. Data Source and Processing
Nine geospatial and statistical datasets were used in this study, including watershed boundaries, the digital elevation model (DEM), climate, soil properties, the vegetation normalization index (NDVI), land use (LULC), and statistical data. Among them, the basin boundary data came from the National Data Center for Glaciology and Permafrost Desert Science, the DEM data came from the Geospatial Data Cloud website, climate data came from the World Climate website, soil data came from the National Tibetan Plateau Data Research Center, and LULC data and NDVI data came from the Resources and Environmental Data Cloud Platform of the Chinese Academy of Sciences. The statistical data were extracted from the statistical yearbooks and statistical bulletins of cities involved in the Xinjiang Uygur Autonomous Region and the TRB. The specific resolution and source of the data are shown in Table 1. The climate data mainly include precipitation, temperature, and evapotranspiration; the statistics mainly include food production of the TRB, etc.

Table 1.
Data source and resolution.
Using the ArcGIS 10.8 software WGS_1984_UTM_Zone_49 projection system, all datasets were resampled to a uniform 30 m resolution to calculate the ESs and their trade-off synergies. Due to the large study area, the study area was divided into 5 × 5 km grids when calculating pixel scales of GWR and SOM, forming 40,800 grids in total. The data in 40,800 grids were extracted as pixel-level point data to calculate GWR and SOM, and the point data results underwent re-kriging interpolation to obtain pixel-level plane result data. The trade-off synergies and ESB in the 30 m spatial resolution of the TRB were obtained. The sub-basins were calculated by using the method of partition statistics.
2.3. Research Framework
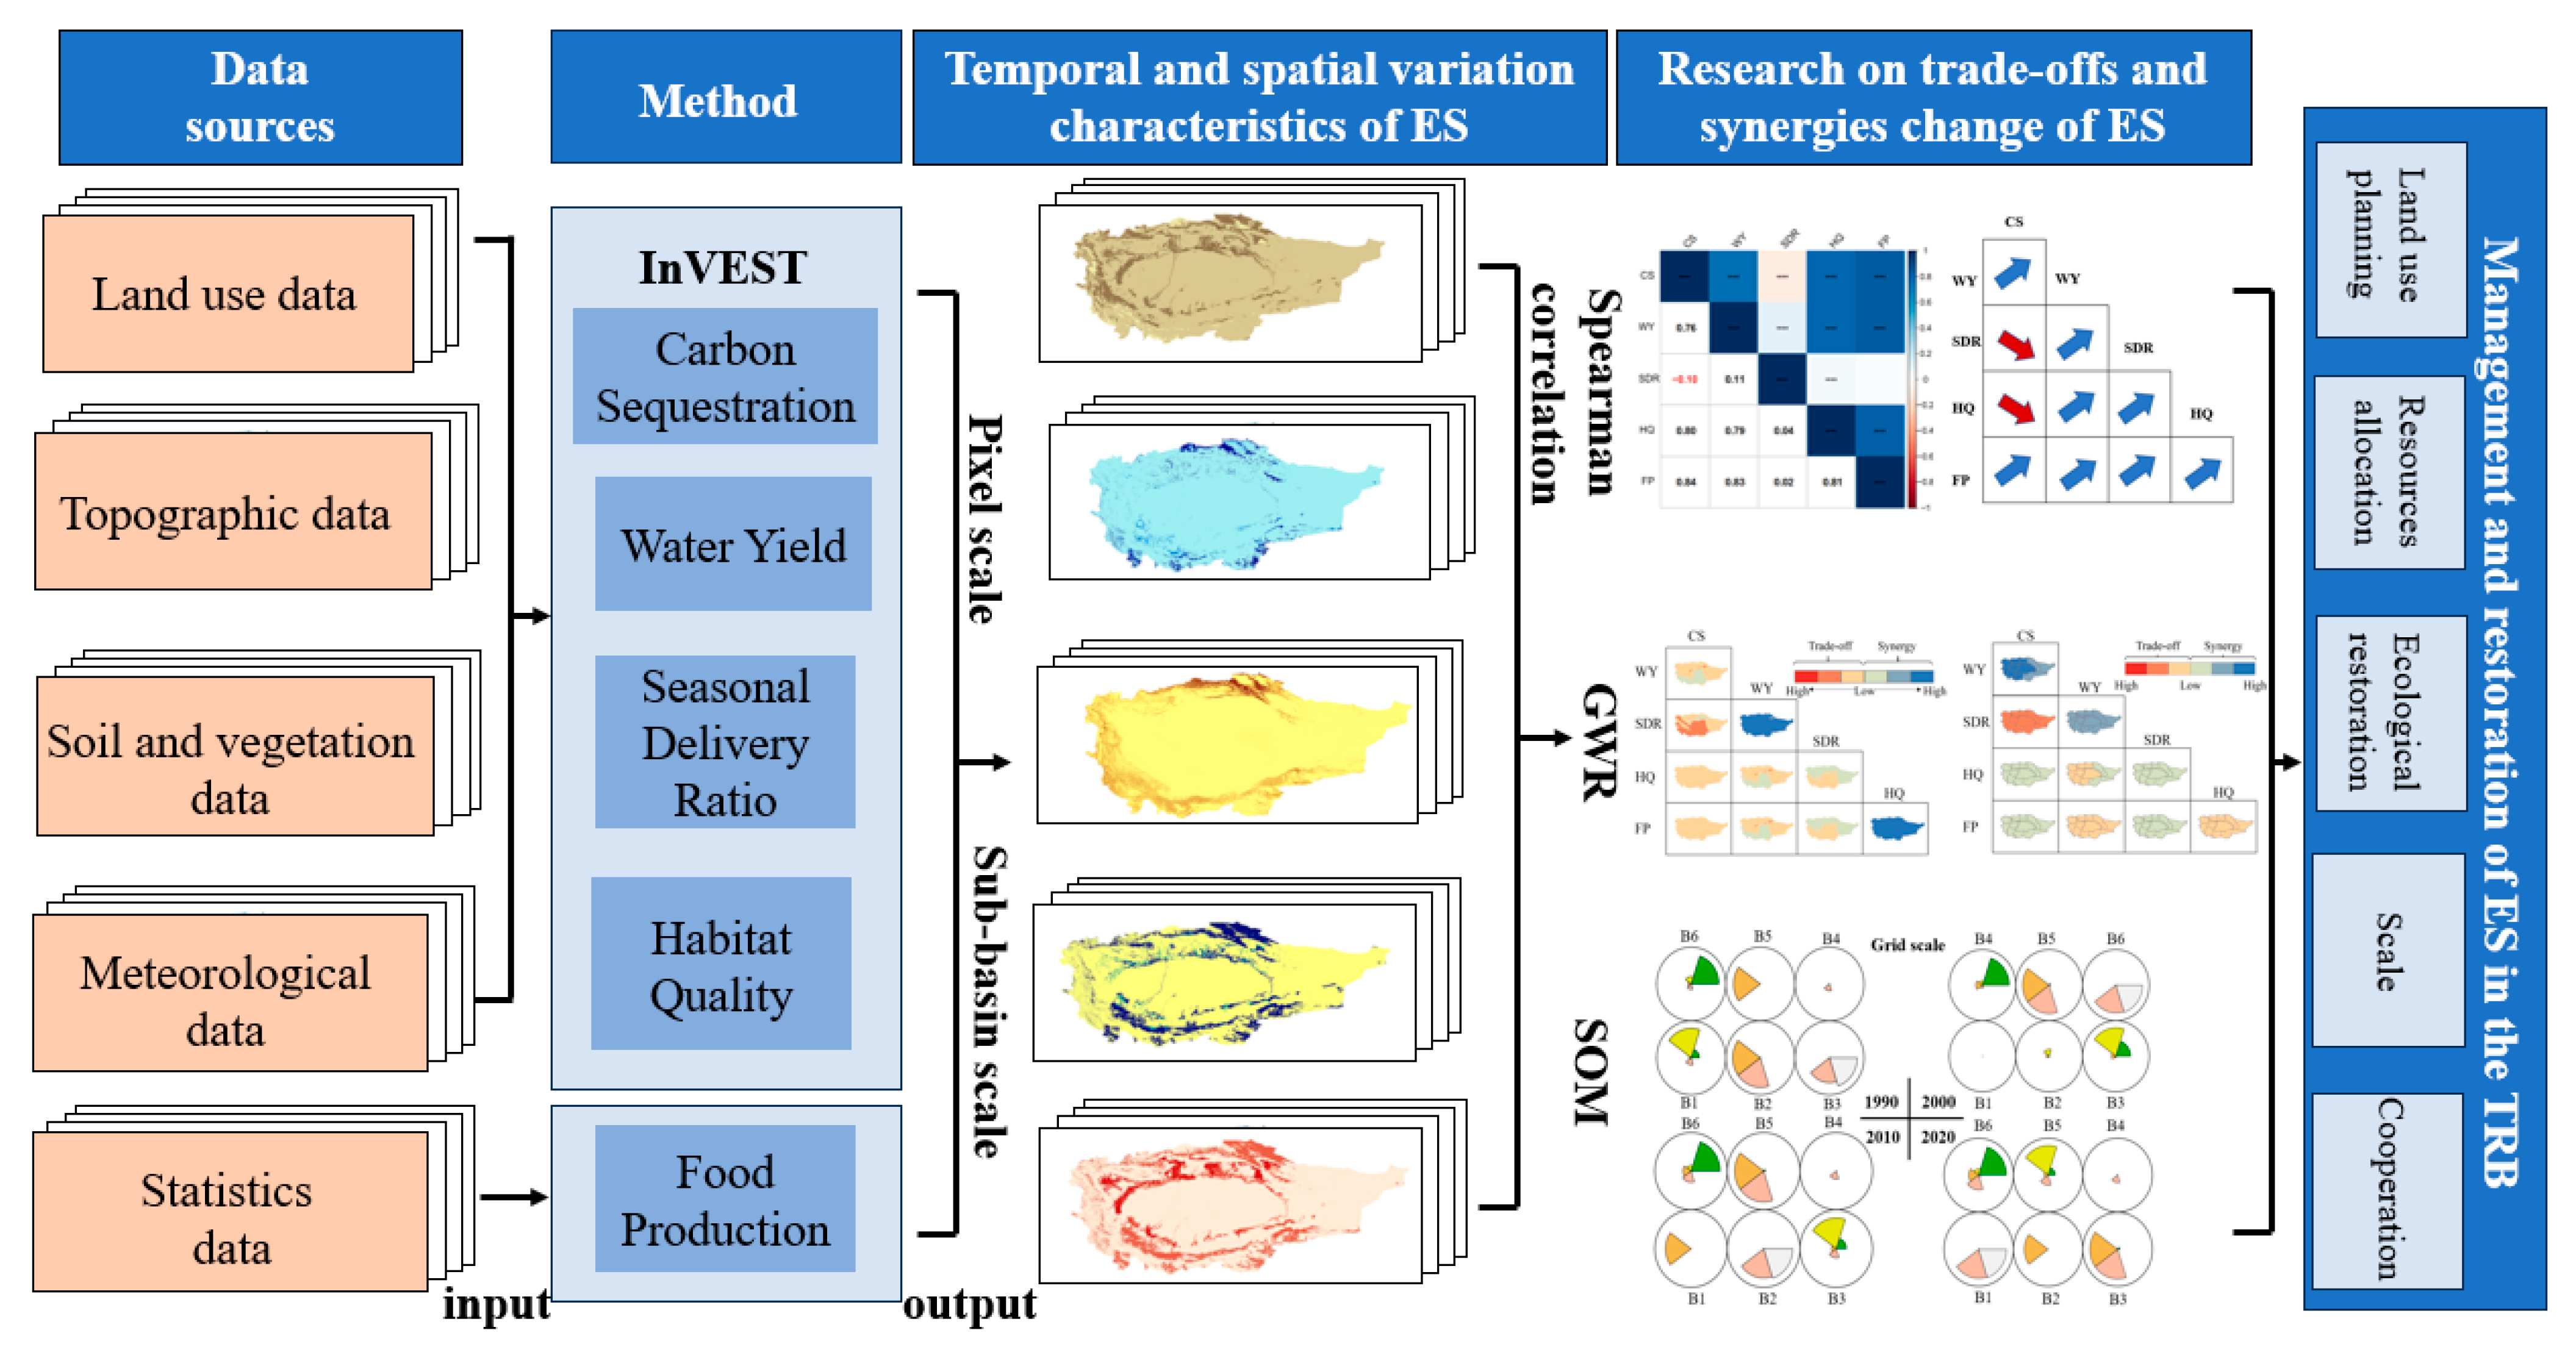
The workflow of this study follows the sequence of “ES quantization–ES interaction–space management recommendations”. The specific framework of the study is shown in Figure 2.
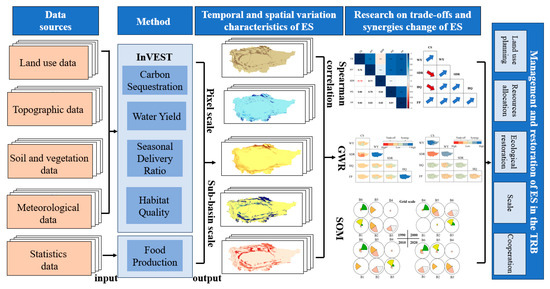
Figure 2.
Research framework diagram of this study.
2.4. Research Methods
2.4.1. Ecosystem Services
This study comprehensively considered the important ecological processes in the TRB and the other relevant literature [23,45], and determined the ES index of this study according to the following criteria: (1) being consistent with the ES classification in the Millennium ES Assessment and Common International Classification of ESs [1,45]; (2) able to reflect the TRB ecosystem status [40,45,46]; and (3) the data being readily available and accessible [3].
Based on the above criteria, the final selection was as follows: provisioning services: food production (FP); and regulating and maintaining services: water yield (WY); carbon sequestration (CS), the sediment delivery ratio (SDR), and habitat quality (HQ). These represent five key functions that are essential for maintaining biodiversity and improving human well-being [2]. Quantification of ESs was performed at the pixel scale and sub-basin scale for the years 1990, 2000, 2010, and 2020. This research spatially plotted the ES distribution and evaluated the trade-offs and synergies. The methods and specific parameters used to quantify each ES are shown in Table 2 and Supplementary S2.
Table 2.
The evaluation methods of ecosystem service.
2.4.2. Ecosystem Service Trade-Offs and Synergies
- (1)
- Spearman Correlation Analysis
The Spearman correlation analysis was used to quantify the trade-offs and synergies among various ES indicators of the TRB. Spearman correlation analysis is a nonparametric measure of rank correlation [47]. When the correlation coefficient of two ES indicators is greater than 0, there is considered to be synergy between the two indicators, and when the correlation coefficient of two ES indicators is less than 0, it is considered to be a trade-off relationship between the two indicators [48]. The calculation formula is as follows:
where is the Spearman correlation coefficient, is the number of grades, and is the number of grade differences in two columns of paired variables. In this study, the “corrplot” package of R 4.2.3 software was used to conduct Spearman correlation analysis to explore the interaction between each ES of the TRB.
- (2)
- Geographically Weighted Regression Analysis
The GWR model is a localized spatial analysis method. It is an extension of a traditional regression model that explicitly integrates geographical factors and considers spatial heterogeneity [29,48]. Because it allows the non-stationarity of spatial variables (that is, the variable relationship may change in space), GWR is widely used in geospatial analysis and can better reveal the spatial variability of the relationship between variables [22]. The model is expressed as follows:
where represents the spatial position of the point; p represents the number of independent variables; , , and represent the dependent variable, independent variable, and random error, respectively; is the intercept of the points; and is the regression coefficient, where the positive regression coefficient represents the spatial synergistic effect relationship and the negative regression coefficient represents the spatial trade-off relationship. The “spgwr” software package in R4.3.2 was used for GWR analysis.
- (3)
- Identification of Ecosystem Service Bundles
SOM is an unsupervised clustering method based on neural networks that allows the spatial clustering of Ess at different spatial scales based on similarity, thus comparing feature changes in ESBs across different pixels and sub-basins [24,49]. We used SOM to classify 6 categories of ESB in the TRB, which were defined as B1-B6. Each bundle represents a collection of different ESs. When the ESB is dominated by a single ES, it is a provision bundle (e.g., FP bundle). When the ESB is dominated by WY, CS, SDR or HQ, it is called a regulation bundle. When the ESB is dominated by two or more services, it is a synergistic bundle. SOM analysis was performed using the “Kohonen” software package in R4.3.2 software.
3. Results
3.1. Spatial and Temporal Patterns of Ecosystem Services
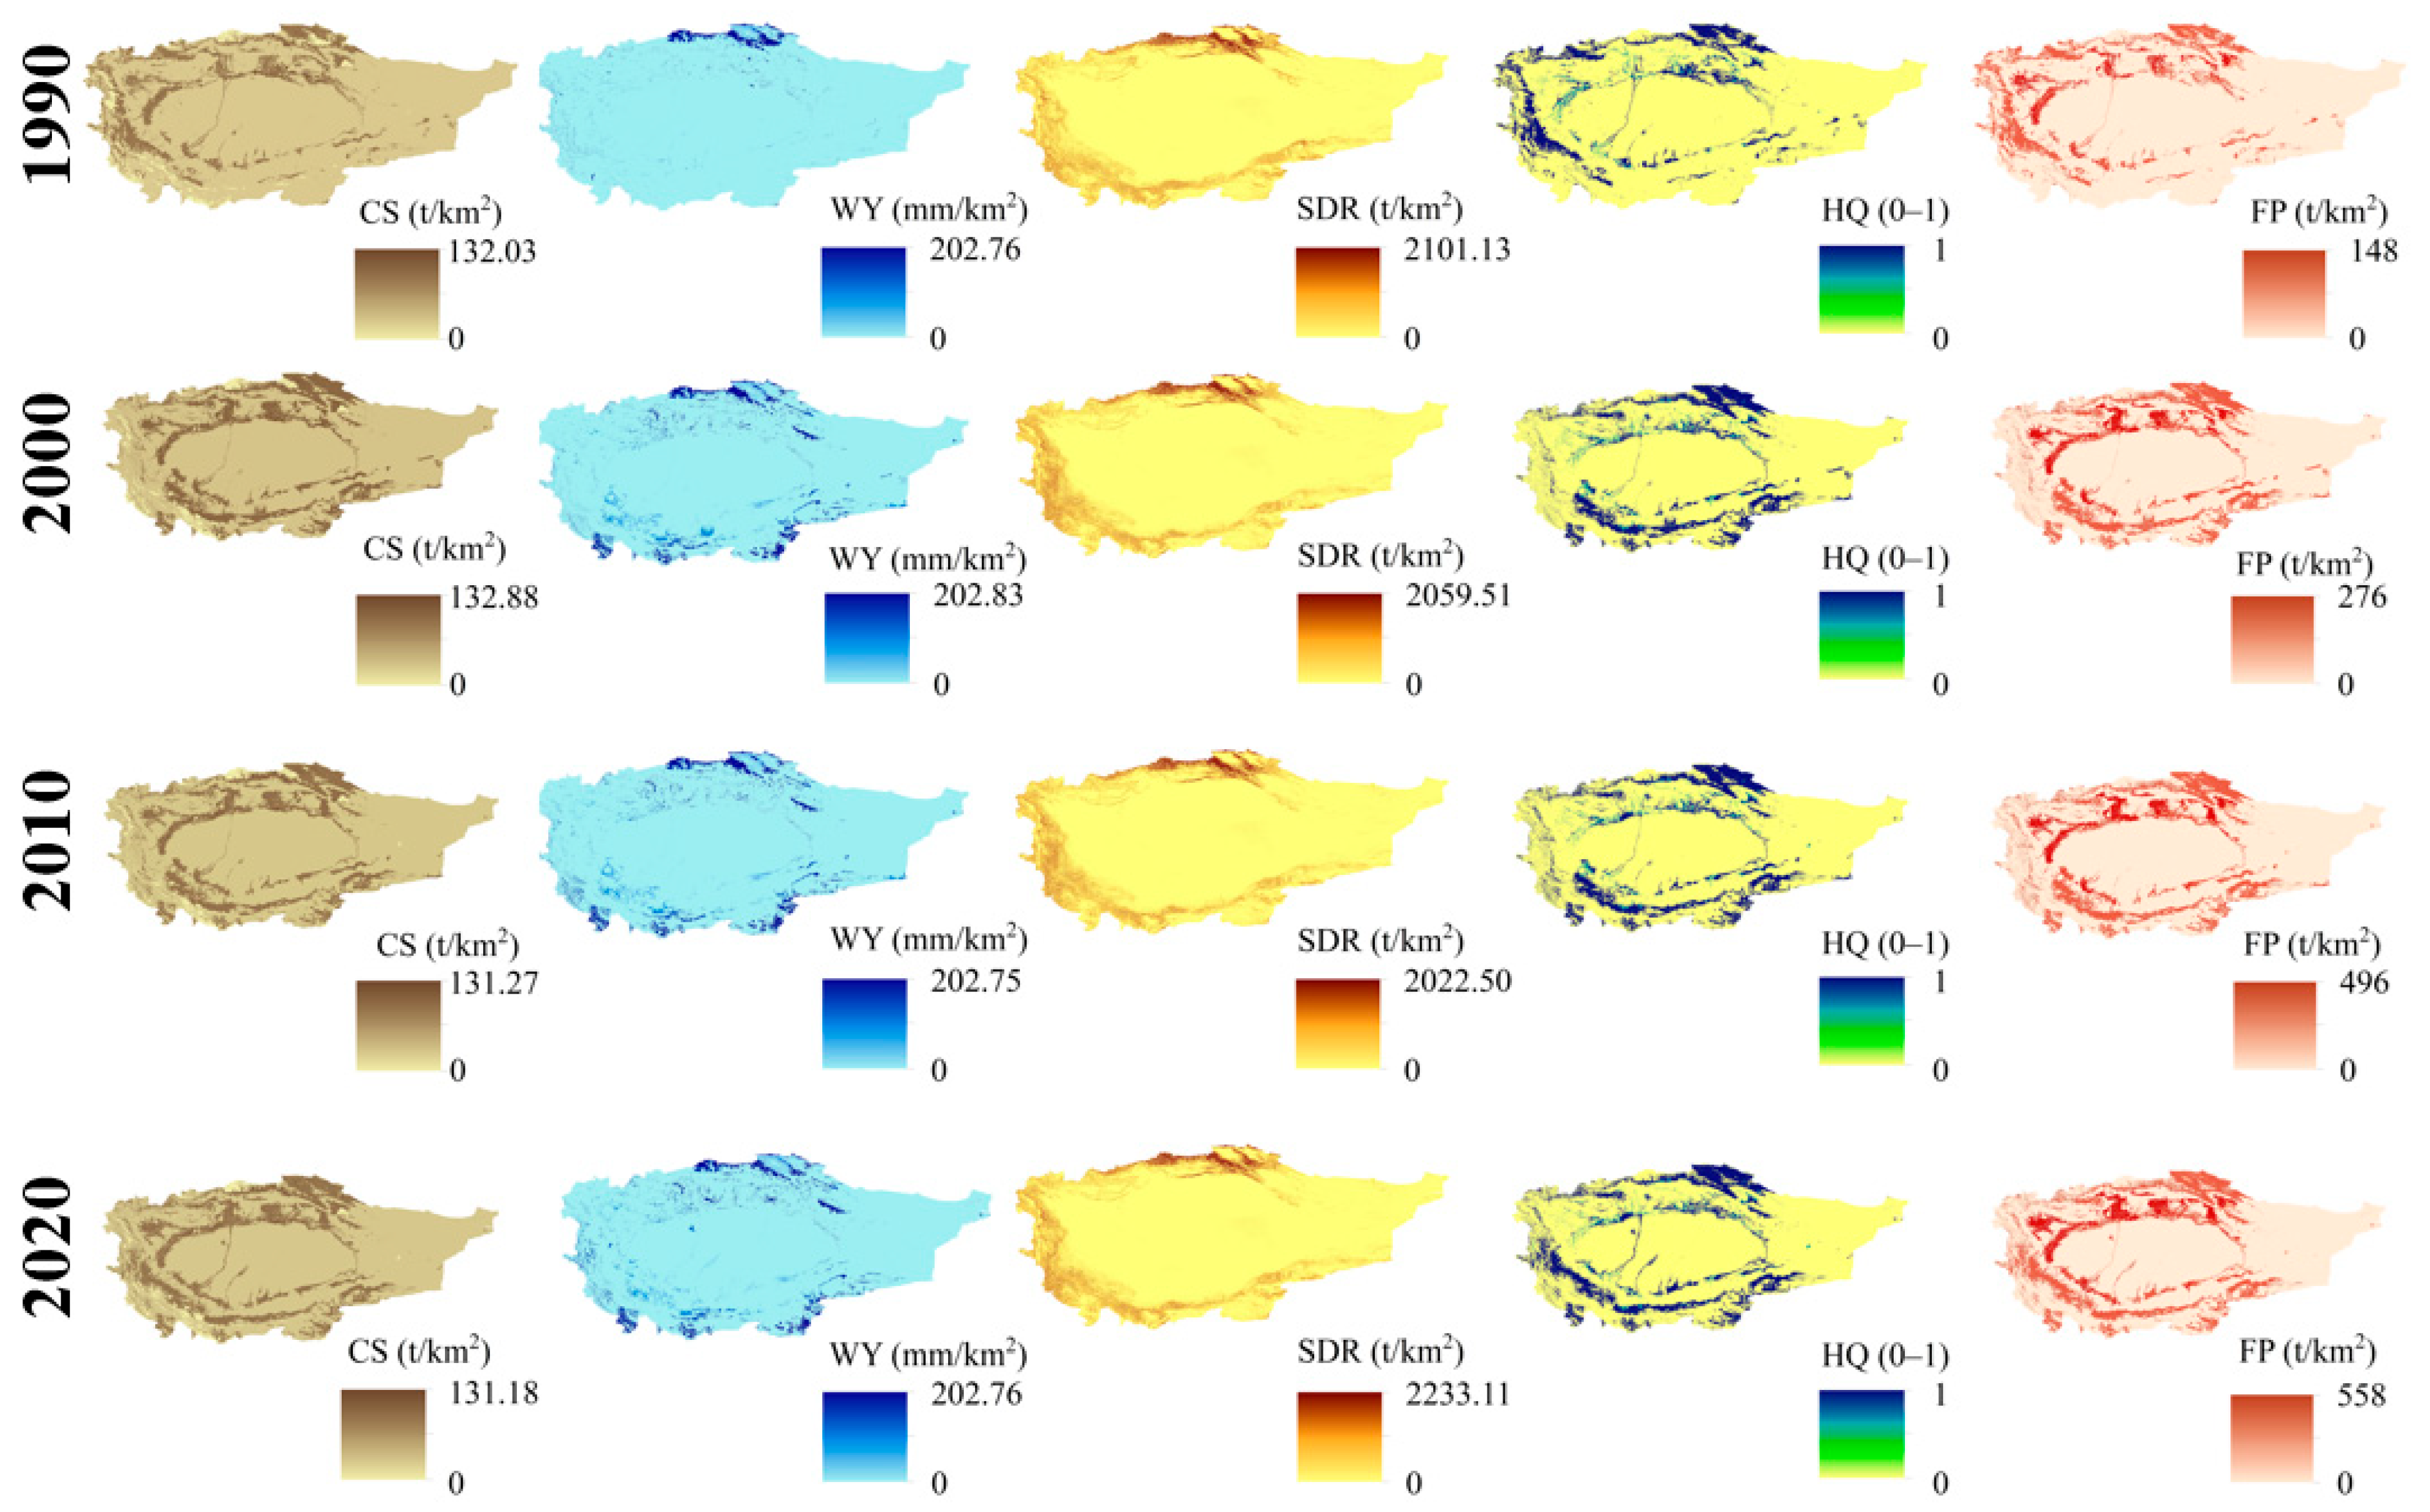
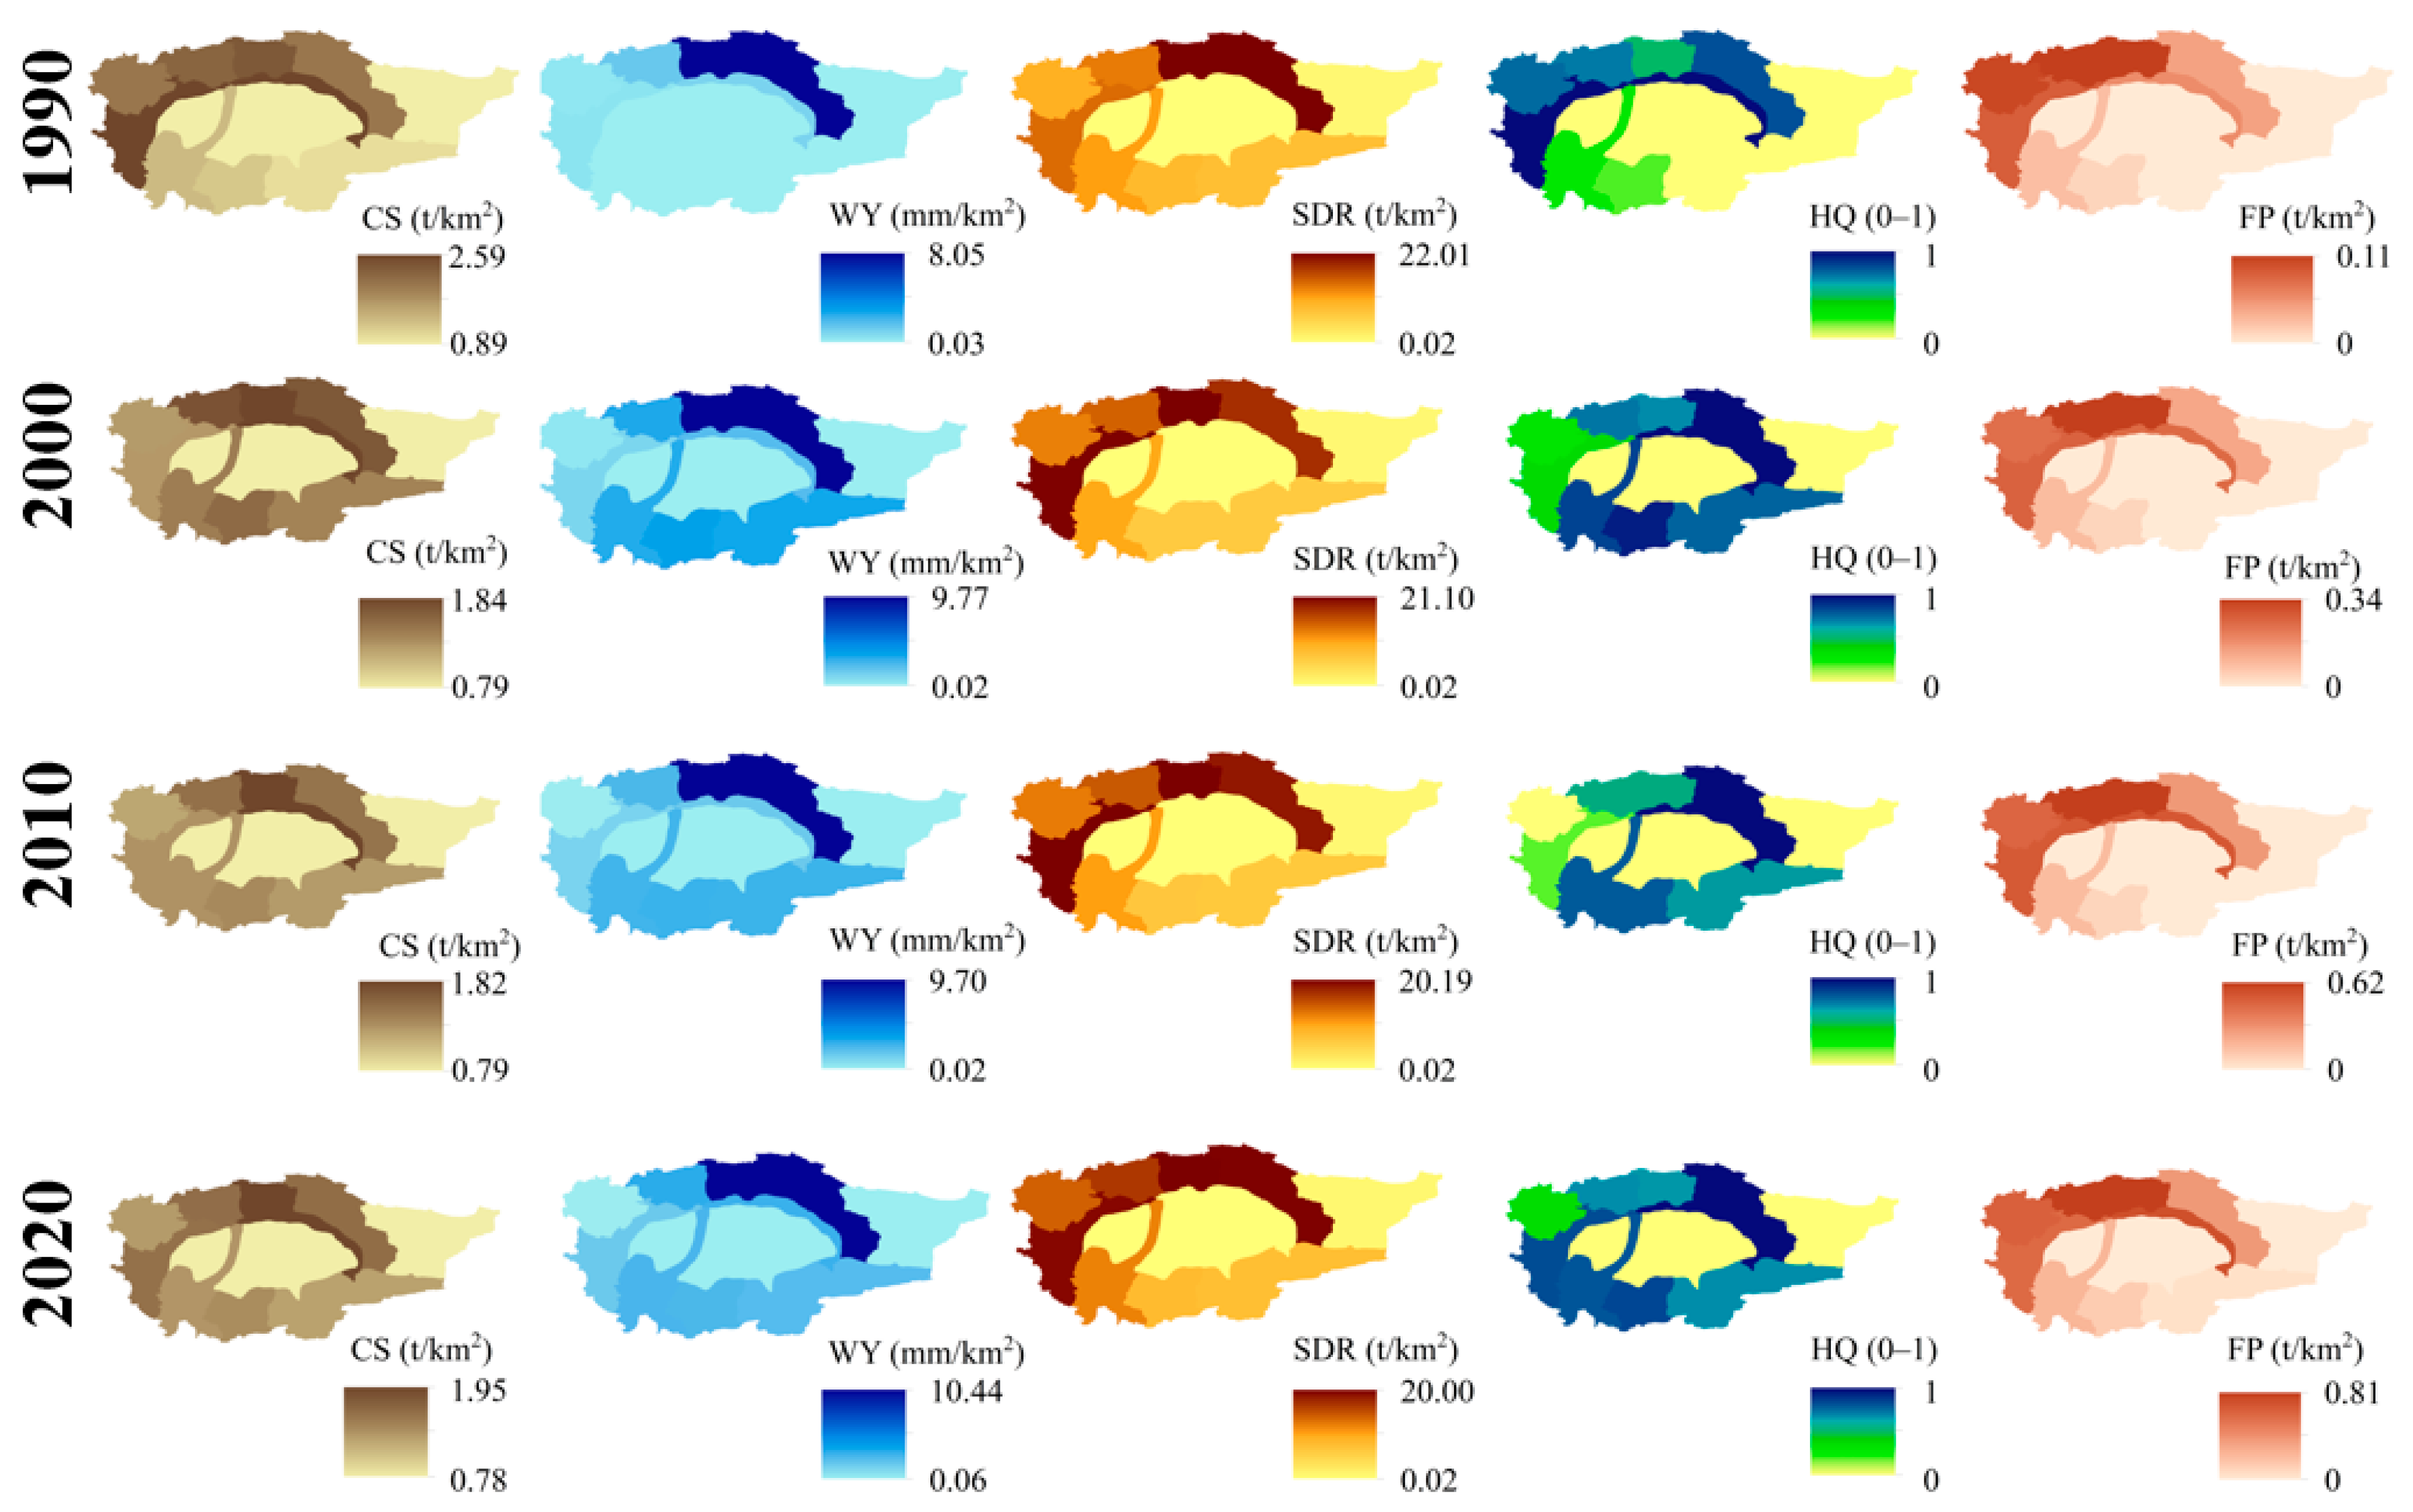
The WY quantity in the TRB was 15.38 × 10⁹ m3 in 1990, and remained at 26 × 109 m3 from 2000 to 2020. Mainly in the northern Kaikou river sub-basin and Weigan river sub-basin, the WY amount increased significantly. CS increased year by year, extending from 12.79 × 10⁸ t to 14.12 × 10⁸ t. The SDR decreased gradually, from 76.16 × 10⁷ t in 1990 to 66.81 × 10⁷ t. HQ gradually improved, increasing from 0.1538 to 0.2081. The amount of FP increased significantly, from 34.01 × 10⁵ t in 1990 to 11.03 × 10⁶ t in 2000 and to 29.27 × 10⁶ t in 2020. In particular, the Kaikou river sub-basin, Weigan river sub-basin, and Kashigar River sub-basin in the north, and the Yarkant River sub-basin in the west had a significant increase in the amount of FP. The spatial and temporal distribution of ESs at the pixel scale in the TRB are shown in Figure 3.
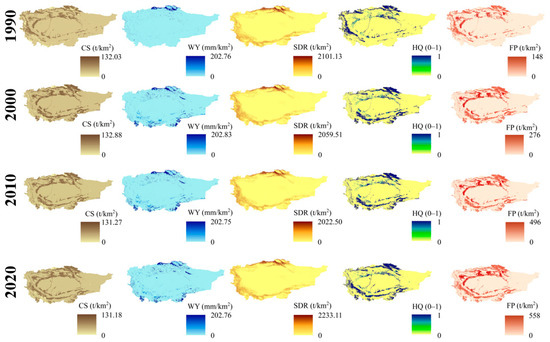
Figure 3.
Spatial and temporal distribution of ESs at the pixel scale in the TRB (carbon sequestration (CS), water yield (WY), sediment delivery ratio (SDR), habitat quality (HQ), and food production (FP)).
The spatial distribution of the five kinds of ES in the TRB also showed heterogeneity, but the spatial patterns remain the same over time. The high-value ESs are mainly distributed in the north, west, and south of the TRB, and are scattered in the middle and west of the basin. From 1990 to 2020, the range of high-value ESs in the TRB has expanded significantly. In particular, the areas with a high-value WY service increased significantly in the southern Kria river sub-basin and Hotan River sub-basin. The Kumuta desert sub-basin, Kria river sub-basin, and Taklimakan desert sub-basin had the lowest ES values, and the time change was not significant. The spatial and temporal distribution of ESs at the sub-basin scale in the TRB are shown in Figure 4.

Figure 4.
Spatial and temporal distribution of ESs at the sub-basin scale in the TRB (carbon sequestration: CS, water yield: WY, sediment delivery ratio: SDR, habitat quality: HQ, and food production: FP).
3.2. Spatial and Temporal Correlation Between Ecosystem Services
3.2.1. Correlation Analysis Between Ecosystem Services
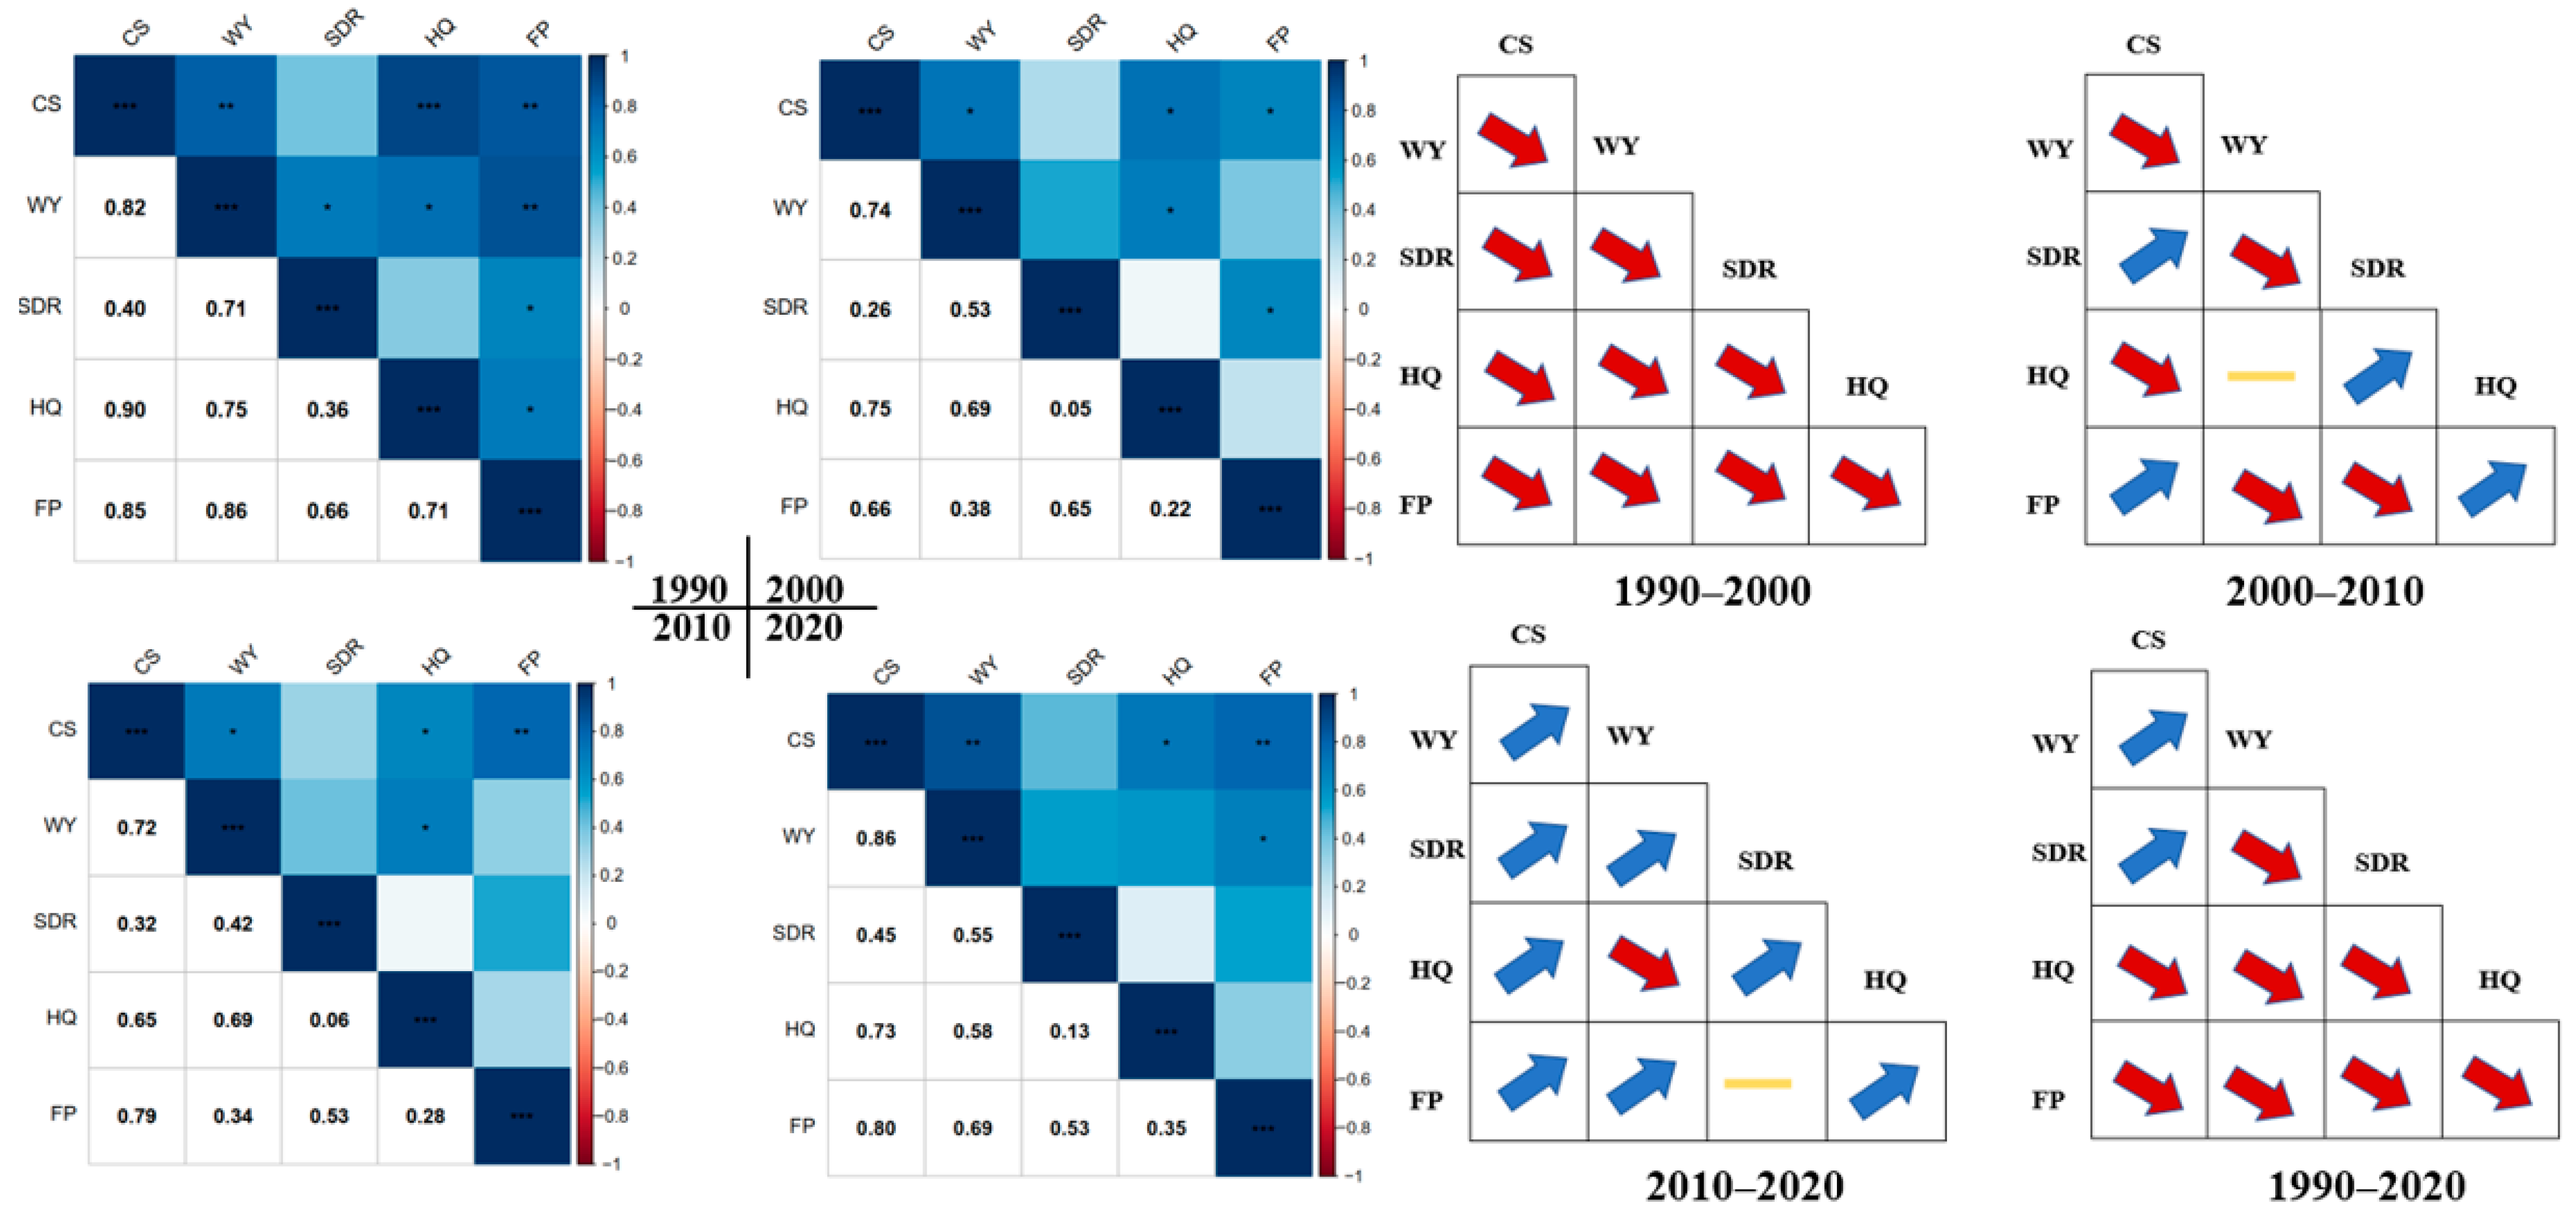
At the pixel scale, a total of 10 correlations were identified among the five ESs for the four years. Some of the ESs showed similarities in terms of annual correlation trends, and the 1990 to 2020 correlations show ES trends over the 20-year time period. In 1990 to 2000, for example, there is a negative trade-off relationship between the SDR–FP, while there are positive synergistic relationships among the other ES indicators. The correlations between FP–CS, and between FP–WY are both higher than 0.8, indicating a strong synergistic effect. The correlation between the SDR–CS gradually increases from −0.1 to −0.01, and the trade-off effect is continuously decreasing. Between 2000 to 2010, and 2010 to 2020, although there were more synergistic relationships among most ESs in the TRB, with the passage of time, the correlations among most ESs either decreased or remained unchanged. Overall, from 1990 to 2020, the correlations of most ESs showed an upward trend. Synergy was constantly strengthening, while the correlations among HQ–CS, HQ–WY, and FP–HQ gradually decreased, and the trade-off effect was continuously strengthening. The correlation and change trend in ESs at the pixel scale in the TRB are shown in Figure 5.
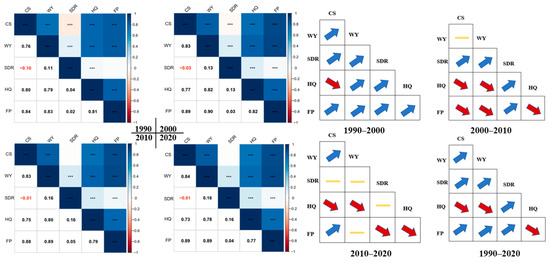
Figure 5.
Correlation and change trend in ESs at the pixel scale in the TRB (p < 0.05 is marked with “*”; p < 0.01 is marked with “**”; p < 0.001 is marked with “***”).
At the sub-basin scale, all ESs show a positive synergistic relationship. Among the four years, the correlations among other services are relatively high, except for the relationship between HQ–SDR. From 1990 to 2000, the correlations among all services decreased, and the trade-off effect was strengthening. From 2000 to 2010, the changing trends in the trade-off relationship and the synergistic relationship were rather chaotic. From 2010 to 2020, the correlations among most ESs increased, with the synergistic effect being enhanced. From 1990 to 2020, the correlations of the main ES in each sub-basin of the TRB decreased, indicating that the trade-off effect was gradually strengthening. Only the correlations between WY–CS, and the SDR–CS increased, with the synergistic effect being enhanced. The correlation and change trend in ESs at the sub-basin in the TRB are shown in Figure 6.
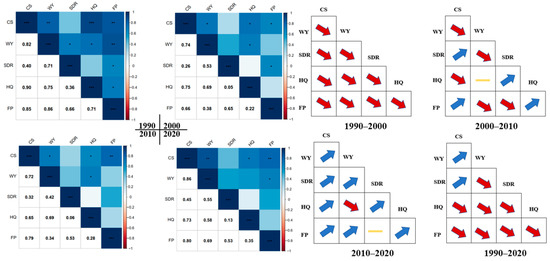
Figure 6.
Correlation and change trend in ESs at the sub-basin scale in the TRB (p < 0.05 is marked with an “*”; p < 0.01 is marked with “**”; p < 0.001 is marked with “***”).
3.2.2. Spatial–Temporal Patterns of Trade-Offs/Synergies Between Ecosystem Service Pairs
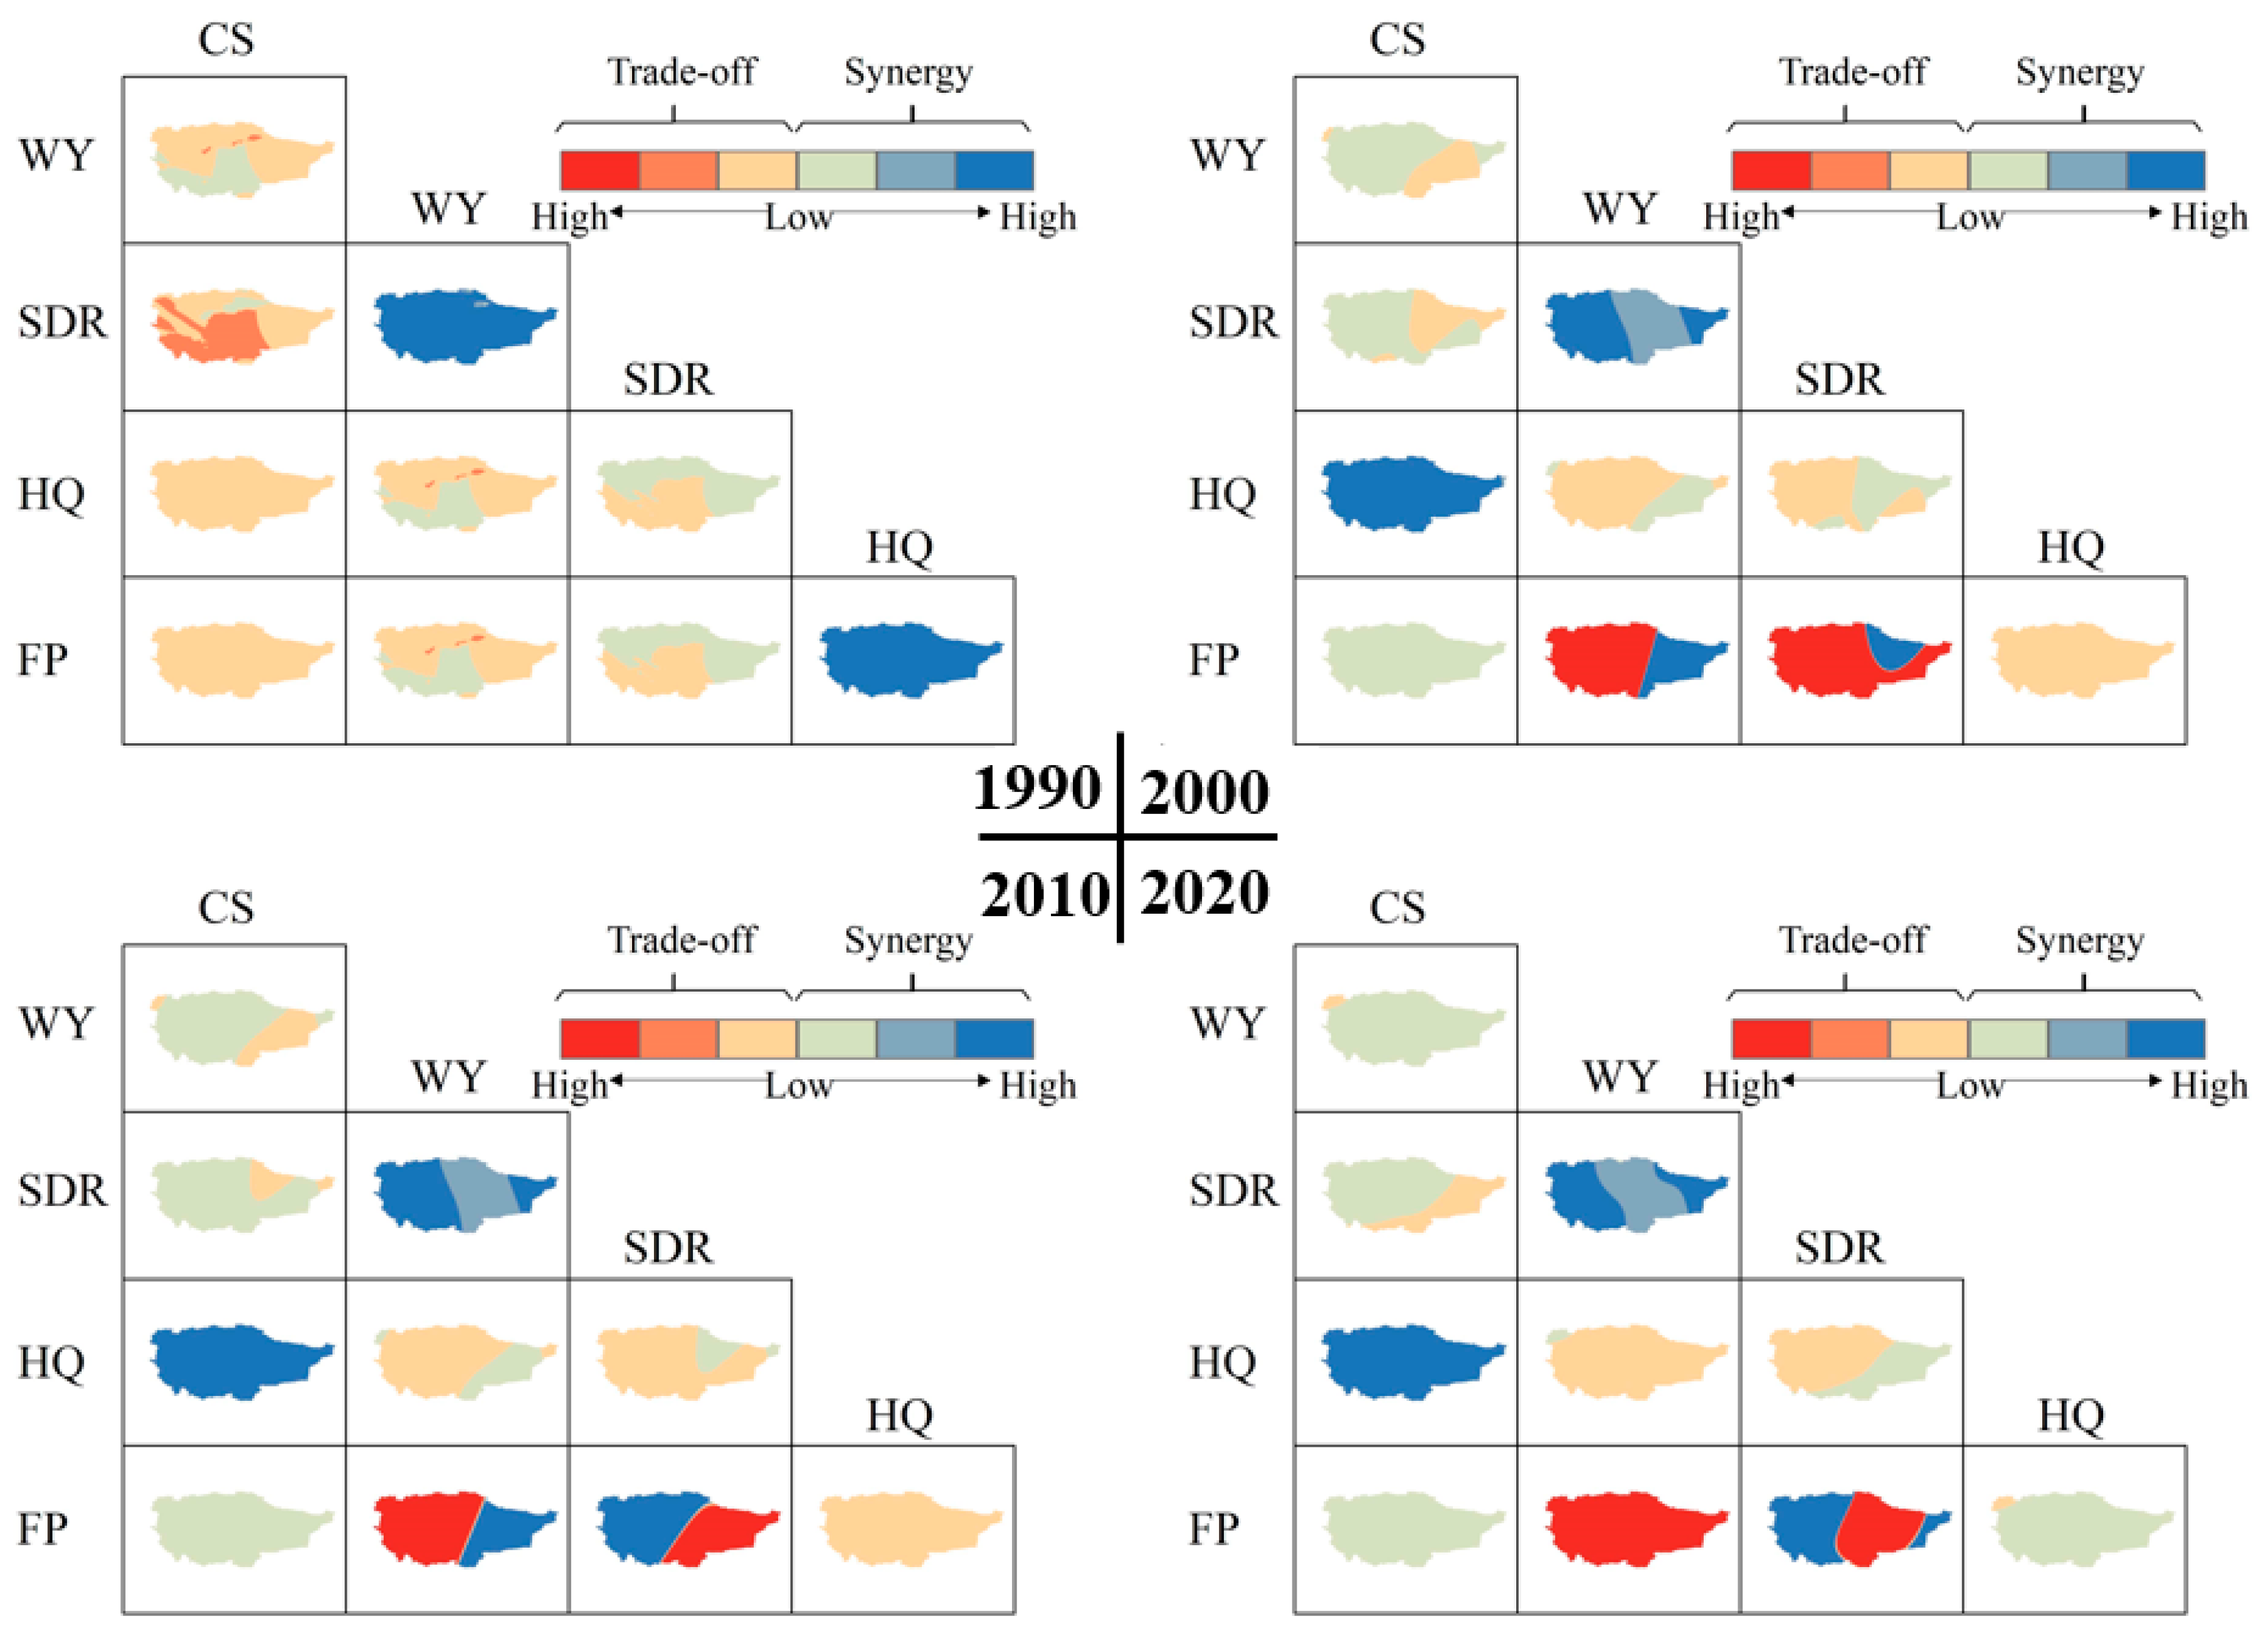
The GWR results show that the spatial trade-offs and synergies of ES pairs at the pixel scale have certain spatial heterogeneity in the spatial scale. The southwest of CS–SDR was dominated by trade-offs in 1990, and there was a high synergy between the SDR–WY, and FP–HQ. The west of FP–WY was high in trade-offs and the east was high in synergies from 2000 to 2010; and the whole basin was high in trade-offs by 2020. In 2000, the west of FP–SDR is dominated by a high trade-off; and only the northeast had high synergy; but, in 2010 and 2020, the west had high synergism and the east had a high trade-off. From 2000 to 2020, the relationship between HQ–CS was strongly synergistic, while the FP–WY trade-off was largely strong. The spatial distribution of ES trade-offs and synergies at the pixel scale in the TRB are shown in Figure 7.
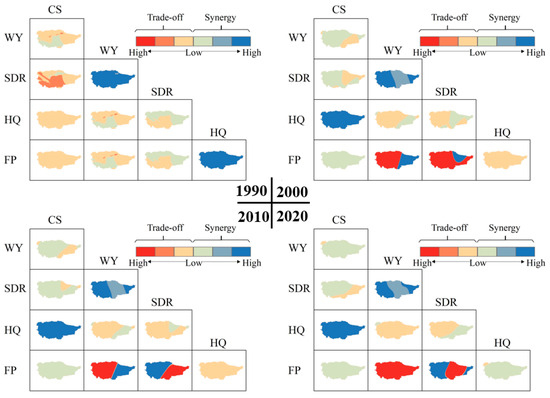
Figure 7.
Spatial distribution of ES trade-offs and synergies at the pixel scale in the TRB.
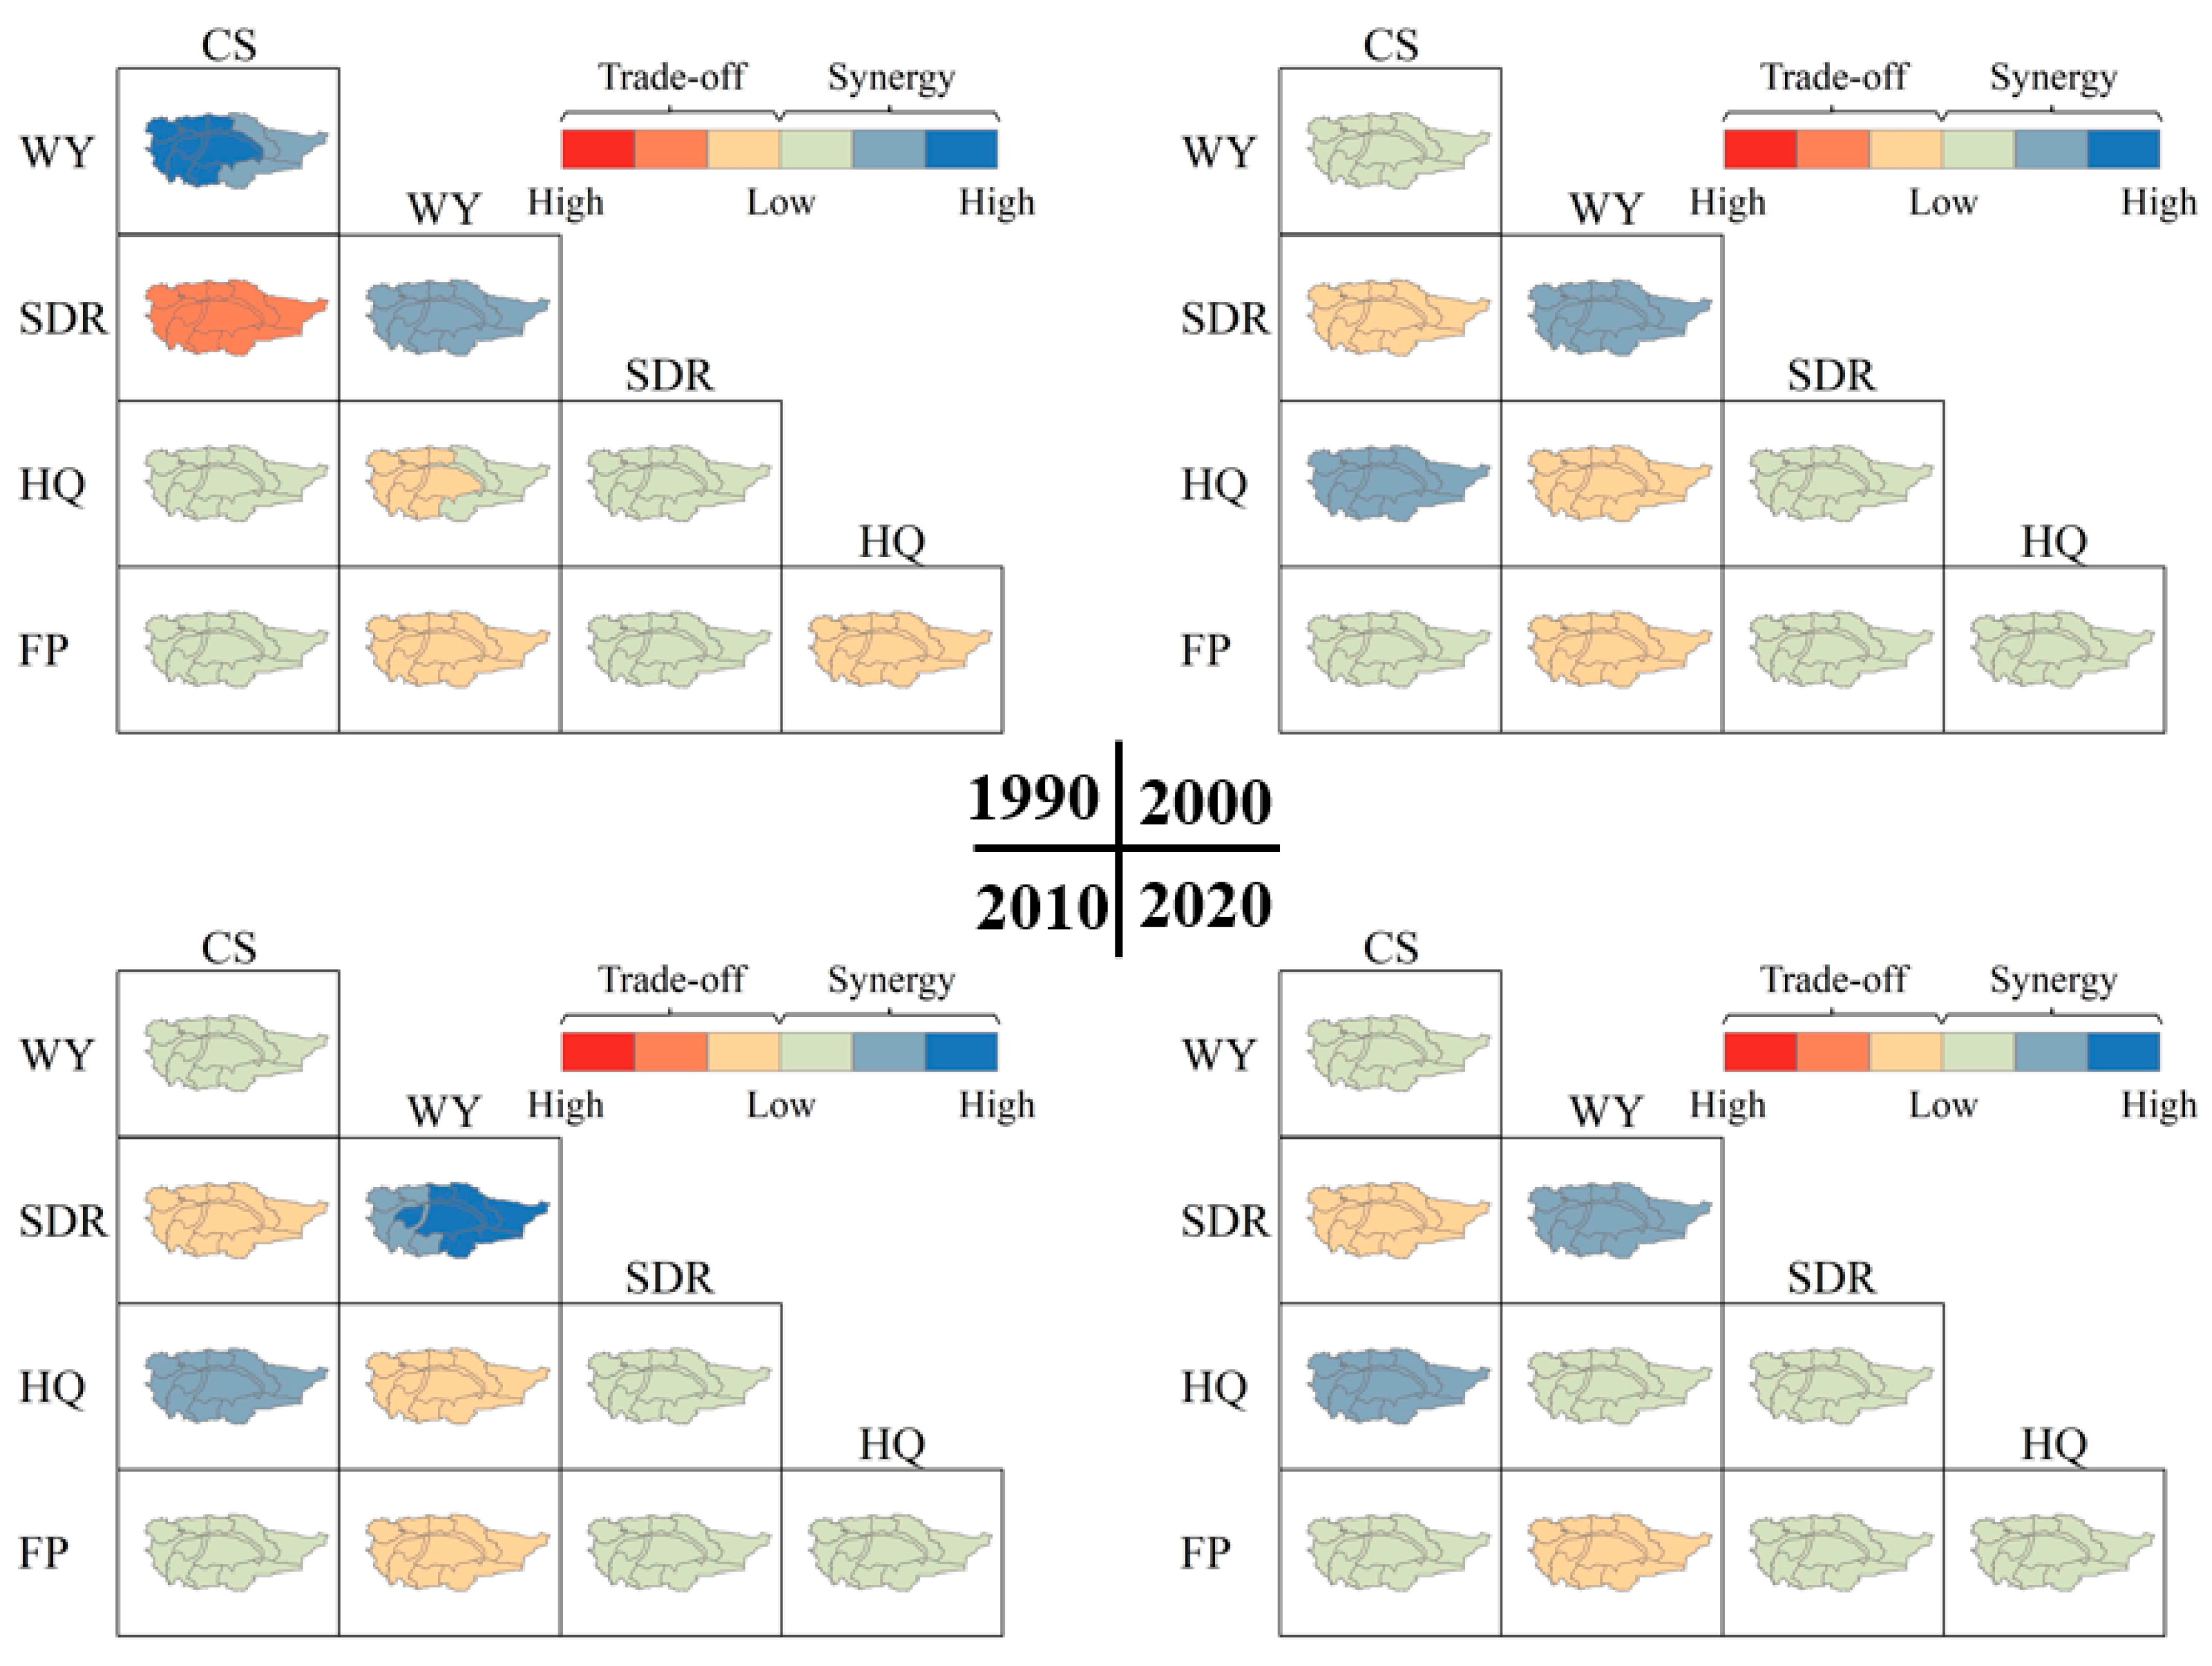
At the sub-basin scale, the GWR results show that only the 1990 CS–SDR had a moderate trade-off in the whole basin, and other years had a mild trade-off relationship. The WY–CS was highly synergistic in the western basin in 1990; moderately synergistic in the eastern Kumuta desert, Qarqan river, and Kaikou river sub-basins; and mildly synergistic in other years. In 2010, The SDR–WY was highly synergistic in the eastern sub-basins and slightly synergistic in the western sub-basins of the Aksu River, Kashigar river, and Yarkant river sub-basins. From the whole sub-basin, each sub-basin in different years had mainly light coordination or a light trade-off. The spatial distribution of ES trade-offs and synergies at the sub-basin scale in the TRB are shown in Figure 8.
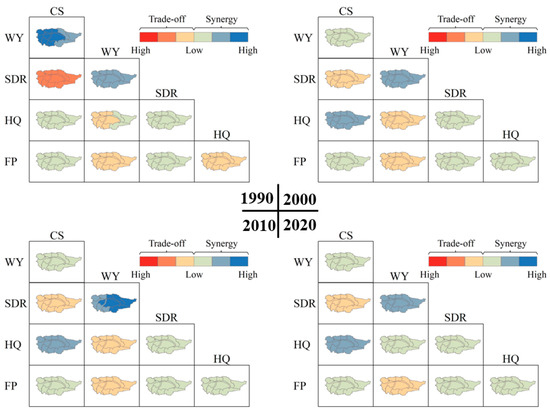
Figure 8.
Spatial distribution of ES trade-offs and synergies at the sub-basin scale in the TRB.
3.2.3. Spatial–Temporal Patterns of the Ecosystem Service Bundle
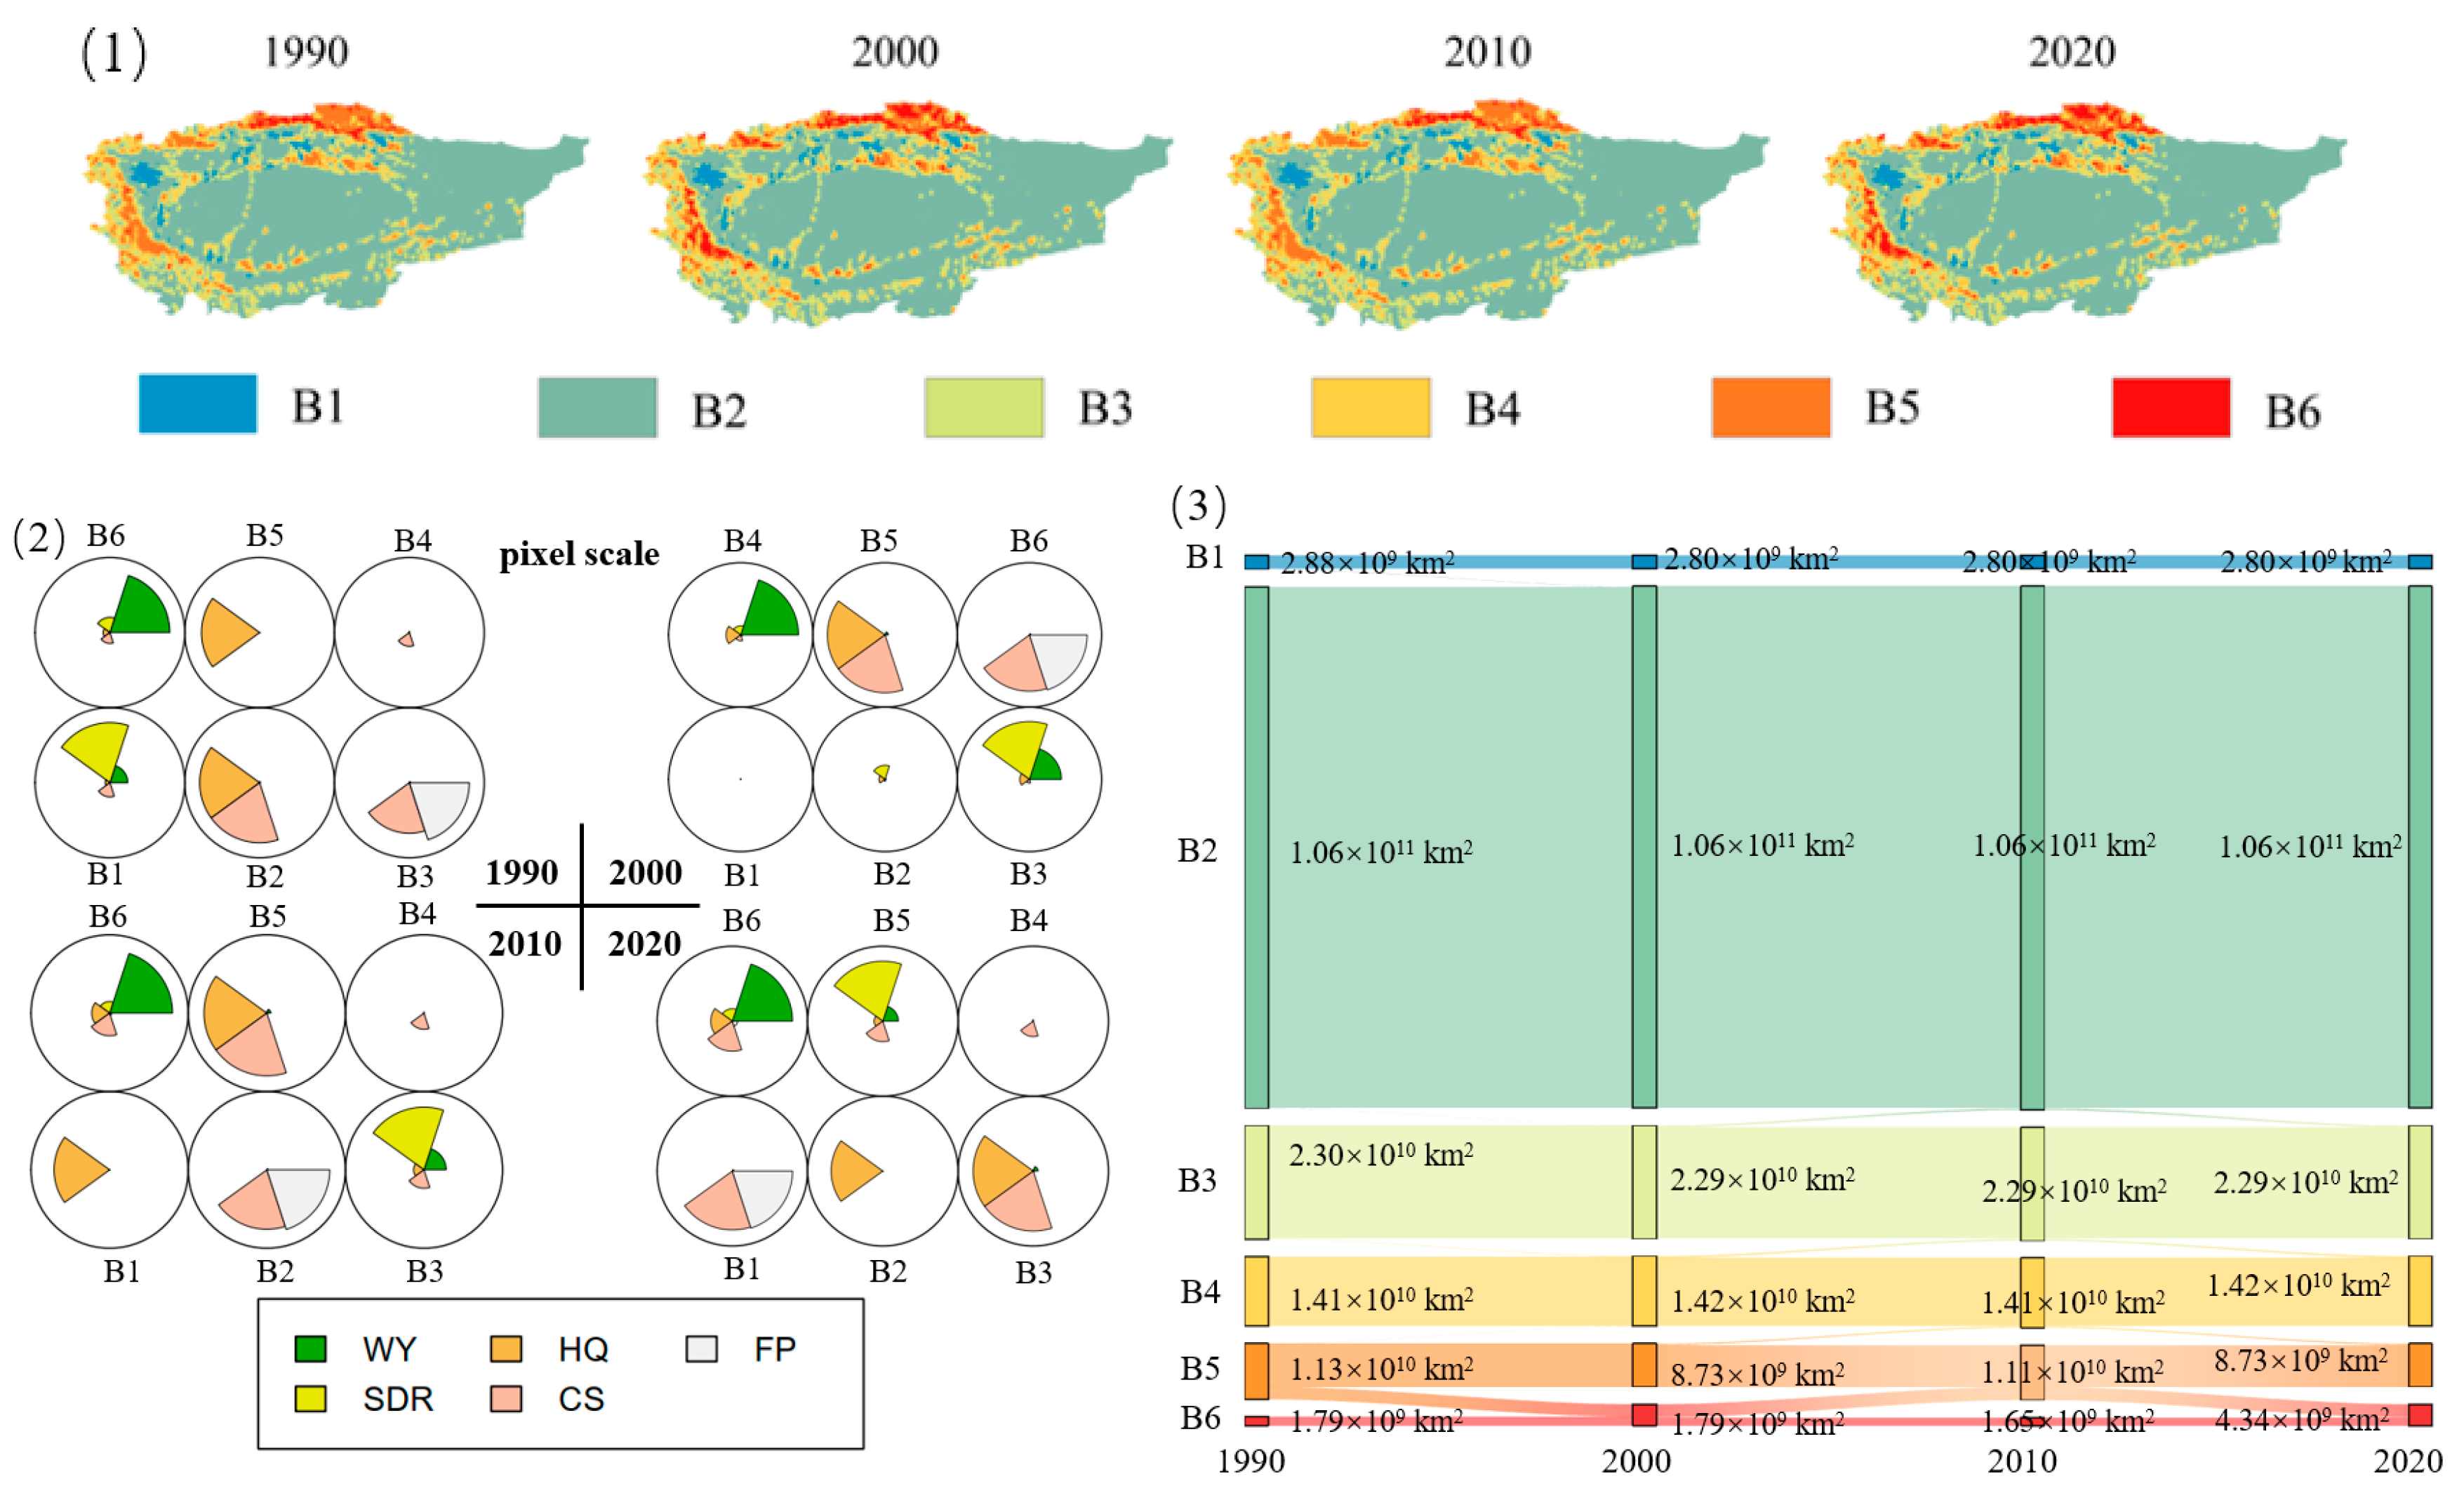
SOM identified six ESBs at the pixel scale and sub-basin scale in the TRB. In terms of the pixel scale, WY, HQ, and the SDR formed a synergistic bundle, while HQ–CS and CS–FP formed synergistic bundles in 1990. WY–SDR formed a regulation bundle, and HQ–CS and CS–FP formed synergistic bundles in 2000. In 2010, WY, HQ, and the SDR formed a synergistic bundle and HQ–CS and CS–FP formed a synergistic bundle. In 2020, WY, SDR, and HQ formed a synergistic bundle, and HQ–CS and CS–FP formed a synergistic bundle. It can be seen that in these four years, WY and the SDR mainly formed regulation bundles, while HQ–CS and CS–FP mainly formed synergistic bundles. Bundle B1 and bundle B6 have the smallest area and are scattered in the west and north. The whole basin is dominated by bundle B2, which is widely distributed in the central and eastern regions, while other bundles are distributed in the north, west, and south regions. The area of each ESB changed little in the four years. The ESBs at the pixel scale in the TRB are shown in Figure 9.
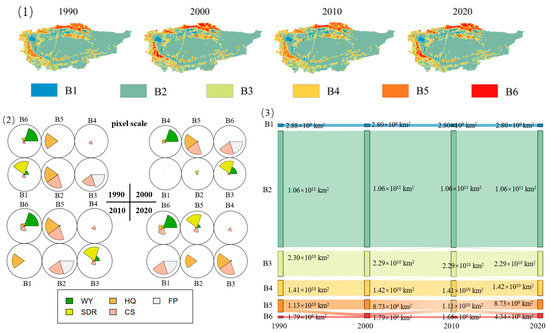
Figure 9.
(1) Spatiotemporal patterns of ESBs at the pixel scale (ecosystem service bundle: ESB). (2) Composition and relative magnitude of ESs in ESBs at the pixel scale. (3) Area of interconversion among different ESBs in 1990–2020 at the pixel scale.
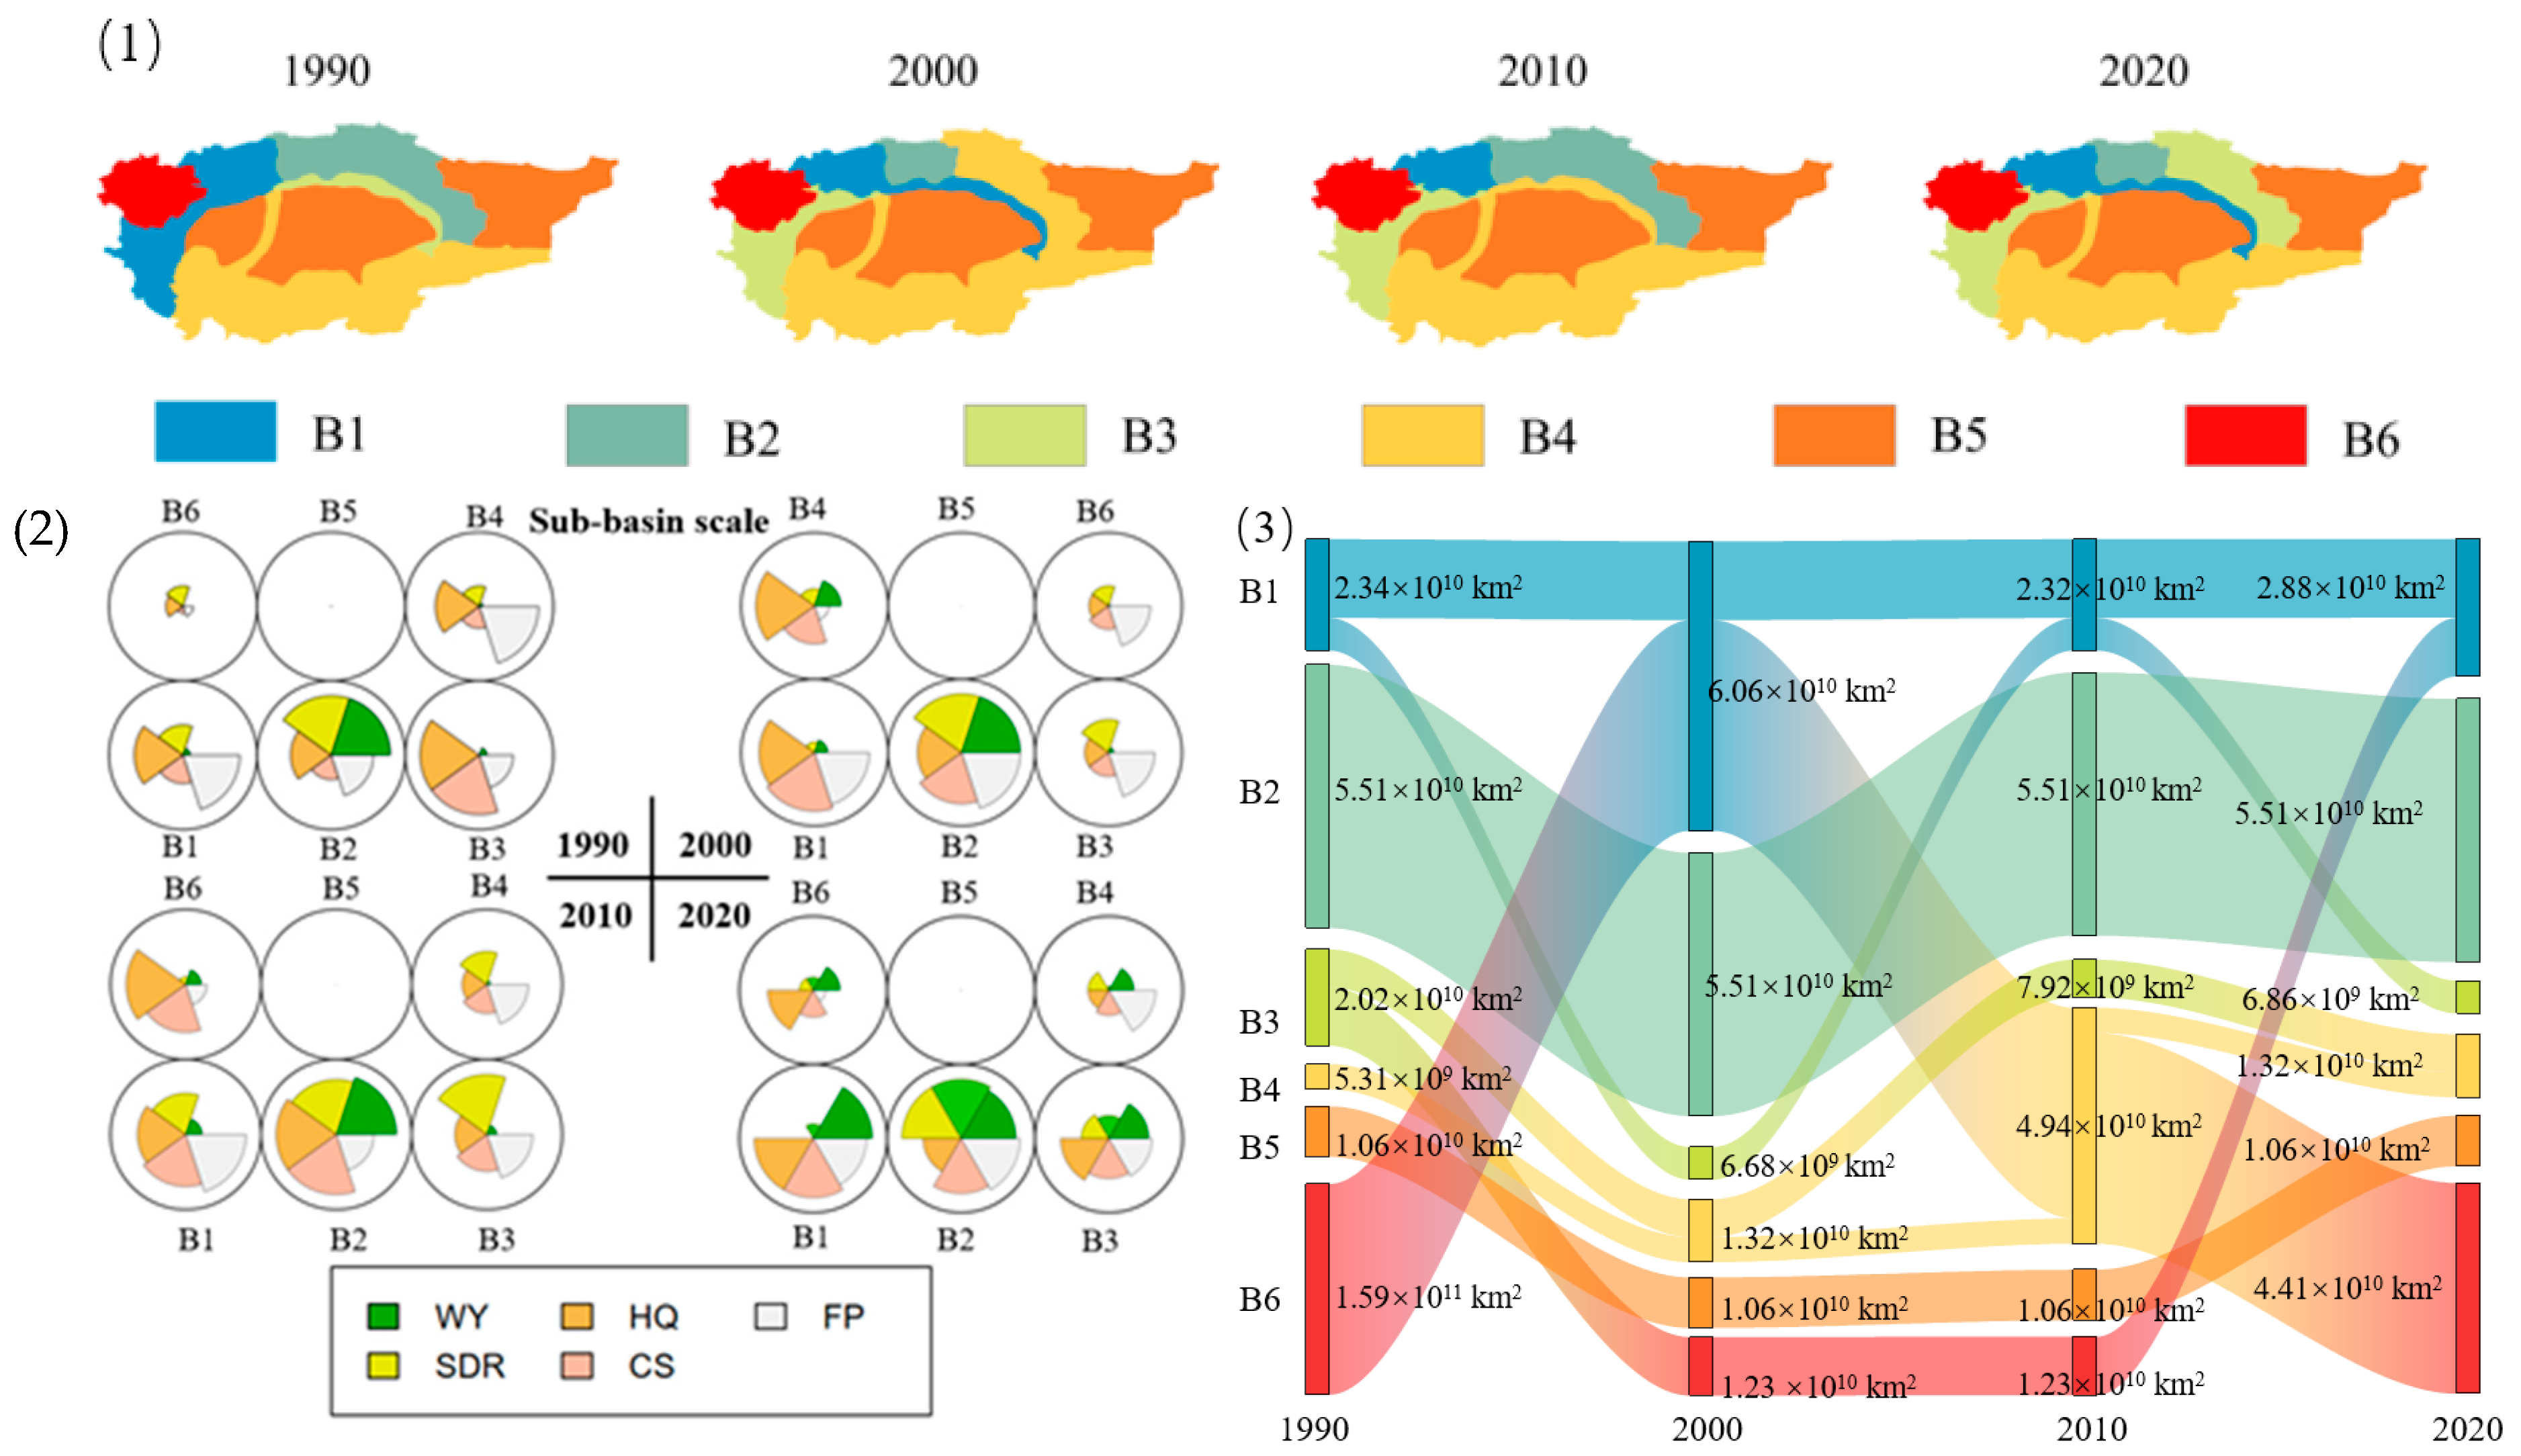
At the sub-basin scale, the HQ–FP and HQ–CS synergistic bundles were formed and the SDR–WY regulation bundle appeared in 1990. In 2000, the CS–FP–HQ and CS–SDR–WY–FP–HQ comprehensive bundles and the FP–HQ bundle formed but other services constituted a slight synergy. In 2010, HQ–FP–CS and CS–SDR–WY–HQ comprehensive bundles, and the SDR, FP, and HQ regulation bundles were formed, but they were slightly synergistic with other services. In 2020, the HQ–FP–CS and CS–SDR–FP–WY comprehensive bundles were formed, and the formed HQ and FP bundles were slightly synergistic with other services. The Kaikou river sub-basin in the north of the basin changed into the B2–B4–B2–B3 bundle in four years and the Tarim River sub-basin changed from the B3–B1–B4–B1 bundle. The western Yarkant river sub-basin in 1990 was the B1 bundle, and in the other years was the B3 bundle. The area of each ESB changed little in the four years; however, the area of the B1 and B6 bundles changed the most. The ESB at the sub-basin scale in the TRB are shown in Figure 10.
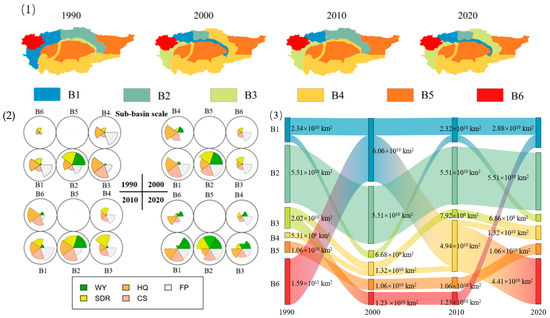
Figure 10.
(1) Spatiotemporal patterns of ESBs at the sub-basin scale. (2) Composition and relative magnitude of ESs in ESBs at the sub-basin scale. (3) Area of interconversion among different ESBs in 1990–2020 at the sub-basin scale.
By comparing the ESB at the pixel scale and sub-basin scale, we found that some ESBs are the same on the two scales, but their spatial distribution is similar, such as the HQ-CS bundle and CS-FP bundle. Meanwhile, some ESBs have scale heterogeneity, and the area changes between different ESBs at the pixel scale are relatively small. However, it has an important impact on ESBs at the sub-watershed scale, resulting in important changes in the area of B2 and B6 bundles at the sub-watershed scale. This difference in ESB classification and area means that different management strategies need to be proposed based on ES differentiation at different scales.
4. Discussion
4.1. Spatiotemporal Variation and Ecological Management Suggestions for Ecosystem Services
The spatial distribution of ESs in the TRB presents spatial heterogeneity, but from the perspective of a long time scale, the distribution of ESs presents consistency. The northern part of the basin is mainly forest, grassland, cultivated land, and land with ice and snow; the western part is mainly grassland; and the southern part is mainly grassland, scrub, and land with ice and snow. These areas with high vegetation coverage are also the areas where rivers flow through wetlands and converge, and are the high-value areas of ESs [41]. The spatial pattern of WY and the SDR showed the same pattern, and the forest and land with permanent ice and snow in the north of the basin showed a spatial aggregation, especially in terms of WY. From 2000 to 2020, the high value range of WY increased greatly, and the amount of WY expanded to nearly twice the amount. CS and HQ are mainly high-value areas in the forest area near the river, and there is also a large distribution in the grassland area. FP increased significantly in the four years, especially after 2000. The increase in WY and FP is closely related to the implementation of the ecological water supply project in the Xinjiang Uygur Autonomous Region [34]. Through the efficient allocation of water resources, the demand for agricultural water and ecological water is met, and the agricultural planting area is greatly increased. Meanwhile, the statistical yearbook shows that pesticide and fertilizer use in the Xinjiang Uygur Autonomous Region has significantly increased over the past 40 years. This has promoted agricultural development and green space in the TRB, while also reducing soil and water loss in the basin, thereby improving habitat quality (HQ).
The central and western deserts of the TRB are widely spread, with the Taklimakan Desert, the second largest in the world, being in the middle and the Kumtag Desert in the east. It is limited by extreme climatic conditions and a fragile ecological environment. Due to the scarcity of water resources, low vegetation coverage, and poor soil, the capacity of service supply and regulation in desert areas is weak [50]. However, desert ecosystems still provide important species conservation services, and HQ is sporadically distributed in desert areas, while the area of HQ increases slightly over time. Through ecological restoration and sustainable management, ES capabilities in desert areas can be improved to help regional ecological security and economic development [35].
4.2. Trade-Offs and Synergies Between Ecosystem Services
Spearman correlation analysis results show that WY, CS, FP, and HQ in the TRB are mainly synergies, and synergies increase with the passage of time, while trade-offs mainly occur between the SDR and CS. From 2000 to 2020, the results of the GWR analysis at the pixel scale show that FP–WY and FP–SDR within the river basin exhibit a state of high synergy or high trade-off in spatial distribution. Although irrigated agriculture in the TRB oasis has a positive effect on the terrestrial carbon sink, long-term high-intensity tillage will lead to significant water and soil resource contradictions, which are embodied in water resource pressure, soil degradation, and HQ decline, etc. [37]. This resource-competitive development model continuously strengthens the trade-off and synergistic relationship of ESs. It is worth noting that 98% of the population in the basin is concentrated in the oasis zone, and the increase in land use intensity driven by population pressure further amplifies this trade-off effect. In the western, northern, and southern regions, ESs are in a cooperative state, WY and SDR are dominated by the regulation bundle, and HQ–CS and CS–FP are dominated by the synergistic bundle. Therefore, in order to realize the synergistic development of ESs in the TRB, it is necessary to adopt a comprehensive management strategy. Ecological restoration, afforestation, and grass planting in the basin increase the area of forests and grasslands, and improve WY and HQ in a short amount of time. However, the vegetation type is single, the redistribution of water resources conflicts in time and space, contradiction exists between irrigated agriculture and ecological water use, the soil nutrients are exhausted, and the HQ is reduced for a long period of time [17].
Through the comparative study of the TRB pixel scale and sub-basin scale, it is found that the ES trade-off coordination presents a significant “scale-dependent” feature, and needs to be combined with “bottom-up” local adaptation and “top-down” overall regulation to achieve sustainable management [14]. In the eco-agricultural system of the oasis in the arid region, the interaction of different scales profoundly affects the ES trade-off and synergistic relationship. As a complex ecosystem, the stability of the TRB depends on the coordination degree of each local region, and large-scale studies will ignore small-scale ecological relations [51]. The high coordination relationship between CS–HQ, and the SDR–WY, at the pixel scale also has an important impact on the sub-basin scale, and the sub-basin scale will dilute the high trade-off of CS–SDR, FP–WY, and FP–SDR at the pixel scale, weakening their trade-off intensity. WY in the local region may promote FP and HQ, but it may have a negative correlation with CS and the SDR, and then have a significant impact on the overall ESs. The area of multiple ESBs at the pixel scale does not change much, but has a significant impact on the ESBs at the sub-basin scale, resulting in a drastic change in the ESB area. This relationship illustrates the core contradiction of ecological management that “local optimality ≠ overall optimality”, and emphasizes the need to regulate the human–land relationship at the system level [52,53].
4.3. Suggestions on Policy Management of Ecosystem Service Trade-Off and Synergy
As an important ecological barrier in the arid area of northwest China, the trade-off and synergy relationship of ESs in the TRB is very important for regional sustainable development. In order to achieve the win–win goal of ecological protection and economic development, the following policy suggestions are put forward:
(1) Implement multi-objective land use planning. From the perspective of space, the land use mode of the TRB directly affects the ESs in the basin. The cooperative area is mainly distributed in the western and southern mountain oases, and partially distributed in the northern mountain areas. These areas are mainly covered by forests, grasslands, and farmlands, with high vegetation coverage. Increased vegetation cover can improve HQ and CS while improving soil erosion. Through land use planning, the spatial layout of ecological protection areas and agricultural development areas should be clarified to avoid the degradation of ecological functions caused by over development [54].
(2) Optimize water resources allocation. Promote water-saving irrigation technology in agricultural areas, reduce water waste, and realize the collaborative growth of FP–WY [55,56]. In ecologically fragile areas, the project of returning farmland to forest and grassland should be implemented according to local conditions to enhance the capacity of the SDR and WY. At the same time, the north of the land with ice and snow and the river WY supply bundle area should be delimited water protection zones, to avoid over-development caused by water shortages and land degradation [56].
(3) Ecological restoration should be carried out according to local conditions. There is a trade-off relationship between CS and the SDR, and a large number of areas in the central and western parts of the basin still have a high trade-off. Large-scale afforestation may increase the carbon sink, but in arid regions, it may consume a lot of water, so vegetation growth is limited. The SDR, on the other hand, depend on the stability of vegetation cover and the soil structure, which, if poorly managed, can lead to soil erosion and the worsening of HQ degradation [42]. Through optimizing ecological restoration, promoting suitable vegetation restoration models, establishing ecological corridors, and ecological monitoring and assessment, the development of CS and the SDR can be balanced to promote the sustainable management of ecosystems.
(4) It is necessary to focus on the scale characteristics when conducting regional ecological assessment and ecological planning. At the pixel scale, water-saving technology can be promoted, WY protection can be strengthened, FP can be increased, CS and biodiversity can be promoted, and multiple ES clusters in local areas can be developed in concert. At the sub-basin scale, the layout of “three-life space” can be optimized, red lines of ecological protection and water source protection areas can be delineated, dynamic management strategies can be formulated, and cross-regional water right allocation based on ES management can be implemented [13,57]. The integrated management of “mountain, water, forest, farmland, lake, grass, and sand” should be built on a large scale to improve the overall ecological resilience of the basin and achieve a sustainable balance between ecological protection and agricultural development [58,59,60].
(5) Strengthen cooperation with neighboring regions and countries in the ecological environment. The TRB is located within China and is adjacent to countries in Central Asia such as Kazakhstan and Kyrgyzstan. These Central Asian regions are typically arid and semi-arid ecologically vulnerable areas. Environmental protection and governance face challenges such as water resource shortages, land degradation, and desertification [60]. The regions where ESs are generated usually do not coincide with the places where their associated effects occur. In most cases, ESs are transferred downstream or have an effect in adjacent areas [61]. In the sub-basins of the Tarim River, the Kashigar River originates from Kyrgyzstan, flows through the Kashgar region of China, and finally converges into the Tarim River. The Kashigar River sub-basin is an important production area for cotton and wheat in the TRB. Therefore, it is necessary not only to strengthen the research among different scales in the TRB, but also to strengthen cooperation with neighboring countries to protect the regional ecological environment [1,60].
4.4. Limitations and Future Prospects
This study provides theoretical support for the management of ESs in inland arid areas, and provides a basis for spatial planning. However, there are still some limitations in the study. First of all, ESs in this study are calculated with a 30 m resolution, but in GWR and SOM analysis, limited by the operation of the model, only a 5 km resolution grid can be resampled for calculation, which may affect the pixel-scale results. It is possible to reduce the extraction of the ES data volume so that the data can meet the model calculation with a resolution of 30 m. However, the area of the TRB is large, and reducing the data volume may not be able to fully demonstrate the spatiotemporal changes in the trade-offs and synergies of the ESs in the TRB. Secondly, previous studies have shown that a land use change significantly impacts ESs [62]. In this study, while land use and ESs generally showed consistency, the analysis of land use changes in the basin was not thorough and may affect ESs in arid desert areas. Thirdly, this study did not consider the influencing factors of ESs, especially the ES changes caused by human activities [40]. Therefore, it is necessary to explore the influence of different factors on ESs in the basin, so as to provide more accurate support for the management of the basin. Finally, ESs are a dynamic transfer process from the production area to the beneficiary area. We should not only consider the changes in ES in different time and space scales within the TRB, but also consider the ES status of neighboring regions and countries [38,60,61].
5. Conclusions
By analyzing the spatiotemporal evolution of the CS, WY, SDR, HQ, and FP ESs in the TRB from 1990 to 2020, and by correlation analysis, GWR, and SOM to study the trade-off and synergistic relationship among different ESs, this paper elucidates the difference in ES level in the whole basin and ESs in different regions. It is helpful to improve ES supply in drought-vulnerable areas, and provide support and a basis for ecological planning and ecological management of the basin.
The study found that ESs present spatial heterogeneity and their spatial distribution is relatively stable over time. High-value ESs were mainly distributed in the northern, western, and southern oases composed of forests, grasslands, and wetlands, with significant increases in WY and FP, while low-value ESs were found in the extensive midwest desert regions. The synergistic effect mainly occurred between WY, CS, FP, and HQ, spatially distributed mainly in the mountainous and hilly regions of the west, north, and south, while the trade-off effect mainly occurred between the SDR and CS, spatially distributed mainly in the midwest desert. ES management needs to focus not only on ES pairs that exhibit trade-offs, but also on ES pairs where synergies decline. ESs also present differently on different scales, so it is necessary to pay attention to scale characteristics when conducting ecological assessment and planning, and specify different management policies based on different scales.
Supplementary Materials
The following supporting information can be downloaded at: https://www.mdpi.com/article/10.3390/f16061024/s1, S1: Locations of Sub-basins in the Tarim River Basin. S2: Ecosystem services methods and specific parameters. S3: Verification of Ecosystem Services. Figure S1: Locations of Sub-basins in the Tarim River Basin; Table S1: Sub-basin names.
Author Contributions
Methodology, Z.L.; Resources, Y.S.; Software, Z.L. and W.F.; Validation, Z.L. and W.F.; Formal analysis, Z.L.; Data curation, Z.L. and Y.S.; Writing—original draft, Z.L.; Writing—review & editing, Y.Q. and X.W.; Project administration, Y.Q. and X.W. All authors have read and agreed to the published version of the manuscript.
Funding
This research was funded by the National Natural Foundation of China, 42277310.
Data Availability Statement
The raw data supporting the conclusions of this article will be made available by the authors on request.
Conflicts of Interest
The authors declare no conflicts of interest.
References
- Millennium Ecosystem Assessment. Ecosystems and Human Well-Being; Island Press: Washington, DC, USA, 2005. [Google Scholar]
- Crossman, N.D.; Burkhard, B.; Nedkov, S.; Willemen, L.; Petz, K.; Palomo, I.; Drakou, E.G.; Martín-Lopez, B.; McPhearson, T.; Boyanova, K.; et al. A Blueprint for Mapping and Modelling Ecosystem Services. Ecosyst. Serv. 2013, 4, 4–14. [Google Scholar] [CrossRef]
- Schirpke, U.; Ghermandi, A.; Sinclair, M.; Van Berkel, D.; Fox, N.; Vargas, L.; Willemen, L. Emerging Technologies for Assessing Ecosystem Services: A Synthesis of Opportunities and Challenges. Ecosyst. Serv. 2023, 63, 101558. [Google Scholar] [CrossRef]
- Chen, J.; Jiang, B.; Bai, Y.; Xu, X.; Alatalo, J.M. Quantifying Ecosystem Services Supply and Demand Shortfalls and Mismatches for Management Optimisation. Sci. Total Environ. 2019, 650, 1426–1439. [Google Scholar] [CrossRef]
- Shen, J.; Li, S.; Wang, H.; Wu, S.; Liang, Z.; Zhang, Y.; Wei, F.; Li, S.; Ma, L.; Wang, Y.; et al. Understanding the Spatial Relationships and Drivers of Ecosystem Service Supply-Demand Mismatches towards Spatially-Targeted Management of Social-Ecological System. J. Clean. Prod. 2023, 406, 136882. [Google Scholar] [CrossRef]
- Ma, S.; Wang, L.-J.; Jiang, J.; Chu, L.; Zhang, J.-C. Threshold Effect of Ecosystem Services in Response to Climate Change and Vegetation Coverage Change in the Qinghai-Tibet Plateau Ecological Shelter. J. Clean. Prod. 2021, 318, 128592. [Google Scholar] [CrossRef]
- Fang, Z.; Wang, H.; Xue, S.; Zhang, F.; Wang, Y.; Yang, S.; Zhou, Q.; Cheng, C.; Zhong, Y.; Yang, Y.; et al. A Comprehensive Framework for Detecting Economic Growth Expenses under Ecological Economics Principles in China. Sustain. Horiz. 2022, 4, 100035. [Google Scholar] [CrossRef]
- Bai, Y.; Zhuang, C.; Ouyang, Z.; Zheng, H.; Jiang, B. Spatial Characteristics between Biodiversity and Ecosystem Services in a Human-Dominated Watershed. Ecol. Complex. 2011, 8, 177–183. [Google Scholar] [CrossRef]
- Yuan, L.; Geng, M.; Li, F.; Xie, Y.; Tian, T.; Chen, Q. Spatiotemporal Characteristics and Drivers of Ecosystem Service Interactions in the Dongting Lake Basin. Sci. Total Environ. 2024, 926, 172012. [Google Scholar] [CrossRef]
- Li, G.; Fang, C.; Wang, S. Exploring Spatiotemporal Changes in Ecosystem-Service Values and Hotspots in China. Sci. Total Environ. 2016, 545–546, 609–620. [Google Scholar] [CrossRef]
- Bai, Y.; Wong, C.P.; Jiang, B.; Hughes, A.C.; Wang, M.; Wang, Q. Developing China’s Ecological Redline Policy Using Ecosystem Services Assessments for Land Use Planning. Nat. Commun. 2018, 9, 3034. [Google Scholar] [CrossRef]
- Huang, Z.; Bai, Y.; Ali, M.; Fang, Z. “Two Mountains Concept” Leading the Green Transformation of China’s Economic Society. J. Environ. Manag. 2024, 359, 120960. [Google Scholar] [CrossRef] [PubMed]
- Xu, H.; Meng, M.; Zhu, F.; Ding, Q. The Role of Local Officials in Promoting Public Participation during Local Urban Planning Processes: Evidence from Chinese Cities. Land Use Policy 2024, 141, 107108. [Google Scholar] [CrossRef]
- Xu, C.; Zhao, S.; Liu, S. Spatial Scaling of Multiple Landscape Features in the Conterminous United States. Landscape Ecol. 2020, 35, 223–247. [Google Scholar] [CrossRef]
- Liu, J.; Pei, X.; Zhu, W.; Jiao, J. Scenario Modeling of Ecosystem Service Trade-Offs and Bundles in a Semi-Arid Valley Basin. Sci. Total Environ. 2023, 896, 166413. [Google Scholar] [CrossRef] [PubMed]
- Shifaw, E.; Sha, J.; Li, X.; Bao, Z.; Ji, J.; Ji, Z.; Kassaye, A.Y.; Lai, S.; Yang, Y. Ecosystem Services Dynamics and Their Influencing Factors: Synergies/Tradeoffs Interactions and Implications, the Case of Upper Blue Nile Basin, Ethiopia. Sci. Total Environ. 2024, 938, 173524. [Google Scholar] [CrossRef]
- Ling, H.; Guo, B.; Yan, J.; Deng, X.; Xu, H.; Zhang, G. Enhancing the Positive Effects of Ecological Water Conservancy Engineering on Desert Riparian Forest Growth in an Arid Basin. Ecol. Indic. 2020, 118, 106797. [Google Scholar] [CrossRef]
- Gonzalez-Ollauri, A.; Mickovski, S.B. Providing Ecosystem Services in a Challenging Environment by Dealing with Bundles, Trade-Offs, and Synergies. Ecosyst. Serv. 2017, 28, 261–263. [Google Scholar] [CrossRef]
- Zheng, H.; Wang, L.; Wu, T. Coordinating Ecosystem Service Trade-Offs to Achieve Win–Win Outcomes: A Review of the Approaches. J. Environ. Sci. 2019, 82, 103–112. [Google Scholar] [CrossRef]
- Li, Y.; Liu, W.; Feng, Q.; Zhu, M.; Yang, L.; Zhang, J. Quantitative Assessment for the Spatiotemporal Changes of Ecosystem Services, Tradeoff–Synergy Relationships and Drivers in the Semi-Arid Regions of China. Remote Sens. 2022, 14, 239. [Google Scholar] [CrossRef]
- Gao, C.; Hu, B.; Wang, Z.; Huang, S.; Zhang, L. Study on Spatiotemporal Changes of Ecosystem Service Trade-Offs/Synergies and Driving Mechanisms in the Key Zone of Mountain-River-Sea Coupling: A Case Study of the Southwest Guangxi Karst-Beibu Gulf. Ecol. Indic. 2024, 169, 112892. [Google Scholar] [CrossRef]
- Xue, C.; Chen, X.; Xue, L.; Zhang, H.; Chen, J.; Li, D. Modeling the Spatially Heterogeneous Relationships between Tradeoffs and Synergies among Ecosystem Services and Potential Drivers Considering Geographic Scale in Bairin Left Banner, China. Sci. Total Environ. 2023, 855, 158834. [Google Scholar] [CrossRef] [PubMed]
- Shen, J.; Li, S.; Liang, Z.; Liu, L.; Li, D.; Wu, S. Exploring the Heterogeneity and Nonlinearity of Trade-Offs and Synergies among Ecosystem Services Bundles in the Beijing-Tianjin-Hebei Urban Agglomeration. Ecosyst. Serv. 2020, 43, 101103. [Google Scholar] [CrossRef]
- Li, J.; Liu, J.; Liu, M.; Lv, X.; Dong, Z.; Yan, X. Urban Ecological Environment Evaluation and Influencing Factors Analysis at the Residential Quarter-Level in Xi’an, China. Ecol. Indic. 2024, 158, 111348. [Google Scholar] [CrossRef]
- Rodriguez-Galiano, V.F.; Ghimire, B.; Rogan, J.; Chica-Olmo, M.; Rigol-Sanchez, J.P. An Assessment of the Effectiveness of a Random Forest Classifier for Land-Cover Classification. ISPRS J. Photogramm. Remote Sens. 2012, 67, 93–104. [Google Scholar] [CrossRef]
- Liu, Y.; Li, T.; Zhao, W.; Wang, S.; Fu, B. Landscape Functional Zoning at a County Level Based on Ecosystem Services Bundle: Methods Comparison and Management Indication. J. Environ. Manag. 2019, 249, 109315. [Google Scholar] [CrossRef] [PubMed]
- Poli, G.; Cuntò, S.; Muccio, E.; Cerreta, M. A Spatial Decision Support System for Multi-Dimensional Sustainability Assessment of River Basin Districts: The Case Study of Sarno River, Italy. Land Use Policy 2024, 141, 107123. [Google Scholar] [CrossRef]
- Yang, H.; Jiang, H.; Wu, R.; Hu, T.; Wang, H. Dynamic Evolution of Multi-Scale Ecosystem Services and Their Driving Factors: Rural Planning Analysis and Optimisation. Land 2024, 13, 995. [Google Scholar] [CrossRef]
- Xu, S.; Liu, Y.; Wang, X.; Zhang, G. Scale Effect on Spatial Patterns of Ecosystem Services and Associations among Them in Semi-Arid Area: A Case Study in Ningxia Hui Autonomous Region, China. Sci. Total Environ. 2017, 598, 297–306. [Google Scholar] [CrossRef]
- Bai, Y.; Chen, Y.; Alatalo, J.M.; Yang, Z.; Jiang, B. Scale Effects on the Relationships between Land Characteristics and Ecosystem Services—A Case Study in Taihu Lake Basin, China. Sci. Total Environ. 2020, 716, 137083. [Google Scholar] [CrossRef]
- Van Jaarsveld, A.S.; Biggs, R.; Scholes, R.J.; Bohensky, E.; Reyers, B.; Lynam, T.; Musvoto, C.; Fabricius, C. Measuring Conditions and Trends in Ecosystem Services at Multiple Scales: The Southern African Millennium Ecosystem Assessment (SAfMA) Experience. Phil. Trans. R. Soc. B 2005, 360, 425–441. [Google Scholar] [CrossRef]
- Larondelle, N.; Lauf, S. Balancing Demand and Supply of Multiple Urban Ecosystem Services on Different Spatial Scales. Ecosyst. Serv. 2016, 22, 18–31. [Google Scholar] [CrossRef]
- Billaud, O.; Soubeyrand, M.; Luque, S.; Lenormand, M. Comprehensive Decision-Strategy Space Exploration for Efficient Territorial Planning Strategies. Comput. Environ. Urban Syst. 2020, 83, 101516. [Google Scholar] [CrossRef]
- Huang, S.; Wortmann, M.; Duethmann, D.; Menz, C.; Shi, F.; Zhao, C.; Su, B.; Krysanova, V. Adaptation Strategies of Agriculture and Water Management to Climate Change in the Upper Tarim River Basin, NW China. Agric. Water Manag. 2018, 203, 207–224. [Google Scholar] [CrossRef]
- Millennium Ecosystem Assessment. Ecosystems and Human Well-Being: Desertification Synthesis: A Report of the Millennium Ecosystem Assessment; Island Press: Washington, DC, USA, 2005. [Google Scholar]
- Ding, Q.; Wang, L.; Fu, M. Spatial Characteristics and Trade-Offs of Ecosystem Services in Arid Central Asia. Ecol. Indic. 2024, 161, 111935. [Google Scholar] [CrossRef]
- Feng, M.; Chen, Y.; Duan, W.; Fang, G.; Li, Z.; Jiao, L.; Sun, F.; Li, Y.; Hou, Y. Comprehensive Evaluation of the Water-Energy-Food Nexus in the Agricultural Management of the Tarim River Basin, Northwest China. Agric. Water Manag. 2022, 271, 107811. [Google Scholar] [CrossRef]
- Ling, H.; Guo, B.; Zhang, G.; Xu, H.; Deng, X. Evaluation of the Ecological Protective Effect of the “Large Basin” Comprehensive Management System in the Tarim River Basin, China. Sci. Total Environ. 2019, 650, 1696–1706. [Google Scholar] [CrossRef]
- Zhang, J.; Hao, X.; Li, X.; Fan, X.; Zhang, S. Evaluation and Regulation Strategy for Ecological Security in the Tarim River Basin Based on the Ecological Footprint. J. Clean. Prod. 2024, 435, 140488. [Google Scholar] [CrossRef]
- Yang, R.; Mu, Z.; Gao, R.; Huang, M.; Zhao, S. Interactions between Ecosystem Services and Their Causal Relationships with Driving Factors: A Case Study of the Tarim River Basin, China. Ecol. Indic. 2024, 169, 112810. [Google Scholar] [CrossRef]
- Zhang, S.; Wang, Y.; Wang, Y.; Li, Z.; Hou, Y. Spatiotemporal Evolution and Influencing Mechanisms of Ecosystem Service Value in the Tarim River Basin, Northwest China. Remote Sens. 2023, 15, 591. [Google Scholar] [CrossRef]
- Xue, L.; Wang, J.; Zhang, L.; Wei, G.; Zhu, B. Spatiotemporal Analysis of Ecological Vulnerability and Management in the Tarim River Basin, China. Sci. Total Environ. 2019, 649, 876–888. [Google Scholar] [CrossRef]
- Hu, Y.; Xue, J.; Zhao, J.; Feng, X.; Sun, H.; Tang, J.; Chang, J. Dynamic Bayesian Networks for Spatiotemporal Modeling and Its Uncertainty in Tradeoffs and Synergies of Ecosystem Services: A Case Study in the Tarim River Basin, China. Stoch. Environ. Res. Risk Assess. 2024, 38, 4311–4329. [Google Scholar] [CrossRef]
- Qiao, X.; Gu, Y.; Zou, C.; Wang, L.; Luo, J.; Huang, X. Trade-Offs and Synergies of Ecosystem Services in the Taihu Lake Basin of China. Chin. Geogr. Sci. 2018, 28, 86–99. [Google Scholar] [CrossRef]
- Haines-Young, R. Common International Classification of Ecosystem Services (CICES) V5.2 Guidance on the Application of the Revised Structure. Available online: https://cices.eu/ (accessed on 29 April 2025).
- Xu, Z.; Wei, H.; Fan, W.; Wang, X.; Zhang, P.; Ren, J.; Lu, N.; Gao, Z.; Dong, X.; Kong, W. Relationships between Ecosystem Services and Human Well-Being Changes Based on Carbon Flow—A Case Study of the Manas River Basin, Xinjiang, China. Ecosyst. Serv. 2019, 37, 100934. [Google Scholar] [CrossRef]
- Deng, C.; Shen, X.; Liu, C.; Liu, Y. Spatiotemporal Characteristics and Socio-Ecological Drivers of Ecosystem Service Interactions in the Dongting Lake Ecological Economic Zone. Ecol. Indic. 2024, 167, 112734. [Google Scholar] [CrossRef]
- Xia, H.; Yuan, S.; Prishchepov, A.V. Spatial-Temporal Heterogeneity of Ecosystem Service Interactions and Their Social-Ecological Drivers: Implications for Spatial Planning and Management. Resour. Conserv. Recycl. 2023, 189, 106767. [Google Scholar] [CrossRef]
- Xu, T.; Tian, G.; Lin, T.; Li, W.; Liu, C. Multiscale Analysis of Ecosystem Service Interactions and Driving Factors in the Loess Plateau: Implications for Ecological Management. J. Clean. Prod. 2025, 495, 145074. [Google Scholar] [CrossRef]
- Zhou, Q.; Chen, W.; Wang, H.; Wang, D. Spatiotemporal Evolution and Driving Factors Analysis of Fractional Vegetation Coverage in the Arid Region of Northwest China. Sci. Total Environ. 2024, 954, 176271. [Google Scholar] [CrossRef] [PubMed]
- Soranno, P.A.; Cheruvelil, K.S.; Bissell, E.G.; Bremigan, M.T.; Downing, J.A.; Fergus, C.E.; Filstrup, C.T.; Henry, E.N.; Lottig, N.R.; Stanley, E.H.; et al. Cross-scale Interactions: Quantifying Multi-scaled Cause–Effect Relationships in Macrosystems. Front. Ecol. Env. 2014, 12, 65–73. [Google Scholar] [CrossRef]
- Fang, Z.; Xue, S.; Zhou, Q.; Cheng, C.; Bai, Y.; Huang, Z.; Wang, J.; Wang, R.; Wang, Y.; Wu, R.; et al. Unveiling Driving Disparities between Satisfaction and Equity of Ecosystem Services in Urbanized Areas. Resour. Environ. Sustain. 2024, 18, 100176. [Google Scholar] [CrossRef]
- Cumming, G.S.; Cumming, D.H.M.; Redman, C.L. Scale Mismatches in Social-Ecological Systems: Causes, Consequences, and Solutions. Ecol. Soc. 2006, 11, art14. [Google Scholar] [CrossRef]
- Hasan, S.S.; Zhen, L.; Miah, M.G.; Ahamed, T.; Samie, A. Impact of Land Use Change on Ecosystem Services: A Review. Environ. Dev. 2020, 34, 100527. [Google Scholar] [CrossRef]
- Sargentis, G.-F.; Koutsoyiannis, D. The Function of Money in Water–Energy–Food and Land Nexus. Land 2023, 12, 669. [Google Scholar] [CrossRef]
- Deng, Q.; Sharretts, T.; Ali, T.; Ao, Y.Z.; Chiarelli, D.D.; Demeke, B.; Marston, L.; Mehta, P.; Mekonnen, M.; Rulli, M.C.; et al. Deepening Water Scarcity in Breadbasket Nations. Nat. Commun. 2025, 16, 1110. [Google Scholar] [CrossRef] [PubMed]
- Bai, Y.; Fang, Z.; Hughes, A.C. Ecological Redlines Provide a Mechanism to Maximize Conservation Gains in Mainland Southeast Asia. One Earth 2021, 4, 1491–1504. [Google Scholar] [CrossRef]
- Xue, S.; Fang, Z.; Bai, Y.; Alatalo, J.M.; Yang, Y.; Zhang, F. The next Step for China’s National Park Management: Integrating Ecosystem Services into Space Boundary Delimitation. J. Environ. Manag. 2023, 329, 117086. [Google Scholar] [CrossRef]
- Wang, Q.; Liu, C.; Hou, Y.; Xin, F.; Mao, Z.; Xue, X. Study of the Spatio-Temporal Variation of Environmental Sustainability at National and Provincial Levels in China. Sci. Total Environ. 2022, 807, 150830. [Google Scholar] [CrossRef]
- Liu, J.; Ren, Y.; He, P.; Xiao, J. Quantifying Uncertainty in Projections of Desertification in Central Asia Using Bayesian Networks. Remote Sens. 2025, 17, 665. [Google Scholar] [CrossRef]
- Wang, L.; Zheng, H.; Chen, Y.; Ouyang, Z.; Hu, X. Systematic Review of Ecosystem Services Flow Measurement: Main Concepts, Methods, Applications and Future Directions. Ecosyst. Serv. 2022, 58, 101479. [Google Scholar] [CrossRef]
- Zhao, X.; Xu, Y.; Pu, J.; Tao, J.; Chen, Y.; Huang, P.; Shi, X.; Ran, Y.; Gu, Z. Achieving the Supply-Demand Balance of Ecosystem Services through Zoning Regulation Based on Land Use Thresholds. Land Use Policy 2024, 139, 107056. [Google Scholar] [CrossRef]

Disclaimer/Publisher’s Note: The statements, opinions and data contained in all publications are solely those of the individual author(s) and contributor(s) and not of MDPI and/or the editor(s). MDPI and/or the editor(s) disclaim responsibility for any injury to people or property resulting from any ideas, methods, instructions or products referred to in the content. |
© 2025 by the authors. Licensee MDPI, Basel, Switzerland. This article is an open access article distributed under the terms and conditions of the Creative Commons Attribution (CC BY) license (https://creativecommons.org/licenses/by/4.0/).