
Exploring the Composition of Forest Collaboratives in Northeastern Oregon


Abstract
1. Introduction
- Do collaboratives with a larger number of attending organizations have a lower attendance rate?
- How does collaborative size affect stakeholder diversity among all attendees and core attendees? Are larger collaboratives more heterogeneous?
- Is greater stakeholder diversity associated with balanced representation among regular and core attendees?
- How diverse are collaboratives in terms of the locality of attending organizations, and does locality vary by collaborative size?
- What stakeholder types attend meetings of multiple forest collaborative groups?
2. Literature
3. Materials and Methods
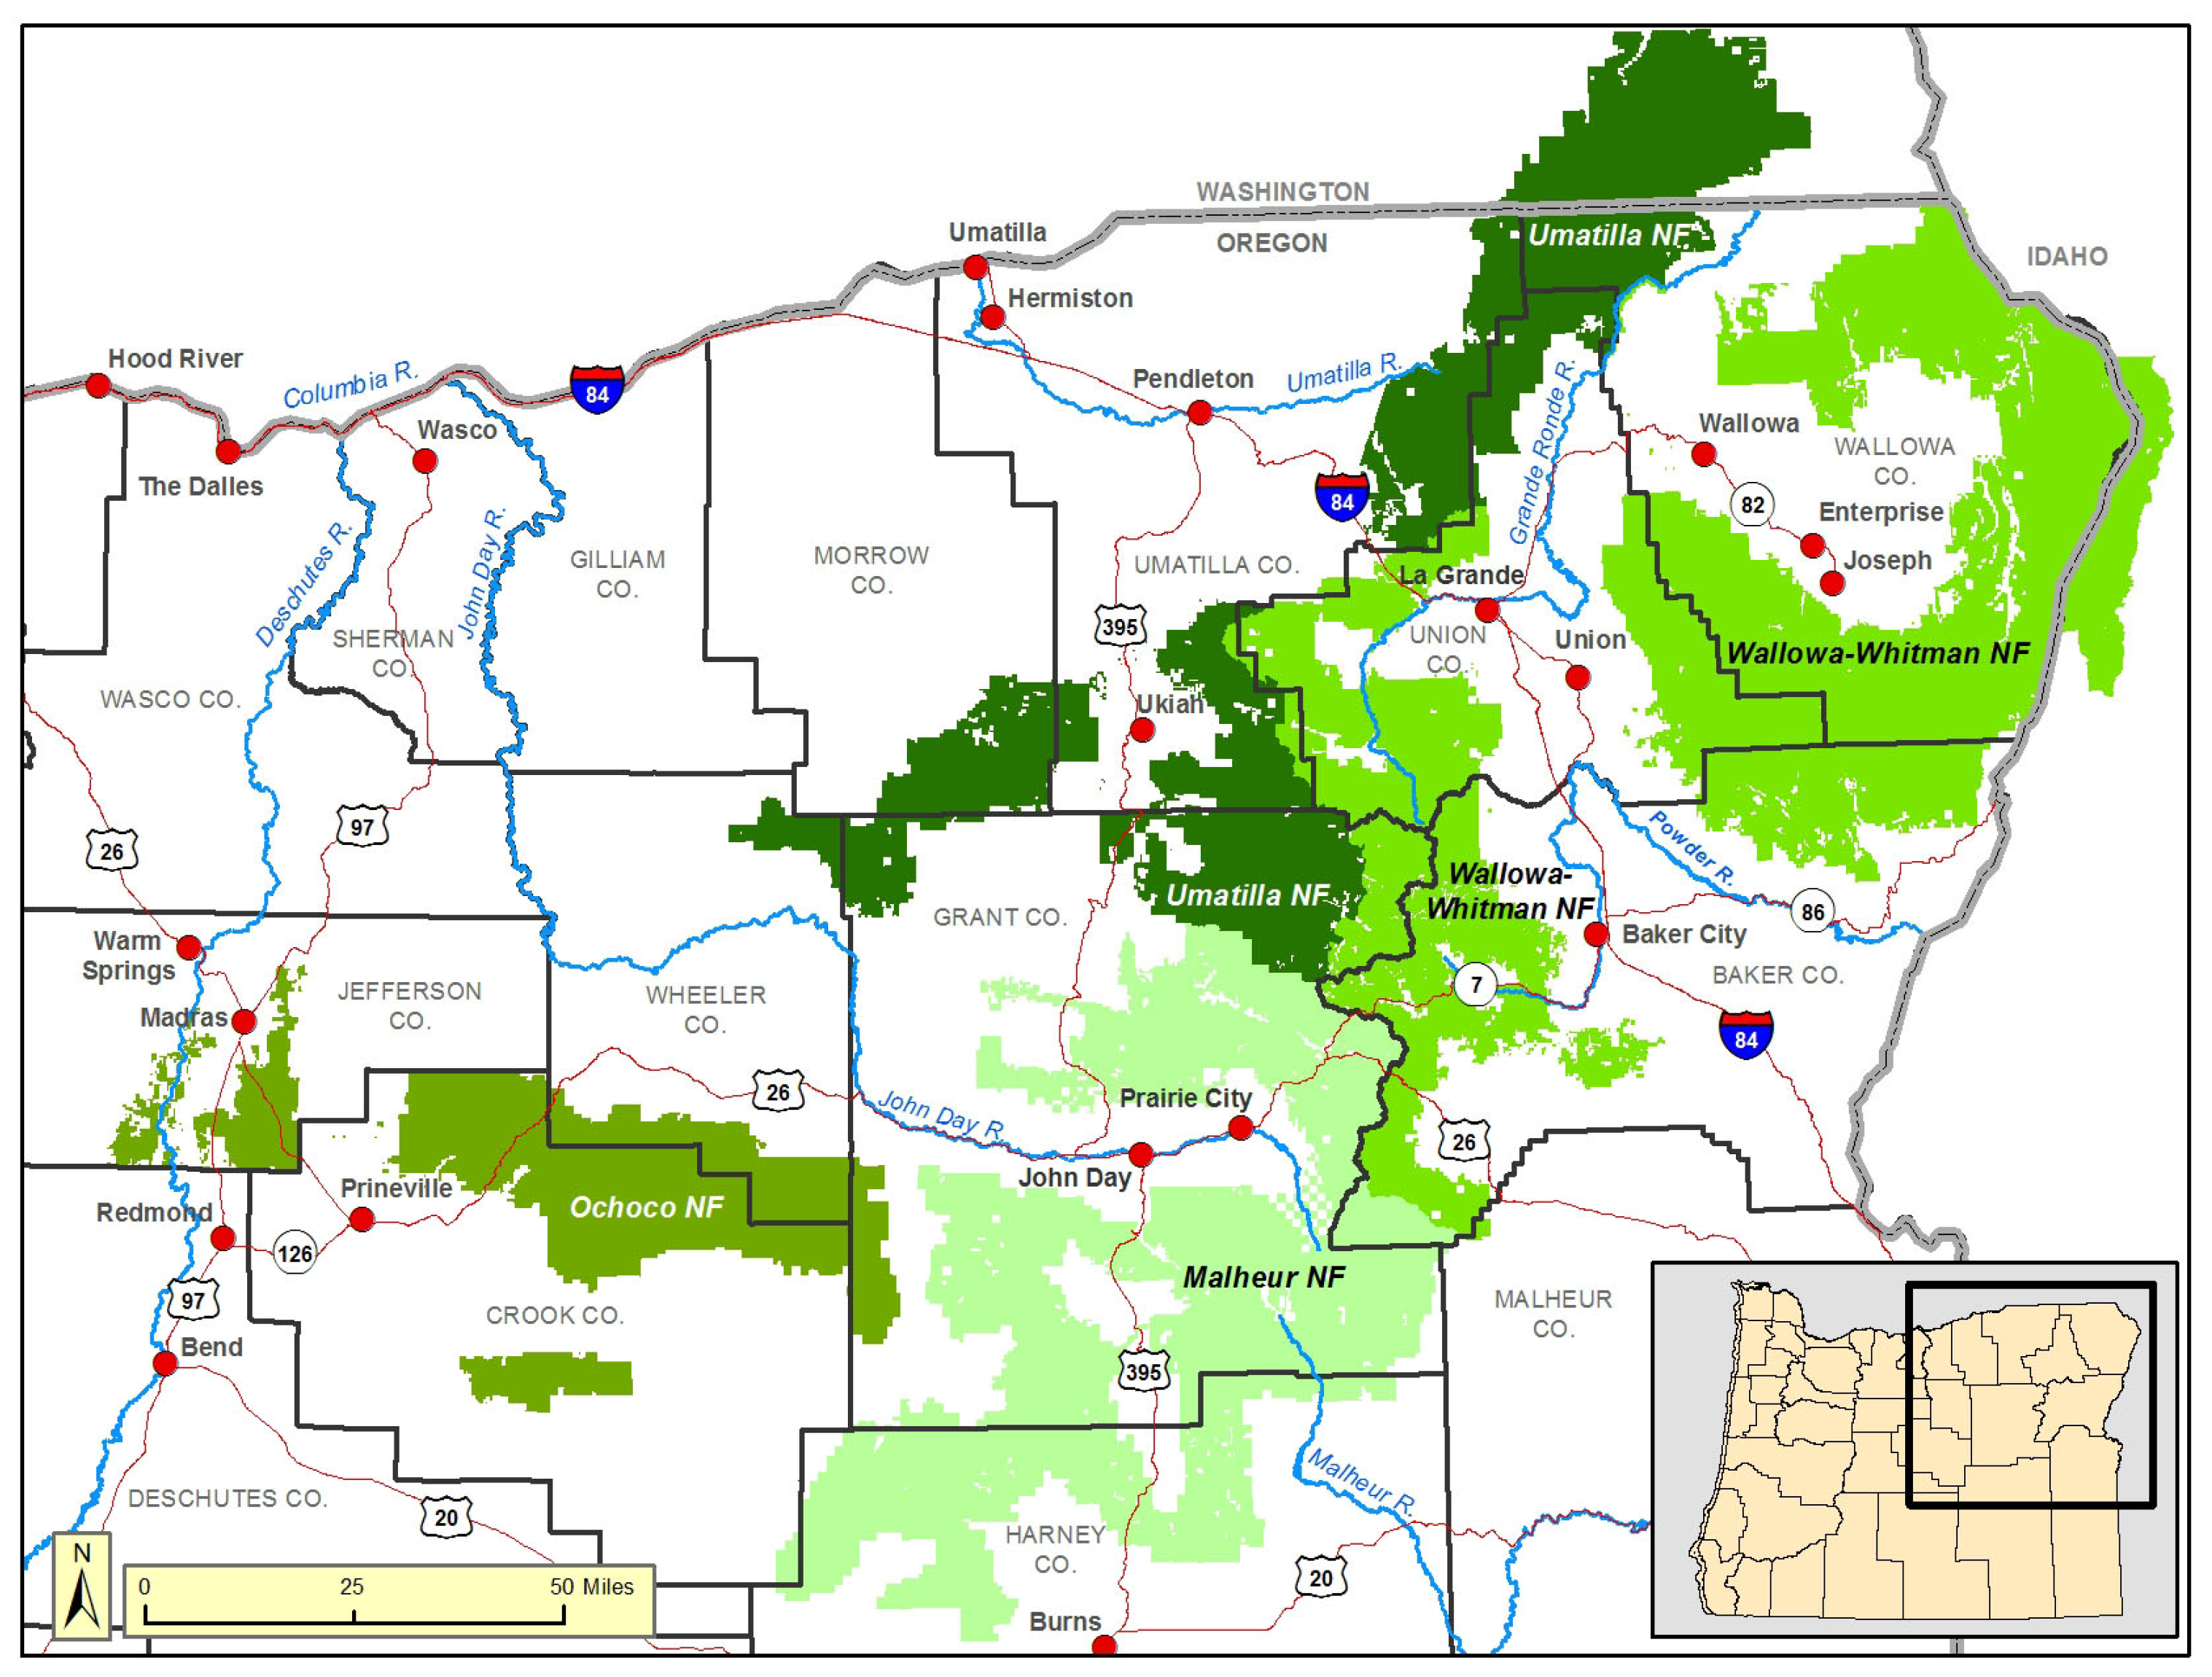
3.1. Study Context
3.2. Data Collection
3.3. Measures
- Collaborative size determined by the number of organizations whose representatives attended at least one meeting of the collaborative over the 18-month period. [This assumes that one person attended a meeting representing one organization.] We categorized collaboratives into three sizes: small (<35 organizations), medium (35–50 organizations), and large (>50 organizations).
- Stakeholder diversity is determined by examining the attendance of representing organizations across the 11 stakeholder categories (Table 2). To determine the categories, we studied organizational websites and public documents. Because of the predominant role of the USFS, we placed that agency in its own category. We recognize that some organizations may have multiple functions and that there could be different perceptions as to the category into which a group should be placed. Using the diversity ratio (the number of stakeholders represented divided by total possible stakeholders), we categorized each collaborative based on low diversity (7 or fewer stakeholders), medium diversity (8 to 9 stakeholders), and high diversity (10 or more).

| Stakeholder Category | Description |
|---|---|
| Community development | Entity focused on economic or community development. |
| Conservation | Non-governmental organization focused on natural resource protection, conservation, or clean energy. |
| Forest industry | Firm or entity involved in timber harvest, milling, or other forms of production or forest restoration. |
| Local, regional, and state agencies | Non-federal government agencies not focused on natural resource management (e.g., housing, health, and social services). |
| Public natural resource agency | Governmental agency focused on natural resources or environmental management (excludes USFS). |
| Ranching | Group engaged in livestock production or processing, grazing. |
| Recreation or access | Group focused on outdoor recreation, motorized/nonmotorized. |
| Research, education, extension | Group conducting science, education, or extension, including universities and state extension units. |
| Tribal agency | Federally recognized and non-federally recognized tribes. |
| U.S. Forest Service (USFS) | USFS participants from all levels of the agency. |
| Other | Groups representing other interests. |
- Balance is determined by comparing the number of organizations within each stakeholder category that attended at least one collaborative meeting. For example, a collaborative group would be ‘well-balanced’ if it had 3 or more organizations representing each of the 11 stakeholder categories that attended at least one meeting over the 18 month period. A collaborative group would be ‘imbalanced’ if there were some stakeholder categories with one or fewer organizations attending at least one meeting and other stakeholder categories with five or more organizations attending at least one meeting.
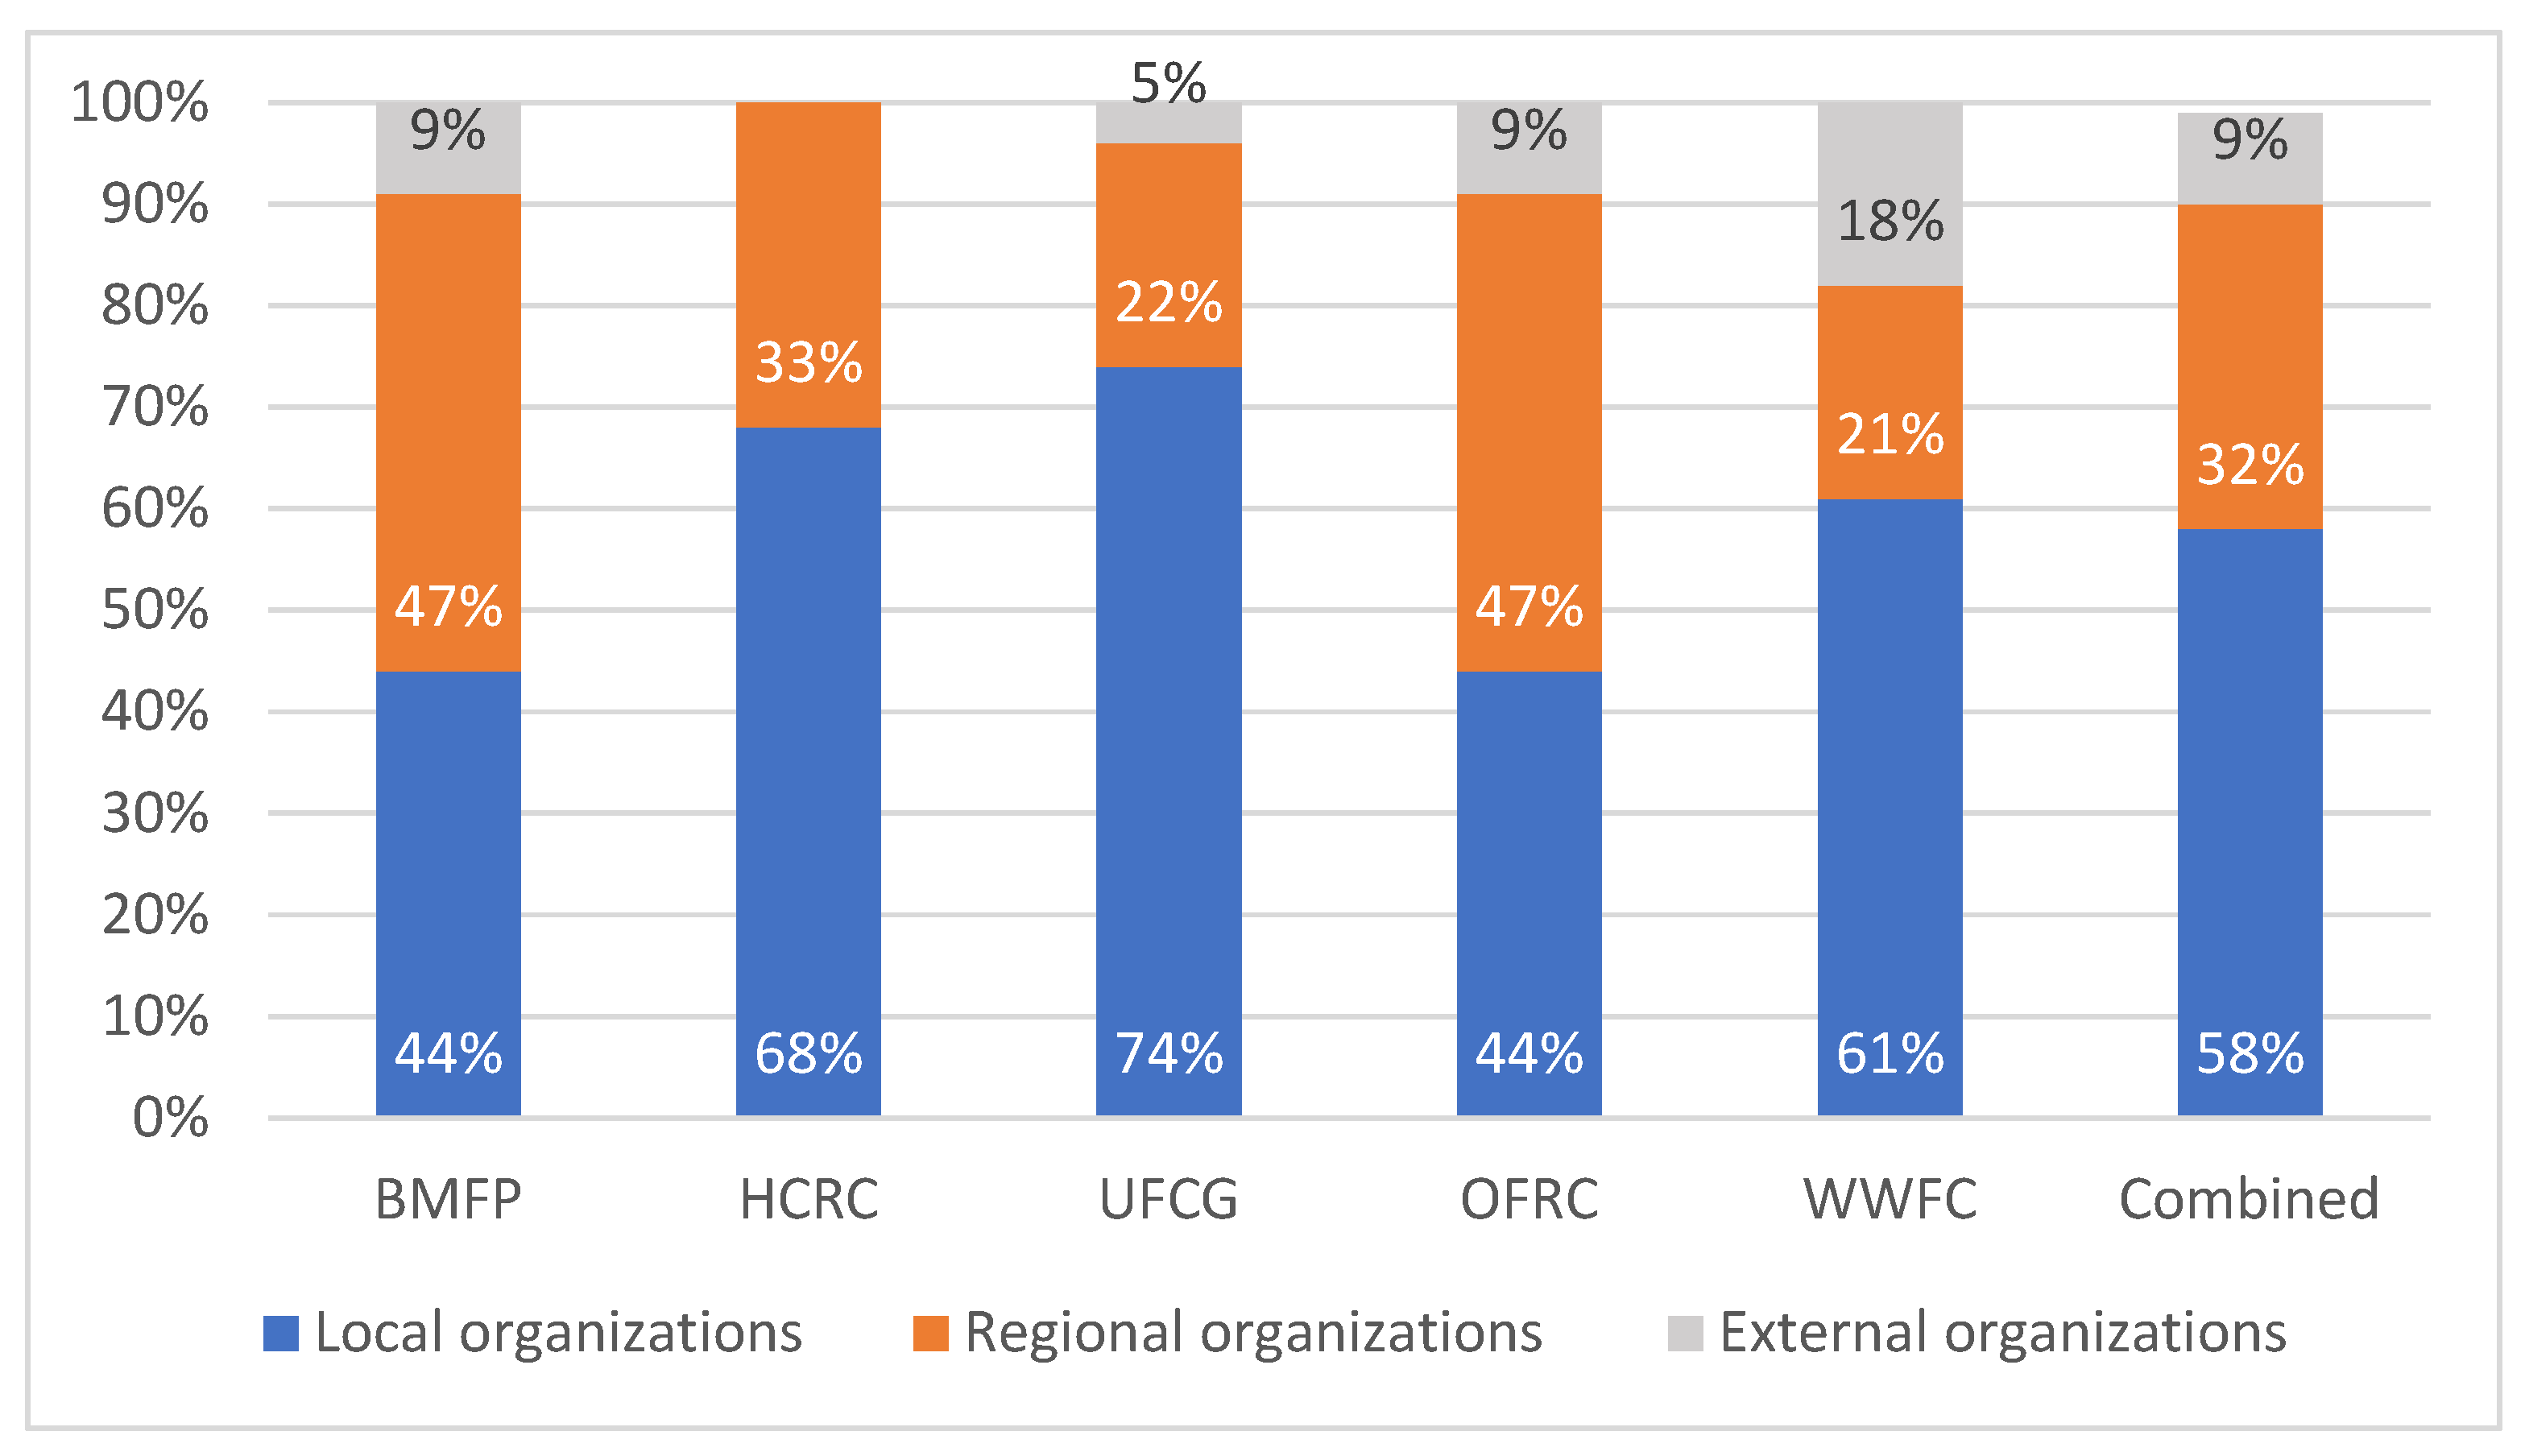
- Locality–diversity was determined based on the location of the organization’s headquarters within the study area. We grouped organizations into three categories: local, non-local in Oregon, and non-local outside Oregon (out-of-state). ‘Local organizations’ are those organizations with an office in one of the counties associated with the collaborative group. For BMFP and HCFC, the local counties were Grant and Harney. For UFCG, the local counties were Umatilla, Grant, Wheeler, and Union. For OFRC, the local counties were Crook, Wheeler, and Grant. For WWFC, the local counties were Wallowa, Baker, and Union. Regional organizations are organizations with offices elsewhere in Oregon. ‘External’ organizations constituted those organizations whose headquarters and operations were based outside Oregon. In cases when an organization’s headquarters was non-local, but a branch office existed in one of the local counties, we categorized the organization as local.
- Core attendance is determined based on an organizational representative attending 50% or more of the collaborative’s organized events over an 18 month period. Organizations whose representatives are frequent attendees at collaborative meetings and events suggest active participation and enhanced ability to influence outcomes.
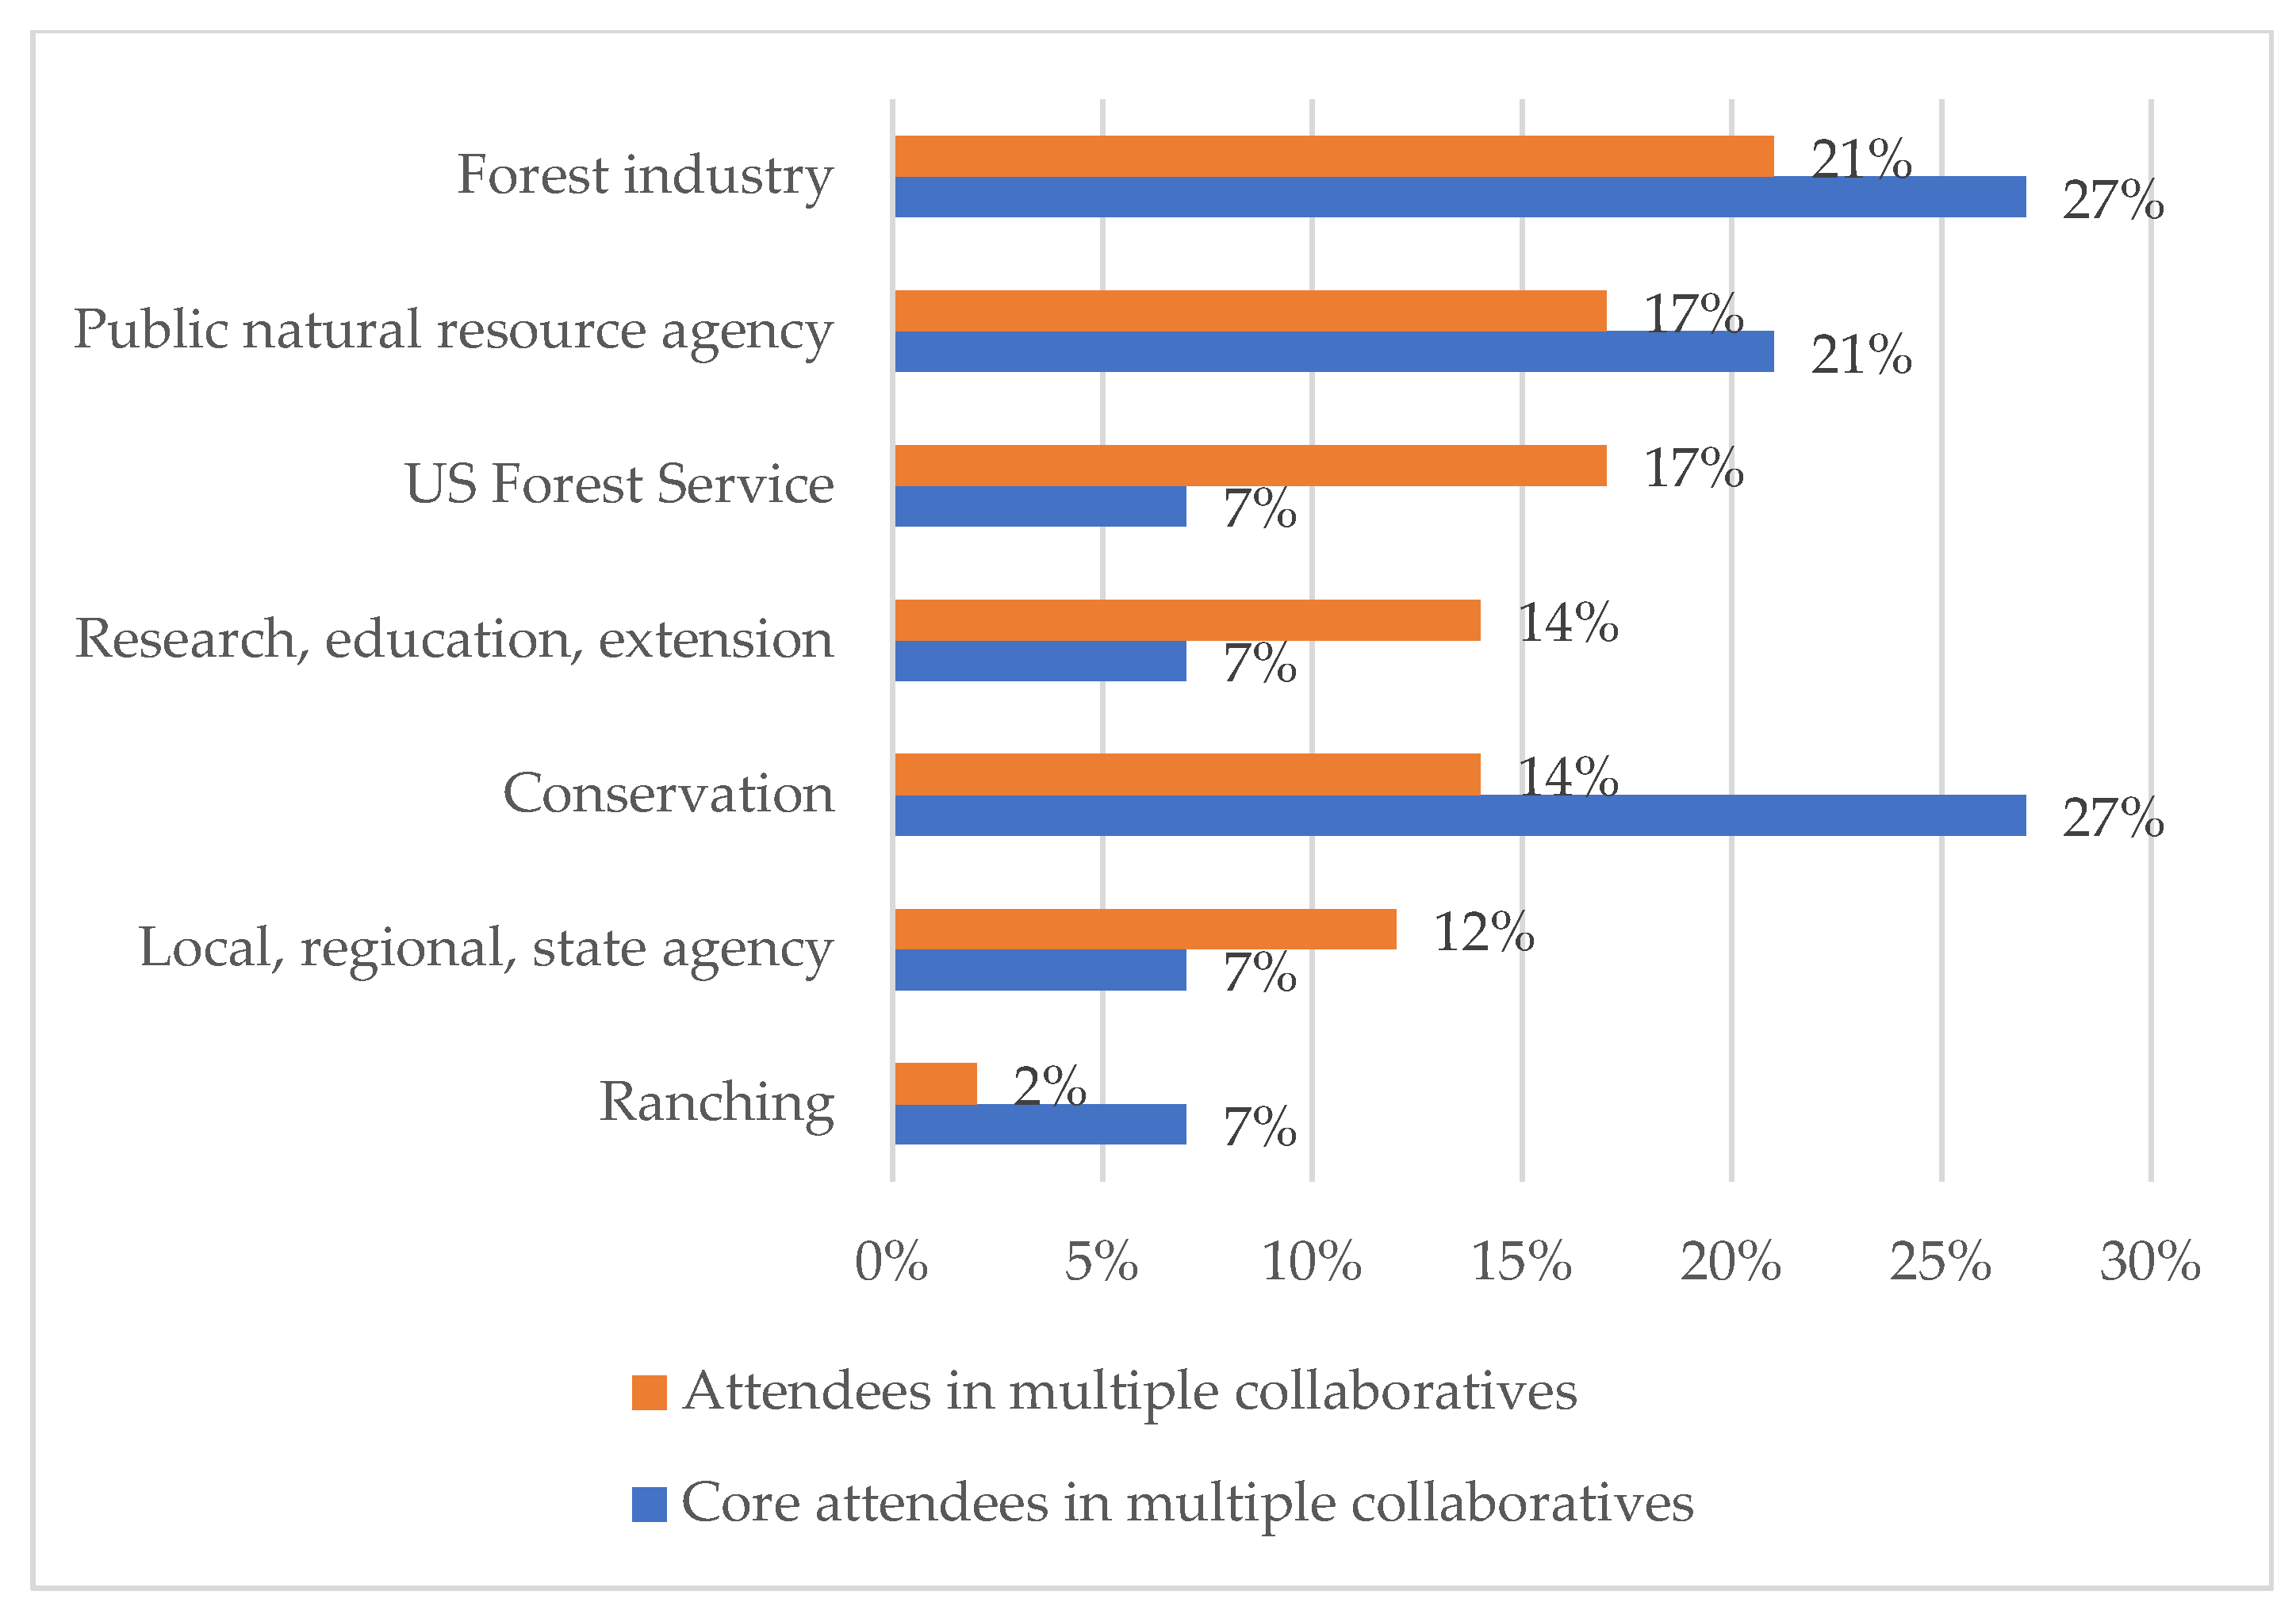
- Cross-participation was determined by examining organizations that attended multiple (two or more) collaborative group meetings over the 18-month period.
3.4. Data Limitations
4. Results
4.1. Collaborative Size, Event Frequency, and Attendance
4.2. Stakeholder Diversity
4.3. Collaborative Balance Across Stakeholder Categories
4.4. Participation by Locality
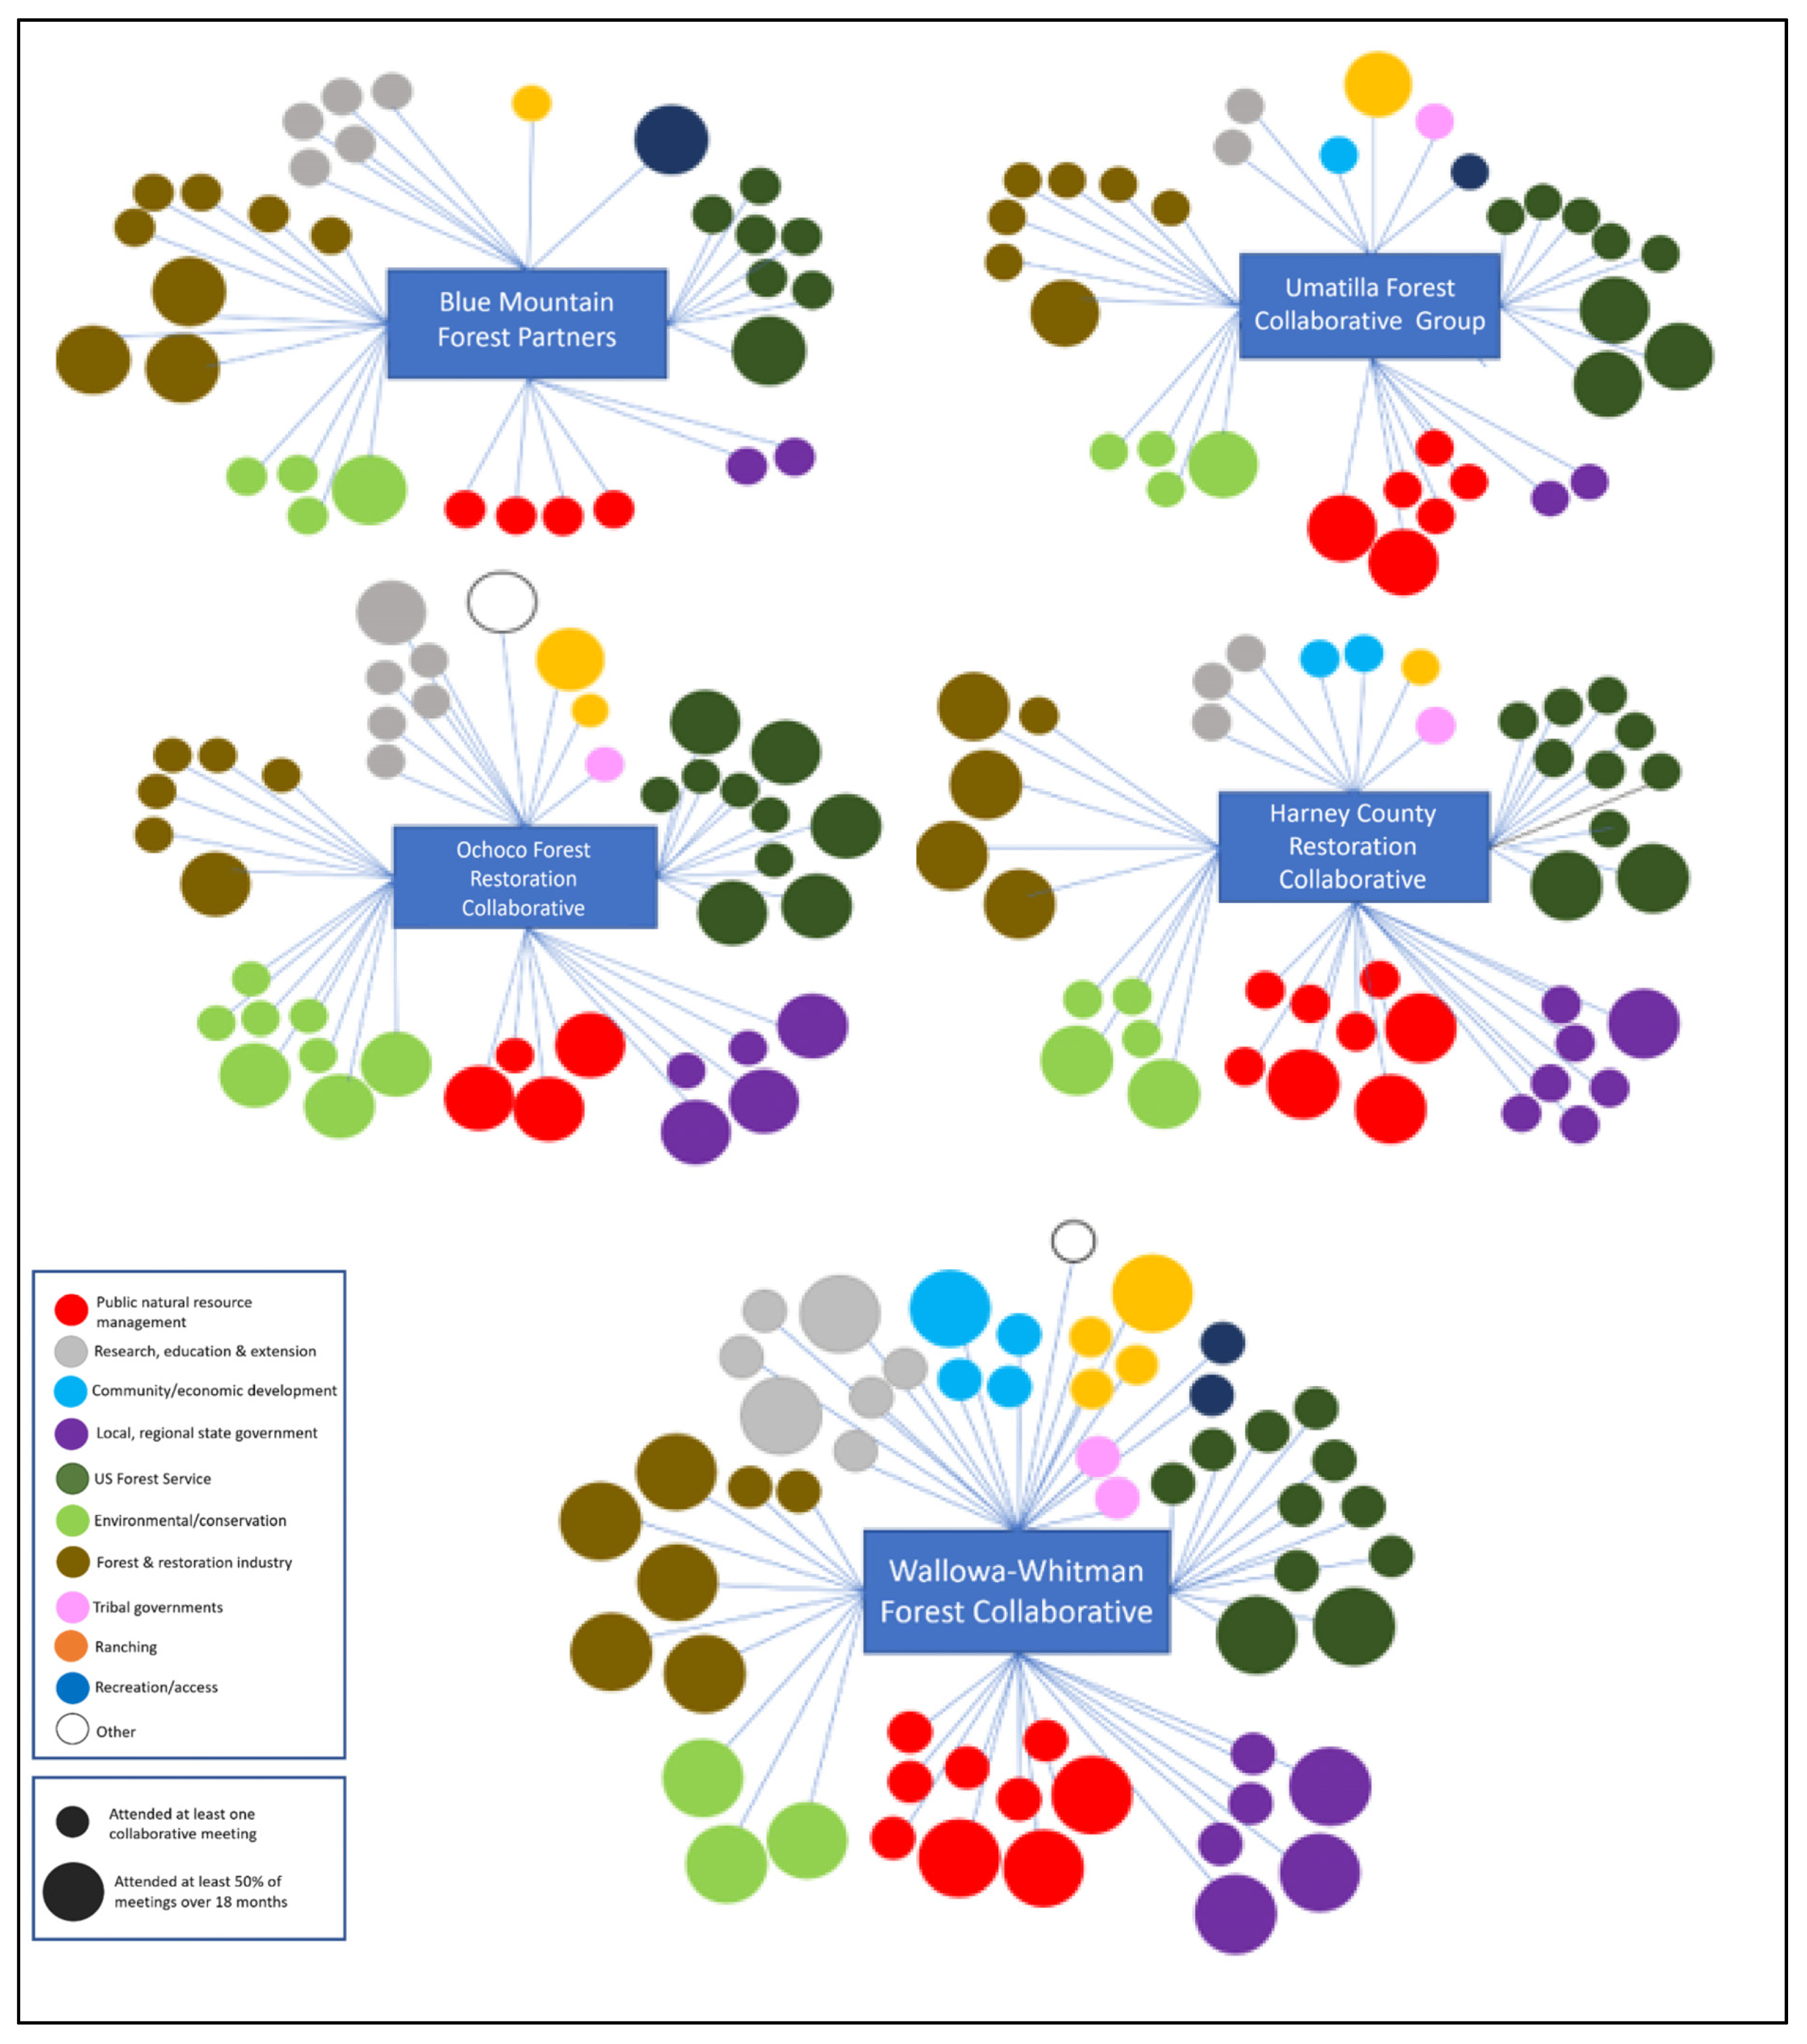
4.5. Collaborative Cross-Participation
5. Discussion
5.1. Collaborative Size and Attendance Patterns
5.2. Stakeholder Diversity Across Forest Collaboratives
5.3. Collaborative Balance
5.4. Locality–Diversity
5.5. Cross-Participation and Bridging Organizations
5.6. Management Implications
5.7. Study Limitations and Future Research
6. Conclusions
Author Contributions
Funding
Data Availability Statement
Acknowledgments
Conflicts of Interest
Abbreviations
| USFS | United States Forest Service |
| CFLR | Collaborative Forest Landscape Restoration |
| BMFP | Blue Mountain Forest Partners |
| WWFC | Wallowa–Whitman Forest Collaborative |
| UFCG | Umatilla Forest Collaborative Group |
| HCRC | Harney County Restoration Collaborative |
| OFRC | Ochoco Forest Restoration Collaborative |
References
- Petheram, R.J.; Stephen, P.; Gilmour, D. Collaborative forest management: A review. Aust. For. 2004, 67, 137–146. [Google Scholar] [CrossRef]
- European Commission. A New EU Forest Strategy: For Forests and the Forest-Based Sector; European Commission: Brussels, Belgium, 2013; COM, 659 final; Available online: https://eur-lex.europa.eu/resource.html?uri=cellar:21b27c38-21fb-11e3-8d1c-01aa75ed71a1.0022.01/DOC_1&format=PDF (accessed on 17 June 2025).
- Lazdinis, M.; Angelstam, P.; Pülzl, H. Towards sustainable forest management in the European Union through polycentric forest governance and an integrated landscape approach. Landsc. Ecol. 2019, 34, 1737–1749. [Google Scholar] [CrossRef]
- Bhatia, N.K.; Yousuf, M. Reassuring livelihood functions of the forests to their dependents: Adoption of collaborative forest management system over Joint forest management regime in India. Ann. For. Res. 2013, 56, 377–388. [Google Scholar]
- Borrini, G.; Kothari, A.; Oviedo, G. Indigenous and Local Communities and Protected Areas; Towards equity and enhanced conservation: Guidance on policy and practice for co-managed protected areas and community conserved areas; IUCN: Gland, Switzerland, 2004; Available online: https://ceeto-network.eu/content/iucn_indigenous_and_local_communities_and_protected_areas_towards_equity_and_enhanced_conservation_2004.pdf (accessed on 17 June 2025).
- Jacobs, K. Teams at their core: Implementing an ALL LANDS approach to conservation requires focusing on relationships, teamwork process, and communications. Forests 2017, 8, 246. [Google Scholar] [CrossRef]
- Butler, W.H.; Monroe, A.; McCaffrey, S. Collaborative implementation for ecological restoration on US public lands: Implications for legal context, accountability, and adaptive management. Environ. Manag. 2015, 55, 564–577. [Google Scholar] [CrossRef]
- McIntyre, K.B.; Schultz, C.A. Facilitating collaboration in forest management: Assessing the benefits of collaborative policy innovations. Land Use Policy 2020, 96, 104683. [Google Scholar] [CrossRef]
- Wilkins, K.; Pejchar, L.; Carroll, S.L.; Jones, M.S.; Walker, S.E.; Shinbrot, X.A.; Huayhuaca, C.A.; Fernandez-Gimenez, M.E.; Reid, R.S. Collaborative conservation in the United States: A review of motivations, goals, and outcomes. Biodivers. Conserv. 2021, 259, 109165. [Google Scholar] [CrossRef]
- Nie, M. The Forest Service’s 2012 Planning Rule and its implementation: Federal advisory committee member perspectives. J. For. 2018, 117, 64–71. [Google Scholar] [CrossRef]
- Monroe, A.S.; Butler, W.H. Responding to a policy mandate to collaborate: Structuring collaboration in the collaborative forest landscape restoration program. J. Environ. Plan Manag. 2016, 59, 1054–1072. [Google Scholar] [CrossRef]
- Fernández-Giménez, M.E.; Augustine, D.J.; Porensky, L.M.; Wilmer, H.; Derner, J.D.; Briske, D.D.; Stewart, M.O. Complexity fosters learning in collaborative adaptive management. Ecol. Soc. 2019, 24, 21. [Google Scholar] [CrossRef]
- Beeton, T.A.; Cheng, A.S.; Colavito, M.M. Cultivating collaborative resilience to social and ecological change: An assessment of adaptive capacity, actions, and barriers among collaborative forest restoration groups in the United States. J. For. 2022, 120, 316–335. [Google Scholar] [CrossRef]
- Koontz, T.M.; Newig, J. From planning to implementation: Top-down and bottom-up approaches for collaborative watershed management. Policy Stud. J. 2014, 42, 416–442. [Google Scholar] [CrossRef]
- Mattor, K.M.; Cheng, A.S.; Kittler, B.; McDonough, M. Assessing collaborative governance outcomes and indicators across spatial and temporal scales: Stewardship contract implementation by the United States Forest Service. Soc. Nat. Resour. 2020, 33, 484–503. [Google Scholar] [CrossRef]
- Yoon, N.; Fields, K.; Cochran, B.; Nabatchi, T. Collaborative governance at scale: Examining the regimes, platforms, and system in the state of Oregon. Am. Rev. Public Adm. 2022, 52, 439–456. [Google Scholar] [CrossRef]
- Margerum, R.D. Beyond Consensus: Improving Collaborative Planning and Management; MIT Press: Cambridge, MA, USA, 2011. [Google Scholar]
- Ansell, C.; Gash, A. Collaborative governance in theory and practice. J. Public Adm. Res. Theory 2008, 18, 543–571. [Google Scholar] [CrossRef]
- Bodin, Ö.; Sandström, A.; Crona, B. Collaborative networks for effective ecosystem-based management: A set of working hypotheses. Policy Stud. J. 2017, 45, 289–314. [Google Scholar] [CrossRef]
- Coleman, K.; Stern, M.J. Exploring the functions of different forms of trust in collaborative natural resource management. Soc. Nat. Resour. 2018, 31, 21–38. [Google Scholar] [CrossRef]
- Davis, E.J.; Cerveny, L.K.; Ulrich, D.R.; Nuss, M.L. Making and breaking trust in forest collaborative groups. Humboldt J. Soc. Relat. 2018, 40, 211–231. [Google Scholar] [CrossRef]
- Burgos, A.; Mertens, F. Collaborative governance networks: Exploring governance success in large-scale conservation. Ambiente Soc. 2022, 25, e0110. [Google Scholar] [CrossRef]
- Wyborn, C.; Bixler, R.P. Collaboration and nested environmental governance: Scale dependency, scale framing, and cross-scale interactions in collaborative conservation. J. Environ. Manag. 2013, 15, 58–67. [Google Scholar] [CrossRef]
- Abrams, J.; Davis, E.J.; Moseley, C. Community-based organizations and institutional work in the remote rural west. Rev. Policy Res. 2015, 32, 675–698. [Google Scholar] [CrossRef]
- McIver, C.P.; Becker, D.R. An empirical evaluation of the impact of collaboration on the pace and scale of national forest management in Idaho. For. Sci. 2021, 67, 49–59. [Google Scholar] [CrossRef]
- Swette, B.; Huntsinger, L.; Lambin, E.F. Collaboration in a polarized context: Lessons from public forest governance in the American West. Ecol. Soc. 2023, 28, 29. [Google Scholar] [CrossRef]
- Dobbin, K.B.; Kuo, M.; Lubell, M.; Bostic, D.; Mendoza, J.; Echeveste, E. Drivers of (in) equity in collaborative environmental governance. Policy Stud. J. 2023, 51, 375–395. [Google Scholar] [CrossRef]
- Margerum, R.D. Overcoming locally based collaboration constraints. Soc. Nat. Resour. 2007, 20, 135–152. [Google Scholar] [CrossRef]
- Carboni, J.L.; Siddiki, S.; Koski, C.; Sadiq, A. Using network analysis to identify key actors in collaborative governance processes. Nonprofit Policy Forum 2017, 8, 133–145. [Google Scholar] [CrossRef]
- Ansell, C.; Torfing, J. How does collaborative governance scale? Policy Politics 2015, 43, 315–329. [Google Scholar] [CrossRef]
- Orth, P.B.; Cheng, A.S. Who’s in charge? The role of power in collaborative governance and forest management. Humboldt J. Soc. Relat. 2018, 1, 191–210. [Google Scholar] [CrossRef]
- Koski, C.; Siddiki, S.; Sadiq, A.-A.; Carboni, J. Representation in collaborative governance: A case study of a food policy council. Am. Rev. Public Adm. 2018, 48, 359–373. [Google Scholar] [CrossRef]
- Davis, E.J.; White, E.M.; Cerveny, L.K.; Seesholtz, D.; Nuss, M.L.; Ulrich, D.R. Comparison of USDA Forest Service and stakeholder motivations and experiences in collaborative federal forest governance in the western United States. Environ. Manag. 2017, 60, 908–921. [Google Scholar] [CrossRef]
- Davis, E.J.; Santo, A.; White, E.M. Collaborative capacity and outcomes from Oregon’s Federal Forest Restoration Program. Ecosystem Workforce Program Working Paper Number 92. 2019, University of Oregon and Oregon State University. Available online: https://www.oregon.gov/odf/working/Documents/collaborative-capacity-outcomes-from-oregon-ffr.pdf (accessed on 1 May 2025).
- Abrams, J. The emergence of network governance in US National Forest Administration: Causal factors and propositions for future research. For. Policy Econ. 2019, 106, 101977. [Google Scholar] [CrossRef]
- Fernandez-Gimenez, M.E.; Ballard, H.L.; Sturtevant, V.E. Adaptive management and social learning in collaborative and community-based monitoring: A study of five community-based forestry organizations in the western USA. Ecol. Soc. 2008, 13, 22. [Google Scholar] [CrossRef]
- Buuren, A. Knowledge for governance, governance of knowledge: Inclusive knowledge management in collaborative governance processes. Int. Public Manag. J. 2009, 12, 208–235. [Google Scholar] [CrossRef]
- Adade Williams, P.; Sikutshwa, L.; Shackleton, S. Acknowledging indigenous and local knowledge to facilitate collaboration in landscape approaches—Lessons from a systematic review. Land 2020, 9, 331. [Google Scholar] [CrossRef]
- Cheng, A.S.; Sturtevant, V.E. A Framework for Assessing Collaborative Capacity in Community-Based Public Forest Management. Environ. Manag. 2012, 49, 675–689. [Google Scholar] [CrossRef]
- Goldstein, B.E.; Butler, W.H. Expanding the scope and impact of collaborative planning. J. Am. Plan. Assoc. 2010, 76, 238–249. [Google Scholar] [CrossRef]
- Bidwell, R.D.; Ryan, C.M. Collaborative partnership design: The implications of organizational affiliation for watershed partnerships. Soc. Nat. Resour. 2009, 19, 827–843. [Google Scholar] [CrossRef]
- Urgenson, L.S.; Ryan, C.M.; Halpern, C.B.; Bakker, J.D.; Belote, R.T.; Franklin, J.F.; Haugo, R.D.; Nelson, C.R.; Waltz, A.E. Visions of restoration in fire-adapted forest landscapes: Lessons from the Collaborative Forest Landscape Restoration Program. Environ. Manag. 2017, 59, 338–353. [Google Scholar] [CrossRef]
- Poteete, A.R.; Ostrom, E. Heterogeneity, group size and collective action: The role of institutions in forest management. Dev. Change 2004, 35, 435–461. [Google Scholar] [CrossRef]
- Scott, R.J.; Merton, E.R. When the going gets tough, the goal-committed get going: Overcoming the transaction costs of inter-agency collaborative governance. Public Manag. Rev. 2021, 23, 1640–1663. [Google Scholar] [CrossRef]
- Ansell, C.; Doberstein, C.; Henderson, H.; Siddiki, S.; ‘t Hart, P. Understanding inclusion in collaborative governance: A mixed methods approach. Policy Soc. 2020, 39, 570–591. [Google Scholar] [CrossRef]
- Agrawal, A.; Goyal, S. Group size and collective action: Third-party monitoring in common-pool resources. Comp. Political Stud. 2001, 34, 63–93. [Google Scholar] [CrossRef]
- Ostrom, E. Self-Governance and Forest Resources; CIFOR Occasional Paper Number 20; Center for International Forestry Research: Bogor, Indonesia, 1999; Available online: https://dlc.dlib.indiana.edu/dlcrest/api/core/bitstreams/1725cc01-fcbf-4293-8198-d528ee9fab0a/content (accessed on 1 May 2025).
- Koontz, T.M.; Johnson, E.M. One size does not fit all: Matching breadth of stakeholder participation to watershed group accomplishments. Policy Sci. 2004, 37, 185–204. [Google Scholar] [CrossRef]
- Scott, T. Does collaboration make any difference? Linking collaborative governance to environmental outcomes. J. Policy Anal. Manag. 2015, 34, 537–566. [Google Scholar] [CrossRef]
- Siddiki, S.; Kim, J.; Leach, W.D. Diversity, trust, and social learning in collaborative governance. Public Adm. Rev. 2017, 77, 863–874. [Google Scholar] [CrossRef]
- Siddiki, S.; Ambrose, G. Evaluating change in representation and coordination in collaborative governance over time: A study of environmental justice councils. Environ. Manag. 2022, 71, 620–640. [Google Scholar] [CrossRef]
- Jamal, T.; Stronza, A. Collaboration theory and tourism practice in protected areas: Stakeholders, structuring and sustainability. J. Sustain. Tour. 2009, 17, 169–189. [Google Scholar] [CrossRef]
- Schultz, C.A.; Jedd, T.; Beam, R.D. The Collaborative Forest Landscape Restoration Program: A history and overview of the first projects. J. For. 2012, 110, 381–391. [Google Scholar] [CrossRef]
- Medema, W.; Adamowski, J.; Orr, C.; Furber, A.; Wals, A.; Milot, N. Building a foundation for knowledge co-creation in collaborative water governance: Dimensions of stakeholder networks facilitated through bridging organizations. Water 2017, 9, 60. [Google Scholar] [CrossRef]
- U.S. Census Bureau. Quick Facts. 2021. Available online: https://www.census.gov/quickfacts/ (accessed on 1 May 2025).
- Hibbard, M.; Senkyr, L.; Webb, M. Multifunctional rural regional development: Evidence from the John Day watershed in Oregon. J. Plan. Educ. Res. 2015, 35, 51–62. [Google Scholar] [CrossRef]
- Hamilton, L.C.; Hartter, J.; Safford, T.G.; Stevens, F.R. Rural environmental concern: Effects of position, partisanship, and place. Rural. Sociol. 2014, 79, 257–281. [Google Scholar] [CrossRef]
- Oregon Solutions. Oregon Forest Collaboratives: Statewide Inventory. Prepared for the Federal Forestlands Advisory Committee–Implementation Working Group of the Oregon Board of Forestry. 2013. Available online: https://orsolutions.org/wp-content/uploads/2011/08/OFCSI_Draft_February_20131.pdf (accessed on 1 May 2025).
- Emerson, K.; Nabatchi, T.; Balogh, S. An integrative framework for collaborative governance. J. Public Adm. Res. Theory 2012, 22, 1–29. [Google Scholar] [CrossRef]
- Coleman, K.J.; Butler, W.H.; Stern, M.J.; Beck, S.L. They’re Constantly Cycling Through: Lessons about Turnover and Collaborative Forest Planning. J. For. 2021, 119, 1–12. [Google Scholar] [CrossRef]
- Lockwood, M.; Davidson, J.; Curtis, A.; Stratford, E.; Griffith, R. Governance principles for natural resource management. Soc. Nat. Resour. 2010, 23, 986–1001. [Google Scholar] [CrossRef]
- Bishop, E.M. Enviro Groups Withdraw from Forest Collaborative. Wallowa County Chieftain. 24 June 2020. Available online: https://www.union-bulletin.com/news/enviro-groups-withdraw-from-forest-collaborative/article_0aaaa1c1-1728-531f-a142-ee58011adb7b.html (accessed on 1 May 2025).
- Gbadebo, B. Oregon Wild, Sierra Club Withdraw from Ochoco Forest Restoration Collaborative. KTVZ News. 2022, 9 March 2022. Available online: https://ktvz.com/news/environment/2022/03/09/oregon-wild-sierra-club-withdraw-from-ochoco-forest-restoration-collaborative-cite-concerns/ (accessed on 1 May 2025).
- Lee, J.; Baggio, J. Promises and limits of community-based organizations in bridging mismatches of scale: A case study on collaborative governance on federal lands. Ecol. Soc. 2021, 26, 7. [Google Scholar] [CrossRef]
- Stewart, J.; Tyler, M.E. Bridging organizations and strategic bridging functions in environmental governance and management. Int. J. Water Resour. Dev. 2019, 35, 71–94. [Google Scholar] [CrossRef]
| Element | Description |
|---|---|
| Size | The total number of organizations whose representatives attended at least one meeting of the collaborative over the study period. |
| Stakeholder diversity | The proportion of stakeholder categories represented in the collaborative. |
| Balance | The relative frequency of organizations within each stakeholder category that attended a collaborative meeting over the study period. |
| Locality–diversity | The number of organizations attending collaborative meetings from local, regional (non-local, within state), and external (non-local, out of state) divided by the total number of organizations. |
| Core attendance | Percentage of organizations whose representatives attended 50 percent or more collaborative meetings over the study period. |
| Cross-participation | Percentage of organizations that attended meetings of multiple (two or more) collaborative groups within the study region over the study period. |
| Characteristic | BMFP | HCRC | UFCG | OFRC | WWFC | Average |
|---|---|---|---|---|---|---|
| Total number of events held (meetings, field trips) | 23 | 5 | 13 | 16 | 14 | 14 |
| Average number of attendees per event | 12 | 20 | 25 | 21 | 12 | 18 |
| Attendees (attended at least one event) | 31 | 33 | 42 | 43 | 57 | 41 |
| Attendance ratio (attendees per event based on total attendees) | 39% | 60% | 60% | 49% | 21% | 44% |
| Core attendees-attended at least 50% of collaborative events (percent of total attendees) | 5 (16%) | 9 (27%) | 12 (29%) | 18 (42%) | 20 (35%) | 13 (32%) |
| Collaborative Group | Number of Stakeholder Categories | Diversity Ratio | Diversity Category | Total Attendees | Size Category |
|---|---|---|---|---|---|
| BMFP | 7 | 0.64 | Low | 31 | Small |
| HCRC | 10 | 0.91 | High | 33 | Small |
| UFCG | 9 | 0.82 | Medium | 42 | Medium |
| OFRC | 9 | 0.82 | Medium | 43 | Medium |
| WWFC | 11 | 1.00 | High | 57 | Large |
| Average | 9 | 0.82 | 41 |
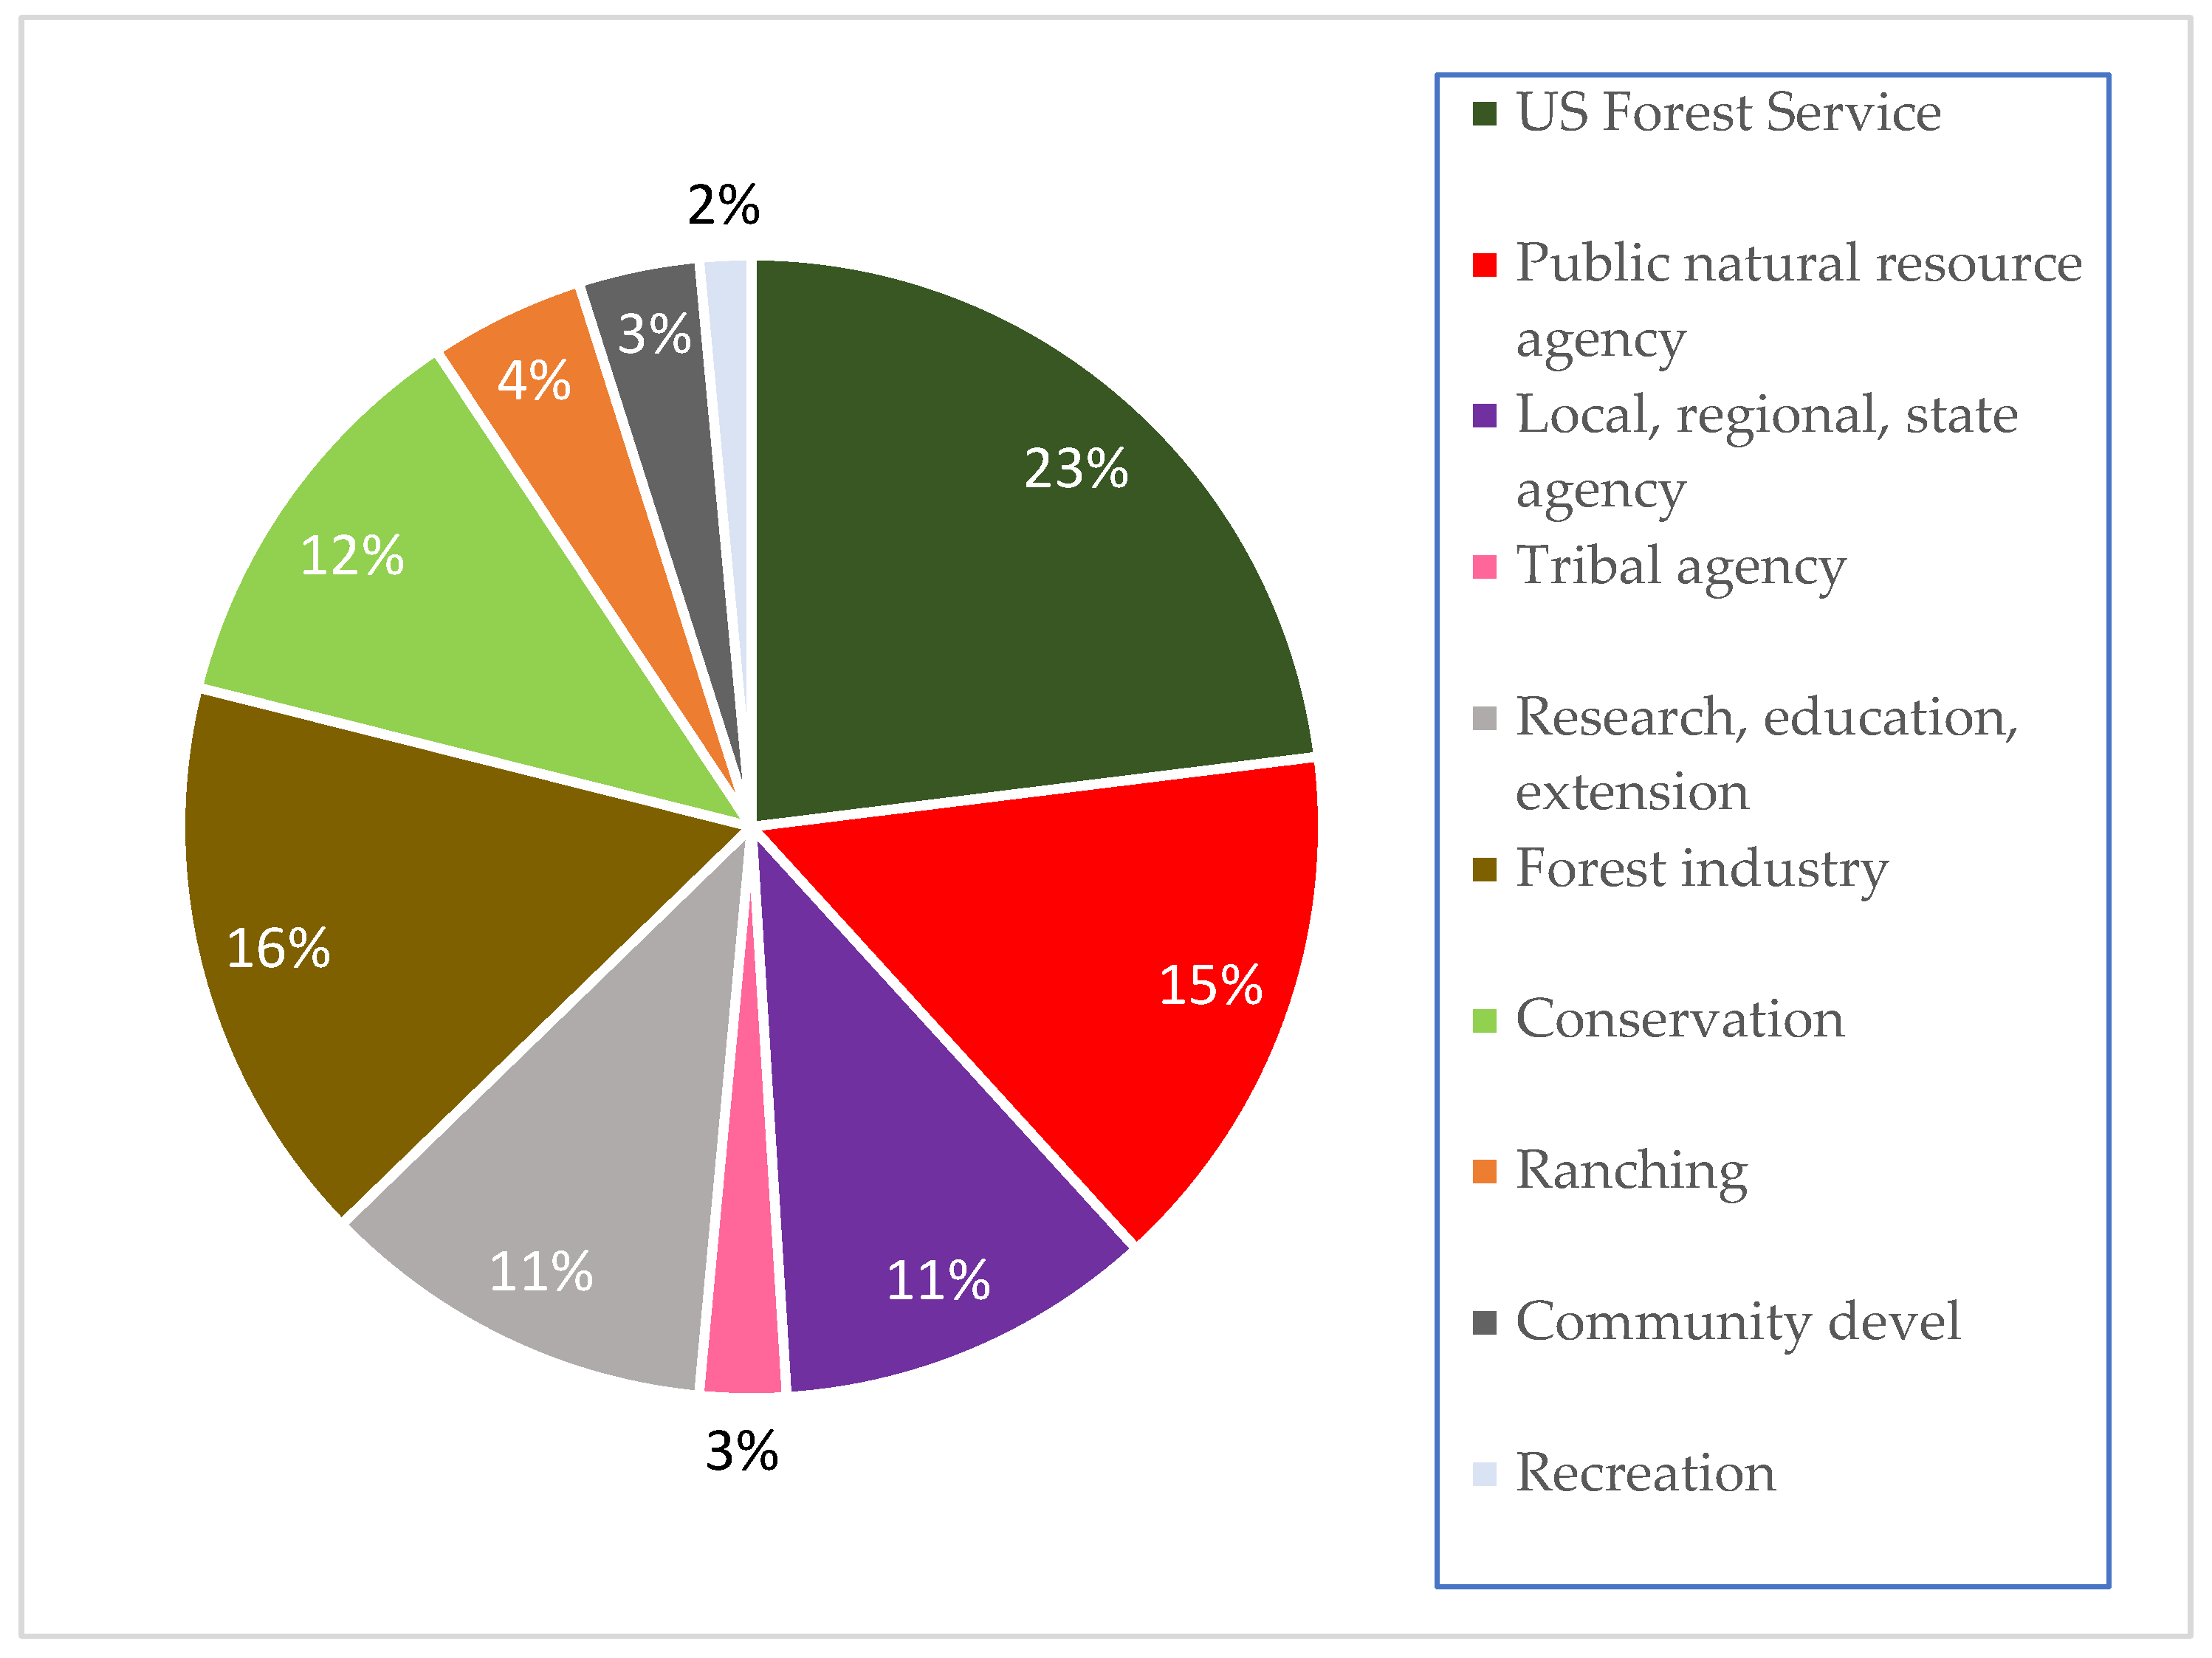
| Stakeholder Category | BMFP | HCRC | UFCG | OFRC | WWFC |
|---|---|---|---|---|---|
| US Forest Service | 7 (23%) | 8 (24%) | 10 (24%) | 11 (25%) | 11(19%) |
| Public natural resource agency | 4 (13%) | 6 (18%) | 8 (19%) | 4 (9%) | 9 (16%) |
| Local, regional, and state agencies | 2 (6%) | 2 (6%) | 7 (17%) | 5 (11%) | 6 (11%) |
| Tribal agency | 0 (0%) | 1 (3%) | 1 (2%) | 1 (2%) | 2 (4%) |
| Research, education, extension | 5 (16%) | 2 (6%) | 3 (7%) | 6 (14%) | 7 (12%) |
| Forest industry | 8 (26%) | 7 (21%) | 5 (12%) | 6 (14%) | 7 (12%) |
| Conservation | 4 (13%) | 4 (12%) | 5 (12%) | 8 (18%) | 3 (5%) |
| Ranching | 1 (3%) | 1 (3%) | 1 (2%) | 2 (5%) | 4 (7%) |
| Community development | 0 (0%) | 1 (3%) | 2 (5%) | 0 (0%) | 4 (7%) |
| Recreation, access | 0 (0%) | 1 (3%) | 0 (0%) | 0 (0%) | 2 (4%) |
| Other | 0 (0%) | 0 (0%) | 0 (0%) | 1 (2%) | 2 (4%) |
| Total | 31 (100%) | 33 (100%) | 42 (100%) | 44 (100%) | 57 (100%) |
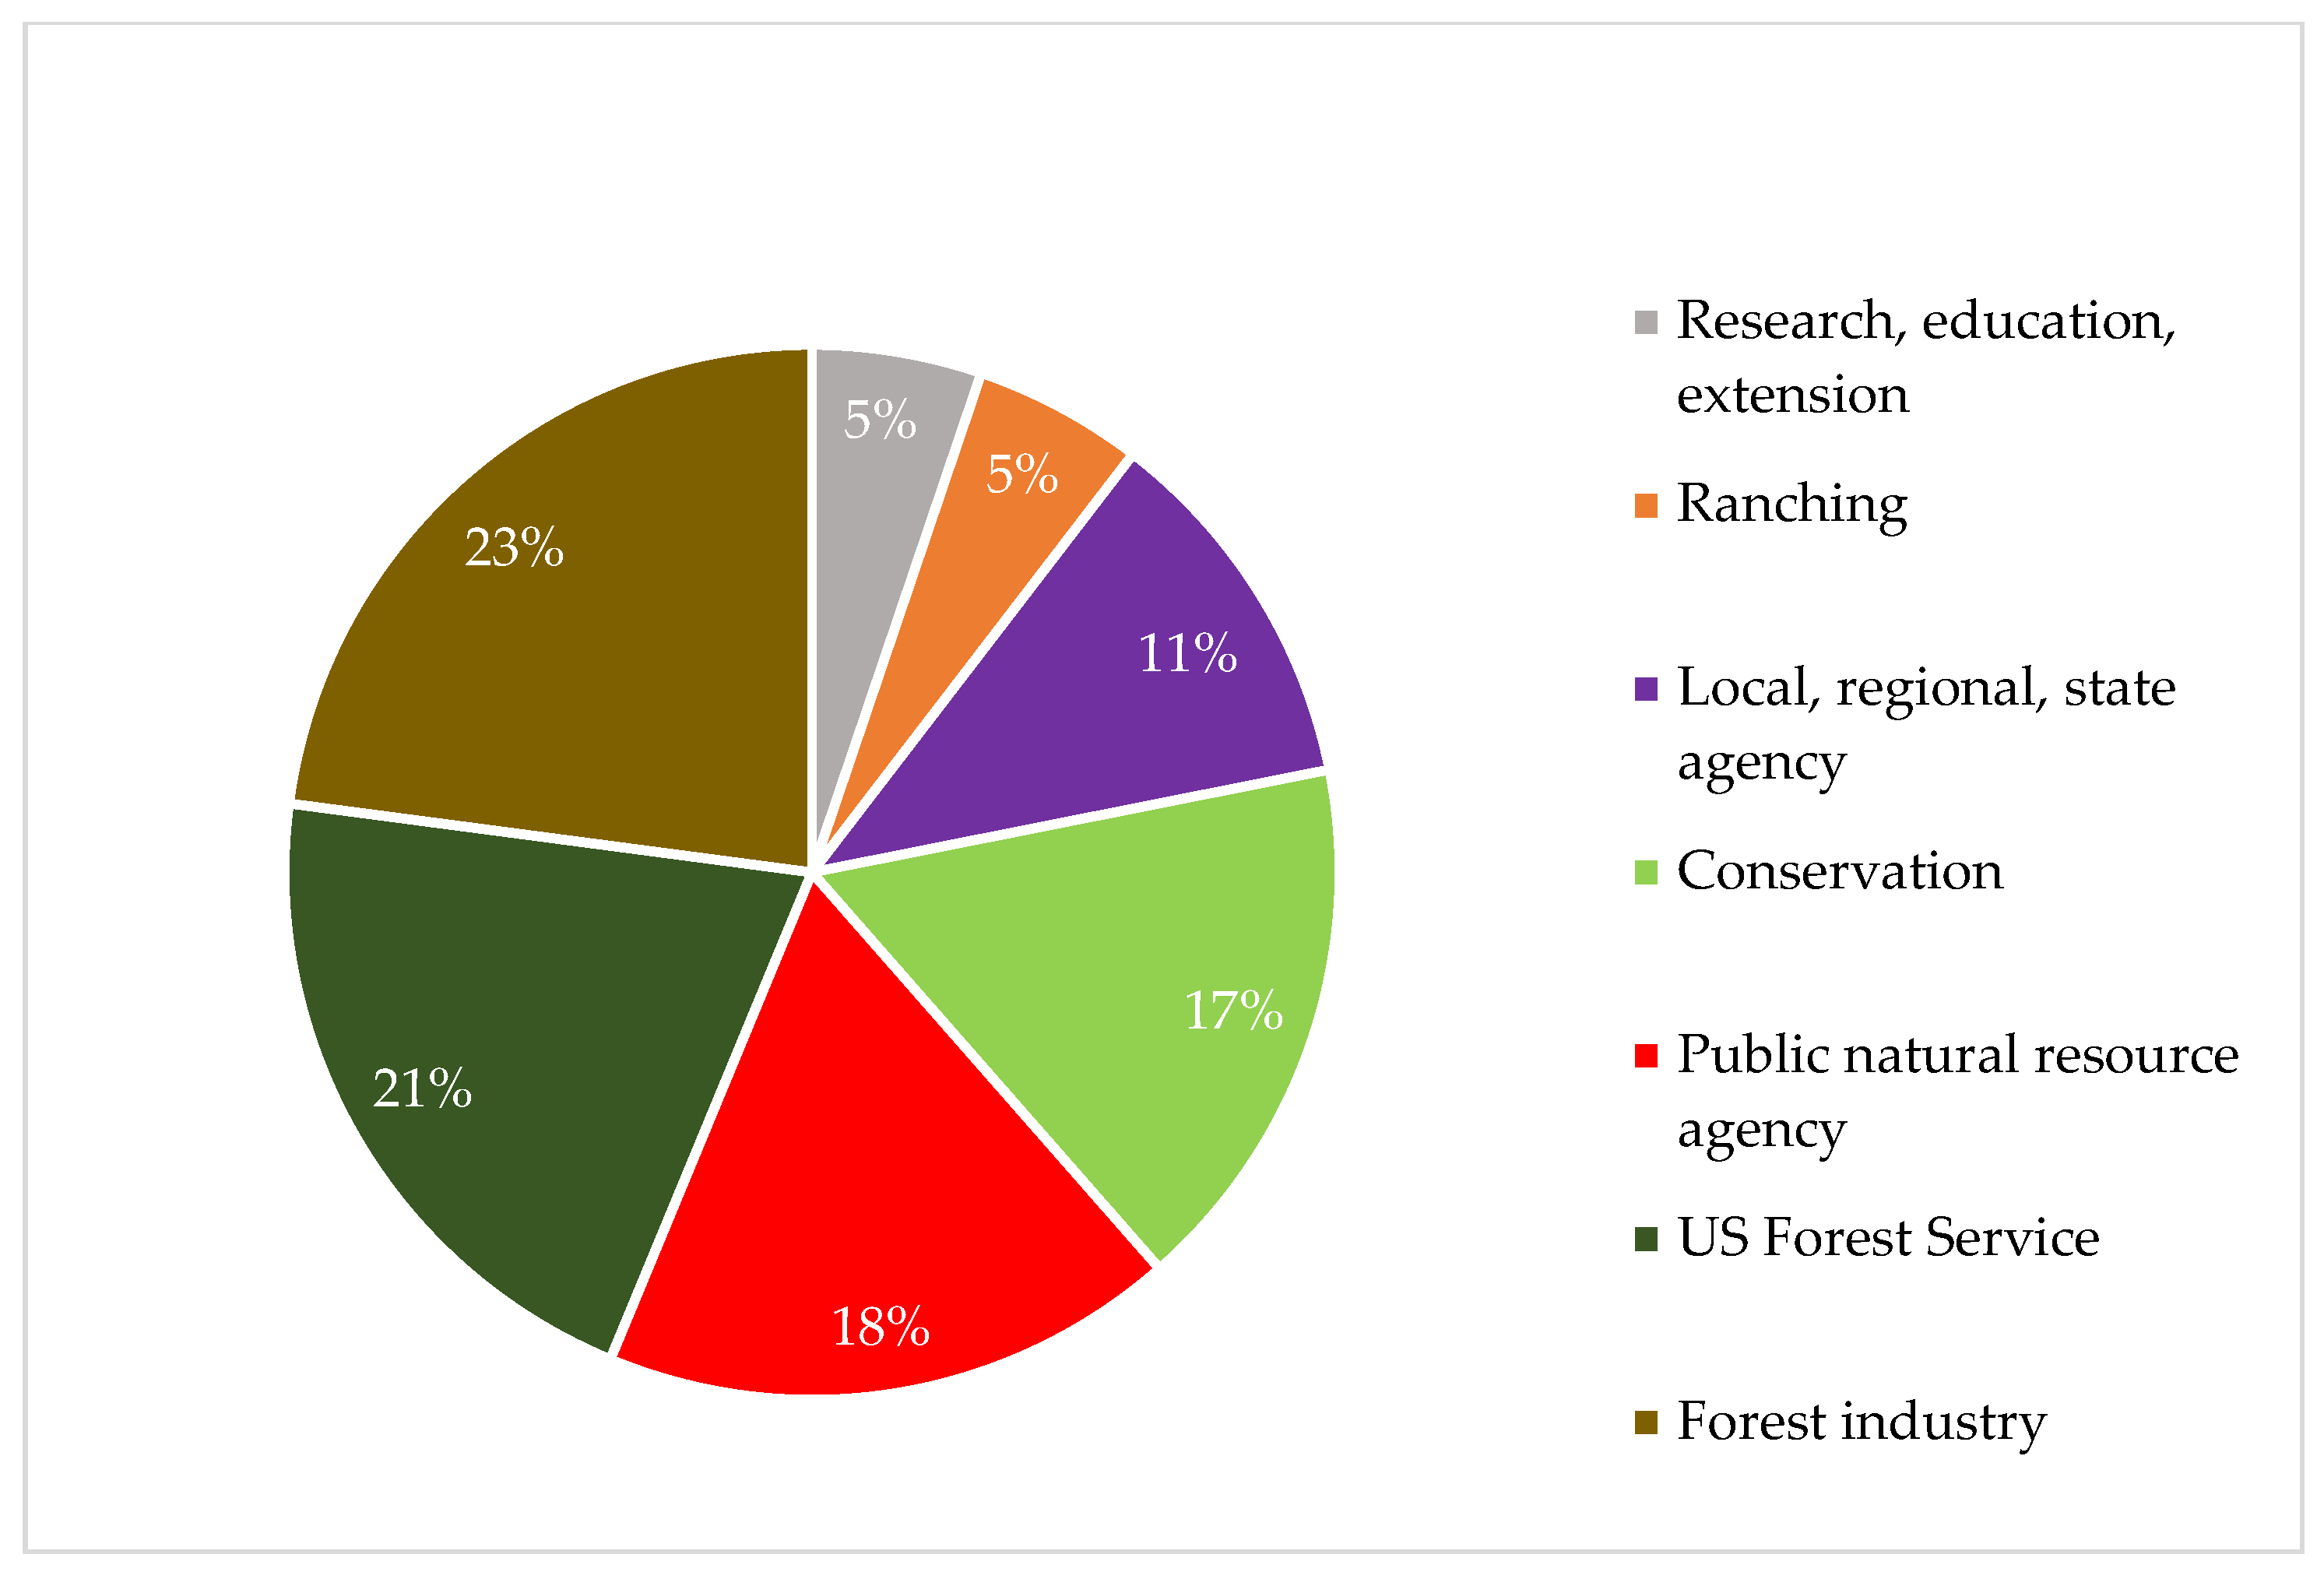
| Stakeholder Category | BMFP | HCRC | UFCG | OFRC | WWFC |
|---|---|---|---|---|---|
| US Forest Service | 1 | 3 | 2 | 5 | 2 |
| Public natural resource agency | 0 | 2 | 3 | 3 | 3 |
| Local, regional, and state agencies | 0 | 0 | 1 | 3 | 3 |
| Tribal agency | 0 | 0 | 0 | 0 | 0 |
| Research, education, extension | 0 | 0 | 0 | 1 | 2 |
| Forest industry | 3 | 1 | 4 | 1 | 5 |
| Conservation | 1 | 1 | 2 | 3 | 3 |
| Ranching | 0 | 1 | 0 | 1 | 1 |
| Community development | 0 | 0 | 0 | 0 | 1 |
| Recreation, access | 0 | 1 | 0 | 0 | 0 |
| Other | 0 | 0 | 0 | 1 | 0 |
| Total | 5 | 9 | 12 | 18 | 20 |
Disclaimer/Publisher’s Note: The statements, opinions and data contained in all publications are solely those of the individual author(s) and contributor(s) and not of MDPI and/or the editor(s). MDPI and/or the editor(s) disclaim responsibility for any injury to people or property resulting from any ideas, methods, instructions or products referred to in the content. |
© 2025 by the authors. Licensee MDPI, Basel, Switzerland. This article is an open access article distributed under the terms and conditions of the Creative Commons Attribution (CC BY) license (https://creativecommons.org/licenses/by/4.0/).
Share and Cite
Cerveny, L.K.; McLain, R.J.; Wright, K. Exploring the Composition of Forest Collaboratives in Northeastern Oregon. Forests 2025, 16, 1022. https://doi.org/10.3390/f16061022
Cerveny LK, McLain RJ, Wright K. Exploring the Composition of Forest Collaboratives in Northeastern Oregon. Forests. 2025; 16(6):1022. https://doi.org/10.3390/f16061022
Chicago/Turabian StyleCerveny, Lee K., Rebecca J. McLain, and Kristen Wright. 2025. "Exploring the Composition of Forest Collaboratives in Northeastern Oregon" Forests 16, no. 6: 1022. https://doi.org/10.3390/f16061022
APA StyleCerveny, L. K., McLain, R. J., & Wright, K. (2025). Exploring the Composition of Forest Collaboratives in Northeastern Oregon. Forests, 16(6), 1022. https://doi.org/10.3390/f16061022