2. Materials and Methods
This study focuses on the Legal Amazon region, with potential for future expansion to other areas of silvicultural interest. The analysis was conducted using a combination of species occurrence records, climate data, topographic information, and statistical modeling to support topoclimatic zoning for native forest species.
The core dataset used to model species distribution was obtained from the Environmental Information Database (BDiA) of the Brazilian Institute of Geography and Statistics (IBGE). Additional occurrence records were sourced from the Global Biodiversity Information Facility (GBIF,
www.gbif.org accessed on 10 December 2024), herbarium databases, and bibliographic repositories containing forest inventory data. These supplementary datasets were essential for validating the topoclimatic zoning (TopZon) model for each of the 12 trees forest species analyzed (
Bagassa guianensis Aubl;
Copaifera multijuga Hayne;
Cordia goeldiana Huber;
Dinizia excelsa Ducke;
Handroanthus albus (Cham.) Mattos;
Jacaranda copaia (Aubl.) D.Don;
Schefflera morototoni (Aubl.);
Schizolobium parahyba var.
amazonicum (Huber ex Ducke) Barneby;
Simarouba amara Aubl.;
Swietenia macrophylla King;
Virola surinamensis (Rol. ex Rottb.) Warb.;
Vochysia maxima Ducke), totaling 7643 georeferenced occurrences.
The climatic data were derived from the Brazilian Daily Weather Gridded Data (BR-DWGD), a high-resolution dataset in NetCDF format (0.1° × 0.1° grid), covering 41,115 virtual stations across the study area. The dataset spans the period from 1961 to 2022 [
16,
17] and includes daily records of precipitation, minimum, maximum and average temperatures, solar radiation (MJ m
−2 day
−1), wind speed at 2 m height (m s
−1), potential evapotranspiration (mm), and relative humidity (%).
To perform the analysis, environmental layers were generated for each climatic variable. These included total annual rainfall (TAR), total rainfall in the driest quarter (TLRQ), rainfall in months with less than 100 mm (RF < 100 mm), and rainfall in months with less than 60 mm (RF < 60 mm). Temperature metrics included maximum (TMx), average (TAvg), and minimum (TMin). Additional variables such as relative humidity (RH), vapor pressure deficit (VPD), and Standardized Precipitation Index (SPI) were also incorporated, along with variables derived from the climatological water balance (CWB), including actual evapotranspiration (ETP), water stress (WST), and water surplus (WSP). The CWB was calculated assuming a readily available water (RAW) value of 300 mm.
Topographic (altitude) and geographic (longitude and latitude) data were also included in the analysis, as these are essential for understanding species distribution and adaptive capacity in response to environmental gradients. The vapor pressure deficit (VPD) was calculated as an indicator of potential water stress. Elevated VPD values are associated with greater evapotranspiration demand, potentially leading to stomatal closure and decreased photosynthetic activity. The Standardized Precipitation Index (SPI) was used to characterize the frequency and severity of dry periods relative to wetter conditions.
The climate typology employed in this study is based on the Köppen classification system, incorporating methodological adaptations proposed by [
18] for tropical climates (type “A”), such as the Brazilian Amazon, where the mean annual air temperature exceeds 18 °C. These adaptations were comprehensively detailed by [
11]; however, this work presents a synthesis as described below.
Considering the ecological specificity of the Amazon regarding rainfall availability, it was established that each precipitation range would span 500 mm. Thus, the climatic subtypes defined by Köppen (Af, Am, Aw), traditionally classified based on the driest month (being greater than 60 mm for Af) and (less than 60 mm for Am and Aw), were refined to also incorporate the total annual precipitation. In this way, beyond stratification based on the driest month, the region’s climate is highly influenced by the total annual rainfall. The numbering of the subtypes corresponds to the precipitation intervals is detailed in [
11] but synthesized in this work to facilitate the understanding of the methodological adaptation proposed by [
18,
19], in which:
Af—Fully humid climates (p_dry ≥ 60 mm)
- ◦
Af1: Annual precipitation > 3000 mm.
- ◦
Af2: 3000 mm ≥ Annual precipitation > 2500 mm.
- ◦
Af3: 2500 mm ≥ Annual precipitation > 2000 mm.
Am—Monsoon climates (p_dry < 60 mm and p_dry > β′)
- ◦
Am1: Annual precipitation > 3000 mm.
- ◦
Am2: 3000 mm ≥ Annual precipitation > 2500 mm.
- ◦
Am3: 2500 mm ≥ Annual precipitation > 2000 mm.
- ◦
Am4: 2000 mm ≥ Annual precipitation ≥ 1500 mm.
Aw—Savanna climates (p_dry < 60 mm and p_dry ≤ β′)
- ◦
Aw3: 2500 mm ≥ Annual precipitation > 2000 mm.
- ◦
Aw4: 2000 mm ≥ Annual precipitation ≥ 1500 mm.
- ◦
Aw5: Annual precipitation < 1500 mm.
2.1. Statistical Analysis
Topoclimatic zoning was conducted using multiple linear regression models applied individually to each species. These models integrated climatic variables (such as annual precipitation, average temperature, and relative humidity), topographic variables (such as altitude and slope), and species occurrence data. Occurrence information was obtained from the RADAMBRASIL Project [
20], totaling 7643 data points, which were hierarchically grouped into internally homogeneous clusters to ensure the ecological representativeness of the analyzed species. This statistical approach enabled the identification of areas with varying levels of topoclimatic potential for the cultivation and restoration of forest species in the region, as detailed in [
19].
The variable “Frequency”, generated from this clustering process, was selected to represent species response behavior. The optimal number of clusters was determined by silhouette analysis, which indicated that 18 clusters offered the best fit.
Silhouette values range from −1 to 1. Values close to 1 indicate that the object is well-matched to its own cluster and poorly matched to neighboring clusters. Values around 0 suggest overlapping group boundaries, while negative values indicate potential misclassification. The purpose of this clustering step was twofold: (i) to group species with similar ecological responses to climatic and topographic conditions, and (ii) to provide a meaningful dependent variable for regression modeling. All input variables were standardized (mean = 0; SD = 1) prior to analysis.
With the dependent variable defined, a multiple linear regression analysis was applied using the cluster-based frequency means. Stepwise variable selection (both forward and backward) was employed to identify the most significant predictors. The final model was selected based on the lowest value of the Akaike Information Criterion (AIC).
The modeling approach incorporated both geographic and topographic variables (longitude, latitude, and altitude), as well as climatic predictors related to water availability, temperature variation, and atmospheric conditions. These included the following: water stress index (WST): a combined metric capturing climatic drought and evapotranspiration dynamics; rainfall thresholds: number of months with rainfall below 100 mm (RF < 100) and below 60 mm (RF < 60), as indicators of seasonal water deficit; total annual rainfall (TAR) and total rainfall in the driest quarter (TLRQ): used to assess long-term and seasonal water availability; relative humidity (RH) and vapor pressure deficit (VPD): reflecting atmospheric moisture demand; Standardized Precipitation Index (SPI): a normalized drought indicator; temperature extremes and means (TMx, TAvg, TMin): indicating thermal suitability and stress conditions. Regression coefficients were interpreted to evaluate how each predictor contributed to the potential occurrence or environmental suitability of each forest species.
2.2. Topoclimatic Suitability Mapping
Principal Component Analysis (PCA) was applied to assess the degree of correlation among topoclimatic variables and to reduce data dimensionality, with the selection of representative variables based on the proportion of variance explained. This method also enabled the characterization of observations (i.e., native forest species) in relation to environmental gradients.
For each of the 12 native Amazonian tree species, multiple linear regression models were developed using a stepwise variable selection method. The predictor variables included climatic and environmental layers, such as annual precipitation (prpannual); total precipitation in months with rainfall below 60 mm (prp60); total precipitation in months with rainfall below 100 mm (prp100); maximum, mean and minimum air temperatures (tempmax, tmpmed, tmpmin); relative humidity (rh); Standardized Precipitation Index (spi); length of the dry season (trimenos); vapor pressure deficit (dpv); climatic water deficit (def); elevation (altitude); and spatial coordinates (latitude, longitude).
2.3. Topoclimatic Suitability Equations
Angelim-pedra (Dinizia excelsa) = −907.3962 + 3.3423 × longitude + 0.201 × def − 1.311 × prp60 − 0.0401 × prpannual + 15.4871 × rh − 0.2856 × dryseason + 117.6838 × vpd − 0.0974 × elevation.
Copaíba (Copaifera multijuga) = 3077.1170 + 2.7867 × longitude − 0.3832 × def − 0.0708 × prp100 + 1.3532 × prp60 − 0.0332 × prpannual − 14.9907 × rh + 6.3045 × spi + 155,263.1832 × tmax – 310,601.0180 × tmean + 155,286.4173 × tmin + 0.3154 × dryseason − 274.9635 × vpd − 0.2121 × elevation.
Tatajuba (Bagassa guianensis) = 1168.8506 + 5.1857 × longitude + 14.8098 × latitude − 1.2600 × def − 0.6676 × prp100 + 2.0430 × prp60 − 0.0348 × prpannual − 19.2385 × rh + 407,126.9500 × tmax – 814,176.6517 × tmean + 407,079.4051 × tmin − 0.8054 × dryseason + 85.3343 × vpd − 0.0473 × elevation.
Mogno brasileiro (Swietenia macrophylla) = −487.3907 − 2.2819 × longitude + 0.4977 × latitude + 0.0367 × def + 0.1845 × prp100 + 0.0403 × prpannual − 4.6196 × rh + 24.4582 × spi – 1,586,736.3925 × tmax + 3,173,481.4647 × tmean – 1,586,719.1213 × tmin − 0.0385 × dryseason + 10.1257 × vpd + 0.0790 × elevation.
Freijó (Cordia goeldiana) = −217.6567 + 0.3824 × longitude − 0.0211 × def + 0.0194 × prp60 + 0.9540 × rh − 3.5810 × spi – 123,318.3247 × tmax + 246,649.1180 × tmean – 123,326.3516 × tmin + 7.1082 × vpd + 0.0198 × elevation.
Quaruba (Vochysia maxima) = 4.5867 − 2.8295 × latitude + 0.1113 × prp100 − 0.6249 × prp60 − 0.0116 × prpannual + 26.3519 × spi − 14.0679 × tmax + 18.9008 × tmean.
Ipê Amarelo (Handroanthus albus) = 492.2552 − 6.0067 × longitude + 26.8858 × latitude + 0.4977 × def − 0.7012 × prp100 − 0.1944 × prpannual + 30.1898 × rh + 111.3414 × spi + 127.7833 × tmax − 244.8103 × tmean − 0.4892 × dryseason + 253.8842 × vpd − 1.0800 × elevation.
Parapará (Jacaranda copaia) = 2236.8447 + 2.4987 × longitude + 14.8318 × latitude − 0.3011 × def − 1.9760 × prp60 − 0.1272 × prpannual − 21.8551 × spi + 48.3450 × tmax − 106.4293 × tmean − 0.3772 × dryseason − 91.4789 × vpd − 0.4684 × elevation.
Marupá (Simarouba amara) = −145.6026 + 40.3134 × tmax − 40.3282 × tmean.
Ucuuba (Virola surinamensis) = −3092.9919 − 14.3109 × longitude + 4.7749 × latitude + 1.3442 × def + 0.0486 × prpannual − 79.6432 × spi + 78.0274 × tmean + 0.0140 × vpd.
Morototó (Schefflera morototoni) = −944.6943 + 6.4945 × longitude + 6.7747 × latitude − 0.7439 × def + 0.9063 × prp60 − 0.0438 × prpannual + 13.4594 × rh + 76.3397 × spi + 122.7637 × tmax − 130.4427 × tmean − 0.0019 × vpd − 0.1269 × elevation.
Paricá (Schizolobium amazonicum) = −324.5762 − 2.3514 × longitude + 5.8877 × latitude − 0.2694 × def − 0.1887 × prp100 + 1.2552 × prp60 + 0.0083 × prpannual − 5.7949 × rh + 47.2438 × spi + 26.3043 × tmax − 6.1095 × tmean + 0.0193 × dryseason − 19.2987 × vpd.
The regression coefficients obtained for each species were applied through map algebra in a Geographic Information System (GIS), resulting in continuous raster surfaces representing modeled topoclimatic suitability. These outputs were analyzed using frequency histograms and natural breaks to define thresholds that segmented the data into three suitability classes: high (top third of the values), medium (middle third), and low (bottom third). These categories were visualized in green, yellow, and brown, respectively.
2.4. Topoclimatic Zoning Validation
After constructing the topoclimatic zoning (TopZon) maps, a validation procedure was conducted to evaluate the coherence between the potential zoning classes and the regional climatic typologies defined by [
18].
Topoclimatic potential areas (high, medium, low) for native forest species in the Amazon were delineated by integrating environmental variables into a geodatabase (GIS), structured through multiple regression models specific to each species. These models were based on occurrence points from the RADAMBRASIL project—an extensive forest inventory conducted during the 1970s and 1980s, when the Amazon was still considered a demographic void [
21].
The methodology was rigorously validated using independent occurrence data obtained from herbarium collections, the Global Biodiversity Information Facility (GBIF), and additional bibliographic sources. Subsequently, multivariate statistical analyses—Principal Component Analysis (PCA) and K-means clustering—were applied to examine the distribution patterns of species in relation to the adapted Köppen climate typology [
18].
A further step involved isolating anthropized areas based on data from the Ecological-Economic Zoning (UZEE), using spatial buffer techniques [
22]. As an example, this methodology was applied within the UZEE Project to the species
Tachigali vulgaris L.F. (Taxi-branco) [
23], as well as to
Schizolobium amazonicum (Paricá), for which the delineation of areas with favorable topoclimatic conditions supported the identification of priority zones for ecological restoration and forest planning actions, as demonstrated in [
24,
25].
2.5. Association Tests and Visualization
To test the relationship between topoclimatic potential and climatic typologies, categorical association tests were conducted using SAS OnDemand for Academics, SAS INC. (Cary, NC, USA) SAS FREE VERSION, 2025. The Chi-square test was used to assess the statistical significance of associations (p < 0.05 indicating significance), while Cramér’s V and the Phi coefficient were calculated to assess the strength of the associations. A Cramér’s V value near 0 indicates a weak association, whereas values approaching 1 indicate strong association. Similarly, the Phi coefficient ranges from −1 to 1, with values close to 1 or −1 suggesting strong relationships. A biplot was also produced to visually explore the interaction between topoclimatic potential classes and climatic subtypes across the 12 native species analyzed.
ArcGIS for Desktop v10.2.2 software was used for map modeling and generating the raster layers and used to produce the final maps.
3. Results and Discussion
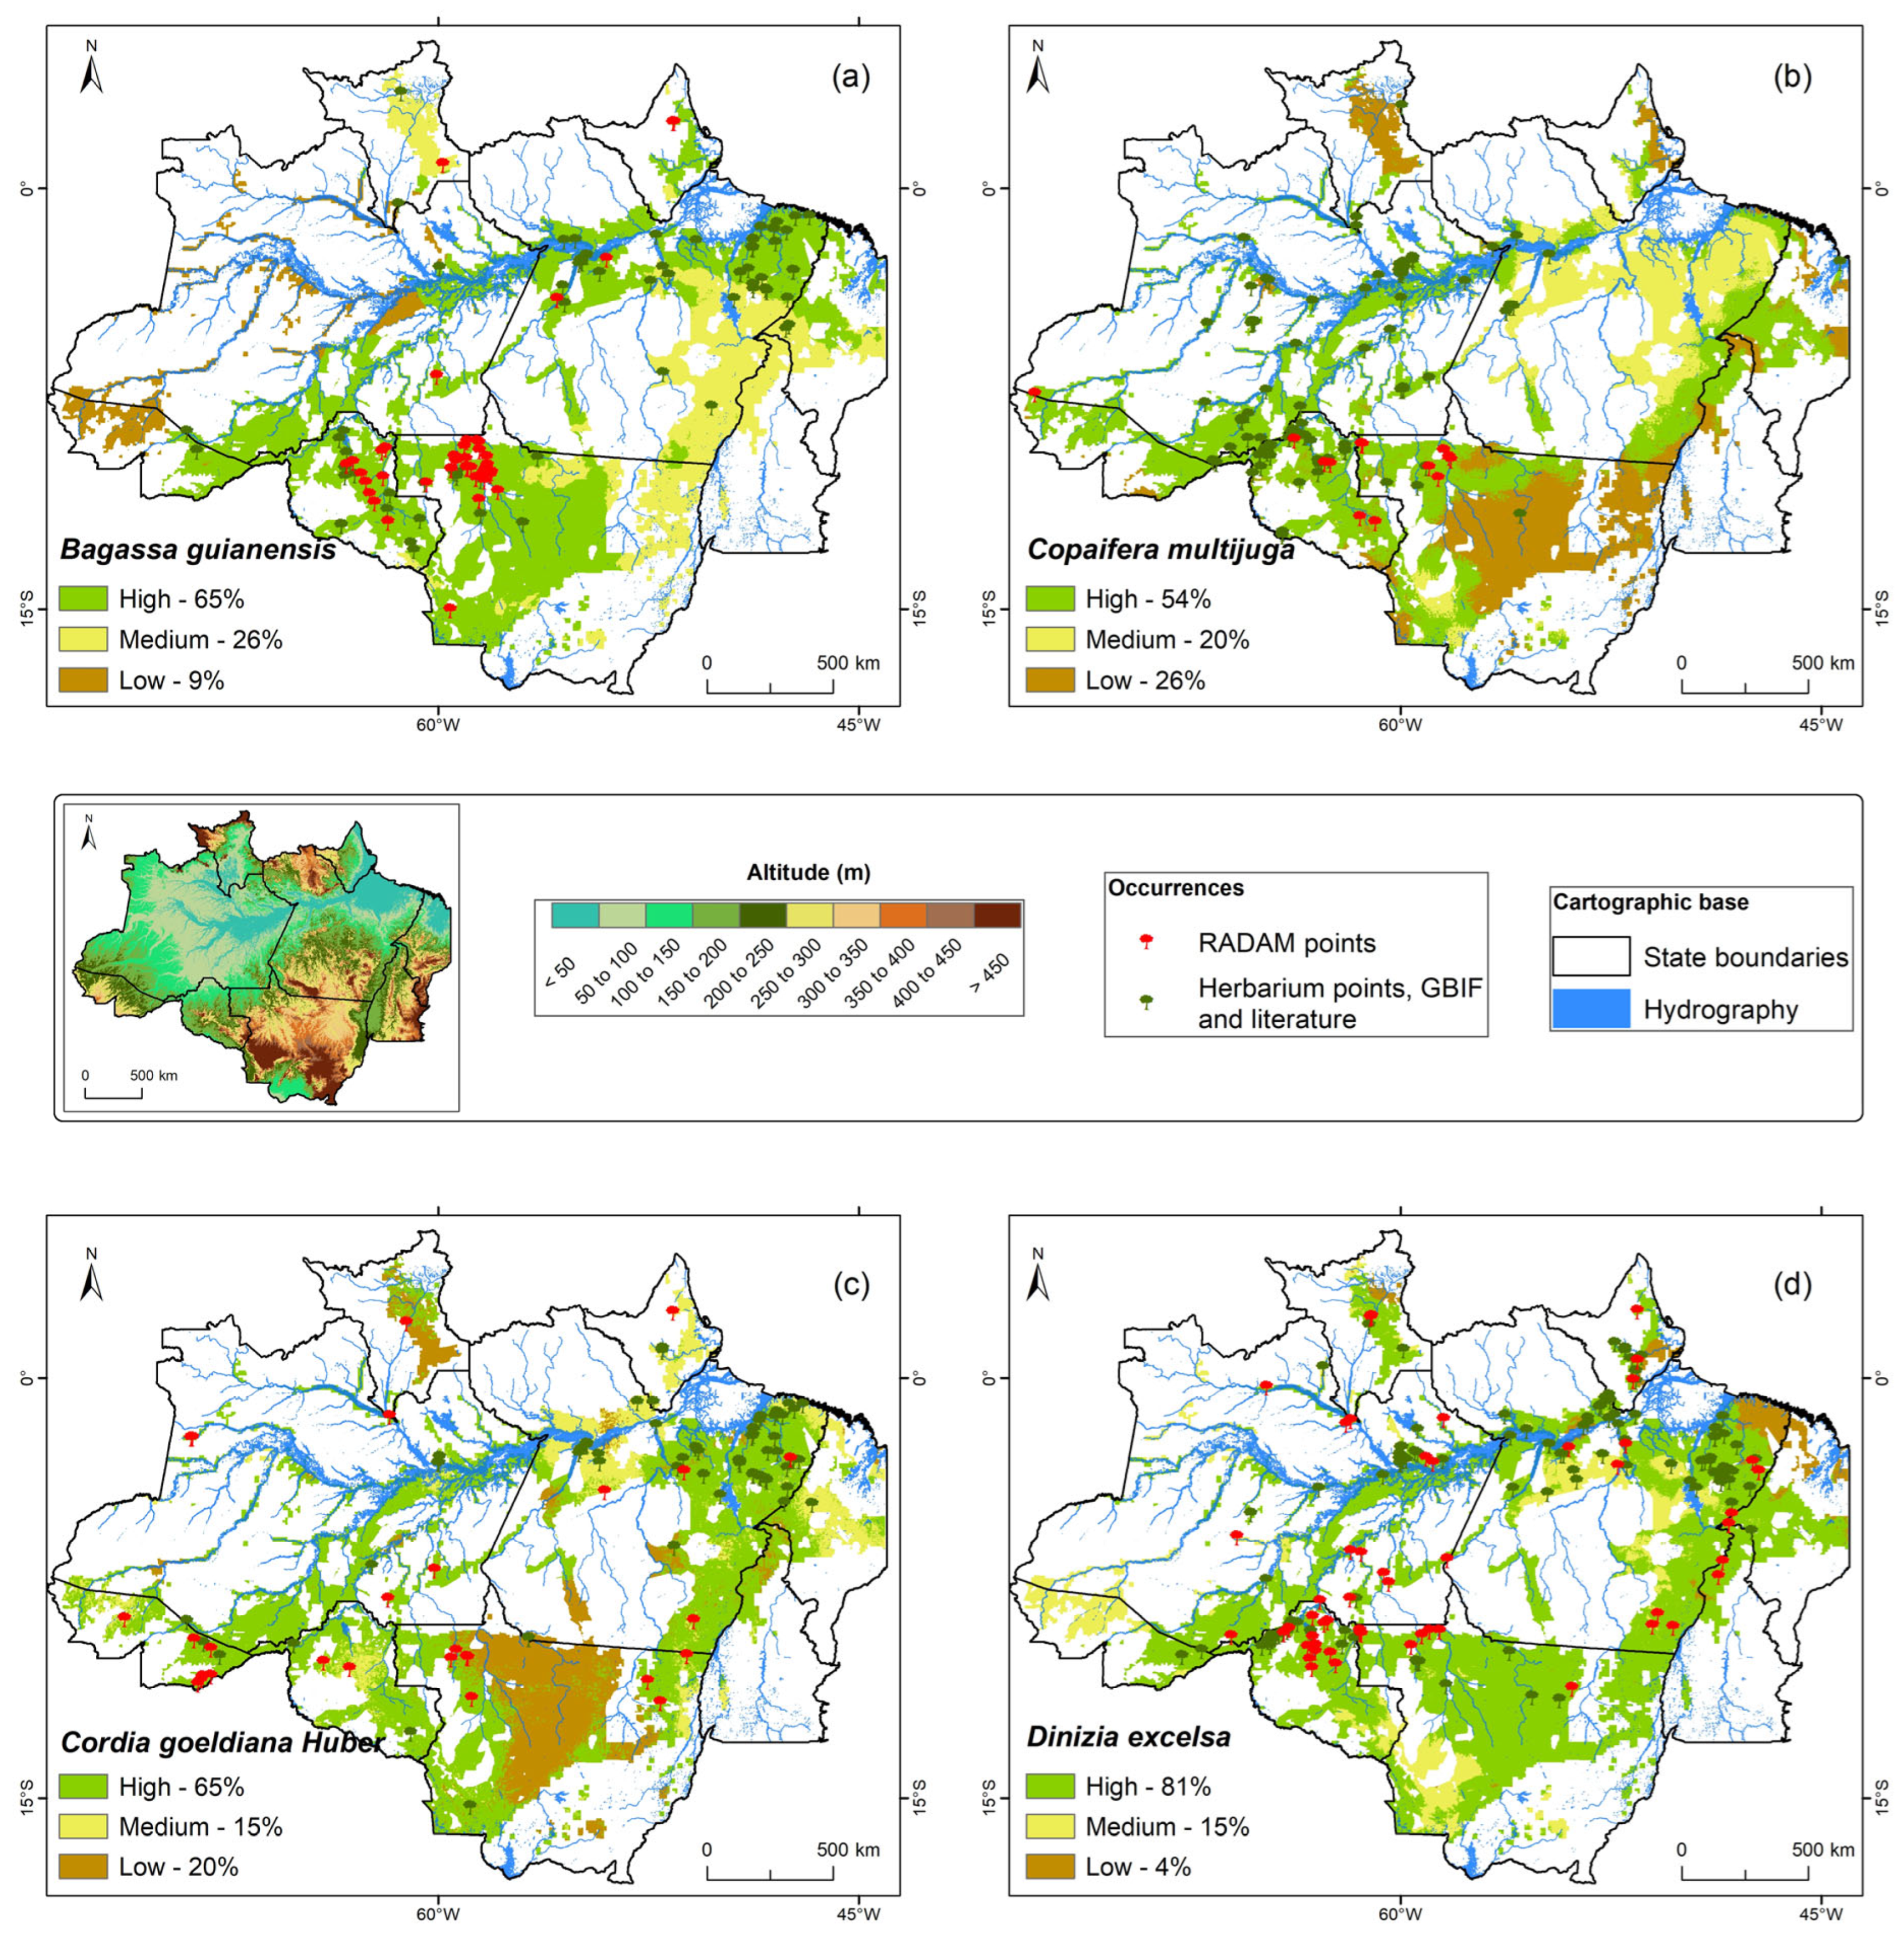
The topoclimatic zoning conducted for the twelve native forest species revealed spatial variability in their potential distribution across the Brazilian Amazon, categorized into three classes: high, medium, and low potential.
Table 1 presents the percentage of each class identified for each species and offers a comparative overview of their ecological preferences.
For instance, B. guianensis (tatajuba) exhibits a strong preference for areas with adequate water availability, with 65% of its mapped area identified as having high potential. Conversely, C. multijuga (copaíba), while adaptable, shows a slightly lower high-potential area (54%), indicating a greater sensitivity to specific environmental factors, particularly water availability, with the remaining area distributed between medium (20%) and low (26%) suitability. Similarly, C. goeldiana (freijó) demonstrates a broad adaptability, with 65% high potential, thriving best in regions with sufficient precipitation and soil moisture.
Species with particularly high topoclimatic potential include D. excelsa (angelim vermelho), with 81% high potential, demonstrating a strong affinity for optimal conditions, notably the hydrologically floodplain and igapó regions. H. albus (ipê branco) and H. serratifolius (ipê amarelo) also show extensive high potential areas (78%), highlighting their adaptability across diverse altitudes and precipitation regimes. J. copaia (parapará) follows closely with 75% high potential, suggesting its strong suitability for areas with favorable climatic conditions, making it a promising species for ecological restoration and forest regeneration initiatives.
In contrast, S. parahyba var. amazonicum (paricá) and S. amara (marupá) exhibit more restricted high-potential areas (46% and 37%, respectively), indicating a greater dependence on specific environmental conditions, particularly concerning soil moisture for paricá and optimal precipitation and soil moisture for marupá. S. morototoni (morototó) and V. surinamensis (ucuúba) show moderate high-potential areas (60% and 59%), suggesting a need for specific environmental conditions like adequate moisture and fertility for optimal growth. Finally, S. macrophylla (mogno brasileiro) and V. maxima (quaruba) display considerable high potential (74% and 67%), reflecting their adaptability to moderate to high precipitation and varied environmental conditions, respectively.
The spatial patterns identified in
Table 1 strongly suggest a prioritization of high-potential regions, particularly those along rivers and humid areas, for immediate and focused forest management and conservation interventions. While acknowledging the importance of medium and low potential areas for maintaining overall biodiversity, our analysis indicates that these regions, characterized by environmental constraints for the studied species, will require the development and implementation of more targeted and potentially assisted management strategies to ensure their effective conservation and sustainable use.
The topoclimatic zoning for the twelve selected native forest species, visually represented across
Figure 1,
Figure 2 and
Figure 3, provides an unprecedented level of detail on their ecological suitability within the anthropized landscapes of the Legal Amazon. These figures, read in conjunction with the precise percentages outlined in
Table 1, serve as a fundamental tool for guiding evidence-based silvicultural strategies, enabling more effective cultivation, conservation, and restoration efforts within the framework of the Unified Ecological-Economic Zoning (UZEE) buffer.
Figure 1a–d delves into the topoclimatic potential of four key species:
Bagassa guianensis,
Copaifera multijuga,
Cordia goeldiana, and
Dinizia excelsa. For
Bagassa guianensis (
Figure 1a), the map predominantly highlights high topoclimatic potential, encompassing 65% of anthropized areas. This visually expansive high-potential zone signifies a robust environmental suitability, positioning
B. guianensis as a priority species for large-scale silvicultural interventions aimed at forest restoration in deforested regions. Medium potential covers 26%, while only 9% is low, indicating a consistently favorable landscape for its development.
The zoning for
Copaifera multijuga (
Figure 1b) illustrates that 54% of anthropized areas within the UZEE buffer exhibit high topoclimatic potential. While substantial, the map also shows a notable presence of low potential (26%), suggesting a more geographically constrained optimal distribution. This spatial pattern emphasizes the need for careful site selection to maximize the success of silvicultural strategies and conservation efforts for this species in areas impacted by deforestation.
Cordia goeldiana (
Figure 1c) presents a clear dominance of high potential, accounting for 65% of the anthropized buffer zones. This widespread suitability across deforested areas makes
C. goeldiana a highly recommendable species for prioritization in silvicultural programs focused on areas aligning with the UZEE guidelines. Its moderate presence in medium (15%) and low (20%) potential zones further supports its general viability.
Dinizia excelsa (
Figure 1d) stands out with a remarkable 81% of its distribution modeled as high topoclimatic potential within anthropized areas. This exceptional suitability, visually striking on the map, indicates that
D. excelsa is profoundly adapted to a vast extent of available deforested lands. Such high-potential zones are unequivocally priority areas for ambitious silvicultural strategies, offering immense promise for high-productivity forest interventions and ecological restoration in regions previously impacted by deforestation. Medium and low potentials are minimal (15% and 4%, respectively), underscoring its precise ecological niche.
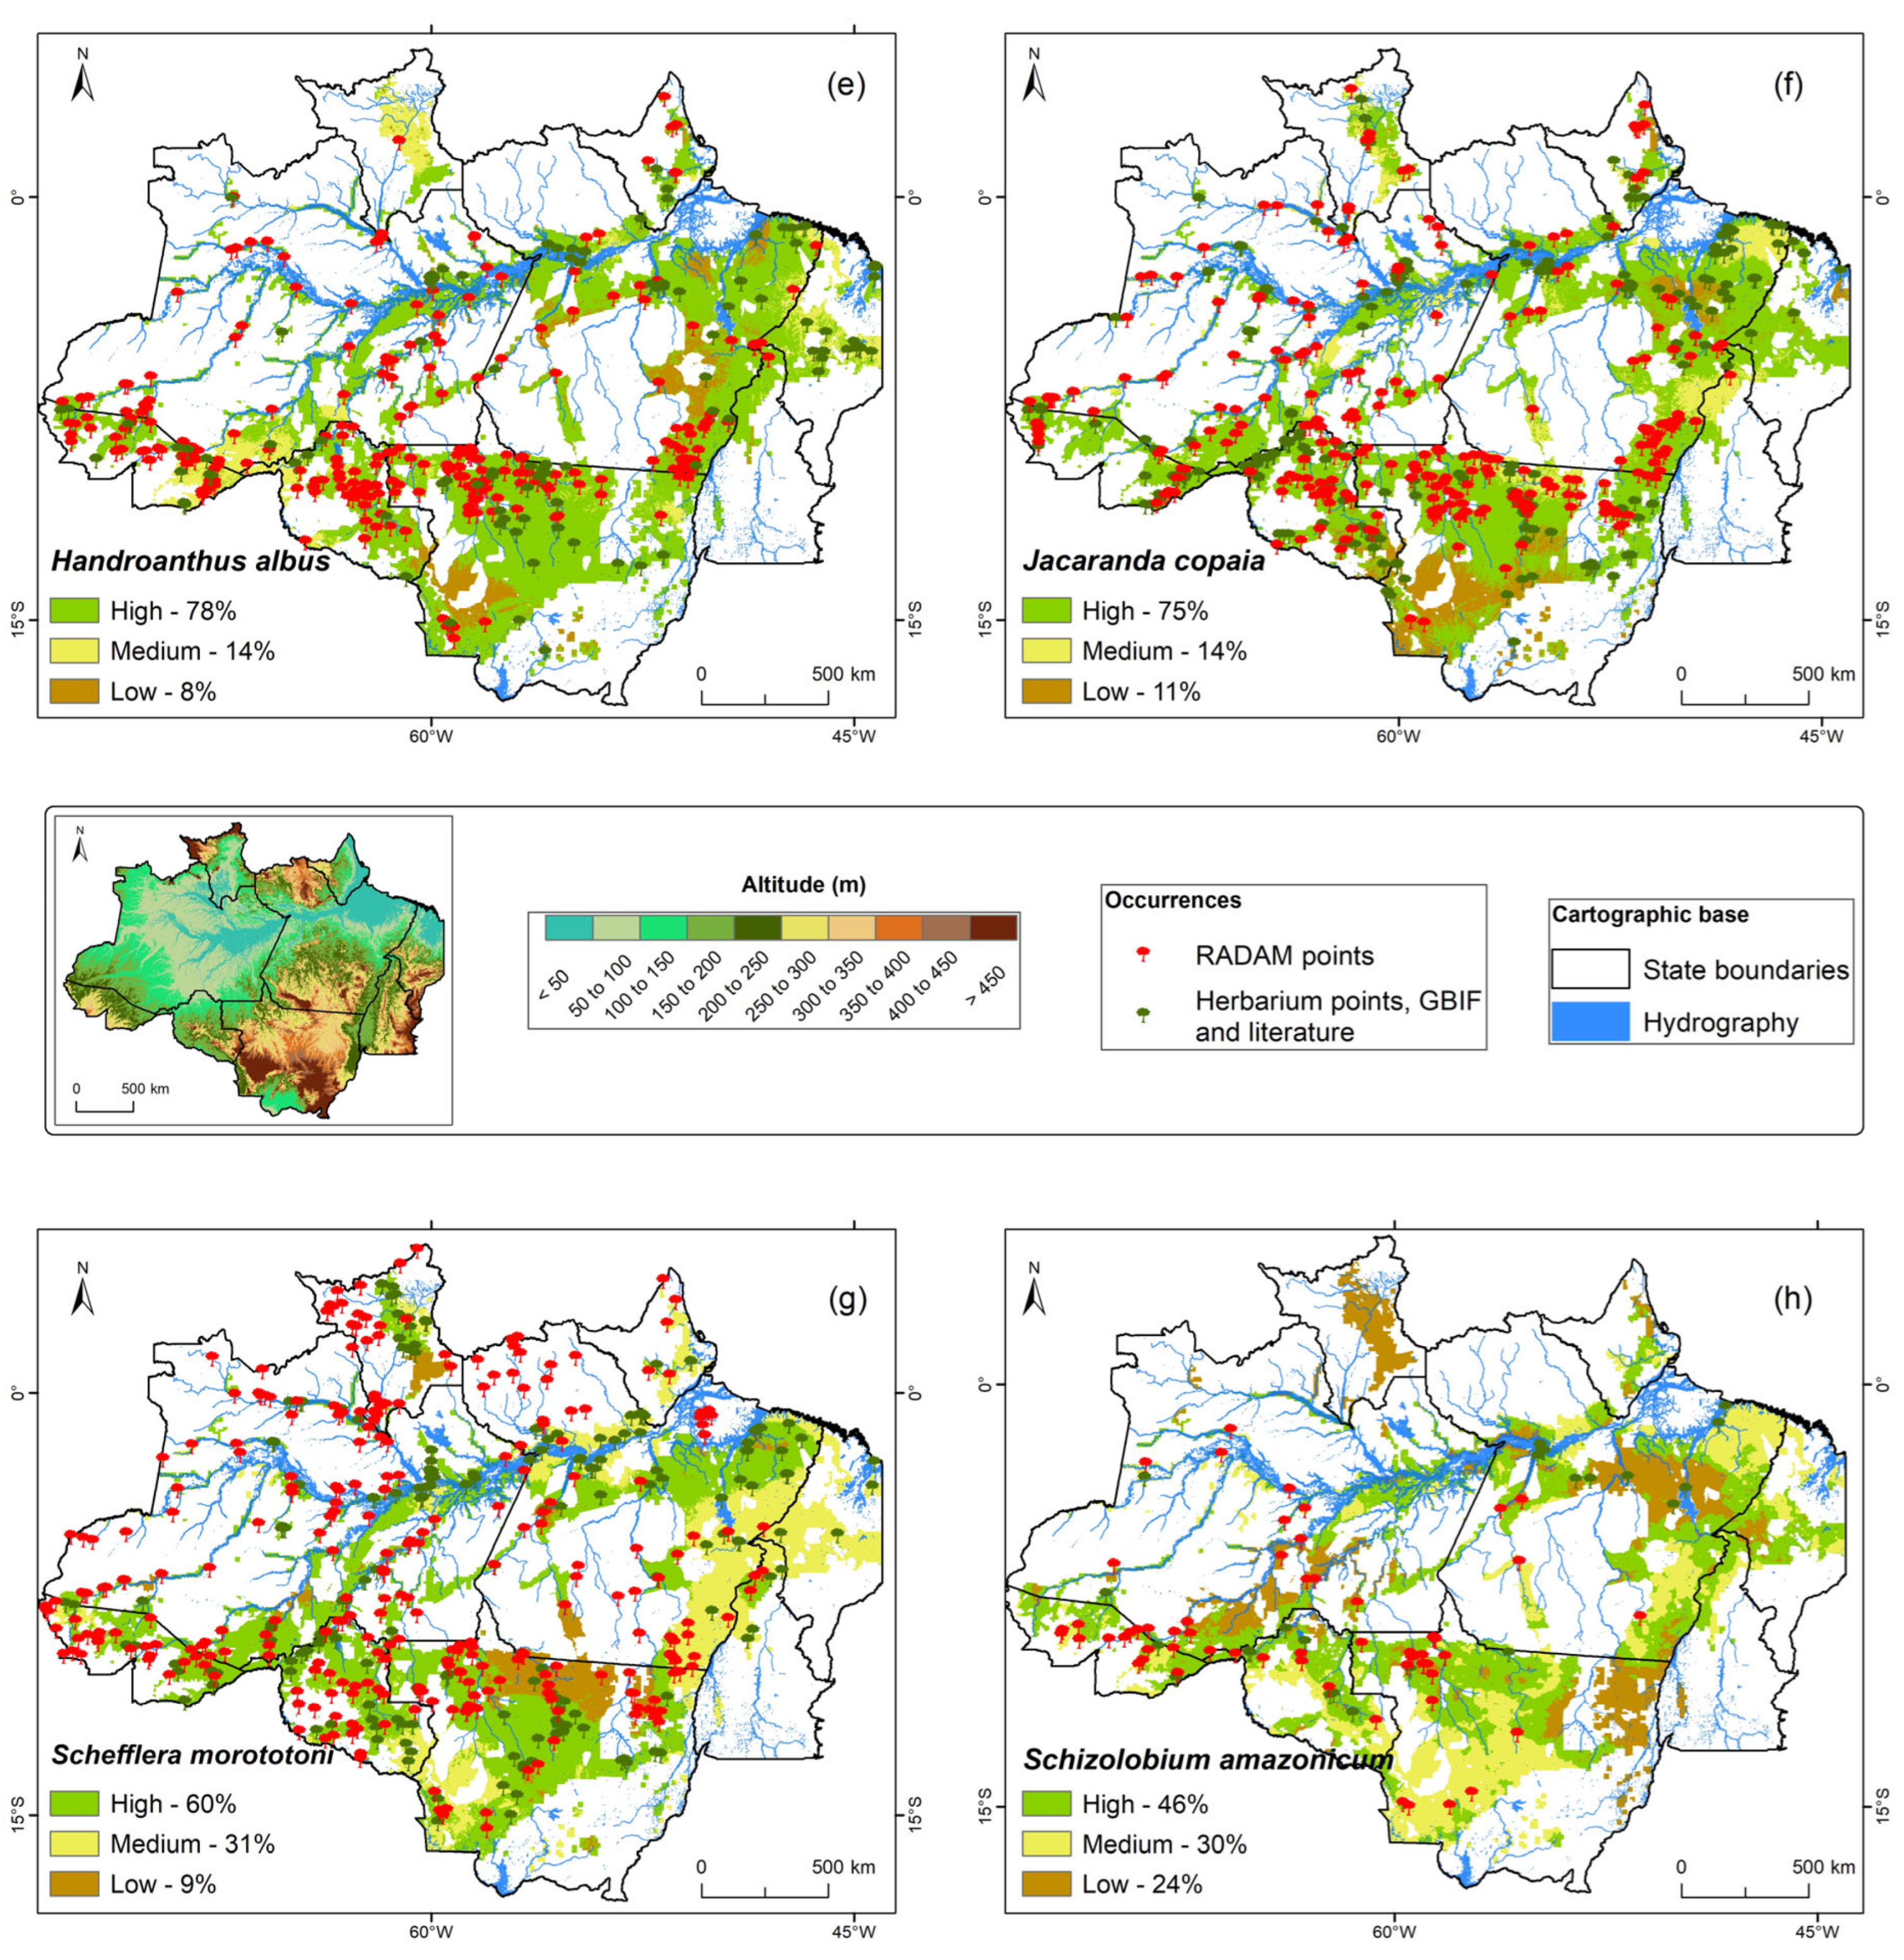
Figure 2e–h further details the topoclimatic zoning for
Handroanthus albus,
Jacaranda copaia,
Schefflera morototoni, and
Schizolobium parahyba var.
amazonicum.
Handroanthus albus (
Figure 2e) shows strong performance, with 78% of anthropized areas within the buffer presenting high topoclimatic potential. This substantial coverage across favorable zones positions
H. albus as a cornerstone species for large-scale restoration initiatives and sustainable forest management, particularly where suitable environmental conditions for its robust establishment are present.
The maps for
Jacaranda copaia (
Figure 2f) reinforce its suitability, revealing 75% of anthropized areas with high potential, 14% medium, and 11% low. This consistent high suitability across widespread deforested areas makes
J. copaia a reliable choice for reforestation and sustainable management initiatives, contributing to the ecological recovery of degraded Amazonian landscapes.
For
Schefflera morototoni (
Figure 2g), 60% of the anthropized areas exhibit high topoclimatic potential, with a significant 31% in medium and 9% in low potential zones. This pattern, visible on the map, indicates a moderate variability in suitability but also broad possibilities for its integration into diverse restoration strategies, including those in moderately suitable environments, due to its adaptability. The distribution for
Schizolobium parahyba var.
amazonicum (
Figure 2h) is more balanced, with 46% high, 30% medium, and 24% low potential. Visually, its map presents a more mosaic-like pattern of suitability. While the proportion of highly suitable zones is lower compared to other species, these results still highlight a significant area of favorable conditions for silvicultural adoption across anthropized landscapes. This balanced distribution suggests its robust performance in a broader range of environmental conditions, indicating significant ecological plasticity.
Figure 3i,j,l,m completes the comprehensive topoclimatic zoning, illustrating the potential for
Simarouba amara,
Swietenia macrophylla,
Virola surinamensis, and
Vochysia maxima.
Simarouba amara (
Figure 3i) exhibits a unique distribution, with only 37% of anthropized areas classified as high potential, while 40% are medium and 23% are low. This relatively balanced spatial distribution, clearly depicted on the map, mandates a highly selective application of silvicultural strategies, emphasizing the crucial need for local suitability assessment before implementation. Its resilience across various conditions, however, offers strategic opportunities in diverse restoration contexts.
In contrast,
Swietenia macrophylla (
Figure 3j) shows a more favorable pattern, with 74% of anthropized zones identified as high potential, 10% as medium, and 16% as low. This strong environmental suitability, visibly concentrated in favorable areas on the map, confirms its robust potential for large-scale restoration efforts in deforested areas, particularly in regions where environmental conditions align with its optimal requirements.
Virola surinamensis (
Figure 3l) presents 59% of anthropized areas with high potential, 24% medium, and 17% low. This distribution, shown visually, reinforces its strong viability for inclusion in various silvicultural programs across a wide range of previously degraded landscapes, allowing for flexible application based on local site conditions and restoration objectives.
Finally,
Vochysia maxima (
Figure 3m) demonstrates highly promising conditions, with 67% of its distribution modeled as high potential, 27% as medium, and only 6% as low. This translates into vast areas of favorable topoclimatic conditions within anthropized zones, making
V. maxima one of the most suitable species for widespread implementation in restoration initiatives across the Legal Amazon.
Taken together, these detailed visual representations in
Figure 1,
Figure 2 and
Figure 3, coupled with the precise quantitative data in
Table 1, offer an indispensable tool for evidence-based decision-making.
The values presented in
Table 2 indicate that all species exhibited a statistically significant association with the climatic typologies (
p < 0.05), suggesting that their distributions are not random, but rather influenced by specific climatic patterns. The Phi and Cramér’s V coefficients, used to assess the strength of this association, revealed magnitudes ranging from moderate to moderately strong. The Phi coefficient varied from 0.5608 (for
C. multijuga) to 0.6774 (for the remaining species), while Cramér’s V remained constant at 0.3911 across all species, reinforcing the consistency of the detected associations. Specifically,
C. multijuga,
J. copaia,
S. parahyba var.
amazonicum,
S. amara, and
V. surinamensis showed moderate associations, whereas the remaining species exhibited moderately strong associations, indicating greater sensitivity to variations in the mapped topoclimatic conditions.
Figure 4 provides an integrated visualization of climatic typologies, species groupings, and multivariate ecological relationships that structure the topoclimatic zoning of twelve native forest species in the Brazilian Amazon. The left portion of the figure displays the Köppen climatic typology map, adapted from [
18], where species occurrence points are grouped into three categories (high, medium, and low) according to their topoclimatic potential as determined by the zoning model. This model was developed exclusively within anthropized areas, defined by the application of an anthropic buffer, and therefore excluded occurrence points located outside zones of consolidated land-use.
This ensures that the ecological associations reflect species performance under realistic land–climate scenarios, directly relevant to reforestation and management planning. The spatial distribution of species grouped by potential demonstrates clear patterns of ecological affinity with specific climatic regimes. Species with high topoclimatic potential tend to concentrate in typologies such as Af2, Af3, and Am3, which correspond to humid and climatically stable areas, while those with low potential are found in more restrictive typologies, such as Af1, Am4, and Aw5, characterized by high humidity extremes or greater seasonal variation.
These trends are further elucidated in the right panel of the figure, which presents the factorial biplot derived from Principal Component Analysis (PCA), a multivariate method. The first four factors jointly explained 89.7% of the total variance, with Factor 1 (59.1%) representing the dominant climatic gradient (
Figure 4a). Species such as
S. macrophylla (H),
C. multijuga (H),
V. surinamensis (H), and
C. goeldiana (H) are positioned near Af2, Am3, and Aw4, reinforcing their affinity for humid conditions with low climatic seasonality. In contrast,
D. excelsa (L) and
J. copaia (L) are associated with Af1 and Aw5, suggesting reduced adaptability to either super-humid or strongly seasonal climates. Intermediate species, including
B. guianensis (M),
S. amara (M), and
H. albus (M), show broader distributions, occupying transitional climatic zones such as Am2 and Aw4, indicative of greater ecological plasticity.
Factor 4 (
Figure 4c), despite explaining a smaller portion of the variance (6.2%), revealed specific adaptive patterns under hydric stress. For instance,
S. parahyba var.
amazonicum (L) and
S. amara (M) are associated with Am4, a typology that includes a distinct dry month and annual precipitation ranging from 1500 mm to 2000 mm. The alignment between spatial patterns observed in the typology map and the multivariate groupings in the biplot confirms the robustness of the topoclimatic potential classifications. By integrating climatic zoning with ecological response patterns, this figure consolidates the methodological approach proposed by [
11] and reinforces its practical application as a strategic tool for ecological zoning, species selection, and climate-adapted forest restoration across the Amazon.
Figure 4 integrates the results of Principal Component Analysis (PCA) applied to twelve native forest species of the Brazilian Amazon, highlighting their associations with climatic typologies and topoclimatic potential classes (high, medium, and low). The PCA revealed that climatic typologies play a central role in structuring the ecological distribution of these species, with the first four components explaining 89.7% of the total variance—Factor 1 alone accounts for 59.1% as the main environmental axis.
Figure 5 displays a matrix of associations between forest species and topoclimatic zones, organized according to established climatic typologies. Each cell in the matrix is represented by a proportional circle, where the color indicates the predominance of species occurrence—ranging from light green/blue (lowest predominance, 0.2) to purple (highest predominance, 1), with intermediate gradients of yellow, orange, and red (0.4, 0.6, 0.8, respectively). Concomitantly, the circle size reflects the absolute area occupied by the species within a given topoclimatic zone, facilitating the simultaneous analysis of both relative representativeness and spatial magnitude.
Dendrograms positioned along the top and left margins of the matrix group the topoclimatic zones and forest species, respectively, based on ecological similarity, allowing for the identification of structural patterns. These hierarchical clusters reveal affinities among species in relation to environmental conditions and allow inferences regarding varying levels of ecological adaptability to the analyzed climatic typologies.
Within this framework, species exhibiting high predominance, evidenced by purple and red circles (e.g., S. macrophylla, C. multijuga, H. serratifolius), are largely associated with Af3 and Am3 typologies, reflecting their ecological preferences for humid and climatically stable environments. Conversely, species with lower predominance, shown by light green/blue and yellow circles (e.g., D. excelsa and J. copaia), are primarily linked to typologies like Af1, Am4, and Aw5, which represent more extreme or seasonal moisture regimes. Medium predominance species tend to occupy transitional typologies such as Am2 and Aw4, indicating greater ecological plasticity.
This integrated analysis, combining color intensity, bubble size, and clustering patterns, provides key insights into species distribution and confirms the robustness of the derived ecological gradients shaped by climatic typologies. The recognition of species with broad distributions, those with more restricted occurrences, and zones with a higher recurrence of favorable conditions for forest development is thus enabled, underpinning their potential for silvicultural actions.
This multivariate approach not only validates the classification of topoclimatic potential but also provides a reliable scientific foundation for selecting species in ecological restoration initiatives. Particularly in anthropized Amazonian landscapes, where environmental variation and land-use pressures are intense, such detailed climate–species relationships serve as essential tools for planning reforestation, sustainable forest management, and adaptive conservation. The results reinforce the methodological framework proposed by [
11], demonstrating its broad applicability beyond the Amazon and into any region where aligning species traits with climatic patterns is crucial to restoration success (
Figure 5).
The sensitivity of the Amazon rainforest to changes in rainfall regimes, as highlighted by [
26], reveals a non-linear yet reversible relationship between Aboveground Biomass (AGB) and Mean Annual Precipitation (MAP). Their findings suggest a critical MAP threshold, below which vegetation biomass decline accelerates with decreasing rainfall. Notably, these critical thresholds vary geographically across the Amazon, with precipitation seasonality and potential evapotranspiration (PET) identified as key determinants. Their conclusion regarding the potential for forest degradation due to hydrological cycle alterations, particularly the vulnerability of currently water-rich regions to future drought, provides a crucial backdrop for interpreting the species-specific responses observed in our topoclimatic zoning.
Our results, which indicate varying degrees of topoclimatic plasticity among the twelve native species analyzed, align with this understanding of differential vulnerability. Species exhibiting broader high-potential zones across diverse topoclimatic conditions suggest a greater inherent resilience to environmental fluctuations. In this context, the integration of topoclimatic zoning with ecosystem service strategies becomes evident, as observed in urban studies such as [
27], where root biomass allocation played a key role in carbon sequestration under compacted and hydrologically restricted soils. Conversely, species with more restricted high-potential areas may be more susceptible to the predicted shifts in precipitation patterns, underscoring the importance of targeted conservation and management strategies based on their specific topoclimatic requirements.
According to [
28], carbon is one of the most relevant climate regulation services provided by native Amazonian species, such as Bertholletia excelsa, particularly in regions undergoing ecological transition or subject to land-use intensification. This reinforces the importance of integrating species-specific ecological functions with topoclimatic suitability models to support multifunctional landscape planning.
The application of multivariate statistical methods, such as Principal Component Analysis (PCA) and cluster analysis, is paramount in topoclimatic zoning studies. These methods are essential for delineating topoclimatic zones, particularly within anthropogenically altered areas of the Brazilian Amazon, as demonstrated in [
23]. This aligns with the methodological robustness highlighted by [
29] and is further supported by [
30], who applied PCA to effectively manage climatic datasets and assess regional vulnerability in coastal Bangladesh. This synergistic combination allows for a more nuanced and statistically grounded identification of homogeneous topoclimatic regions, enhancing the understanding of local climate variation [
19].
In the Brazilian Amazon, the climatic typologies previously characterized in our results, consistent with [
18] and further elaborated by [
11], identify regions with marked seasonal rainfall limitations. These areas require prioritized attention in forest restoration planning due to their increased environmental vulnerability. Ecological transition zones between the Amazon and Cerrado biomes are especially sensitive and are projected to suffer significant biodiversity losses because of ongoing climate change [
31]. Studies on tree species composition indicate that the most severe threats to biodiversity conservation are concentrated in these transitional forest ecosystems [
32]. Therefore, identifying and mapping suitable areas for native Amazonian species based on topoclimatic criteria is essential to guide conservation and restoration strategies, particularly in landscapes facing intense anthropogenic pressure.
The use of species selected according to their topoclimatic suitability is critical to ensure the success of conservation and reforestation actions. In the southern Amazon, species have undergone long-term adaptive processes, enabling them to survive in marginal conditions distinct from their original habitats. These processes have generated unique patterns of species richness [
33] and increased floristic dissimilarity between transitional and core areas of adjacent biomes [
34]. The biogeographic gradients formed by rare species in such zones suggest a heightened regional conservation responsibility and reflect evolutionary adaptations shaped by paleoclimatic events [
35]. As such, conservation policies should consider these gradients in tandem with topoclimatic distribution patterns to enhance the ecological representativeness and effectiveness of forest recovery initiatives.
Recent studies have emphasized that overlooking the ecological potential of native species can significantly undermine ecosystem resilience. Ref. [
36] estimated that biodiversity loss in disturbed tropical forests could double when ecological compatibility is not considered in restoration. Remote sensing studies by [
37] have contributed valuable data by linking forest stand parameters with spectral responses from Landsat TM imagery in the Amazon Basin, improving forest monitoring and planning. Ref. [
38] also provided critical insight into the hydrological limitations of low-intensity restoration, showing that such efforts may not increase surface water yield, which highlights the need for tailored, context-specific ecological interventions.
Moreover, a broader integrative approach is needed. As indicated by [
28], biodiversity and ecosystem services must be analyzed in conjunction within strategic policy frameworks. These findings reinforce the importance of incorporating multiple scientific perspectives to strengthen forest restoration strategies in the Amazon. The observed patterns of topoclimatic plasticity among native species further justify the integration of species-specific resilience and functional traits into spatial ecological planning. In this context, ecological transitions and their associated environmental services are consistent with broader spatial structures, such as the morphoclimatic domains described by [
39], which provide a foundational understanding of the biophysical organization of Brazilian landscapes. The integration of topoclimatic zoning into these domains has the potential to support the design of multifunctional landscapes and regionally effective restoration strategies across the Amazon.


 ,
, 


