Article

Genome-Wide Resequencing Revealed the Genetic Diversity of Fraxinus platypoda Oliv. in Northwestern China

by
Ying Liu
1,2,
Wanting Ge
2,
Qiuling Zhao
3,
Jing Zhang
3,
Xiaolong Guo
3,* and
Wenjun Ma
2,*
1
State Key Laboratory of Tree Genetics and Breeding, Chinese Academy of Forestry and Northeast Forestry University, Beijing 100091, China
2
Research Institute of Forestry, Chinese Academy of Forestry, Beijing 100091, China
3
Gansu Xiaolongshan Forestry Science Research Institute, Tianshui 741020, China
*
Authors to whom correspondence should be addressed.
Forests 2025, 16(5), 860; https://doi.org/10.3390/f16050860
Submission received: 30 March 2025 / Revised: 8 May 2025 / Accepted: 16 May 2025 / Published: 21 May 2025
(This article belongs to the Section Genetics and Molecular Biology)

Abstract

Fraxinus platypoda Oliv. (Oleaceae), an ecologically and economically valuable tree species with key distribution areas in northwestern China, faces conservation challenges due to its fragmented groups and scarce individual numbers. To investigate the genetic consequences of this demographic crisis, we analyzed 65 individuals from 11 natural groups in this region using whole-genome resequencing. We identified a total of 60,503,092 single nucleotide polymorphisms (SNPs), and after further filtering, retained 3,394,299 SNPs for subsequent analysis. Population structure analysis (Neighbor-Joining tree, STRUCTURE, and kinship coefficients) revealed two distinct genetic clusters (K = 2), with principal component analysis (PCA) confirming this subdivision. Cluster I, composed of eight individuals from Groups 3, 5, 8, and 11, is highly differentiated from Cluster II and may be ancestral to it. Among the 11 groups, Groups 3 and 11 show a high genetic diversity and differentiation, with Tajima’s D > 0, indicating a long evolutionary history and balancing selection. The remaining nine groups have a low diversity, low differentiation, and frequent gene flow, with Tajima’s D < 0, suggesting directional selection. A mantel test showed no significant link between genetic variation and geographic isolation (p = 0.460). The high differentiation of Cluster I and gene flow of Cluster II are maintained by factors like evolutionary history and reproductive systems. Groups 3 and 11 are highlighted as important genetic resources deserving priority protection. This study offers key genomic data for conserving fragmented tree species and future adaptability research.

1. Introduction

Habitat loss and degradation are the primary drivers of global biodiversity decline [1,2]. They lead to smaller population sizes and habitat fragmentation, blocking connectivity between different habitat patches [3,4]. This alters a population’s genetic composition via genetic drift in two main ways: by eroding genetic variation and by increasing within-population inbreeding and genetic differentiation among subpopulations (Lande, 1988; Frankham et al., 2002) [5,6]. For plant populations, the eco-genetic effects of habitat fragmentation are especially pronounced. Reduced habitat area directly decreases the effective population size, while spatial isolation hinders critical gene flow processes like pollen and seed dispersal [7]. This creates a cascading effect: intensified genetic drift reduces within-population genetic variation; restricted gene flow increases genetic differentiation between populations; and increased inbreeding in small populations causes inbreeding depression, manifesting as reduced seed germination and seedling survival [8,9]. Ultimately, this lowers short-term survival and long-term adaptive potential in fragmented habitats [10,11]. As biodiversity continues to decline, many plants are threatened by overexploitation, invasive species, and habitat fragmentation and loss [12]. However, different species respond differently to habitat fragmentation. Some plants show only slight impacts on gene flow and diversity [13,14]. Hence, understanding the impacts of habitat fragmentation is key to effectively managing populations and species.
The genus Fraxinus (ash), comprising approximately 50 species distributed across temperate and subtropical regions of the Northern Hemisphere, represents a critical component of forest ecosystems due to its ecological and economic importance [15,16]. Among these, Fraxinus platypoda Oliv., an East Asian endemic deciduous tree, is of particular concern due to its unique biological characteristics and critical conservation status. Distributed in central-western China (including the Shaanxi, Gansu, Hubei, and Sichuan provinces) and Japan [17,18,19], this long-lived species (with a lifespan exceeding 250 years [20]) can reach heights of up to 40 m and a breast height diameter of over 150 cm [18]. It possesses a monoecious reproductive system, with male and hermaphroditic individuals coexisting within populations, and exhibits a biennial seed dispersion pattern [21]. Valued for its rapid growth, high-quality and decay-resistant timber, as well as its ecological adaptability, it is a key timber and ecological tree species in China’s arid northwest (NW) region, where woody plant diversity is relatively low [22]. However, due to habitat fragmentation and overexploitation, it has been listed as a second-class nationally protected wild plant, with a notable decline in its NW China distribution: mature individuals with a breast height diameter exceeding 40 cm account for only approximately 6% of the remaining population [19]. This indicates that the wild populations in this region, which are valuable genetic resources adapted to arid environments, are facing a risk of genetic erosion.
The genetic erosion caused by anthropogenic survival pressures is exacerbated by climate change. Adaptability, defined as a species’ intrinsic ability to adjust to environmental changes [23], and genetic diversity, which may represent a form of resilience reflecting evolutionary potential [24], are increasingly recognized as crucial for ensuring that biodiversity can persist and adapt under current and future environmental conditions [25,26,27]. In the absence of ecological and epigenetic studies, molecular approaches can identify genetic erosion [28], detect local adaptation [29], monitor genetic diversity, and provide baseline data on genetic diversity for conservation planning, thereby guiding the development of management strategies to maximize genetic diversity conservation [28]. Additionally, molecular tools can be integrated with spatial data to identify factors influencing genetic structure and connectivity, assisting practitioners in determining which populations are crucial for maintaining or restoring gene flow across networks or metapopulations [28,30].
Despite studies on genetic relationships and diversity in other Fraxinus species, such as F. velutina, F. rhynchophylla, and F. mandshurica using molecular markers like SRAP, ISSR, and SSR [31,32,33,34,35], and the exploration of F. mandshurica’s genetic structure using SNP technology based on dd-RAD sequencing [36], genome-wide studies on F. platypoda’s genetic diversity remain lacking. Notably, the core distribution area of F. platypoda in NW China (Shaanxi and Gansu provinces) lies at the convergence of the biogeographic regions of North China, Central China, Mongolia-Xinjiang, and the Qinghai-Tibet Plateau, presenting a complex biogeographical background. Groups in this region may exhibit a greater adaptability to aridity compared to those in central China. Conducting genetic diversity studies in this biodiversity hotspot can clarify the genetic variation patterns of the species, providing a theoretical basis for regional conservation planning, such as the designation of priority conservation areas and the establishment of germplasm banks. It also lays a foundation for understanding ecological adaptation. This study combines high-throughput SNP markers with spatial ecological methods to comprehensively reveal the genetic diversity distribution of F. platypoda groups in NW China for the first time, aiming to fill research gaps in current conservation practices and establish a scientific foundation for the sustainable utilization of its superior genetic resources (Figure 1).
Whole-genome resequencing is the process of sequencing the genomes of different individuals of species with reference sequences. Based on this, individual- or population-level population genetic characteristics can be studied [37,38]. This technology enables the rapid and precise obtaining of the SNP and InDel (insertion deletion polymorphism) of an individual or a population, and through the means of big data analysis, it can more precisely analyze the relationship between the relatives of a species and the structure of a population, clearly reveal the level of the genetic diversity of a species, and provide a solid theoretical basis for the species protection [39]. In this study, the population genetic characteristics of 11 groups of F. platypoda were explored based on whole-genome resequencing. The purpose of this study was to, as follows: (A) clarify the population structure and genetic relationship of F. platypoda in NW China, and analyze the reasons for the formation of the population structure, and (B) evaluate the current status of the genetic diversity of F. platypoda groups in NW China, as well as put forward the corresponding protection measures. The study laid a foundation for the genome research of F. platypoda and promoted its molecular breeding process.

2. Materials and Methods

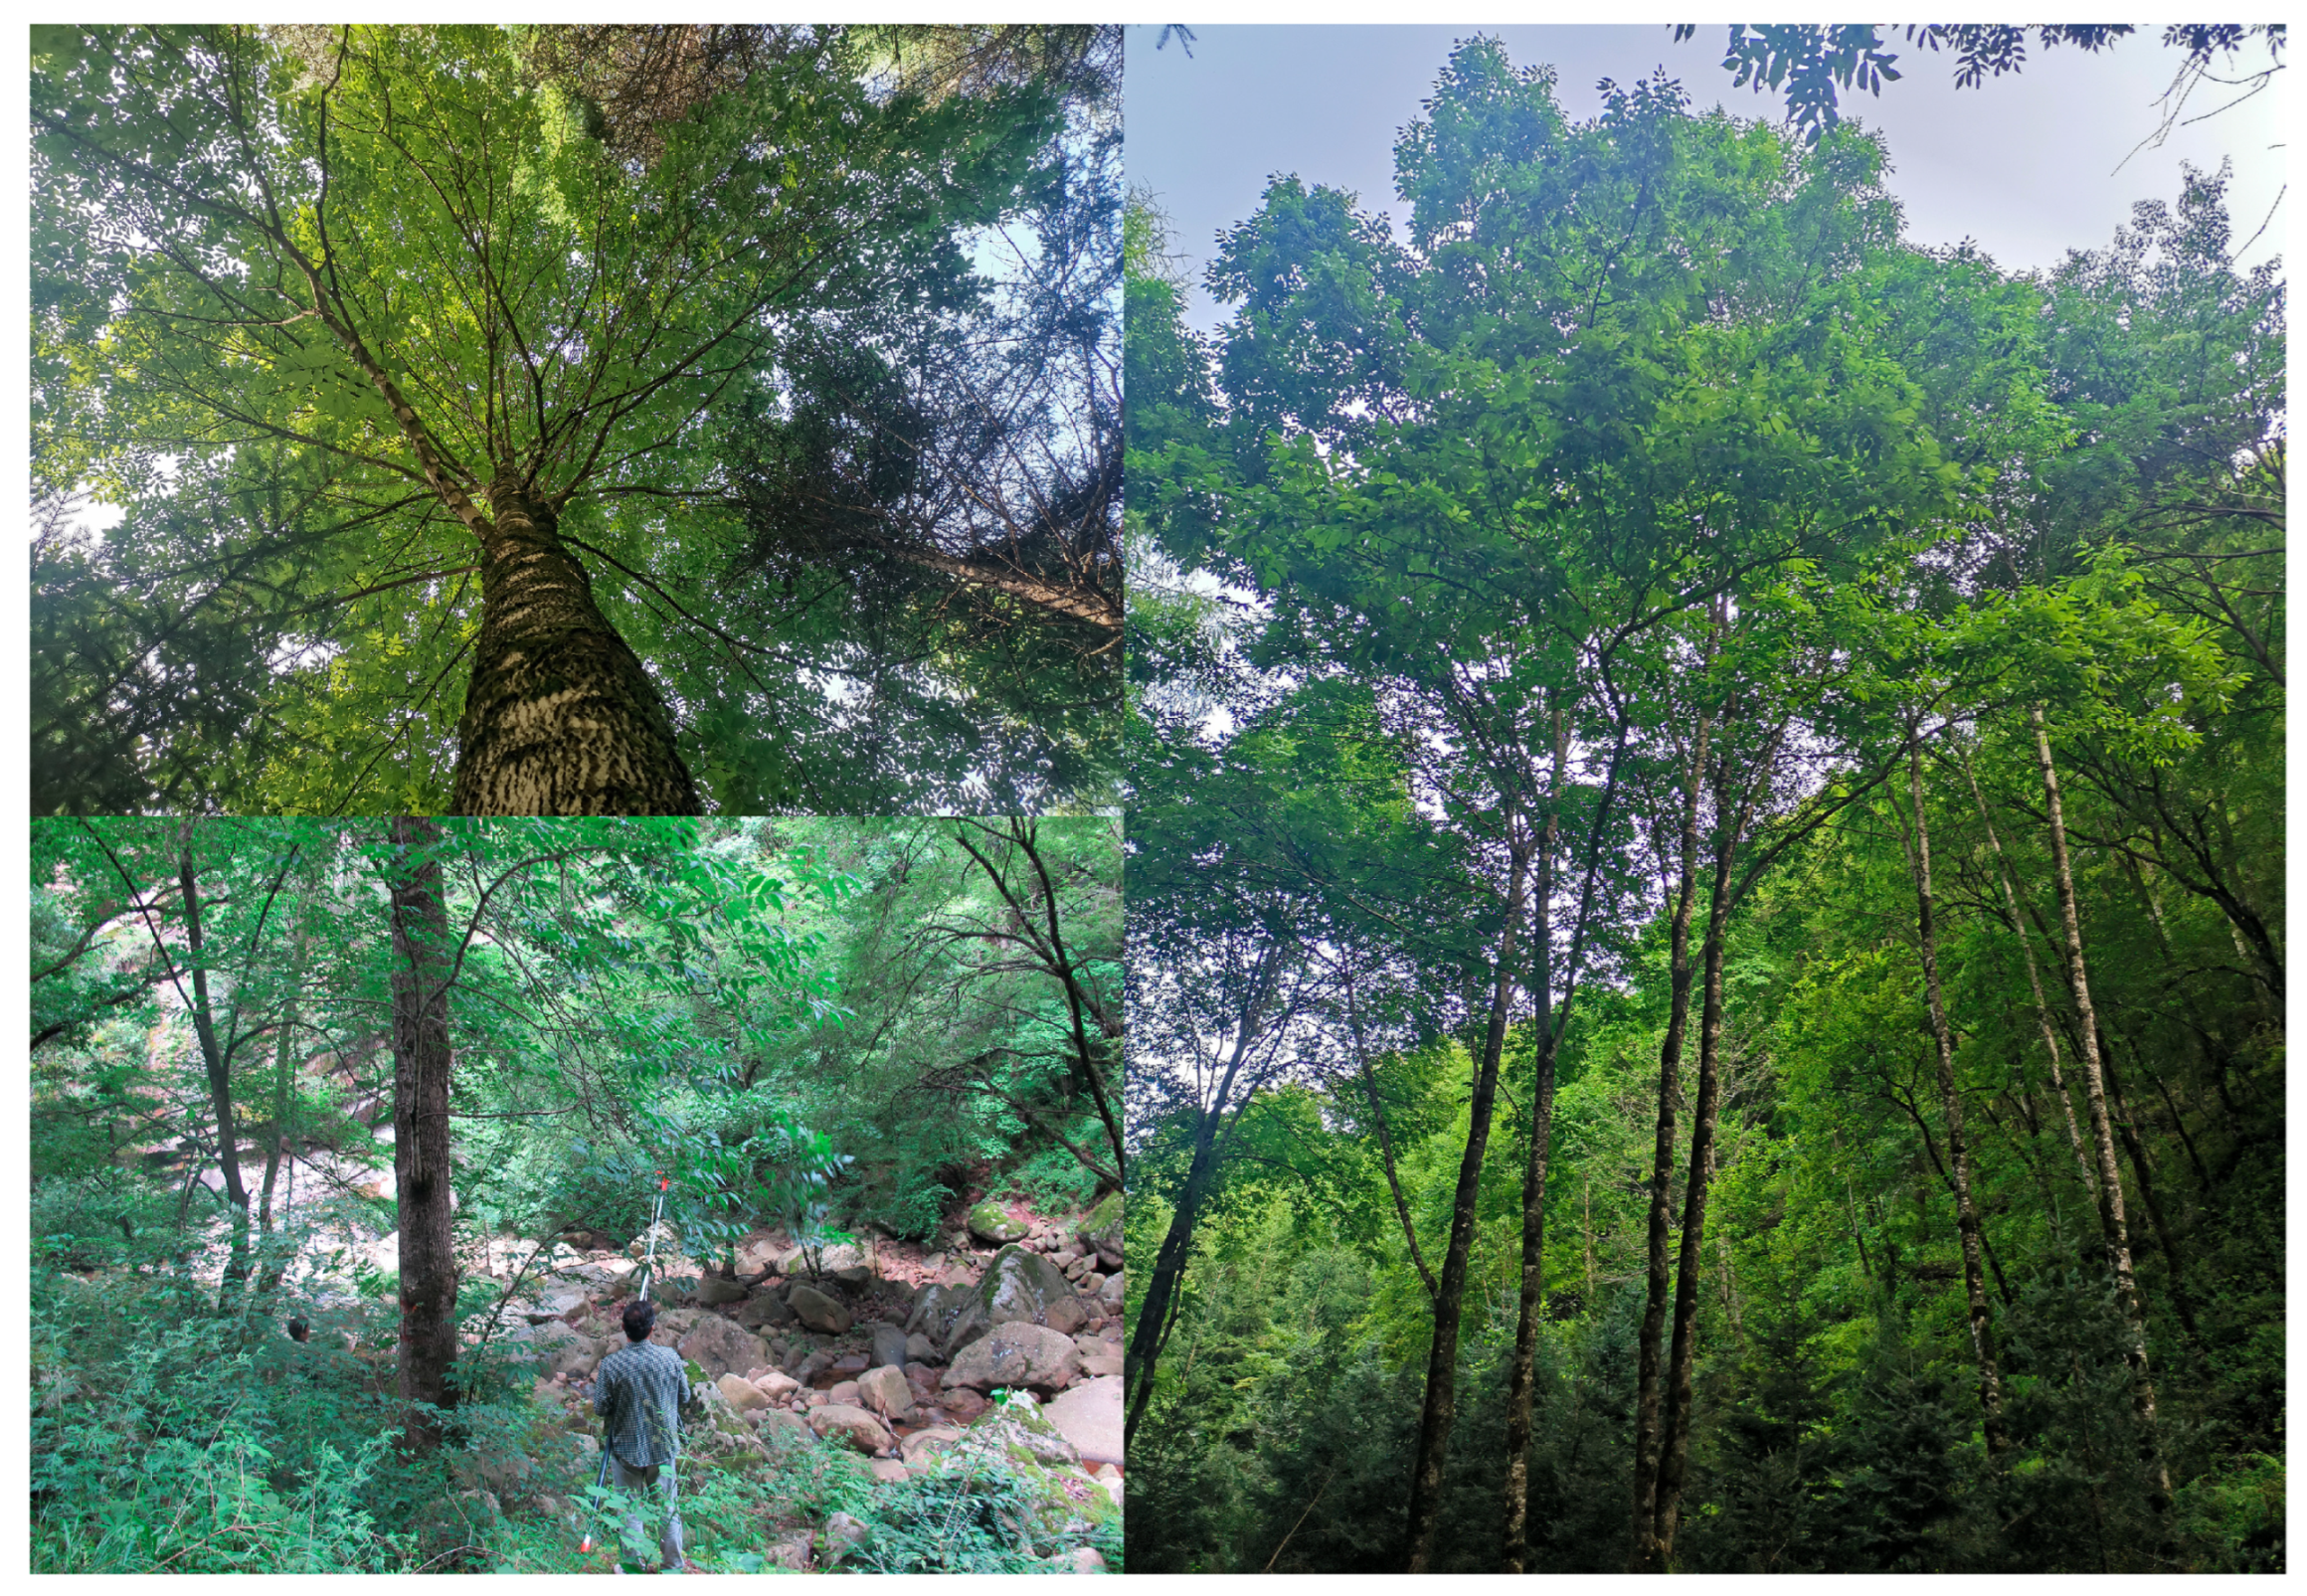
2.1. Sampling and Sequencing

Given the fragmented distribution and limited natural individuals of F. platypoda, we selected 11 geographical areas in NW China with relatively higher densities of F. platypoda individuals. To ensure representativeness, we randomly selected healthy adult trees within each area, with distances between individuals exceeding 150 m. However, the strict sampling criteria and uneven resource distribution (with some areas having dense individuals), which resulted in smaller sample sizes in certain regions, which might influence the results. In total, 65 individuals were collected from the 11 sampling sites. F. platypoda individuals are maintained at the forest germplasm resources bank of the Xiaolongshan Forest Experiment Bureau. Specimens are also preserved at the Natural History Museum of the Chinese Academy of Forestry (museum.caf.ac.cn, CAF 10023401). The fresh leaves of 65 individuals from 11 sampling locations were preserved in silica gel for genome extraction. Detailed information about each accession included in this study is shown in Figure 2 and Supplementary File S1. We used a modified cetyltrimethylammonium bromide (CTAB) extraction method [40] to extract the total DNA from the young leaves of F. platypoda for whole-genome resequencing. The GenoBaits DNA-seq Library Prep kit was used to construct resequencing libraries of quality-checked DNA, which proceeded according to the following steps. The DNA, qualified for quantitative quality inspection, was subjected to DNA fragmentation, end repair, and A-tailing. Subsequently, the sequencing adaptor was ligated, and then Beckman AMPure XP Beads were added to purify the ligation product. The ligation product containing the insertion fragment at 200–300 bp was retained, and the Barcode sequencing adaptor was added. Following the completion of the library construction, a preliminary quantification was performed using Qubit 2.0, and the effective concentration of the library was accurately quantified using the qPCR method to ensure the quality of the library. After the library quality test was qualified, sequencing was performed using the Bgi MGI-2000/MGI-T7 sequencing platform, and the sequencing mode was PE150 mode. The sequencing data are available at https://www.ncbi.nlm.nih.gov/bioproject/PRJNA1035649 (accessed on 4 November 2024).

2.2. SNP Calling

In order to ensure the quality of the information analysis, raw reads must be filtered to obtain clean reads. The filtering process is conducted using the FASTP software (version 0.20.0) with the parameters that follow: -n 10 -q 20 -u 40 [41]. This step of filtering is to remove the adapter sequence, and to remove the N content of more than 10% or of the low quality (Q ≤ 20) base number of more than 40% of the reads [42]. This study utilized the whole genome of F. platypoda as the reference sequence, with an assembled genome size of 610.9 Mb. The assembly contains 237,163 scaffolds (N50 = 7.7 kb) and 241,977 contigs (N50 = 7.4 kb), achieving a sequencing coverage depth of 60×. Clean reads from each individual were aligned to the reference genome (Fraxinus platypoda genome assembly FRAX33-0.1-NCBI-NLM (nih.gov) using the Burrows–Wheeler Aligner (BWA) 0.7.8 software package with the option “mem-t 4-k 32 -M” [43,44]. After mapping, the resulting bam files were sorted using SAMtools 0.1.19 [45] and duplicate reads were removed. Subsequently, the quality of the calibration file is improved. The HaplotypeCaller module of the software GATK (version 4.0.4.0) is used for variation detection, and a total of 60,503,092 SNPs were identified [46,47]. The VariantFiltration module is used for filtering, and the filtering parameters are as follwos: -filterExpression MQ0 >= 4 && ((MQ0/(1.0 * DP)) > 0.1) -filterName HARD_TO_VALIDATE -filterExpression DP < 5|| QD < 2 -filterName LOW_READ_SUPPORT. After filtering, the remaining 3,394,299 SNPs were used for the subsequent bioinformatics analysis.

2.3. Population Genetic Structure Analysis

Based on the filtered SNP data, NJ (Neighbor-Joining method) tree construction was performed using MEGA-X software (model: p-distance, 1000 bootstrapping replicates). The phylogenetic tree file was imported into the Interactive Tree of Life (ITOL, https://itol.embl.de/itol.cgi, accessed on 15 October 2024), an online tool used for displaying, annotating, and managing phylogenetic trees. ADMIXTURE is a software that estimates individual ancestors from multi-site SNP genotype data sets [48]. The statistical model of the software is the same as that of STRUCTURE software, but it can be calculated more quickly. Estimation, because ADMIXTURE v1.3.0 has been verified multiple times over the years, has a high timeliness and accuracy [49,50], and is usually used for population structure analysis. In this study, we used ADMIXTURE (v1.3) software to analyze the population structure of F. platypoda. The model-based ADMIXTURE assigns clusters of all individuals from each geographic location to each taxonomic group, using the number of genetic subpopulations (K) tested from 1 to 15, with each K value running a separate calculation. The genetic composition of each individual in each subpopulation was plotted as a bar graph using POPHELPER software (v2.2.7).

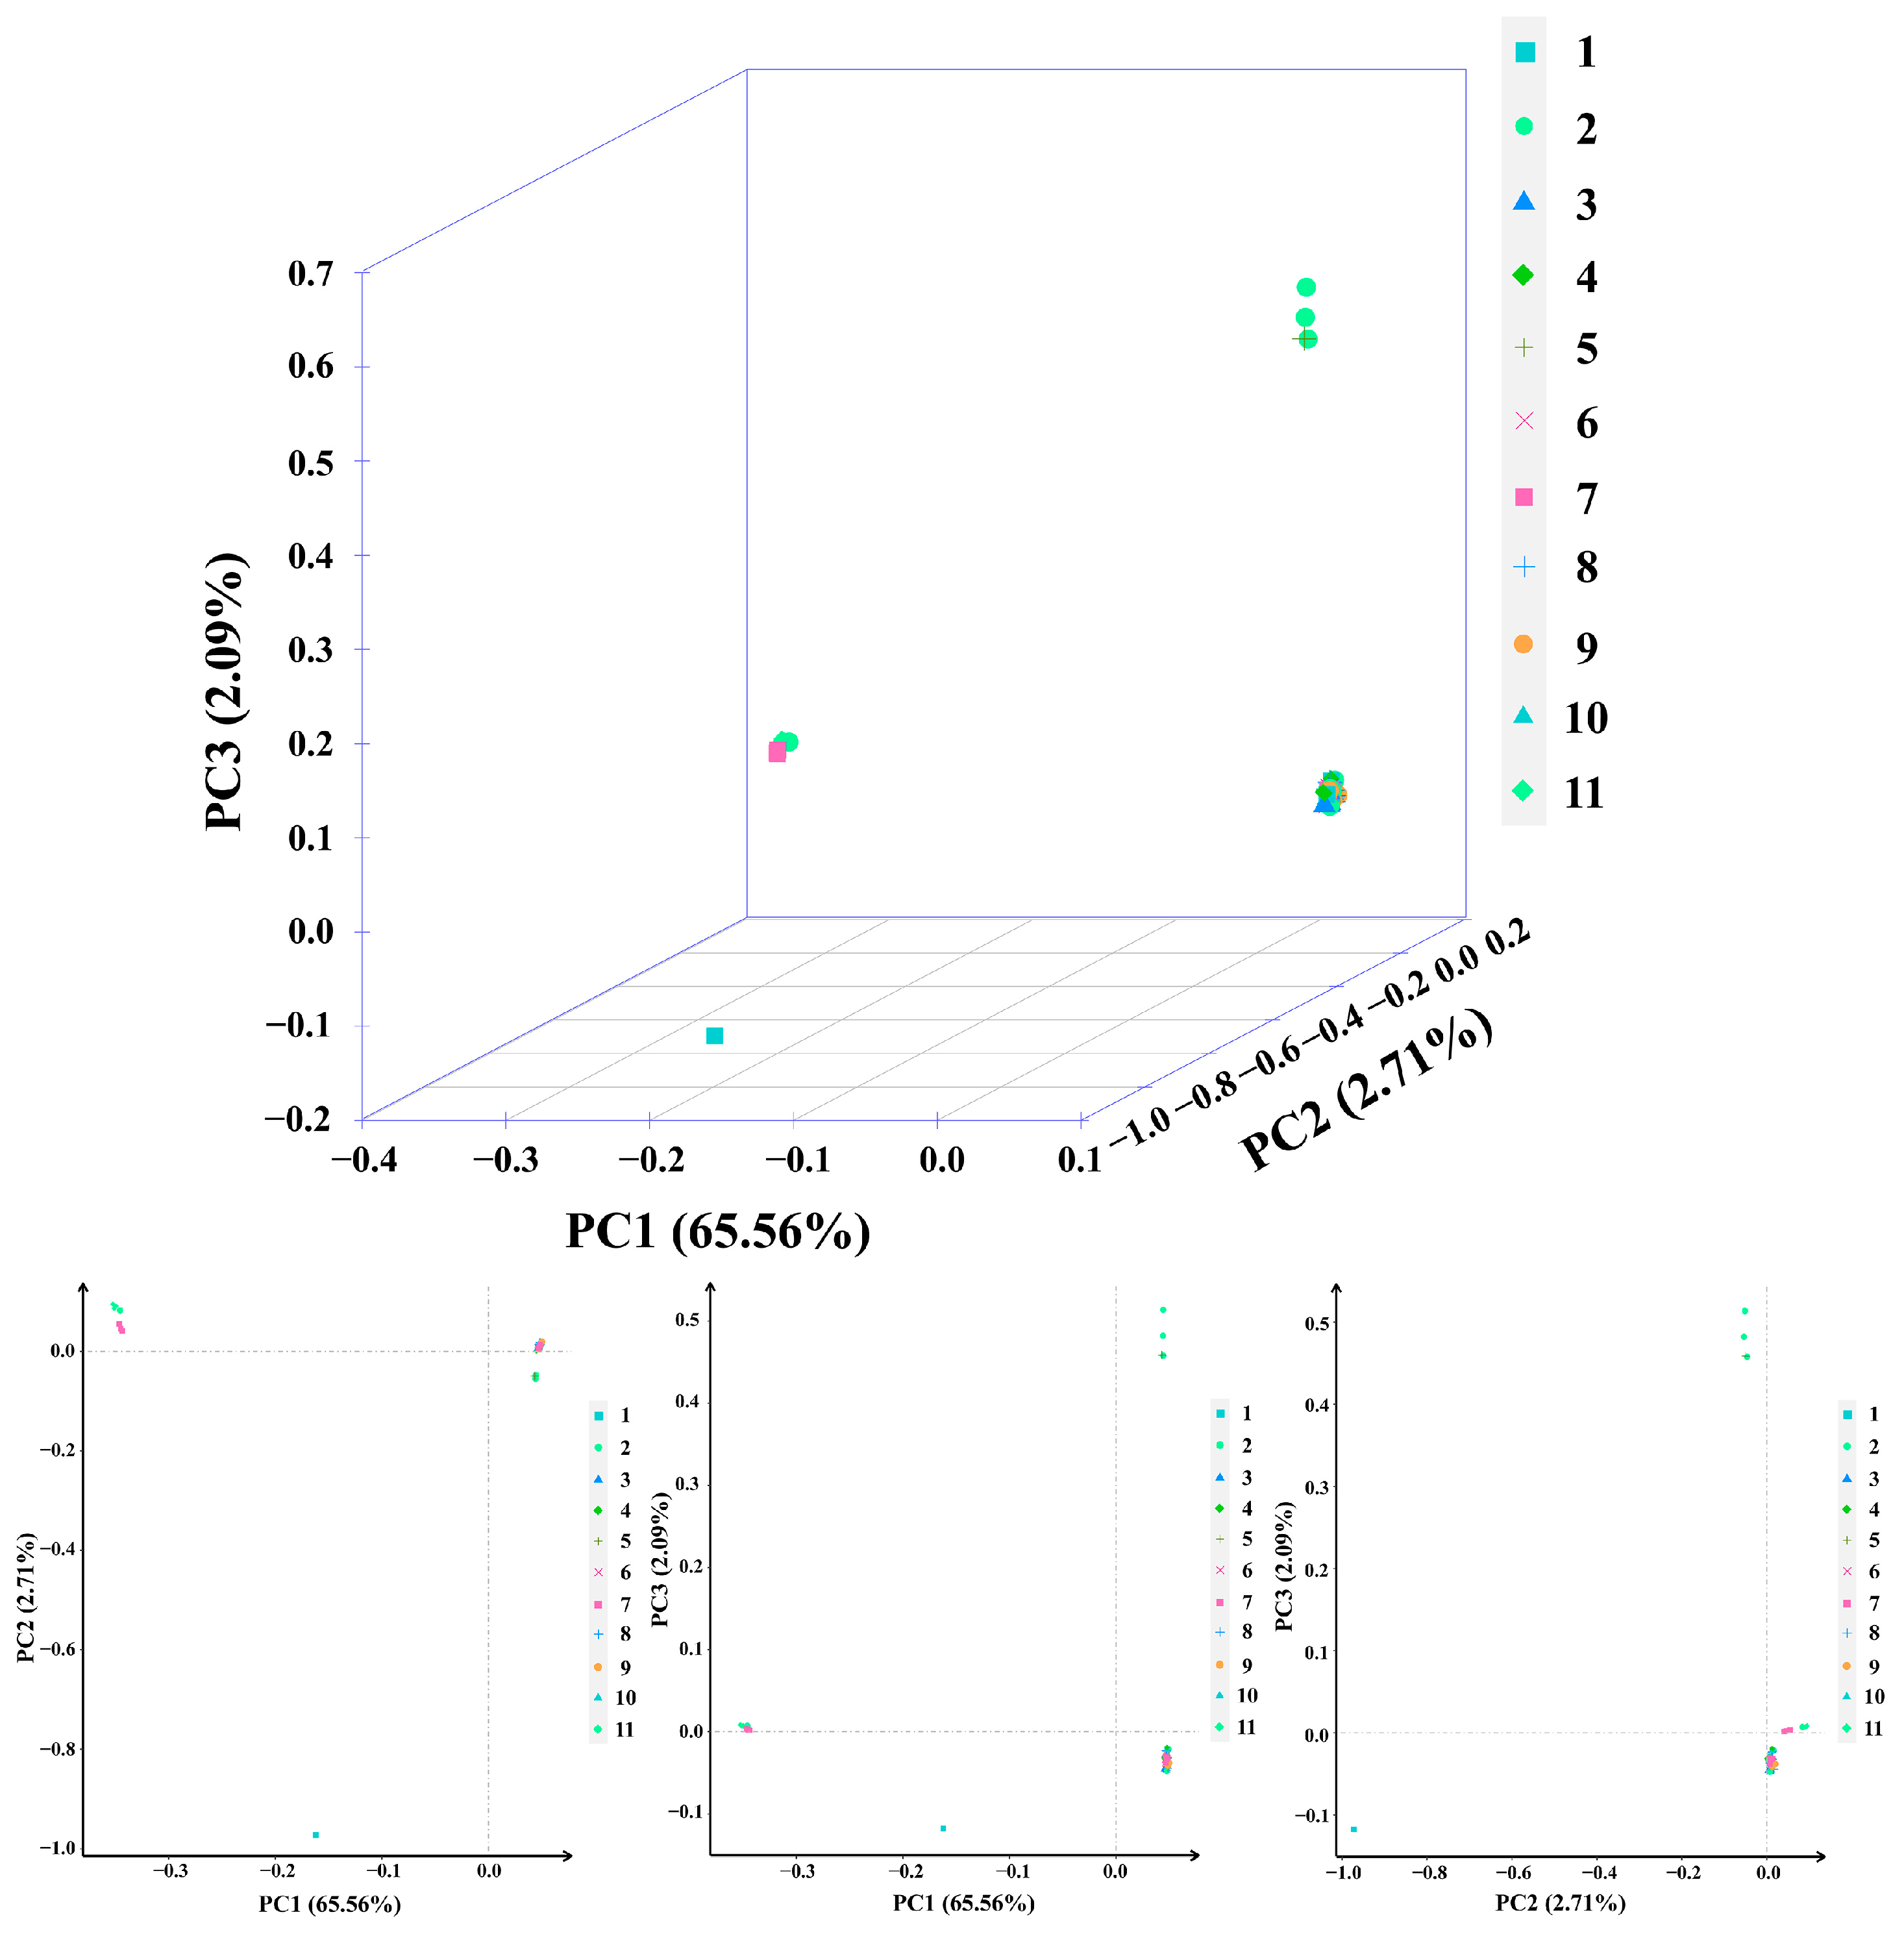
2.4. Principal Component Analysis

Principal component analysis (PCA) is a purely mathematical method that can select a small number of variables with high weights from multiple related variables. We used GCTA v1.92.4 software to perform principal component analysis on SNPs obtained from 65 individuals, and then based on the generated out.eigenvector file, we used the R package to plot [51,52]. In the PCA plot, each group was represented by different numbers. To better visualize the kinship of the 65 individuals of the F. platypoda, the filtered data were read into the GCTA software (v1.92.4), a kinship matrix was constructed, and it was imported into the R software v4.4.1 for visualization [53].

2.5. Linkage Disequilibrium Analysis

The phenomenon in which two genes are inherited simultaneously at different sites in a population at a significantly higher frequency than the expected random frequency is called linkage disequilibrium (LD). Linkage disequilibrium analysis is performed to obtain the minimum genetic unit of a species [54]. The linkage of SNPs in all individuals was analyzed by combinations of SNPs in the same chromosome. It was expressed as the coefficient of LD (r2) in the natural population, and r2 closer to 1 represents a stronger linkage [55]. Most of what is commonly referred to as LD is intrachromosomal LD, and LD intensity is expressed as D’ or r2. Based on the filtered SNP markers, the software PopLDdecay v3.41 was used to calculate the size of the LD (r2) between two markers and plotted it as a function of the increase in distance [56].

2.6. The Analysis of Molecular Variance and Genetic Diversity

Diversity analysis within the F. platypoda collection was evaluated using the VCFtools v0.1.16 (https://vcftools.github.io/man_latest.html, accessed on 10 October 2024) [57], and in-house perl scrip based on 3,394,299 SNPs, including the minor allele frequency (MAF), polymorphism information content (PIC), nucleotide diversity (Pi), expected heterozygosity (He), observed heterozygosity (Ho), and Tajima’s D with default parameters. Additionally, to assess the degree of differentiation among groups, we calculated pairwise Fixation Index (FST) among groups using VCFtools v0.1.16 and selected the Weir and Cockerham weighted FST from the results.

2.7. Isolation by Distance (IBD)

To assess the impact of geographic isolation on the distribution of genetic variation in F. platypoda groups within fragmented habitats, we conducted an IBD analysis using a Mantel test. This statistical method evaluates the correlation between two distance matrices. Geographic distances, calculated as Euclidean distances from the coordinates (longitude and latitude) of individual trees, were correlated with genetic distances, which were measured as FST/(1 − FST). For this analysis, we employed the mantel function from the vegan package in R, following the methodology outlined by Guillot and Rousset [58].

3. Results

3.1. Quality Control and the Filtration of Data

Whole-genome resequencing of 11 natural groups of F. platypoda was performed using the Illumina sequencing platform. Each sample had an average sequencing depth of 10×. After filtering out low-quality reads and those with adapters, a total of 292.74 G of clean data was obtained, with an average of 5.05 G per individual, and an average genome coverage of 82.3%. The proportion of base quality Q30 reached 88.96%. The aforementioned results indicate that the similarity between each individual and the reference genome meets the requirements for resequencing analysis, enabling subsequent analysis. After the quality control of the data, 60,503,092 SNP positions were obtained. After further filtering, 3,394,299 SNP positions were retained for subsequent analysis.
Whole-genome resequencing of 11 natural F. platypoda groups was conducted on the Bgi MGI-2000/MGI-T7 sequencing platform. Each individual was sequenced to an average depth of 10×. After removing low-quality reads (Phred score < 20) and adapter sequences using Trimmomatic v0.39 (sliding window = 4:20), 282.15 Gb of clean data were retained. Reads were aligned to the F. platypoda reference genome using BWA-MEM v0.7.17, achieving a mean alignment rate of 81.2%. Variant calling via GATK v4.2.6.1 HaplotypeCaller identified 60,503,092 raw SNPs. A stepwise filtering pipeline was applied by VCFtools v0.1.16: Minor allele frequency (MAF): 29,541,710 SNPs retained (MAF ≥ 0.05). Missing data: 4,550,566 SNPs retained (site missing rate ≤ 20%). Heterozygosity: 3,738,087 SNPs retained (individual heterozygosity ≤ 50%). Biallelic sites: 3,394,299 high-quality SNPs retained (non-biallelic loci excluded). These filtered SNPs were used for downstream population genomic analyzes.

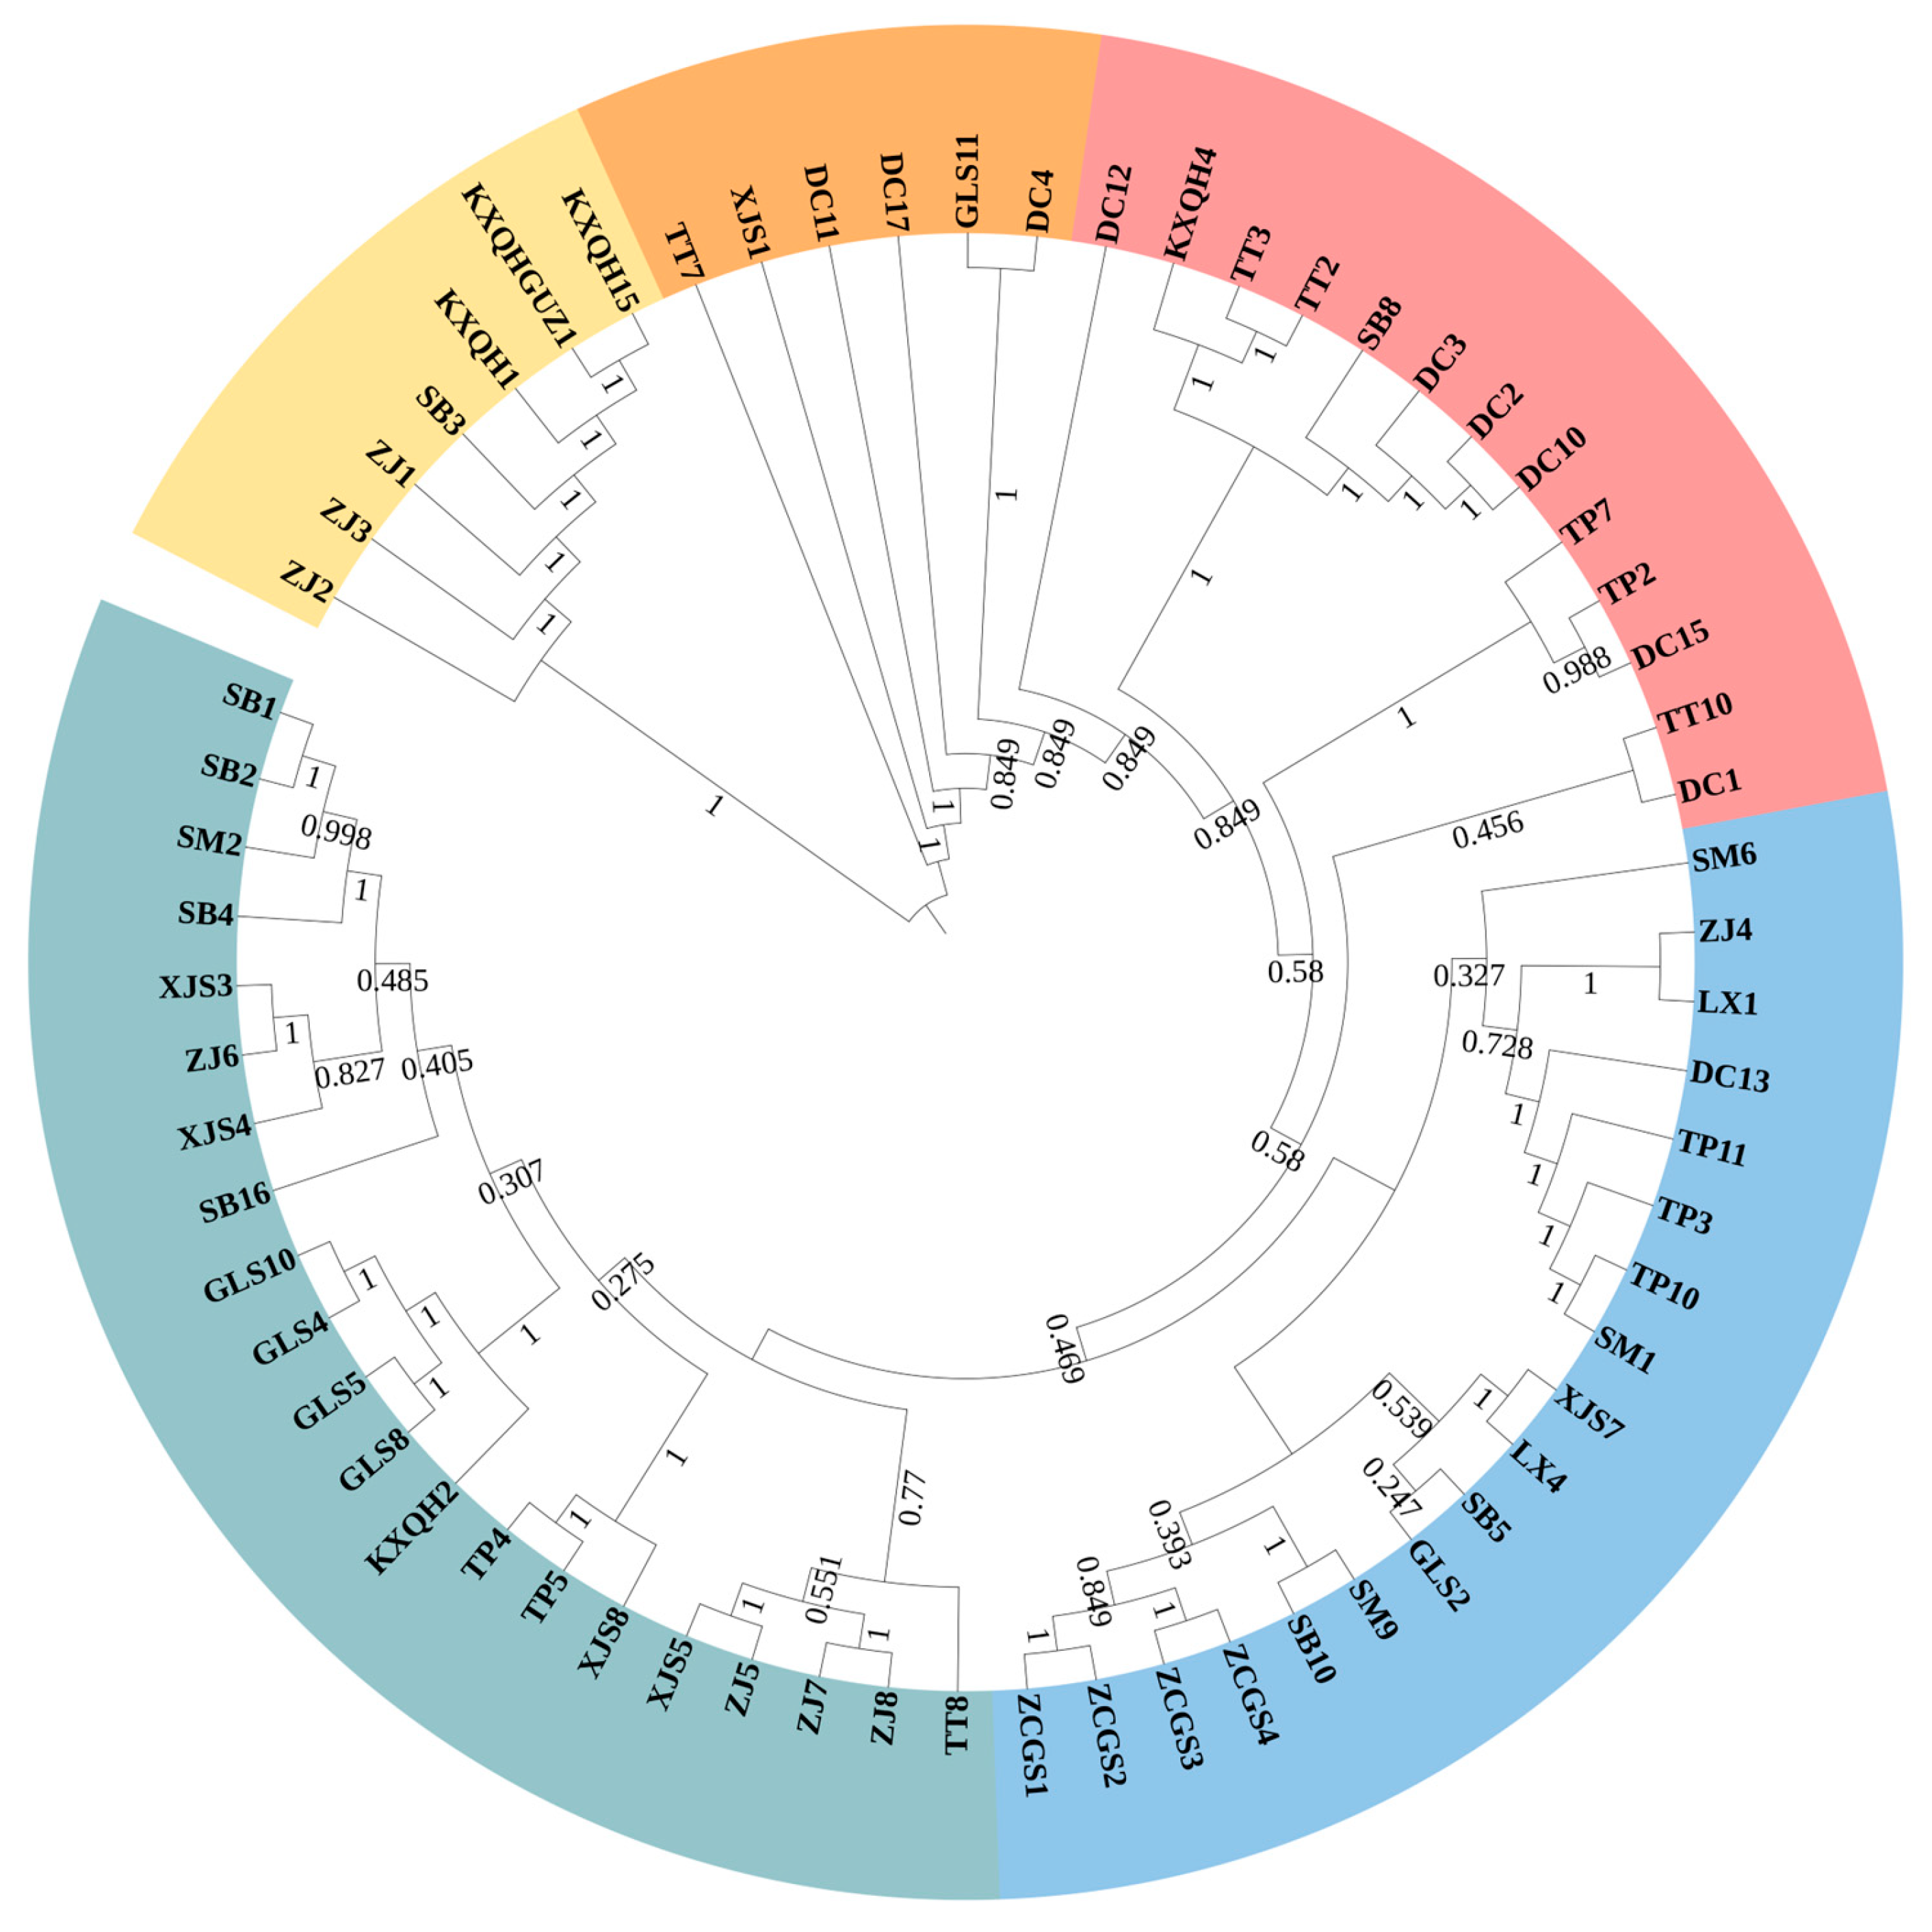
3.2. Phylogenetic Relationship

In this study, a phylogenetic tree of 65 F. platypoda individuals was constructed based on the NJ method (Figure 3). Within the tree, individuals grouped in the same clade indicate that they share a common ancestor [59]. The results revealed that F. platypoda is divided into two major clades, with no apparent genetic boundaries among the natural groups.
Firstly, eight individuals from Group 3 (KXQHGUZ1, KXQH1, KXQH15), Group 5 (SB3), Group 11 (ZJ1, 2, 3), and Group 8 (TT7) were separated from the others and formed a single clade (Cluster I), indicating that they were of the same ancestral origin and were distantly related to other individuals. As shown in Figure 2, the groups (3, 8, and 11) to which these eight individuals belong are connected by roads, and Group 5 is close to Group 11. The remaining individuals share a second clade (Cluster II). To gain a more comprehensive understanding of their interrelationships, they were systematically classified into four distinct groups. The first group consisted of five individuals (from Group 1, 3, and 9, respectively), while the second group of 13 individuals mainly originated from Group 1 and Group 8. The remaining two groups of 39 individuals from the phylogenetic tree are the same as a branch, indicating that they are closely related. It is worth noting that the individuals in Group 7 appear in multiple groups, which indicates that the genetic background of this group is more complex than that of other groups.

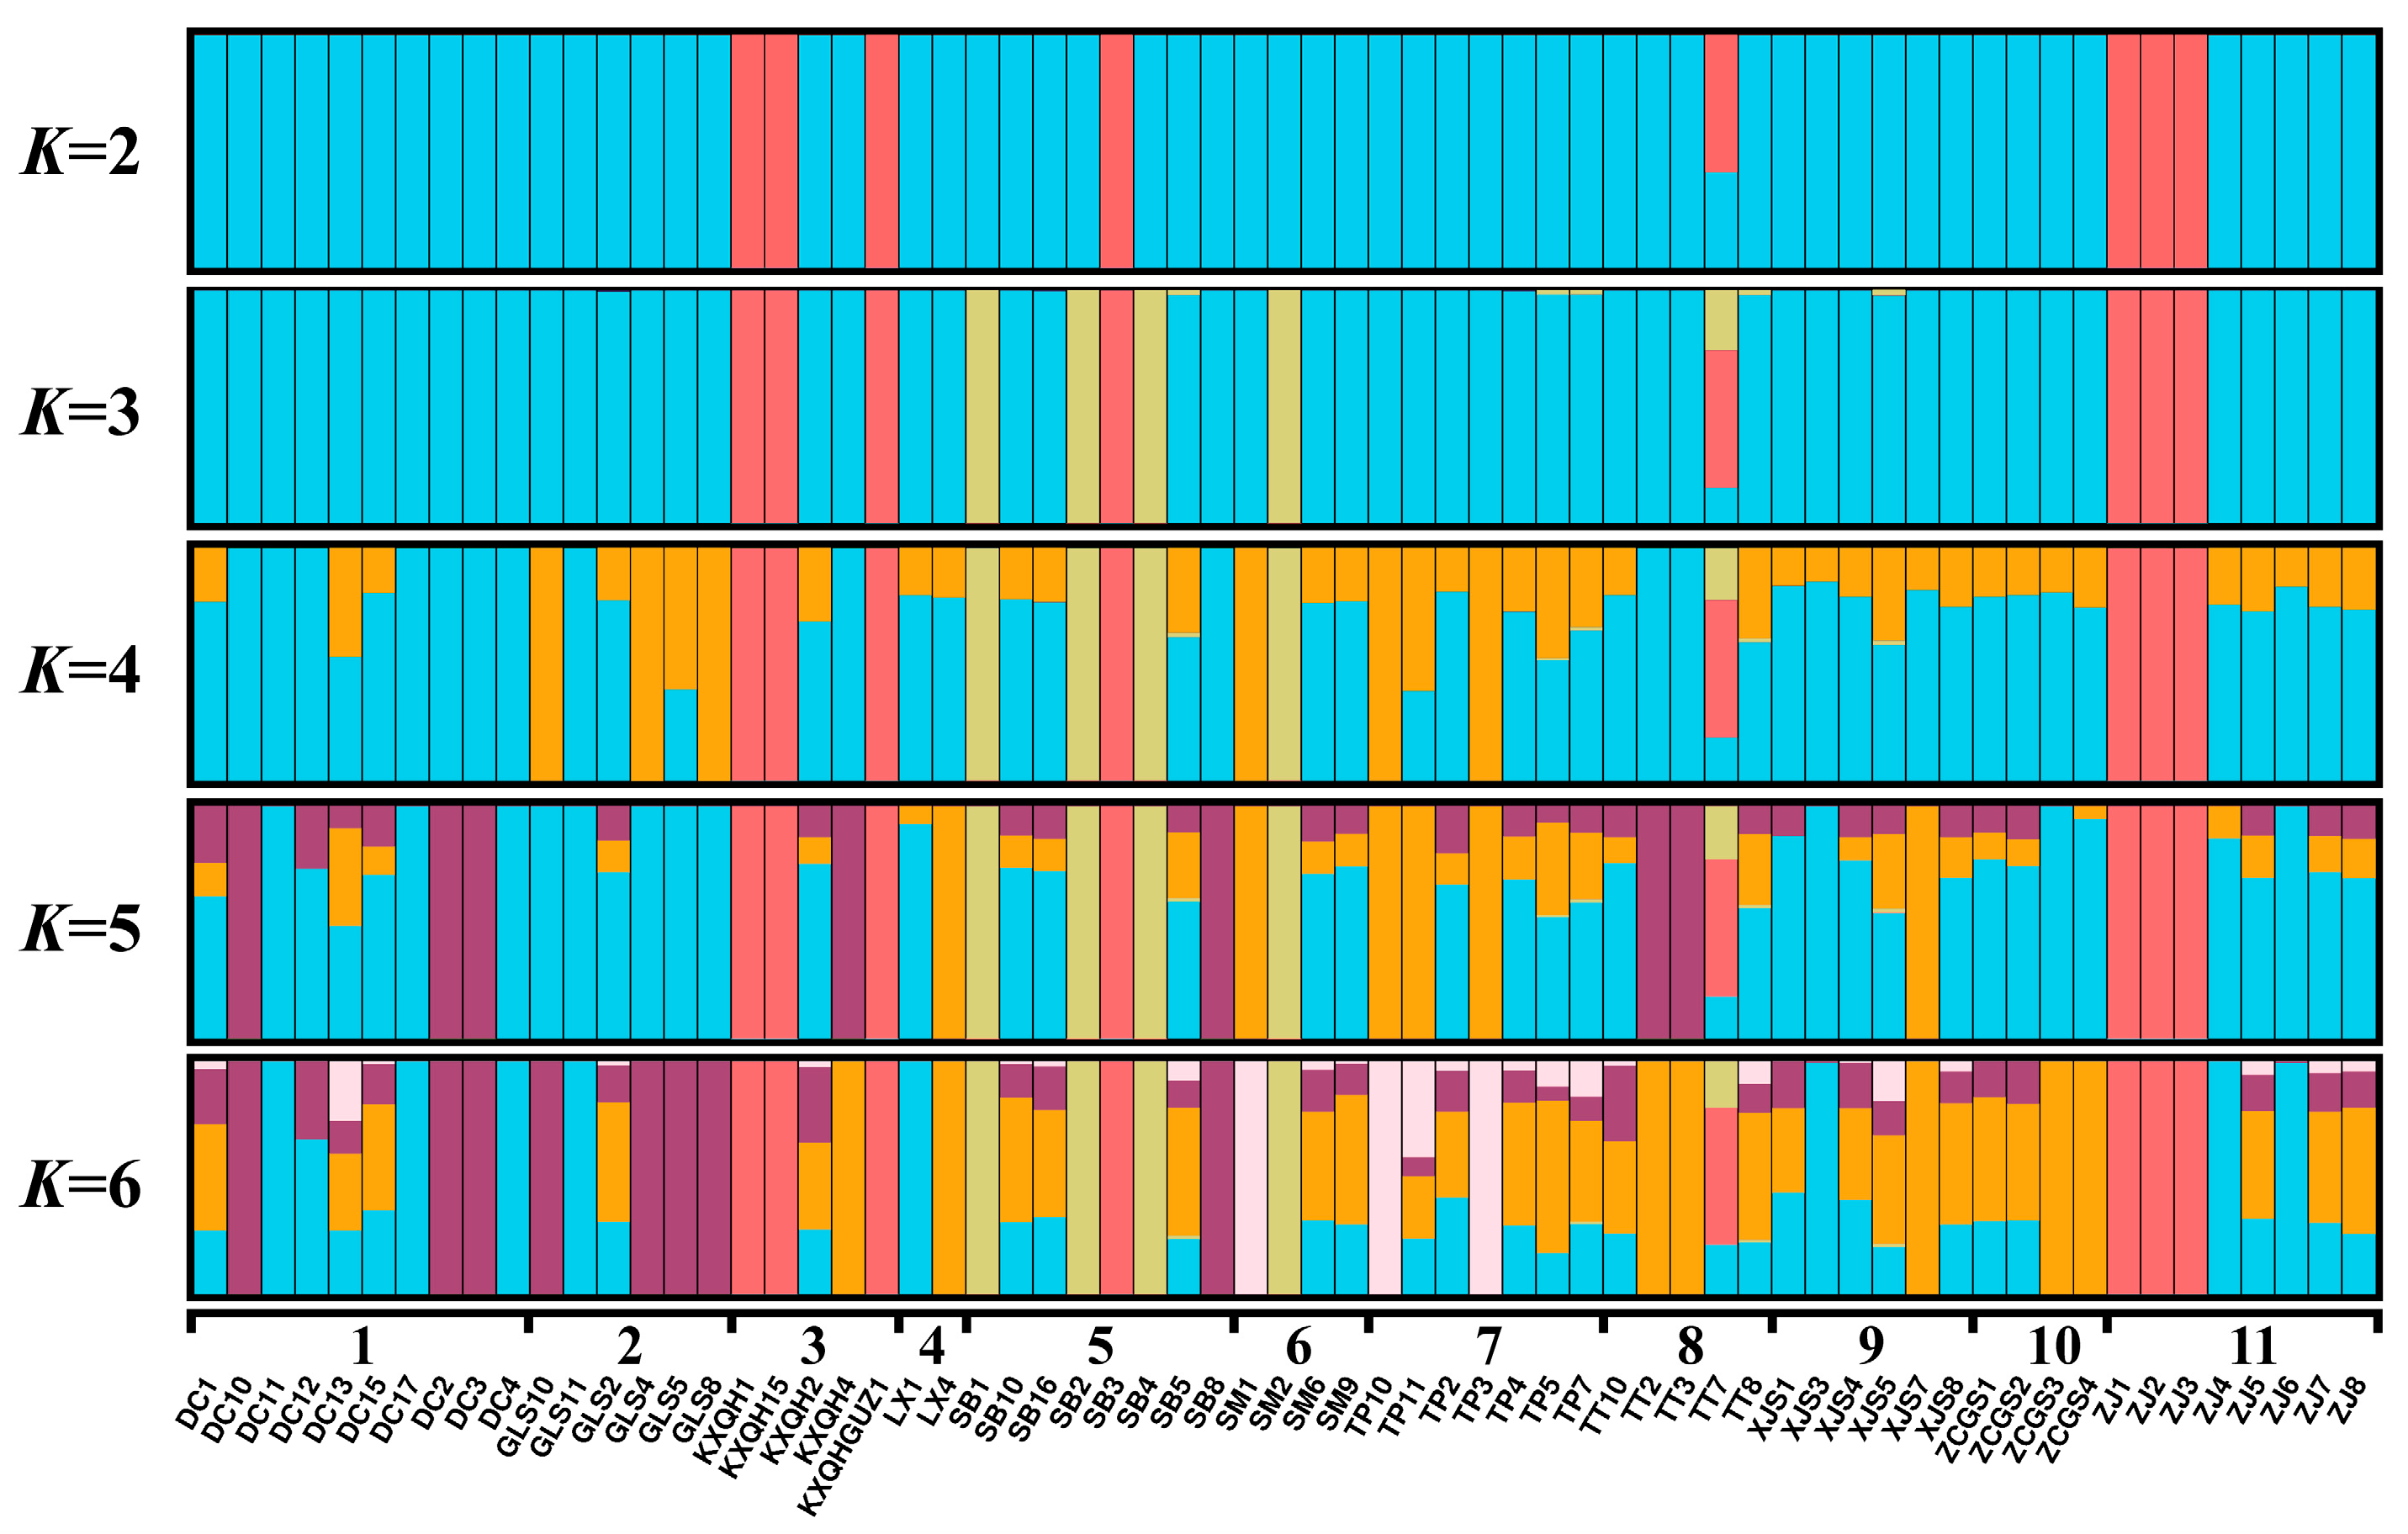
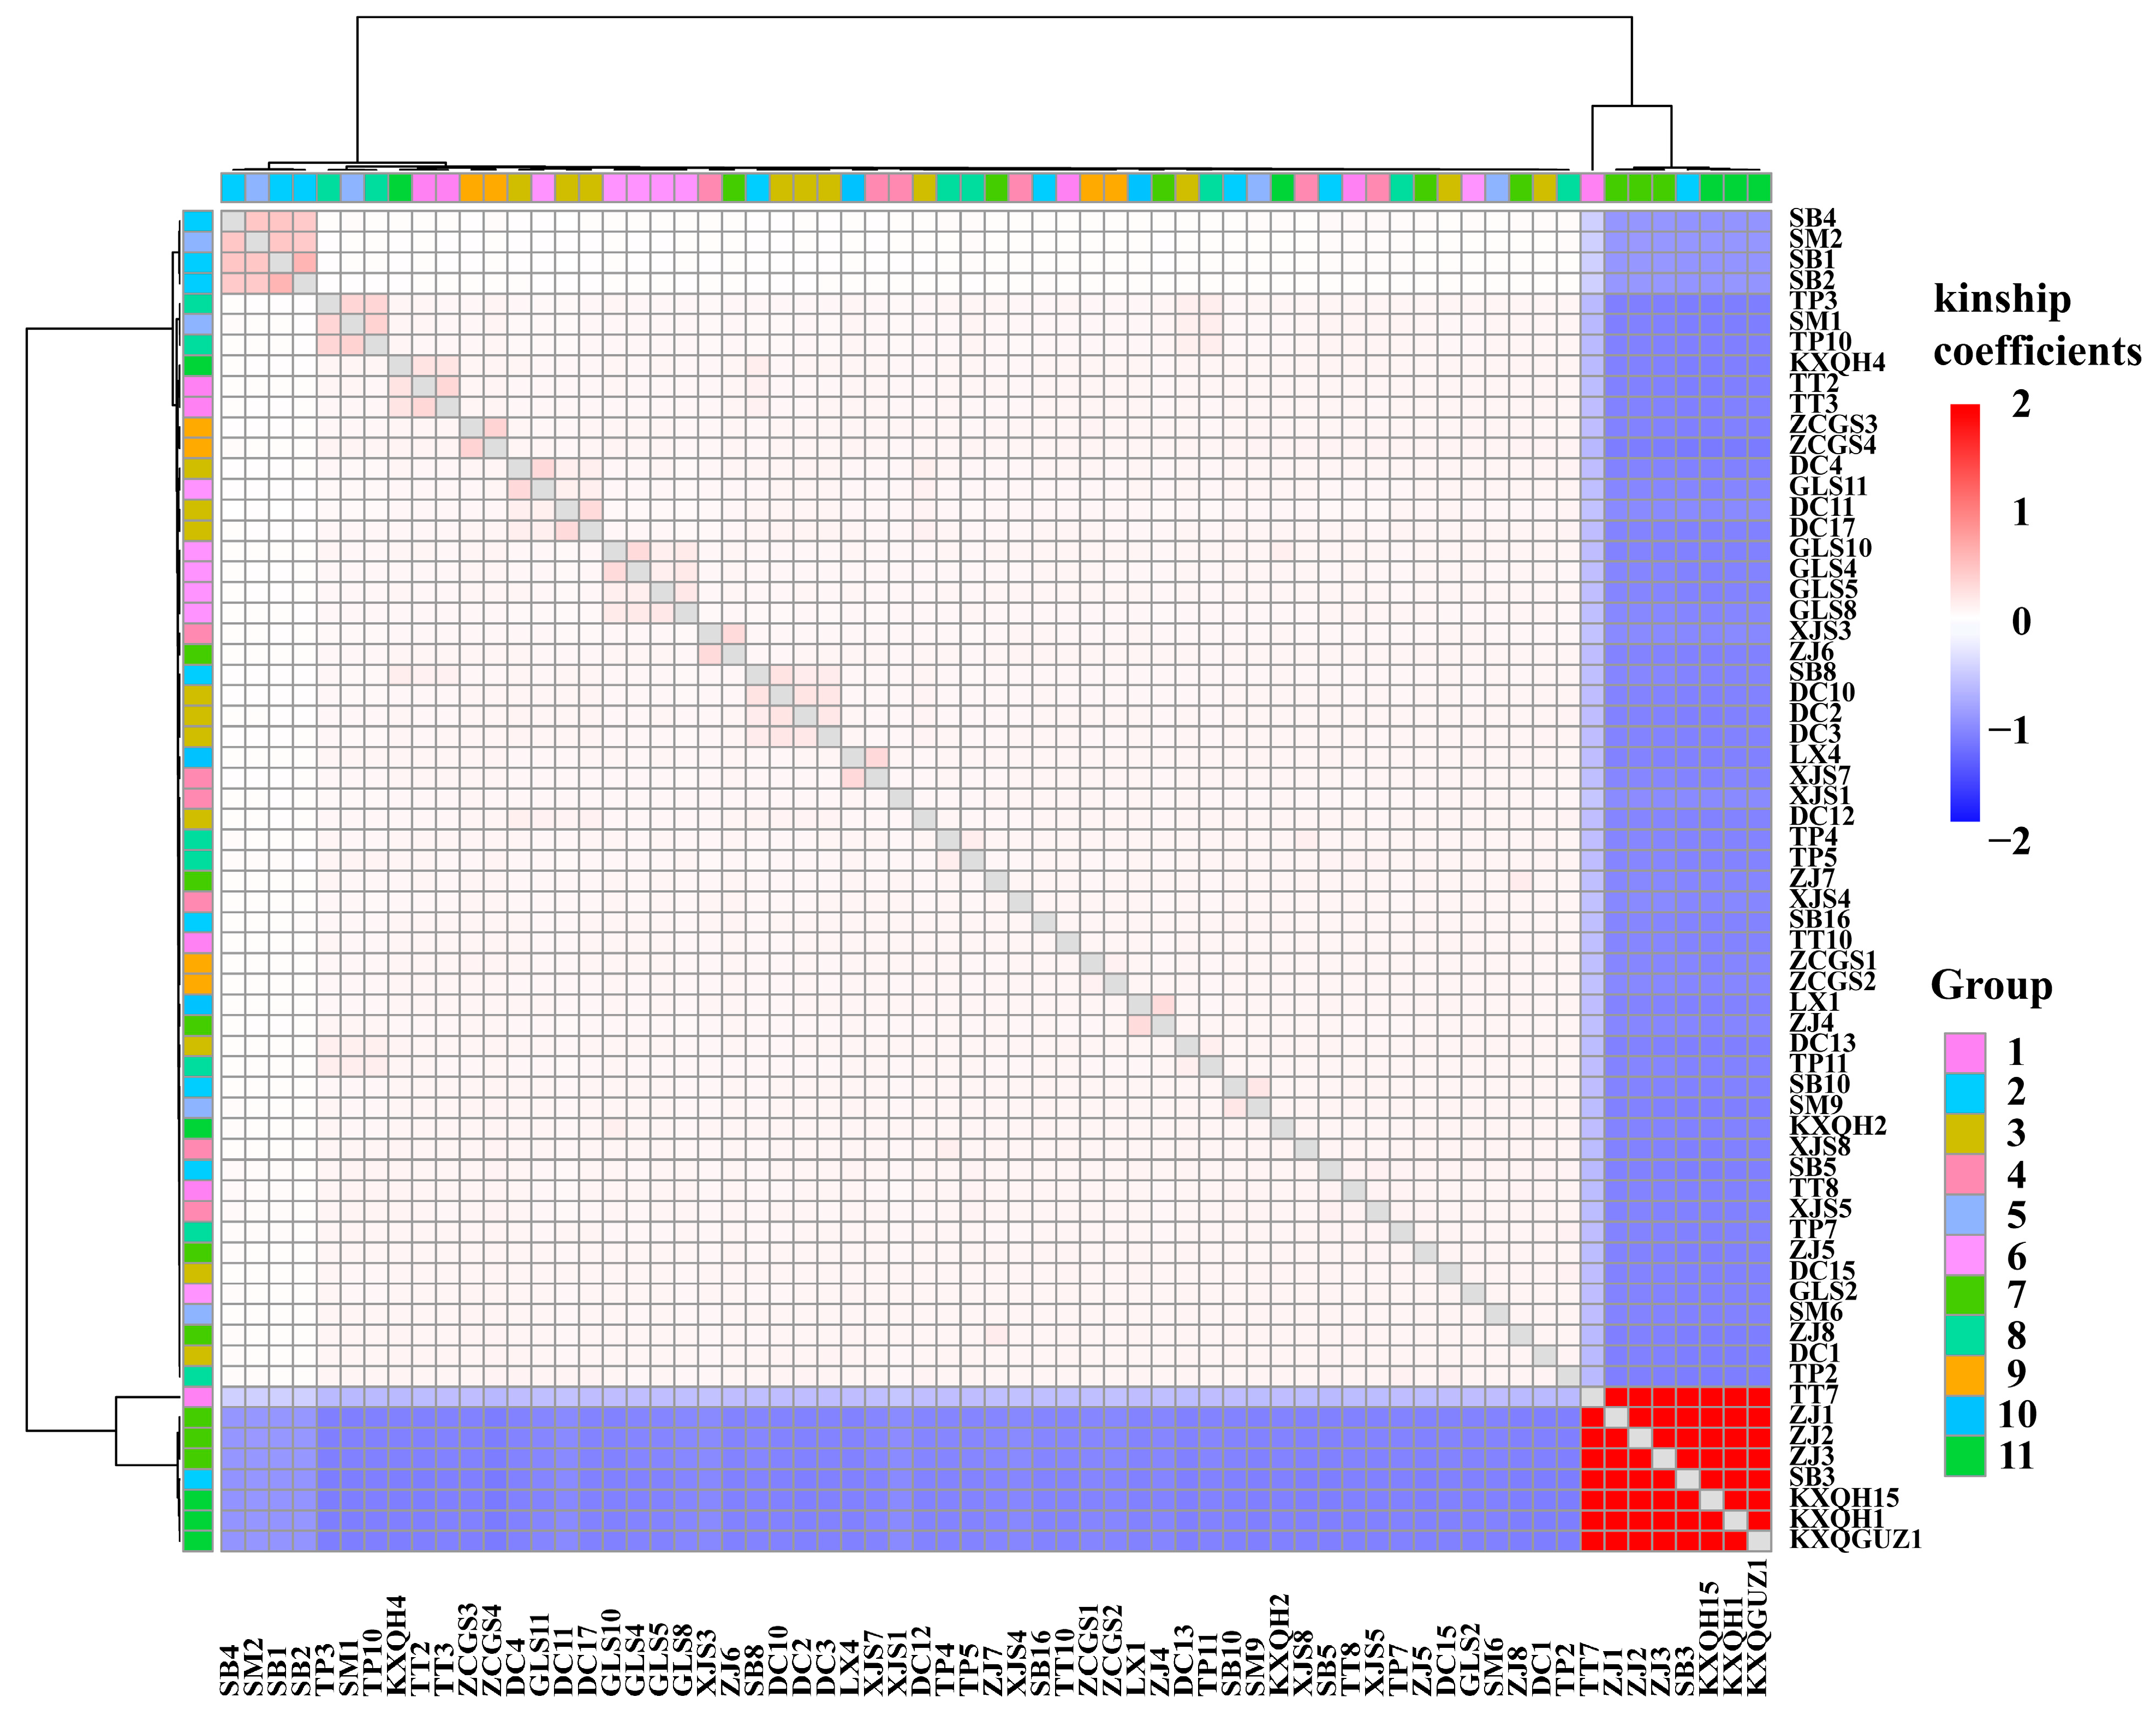
3.3. Population Genetic Structure

To gain insights into the genetic structure of the F. platypoda individuals, an analysis was conducted on 11 F. platypoda groups (Figure 4 and Figure 5). The clustering was performed by the Bayesian algorithm, assuming the number of groups (K value) of 65 individuals to be 1–15. As shown in Figure 4, when K = 2 to 6, the CV error (cross validation error) is relatively small, and it is the lowest at K = 2. When K = 2, all the individuals are from a single ancestor except TT7. The first cluster (Cluster II) includes the majority of individuals, and the second cluster (Cluster I) includes most of the individuals from Group 3 and Group 11. When K = 3, three individuals (SB1, 2, and 4) from Group 5 and one individual (SM2) from Group 6 are further separated. When K = 4, some individuals from Group 2, Group 7, and Group 6 showed an ancestor origin. When K = 5 or 6, the population structure bar plot showed that most of the individuals were genetic admixture individuals except for some individuals from Group 5 and Group 2, Group 3 with Group 11, Group 10 with Group 9, and Group 1 with Group 11, that may be from a single ancestor. When K = 2–6, the individual TT7 always has multiple ancestral sources. According to the lowest point of the CV error corresponding to the K value to determine the optimal number of groups as two, it indicated that all F. platypoda individuals may originate from two original ancestors (Figure 5).
In this study, we performed PCA based on SNP data from 65 F. platypoda individuals (Figure 6). The results show that the first three principal components account for 65.56% (PC 1), 2.71% (PC 2), and 2.09% (PC 3) of the total variation, respectively. The 65 individuals are roughly divided into four groups: the first cluster consists of some individuals from Groups 2, 7, and 11, the second cluster includes some individuals from Group 2 and 5, the third cluster includes those from Group 1, and the remaining individuals form the fourth cluster. Combined with the results of the CV error (Figure 5), when K = 4, some individuals in Group 2 and Group 7 are separated from other individuals, which is a separate ancestral source, similar to the results of this analysis. The geographic location of Group 5, Group 7, and Group 11 in the first two clusters is relatively close to each other, but Group 2 is relatively far. However, when we analyze this in conjunction with Figure 2, it becomes evident that there is a distinct road connection between Group 2 and both Group 5 and Group 7.
In order to more clearly show the genetic relationship between individuals and supplement the analysis of population genetic structure, the study constructed a kinship heatmap for the 65 individuals of F. platypoda based on GCTA (Figure 7). As shown in the figure, all individuals are divided into two major clades. Eight individuals from Group 3, Group 5, Group 11, and Group 8 constitute one major clade (Cluster I), while the remaining individuals form another major clade (Cluster II). This result is consistent with the genetic structure results and phylogenetic tree (Figure 3), indicating that these eight individuals have a close kinship. Furthermore, from Figure 5, we can observe that in the second clade, four individuals from Group 5 (SB1, 2, and 4) and Group 6 (SM2) cluster together (the upper left corner of the heat map), and the four individuals are relatively distant from the other individuals within this clade. This result is consistent with the result when K = 3 (Figure 5). At the same time, we can find that TP3, SM1, and TP10 were closely related, and KXQH4, TT2, and TT3 were closely related.

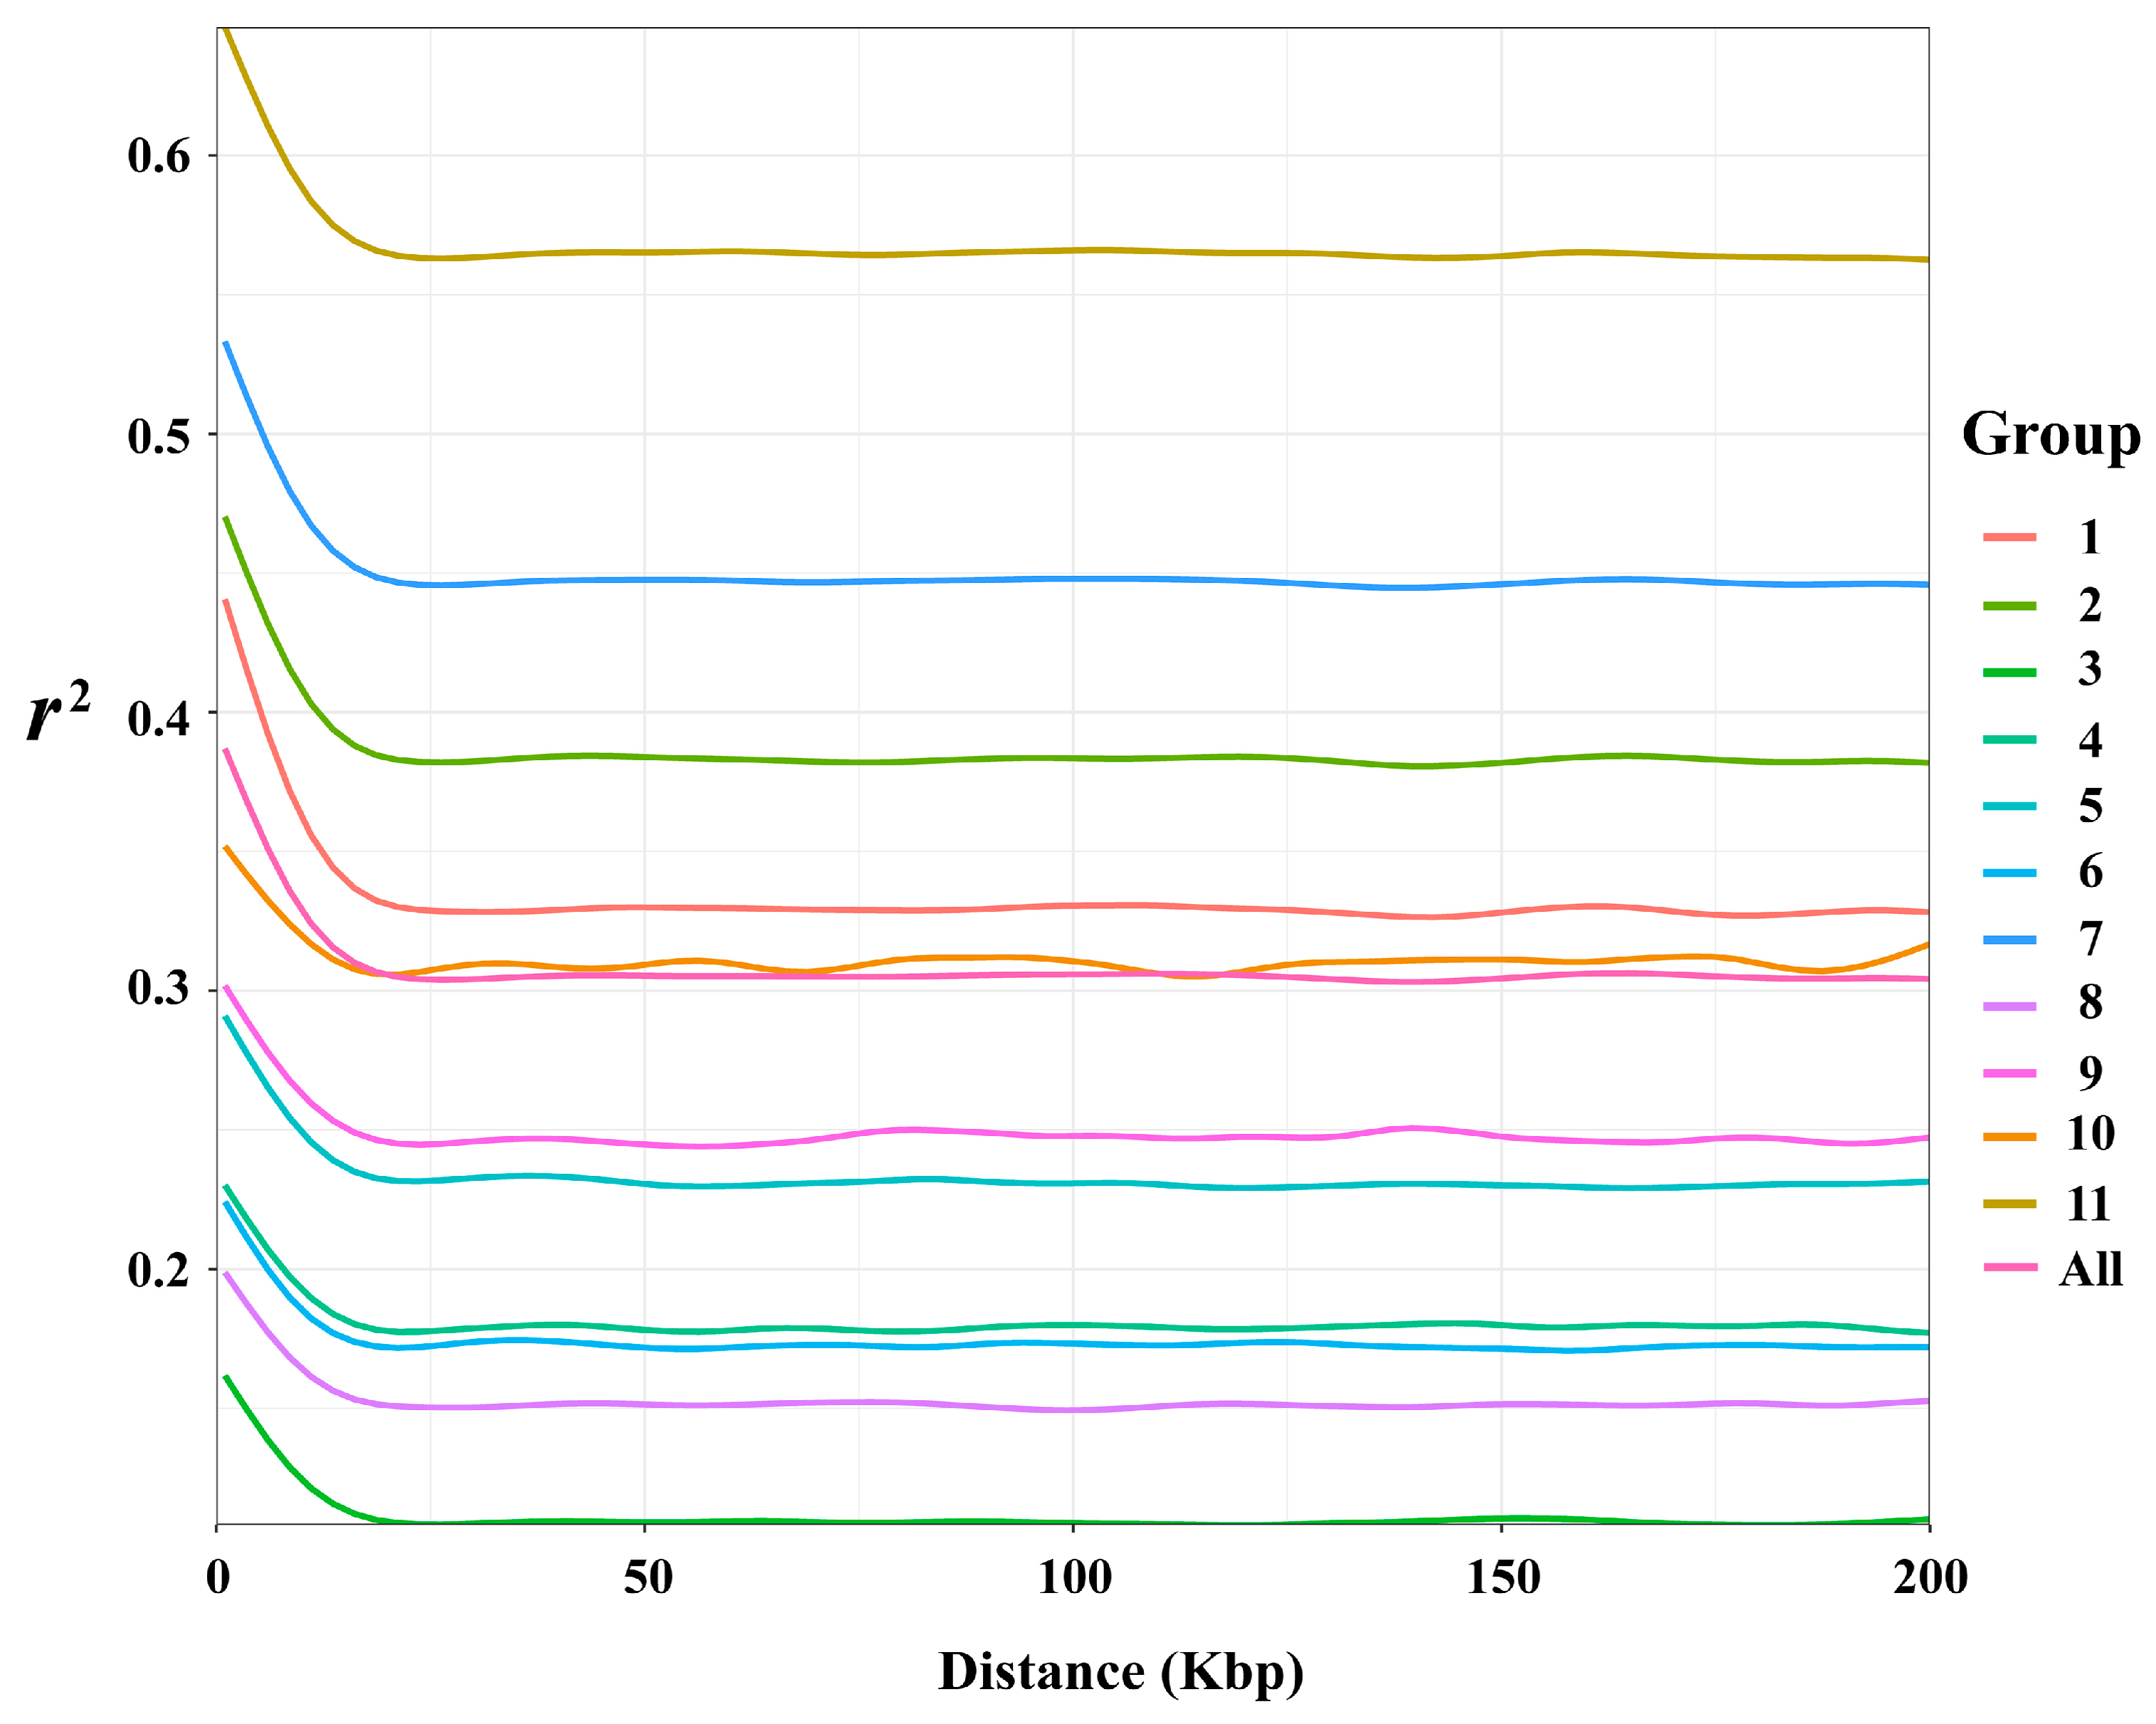
3.4. Linkage Disequilibrium Decay

We conducted a linkage disequilibrium (LD) analysis across 11 groups, with the results presented in Figure 8. At extremely short physical distances, there were significant differences in r2 among the groups. Within short distances, Group 3 exhibited the lowest r2, followed by Group 8. This suggests that these groups have complex evolutionary histories and a higher genetic diversity, which may be attributed to long-term random mating or a larger effective population size. In contrast, Groups 11, 7, 2, and 1 had a higher r2, indicating strong LD between SNPs and the retention of allelic combinations during inheritance. This implies a lower genetic diversity in these groups, likely due to a bottleneck effect that reduced genetic variation. However, when considering the decay rates, Groups 1, 2, 7, and 11 exhibited a faster LD decay, suggesting higher recombination rates. Yet, these groups also had a higher r2 at extremely short distances, implying that they may have experienced shorter evolutionary times or multiple gene flow and admixture events, which disrupted LD at short distances. Conversely, Groups 10, 8, and 3 had slower decay rates but a relatively lower r2, indicating that they may have undergone longer evolutionary times, possess complex genomic structures, and have lower recombination rates.

3.5. Population Diversity Analysis

This study assessed the genetic diversity of 11 F. platypoda groups, aiming to analyze the genetic diversity within the region (Table 1). MAF, defined as the frequency of recessive or minor alleles in a specific population [60], ranged from 0.0674 to 0.2609 across the 11 groups. PIC, which reflects genetic diversity based on the number and frequency distribution of alleles [61], varied from 0.2083 to 0.3224. Pi values spanned from 0.0005 (in Group 1, 2, 4, 9, and 10) to 0.0016 (in Group 3 and 11), highlighting greater genomic nucleotide differences in the latter two groups. Ho and He, important indicators of plant genetic diversity, ranged from 0.1081 to 0.1367 and from 0.0866 to 0.3343, respectively. Notably, Groups 3 and 11 exhibited significantly higher He values (>0.3) compared to other groups, a pattern that aligns with their elevated MAF and Pi values. However, the Ho values in these groups were lower than their He values, suggesting potential inbreeding or selection pressure leading to a heterozygote deficit. Tajima’s D ranged from −0.6303 to 1.4255. Groups 3 and 11 exhibited a positive Tajima’s D, while the remaining groups showed negative values. Overall, Groups 3 and 11 showed a higher genetic diversity (a higher MAF, PIC, Pi, and He), likely due to balancing selection or population contraction (Tajima’s D > 1), while the other groups may be experiencing expansion or directional selection (negative Tajima’s D values).
FST can reflect the genetic differentiation between groups (Table 2). In this study, the FST values between Group 3 and the other groups, especially Groups 1, 2, and 7, were generally high (0.2160–0.4560), indicating that Group 3 has a distinct genetic background. Group 11 showed a low FST (−0.0484) with Group 3, suggesting it might be a subgroup or independent evolutionary unit of Group 3. Meanwhile, the FST between Group 11 and Groups 1, 2, and 7 ranged from 0.1588 to 0.2049, reflecting a strong genetic differentiation. Most of the other group pairs had a low FST (mostly < 0.05, except for the 0.0562 between Groups 1 and 8) or negative values, pointing to frequent gene exchange or recent common ancestry. Combined with genetic diversity results, Groups 3 and 11 showed a high diversity and strong differentiation from the rest. In contrast, the other groups had a low diversity and limited genetic differentiation.

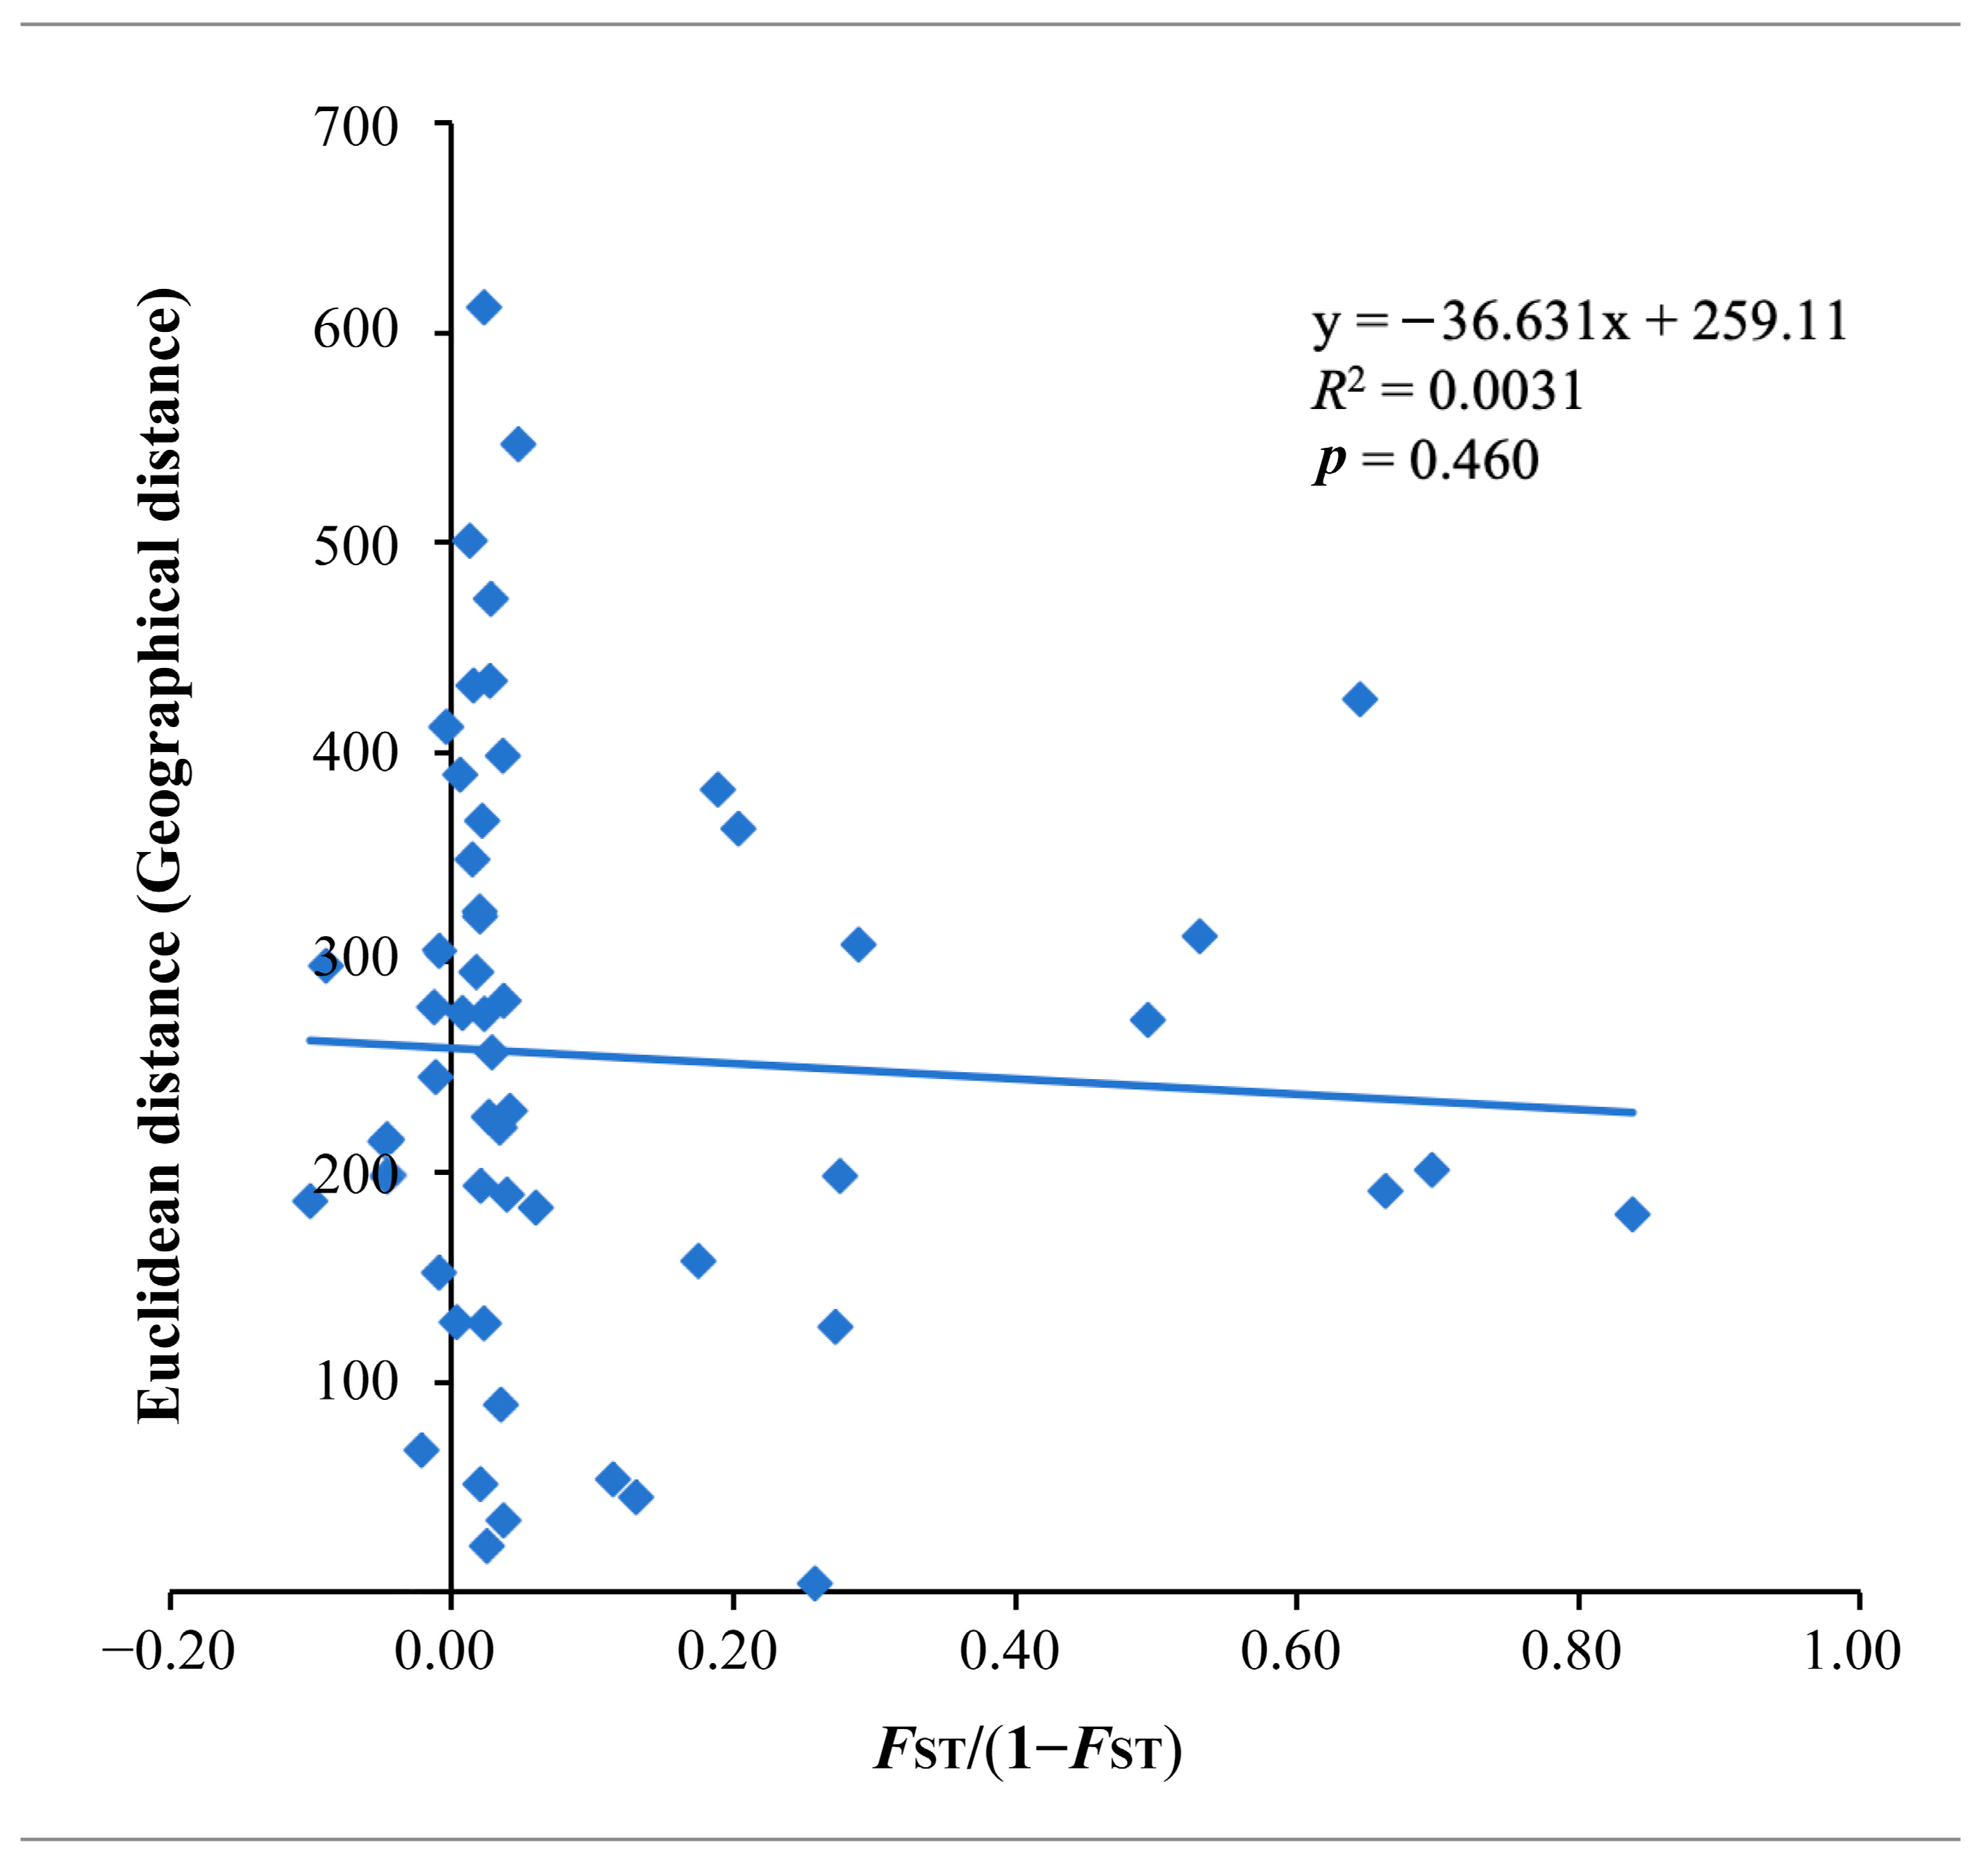
3.6. Isolation by Distance Analysis

To further analyze whether geographical isolation caused the divergence patterns among groups, we performed a Mantel test to assess the correlation between the genetic and geographical matrices of the groups. Figure 9 illustrates the relationship between geographical and genetic distances. The absence of a significant correlation (Mantel test, p = 0.460) indicates that genetic differentiation among F. platypoda groups is likely influenced mainly by non-spatial factors. This pattern implies a sustained gene flow between populations, aligning with the observed low genetic differentiation across most groups.

4. Discussion

4.1. The Genetic Structure of F. platypoda

The phylogenetic analysis, population genetic structure analysis, and PCA and kinship analysis based on SNPs from whole-genome resequencing data all showed a strong genetic structure among F. platypoda groups (Figure 3, Figure 4, Figure 5, Figure 6 and Figure 7). The NJ phylogenetic tree (Figure 3) indicated that eight individuals from Groups 3, 5, 8, and 11 formed Cluster I, which is at the base of the tree and may be ancestral to other individuals. Cluster II, including the remaining individuals, was further divided into smaller clades. However, these clades contained individuals from different regions, with no clear genetic stratification based on geography. Structure analysis revealed that the 11 natural F. platypoda groups likely originated from two ancestral sources. Groups 3 (KXZ1, KX1, and 15), 5 (SB3), and 11 (ZJ1, 2, and 3) could be traced back to one ancestor, while other individuals had a different ancestral origin. This conclusion can be effectively proved in the phylogenetic tree, population structure, PCA, and other analyzes. Through the above analysis, we can clearly see that the subgroup differentiation level of these two ancestral sources is relatively high. When K = 3–6, the ancestor of subgroup 1 is the same stable ancestor from beginning to end (Figure 5). In contrast, there is a general phenomenon of genetic mixing in subgroup 2. Each population is not clustered into an obvious branch, and there are many individuals with multiple ancestors. It could have resulted from the low level of differentiation between these populations and the high level of gene flow, which may be caused by the long-distance transmission of seeds. However, when K = 3–6, a new group is separated, indicating that there is differentiation on the whole. For example, when K = 3, four individuals in Group 5 (SB1, 2, and 4) and Group 6 (SM2) were clustered together, and the distance between them and other individuals was far (Figure 5 and Figure 6). The results indicate that Cluster I, potentially the ancestral population, exhibits a strong genetic differentiation from other groups. It comprises fewer individuals. Cluster II, with a larger sample size spanning multiple groups, shows complex genetic backgrounds and no distinct geographic-based genetic structure. Gao et al. analyzed 380 F. chinensis Roxb. germplasm resources from nine geographical regions using SSRs and reported similar results [35]. This suggests that frequent gene flow among populations may hinder genetic differentiation in F. chinensis. The extensive gene flow is likely linked to human activities; a dense road network connects these populations, facilitating the spread of breeding materials by humans.
To explore the patterns and causes of genetic variation distribution, we estimated genetic differentiation among groups. Results showed that Group 3 and Group 11 are closely related and highly differentiated from other groups, particularly Group 3 (FST > 0.2). As seen in the population genetic structure (Figure 5), these two groups contain most of the Cluster I individuals (6/8), which may account for their genetic distance from other groups. Nine other groups showed no significant differentiation (FST near zero), indicative of a high gene flow between them. A Mantel test revealed no significant correlation between genetic and geographic distances (p = 0.460), indicating that genetic variation distribution is not spatially dominated. The overlap of Cluster I and Cluster II in Groups 3, 5, 8, and 11 further suggests that genetic differentiation may not stem from local climate adaptation. Based on previous studies [62,63], we propose the following factors contributing to the significant gene flow in most F. platypoda groups and the maintenance of genetic structure: (A) F. platypoda’s tall trunk and wind-dispersed samaras and pollen significantly impact genetic structure; (B) human activities enhance gene flow (e.g., transporting reproductive materials) or reduce diversity (e.g., overexploitation); (C) the reproduction system, with unstable ratios of male and hermaphroditic plants, may lead to fertility differences between Cluster I and Cluster II individuals, maintaining differentiation.

4.2. The Genetic Diversity of F. platypoda

Species are endangered due to their evolutionary history, habitat changes, reproductive characteristics, and human disturbance [64]. To explore the population genetics and conservation of Fraxinus species, numerous studies have been conducted. For instance, Jiang et al. analyzed the genetic diversity of F. mandshurica Rupr. using 611,192 SNPs from six populations and found a high genetic diversity at the species level (Ho = 0.1550, He = 0.2174, Pi = 0.2417, and Fis = 0.1947) [36]. Similarly, Yan et al. used AFLP markers to analyze the genetic diversity of 90 individuals from different Fraxinus tree species and reported a rich genetic diversity within the genus (p = 72.1%–95.8%, Nei’s = 0.1717) [65]. To protect this vulnerable species and inform effective management strategies, we conducted this study to accurately estimate the genetic diversity of F. platypoda. Genetic diversity, defined as the degree of genetic polymorphism among different populations or individuals within a species, is crucial for species survival under climate change [66]. In this study, the overall genetic diversity of F. platypoda was found to be relatively low (Table 1), with differences observed among groups. A strong population structure was detected, with populations tending to divide into two clusters. Groups 3 and 11 showed close genetic relationships and a high genetic differentiation from other groups, while nine other groups exhibited a low genetic differentiation and high gene flow. Groups 3 and 11 had higher genetic diversity levels compared to other groups (MAF, PIC, Pi, and He all ranked first and second). Tajima’s D values were positive for Groups 3 and 11, suggesting they might be ancient relict populations that have undergone balancing selection. In contrast, other groups showed negative Tajima’s D, indicating a recent expansion or directional selection.
Linkage disequilibrium (LD) analysis revealed significant differences in r2 at very short distances. Group 3 had the smallest r2, followed by Group 8, indicating a weak LD and suggesting frequent recombination events or a large effective population size. Groups 11, 7, 2, and 1 had high r2 values, implying a strong LD and possible recent bottleneck effects. The decay rate of LD varied among groups, with Groups 1, 2, 7, and 11 showing a rapid decay and Groups 10, 8, and 3 showing a slower decay. Based on these findings, we propose the following hypotheses. Group 3 is a long-stable, large population maintained by balancing selection with high recombination rates. Its high genetic differentiation and slow LD decay suggest it is an evolutionarily conserved unit and potential ‘genetic refuge’ for the species. Group 11, having experienced a recent bottleneck followed by expansion, shows an elevated initial LD due to genetic drift, with subsequent accelerated LD decay caused by increased gene flow and recombination. We divided the populations into three genetic units. Unit 1 consists of Group 3, characterized by a high diversity and strong differentiation. Unit 2 includes Group 11, which is related to Group 3 but has independently differentiated. Unit 3 comprises Groups 1, 2, and 4–10, which have a low diversity and frequent gene flow. According to the central–marginal hypothesis [67,68,69], genetic diversity decreases and differentiation increases towards the edges of a species’ distribution. However, in this study, F. platypoda groups in NW China did not show a clear central–marginal gradient. Edge populations did not exhibit isolation but rather a high gene flow and low genetic differentiation.
Genetic Units 1 and 2 have long-term evolutionary histories and a high differentiation with substantial diversity. However, their observed heterozygosity suggests possible inbreeding or selection-induced heterozygote deficits. These units require priority protection to prevent excessive inbreeding in fragmented distributions and genetic resource loss from human impacts. Genetic Unit 3’s features align with Bacles’ findings on F. excelsior in fragmented habitats. In such settings, five populations maintained an extremely low genetic differentiation and high gene flow, primarily due to wind pollination [13]. Additionally, the widespread plantation forests may significantly impact the genetic diversity of natural F. platypoda populations in this unit. Studies by Abhainn et al. indicate that natural F. pennsylvanica extensively exchanges genes with cultivated Fraxinus, reducing allele richness [70].
This study offers an initial analysis of the population genetic structure and diversity of natural F. platypoda in the NW region. However, it leaves many questions unanswered, such as how historical geology and climate change shaped the current genetic structure, the differences in reproductive systems, phenotypes, and adaptability between Cluster I and II, and the adaptive loci for NW arid regions within the population’s genetic information. In future research, we will incorporate central region F. platypoda populations and integrate geographical and climatic data for further investigation. Despite the limited number of individuals per area in this study, the findings hold significant reference value. To address the status of F. platypoda in the NW, the following conservation measures should be implemented as follows: (A) Establish nature reserves with a focus on the in-situ protection of F. platypoda Cluster I. (B) Enhance publicity and education for the populations in human-inhabited areas to minimize human impacts. (C) Conduct intraspecific hybrid breeding of F. platypoda between Cluster I and II to boost its diversity.

5. Conclusions

In this study, we performed whole-genome resequencing analysis on F. platypoda, identifying and annotating 3,394,299 high-quality SNPs, and analyzing the locus distribution types and polymorphisms. The genetic structure and diversity of F. platypoda populations were elucidated. This study reveals a marked genetic structure of F. platypoda in NW China. Eight individuals from Groups 3, 5, 8, and 11 formed Cluster I, which is highly differentiated from Cluster II and likely represents its ancestral group. While the overall genetic diversity is low, Groups 3 and 11 show a greater genetic differentiation and diversity compared to other groups. The remaining populations exhibit extensive gene flow and low genetic differentiation, which may endanger their adaptability and survival in the face of climate change. In response, we propose specific conservation measures, including an in-situ protection of groups with a higher genetic diversity, enhanced publicity, and breeding experiments. The genome-wide resequencing data from the 11 groups provide valuable genetic resources for studying the adaptation of F. platypoda to arid conditions in NW China. Future research will combine these findings with groups from central regions to further explore the climate adaptability of F. platypoda.

Supplementary Materials

The following supporting information can be downloaded at https://www.mdpi.com/article/10.3390/f16050860/s1; Supplementary File S1: Geographical and climatic factors of the 11 groups.xlsx. Supplementary File S2: Geographical distance and Genetic distance.xlsx. Supplementary File S3: ld_results.

Author Contributions

Conceptualization, W.M.; formal analysis, Y.L. and W.G.; funding acquisition, X.G. and W.M.; methodology, Y.L. and W.M.; project administration, Q.Z. and W.M.; resources, Q.Z. and J.Z.; supervision, X.G. and W.M.; visualization, Y.L.; writing—original draft, Y.L. and W.G.; writing—review and editing, Y.L. All authors have read and agreed to the published version of the manuscript.

Funding

This research was funded by the Key Research and Development Program of Gansu Province, China, grant number 20YF3NA010.

Data Availability Statement

All data generated or analyzed during this study are included in this published article and its Supplementary Information Files. The sequencing data are available at https://www.ncbi.nlm.nih.gov/bioproject/PRJNA1035649 accessed on 4 November 2024. The variation data reported in this paper have been deposited in the Genome Variation Map (GVM) in the National Genomics Data Center, Beijing Institute of Genomics, Chinese Academy of Sciences and China National Center for Bioinformation (accession number: GVM000758). The datasets generated during the study are available from the corresponding author on reasonable request.

Conflicts of Interest

The authors declare no conflicts of interest.

Abbreviations

The following abbreviations are used in this manuscript:
F. platypodaFraxinus platypoda
NWNorthwestern
SNPsingle nucleotide polymorphism
PCAprincipal component analysis
Heexpected heterozygosity
Hoobserved heterozygosity
MAFminor allele frequency
PICpolymorphism information content
GVMGenome Variation Map

References

  1. Rands, M.R.; Adams, W.M.; Bennun, L.; Butchart, S.M.; Clements, A.; Coomes, D.; Entwistle, A.; Hodge, I.; Kapos, V.; Scharlemann, J.W.; et al. Biodiversity conservation: Challenges beyond 2010. Science 2010, 329, 1298–1303. [Google Scholar] [CrossRef] [PubMed]
  2. Maxwell, S.L.; Fuller, R.A.; Brooks, T.M.; Watson, J.M. Biodiversity: The ravages of guns, nets and bulldozers. Nature 2016, 536, 143–145. [Google Scholar] [CrossRef]
  3. Haddad, N.M.; Brudvig, L.A.; Clobert, J.; Davies, K.F.; Gonzalez, A.; Holt, R.D.; Lovejoy, T.E.; Sexton, J.O.; Austin, M.P.; Collins, C.D.; et al. Habitat fragmentation and its lasting impact on Earth’s ecosystems. Sci. Adv. 2015, 1, e1500052. [Google Scholar] [CrossRef]
  4. Newbold, T.; Hudson, L.N.; Hill, S.L.; Contu, S.; Lysenko, I.; Senior, R.A.; Börger, L.; Bennett, D.J.; Choimes, A.; Collen, B.; et al. Global effects of land use on local terrestrial biodiversity. Nature 2015, 520, 45–50. [Google Scholar] [CrossRef]
  5. Lande, R. Genetics and demography in biological conservation. Science 1988, 241, 1455–1460. [Google Scholar] [CrossRef]
  6. Frankham, R.; Ballou, J.D.; Briscoe, D.A. Introduction to Conservation Genetics; Cambridge University Press: Cambridge, UK, 2002. [Google Scholar]
  7. Sork, V.L.; Smouse, P.E. Genetic Analysis of Landscape Connectivity in Tree Populations. Landsc. Ecol. 2006, 21, 821–836. [Google Scholar] [CrossRef]
  8. Frankham, R. Genetics and extinction. Biol. Conserv. 2005, 126, 131–140. [Google Scholar] [CrossRef]
  9. Yadav, L.K.; Bellis, D.; Smith, Z.C.; Ony, M.; Hale, C.; Richards, C.; Klingeman, W.E.; Staton, M.E.; Granger, J.J.; Hadziabdic, D. Genetic diversity and population structure of a rare flowering tree endemic to Appalachia, Stewartia ovata. Ecol. Evol. 2024, 14, e11547. [Google Scholar] [CrossRef]
  10. Young, A.; Boyle, T.; Brown, T. The population genetic consequences of habitat fragmentation for plants. Trends Ecol. Evol. 1996, 11, 413–418. [Google Scholar] [CrossRef]
  11. Yao, X.; Ye, Q.; Kang, M.; Huang, H. Microsatellite analysis reveals interpopulation differentiation and gene flow in the endangered tree Changiostyrax dolichocarpa (Styracaceae) with fragmented distribution in central China. New Phytol. 2007, 176, 472–480. [Google Scholar] [CrossRef]
  12. Rocchetti, G.A. Vascular Plant Extinction in Macaronesia: Biogeographical and Biological Drivers of Loss. Glob. Change Biol. 2025, 31, e70128. [Google Scholar] [CrossRef] [PubMed]
  13. Bacles, C.F.E.; Burczyk, J.; Lowe, A.J.; Ennos, R.A. Historical and contemporary mating patterns in remnant populations of the forest tree Fraxinus excelsior L. Evolution 2005, 59, 979–990. [Google Scholar] [CrossRef] [PubMed]
  14. Semizer-Cuming, D.; Kjær, E.D.; Finkeldey, R. Gene flow of common ash (Fraxinus excelsior L.) in a fragmented landscape. PLoS ONE 2017, 12, e0186757. [Google Scholar] [CrossRef] [PubMed]
  15. Hinsinger, D.D.; Basak, J.; Gaudeul, M.; Cruaud, C.; Bertolino, P.; Frascaria-Lacoste, N.; Bousquet, J. The phylogeny and biogeographic history of ashes (Fraxinus, Oleaceae) highlight the roles of migration and vicariance in the diversification of temperate trees. PLoS ONE 2013, 8, e80431. [Google Scholar] [CrossRef]
  16. Li, E.; Wang, Y.; Liu, K.; Liu, Y.; Xu, C.; Dong, W.; Zhang, Z. Historical climate change and vicariance events contributed to the intercontinental disjunct distribution pattern of ash species (Fraxinus, Oleaceae). Commun. Biol. 2024, 7, 603. [Google Scholar] [CrossRef]
  17. Wallander, E. Systematics of Fraxinus (Oleaceae) and evolution of dioecy. Plant Syst. Evol. 2008, 273, 25–49. [Google Scholar] [CrossRef]
  18. Sakio, H. (Ed.) Fraxinus platypoda. In Long-Term Ecosystem Changes in Riparian Forest; Springer: Singapore, 2020; pp. 23–37. [Google Scholar]
  19. Zhao, X.X.; Ju, T.Z.; Wang, S.; Lu, X.; Wang, J.; Xie, S.; Zhang, S. Analysis of population structure characteristics and spatial distribution pattern of Fraxinus platypoda Oliv. in Xiaolongshan National Nature Reserve. Jiangsu Agric. Sci. 2018, 46, 235–239. [Google Scholar] [CrossRef]
  20. Cui, J.; Yang, Y.; Luo, S.; Wang, L.; Huang, R.; Wen, Q.; Han, X.; Miao, N.; Cheng, J.; Liu, Z.; et al. Whole-genome sequencing provides insights into the genetic diversity and domestication of bitter gourd (Momordica spp.). Hortic. Res. 2020, 7, 85. [Google Scholar] [CrossRef]
  21. Sakio, H.; Kon, A.; Kubo, M.; Nakano, Y. Long-term fluctuations and mechanisms of seed production of riparian tree canopy species. Ecol. Res. 2023, 38, 370–385. [Google Scholar] [CrossRef]
  22. Li, L.; Du, Z.; Liang, J.; Mo, X.; Xu, G.; Zhu, J.; Li, H. Homogenization characteristics and regional effects in the diversity pattern of woody plants in 101 cities in China. J. Environ. Manag. 2023, 345, 118665. [Google Scholar] [CrossRef]
  23. Nicotra, A.B.; Beever, E.A.; Robertson, A.L.; Hofmann, G.E.; O’Leary, J. Assessing the components of adaptive capacity to improve conservation and management efforts under global change. Conserv. Biol. 2015, 29, 1268–1278. [Google Scholar] [CrossRef] [PubMed]
  24. Plaisted, H.K.; Novak, A.B.; Weigel, S.; Klein, A.S.; Short, F.T. Eelgrass genetic diversity influences resilience to stresses associated with eutrophication. Estuaries Coasts 2020, 43, 1425–1438. [Google Scholar] [CrossRef]
  25. Wang, X.; Duan, F.; Zhang, H.; Han, H.; Gan, X. Fine-scale spatial genetic structure of the endangered plant Tetracentron sinense Oliv. (Trochodendraceae) in Leigong Mountain. Glob. Ecol. Conserv. 2023, 41, e02382. [Google Scholar] [CrossRef]
  26. Elshibli, S.; Korpelainen, H. Genetic Diversity and Population Structure of Medemia argun (Mart.) Wurttenb. ex H.Wendl. Based on Genome-Wide Markers. Front. Ecol. Evol. 2021, 9, 687188. [Google Scholar] [CrossRef]
  27. Wang, Y.; Jiao, Z.; Zheng, J.; Zhou, J.; Wang, B.; Zhuge, Q.; He, X. Population Genetic Diversity and Structure of an Endangered Salicaceae Species in Northeast China: Chosenia arbutifolia (Pall.). A. Skv. For. 2021, 12, 1282. [Google Scholar] [CrossRef]
  28. Thompson, L.; Thurman, L.; Cook, C.; Beever, E.; Sgro, C.; Battles, A.; Botero, C.; Gross, J.; Hall, K.; Hendry, A.; et al. Connecting research and practice to enhance the evolutionary potential of species under climate change. Conserv. Sci. Pract. 2023, 5, e12855. [Google Scholar] [CrossRef]
  29. Peláez, P.; Ortiz-Martínez, A.; Figueroa-Corona, L.; Montes, J.R.; Gernandt, D.S. Population structure, diversifying selection, and local adaptation in Pinus patula. Am. J. Bot. 2020, 107, 1555–1566. [Google Scholar] [CrossRef]
  30. Castillo, J.A.; Epps, C.W.; Jeffress, M.R.; Ray, C.; Rodhouse, T.J.; Schwalm, D. Replicated landscape genetic and network analyses reveal wide variation in functional connectivity for American pikas. Ecol. Appl. 2016, 26, 1660–1676. [Google Scholar] [CrossRef]
  31. Hu, C.L. Establishment of Molecular ID for Fraxinus Based on SSR Markers and Analysis of Genetic Diversity. Master’s Thesis, Shandong Agricultural University, Tai’an, China, 2015. [Google Scholar]
  32. Huff, M.; Seaman, J.; Wu, D.; Zhebentyayeva, T.; Kelly, L.J.; Faridi, N.; Nelson, C.D.; Cooper, E.; Best, T.; Steiner, K.; et al. A high-quality reference genome for Fraxinus pennsylvanica for ash species restoration and research. Mol. Ecol. Resour. 2022, 22, 1284–1302. [Google Scholar] [CrossRef]
  33. Meng, X.T. Study on genetic differentiation of Fraxianus mandshurica Rupr. in different provenances Northeast of China. Master’s Thesis, Northeast Forestry University, Harbin, China, 2009. [Google Scholar]
  34. Zheng, P.L.; Cheng, J.R.; Cheng, L.Q.; Zhou, M. Assessment of genetic diversity of an endangered species Fraxinus hupehensis based on ISSR markers. Not. Bot. Horti Agrobot. 2019, 47, 1308–1315. [Google Scholar] [CrossRef]
  35. Gao, C.C.; Yan, L.P.; Wu, D.J.; Wang, Y.H. Analysis of the genetic diversity and population structure of Fraxinus spp. populations based on SSR markers. J. Cent. South. Univ. For. Technol. 2023, 43, 69–78. [Google Scholar] [CrossRef]
  36. Jiang, T.Y.; Zhu, X.R.; Shi, C.Y.; Ye, L.Q.; Wen, G.W.; Lai, W.F.; Lv, Z.W.; Zhang, G.F. Genetic Diversity Analysis of Fraxinus mandshurica Based on dd-RAD Simplified Genome Sequencing. Mol. Plant Breed 2022, 1–16. [Google Scholar]
  37. Jing, D.; Liu, X.; He, Q.; Dang, J.; Hu, R.; Xia, Y.; Wu, D.; Wang, S.; Zhang, Y.; Xia, Q.; et al. Genome assembly of wild loquat (Eriobotrya japonica) and resequencing provide new insights into the genomic evolution and fruit domestication in loquat. Hortic. Res. 2022, 10, 265. [Google Scholar] [CrossRef]
  38. Mekbib, Y.; Tesfaye, K.; Dong, X.; Saina, J.K.; Hu, G.W.; Wang, Q.F. Whole-genome resequencing of Coffea arabica L. (Rubiaceae) genotypes identify SNP and unravels distinct groups showing a strong geographical pattern. BMC Plant Biol. 2022, 22, 69. [Google Scholar] [CrossRef]
  39. Qing, J.; Meng, Y.D.; He, F.; Du, Q.X.; Zhong, J.; Du, H.Y.; Liu, P.F.; Du, L.Y.; Wang, L. Whole genome re-sequencing reveals the genetic diversity and evolutionary patterns of Eucommia ulmoides. Mol. Genet. Genom. 2022, 297, 485–494. [Google Scholar] [CrossRef]
  40. Tel-Zur, N.; Abbo, S.; Myslabodski, D.; Mizrahi, Y. Modified CTAB Procedure for DNA Isolation from Epiphytic cacti of the Genera Hylocereus and Selenicereus (Cactaceae). Plant Mol. Biol. Rep. 1999, 17, 249–254. [Google Scholar] [CrossRef]
  41. Chen, S.; Zhou, Y.; Chen, Y.; Gu, J. fastp: An ultra-fast all-in-one FASTQ preprocessor. Bioinformatics 2018, 34, i884–i890. [Google Scholar] [CrossRef]
  42. Wang, K.; Li, M.; Hakonarson, H. ANNOVAR: Functional annotation of genetic variants from high-throughput sequencing data. Nucleic Acids Res. 2010, 38, e164. [Google Scholar] [CrossRef]
  43. Li, H.; Durbin, R. Fast and accurate long-read alignment with burrows-wheeler transform. Bioinformatics 2010, 26, 589–595. [Google Scholar] [CrossRef]
  44. Li, H. Aligning sequence reads, clone sequences and assembly contigs with BWA-MEM. arXiv 2013, arXiv:1303.3997. [Google Scholar] [CrossRef]
  45. Li, H.; Handsaker, B.; Wysoker, A.; Fennell, T.; Ruan, J.; Homer, N.; Marth, G.; Abecasis, G.; Durbin, R.; 1000 Genome Project Data Processing Subgroup. The Sequence Alignment/Map format and SAMtools. Bioinformatics 2009, 25, 2078–2079. [Google Scholar] [CrossRef] [PubMed]
  46. McKenna, A.; Hanna, M.; Banks, E.; Sivachenko, A.; Cibulskis, K.; Kernytsky, A.; Garimella, K.; Altshuler, D.; Gabriel, S.; Daly, M.; et al. The Genome Analysis Toolkit: A MapReduce framework for analyzing next generation DNA sequencing data. Genome Res. 2010, 20, 1297–1303. [Google Scholar] [CrossRef] [PubMed]
  47. do Valle, Í.F.; Giampieri, E.; Simonetti, G.; Padella, A.; Manfrini, M.; Ferrari, A.; Papayannidis, C.; Zironi, I.; Garonzi, M.; Bernardi, S.; et al. Optimized pipeline of MuTect and GATK tools to improve the detection of somatic single nucleotide polymorphisms in whole-exome sequencing data. BMC Bioinform. 2016, 17, 27–35. [Google Scholar] [CrossRef] [PubMed]
  48. Alexander, D.H.; Novembre, J.; Lange, K. Fast model-based estimation of ancestry in unrelated individuals. Genome Res. 2009, 19, 1655–1664. [Google Scholar] [CrossRef] [PubMed]
  49. Langella, O.; Chikhi, L.; Beaumont, M.A. LEA (likelihood-based estimation of admixture): A program to simultaneously estimate admixture and the time since admixture. Mol. Ecol. Resour. 2010, 1, 357–358. [Google Scholar] [CrossRef]
  50. Zhou, Y.; Qiu, H.; Xu, S. Modeling Continuous Admixture Using Admixture-Induced Linkage Disequilibrium. Sci. Rep. 2017, 7, 43054. [Google Scholar] [CrossRef]
  51. Yang, J.; Lee, S.H.; Goddard, M.E.; Visscher, P.M. GCTA: A tool for genome-wide complex trait analysis. Am. J. Hum. Genet. 2010, 88, 76–82. [Google Scholar] [CrossRef]
  52. Privé, F.; Luu, K.; Blum, M.G.B.; McGrath, J.J.; Vilhjálmsson, B.J. Efficient toolkit implementing best practices for principal component analysis of population genetic data. Bioinformatics 2020, 36, 4449–4457. [Google Scholar] [CrossRef]
  53. Garreta, L.; Cerón-Souza, I.; Palacio, M.R.; Reyes-Herrera, P.H. Multi GWAS: An integrative tool for Genome Wide Association Studies in tetraploid organisms. Ecol. Evol. 2021, 11, 7411–7426. [Google Scholar] [CrossRef]
  54. Zhu, X.; Xu, F.; Zhao, S.; Bo, W.; Jiang, L.; Pang, X.; Wu, R. Inferring the evolutionary history of outcrossing populations through computing a multiallelic linkage–linkage disequilibrium map. Methods Ecol. Evol. 2015, 6, 1259–1269. [Google Scholar] [CrossRef]
  55. Campoy, J.A.; Lerigoleur-Balsemin, E.; Christmann, H.; Beauvieux, R.; Girollet, N.; Quero-García, J.; Dirlewanger, E.; Barreneche, T. Genetic diversity, linkage disequilibrium, population structure and construction of a core collection of Prunus avium L. landraces and bred cultivars. BMC Plant Biol. 2016, 16, 49. [Google Scholar] [CrossRef] [PubMed]
  56. Zhang, C.; Dong, S.S.; Xu, J.Y.; He, W.M.; Yang, T.L. PopLDdecay: A fast and effective tool for linkage disequilibrium decay analysis based on variant call format files. Bioinformatics 2019, 35, 1786–1788. [Google Scholar] [CrossRef] [PubMed]
  57. Danecek, P.; Auton, A.; Abecasis, G.; Albers, C.A.; Banks, E.; DePristo, M.A.; Handsaker, R.E.; Lunter, G.; Marth, G.T.; Sherry, S.T.; et al. The variant call format and VCFtools. Bioinformatics 2011, 27, 2156–2158. [Google Scholar] [CrossRef] [PubMed]
  58. Guillot, G.; Rousset, F. Dismantling the mantel tests. Methods Ecol. Evol. 2013, 4, 336–344. [Google Scholar] [CrossRef]
  59. Tian, Q.; El-Kassaby, Y.A.; Li, W. Revealing the Genetic Structure and Differentiation in Endangered Pinus bungeana by Genome-Wide SNP Markers. Forests 2022, 13, 326. [Google Scholar] [CrossRef]
  60. Linck, E.; Battey, C.J. Minor allele frequency thresholds strongly affect population structure inference with genomic data sets. Mol. Ecol. Resour. 2019, 19, 639–647. [Google Scholar] [CrossRef]
  61. Shete, S.; Tiwari, H.; Elston, R.C. On estimating the heterozygosity and polymorphism information content value. Theor. Popul. Biol. 2000, 57, 265–271. [Google Scholar] [CrossRef]
  62. José, G.D.; Akanksha, S.; Corbinian, G.; Stetter, M.G. Genetic Incompatibilities and Evolutionary Rescue by Wild Relatives Shaped Grain Amaranth Domestication. Mol. Biol. Evol. 2023, 40, msad177. [Google Scholar] [CrossRef]
  63. Ibañez, E.A.; Guichón, M.L.; Peralta, D.M.; Cassini, M.H.; Túnez, J.I. Genetic structure and gene flow in Myocastor coypus (Rodentia: Echimyidae) populations inhabiting a highly modified agroecosystem of the Pampas region. Biol. J. Linn. Soc. 2024, 141, 401–418. [Google Scholar] [CrossRef]
  64. Zhang, J.; Zhao, F.Y.; Zhang, H.X. Evolutionary Genomics Provides Insights Into Endangerment and Conservation of a Wild Apple Tree Species, Malus sieversii. Evol. Appl. 2024, 17, e70048. [Google Scholar] [CrossRef]
  65. Yan, L.P.; Wu, D.J.; Wang, Y.H.; Liu, C.; Wang, K.; Wu, H.; Li, Q. Analysis on phylogenetic relationship of elite germplasm resources in Fraxinus using AFLP. J. Cent. South. Univ. For. Technol. 2018, 38, 89–95. [Google Scholar] [CrossRef]
  66. Hu, L.J.; Uchiyama, K.; Shen, H.L.; Saito, Y.; Tsuda, Y.; Ide, Y. Nuclear DNA microsatellites reveal genetic variation but a lack of phylogeographical structure in an endangered species, Fraxinus mandshurica, across North-east China. Ann. Bot. 2008, 102, 195–205. [Google Scholar] [CrossRef]
  67. Sagarin, R.D.; Gaines, S.D. The ‘abundant centre’ distribution: To what extent is it a biogeographical rule? Ecol. Lett. 2002, 5, 137–147. [Google Scholar] [CrossRef]
  68. Eckert, C.G.; Samis, K.E.; Lougheed, S.C. Genetic variation across species’ geographical ranges: The central-marginal hypothesis and beyond. Mol. Ecol. 2008, 17, 1170–1188. [Google Scholar] [CrossRef]
  69. Pironon, S.; Papuga, G.; Villellas, J.; Angert, A.L.; García, M.B.; Thompson, J.D. Geographic variation in genetic and demographic performance: New insights from an old biogeographical paradigm. Biol. Rev. 2017, 92, 1877–1909. [Google Scholar] [CrossRef]
  70. Abhainn, E.A.; Shirley, D.L.; Stanley, R.K.; Scarpato, T.; Koch, J.L.; Romero-Severson, J. Gene flow from Fraxinus cultivars into natural stands of Fraxinus pennsylvanica occurs range-wide, is regionally extensive, and is associated with a loss of allele richness. PLoS ONE 2024, 19, e0294829. [Google Scholar] [CrossRef]
Figure 1. The characteristic straight trunk morphology of F. platypoda in NW China.
Forests 16 00860 g001
Figure 2. Maps of 65 F. platypoda individuals collected from 11 sampling sites in NW China. Note: In this study, except for the individual KXQHGUZ1 in Group 3, which is abbreviated as KXZ1, the names of other individuals are replaced with the first two letters of the original sample name plus a number. For example, GLS2 in Group 2 is denoted as GL2 in the text, and KXQH1 in Group 3 is denoted as KX1.
Forests 16 00860 g002
Figure 3. A Neighbor-Joining tree constructed using 3,394,299 SNPs from 65 F. platypoda individuals from 11 sampling locations. Individuals marked with light yellow were clustered into one branch, while the remaining individuals were clustered into a separate branch.
Forests 16 00860 g003
Figure 4. The corresponding CV error for structure analysis across F. platypoda groups (K = 1 to 15).
Forests 16 00860 g004
Figure 5. A STRUCTURE bar graph of genetic clusters among 11 sampling locations of 65 F. platypoda at K = 2–6. The numbers below the horizontal axis represent groups.
Forests 16 00860 g005
Figure 6. A principal component analysis of 65 F. platypoda individuals from 11 sampling locations.
Forests 16 00860 g006
Figure 7. Kinship matrices for 65 F. platypoda individuals from 11 sampling locations.
Forests 16 00860 g007
Figure 8. The linkage disequilibrium decay of all the tested F. platypoda groups analyzed in this study, denoted with one line for each group. The horizontal coordinate represents the spacing of the SNPs and the vertical coordinate represents the r2 value. r2 decayed to half of the corresponding SNP spacing is LD-decay.
Forests 16 00860 g008
Figure 9. The relationship between genetic and geographic distances based on Mantel tests.
Forests 16 00860 g009
Table 1. Estimates of genetic diversity indexes of eleven F. platypoda groups.
GroupMAFPICPiHoHeTajima’s D
10.0722
(6.0313 × 10⁻⁵)
0.2190
(7.6915 × 10⁻⁵)
0.0005
(3 × 10⁻⁷)
0.1191
(6.8796 × 10⁻³)
0.1082
(4.1688 × 10⁻⁵)
−0.1005
(4.20 × 10⁻³)
20.0707
(6.3403 × 10⁻⁵)
0.2410
(7.5970 × 10⁻⁵)
0.0005
(3 × 10⁻⁷)
0.117
(7.3985 × 10⁻³)
0.1031
(4.9169 × 10⁻⁵)
−0.1983
(4.10 × 10⁻³)
30.2609
(9.2414 × 10⁻⁵)
0.3198
(4.5299 × 10⁻⁵)
0.0016
(7 × 10⁻⁷)
0.1081
(8.7903 × 10⁻³)
0.3297
(2.2090 × 10⁻⁴)
1.4255
(4.90 × 10⁻³)
40.0674
(7.4947 × 10⁻⁵)
0.3224
(3.5787 × 10⁻⁵)
0.0005
(3 × 10⁻⁷)
0.1197
(1.0726 × 10⁻²)
0.0866
(1.8200 × 10⁻⁴)
−0.058
(3.30 × 10⁻³)
50.1385
(5.0368 × 10⁻⁵)
0.2083
(3.8242 × 10⁻⁵)
0.0011
(4 × 10⁻⁷)
0.1213
(6.9485 × 10⁻³)
0.2213
(8.3344 × 10⁻⁵)
−0.6303
(2.00 × 10⁻³)
60.0805
(6.8972 × 10⁻⁵)
0.2669
(6.3191 × 10⁻⁵)
0.0006
(3 × 10⁻⁷)
0.1313
(1.6690 × 10⁻²)
0.1155
(6.2816 × 10⁻⁵)
−0.186
(3.60 × 10⁻³)
70.0783
(6.4654 × 10⁻⁵)
0.2373
(7.3850 × 10⁻⁵)
0.0006
(3 × 10⁻⁷)
0.1367
(8.0000 × 10⁻³)
0.1157
(3.8717 × 10⁻⁵)
−0.0972
(3.90 × 10⁻³)
80.1210
(6.6023 × 10⁻⁵)
0.2597
(4.2896 × 10⁻⁵)
0.0009
(4 × 10⁻⁷)
0.1098
(3.4593 × 10⁻²)
0.1837
(5.5073 × 10⁻⁵)
−0.0947
(2.50 × 10⁻³)
90.0718
(6.2211 × 10⁻⁵)
0.2373
(7.2699 × 10⁻⁵)
0.0005
(3 × 10⁻⁷)
0.1167
(1.2470 × 10⁻⁴)
0.1058
(2.0041 × 10⁻²)
−0.2806
(3.90 × 10⁻³)
100.0707
(6.7828 × 10⁻⁵)
0.2718
(6.9322 × 10⁻⁵)
0.0005
(3 × 10⁻⁷)
0.1239
(3.2038 × 10⁻²)
0.0992
(2.0313 × 10⁻⁴)
−0.0604
(4.10 × 10⁻³)
110.2481
(7.8788 × 10⁻⁵)
0.2923
(5.0968 × 10⁻⁵)
0.0016
(6 × 10⁻⁷)
0.1177
(4.8836 × 10⁻³)
0.3343
(3.8793 × 10⁻⁴)
1.3141
(5.60 × 10⁻³)
Note: values are presented outside the parentheses, with standard errors enclosed within the parentheses.
Table 2. Estimations of differentiation coefficients (FST) between groups.
Group12345678910
20.0276
30.45600.3986
40.01700.02690.2240
50.03950.01950.2140−0.1119
60.01980.02620.3307−0.0117−0.0483
70.02100.03360.41030.01500.0224−0.0041
80.05620.03540.2160−0.0982−0.0496−0.01280.0375
90.01430.02230.3920−0.02210.00580.00330.01250.0193
100.03530.04500.34680.0328−0.00930.02420.03490.00740.0222
110.20490.1588−0.0484−0.00920.02550.10260.16900.02000.14890.1156
Disclaimer/Publisher’s Note: The statements, opinions and data contained in all publications are solely those of the individual author(s) and contributor(s) and not of MDPI and/or the editor(s). MDPI and/or the editor(s) disclaim responsibility for any injury to people or property resulting from any ideas, methods, instructions or products referred to in the content.

