Article

Partitioning of Available P and K in Soils During Post-Agricultural Pine and Spruce Reforestation in Smolensk Lakeland National Park, Russia

by
Polina R. Enchilik
1,2,*,
Pavel D. Chechenkov
1,2,
Guang-Hui Yu
3 and
Ivan N. Semenkov
1,2
1
Faculty of Geography, Lomonosov Moscow State University, Leninskie Gory, 1, 119991 Moscow, Russia
2
Isaev Centre for Problems of Forest Ecology and Productivity of the Russian Academy of Sciences, 84/32 Profsoyuznaya Str. 14, 117997 Moscow, Russia
3
Institute of Surface-Earth System Science, School of Earth System Science, Tianjin University, 92 Weijin Road, Nankai District, Tianjin 300072, China
*
Author to whom correspondence should be addressed.
Forests 2025, 16(5), 845; https://doi.org/10.3390/f16050845 (registering DOI)
Submission received: 5 April 2025 / Revised: 15 May 2025 / Accepted: 16 May 2025 / Published: 19 May 2025
(This article belongs to the Section Forest Soil)

Abstract

:
Gradual reforestation and transformation of both vegetation and soils characterize post-agricultural landscapes, which form after the abandonment of arable land. The change in content and vertical distribution of available K and P was analysed by stages in sandy and loamy soils in the north-west of the Smolensk region, forming two chronosequences of pine and spruce succession, mainly in triplicates. During natural succession, from the earliest to the later stages, the content of available P and K decreased in soils due to a reduction in the amount and diversity of plant remains and the downward movement of soluble substances. The loss of available P from the uppermost 0–5 cm topsoil layer was more pronounced than that of K because its leaching in the late successional stages was not compensated by plant uptake. The distribution of nutrients was found to be significantly influenced by forest type, successional stage, and soil proxies. The distribution of available K showed greater stability across successional stages and was influenced by forest type and pH. Available P showed greater variation with forest type and succession stages.

1. Introduction

A variety of soil proxies can be utilized to assess soil quality [1]. Available phosphorus (AP) and available potassium (AK) play vital roles in carbon sequestration, soil fertility, and the recovery of vegetation [2,3,4].
Most part of the soil P occurs in non-exchangeable and mineral forms, e.g., in fluoroapatite, phosphate, and (di)hydrogen phosphate [5]. P is less available than K because the it is not adsorbed by negatively charged soil colloids and moves downward faster within the soil [6,7]. In soil, the main K forms include water-soluble, exchangeable, non-exchangeable, and mineral forms [8,9]. On average, 88%–95% of soil K occurs in aluminosilicates and feldspars in non-exchangeable and mineral forms. However, due to diverse processes associated with soil and biota activity, non-exchangeable and mineral forms of cationic K are transformed into forms available to plants. The availability of K is greater in sandy soils than in silty or clay soils due to the lower content of clay particles that are capable of binding with it into a non-exchangeable form [10,11]. In natural soils, the main sources of available K and P are plant remains and primary minerals [12]. The fertilization of P and K disrupts the initial ratio of their forms [13,14].
Plants impact the supply of available P and K in the soil. The finest plant roots absorb both elements even from primary minerals of parent materials [11,12]. Aerial plant tissues are the main consumer of K and P (Table A1). Plant remains are the most important pool of these nutrients [15]. Leaf litter can supply up to 90% of P, serving as a vital nutrient source for plant root uptake and as a reservoir for soil fertility in forest ecosystems [16,17]. Most studies of litter chemistry in the later stages of decomposition focus only on N and P and show the loss of nutrients during humification [16,18,19,20,21].
Conversion of farmland to forest affects diverse soil proxies and the vertical differentiation of chemical elements [22,23,24], but changes in P and K pools are studied insufficiently. Succession occurs in abandoned agricultural lands worldwide and has recently garnered considerable socio-economic interest [22,25,26,27]. In the East European plain, 45% of these areas occur in the southern taiga zone [28]. Post-agricultural landscapes, which form after agricultural land abandonment, are characterized by stage-by-stage overgrowing and gradual transformation of soil and diverse chemical [29], biochemical [30], and biological [31,32] proxies.
In post-agricultural ecosystems, the mobility of P and K depends on previous land use, tillage and cultivation practices, plant species, the age of the tree stand, topography, climate, and soil proxies such as clay and soil organic carbon content, and pH [33,34,35,36,37,38,39,40,41,42,43]. A number of authors have reported a decrease in AP and AK content during soil restoration [44,45,46]. Others have found no significant changes [3]. Others indicated considerable increases in AP content in the topsoil of Dystric Arenosols in Latvia [47] and in the subsoil layer of 20–30 cm in Estonia [48] during the recovery of forest soils. Thus, the effect of cropland abandonment and afforestation on nutrient content over time is contradictory. Further research into the chronosequences of abandoned agricultural land is required to clarify this issue. Despite the large amount of research conducted, the model of the temporal dynamics of the content of available K and P during soil restoration has not been substantiated, since there are a lot of factors affecting the rate and nature of soil restoration [49,50,51].
The Smolensk Lakeland National Park is distinguished by the post-agricultural transformation of soils and vegetation [32,52,53]. Historically, the region was characterized by high population density and a notable absence of woodland, with extensive agricultural activity resulting in the clearance of numerous forests and their subsequent conversion into agricultural lands. As a consequence of plowing cessation, which occurred step-by step in the 1920s, 1940s, and 1990s, a considerable part of abandoned agricultural lands reforested spontaneously [32]. By 1990 and 2005, approximately 40 and 58% of abandoned agricultural lands were reforested, respectively [52].
This work aims to evaluate changes in the vertical distribution of available P and K in soils of pine and spruce reforestation chronosequences in Smolensk Lakeland. The following hypotheses were tested: i. Whether there are differences in the temporal and vertical distribution of the content of available forms of K and P in soils of pine and spruce reforestation chronosequences; ii. The dynamics and vertical distribution of available K and P are determined by their removal from soils, soil texture, plant uptake, and litter decomposition.

2. Materials and Methods
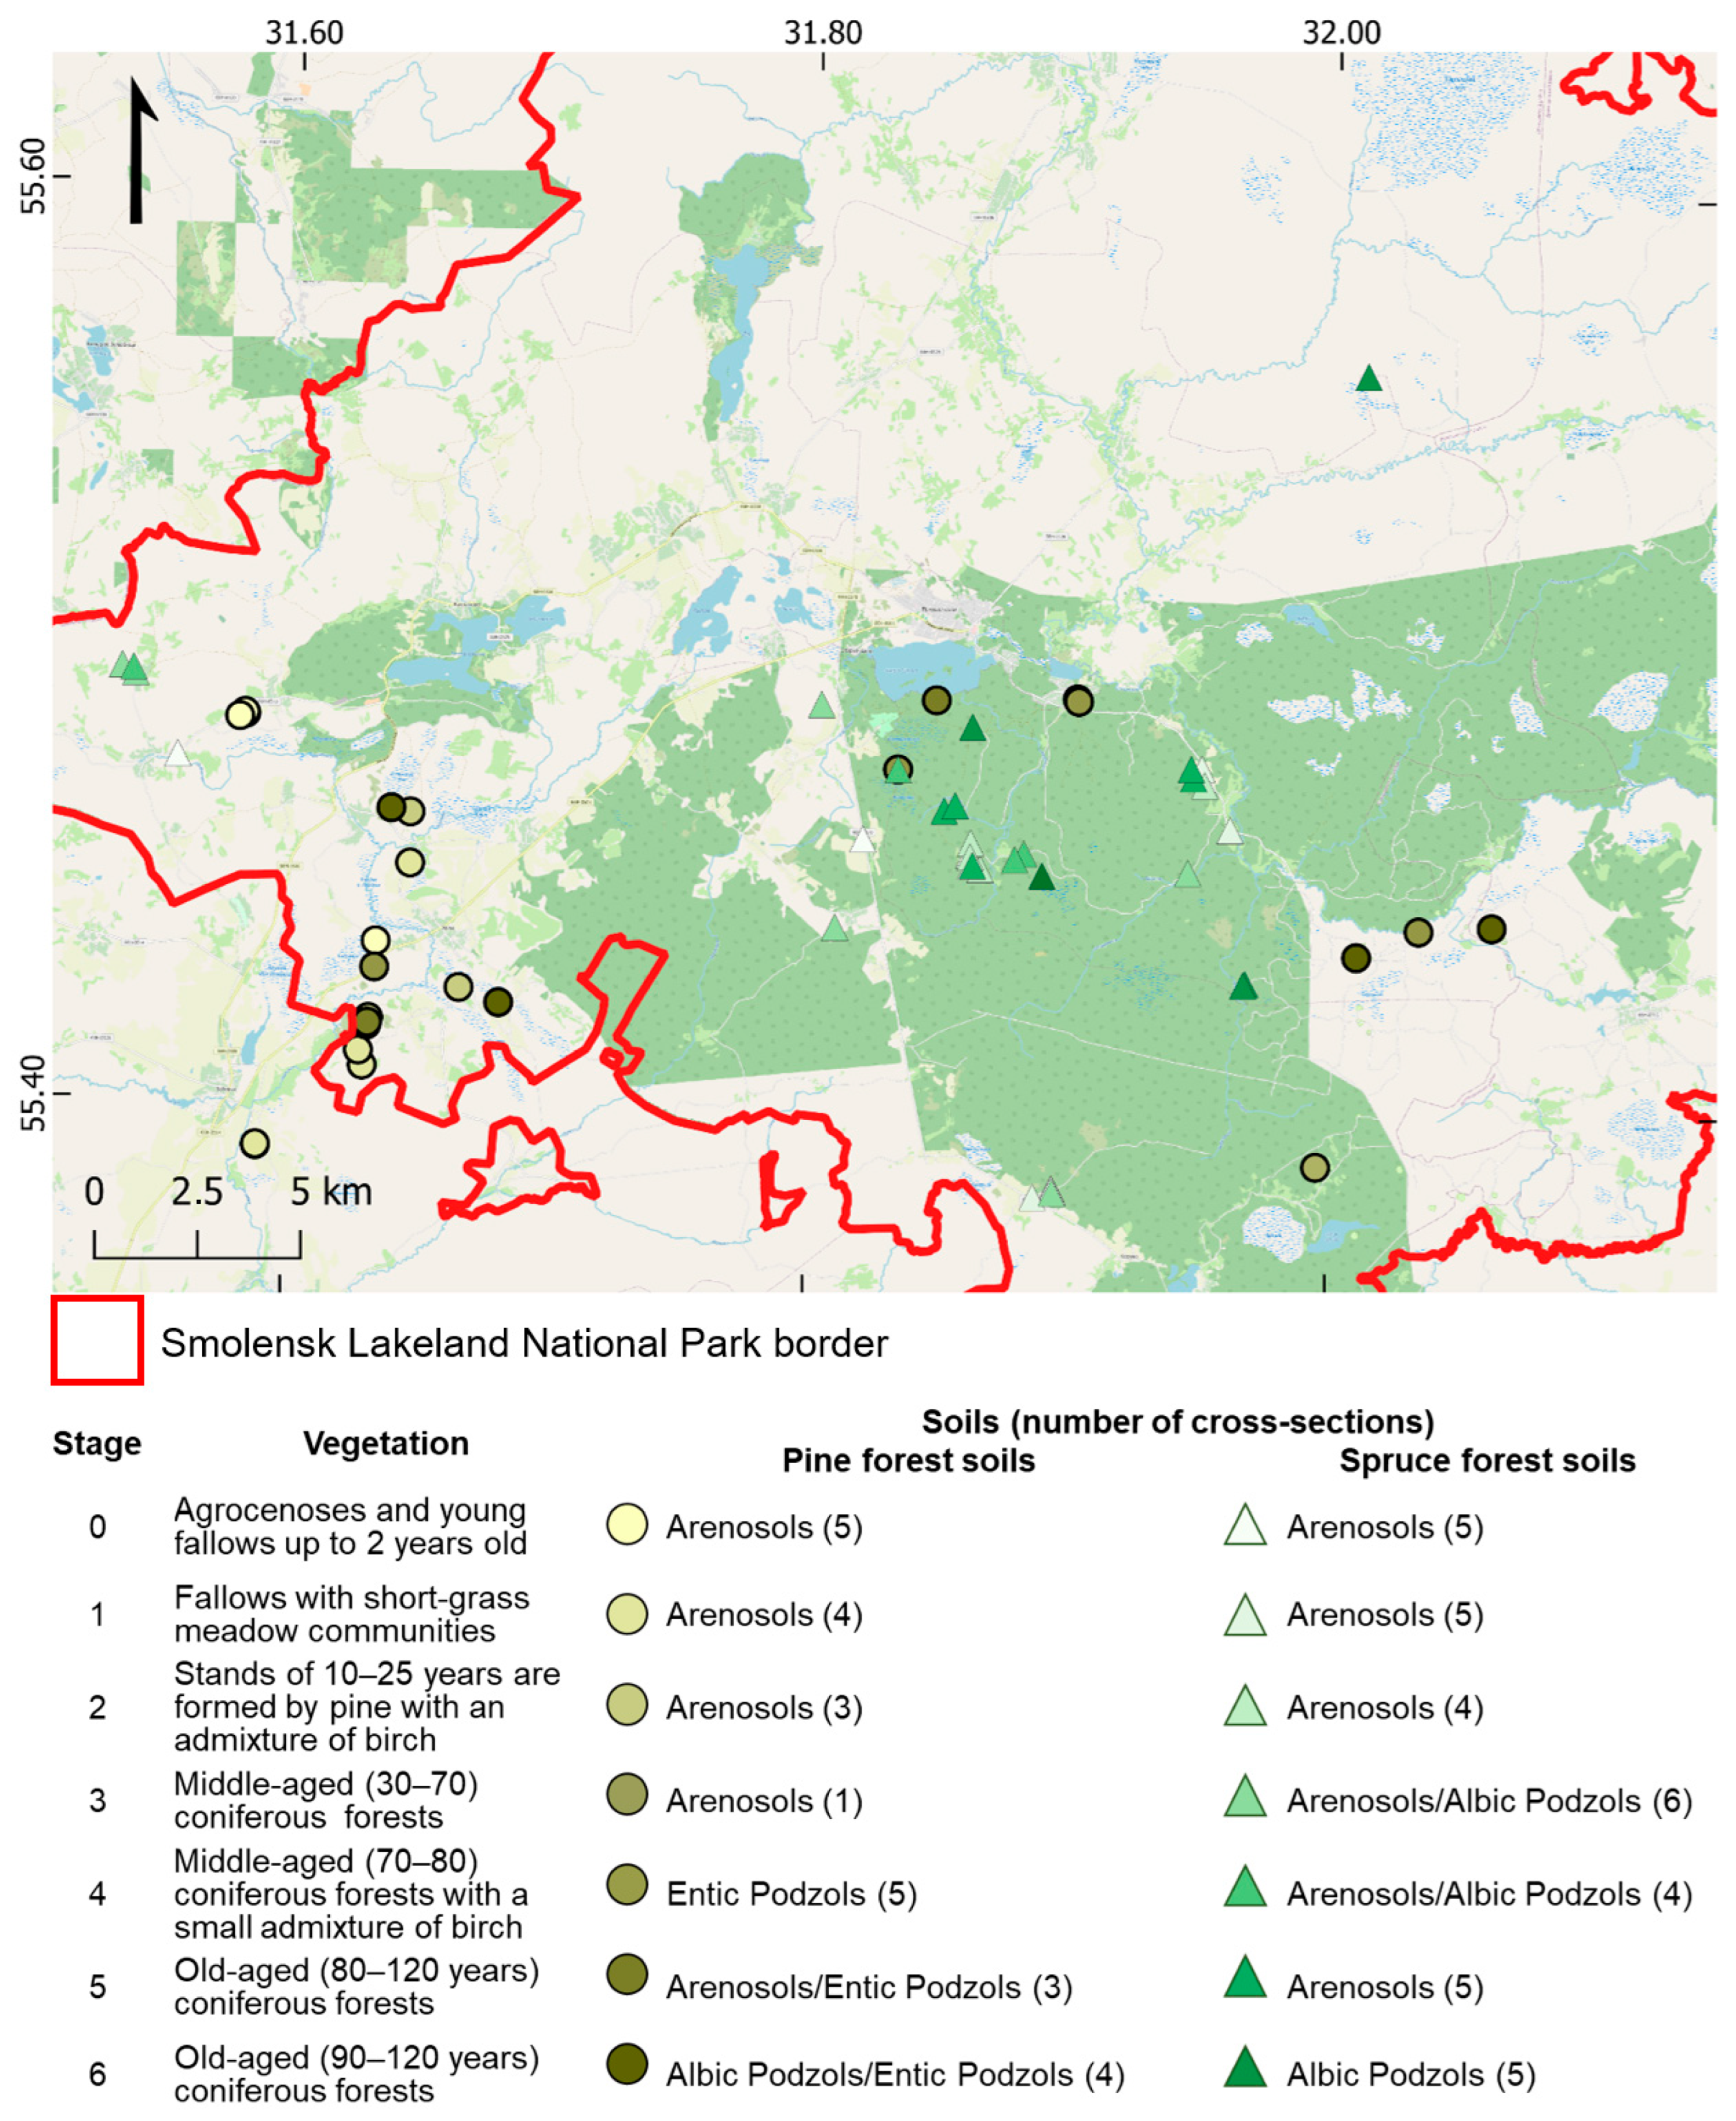
2.1. Study Site

An analysis of the soils was conducted at the subhorizontal surfaces at the Smolensk Lakeland (Russia), which is situated between the Smolensk–Moscow upland and the Valdai Hills in the marginal zone of the last Weichsel glaciation. The Smolensk Lakeland National Park (NP) occupies a substantial portion of the region, encompassing an area of 1460 km2. This park is situated within the boundaries of the Demidovsky and Dukhovshchinsky districts of the Smolensk region [54]. Quaternary sediments were formed during four major glacial periods (Eburonian, Elsterian, Saalian, and Weichselian) and interglacial periods. Sediments of the Weichselian glacier are the most pervasive. In the southern region of the NP, which remained unaffected by the last glaciation, Saalian lacustrine sediments are prevalent. In the marginal zone of the glacier, ridges composed primarily of sands, frequently exhibiting interlayers and lenses of rubble and pebbles, are pervasive. Lacustrine sediments from the Weichselian glacial period, with thicknesses ranging from several tens of centimeters to 5–10 m and beyond, are predominantly distributed along the Elsha, Vasilevka, Polovya, and Sermyatka rivers. These sediments are characterized by the presence of sands, occasionally interspersed with gravel and pebbles. Lake–glacial sediments (most prevalent in areas where the largest contemporary peat bogs are located) are characterized by the presence of fine-grained, clayey, and silty sands with a thickness ranging from 1 to 10 m. Two-membered parent materials are frequently encountered. Such heterogeneity of parent materials determines the diversity of soil and vegetation in the National Park [55,56].
According to the Köppen–Geiger classification, the climate of the National Park is snowy and fully humid with warm summers [57]. During the winter, the arrival of humid air masses from Atlantic cyclones is accompanied by thaws and snowfall. Conversely, Arctic masses decline the temperature and air moisture. In summer, Atlantic cyclones provide cooling and abundant rain, while Asian anticyclones bring sharp warming and dryness [58].
The coniferous and mixed forests that dominate in the National Park were mainly established due to the succession of abandoned arable land. A mere 20% of the park’s total area is comprised of nominally primary forests. The most common tree species are spruce (Picea abies L.), pine (Pínus sylvestris L.), aspen (Populus tremula L.), and birch (Betula pendula Roth). Black alder (Alnus glutinosa L.) and grey alder (A. incana L.) often occupied waterlogged areas. Oak (Quercus robur L.), linden (Tilia cordata Mill.), and maple (Acer platanoides L.) often form the second tree layer. Rowan (Sorbus aucuparia L.), hazel (Corylus avellana L.), spindle (Euonymus verrucosus Scop.), and elderberry (Sambucus nigra L.) are typical for a shrub layer. The dominant tree species define the composition of the herb and shrub layers. Polygonatum odoratum Mill., Convallaria majalis L., Galeobdolon luteum Huds., and Melica nutans L. are abundant in spruce forests. Calamagrostis arundinacea (L.) Roth, Vaccinium vitis-idaea L., and Vaccínium myrtíllus L. are more typical for pine forests. The birch forests are accompanied by Vicia cracca L., Fragaria vesca L., and Centaurea scabiosa L. Various species of sedges and reeds are widespread in waterlogged areas [55,59]. The topography of the territory was distinguished by a high degree of swampiness, with an area of up to 28% of the territory being characterized by such conditions. Continued waterlogging started simultaneously with the retreat of the Weichsel glacier about 12,000 years ago [55].
Podzols, Retisols, Umbrisols, and Arenosols (according to WRB [60]) are the most widespread on interfluve positions. Albic Podzols occur under pine forests. Structured A (humus) horizon is absent in the soils of primary forests on sandy and sandy loam sediments of levelled surfaces of interfluves in the Smolensk Lakeland. In natural soils, the eluviation of humus can form a structureless Ah horizon of 3–6 cm thickness [56]. Therefore, in the soils of the National Park, it can be hypothesised that the substantial A horizon is a remnant of the former ploughing—an Ap horizon [60].
It is possible to distinguish seven distinct stages in the reforestation in the National Park [25]. At present, ploughed lands and young fallow meadows can be regarded as stages 0 and 1, respectively. As the age of fallow meadows increases, the reforestation is initiated. Following the closure of the forest canopy (stage 3), forest vascular species become predominant over meadow plant species, resulting in a significant reduction in the herb layer. In the case of middle-aged forests (stage 4), the formation of a pronounced undergrowth and understorey is characteristic. Old-growth forests (stage 5) are distinguished by high crown closure and a preponderance of boreal plant species. Stage 6 is characterized by the presence of nominally primary forests, which are defined as areas of forest that have been undisturbed for a considerable period of time. These forests are notable for their age; the trees are 180 years old.

2.2. Experimental Design and Plot Description

Sites with homogenous vegetation were selected during preliminary fieldwork. Depending on the tree species, two chronosequences of reforestation were distinguished. The first example is a pine chronosequence, which is found in sandy soils (Table 1). A spruce chronosequence is found in sandy-loamy and loamy soils. In selecting sites for stages 0–1, priority was given to the soil texture in an attempt to investigate sites in proximity to pine or spruce forests. At each of the selected sites (Figure A1), a soil cross-section was excavated (48 in total for the two chronosequences). Morphological proxies of litter were characterized using established approaches [61]. Branches, leaves, needles, stems, and cones that had not undergone decomposition or had undergone a poor degree of decomposition were categorized as the fresh litter Oi horizon. Plant remains with clear signs of fragmentation and decomposition, yet still retaining identifiable features allowing classification into specific litter categories (e.g., leaves or needles), were designated as the fragmented Oe horizon. Residues that could not be allocated to a particular litter category due to their high degree of humification were categorized as the humified Oa horizon.
In the context of agrocenoses and fallow meadows, only the Oi horizon is represented. Its thickness is minimal at stages 0 and 1 (up to 2–3 cm) and increases with the period of forest restoration (up to 6–7 cm). In stage 2, the Oe horizon is typically characterized by a thickness of less than 2–3 cm. From at least stage 3 onwards, the Oa horizon becomes distinguishable, reaching a thickness of up to 7–8 cm at stage 6. The formation of O horizons is consistent across spruce and pine reforestation chronosequences (Figure 1).
The process of converting the Ap horizon into the post-agricultural A(p) horizon occurs gradually. The depth of ploughing (typically 30–35 cm) can be accurately determined in the early stages (0–3) by observing the presence of a smooth boundary and a pronounced transition in colour to the underlying horizon. At subsequent stages, the thickness of the A horizon decreases continuously. In the upper part of the soil at stages 2–3, the formation of the Ah (up to 3 cm) or AO (up to 6 cm) horizons begins. In the soils of old-growth forests that were ploughed 80–100 years ago, the A(p) horizon is still identifiable. The morphological proxies of the underlying horizons correspond to natural ones, as they have not been affected by tillage.

2.3. Soil Sampling

To describe changes in soil proxies during self-restoration, all stages mentioned above were sampled in at least triplicates. Stages 0, 1, and 6 were studied at four sites. Soil pits with cross-sections were obtained from each location. In total, 27 cross-sections were studied. All soils studied are Arenosols and Albic Podzols.
Samples were collected from 0–5, 5–10, 10–15, 15–20, 60–70, and 90–100 cm, taking into account the boundaries between soil horizons. If necessary, the sampling depth was shifted by a few centimeters to obtain material from only one horizon, and additional samples were collected to have material from each horizon. Individual samples of the Oi, Oe, and Oa horizons from the entire site (up to 10 m from the cross-section) were collected separately for chemical analyses. Furthermore, at each site, litter was sampled by horizon in five repetitions using a 25 × 25 cm frame (approximately 500 samples) to determine its stock.

2.4. Soil Analyses

The soil proxies were controlled in 366 samples dried at +40 °C. The grain size fractions were studied using the Analysette 22 comfort laser diffractometer (Fritsch, Germany) as a negative control to substantiate the possibility of using space-for-time substitution [62], i.e., evidence of the initial proximity of soils. We measured 3 fractions: sand (0.05–2 mm), silt (0.002–0.05 mm), and clay (<0.02 mm). The pH value was determined in an aqueous suspension using the pH meter “Expert-pH” (Russia) under dynamic conditions (soil:water ratio of 1:2.5; error ±0.07 pH units). The total organic carbon (TOC) content was determined by dichromate oxidation [63,64]. As the sequential procedures used worldwide to fractionate P compounds (e.g., sequential extraction [65] of P from sediments, dusts, and suspended particulate matter, and methods developed by Mehlich [66], Bray [67], Olsen [68], and others [69]) do not fit our objects, we used the method that is most popular in Russia for such cases (GOST 54650-2011 [70]). The available phosphorus (AP) and potassium (AK) were extracted using 0.2M HCl (soil: solution ratio 1:5 and 1:50 for A-horizons and O-horizons, respectively) according to the Kirsanov method modified by ClNAO. Their concentration was determined by means of inductively coupled plasma optical emission spectrometry (ICP-OES) using Agilent 720 (Agilent Technologies, Malaysia).

2.5. Data Processing and Visualization

The data obtained were processed using Statistica 8 software and R (v. 4.4.3). The Kruskal–Wallis H-test was used to evaluate the temporal changes in the content of available K and P. Depending on the sampling depth, four subsets were formed: i. 0–5 cm, ii. 10–15 cm, iii. 40–50 cm, iv. 90–120 cm (subsoils). In order to evaluate the most significant factors determining the content of available K and P at different depths, regression analysis was also carried out. Spearman’s correlation ranks were calculated. The present study investigates the relationship between the content of available K and P in selected soil layers of pine and spruce reforestation chronosequences and various environmental factors, including the time since the last ploughing, TOC content, pH, texture, and the input of plant remains. The Wilcoxon test was used to assess the difference in the content of AP and AK at the same depth and forest types collected from soils of different stages. Comparisons were made of the target stage and stage 0. The results were visualized in R4.4.3 using the packages ‘dplyr’, ‘ggplot2’, and ‘ggsignif‘ [71]. The significance level of p = 0.05 was chosen.
The graphs of vertical differentiation of available P and K were constructed using the ‘dplyr’ [72] and ‘ggplot2’ [73] packages for R4.4.3. The principal component analysis (PCA), implemented in the ‘factoextra’ and ‘ggplot2’ packages for R4.4.3, was employed to identify the main factors influencing the partitioning of AP and AK. The vectors were superimposed on the PCA plot using a combination of the “fviz_pca_var” function from the ‘factoextra’ package for R4.4.3 [74] and the “geom_segment” and “geom_text” functions from the ‘ggplot2’ package for R4.4.3 [73].

3. Results and Discussion
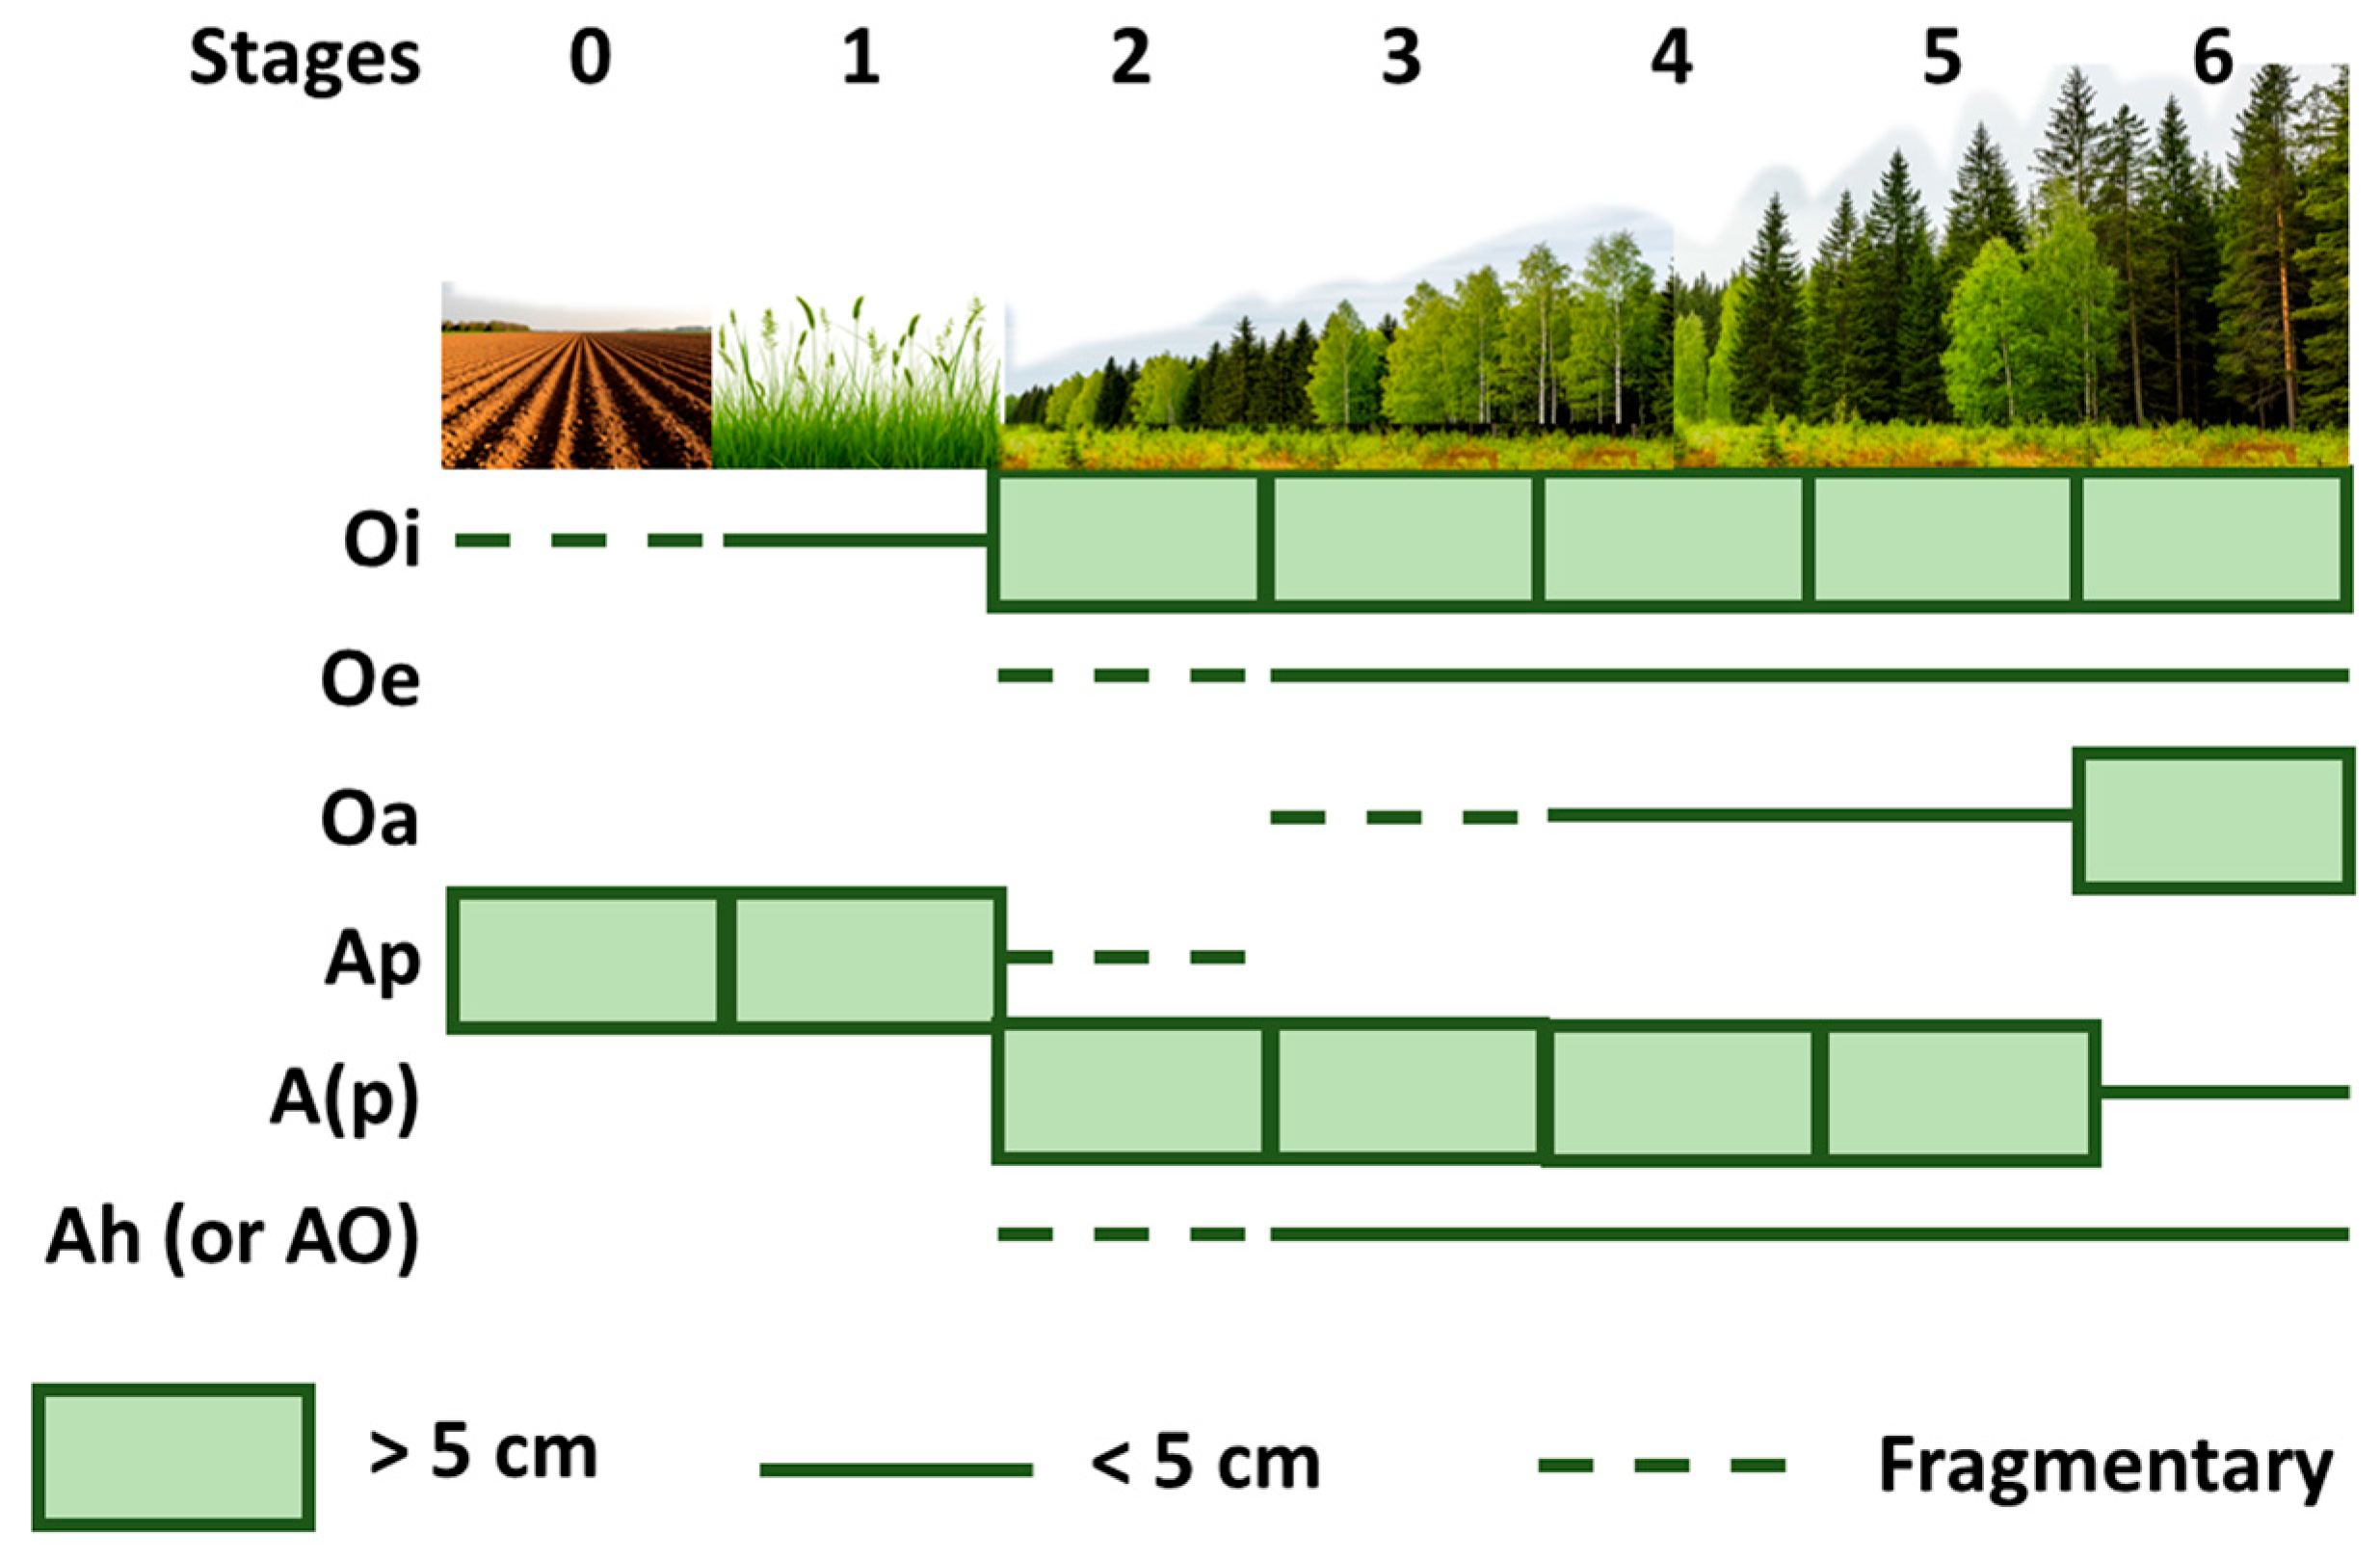
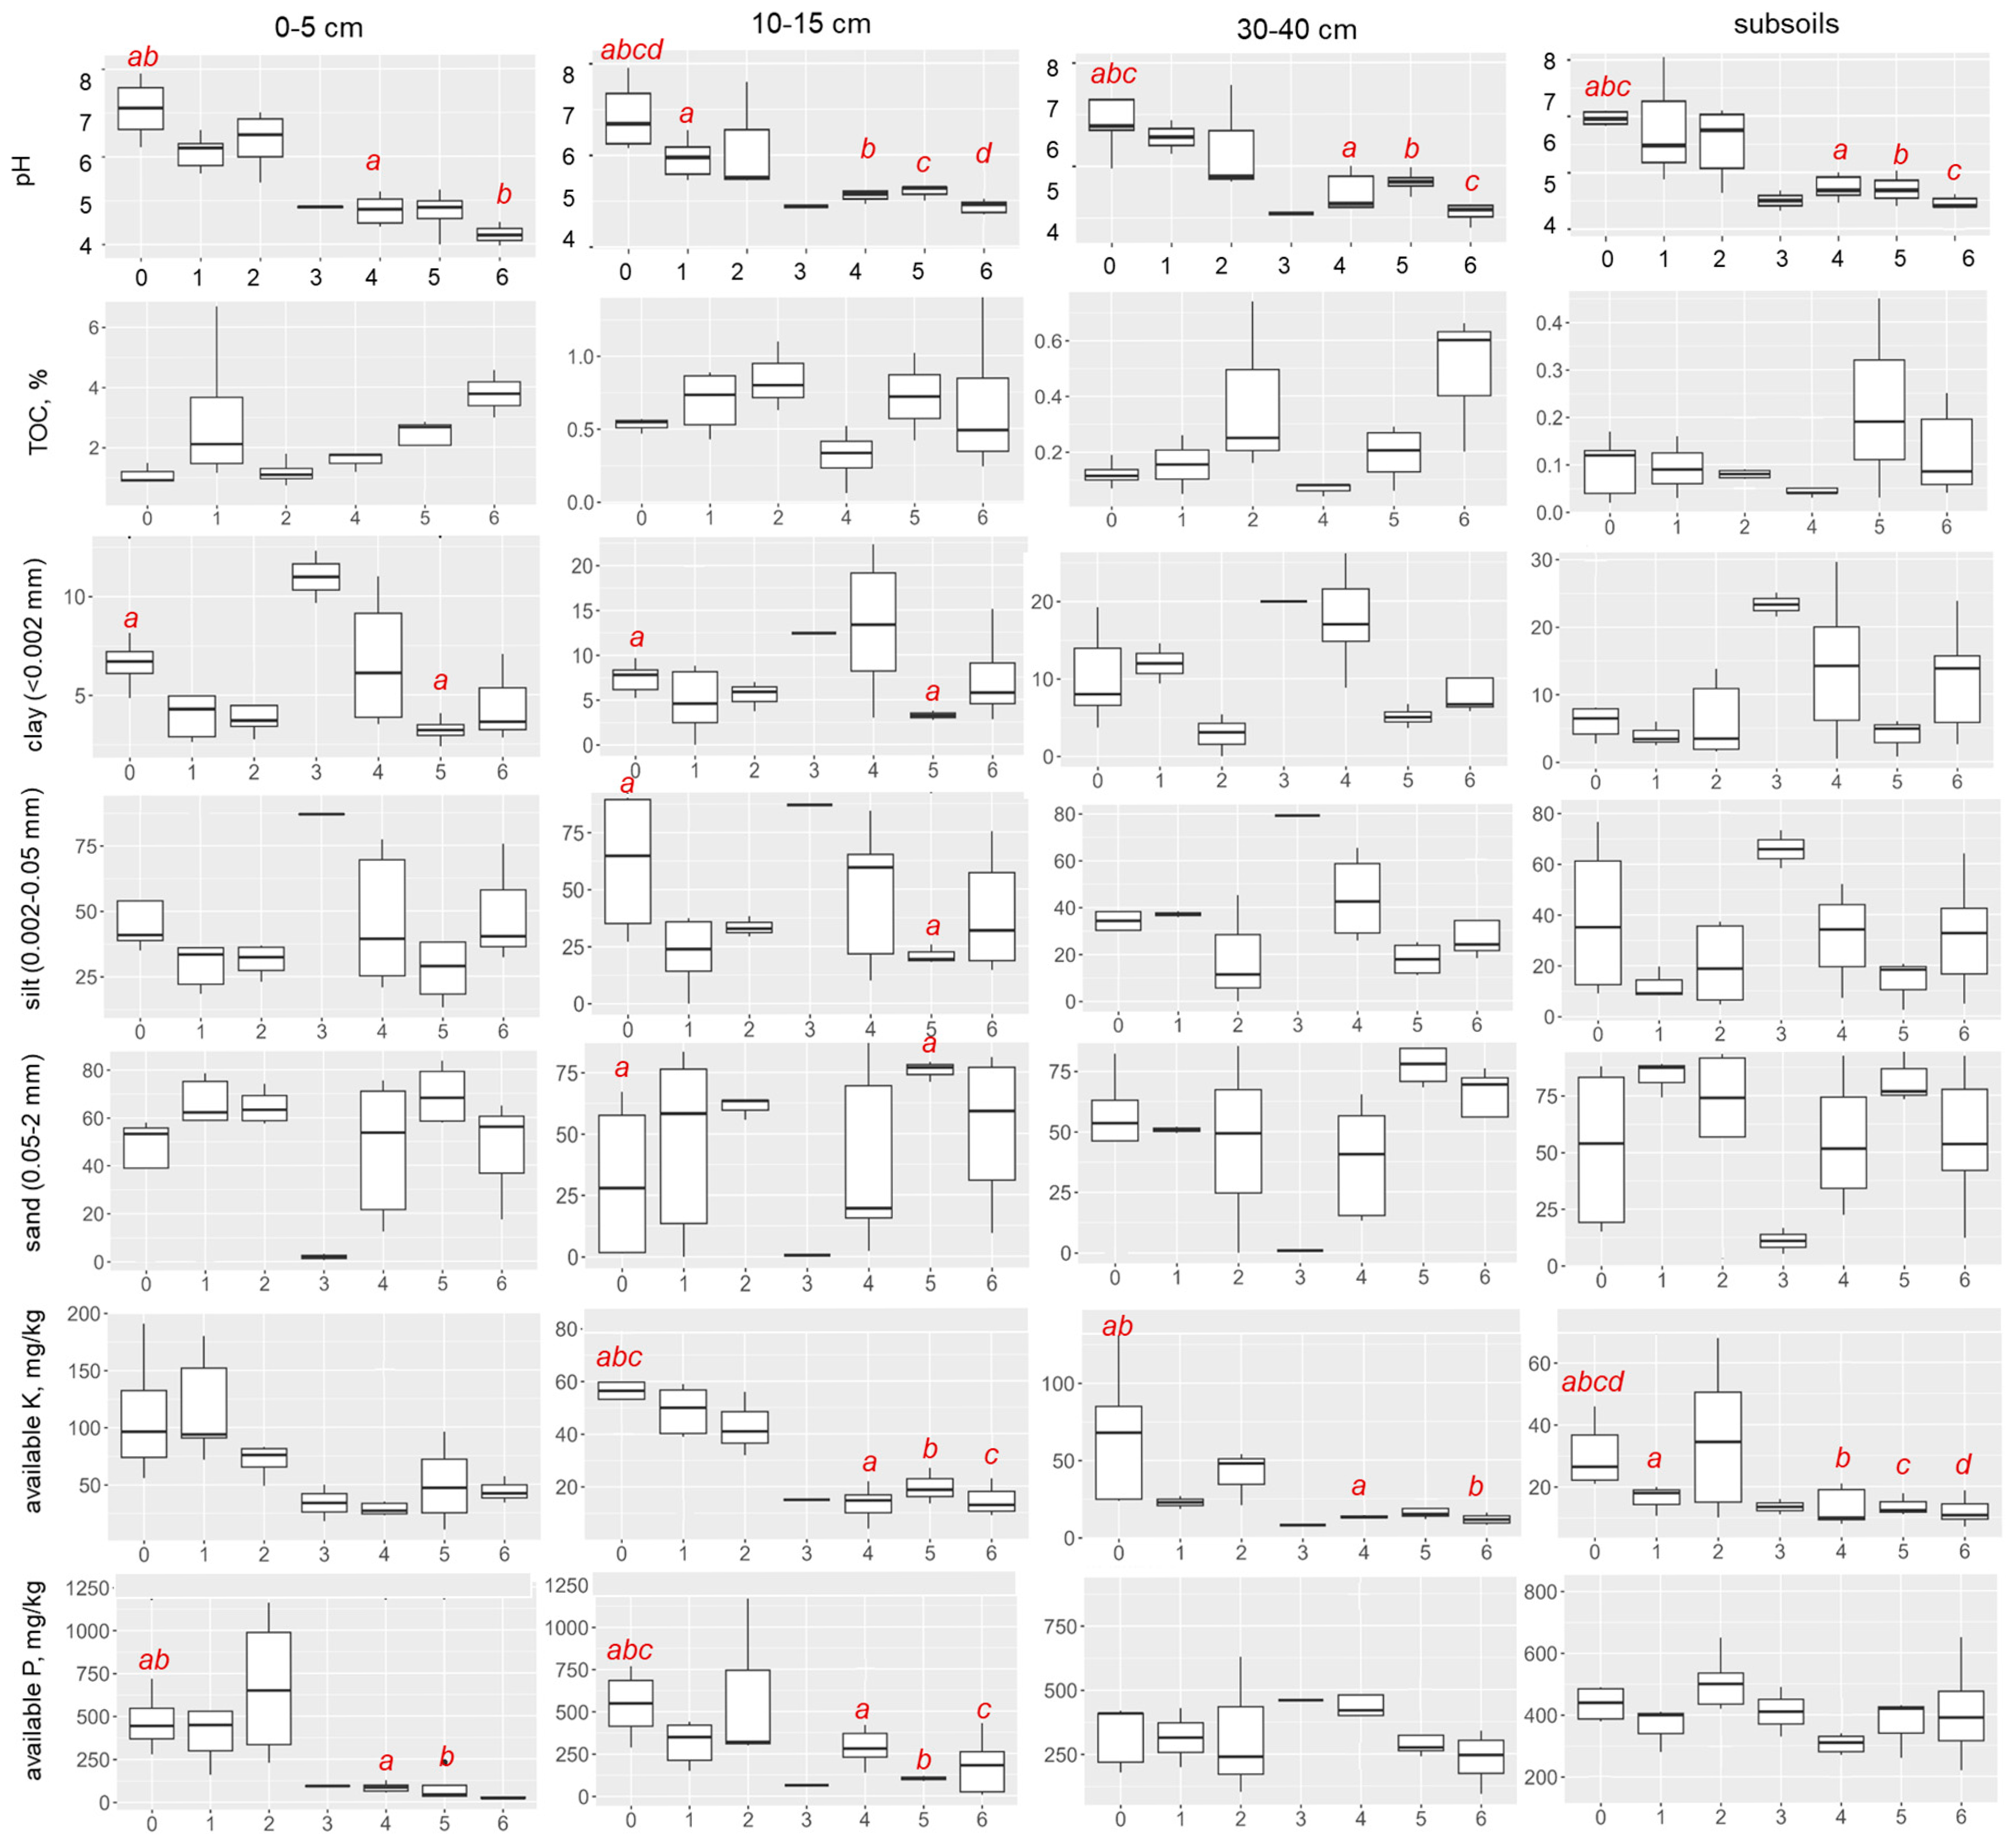
3.1. Soil Proxies

The content of grain size fractions differed insignificantly (Figure 2), though individual changes were observed in the 0–5 and 10–15 cm layers. These findings justify the use of a space-for-time approach for the material collected. After land abandonment, acidification was noted in soils (Figure 2). The most significant decrease in pH was observed after a 20-year fallow period, marked by the emergence of tree plants, aligning with findings from other studies [75].
The litter stock increases from the early to late stages, as well as the degree of its humification (Figure 1). The litter stock increases from stage 0 to stage 2 (from 0.2–0.5 and 0.1–0.6 t/ha in the pine and spruce forest chronosequences, respectively, to 3.6–7.2 and 2.6–10.5 t/ha). Thereafter, the stocks remain approximately constant in the later stages. This finding is consistent with known data [76]. Destructive litter is the most indicative (Table 2), as it contains the majority of available K and P and is the main source of these elements for the underlying horizons [17]. The TOC content was higher at stages 1, 5, and 6 (Figure 2 and Figure 3), which agrees with data reported for abandoned agricultural soils across Europe [77], North America [27,78], and the Russian Far East [75].

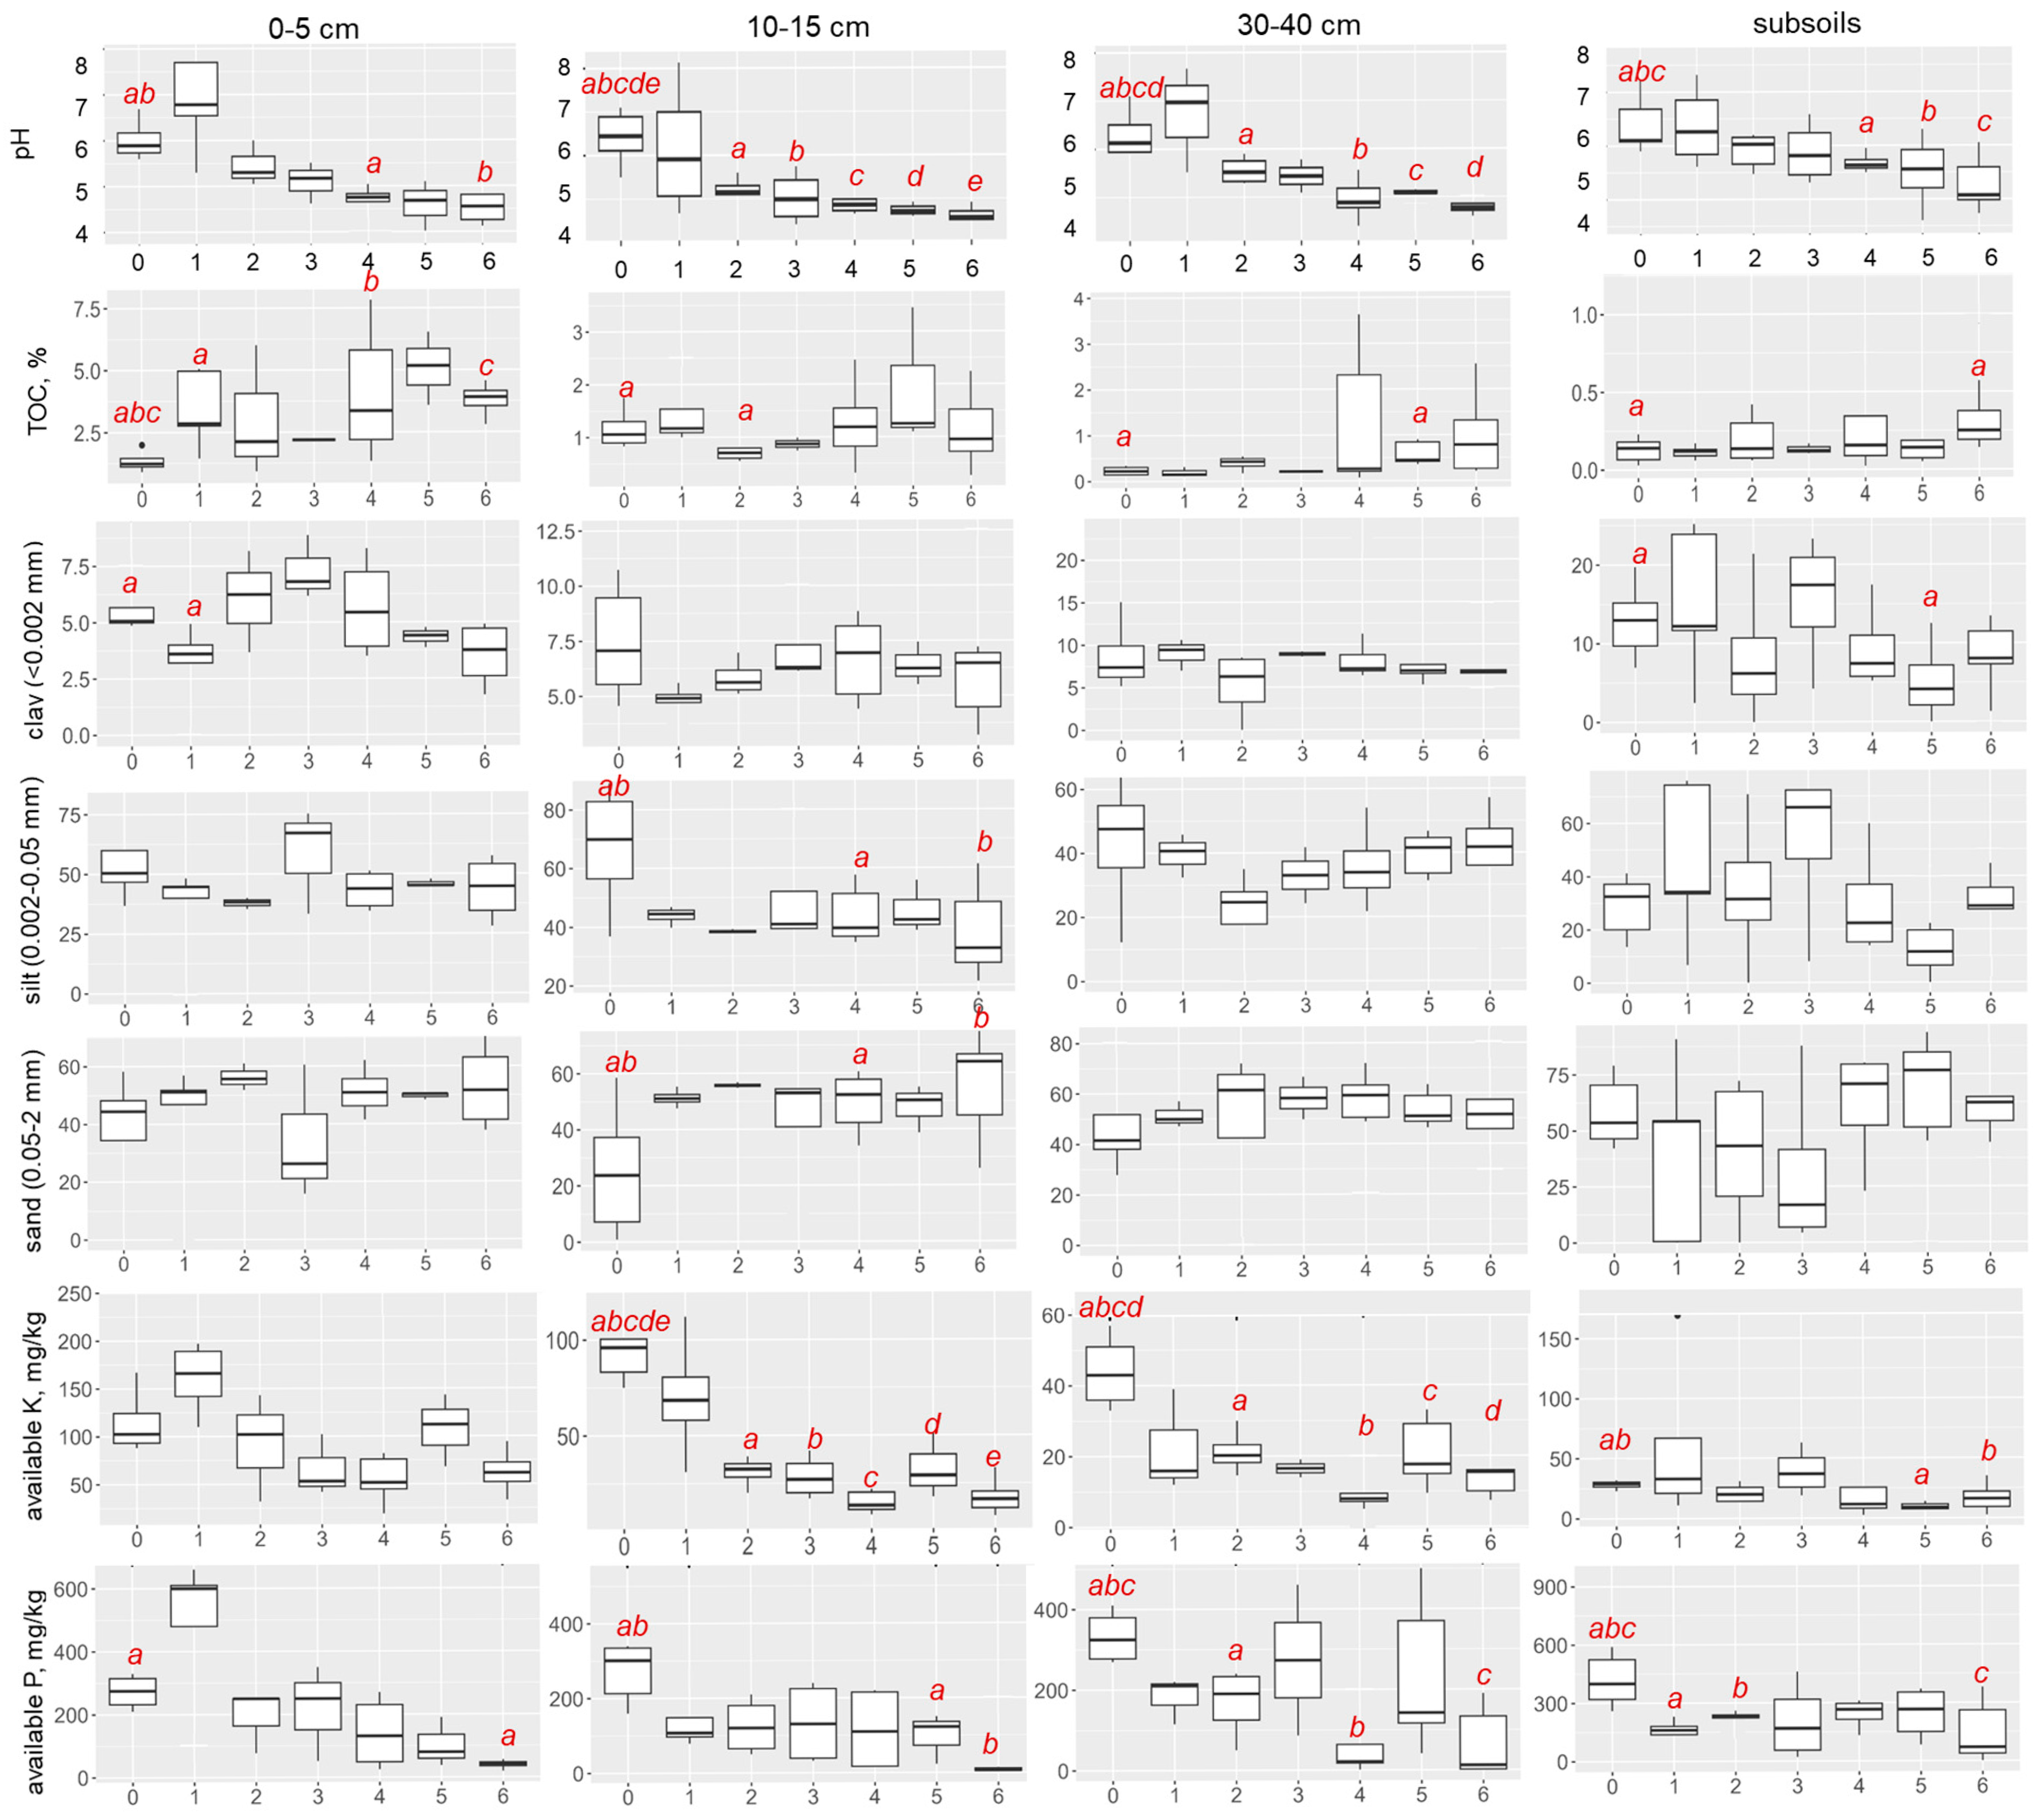
3.2. Vertical Distribution of Available K and P Content

The content of available K exhibited similar trends across all stages of succession. The maximum content of K is invariably found in the uppermost 0–5 cm topsoil layer (Figure 4) due to the release of K from decomposing litter [79] of plants that are predominantly classified hymidocatous, i.e., absorbing elements migrated in a cationic form [80]. Available K accumulates in the topsoil both with plant debris and root uptake [81,82]. The content of available K is higher in soils under spruce forests. However, the organs of spruce and pine accumulate K and P in a similar manner (Table A2). Spruce organs contain only slightly more K and P than pine organs, and the character of their distribution is the same. On average, spruce forests produce more remains per hectare of territory compared to pine forests, which explains the higher content of these macronutrients in the litter of spruce phytocenoses [83].
At the agrocenoses and fallows in the early stages 0–1, the AP content (Figure 4) was high in the uppermost topsoil layer due to the previous fertilization [84]. At stage 2, there was an equilibrium between input AP with remnants of fertilizers and plant and its leaching: similar content is observed in different soil depths. The increase in the P content in the subsoil indicates that leaching and downward movement of the element is predominant over its upward movement with plant uptake [85,86]. Similar results were obtained earlier [35,45]. In the later stages of succession (stages 5–6), similar AP content was observed in the uppermost topsoil layer in spruce and pine forests, which is consistent with [79].
In the absence of agrogenic impact, available P is rapidly leached from the topsoil (Figure 4). The biological input of AP is inadequate to counterbalance the losses from the topsoil layers. The results obtained provide robust evidence to support the hypothesis that the dynamics and vertical distribution of available P in soils are determined by the element’s downward movement.

3.3. Distribution of Available K and P Content by Stages

In the chronosequence studied, changes in available P and K content indicate the impact of fertilization [32]. In the 0–5 and 10–15 cm layers, available K and P content decreased from early to late stages (Figure 2 and Figure 3), in accordance with a shift in the nature of biological input of elements. Grass litter, a source of elements in the topsoils of arable and fallow land, contained more K and P [45,46,87]. During the replacement of the herbaceous remains with coniferous remains, both the volume of biological input and the content of K and P decreased. The alteration to P was more noticeable (especially in the pine forest chronosequence) because its biological input was not compensated by its removal from the topsoil [47]. Concurrently, in spruce forests, the variations in P content were less pronounced due to its elevated concentration in spruce litter [79]. At the 30–40 cm layer, the content of available K significantly decreased during soil restoration. Intriguingly, within this layer, the content of available P was similar at all stages, with minimal variation across stages (Figure 2 and Figure 3). In the subsoil, the content of available K is maximal in stage 0 due to the downward movement of excessive compounds from the root layer. Even at such depths, anthropogenic input of K into the soil is an important factor. At the same depth, agricultural practices, including ploughing and fertilization, had less effect on the distribution of available P.
Consequently, the content of available K and P in soils of the two studied chronosequences decreased from early to late stages (Figure 2 and Figure 3). The maximum content of the nutrients in soils of arable lands (stage 0) and fallow (stage 1) resulted from fertilization and the significant input of plant remains that are rich in K and P. Furthermore, the leaching of their available compounds was not compensated for by the input of plant remains.
The results obtained confirm that there are significant differences in the temporal and vertical distribution of the content of available K and P in the chronosequences studied.

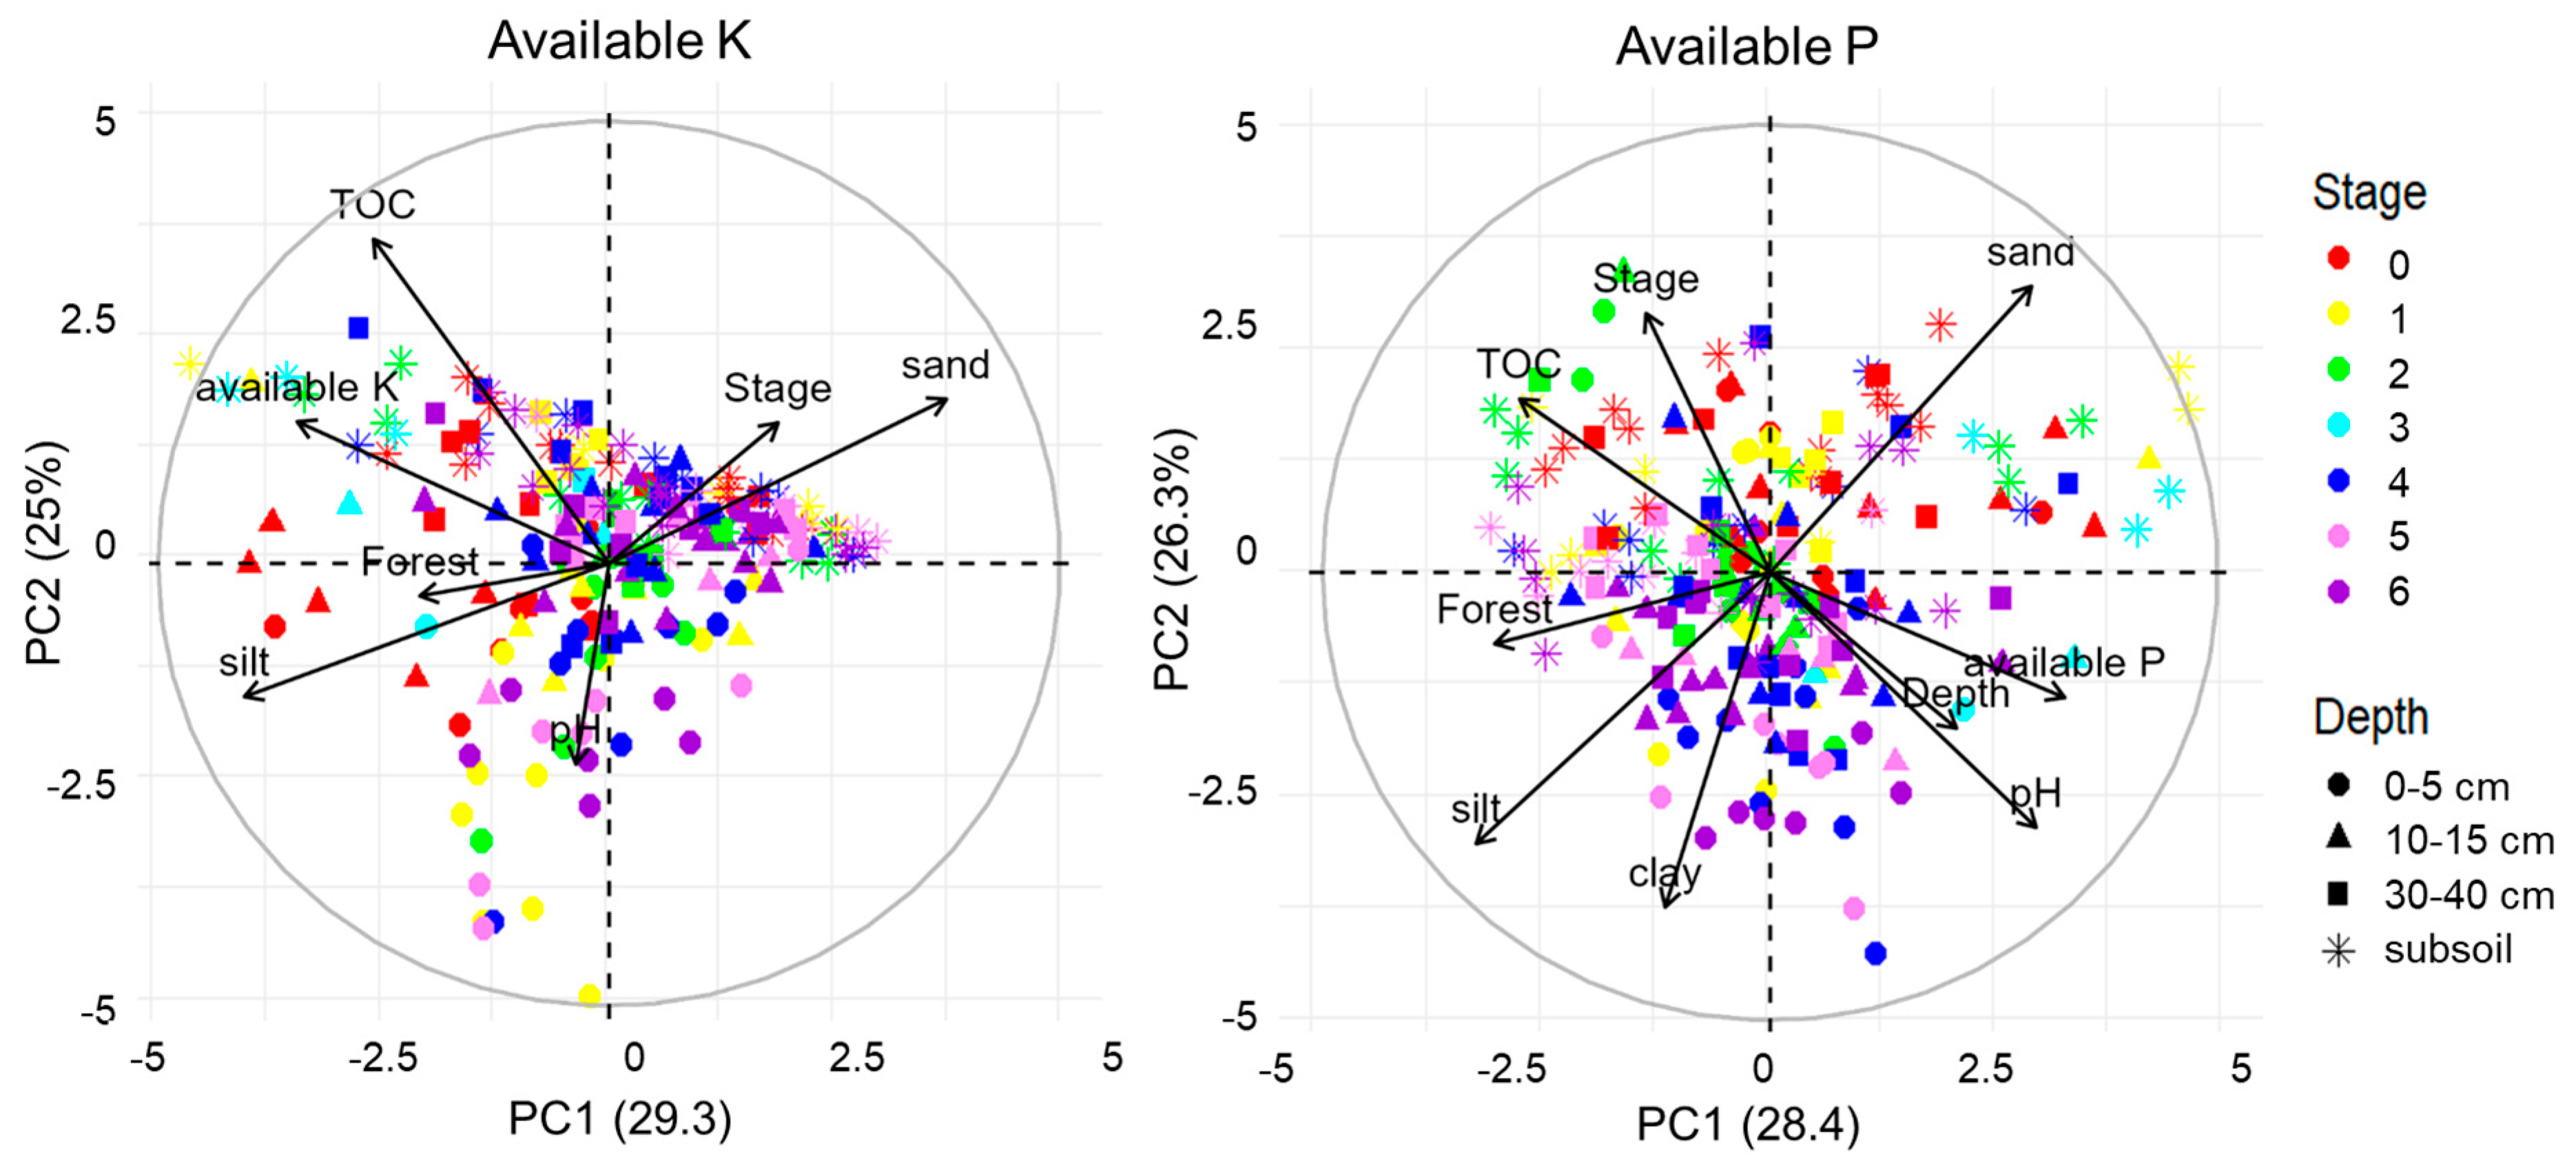
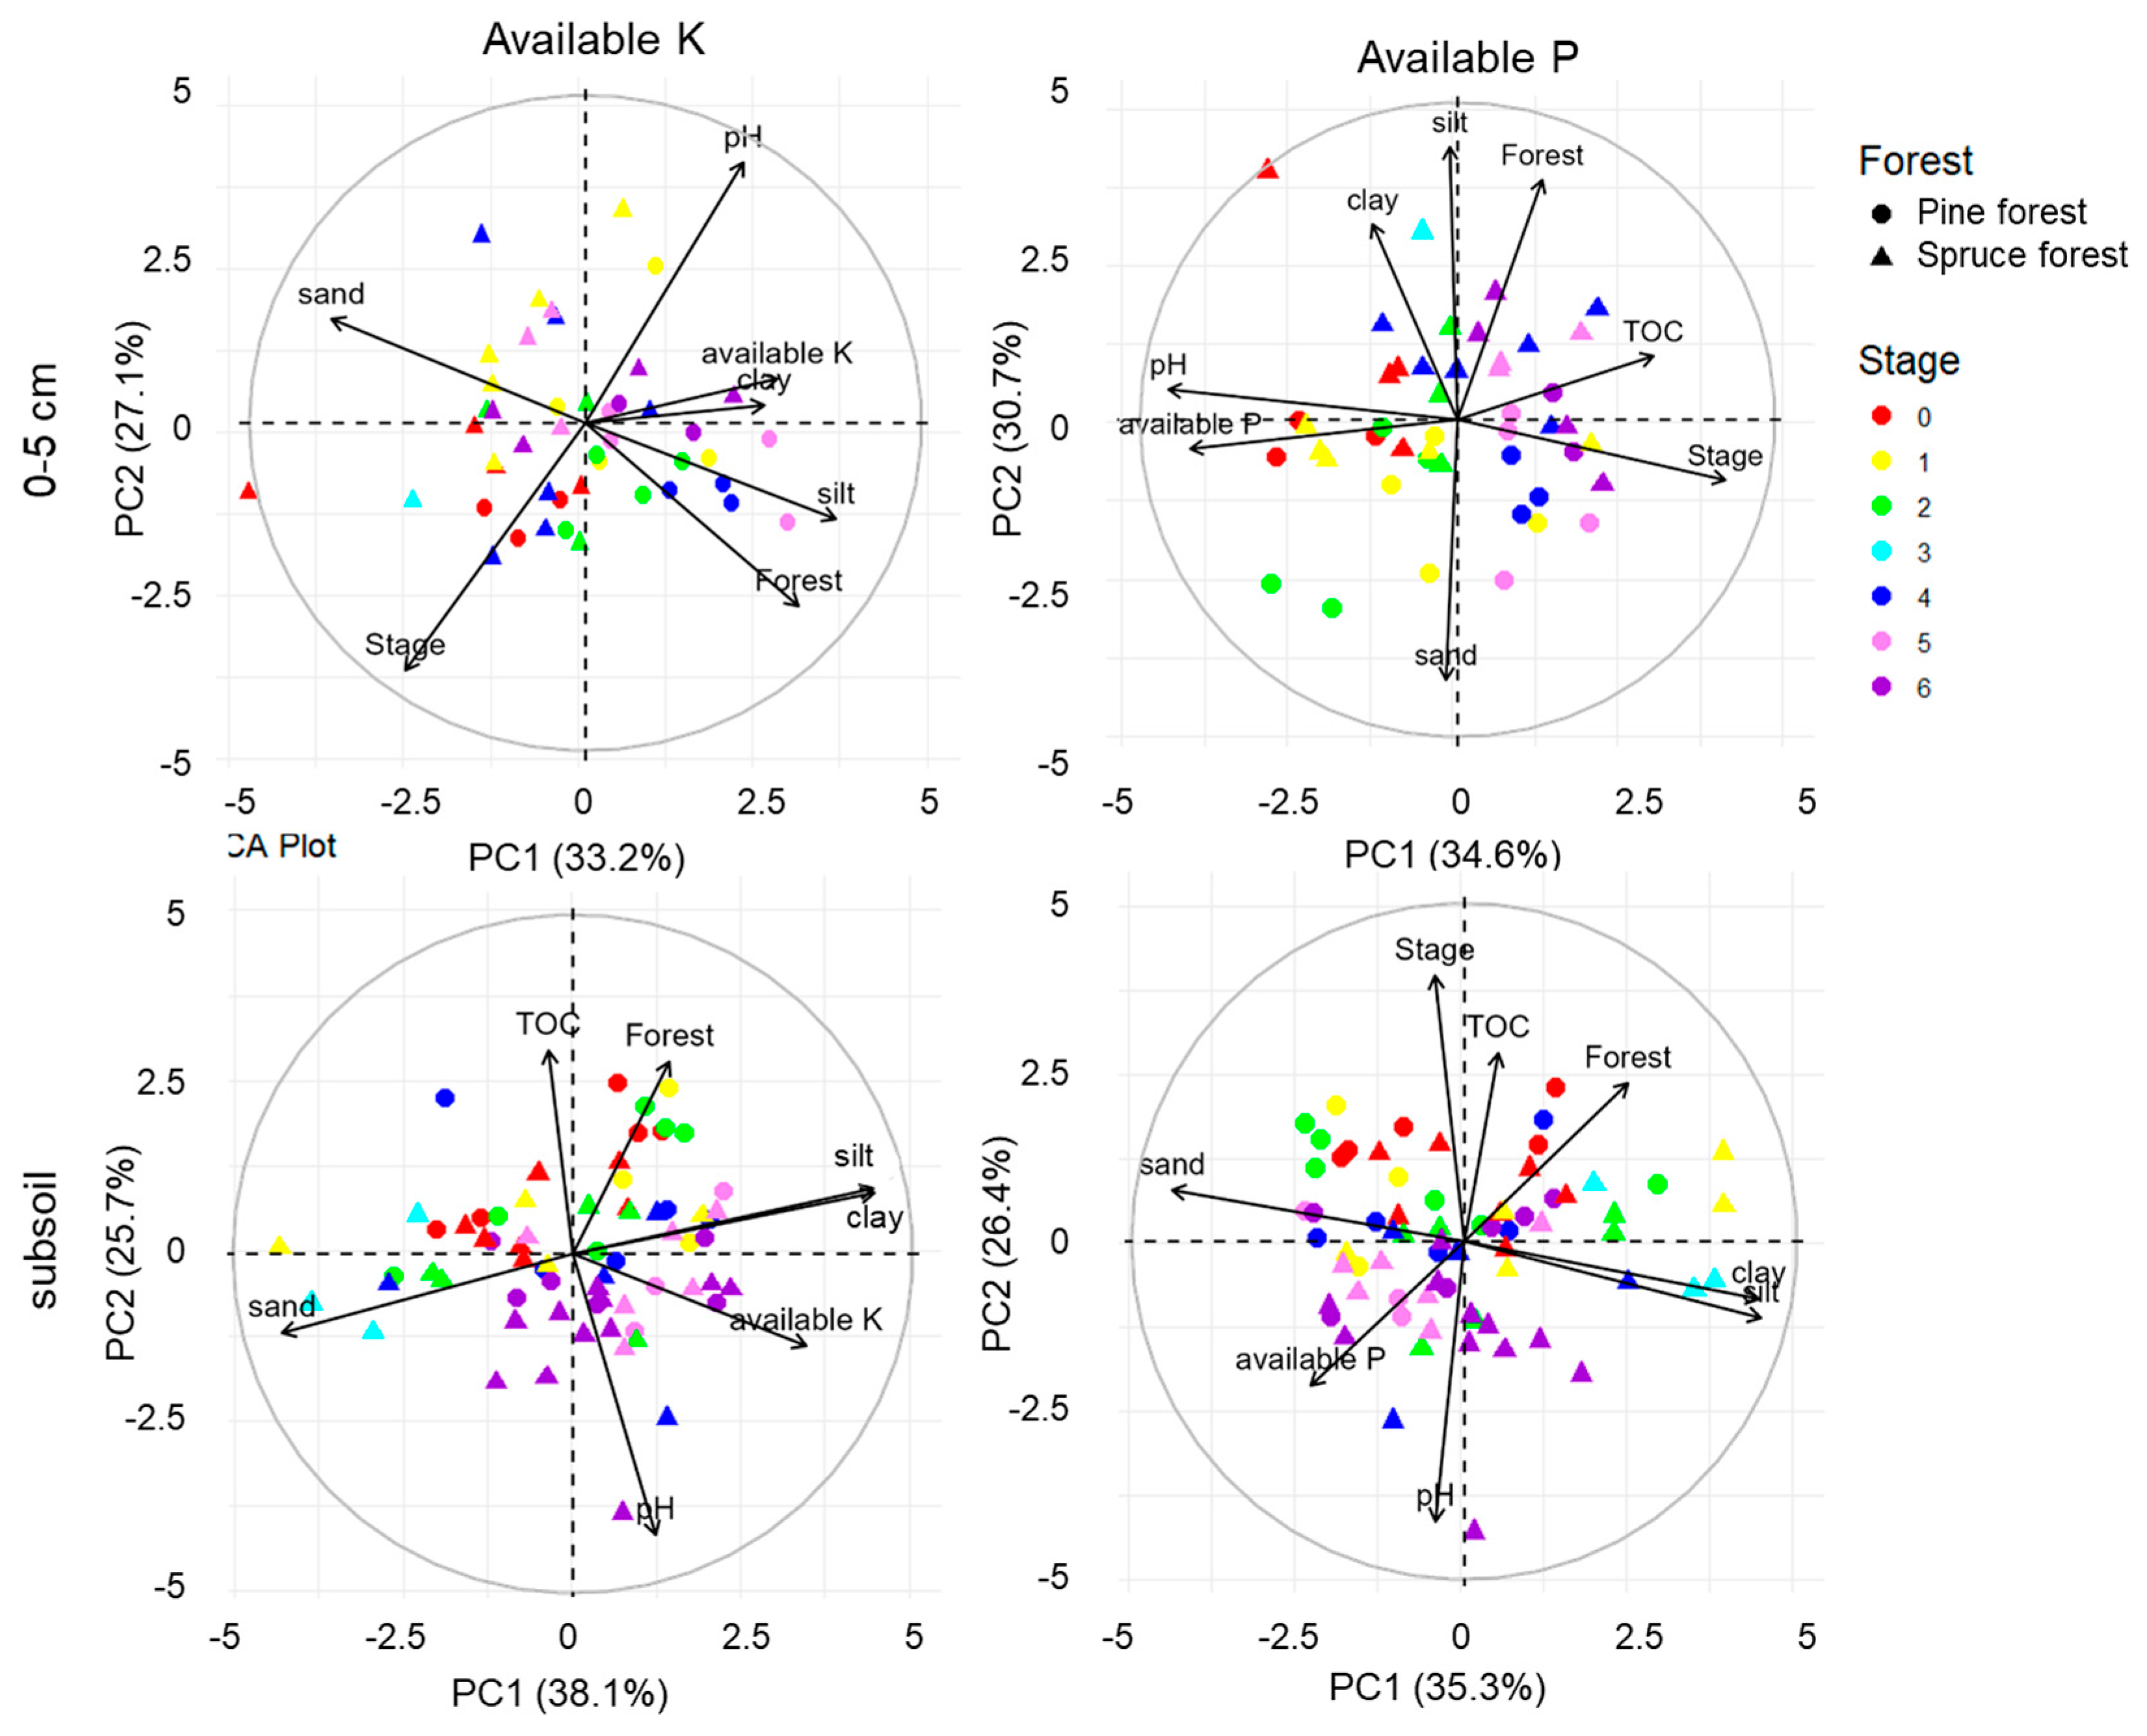
3.4. Factors Determining the Dynamics of the Available K and P Content

A significant correlation of available K content was observed with the input of litter at all depths studied (r = 0.4–0.5; Table 3), confirming the active release of the element from litter [79] and its high mobility with increasing soil acidity [88]. The active release of K from litter underscores the role of humification of plant remnants, especially for cationic elements compared to anionic elements [89].
The pH value defines the behaviour of available K and P. The more alkaline the conditions, the higher the content of the available forms of both elements in the 0–5 and 10–15 cm layers, as well as the content of AK in the 30–40 cm layer and in the subsoil. Higher pH levels associated with greater availability of K and P indicate that pH may have a pivotal role in the retention of these nutrients. In more acidic soils, increased leaching may lead to lower available nutrient content [89]. This highlights the importance of understanding how soil pH influences leaching and nutrient dynamics in forest ecosystems. A slight correlation with the TOC content was observed only for K in the uppermost topsoil layers (r = 0.4; Table 3).
The investigation revealed no significant correlation between soil texture and available K and P content at depths up to 40 cm. Only in the subsoil, the content of AK correlated significantly with silt and clay content (r = 0.4–0.5; Table 3). Consequently, the hypothesis that soils of heavier texture would contain more available K and P due to their high sorption capacity was only partially confirmed and aligned with other studies [90,91]. The available P content did not correlate with sand content. In worldwide soils, total P had a negative correlation with sand content [92]. The partial confirmation of the hypothesis regarding texture suggests that sorption influences nutrient availability together with biological (litter decomposition) and chemical (acidification) processes.
The most significant factors determining the content of available K and P in previously plowed soils are the input of elements during the decomposition of forest litter, soil acidity, and the stage of restoration. The results of the regression analysis were confirmed by the correlation analysis (Table 3). Soil texture was not the main factor in most cases. Based on the regression analysis, four equations were compiled that explain >50% of the variance (exact value is given after the equation) through the influence of the variables considered:
K0–5 = 66 + 0.017 × Klitter − 0.43 × t; (53%)
K10–15 = −54 + 0.19 × K0–5 + 13 × pH; (77%)
Ksubsoil = −88 + 0.02 × Klitter + 12 × pH; (68%)
P0–5 = −588 − 0.07 × Plitter − 0.43 × t + 163 × pH; (65%),
where t is the time since the last ploughing (in years); K and P are the content of available K and P in the corresponding soil layer or in the plant litter (in mg/kg) as indicated by the sub-subscripts.
Nevertheless, the possibility of predicting the distribution of available K and P content in different parts of the soil, as well as the influence of agricultural activity on the content of these nutrients, requires further study.
In the PCA plots, the distribution of samples from different stages was found to be scattered (Figure 5 and Figure A2). The available K content distribution showed minimal variation across succession stages, i.e., the main factors contributing to this scatter are the forest group and the clay and sand content. The subsoil layers were scattered along the main axis, while the points of the 0–5 cm topsoil layer (Figure 5) were grouped along the cross axis. The pH mainly influenced the scattering of points along the main axis at the 0–5 cm depth. Clay content was the main contributor to the scatter of points along the cross axis.
In the subsoil layer, soil texture mainly influenced the scattering of points along the main axis. TOC, forest type, and pH value were the main contributors to the scatter of points along the cross axis (Figure 5).
In the case of available P content, points of the subsoil of stages 0–2 were scattered above the main axis (Figure 5), while the points of the 0–5 cm layer of stages 5–6 were grouped to the right of the cross axis. Succession stage, pH, and TOC content were the main contributors to the scattering of points along the main axis in the 0–5 cm depth. Forest type and soil texture mainly influenced the partitioning of points along the cross axis. In the subsoil, soil texture mainly influenced the scattering of points along the main axis. The TOC content, succession stage, and pH value were the main contributors to the scatter of points along the cross axis (Figure 5).

4. Conclusions

This study provided a comprehensive analysis of the vertical differentiation and dynamics of available K and P content in post-agricultural soils during spruce and pine reforestation. In terms of vertical differentiation, the highest concentration of available K was found in the uppermost 0–5 cm topsoil layer, attributed to the release of K during litter decomposition. The initial high available P content in the topsoil was due to fertilization. In litter layers of later successional stages (3–6), spruce forests had higher available P content than pine forests. A decline in both available K and P content was observed from early to late successional stages, especially in the topsoil (0–5 cm), due to changes in biological input from herbaceous litter to conifer litter.
There was a correlation between available K and litter input. The positive correlation between pH values and nutrient content is associated with agricultural activity. Soil texture influenced nutrient availability but to a lesser extent than biological input or pH. Regression analyses indicated that forest type, successional stage, and soil proxies significantly influenced nutrient distribution. Available K showed less variation among successional stages and was more controlled by changes in pH values, while the available P content varied more with forest type and succession stage.
The observed influence of forest type, successional stage, and soil proxies on nutrient partitioning emphasizes the necessity for adaptive management approaches tailored to specific ecological contexts. As climate change continues to alter precipitation patterns and temperature regimes, understanding these dynamics will be vital for predicting how forest ecosystems respond to environmental stressors. The identification of key factors influencing the dynamics of available K and P content is crucial for developing effective forest management. Our findings are valuable for post-agricultural landscapes where legacy effects from previous land use may hinder natural succession.
In terms of climate resilience, maintaining adequate levels of available K and P is essential for supporting plant growth and productivity, which are critical for carbon sequestration efforts. Healthy forests not only act as carbon sinks but also play a crucial role in regulating local climates. Therefore, integrating findings from our study into broader forest management frameworks can enhance ecosystem services while promoting biodiversity.

Author Contributions

Conceptualization, I.N.S.; methodology, P.D.C. and I.N.S.; software, P.R.E. and P.D.C.; validation, P.R.E., P.D.C. and I.N.S.; formal analysis, P.R.E. and P.D.C.; investigation, P.D.C. and I.N.S.; resources, I.N.S.; data curation, I.N.S. and P.R.E.; writing—original draft preparation, P.R.E. and P.D.C.; writing—review and editing, P.R.E., P.D.C., I.N.S. and G.-H.Y.; visualization, P.R.E. and P.D.C.; supervision, I.N.S.; project administration, I.N.S.; funding acquisition, P.R.E. and I.N.S. All authors have read and agreed to the published version of the manuscript.

Funding

This work was supported by the Russian Science Foundation (project No. 21-74-20171-П).

Data Availability Statement

The raw data supporting the conclusions of this article will be made available by the authors upon request.

Acknowledgments

The authors are grateful to the participants of the fieldwork, namely I.M. Bavshin, D.R. Bardashov, E.V. Basova, Y.B. Bachinsky, A.P. Geraskina, G.V. Klink, A.I. Kulikova, A.D. Naumov, O.V. Shopina, D.A. Terekhova, A.V. Titovets, E.V. Tikhonova, and D.N. Tikhonov. Laboratory work was conducted at the Faculty of Geography of the Lomonosov Moscow State University and at the Chromatography Centre (registration number 3297), established on the basis of the ecoanalytical laboratory of the Komi Scientific Centre of the Ural RAS Department.

Conflicts of Interest

The authors declare no conflicts of interest.

Appendix A

Table A1. K and P content in plants of pine and spruce forests of various ages [83], expressed as a percentage (%) of dry matter.
StagesSpeciesPlant PartKP
From young (10–30 years) to nominally primary pine forestsPinus sylvestrisNeedles0.450.16
Branches0.320.07
Trunk0.100.01
Small roots0.150.06
Litter0.130.05
From young (10–30 years) to nominally primary spruce forestsPicea abiesNeedles0.390.19
Branches0.190.06
Trunk0.070.03
Small roots0.150.05
From young (10–30) to old (over 100 years) coniferous forestsBetula pendulaLeaves0.840.27
Branches0.200.10
Wood0.040.01
Bark0.100.04
From young (10–30 years) to nominally primary coniferous forestsSorbus aucupariaFruits2.030.16
Leaves1.380.41
Arable landsAgrostis capillaris L.Plant1.090.19
Fallow meadowsTrifolium pratense L.Plant1.310.55
Young (10–30 years) pine and birch forestsEpilobium angustifolium L.Plant0.750.43
From middle-aged (30–50 years) to nominally primary pine forests
From middle-aged (30–50 years) to nominally primary spruce forests
Oxalis acetosella L.Leaves2.980.38
Vaccinium myrtillus L.Leaves0.450.12
Figure A1. Study area location.
Forests 16 00845 g0a1
Figure A2. Distribution of studied soil layers of stages 0–6 of the chronosequence based on the concentration of available K and P in the space of two principal components. The plot shows the factors with significant loadings.
Forests 16 00845 g0a2
Table A2. Consumption of K and P by aerial tissues of pine and spruce forests in the southern taiga of the East European Plain [83], measured in kilograms per hectare (kg/ha).
VegetationAge, YearsKP
Spruce205.571.38
606.121.34
1204.341.78
Pine205.041.31
602.681.25
1201.920.44

References

  1. Costantini, E.A.C.; Branquinho, C.; Nunes, A.; Schwilch, G.; Stavi, I.; Valdecantos, A.; Zucca, C. Soil Indicators to Assess the Effectiveness of Restoration Strategies in Dryland Ecosystems. Solid Earth 2016, 7, 397–414. [Google Scholar] [CrossRef]
  2. Ruiz-Navarro, A.; Barberá, G.G.; Navarro-Cano, J.A.; Albaladejo, J.; Castillo, V.M. Soil Dynamics in Pinus Halepensis Reforestation: Effect of Microenvironments and Previous Land Use. Geoderma 2009, 153, 353–361. [Google Scholar] [CrossRef]
  3. Deng, Q.; McMahon, D.E.; Xiang, Y.; Yu, C.L.; Jackson, R.B.; Hui, D. A Global Meta-Analysis of Soil Phosphorus Dynamics after Afforestation. New Phytol. 2017, 213, 181–192. [Google Scholar] [CrossRef] [PubMed]
  4. Qiu, S.; Yang, H.; Zhang, S.; Huang, S.; Zhao, S.; Xu, X.; He, P.; Zhou, W.; Zhao, Y.; Yan, N.; et al. Carbon Storage in an Arable Soil Combining Field Measurements, Aggregate Turnover Modeling and Climate Scenarios. Catena 2023, 220, 106708. [Google Scholar] [CrossRef]
  5. Li, R.; He, W.; Duan, J.; Feng, S.; Zhu, Z.; Zhang, Y. Existing Form and Distribution of Fluorine and Phosphorus in Phosphate Rock Acid-Insoluble Residue. Environ. Sci. Pollut. Res. 2022, 29, 7758–7771. [Google Scholar] [CrossRef] [PubMed]
  6. Zhang, Q.; Boutton, T.W.; Hsiao, C.J.; Mushinski, R.M.; Wang, L.; Bol, R.; Klumpp, E. Soil Colloidal Particles in a Subtropical Savanna: Biogeochemical Significance and Influence of Anthropogenic Disturbances. Geoderma 2023, 430, 116282. [Google Scholar] [CrossRef]
  7. Kraynov, S.R.; Ryzhenko, B.N. Analysis of Resolutions of Predictive Models for Anthropogenic Changes in the Chemical Composition of Groundwaters and Their Optimum Geochemical Content. Geochem. Int. 2000, 38, 629–639. [Google Scholar]
  8. Westerman, R.L. Soil Testing and Plant Analysis; Soil Science Society of America, Inc.: Madison, WI, USA, 2018; ISBN 9780891188629. [Google Scholar]
  9. Anila, A.S.; Joseph, B.; Rani, B.; Gladis, R.; Gopinath, P.P. Potassium Fractions and Release from Mineral Sources of Potassium as Influenced by Potassium Solubilizing Bacteria (Bacillus Sporothermodurans). Curr. J. Appl. Sci. Technol. 2022, 41, 21–31. [Google Scholar] [CrossRef]
  10. Huang, P.M. Chemistry of Potassium in Soils. In Chemical Processes in Soils; Soil Science Society of America: Madison, WI, USA, 2018; ISBN 9780891188926. [Google Scholar]
  11. Seredina, V. Geochemical Features of the Potassium Conduct in the Soil. Vestn. Tomsk. Gos. Univ. Biol. 2007, 1, 106–118. [Google Scholar]
  12. Dobrovolskiy, V.V. Basic Biogeochemistry; Publishing house “Akademiya”: Moskva, Russia, 2003. [Google Scholar]
  13. Holtan, H.; Kamp-Nielsen, L.; Stuanes, A.O. Phosphorus in Soil, Water and Sediment: An Overview. In Phosphorus in Freshwater Ecosystems; Kluwer Academic Publishers: Dordrecht, The Netherlands, 1988. [Google Scholar]
  14. Alfaro, M.A.; Jarvis, S.C.; Gregory, P.J. Factors Affecting Potassium Leaching in Different Soils. Soil Use Manag. 2006, 20, 182–189. [Google Scholar] [CrossRef]
  15. Bogatyrev, L.G.; Telesnina, V.M.; Semenyuk, O.V.; Benediktova, A.I. The Dynamics of the Morphology and Chemical Properties of Forest Litter during Natural Postagrogenic Reforestation and Its Effect on the Ground Cover. Mosc. Univ. Soil Sci. Bull. 2020, 75, 101–108. [Google Scholar] [CrossRef]
  16. Pang, Y.; Tian, J.; Lv, X.; Wang, R.; Wang, D.; Zhang, F. Contrasting Dynamics and Factor Controls in Leaf Compared with Different-Diameter Fine Root Litter Decomposition in Secondary Forests in the Qinling Mountains after 5 Years of Whole-Tree Harvesting. Sci. Total Environ. 2022, 838, 156194. [Google Scholar] [CrossRef] [PubMed]
  17. Shen, G.; Chen, D.; Wu, Y.; Liu, L.; Liu, C. Spatial Patterns and Estimates of Global Forest Litterfall. Ecosphere 2019, 10, e02587. [Google Scholar] [CrossRef]
  18. Seidel, F.; Lopez, C.M.L.; Bonifacio, E.; Kurokawa, H.; Yamanaka, T.; Celi, L. Seasonal Phosphorus and Nitrogen Cycling in Four Japanese Cool-Temperate Forest Species. Plant Soil 2022, 472, 391–406. [Google Scholar] [CrossRef]
  19. Song, Y.; Yu, Y.; Li, Y.; Du, M. Leaf Litter Chemistry and Its Effects on Soil Microorganisms in Different Ages of Zanthoxylum Planispinum Var. Dintanensis. BMC Plant Biol. 2023, 23, 262. [Google Scholar] [CrossRef]
  20. Zhang, D.; Man, X.; Liu, S.; Xu, Z. Litter Decomposition and Nutrient Release of Typical Forest Communities in Non-Growing Season in Cold Temperate Zone. Beijing Linye Daxue Xuebao/J. Beijing For. Univ. 2022, 44, 65–74. [Google Scholar] [CrossRef]
  21. De Marco, A.; Vittozzi, P.; Virzo De Santo, A. Elements Dynamics, from Leaf to Stable Leaf Litter Residue and Soil, for Two Functional Types of Tree Planted on Volcanic Deposits. Plant Soil 2023, 482, 127–140. [Google Scholar] [CrossRef]
  22. Gawęda, T.; Małek, S.; Błońska, E.; Jagodziński, A.M.; Bijak, S.; Zasada, M. Macro-and Micronutrient Contents in Soils of a Chronosequence of Naturally Regenerated Birch Stands on Abandoned Agricultural Lands in Central Poland. Forests 2021, 12, 956. [Google Scholar] [CrossRef]
  23. Dong, X.; Gao, P.; Zhou, R.; Li, C.; Dun, X.; Niu, X. Changing Characteristics and Influencing Factors of the Soil Microbial Community during Litter Decomposition in a Mixed Quercus acutissima Carruth. and Robinia pseudoacacia L. Forest in Northern China. Catena 2021, 196, 104811. [Google Scholar] [CrossRef]
  24. Zhang, Y.; Zhang, X.; Bi, Z.; Yu, Y.; Shi, P.; Ren, L.; Shan, Z. The Impact of Land Use Changes and Erosion Process on Heavy Metal Distribution in the Hilly Area of the Loess Plateau, China. Sci. Total Environ. 2020, 718, 137305. [Google Scholar] [CrossRef]
  25. Shopina, O.V.; Geraskina, A.P.; Kuznetsova, A.I.; Tikhonova, E.V.; Titovets, A.V.; Bavshin, I.M.; Khokhryakov, V.R.; Semenkov, I.N. Stages of Restoration of the Components of Postagrogenic Pine Forest Ecosystems in the Smolenskoye Poozerye National Park. Eurasian Soil Sci. 2023, 56, 16–28. [Google Scholar] [CrossRef]
  26. Deptula, M.; Nienartowicz, A.; Iwicka, M.; Filbrandt-Czaja, A. Biomass of Scots Pine-Silver Birch Tree Stand 25 Years after Afforestation of Former Agricultural Land. Ecol. Quest. 2017, 25, 51–66. [Google Scholar] [CrossRef]
  27. Nave, L.E.; DeLyser, K.; Domke, G.M.; Holub, S.M.; Janowiak, M.K.; Keller, A.B.; Peters, M.P.; Solarik, K.A.; Walters, B.F.; Swanston, C.W. Land Use Change and Forest Management Effects on Soil Carbon Stocks in the Northeast U.S. Carbon Balance Manag. 2024, 19, 5. [Google Scholar] [CrossRef]
  28. Ershov, D.V.; Gavrilyuk, E.A.; Koroleva, N.V.; Belova, E.I.; Tikhonova, E.V.; Shopina, O.V.; Titovets, A.V.; Tikhonov, G.N. Natural Afforestation on Abandoned Agricultural Lands during Post-Soviet Period: A Comparative Landsat Data Analysis of Bordering Regions in Russia and Belarus. Remote Sens. 2022, 14, 322. [Google Scholar] [CrossRef]
  29. Lednev, A.V.; Dmitriev, A.V. Recent Soil-Forming Processes in Postagrogenic Soddy-Podzolic Soils of the Udmurt Republic. Eurasian Soil Sci. 2021, 54, 1119–1129. [Google Scholar] [CrossRef]
  30. Zhou, J.; Sun, T.; Shi, L.; Kurganova, I.; Lopes de Gerenyu, V.; Kalinina, O.; Giani, L.; Kuzyakov, Y. Organic Carbon Accumulation and Microbial Activities in Arable Soils after Abandonment: A Chronosequence Study. Geoderma 2023, 435, 116496. [Google Scholar] [CrossRef]
  31. Koné, A.W.; Edoukou, E.F.; Orendo-Smith, R.; Tondoh, J.E. Earthworms in Chromolaena odorata (L.) King and Robinson (Asteraceae) Fallows along a Chronosequence: Changes in Community Structure and Identification of Persistent and Indicator Species. Pedobiologia 2012, 55, 193–201. [Google Scholar] [CrossRef]
  32. Terekhova, D.A.; Smirnova, M.A.; Geraskina, A.P.; Shopina, O.V.; Kuznetsova, A.I.; Bavshin, I.M.; Klink, G.V.; Enchilik, P.R.; Khokhryakov, V.R.; Gerasimova, M.I.; et al. Macrofauna and Organic Matter in Postagrogenic Sandy Soils in the Northwest of Smolensk Oblast (Russia). Eurasian Soil Sci. 2023, 56, 1139–1151. [Google Scholar] [CrossRef]
  33. Paul, K.I.; Polglase, P.J.; Nyakuengama, J.G.; Khanna, P.K. Change in Soil Carbon Following Afforestation. For. Ecol. Manag. 2002, 168, 241–257. [Google Scholar] [CrossRef]
  34. Jandl, R.; Lindner, M.; Vesterdal, L.; Bauwens, B.; Baritz, R.; Hagedorn, F.; Johnson, D.W.; Minkkinen, K.; Byrne, K.A. How Strongly Can Forest Management Influence Soil Carbon Sequestration? Geoderma 2007, 137, 253–268. [Google Scholar] [CrossRef]
  35. Macdonald, G.K.; Bennett, E.M.; Taranu, Z.E. The Influence of Time, Soil Characteristics, and Land-Use History on Soil Phosphorus Legacies: A Global Meta-Analysis. Glob. Change Biol. 2012, 18, 1904–1917. [Google Scholar] [CrossRef]
  36. Laganière, J.; Angers, D.A.; Paré, D. Carbon Accumulation in Agricultural Soils after Afforestation: A Meta-Analysis. Glob. Change Biol. 2010, 16, 439–453. [Google Scholar] [CrossRef]
  37. Uri, V.; Aosaar, J.; Varik, M.; Becker, H.; Ligi, K.; Padari, A.; Kanal, A.; Lõhmus, K. The Dynamics of Biomass Production, Carbon and Nitrogen Accumulation in Grey Alder (Alnus Incana (L.) Moench) Chronosequence Stands in Estonia. For. Ecol. Manag. 2014, 327, 106–117. [Google Scholar] [CrossRef]
  38. Cukor, J.; Vacek, Z.; Linda, R.; Bílek, L. Carbon Sequestration in Soil Following Afforestation of Former Agricultural Land in the Czech Republic. Cent. Eur. For. J. 2017, 63, 97–104. [Google Scholar] [CrossRef]
  39. Hong, S.; Gan, P.; Chen, A. Environmental Controls on Soil PH in Planted Forest and Its Response to Nitrogen Deposition. Environ. Res. 2019, 172, 159–165. [Google Scholar] [CrossRef]
  40. Fang, W.; Wei, Y.; Liu, J. Comparative Characterization of Sewage Sludge Compost and Soil: Heavy Metal Leaching Characteristics. J. Hazard. Mater. 2016, 310, 1–10. [Google Scholar] [CrossRef] [PubMed]
  41. Król, A.; Mizerna, K.; Bożym, M. An Assessment of PH-Dependent Release and Mobility of Heavy Metals from Metallurgical Slag. J. Hazard. Mater. 2020, 384, 121502. [Google Scholar] [CrossRef]
  42. Kwiatkowska-Malina, J. Functions of Organic Matter in Polluted Soils: The Effect of Organic Amendments on Phytoavailability of Heavy Metals. Appl. Soil Ecol. 2018, 123, 542–545. [Google Scholar] [CrossRef]
  43. Cakmakci, T.; Sahin, U. Productivity and Heavy Metal Pollution Management in a Silage Maize Field with Reduced Recycled Wastewater Applications with Different Irrigation Methods. J. Environ. Manag. 2021, 291, 112602. [Google Scholar] [CrossRef]
  44. Chen, H.; Shao, M.; Li, Y. Soil Desiccation in the Loess Plateau of China. Geoderma 2008, 143, 91–100. [Google Scholar] [CrossRef]
  45. De Schrijver, A.; Vesterdal, L.; Hansen, K.; De Frenne, P.; Augusto, L.; Achat, D.L.; Staelens, J.; Baeten, L.; De Keersmaeker, L.; De Neve, S.; et al. Four Decades of Post-Agricultural Forest Development Have Caused Major Redistributions of Soil Phosphorus Fractions. Oecologia 2012, 169, 221–234. [Google Scholar] [CrossRef] [PubMed]
  46. Nizamutdinov, T.; Yang, S.; Abakumov, E. Post-Agricultural Shifts in Soils of Subarctic Environment on the Example of Plaggic Podzols Chronosequence. Agronomy 2025, 15, 584. [Google Scholar] [CrossRef]
  47. Nikodemus, O.; Kaupe, D.; Kukuļs, I.; Brūmelis, G.; Kasparinskis, R.; Dauškane, I.; Treimane, A. Effects of Afforestation of Agricultural Land with Grey Alder (Alnus incana (L.) Moench) on Soil Chemical Properties, Comparing Two Contrasting Soil Groups. For. Ecosyst. 2020, 7, 38. [Google Scholar] [CrossRef]
  48. Lutter, R.; Tullus, A.; Vares, A.; Sopp, R.; Tullus, T.; Kaivapalu, M.; Ots, K.; Kharel, B.; Lundmark, T.; Tullus, H. Twenty Years of Afforestation of Former Agricultural Lands with Silver Birch Plantations Affects Vertical Distribution of SOC and Macronutrients in the Topsoil Layer. Plant Soil 2023, 482, 385–400. [Google Scholar] [CrossRef]
  49. Telesnina, V.M.; Vaganov, I.E.; Karlsen, A.A.; Ivanova, A.E.; Zhukov, M.A.; Lebedev, S.M. Specific Features of the Morphology and Chemical Properties of Coarse-Textured Postagrogenic Soils of the Southern Taiga, Kostroma Oblast. Eurasian Soil Sci. 2016, 49, 102–115. [Google Scholar] [CrossRef]
  50. Holland, J.; Conyers, M.; Orchard, B.; Poile, G. Soil Potassium Relationships, Uptake Efficiency and Availability for Six Distinctive Soils in Central and Southern New South Wales, Australia. Soil Res. 2014, 52, 129–139. [Google Scholar] [CrossRef]
  51. Hosseini, M.; Rajabi Agereh, S.; Khaledian, Y.; Jafarzadeh Zoghalchali, H.; Brevik, E.C.; Movahedi Naeini, S.A.R. Comparison of Multiple Statistical Techniques to Predict Soil Phosphorus. Appl. Soil Ecol. 2017, 114, 123–131. [Google Scholar] [CrossRef]
  52. Koroleva, N.V.; Tikhonova, E.V.; Ershov, D.V.; Saltykov, A.N.; Gavrilyuk, E.A.; Pugachevskii, A.V. 25 Years of Reforestation on Non-Forest Lands in Smolenskoye Poozerye National Park Assessed from Landsat. Russ. J. For. Sci. 2018, 2, 83–96. [Google Scholar] [CrossRef]
  53. Shopina, O.V.; Semenkov, I.N.; Paramonova, T.A. The Accumulation of Heavy Metals and 137Cs in Plant Products Grown on Radioactively Contaminated Chernozems of Tula Oblast. Ecol. Ind. Russ. 2020, 24, 48–53. [Google Scholar] [CrossRef]
  54. Kochergin, A.S. Ecological-Geographic Basics of Organisation and Management of National Park Area (by Example of Smolensk Lakeland National Park); Moscow Oblast State University: Moscow, Russia, 2002. [Google Scholar]
  55. Koptsik, G.; Berezina, N. Vegetation and Soils of National Park “Smolenskoye Poozer’ye”; Liss, O.L., Sokolova, T.A., Eds.; NIA-Priroda: Moskva, Russia, 2003; ISBN 5784400959. [Google Scholar]
  56. Shopina, O.V.; Gerasimova, M.I.; Bavshin, I.M.; Khokhryakov, V.R.; Semenkov, I.N. Soil Inventory and Mapping in the “Smolenskoye Poozerye” National Park. Russ. J. For. Sci. 2022, 4, 478–493. [Google Scholar] [CrossRef]
  57. Peel, M.C.; Finlayson, B.L.; McMahon, T.A. Updated World Map of the Köppen-Geiger Climate Classification. Hydrol. Earth Syst. Sci. 2007, 11, 1633–1644. [Google Scholar] [CrossRef]
  58. Khokhryakov, V.R. Annals of Nature and Monitoring of the State and Methods of Conservation of Natural Complexes of the National Park; FSBI “Smolensk Lakeland National Park”: Przhevalskoye, Russia, 2016. [Google Scholar]
  59. Titovets, A.V.; Reshetnikova, N.M. Data on Flora Dynamics of the National Park “Smolenskoe Poozer’e”. Her. Tver State Univ. Ser. Biol. Ecol. 2022, 1, 164–179. [Google Scholar] [CrossRef]
  60. IUSS Working Group WRB. World Reference Base for Soil Resources. International Soil Classification System for Naming Soils and Creating Legends for Soil Maps, 4th ed.; International Union of Soil Sciences: Vienna, Austria, 2022. [Google Scholar]
  61. Zanella, A.; Ascher-Jenull, J.; Ponge, J.-F.; Bolzonella, C.; Banas, D.; De Nobili, M.; Fusaro, S.; Sella, L.; Giannini, R. Humusica: Soil Biodiversity and Global Change. Bull. Geogr. Phys. Geogr. Ser. 2018, 14, 15–36. [Google Scholar] [CrossRef]
  62. Pickett, S.T.A. Space-for-Time Substitution as an Alternative to Long-Term Studies. In Long-Term Studies in Ecology; Likens, G.E., Ed.; Springer: New York, NY, USA, 1989; pp. 110–135. [Google Scholar]
  63. Krechetov, P.P.; Dianova, T.M. Soil Chemistry. Analytical Methods of Research; Lomonosov MSU the Faculty of Geography: Moscow, Russia, 2009; ISBN 978-5-89575-168-8. [Google Scholar]
  64. FAO Standard Operating Procedure for Soil PH Determination. Glob Soil Partnersh; FAO: Rome, Italy, 2021; p. 23. [Google Scholar]
  65. Ruttenberg, K.C. Development of a Sequential Extraction Method for Different Forms of Phosphorus in Marine Sediments. Limnol. Oceanogr. 1992, 37, 1460–1482. [Google Scholar] [CrossRef]
  66. Mehlich, A. Determination of P, Ca, Mg, K, Na, and NH4. N. C. Soil Test Div. 1953, 16, 23–89. [Google Scholar]
  67. Bray, R.H.; Kurtz, L.T. Determination of Total, Organic, and Available Form of Phosphorusin Soils. Soil Sci. Soc. Am. J. 1945, 59, 39–45. [Google Scholar] [CrossRef]
  68. Watanabe, F.S.; Olsen, S.R. Test of an Ascorbic Acid Method for Determining Phospho-Rus in Water and NaHCO3 Extracts from Soil. Soil Sci. Soc. Am. Proc. 1965, 29, 677–678. [Google Scholar] [CrossRef]
  69. Pansu, M.; Gautheyrou, J. Handbook of Soil Analysis: Mineralogical, Organic and Inorganic Methods; Springer Science & Business Media: Berlin, Germany, 2006; ISBN 3540312102. [Google Scholar]
  70. SS 54650-2011 Soils; Determination of Mobile Phosphorus and Potassium Compounds by Kirsanov Method Modified by CINAO. Runorm: Moscow, Russia, 2011.
  71. Kassambara, A. Package ‘Ggpubr’. CRAN-R Packag. 2023. Available online: https://CRAN.R-project.org/package=ggpubr (accessed on 5 March 2025).
  72. Wickham, H.; François, R.; Henry, L.; Müller, K. Dplyr: A Grammar of Data Manipulation. R Package Version. Open Access Libr. J. 2020, 7. Available online: https://cran.r-project.org/web/packages/dplyr/index.html (accessed on 5 March 2025).
  73. Wickham, H. Ggplot2—Positioning Elegant Graphics for Data Analysis; Springer: Berlin/Heidelberg, Germany, 2016; ISBN 978-0-387-98140-6. [Google Scholar]
  74. Kassambara, A.; Mundt, F. Factoextra: Extract and Visualize the Results of Multivariate Data Analyses. CRAN-R Packag. 2020. Available online: https://CRAN.R-project.org/package=factoextra (accessed on 5 March 2025).
  75. Burdukovskii, M.L.; Timofeeva, Y.O.; Golov, V.I.; Kiseleva, I.V.; Timoshinov, R.V. Dynamics of Soil Acidity, Structural–Aggregate State, and Carbon Stocks in Agro-Dark-Humus Podbels in the Postagrogenic Development. Eurasian Soil Sci. 2022, 55, 1733–1740. [Google Scholar] [CrossRef]
  76. Telesnina, V.M.; Bogatyrev, L.G.; Benediktova, A.I.; Zemskov, P.I.; Maslov, M.N. The Dynamics of Plant Debris Input and of Some Properties of Forest Litters during Postagrogenic Reforestation under the Conditions of Southern Taiga. Mosc. Univ. Soil Sci. Bull. 2019, 74, 139–145. [Google Scholar] [CrossRef]
  77. Weissgerber, M.; Chanteloup, L.; Bonis, A. Carbon Stock Increase during Post-Agricultural Succession in Central France: No Change of the Superficial Soil Stock and High Variability within Forest Stages. New For. 2024, 55, 1533–1555. [Google Scholar] [CrossRef]
  78. Hooker, T.D.; Compton, J.E. Forest Ecosystem Carbon and Nitrogen Accumulation during the First Century after Agricultural Abandonment. Ecol. Appl. 2003, 13, 299–313. [Google Scholar] [CrossRef]
  79. Spohn, M.; Berg, B. Import and Release of Nutrients during the First Five Years of Plant Litter Decomposition. Soil Biol. Biochem. 2023, 176, 108878. [Google Scholar] [CrossRef]
  80. Kasimov, N.S.; Lychagin, M.Y.; Chalov, S.R.; Shinkareva, G.L. Paragenetic Associations of Chemical Elements in Landscapes. Vestn. Mosk. Univ. Seriya 5 Geogr. 2019, 6, 20–28. [Google Scholar]
  81. Armolaitis, K.; Aleinikoviene, J.; Baniüniene, A.; Lubyte, J.; Zekaite, V. Carbon Sequestration and Nitrogen Status in Arenosols Following Afforestation or Following Abandonment of Arable Land. Balt. For. 2007, 13, 169–178. [Google Scholar]
  82. Matlack, G.R. Long-Term Changes in Soils of Second-Growth Forest Following Abandonment from Agriculture. J. Biogeogr. 2009, 36, 2066–2075. [Google Scholar] [CrossRef]
  83. Rodin, L.E.; Bazilevich, N.I. Dynamics of Organic Matter and Biological Cycle of Nutrients and Nitrogen within Main Types of World Vegetation; Nauka: Moskva, Russia, 1965. [Google Scholar]
  84. Kedir, A.J.; Nyiraneza, J.; Hawboldt, K.A.; McKenzie, D.B.; Unc, A. Phosphorus Sorption Capacity and Its Relationships With Soil Properties Under Podzolic Soils of Atlantic Canada. Front. Soil Sci. 2022, 2. [Google Scholar] [CrossRef]
  85. Ortiz, C.; Pierotti, S.; Molina, M.G.; Bosch-Serra, À.D. Soil Fertility and Phosphorus Leaching in Irrigated Calcareous Soils of the Mediterranean Region. Environ. Monit. Assess. 2023, 195, 1376. [Google Scholar] [CrossRef]
  86. Djodjic, F.; Bergström, L.; Schmieder, F.; Sandström, C.; Agback, P.; Hu, Y. Soils Potentially Vulnerable to Phosphorus Losses: Speciation of Inorganic and Organic Phosphorus and Estimation of Leaching Losses. Nutr. Cycl. Agroecosyst. 2023, 127, 225–245. [Google Scholar] [CrossRef]
  87. Shen, Y.; Yu, Y.; Lucas-Borja, M.E.; Chen, F.; Chen, Q.; Tang, Y. Change of Soil K, N and P Following Forest Restoration in Rock Outcrop Rich Karst Area. Catena 2020, 186, 104395. [Google Scholar] [CrossRef]
  88. Singh, K.; Gupta, S.; Singh, A.P. Review: Nutrient-Nutrient Interactions Governing Underground Plant Adaptation Strategies in a Heterogeneous Environment. Plant Sci. 2024, 342, 112024. [Google Scholar] [CrossRef]
  89. Hue, N. Soil Acidity: Development, Impacts, and Management. In Structure and Functions of Pedosphere; Springer: Berlin/Heidelberg, Germany, 2022; ISBN 9789811687709. [Google Scholar]
  90. McCrea, A.R.; Trueman, I.C.; Fullen, M.A. A Comparison of the Effects of Four Arable Crops on the Fertility Depletion of a Sandy Silt Loam Destined for Grassland Habitat Creation. Biol. Conserv. 2001, 97, 181–187. [Google Scholar] [CrossRef]
  91. Djodjic, F.; Börling, K.; Bergström, L. Phosphorus Leaching in Relation to Soil Type and Soil Phosphorus Content. J. Environ. Qual. 2004, 33, 678–684. [Google Scholar] [CrossRef] [PubMed]
  92. He, X.; Augusto, L.; Goll, D.S.; Ringeval, B.; Wang, Y.; Helfenstein, J.; Huang, Y.; Yu, K.; Wang, Z.; Yang, Y.; et al. Global Patterns and Drivers of Soil Total Phosphorus Concentration. Earth Syst. Sci. Data 2021, 13, 5831–5846. [Google Scholar] [CrossRef]
Figure 1. Topsoil horizons at different stages (0–6) of pine and spruce chronosequences studied in Smolensk Lakeland.
Forests 16 00845 g001
Figure 2. Soil proxies in soil depths of stages of spruce chronosequence studied in Smolensk Lakeland. Box, first and third quartiles; whiskers, minimum and maximum; square, median; letters indicate significant (Wilcoxon test, p < 0.05) differences.
Forests 16 00845 g002
Figure 3. Soil proxies in soil depths of stages of pine chronosequence studied in Smolensk Lakeland. Box, first and third quartiles; whiskers, minimum and maximum; square, median; letters indicate significant (Wilcoxon test, p < 0.05) differences.
Forests 16 00845 g003
Figure 4. Median available (a) K and (b) P content in the soils of the stages of pine and spruce chronosequences.
Forests 16 00845 g004
Figure 5. Distribution of 0–5 cm topsoil and subsoil layers of stages 0–6 of the chronosequences based on the concentration of available K and P in the space of two principal components. Factors with significant loadings are labelled.
Forests 16 00845 g005
Table 1. Soils and vegetation of reforestation stages studied at Smolensk Lakeland.
StageChronosequence
PineSpruce
VegetationSoilsVegetationSoils
0Agrocenoses and young fallows up to 2 years oldArenosolsAgrocenoses and young fallows up to 2 years oldArenosols
1Fallows with short-grass meadow communitiesArenosolsFallows with tall-grass meadow communitiesArenosols
2Stands of 10–25 years are formed by pine with an admixture of birchArenosolsStands of 20–25 years are formed by birch and spruce Arenosols
3Middle-aged (30–70) pine forestsArenosolsMiddle-aged (30–70) birch-spruce forestsArenosols and Albic Podzols
4Middle-aged (70–80) pine forests with a small admixture of birchEntic PodzolsMiddle-aged (65–80) birch-spruce forestsArenosols and Albic Podzols
5Old-aged (80–120 years) pine forestsArenosols and Entic PodzolsOld-aged (80–120 years) birch-spruce forestsArenosols
6Old-aged (90–120 years) pine forestsAlbic Podzols and Entic PodzolsOld-aged (100–130 years) spruce forestsAlbic Podzols
Table 2. Destructive litter (Oi) stock on different stages of pine and spruce chronosequences, t/ha.
Stage *Chronosequence
PineSpruce
00.2–0.50.1–0.6
11.1–6.71.4–7.0
23.6–7.22.6–10.5
3-1.0–2.3
43.7–12.02.7–7.0
53.4–10.42.1–9.0
63.5–15.31.0–7.9
* Notes: Succession stages: 0—agrocenoses and young fallows up to 2 years old; 1—fallows with short-grass meadow communities; 2–4—pine/spruce forest with an admixture of birch; 5–6—pine/spruce forest.
Table 3. Spearman correlation ranks between available K and P content and various factors.
Factor0–5 cm (n = 46)10–15 cm (n = 58)30–40 cm (n = 50)Subsoil (n = 70)
KPKPKPKP
Input with litter0.520.550.580.090.39−0.050.49−0.19
pH0.470.770.720.560.370.410.370.25
TOC0.37−0.380.25−0.34−0.20−0.41−0.10−0.07
Sand−0.260.12−0.310−0.220.06−0.420.23
Silt0.15−0.050.35−0.110.09−0.170.41−0.20
Clay−0.120.05−0.060.090.060.190.50−0.27
Time passed since last ploughing−0.53−0.82−0.77−0.34−0.66−0.23−0.43−0.19
Note. Significant (p < 0.05) correlation ranks are in bold; n, number of samples.
Disclaimer/Publisher’s Note: The statements, opinions and data contained in all publications are solely those of the individual author(s) and contributor(s) and not of MDPI and/or the editor(s). MDPI and/or the editor(s) disclaim responsibility for any injury to people or property resulting from any ideas, methods, instructions or products referred to in the content.

