Article

Utilizing LightGBM to Explore the Characterization of PM2.5 Emission Patterns from Broadleaf Tree Combustion in Northeastern China

1
College of Forestry, Northeast Forestry University, Harbin 150040, China
2
School of Water Conservancy and Civil Engineering, Heilongjiang Agricultural Engineering Vocational College, Harbin 150025, China
3
Heilongjiang Provincial Institute of Natural Resource Rights and Interests Investigation and Monitoring, Harbin 150080, China
*
Author to whom correspondence should be addressed.
Forests 2025, 16(5), 836; https://doi.org/10.3390/f16050836
Submission received: 25 March 2025 / Revised: 11 May 2025 / Accepted: 16 May 2025 / Published: 18 May 2025
(This article belongs to the Section Forest Ecology and Management)

Abstract

:
PM2.5 emissions significantly impact atmospheric environments and human health in the context of forest fires. However, research on PM2.5 emissions from forest fires remains insufficient. This study systematically investigated PM2.5 emission characteristics from broadleaf tree combustion through controlled experiments examining three key factors: species variation (Acer tegmentosum [AT], Acer ukurunduense [AU], Acer pictum [AP], Tilia amurensis [TA], Phellodendron amurense [PA], Ulmus davidiana [UD], Ulmus laciniata [UL], Prunus padus [PP], Prunus maackii [PM]), moisture content (0%–20%), and phenological stages (budding [A], growing [B], defoliation [C]). The results demonstrated: (1) Significant interspecies differences, with UL showing the lowest, and PM the highest emissions; (2) A unimodal moisture—emission relationship peaking at 15% moisture content across most species, while AT, UL and PM exhibited unique linear responses; (3) Distinct phenological patterns, including triphasic fluctuations during the growing and defoliation phases. The LightGBM model effectively predicted emissions (R2 = 0.97), identifying species (36.2% importance) and moisture content (21.6%) as dominant factors. These findings provide critical data for wildfire emission modeling and highlight the need for species-specific parameters in air quality forecasts.

1. Introduction

1.1. Background

As China experiences swift economic and social advancement, ecological and environmental challenges are increasingly coming to the fore. Among these, atmospheric pollution has emerged as a significant factor that impacts public health and hampers the sustainable development of the society. PM2.5 refers to fine particulate matter in the atmosphere with a diameter of 2.5 μm [1], has become a key indicator of atmospheric pollution control due to its strong adsorptive properties, long-distance transport capacity, and far-reaching health impacts. Forest resources play a vital role in sustaining the global environment and supporting human society. Beyond enhancing the quality of the atmospheric environment, forests assume a pivotal role in the global carbon cycle, soil characteristics, and climate modulation. In recent years, the aggravation of global warming along with extreme drought conditions [2], has led to an upward trend in fires. The increase in fires, in turn, aggravates global warming [3]. Fire ranks among the most significant disturbances within global plant ecosystems [4]. Forest fires require three elements to occur: forest fuels, an accelerant (oxygen), and a certain temperature, with fuels being the only human-controllable factor [5]. The burning of any vegetated land, including farmland, grasslands, and forests-is termed open biomass burning (OBB) [6]. OBB produces pollutants that contribute to warming by converting incident solar radiation into heat. Forest fires include above-ground fires, which are surface fires and crown fires, where the primary fuel is trees, shrubs, and herbaceous plants above the surface, and below-ground fires, where the primary fuel is humus or peat [7].

1.2. Related Work

Over the recent past, numerous scholars have conducted research on forest fires as a calamitous event, influenced by a confluence of natural and human-induced factors. Certain studies have employed remote sensing data to evaluate fire patterns, encompassing intensity, seasonality, frequency, and fire return intervals [8]. Some have analyzed the frequency of wildfires and areas burned, as well as climatic patterns [9] and atmospheric conditions [10]. Studies have been conducted to examine the dynamics within indigenous forests [11]. Others have analyzed the impacts of wildfires on Mediterranean-type ecosystems, focusing on soil respiration and the composition of bacterial microbiota [12]. A recent study utilized advanced machine learning techniques—specifically, logistic regression, random forest, support vector machine (SVM), and XGBoost algorithms—to predict vegetation fire occurrences [13], and utilized neural networks for the prediction of forest fires [14]. Since plant flammability directly affects fire severity (as demonstrated in [15]), its assessment is critical for forest management. Another study analyzed the impact of forest fires on terrestrial chemical elements, analyzed the effects of forest fires on ground chemical elements [16]. A further study analyzed the dynamic changes in fuel flammability after trees were treated with different intensities [5]. Moreover, a research endeavor employed machine learning algorithms in conjunction with geospatial techniques to evaluate the post-fire recovery of vegetation within forest ecosystems [17]. The substantial PM2.5 emissions from forest fires during combustion have drawn significant research attention. Some studies have analyzed the influencing factors of PM2.5 emissions [18]. Several studies have investigated the correlation between chronic PM2.5 exposure and its adverse health outcomes, including mortality risk [19,20]. There have been predictions of the daily PM2.5 levels in Australia utilizing the Random Forest Model [21]. Other researchers have applied Response Surface Methodology (RSM) to quantitatively demonstrate the significant interactive effects of moisture content and fuel load on PM2.5 emission levels. PM2.5 emissions occur during combustion processes [22]. Forest fires release large amounts of smoke into the atmosphere, accounting for 42% of particulate emissions from biomass burning. Biomass burning emissions are predominantly composed of particulate matter, with PM2.5 constituting over 90% of the total particulate emissions [23]. High concentrations of PM2.5 affect people of different ages in different degrees and in different ways [24], PM2.5 exposure not only causes immediate respiratory effects but also induces chronic cardiorespiratory impairment and hepatic damage [25,26,27,28].
While prior research has demonstrated the relationship between forest fires and vegetation flammability, along with forecasting PM2.5 emission dynamics and associated drivers, it frequently neglects the temporal variations in intrinsic tree characteristics as contributing factors.

1.3. Research Gap

At present, domestic and international studies on PM2.5 emission from forest fires mainly focus on coniferous species [29,30], and relatively few studies on broadleaf trees. Therefore, exploring the regular characteristics of PM2.5 emission from broadleaf tree combustion can help to enrich and improve the research system in the field of forest fire and air pollution. Understanding the characteristics of PM2.5 emission from broadleaf trees can help governmental departments to formulate targeted forest fire prevention and control policies and air pollution prevention measures, and to reduce the impacts of fires on the environment and human health. The study of the pattern of PM2.5 emission from the burning of broad-leaved trees can provide theoretical support for the protection and restoration of forest ecosystems and help realize the sustainable use of forest resources.
As an indispensable component of forest ecosystems, broad-leaved trees are widely distributed and diverse, are instrumental in sustaining ecological equilibrium and offering ecological services. However, due to climate change, anthropogenic activities, and other factors, forest fires occur frequently [31], and the problem of PM2.5 emission from the burning of broadleaf trees has become increasingly serious. The current understanding of PM2.5 emissions from the combustion of broadleaf trees is insufficiently developed, thereby constraining our comprehension of the extent to which forest fires contribute to air pollution. This limitation also impacts the formulation and execution of pertinent preventative and control strategies. In this study, we conduct an analysis and process the data using laboratory data and the lightGBM (Light Gradient Boosting Machine) algorithm to derive pertinent conclusions.

1.4. Purpose

The purpose of this paper is to explore the regular characteristics of PM2.5 emission from the combustion of broadleaf trees, and the main research includes: analyzing the combustion characteristics of different broadleaf trees and exploring their effects on PM2.5 emission; through laboratory simulation combustion tests, studying the effects of moisture content, fuel load, tree parts, period and other factors on PM2.5 emission from the combustion of broadleaf trees; combining with the lightGBM to carry out data analysis and prediction modeling were carried out to explore the effects of different characteristics on the regularity of PM2.5 emission from broadleaf tree combustion and its correlations.
LightGBM, an algorithm grounded in Gradient Boosting Decision Tree (GBDT) methodology, exhibits superior training speed and diminished memory utilization [32]. Additionally, it demonstrates commendable accuracy, rendering it particularly apt for tasks entailing extensive datasets and high precision requirements [33,34]. Its application extends to the realms of forest fire analysis and prediction [35,36]. There are studies on forest fire susceptibility modeling based on the LightGBM method to generate accurate fire susceptibility maps [37]; the prediction of forest fire occurrence probability and the zoning of high-risk forest fire areas [38]; there are studies on the incorporation of spatial effects and temporal features into the LightGBM model to estimate the ground—level particulate matter [39]; and there is a study that, after comparing several models [40] show that concluded that the LightGBM model is the best single model for predicting PM2.5 using historical PM2.5 concentration data [41].
This study employed a methodology that integrated field sampling, laboratory-based simulated combustion experiments, and LightGBM data analysis to investigate the patterns and characteristics of PM2.5 emissions resulting from the combustion of broadleaf trees. The specific technical methodologies are as follows: compile pertinent research results at home and abroad, and sort out the prevailing research status of PM2.5 emissions from broadleaf tree combustion; select exemplary broadleaf tree species and scrutinize their combustion characteristics; design laboratory simulated combustion experiments to monitor PM2.5 emissions from broadleaf tree combustion across various conditions; and employ lightGBM to analyze meteorological data, thereby investigating the influence of distinct characteristics on PM2.5 emissions from broadleaf tree combustion. This paper aims to elucidate the regular characteristics of PM2.5 emission from broadleaf trees, and provide the following theoretical support for forest fire prevention and control and air pollution prevention and control in China. It seeks to clarify the potential of PM2.5 emission from the combustion of different broadleaf trees, thereby establishing a foundation for the selection and strategic deployment of tree species. Furthermore, the study proposes specific measures for forest fire prevention to mitigate the risk of PM2.5 pollution. Additionally, it aims to provide a scientific foundation for the governmental entities in formulating policies for the prevention and control of air pollution. The research will offer a scholarly basis for the governmental departments to develop air pollution control policies.

2. Materials and Methods

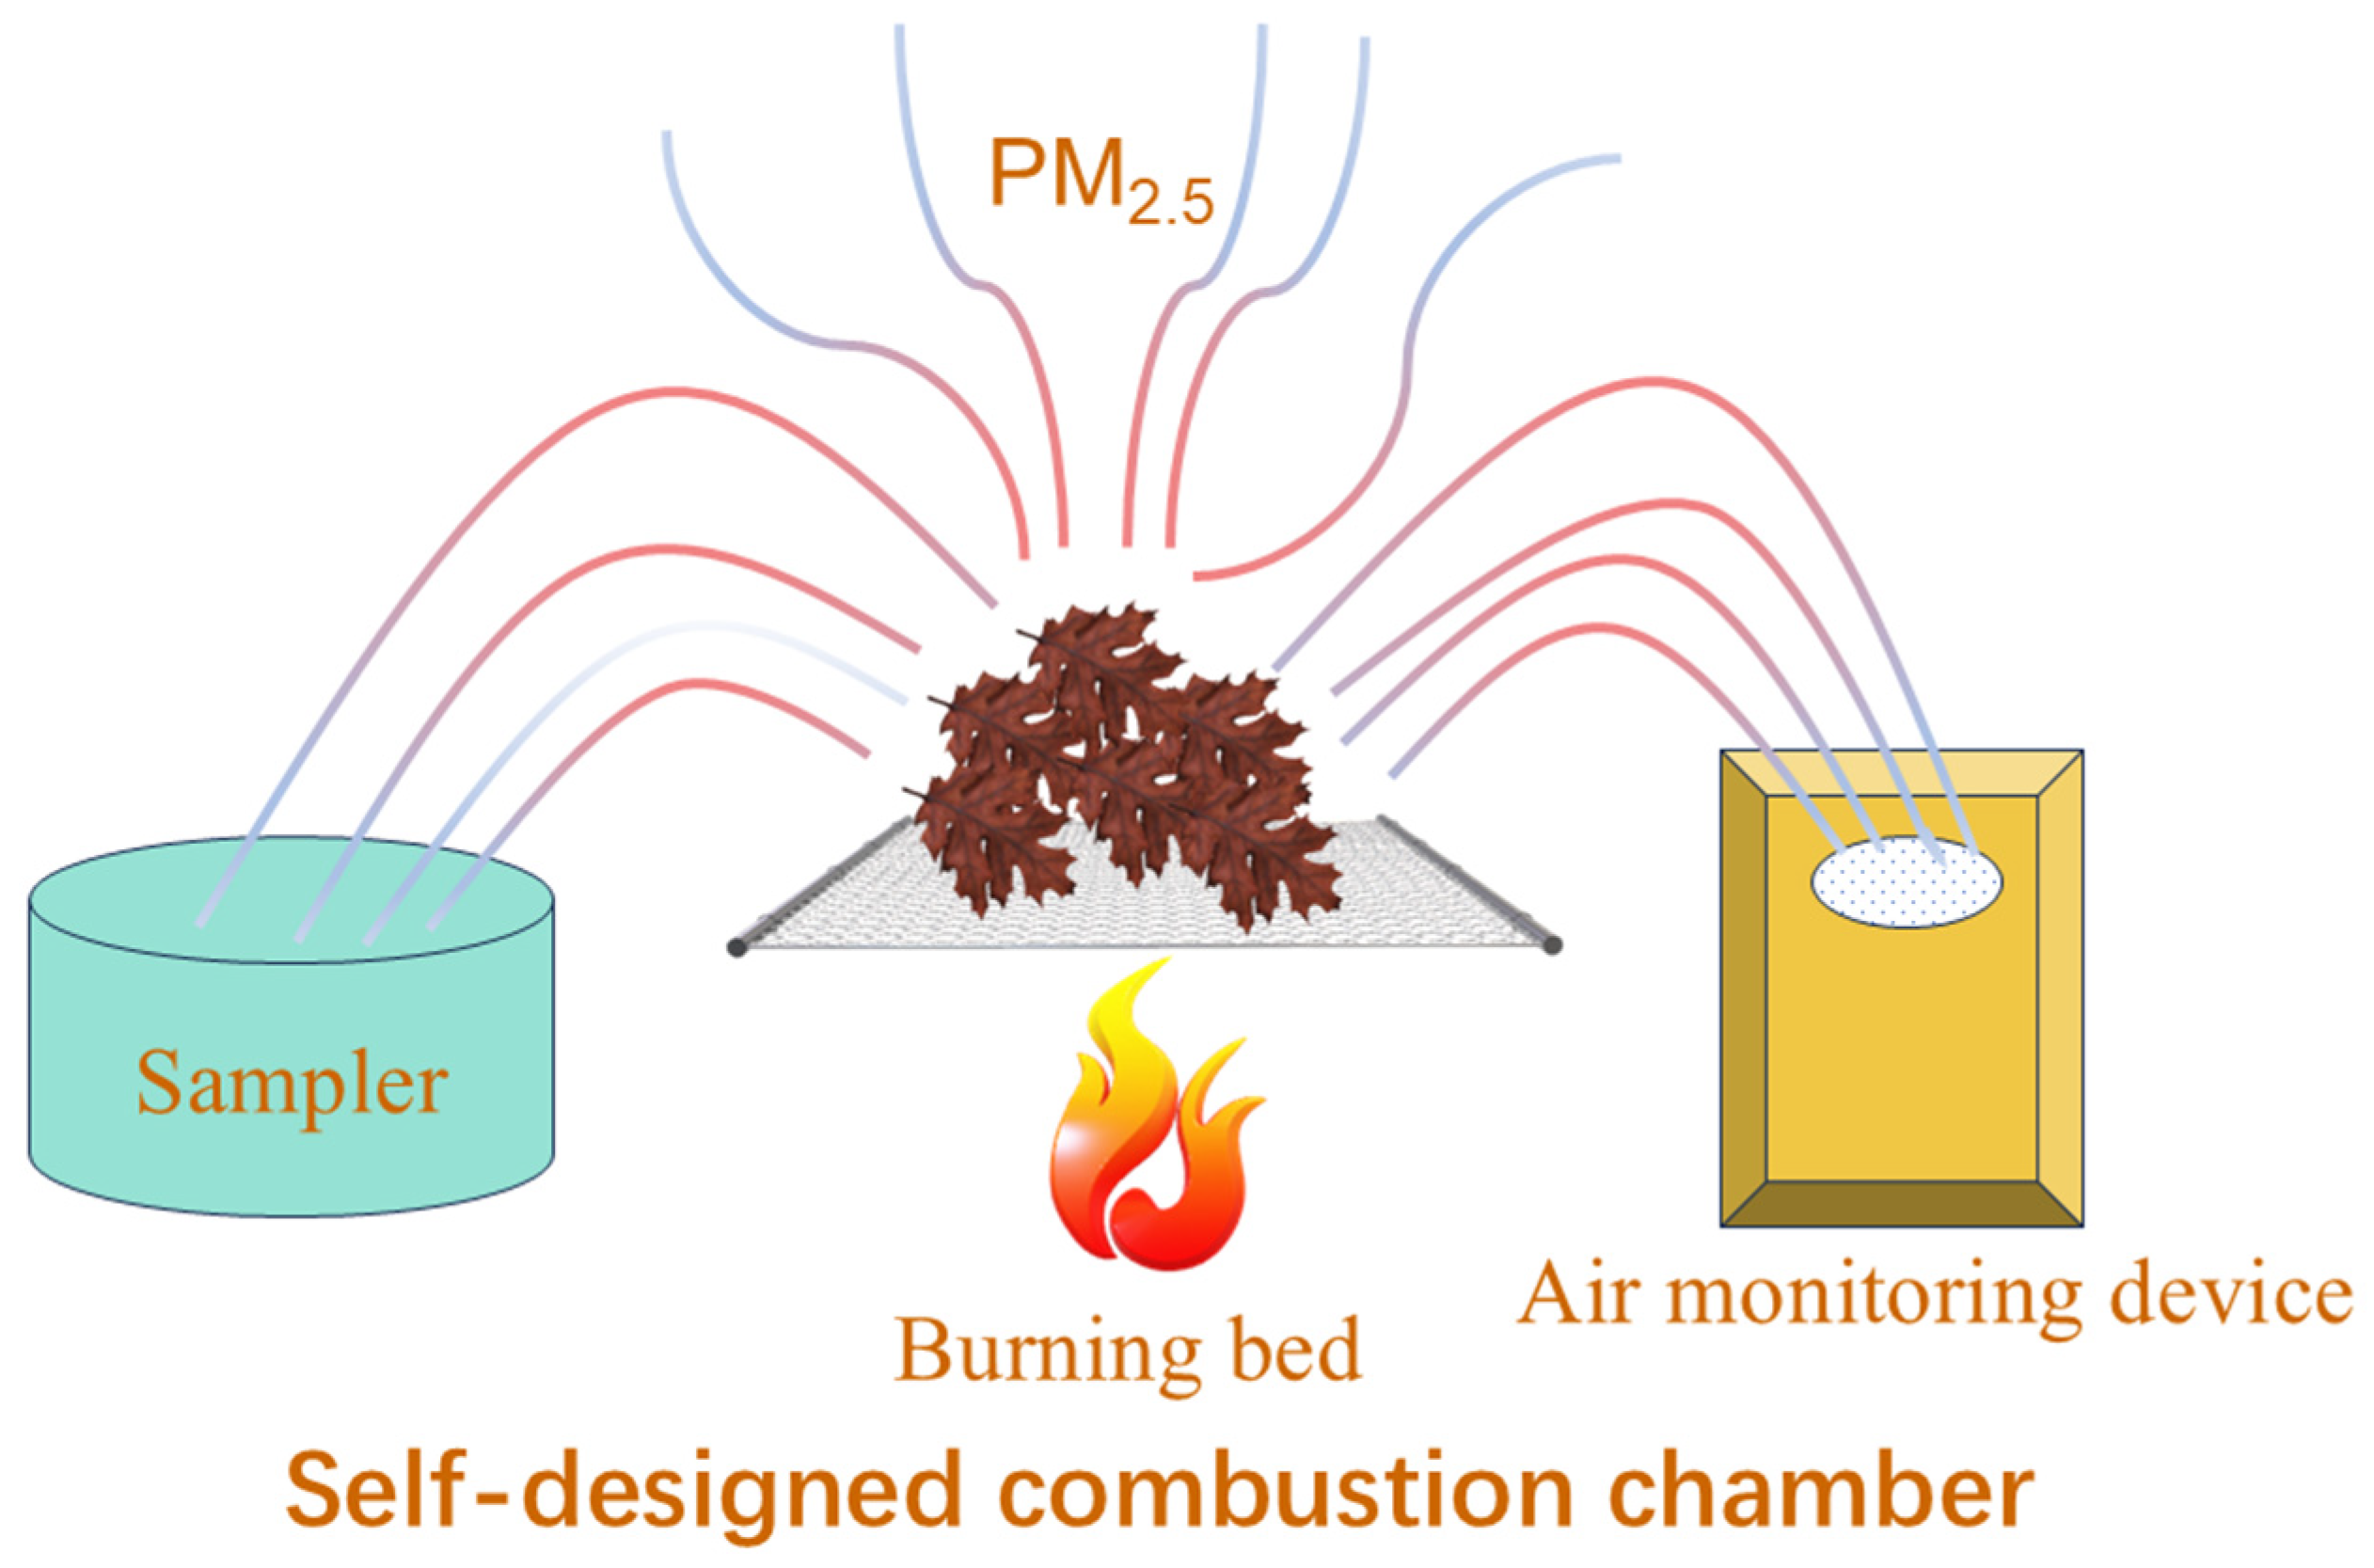
2.1. General Introduction to the Study

The study site of this paper is the Liangshui Experimental Forestry Farm (Liangshui National Nature Reserve) of Northeast Forestry University, which is located on the eastern slope of the Dali Dailing Branch, the southern section of the Xiaoxinganling Mountain Range in the eastern mountains of northeastern China, with a total area of 12,133 ha, and the geographic coordinates of longitude from 128°47′8″ to 128°57′19″, latitude between 47°6′49″ and 47°16′10″ (Figure 1). The zonal vegetation of Liangshui Experimental The forest is a temperate mixed coniferous and broad-leaved forest, in which Korean pine serves as the dominant tree species [42], which has greater typicality and representativeness. The species composition of the original Korean pine forest is dominated by Korean pine, accompanied by a variety of temperate broadleaf species, such as Tilia, Betula, Ulmus laciniata, etc., up to more than 20 species.
Liangshui Experimental Forestry Farm is located on the eastern edge of the Eurasian continent. Deeply influenced by the oceanic climate, it exhibits distinct characteristics of a temperate continental monsoon climate [43]. Due to its elevated latitude, the region experiences an annual mean temperature of −0.3 °C. The mean maximum temperature reaches 7.5 °C, while the mean minimum temperature dips to −6.6 °C. Annual precipitation amounts to 676 mm [44]. The climate is predominantly characterized by long, cold, and dry winters and short, wet, cool, and rainy summers.
The prevailing topographical pattern indicates elevated terrains in the northern, eastern, and western regions, with a decline towards the central and southwestern areas. These regions encompass portions of the core and experimental zones situated within a basin. The elevation spans from 280 m to 707.3 m, and the average elevation of the whole area is approximately 400 m, featuring relative height differences ranging from 80 to 300 m [45]. The area falls within the category of low hills, characterized by rounded hilltops and predominantly asymmetrical slopes. The average gradient lies between 10 to 15 degrees, while certain segments exhibit steep inclines exceeding 20 to 40 degrees.

2.2. Sample Collection and Preparation

We selected nine broadleaf tree species in the Liangshui National Nature Reserve as study materials, including Acer tegmentosum (AT), Acer ukurunduense (AU), Acer pictum (AP), Tilia amurensis (TA), Phellodendron amurense (PA), Ulmus davidiana (UD), Ulmus laciniata (UL), Prunus padus (PP), Prunus maackii (PM) (Table 1). All broadleaf tree species were carefully selected from mature individuals situated on slopes with the same aspect. During the budding period (early April), the growing period (late July), and the defoliation period (early October), samples were systematically collected from three distinct tree parts: branches, bark, and leaves. Initially, sampling was carried out on the slope situated to the south of Liangshui National Nature Reserve, where the slope gradient ranged from 20 to 23 degrees. To determine the maturity of the trees, we considered multiple essential factors, with the diameter at breast height (DBH), the vertical position of the lowest living branch, the dimension of bark thickness, and the amount of stem curvature being the main ones [46]. Upon confirming the species of the sampled trees, we proceeded to excise the branches using high pruning shears. Subsequently, we carefully separated the branches, bark, and leaves using scissors. Then, for each tree species, we combined the similar parts (branches with branches, bark with bark, and leaves with leaves) and discarded any damaged or unsuitable samples within each group. These samples were then promptly placed into airtight plastic bags to prevent dehydration and meticulously labeled with permanent markers. It is pertinent to note that during the budding period in April, only branches and bark were available for sampling, as the trees had not yet developed leaves.
Subsequently, the samples underwent laboratory drying, and the moisture content was determined. Utilizing a drying oven set at 105 °C, the samples were dehydrated until they reached a state of absolute dryness, after which they were portioned into plastic bags, duly labeled, and preserved in a cool environment for the subsequent calculation of their moisture content.
The moisture content of fuel is defined by Equation (1) [47]:
F M C = W F W D W F × 100 % ,
In the formula, FMC represents the moisture content of fuel, and WF and WD denote the fresh and dry weights (kg) of fuel.
During indoor simulated combustion experiments, PM2.5 concentrations were released and comparatively analyzed from various broadleaf species, including branches, bark, and leaves, at different times and moisture contents.
Following extensive experimentation during the preliminary phase, it was established that fuels exhibiting a moisture content exceeding 20% experience heightened difficulty in ignition and tend to undergo incomplete combustion [29]. We wanted to explore how different moisture contents affect PM2.5 emissions from fuel combustion. For this purpose, we set up five different moisture contents with 0%, 5%, 10%, 15% and 20%, for combustion experiments. Based on the known moisture content of the combustible material needed in the experiment, the amount of water to be added was calculated according to Equation (1). The water was quickly sprayed on the surface of the combustible material with a sprayer and the combustible material sealed in a plastic bag for 24 hs so that could completely absorb the water.

2.3. Determination of PM2.5 Compositions

The collected samples were first dried and weighed, followed by simulated combustion experiments carried out in a self-designed device (Figure 2). These experiments were conducted within the fume hood of the laboratory at Northeast Forestry University, utilizing an experimental setup primarily composed of a custom-built combustion bed, a particulate matter sampler and a PM2.5 concentration monitor.
The combustion experiments were designed to simulate smoke emissions from a fire occurring in a natural environment. Different combinations of fuel beds were laid according to the experimentally established fuel load gradient levels, and three trials were conducted for each bed type. The fuel beds were constructed using a 30 cm × 30 cm wire mesh to minimize heat loss during combustion. The experimental beds were leveled to maintain a strictly horizontal orientation. Initial experiments indicated that the smoke generated from the combustion of an excessively large fuel load was not fully absorbable. Consequently, three distinct fuel loads were established, weighing 1 g, 2 g, and 3 g respectively. Prior to each combustion experiment, the samples were meticulously weighed and uniformly distributed upon the combustion bed. The experiment employed an alcohol lamp as an ignition source to guarantee a uniform combustion state in each iteration. A total of 3240 combustion experiments were conducted. The experiments were designed to cover three periods, nine tree species, with each species having samples from three different tree parts. Additionally, the study considered five moisture contents, three fuel loads, and each experimental condition was replicated three times. The gravimetric method, as referenced in literature [48] was used to measure the concentration of PM2.5, which could be calculated from the mass difference of the filter membrane and the standard sampling volume. PM2.5 was collected using a JCH-6120 med a flow ambient particulate sampler manufactured by Qingdao Juchuang Company (Qingdao, China), with a sampling flow rate of 60–130 L/min. The atmospheric particulate matter collector functions by drawing a specific volume of air through a filter membrane of known mass at a steady flow rate. This process enables the suspended particles present in the air to be trapped and retained within the filter membrane. Determined from the increment of the filter membrane’s mass and the volume of traversed air, the mass concentration value of total suspended particles in the atmosphere provides crucial data for environmental studies. The duration for sampling was established at 20 min. The indoor PM2.5 concentration was continuously monitored using the GQ-058 PM2.5 air quality monitor, which is manufactured by Shenzhen Jishun An Technology Co., Ltd., located in Shenzhen, China. The basic operational principle of the PM2.5 concentration monitoring apparatus is based on the phenomenon of light scattering. This occurs when a beam of infrared light illuminates particles as they traverse the detection zone. The intensity of the scattering observed at an angle perpendicular to the light path correlates with the diameter of the particles. Through enumeration, it is possible to ascertain the real-time particle volume concentration. Subsequently, employing empirical conversion formulas and calibration techniques, a mass concentration that aligns with official units can be derived. At the end of each combustion experiment, when the indoor PM2.5 concentration reaches the same level, the collection of PM2.5 particles is terminated, and the sampling volume under standard conditions is then recorded.
PM2.5 was collected with a glass fiber filter membrane. Subsequently, the samples were transferred to a controlled-environment chamber kept at a steady temperature of 25 °C and a relative humidity of 50% for 24 h [49]. To measure the weight of the filter membranes, an electronic balance (Model: FA2004N, with an accuracy of 0.0001 g, Shanghai, China) was employed. At the conclusion of the experiment, the filter membranes with adsorbed PM2.5 particles were re-placed in a constant temperature and humidity chamber under identical conditions to eliminate any potential impact on the PM2.5 measurement results. Additionally, PM2.5 samples were collected from the combustion chamber under non-burned sample conditions to serve as a blank control.
The PM2.5 mass concentration is represented by Equation (2):
P = W 1 W 2 V × 1 0 6 ,
where P represents the PM2.5 mass concentration (µg·m−3); W1 represents the weight of the filter membrane prior to sampling, measured in grams (g), while W2 indicates the weight of the filter membrane after the sampling process, also in grams (g). The variable V denotes the standard volume, with the unit being cubic meters (m3).
In this study, pollutant emissions are quantified by means of emission factors (EFs) as specified in Equation (3). Emission factors are defined as the mass of a pollutant released per unit mass or unit energy of the fuel that is combusted. The EFs for PM2.5 for each combustion experiment were calculated using the following formula. The emission factor of PM2.5 can be expressed and calculated using Equation (3):
E F P M 2.5 = m P M 2.5 m b u r n e d = C P M 2.5 × V m b u r n e d ,
where E F P M 2.5 represents the emission factor for PM2.5, with the unit being micrograms per kilogram (µg.kg−1); m P M 2.5 is the mass of PM2.5 collected, which is calculated as C P M 2.5 × V; C P M 2.5 is the average concentration of PM2.5, measured in micrograms per cubic meter (µg.m−3); V is the standard volume, expressed in cubic meters (m3); and m b u r n e d denotes the mass of the fuel burned, and its unit is grams (g).

3. Results

3.1. Analysis of Total PM2.5 Emission from Combustible Combustion

In this paper, the total amount of PM2.5 emitted from the combustion of each tree part under different moisture content states of the fuel was compared. Figure 3 comprises five panels (A–E), each depicting the total PM2.5 emissions from different tree parts at varying moisture content levels tested in the experiments. The percentage values in the figures represent the proportional contribution of each component. From Figure 3, we can see Acer tegmentosum (AT), Acer ukurunduense (AU), Acer pictum (AP), Tilia amurensis (TA), Phellodendron amurense (PA), Ulmus davidiana (UD), Ulmus laciniata (UL), Prunus padus (PP), Prunus maackii (PM) of PM2.5 emission rules. Upon comprehensive examination, it was determined that there are considerable variations in the emission of PM2.5 resulting from the combustion of various broadleaf trees, as well as notable differences in PM2.5 emissions from distinct sections of the same species. The species with higher PM2.5 emission were Prunus maackii (PM), Acer ukurunduense (AU), Acer pictum (AP), Phellodendron amurense (PA); several other tree species released less PM2.5. The total amount of PM2.5 emission by each species was lowest at 0% moisture content, and the total amount of PM2.5 emission by each species was highest at 15% moisture content. At equivalent moisture levels, Ulmus laciniata (UL) exhibited the lowest total PM2.5 emissions, whereas Prunus maackii (PM) displayed the highest. For branches of the same species, the total PM2.5 emissions were notably lower, generally constituting less than 30% of the overall emissions; conversely, leaves emitted the greatest quantity of PM2.5, typically exceeding 40% of the total emissions [3].
As evidenced by Figure 3, the PM2.5 emission factor does not exhibit a singular variation in response to increasing moisture content, necessitating an individual analysis. The emission factors for Acer ukurunduense (AU) peaked at a moisture content of 10% and subsequently diminished; the emission factor for Tilia amurensis (TA), Phellodendron amurense (PA), Ulmus davidiana (UD), and Prunus padus (PP) attained their highest values at a moisture content of 15% before declining. This indicates that various tree species combust to achieve the peak concentration of PM2.5 at distinct moisture levels. Conversely, the PM2.5 emission factors for Acer tegmentosum (AT), Ulmus laciniata (UL), and Prunus maackii (PM) exhibited an ascending trend in correlation with increasing moisture content, implying that these species adhere to a linear progression in moisture content ranging from 0% to 20%. The remaining tree species in the study also demonstrated their own unique patterns. The moisture content of the remaining species exhibited a gradual decline subsequent to attaining the peak concentration of PM2.5 emitted by themselves, indicating that the maximum value lies within the range of 0%–20%. The precise value necessitates further experimentation to ascertain and refine the moisture content levels.

3.2. Patterns of PM2.5 Emission from Tree Branches in Fuel Load Combustion

Analysis of Figure 4 reveals distinct patterns in PM2.5 mass concentration across different phenological phases. The budding (A) and defoliation (C) periods exhibited significantly higher variability in PM2.5 concentrations (range: 0–50,000 μg/m3), suggesting greater particulate emission dynamics during these transitional growth stages. In contrast, the growing phase (B) showed markedly lower and more stable PM2.5 levels (range: 0–25,000 μg/m3), indicating relatively consistent emission patterns during active vegetation periods.
The experimental data demonstrate a consistent positive correlation between fuel load (1 g, 2 g, 3 g) and PM2.5 mass concentration across all observation periods, with particulate emissions increasing proportionally to fuel quantity.
Analysis of Figure 4 reveals three key moisture-dependent emission patterns: (1) During the budding period (A), PM2.5 concentrations increased progressively (0%–20% moisture), peaking at 15%–20%; (2) The growth period (B) showed an initial decline (0%–5%), subsequent rise (5%–10%), and stabilization (10%–20%) of PM2.5 emission; (3) The leaf fall period (C) exhibited similar but more pronounced (30%–40% greater amplitude) triphasic fluctuations.

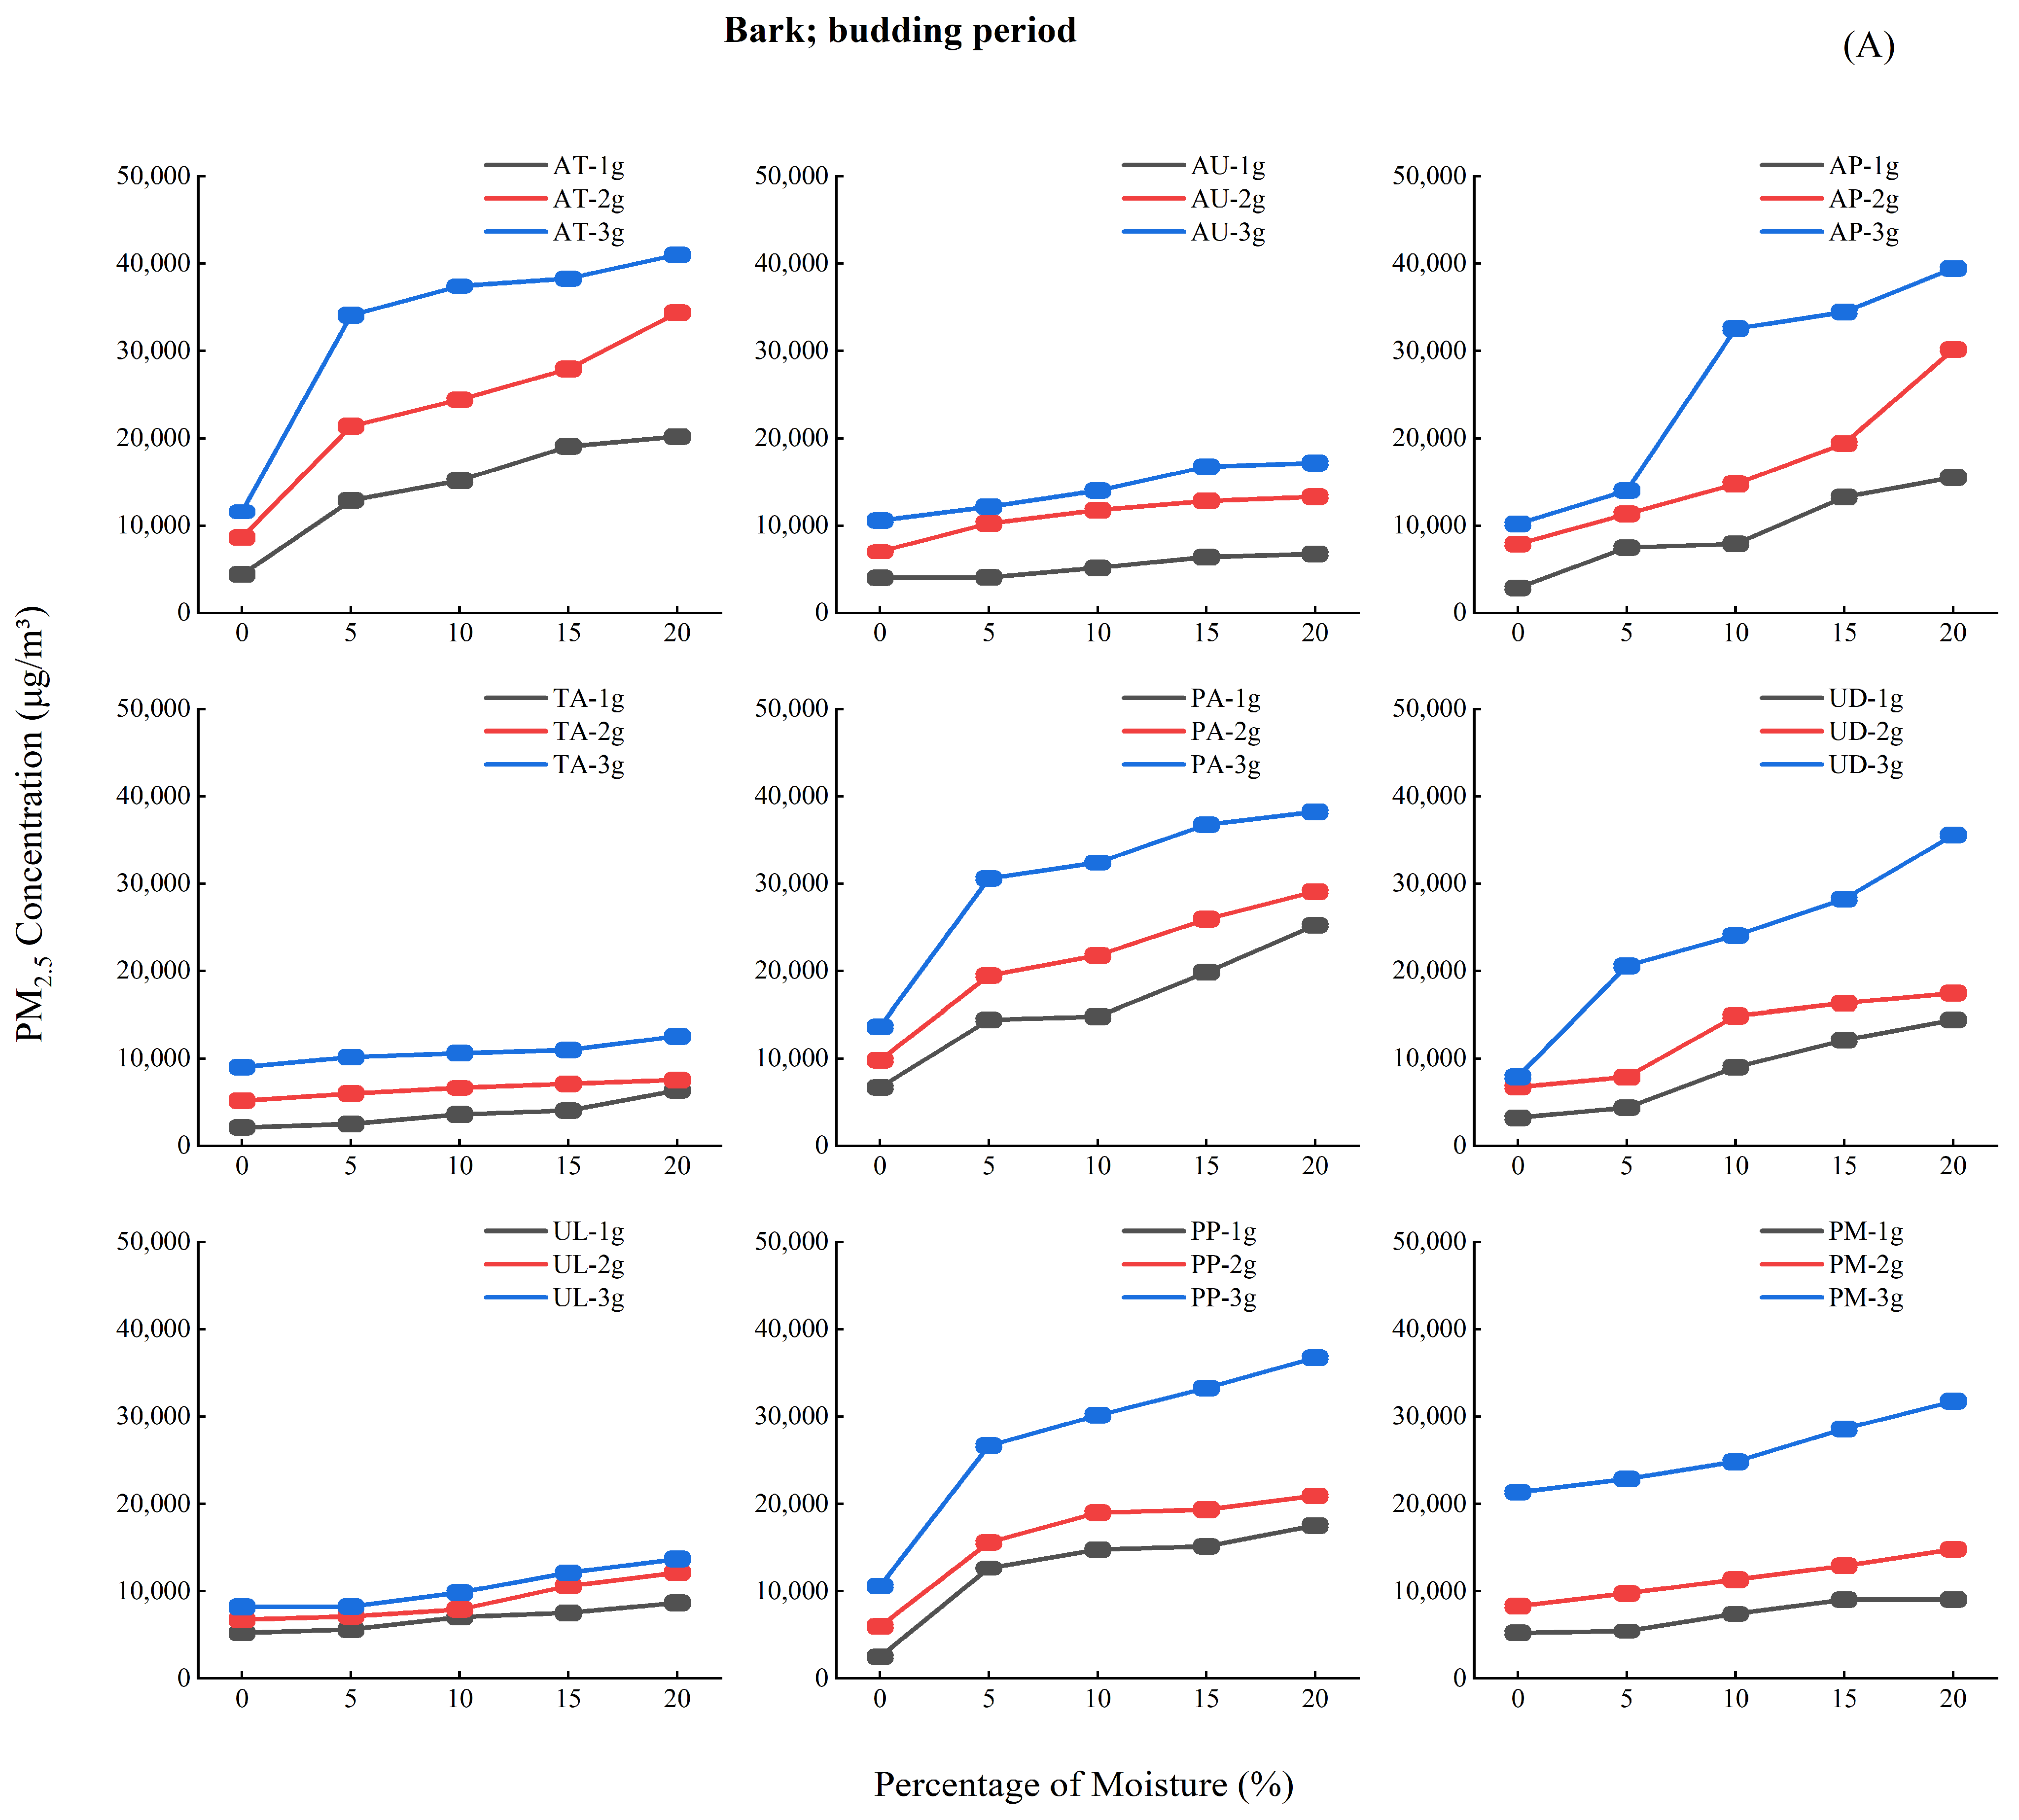
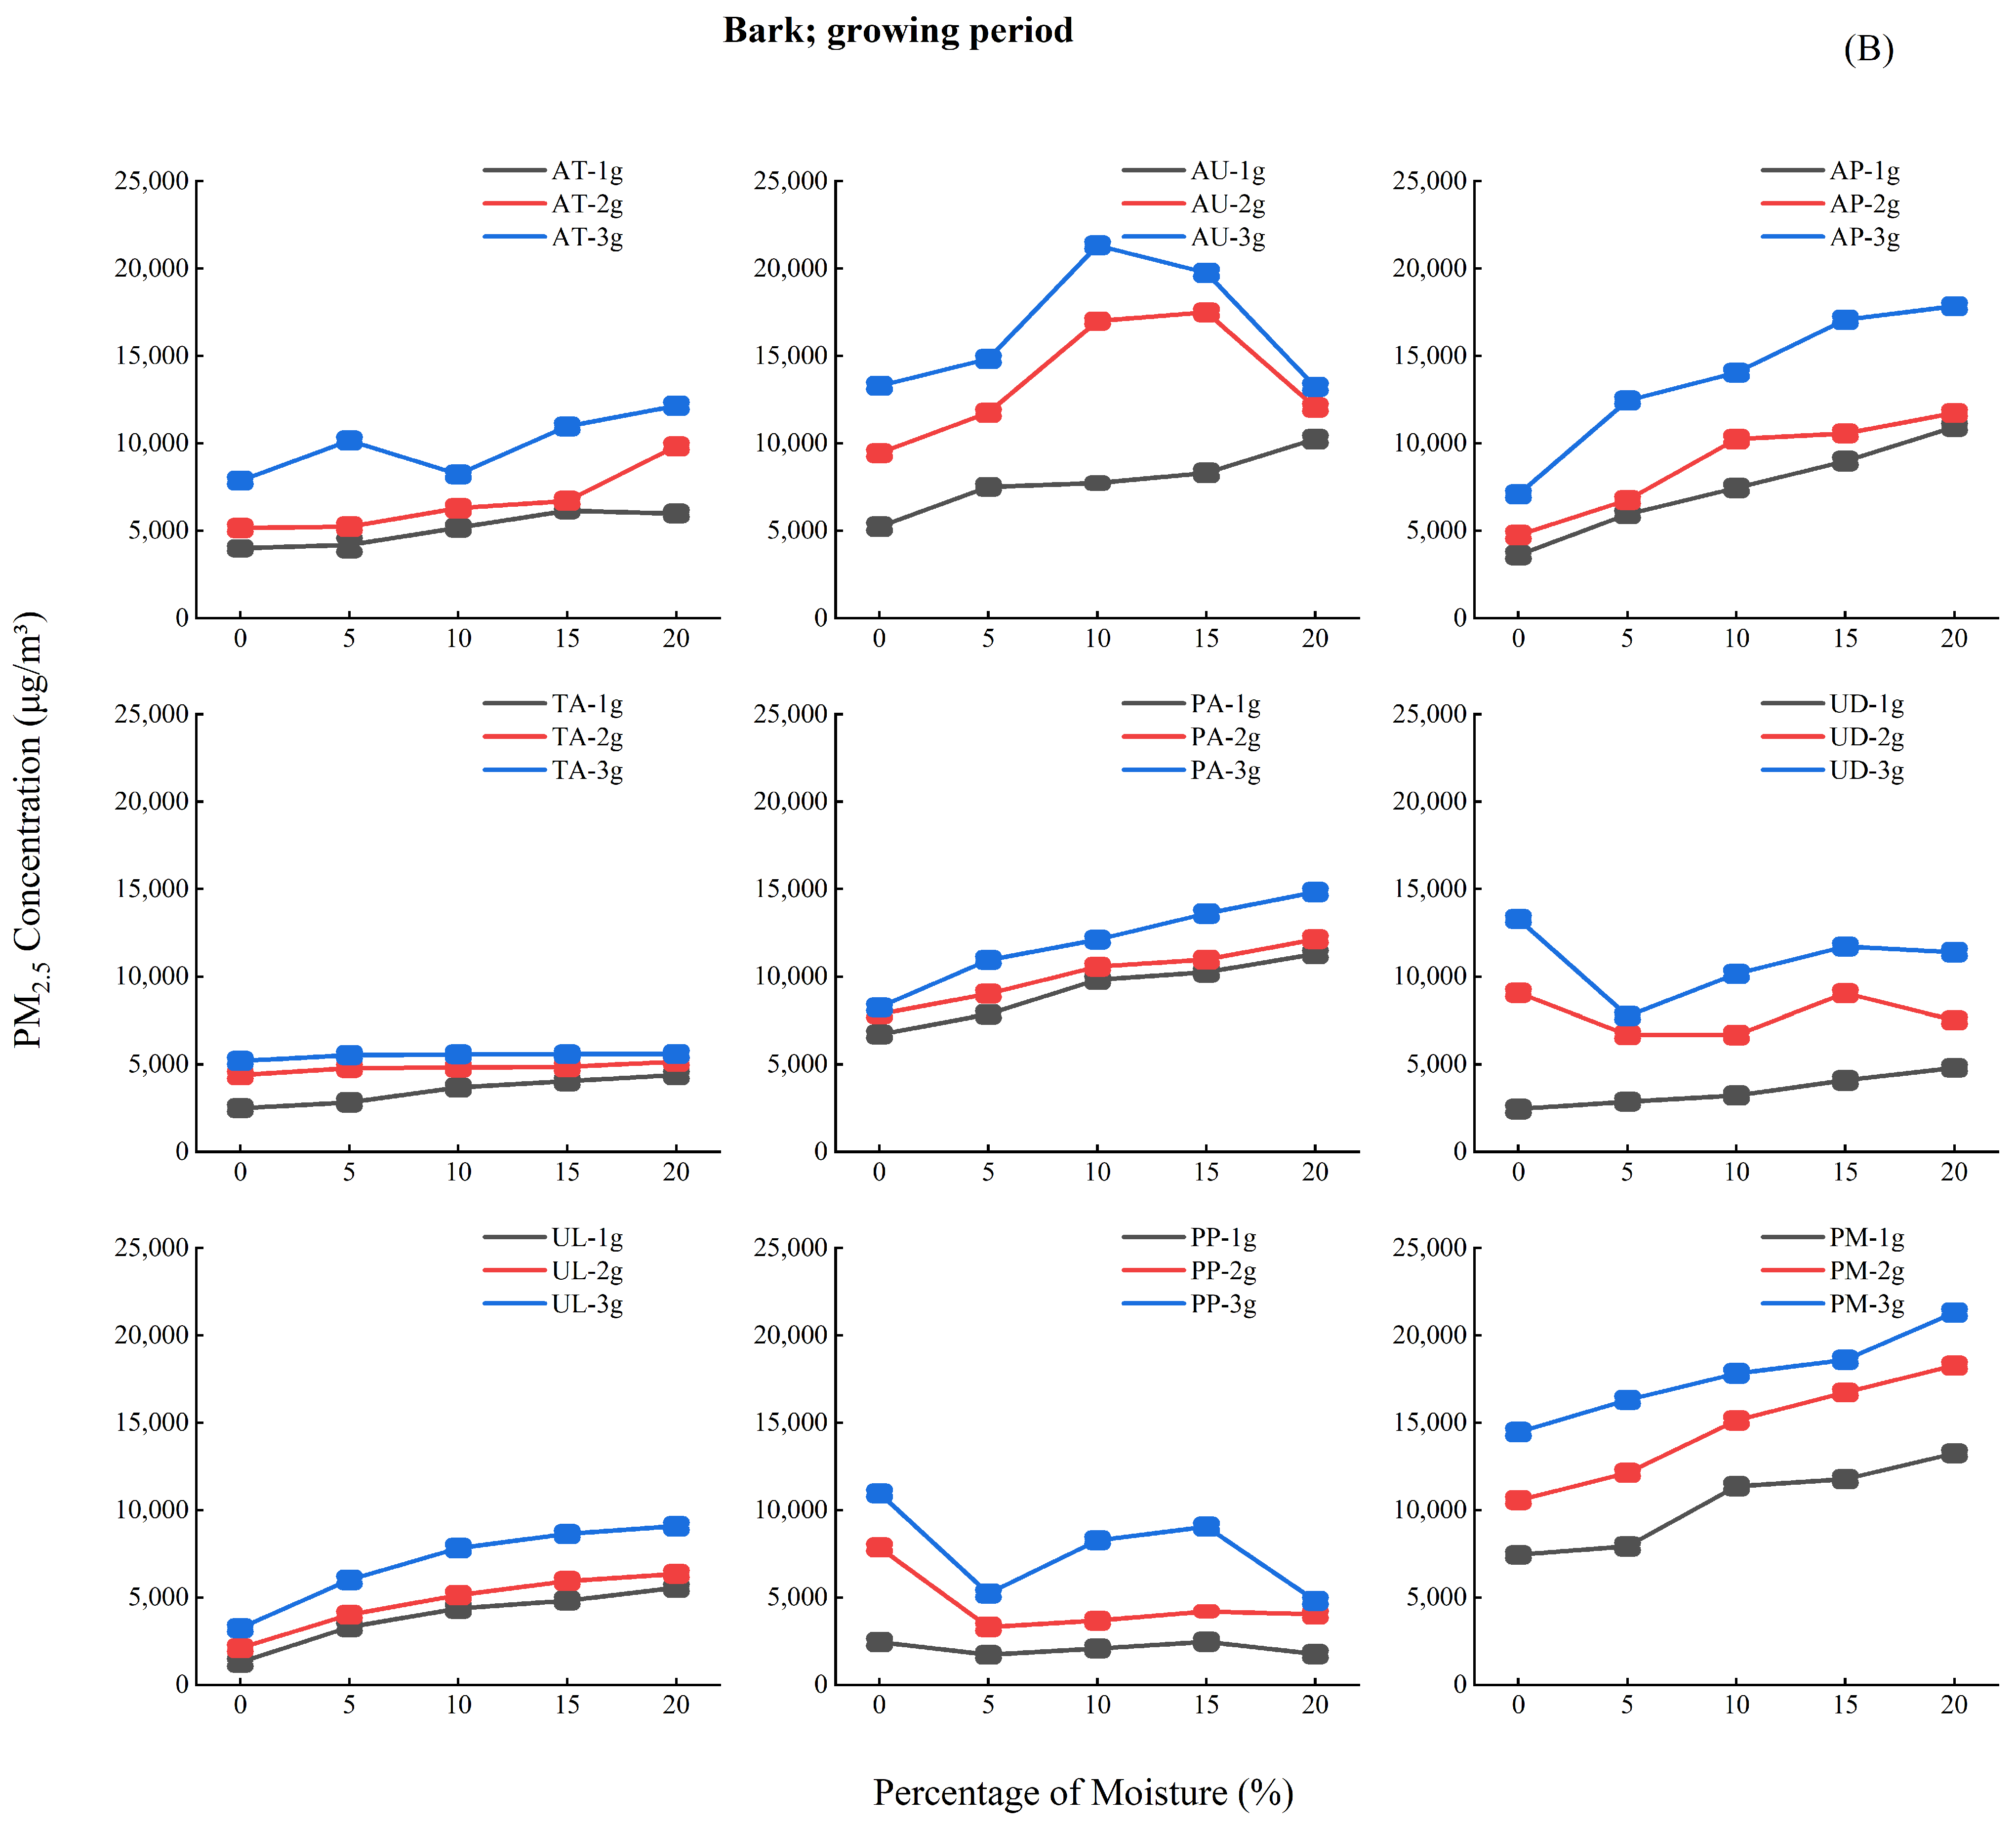
3.3. Patterns of PM2.5 Emission from Bark in Fuel Load Combustion

Analysis of the three phenological periods including budding (A), growing (B), and defoliation (C) revealed significant variations in bark PM2.5 emissions. The budding and defoliation periods exhibited substantial fluctuations in PM2.5 mass concentrations (range: 0–50,000 μg/m3), indicating higher emission volatility during these transitional phases. In contrast, the growing period demonstrated more stable emission patterns with significantly lower concentration ranges (0–25,000 μg/m3).
Figure 5 demonstrates a consistent positive correlation between fuel load (1 g, 2 g, 3 g) and PM2.5 mass concentration across all three experimental periods, with particulate emissions increasing proportionally to fuel quantity.
Figure 5 demonstrates distinct moisture-dependent emission patterns across phenological periods. During the budding period (A), all tree species displayed progressively increasing PM2.5 concentrations with rising moisture content (0% to 20%). The growing period (B) revealed a triphasic pattern: initial decrease (0%–5% moisture), followed by an increase (5%–10%), and subsequent decrease (10%–20%). This trend persisted during the deciduous period (C) for most species (80%).

3.4. Patterns of PM2.5 Emission from Leaves in Combustible Combustion

Figure 6 reveals consistent PM2.5 emission patterns from leaves across key phenological stages, with mass concentrations maintaining similar fluctuation ranges (0–40,000 μg/m3) during both the growing (B) and defoliation (C) periods.
The experimental data demonstrate a consistent positive correlation between fuel load (1 g, 2 g, 3 g) and PM2.5 mass concentration across both observation periods, with particulate emissions scaling proportionally to fuel quantity.
Figure 6 demonstrates distinct moisture-dependent PM2.5 emission patterns across phenological periods: (1) Budding period (A) shows a consistent positive correlation between moisture content (0%–20%) and PM2.5 concentrations for all species; (2) Growing period (B) exhibits a triphasic trend—initial decrease (0%–5% moisture), subsequent increase (5%–10%), and final decrease (10%–20%); (3) Deciduous period (C) replicates this pattern for 80% of species.
In conclusion, our study reveals that PM2.5 emissions from tree components (branches, bark, and leaves) demonstrate significant temporal variations across phenological stages (A–C), modulated by both fuel load and moisture content. Key findings include: (1) Emission stability decreases progressively from budding (A) to defoliation (C); (2) Fuel loads show a consistent positive correlation with PM2.5 concentrations; (3) Moisture content exhibits complex, non-linear impacts that vary by phenological stage. These results underscore the multifactorial nature of biomass burning emissions, necessitating integrated analysis approaches for comprehensive pattern elucidation. Future work should employ multivariate regression to quantify relative factor contributions.

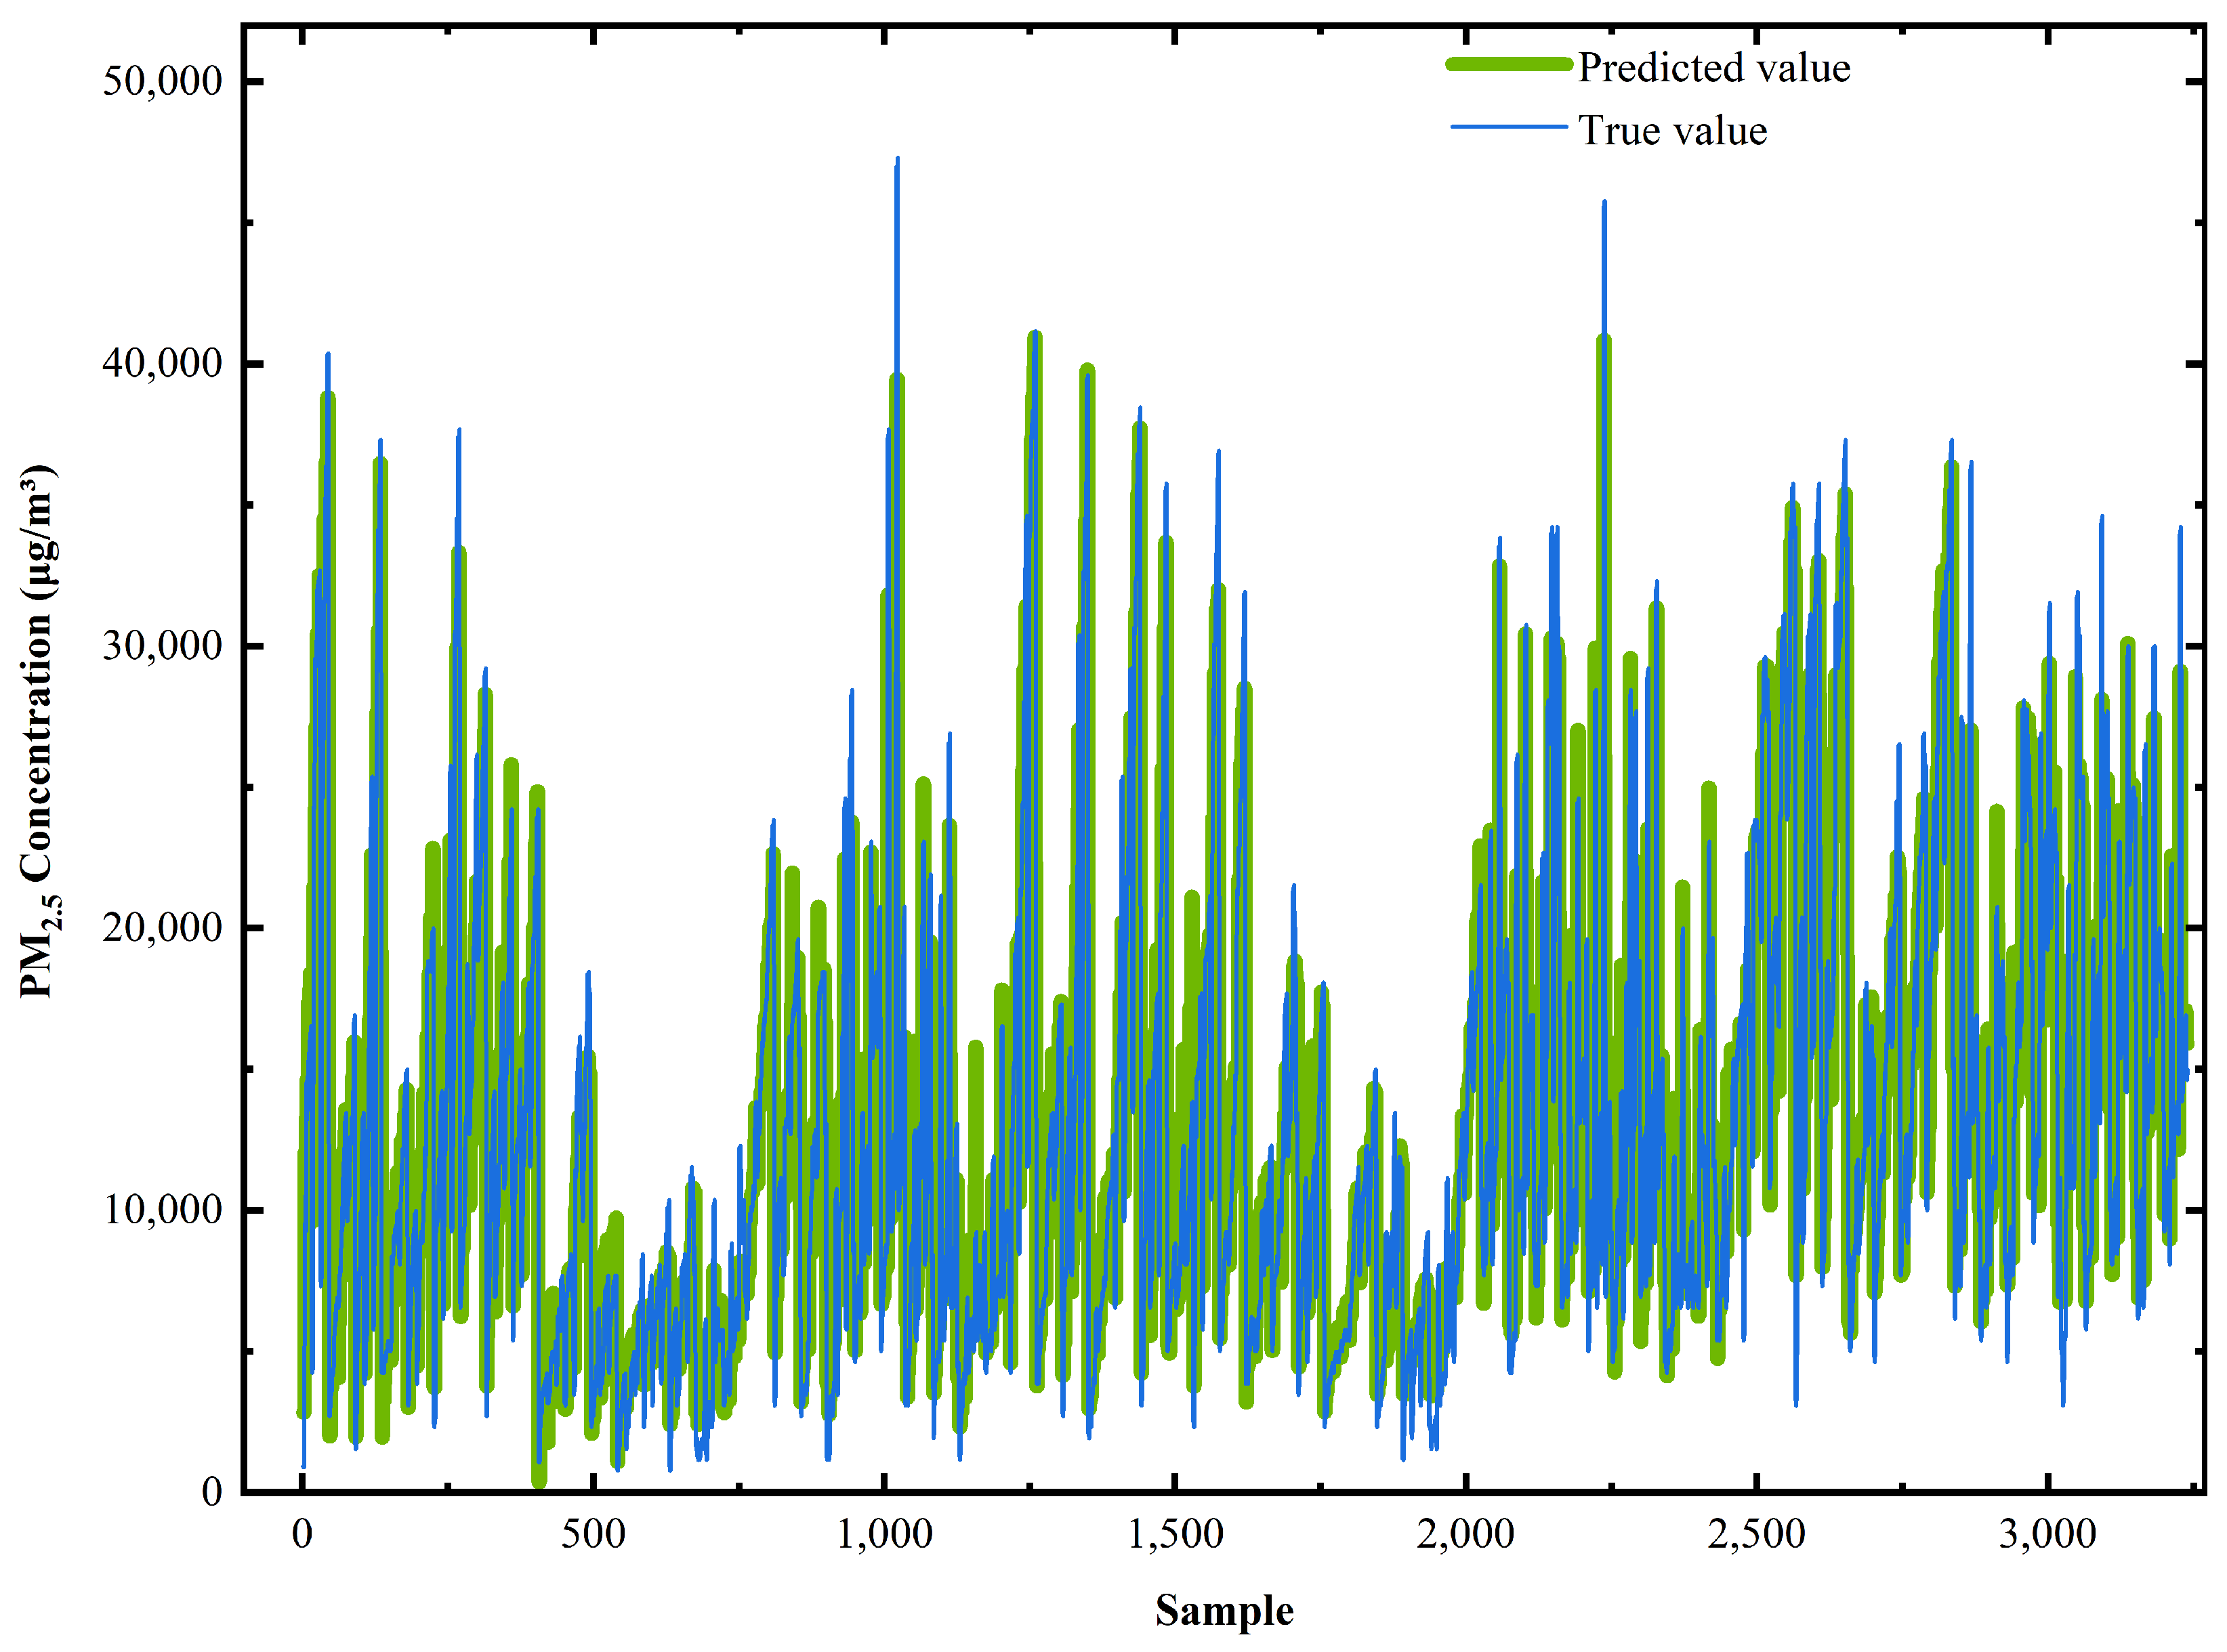
3.5. LightGBM Analysis
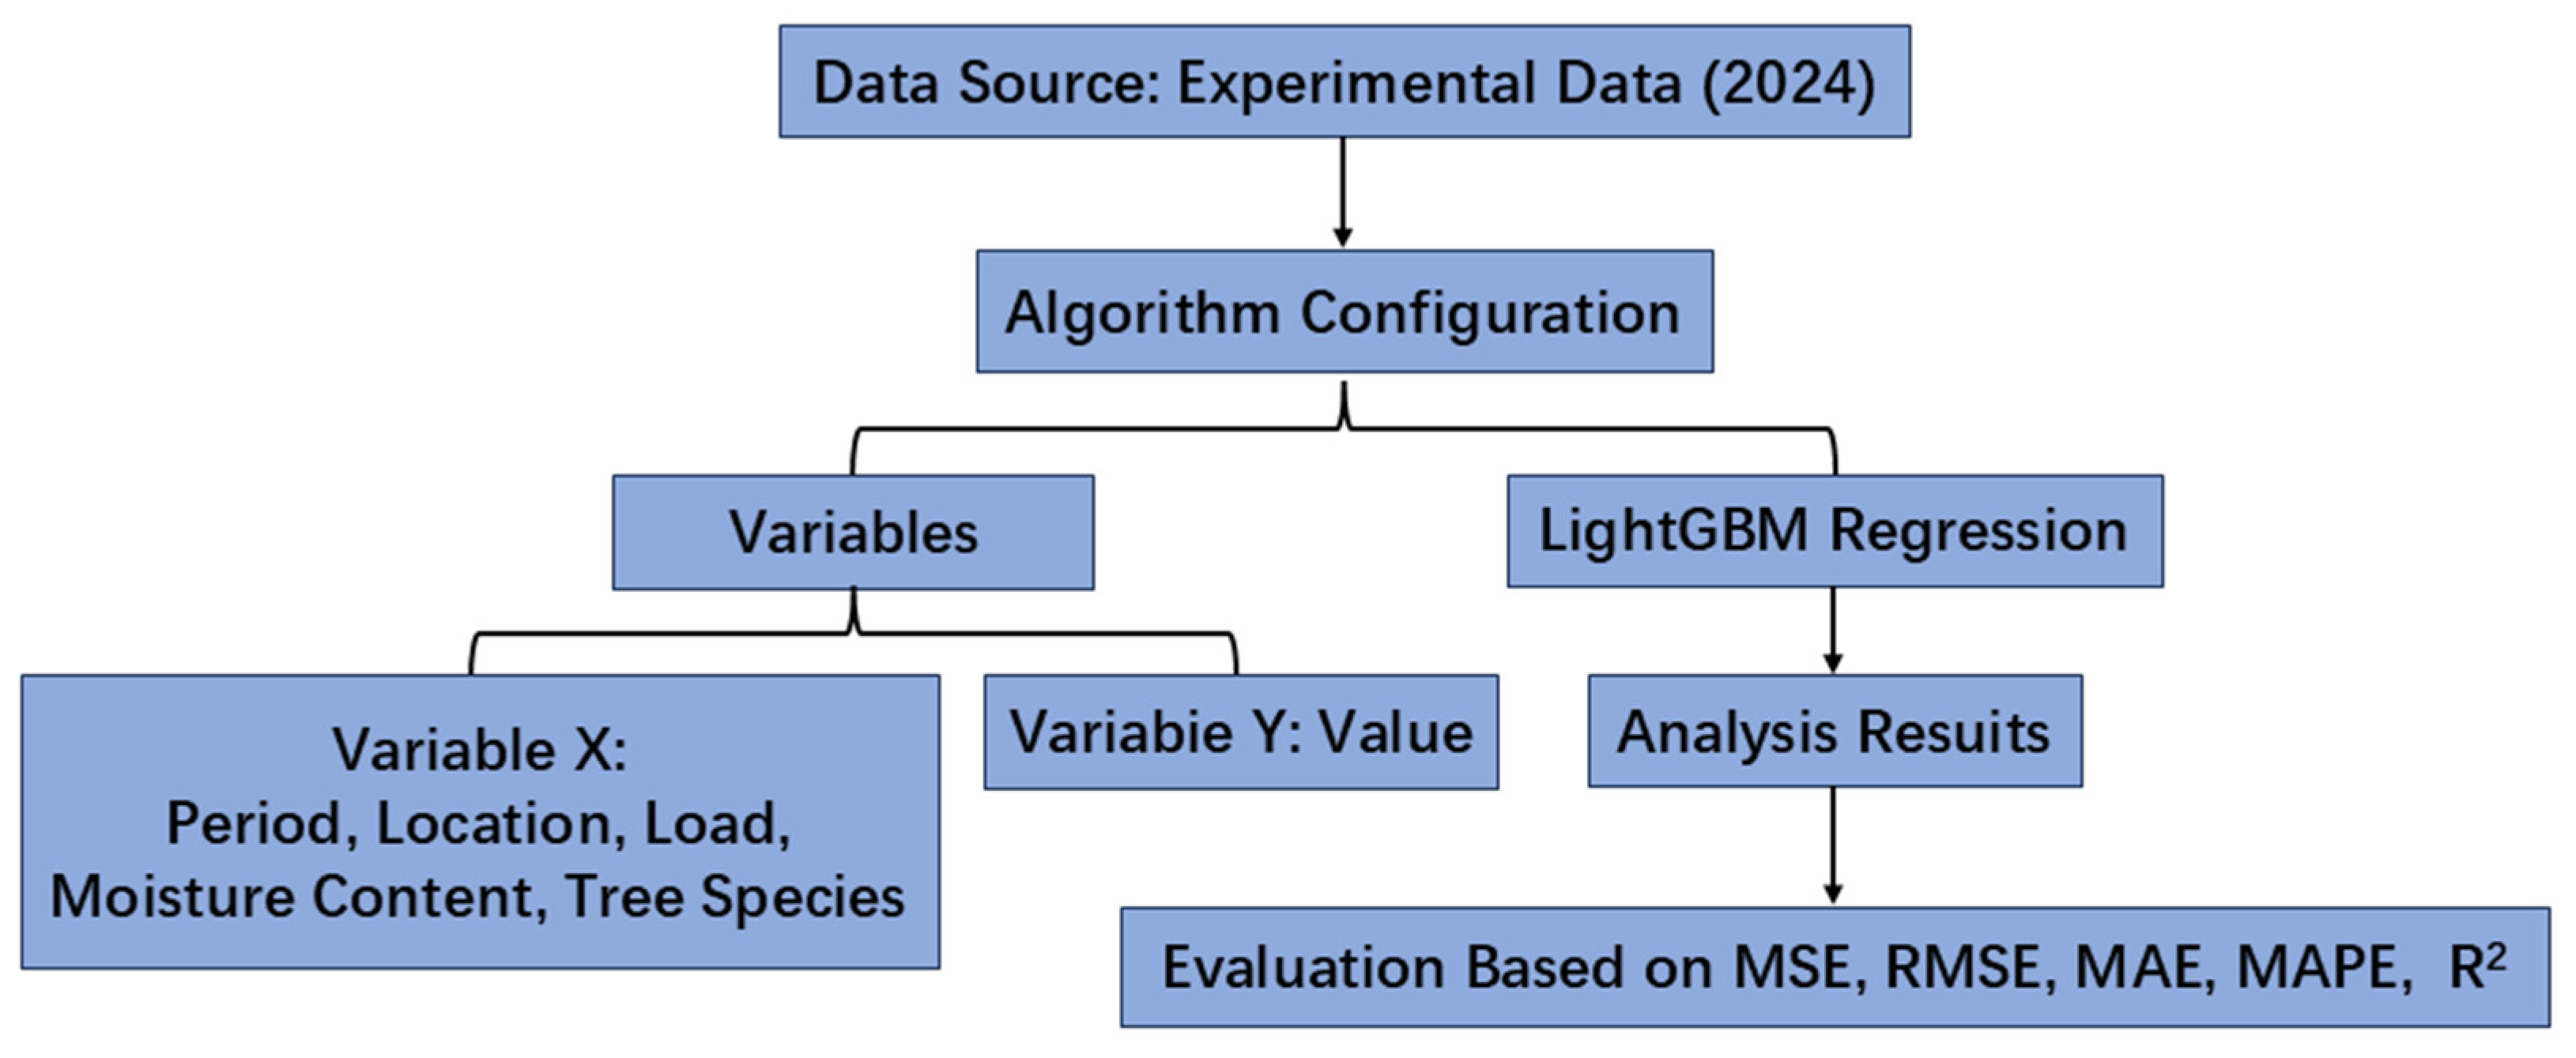
LightGBM is an open-source framework for implementing Gradient Boosting Decision Tree (GBDT) [50,51]. A decision tree is top-down tree-structured algorithm that splits to select the optimal partitioning attributes through impurity measures such as information gain to obtain optimal classification results. LightGBM introduces gradient-based one-side sampling (GOSS) and exclusive feature bundling (EFB) [52] to efficiently process big data. GOSS focuses on instances with more significant gradients, ensuring that the model focuses more on harder-to-fit data. GOSS focuses on instances with more significant gradients, ensuring that the model focuses more on harder-to-fit data points. Furthermore, EFB diminishes the feature count by aggregating mutually exclusive features. Additionally, LightGBM employs a histogram-based algorithm to discretize the data and constructs the tree using an incremental leaf-wise growth methodology, thereby facilitating quicker convergence and superior performance. LightGBM is primarily utilized to address the issue of diminished training speed inherent in traditional GBDT when dealing with large-scale datasets.
The essence of the LightGBM algorithm lies in the iterative training of a weak classifier to achieve an optimal model.

3.5.1. Flowchart

Initially, the LightGBM regression model (Figure 7) is where the independent variable X encompasseds the period, site, fuel load, moisture content, and tree species, while the dependent variable Y representeds the mass concentration of PM2.5; Subsequently, the feature importance is as computed using the established LightGBM model. Thereafter, the constructed LightGBM regression model was applied to both training and the test datasets, and to obtain the outcomes results were obtained of model evaluation. Unlike traditional models that yield a definitive equation, LightGBM typically assesses the model based on the prediction accuracy of the test data. In this paper, the LightGBM regression model is evaluated using metrics such as MSE, RMSE, MAE, MAPE, R2 indicators.
The model evaluation metrics include MSE (Mean Square Error) quantifying the average squared deviation between predicted and actual values, with lower values indicating better accuracy; RMSE (Root Mean Square Error), as the square root of MSE, reflectings the actual magnitude of errors while maintaining the same interpretation principle; MAE (Mean Absolute Error) evaluating the model performance by calculating the mean absolute deviation; MAPE (Mean Absolute Percentage Error), expressed in percentage form, is particularly useful for relative error assessment; R2 (Coefficient of Determination) measure the model’s explanatory power by comparing predictions with the data mean, ranging from 0 to 1 where values closer to 1 denote better fit. Together these metrics form a comprehensive evaluation framework providing multidimensional references for model optimization.

3.5.2. Detailed Description

The modeling process consisted of three key steps:
(1)
Data preprocessing: The dataset of 3240 samples was split into training (70%) and testing (30%) sets using sklearn’s train_test_split function (random_state = 42 for reproducibility)
(2)
Hyperparameter optimization: implemented through randomized search
(3)
Feature encoding: Numerical features underwent outlier treatment, while categorical features were transformed via one-hot encoding
The parameter configuration of the LightGBM regression model is shown in Table 2. Key settings include: a training time of 0.421 s, 7:3 data splitting ratio (70% training set and 30% test set) with data shuffling enabled; GBDT (Gradient Boosting Decision Tree) was selected as the base learner with 300 base learners (i.e., iteration rounds) and a learning rate of 0.15. For regularization, L1 (Lasso) was set to 0.5, while L2 (Ridge) was 0; Sampling strategy parameters including sample selection rate and feature sampling rate were configured; For tree structure control, key parameters such as node split threshold, minimum leaf sample weight (min_child_weight), maximum tree depth and minimum samples in leaf nodes were specified. This parameter combination ensures modeling efficiency while effectively controlling overfitting risks through regularization and sampling strategies. These parameters are determined by cross-validation and hyperparameter tuning to ensure the stability of the model. Table 2 provides a detailed reference for reproducing this experiment.
Figure 8 presents the feature importance analysis from the LightGBM regression model, highlighting significant variations in individual feature contributions to the prediction performance. Notably, the feature importance of tree species, at 36.2%, underscores its paramount role in the model’s predictive capabilities, serving as the central factor in explaining variations in the target variables. This was closely followed by moisture content with 21.60% importance, showing that this characteristic has a significant impact on the model and its variation is able to predict the results. The significance of temporal and locational characteristics was determined to be 18.40% and 17.10%, respectively. Although these values were lower than those for tree species and moisture content, they remained significant predictors that should not be overlooked. Their contribution to the model’s predictive capacity was notably substantial, highlighting the impact of temporal and locational factors on the target variable. In comparison, the contribution of fuel load was found to be merely 6.7%, the smallest among the listed characteristics. This suggests that, within the current model and dataset, the direct influence of fuel load on the predictive outcomes is relatively minor.
The evaluation metrics presented in Table 3 quantitatively demonstrate the predictive performance of the LightGBM model across three distinct datasets: the cross-validation set (reflecting model generalization), training set (indicating fitting accuracy), and test set (representing real-world prediction capability). Notably, the cross-validation metrics provide real-time feedback for hyperparameter tuning, ensuring the development of a robust and stable predictive model. The evaluation outcomes of the GBM regression model reveal the model’s efficacy across various datasets. Within Table 3, the metrics of MSE, RMSE, MAE, and MAPE are explicitly presented, each with a mutual correlation. Given the substantial magnitude of the MSE, RMSE, and MAE figures, differentiation among them is challenging. Consequently, attention is directed towards the MAPE values, which are 6.11%, 16.1%, and 9.38% for the training, cross-validation, and test sets, respectively. This error is comparatively minor. The coefficient of determination (R2) attains values of 0.988, 0.912, and 0.973 within the training set, cross-validation set, and test set, respectively, signifying the model’s robust fit to the data, thus indicating a relatively satisfactory model performance.
From Figure 9, it can be seen that the fitting situation of the predicted have real values had a high degree of overlap, which indicates that LightGBM has a better prediction of the test data with a higher accuracy.

4. Discussion

4.1. Variability in PM2.5 Emissions Among Broadleaf Species

(1)
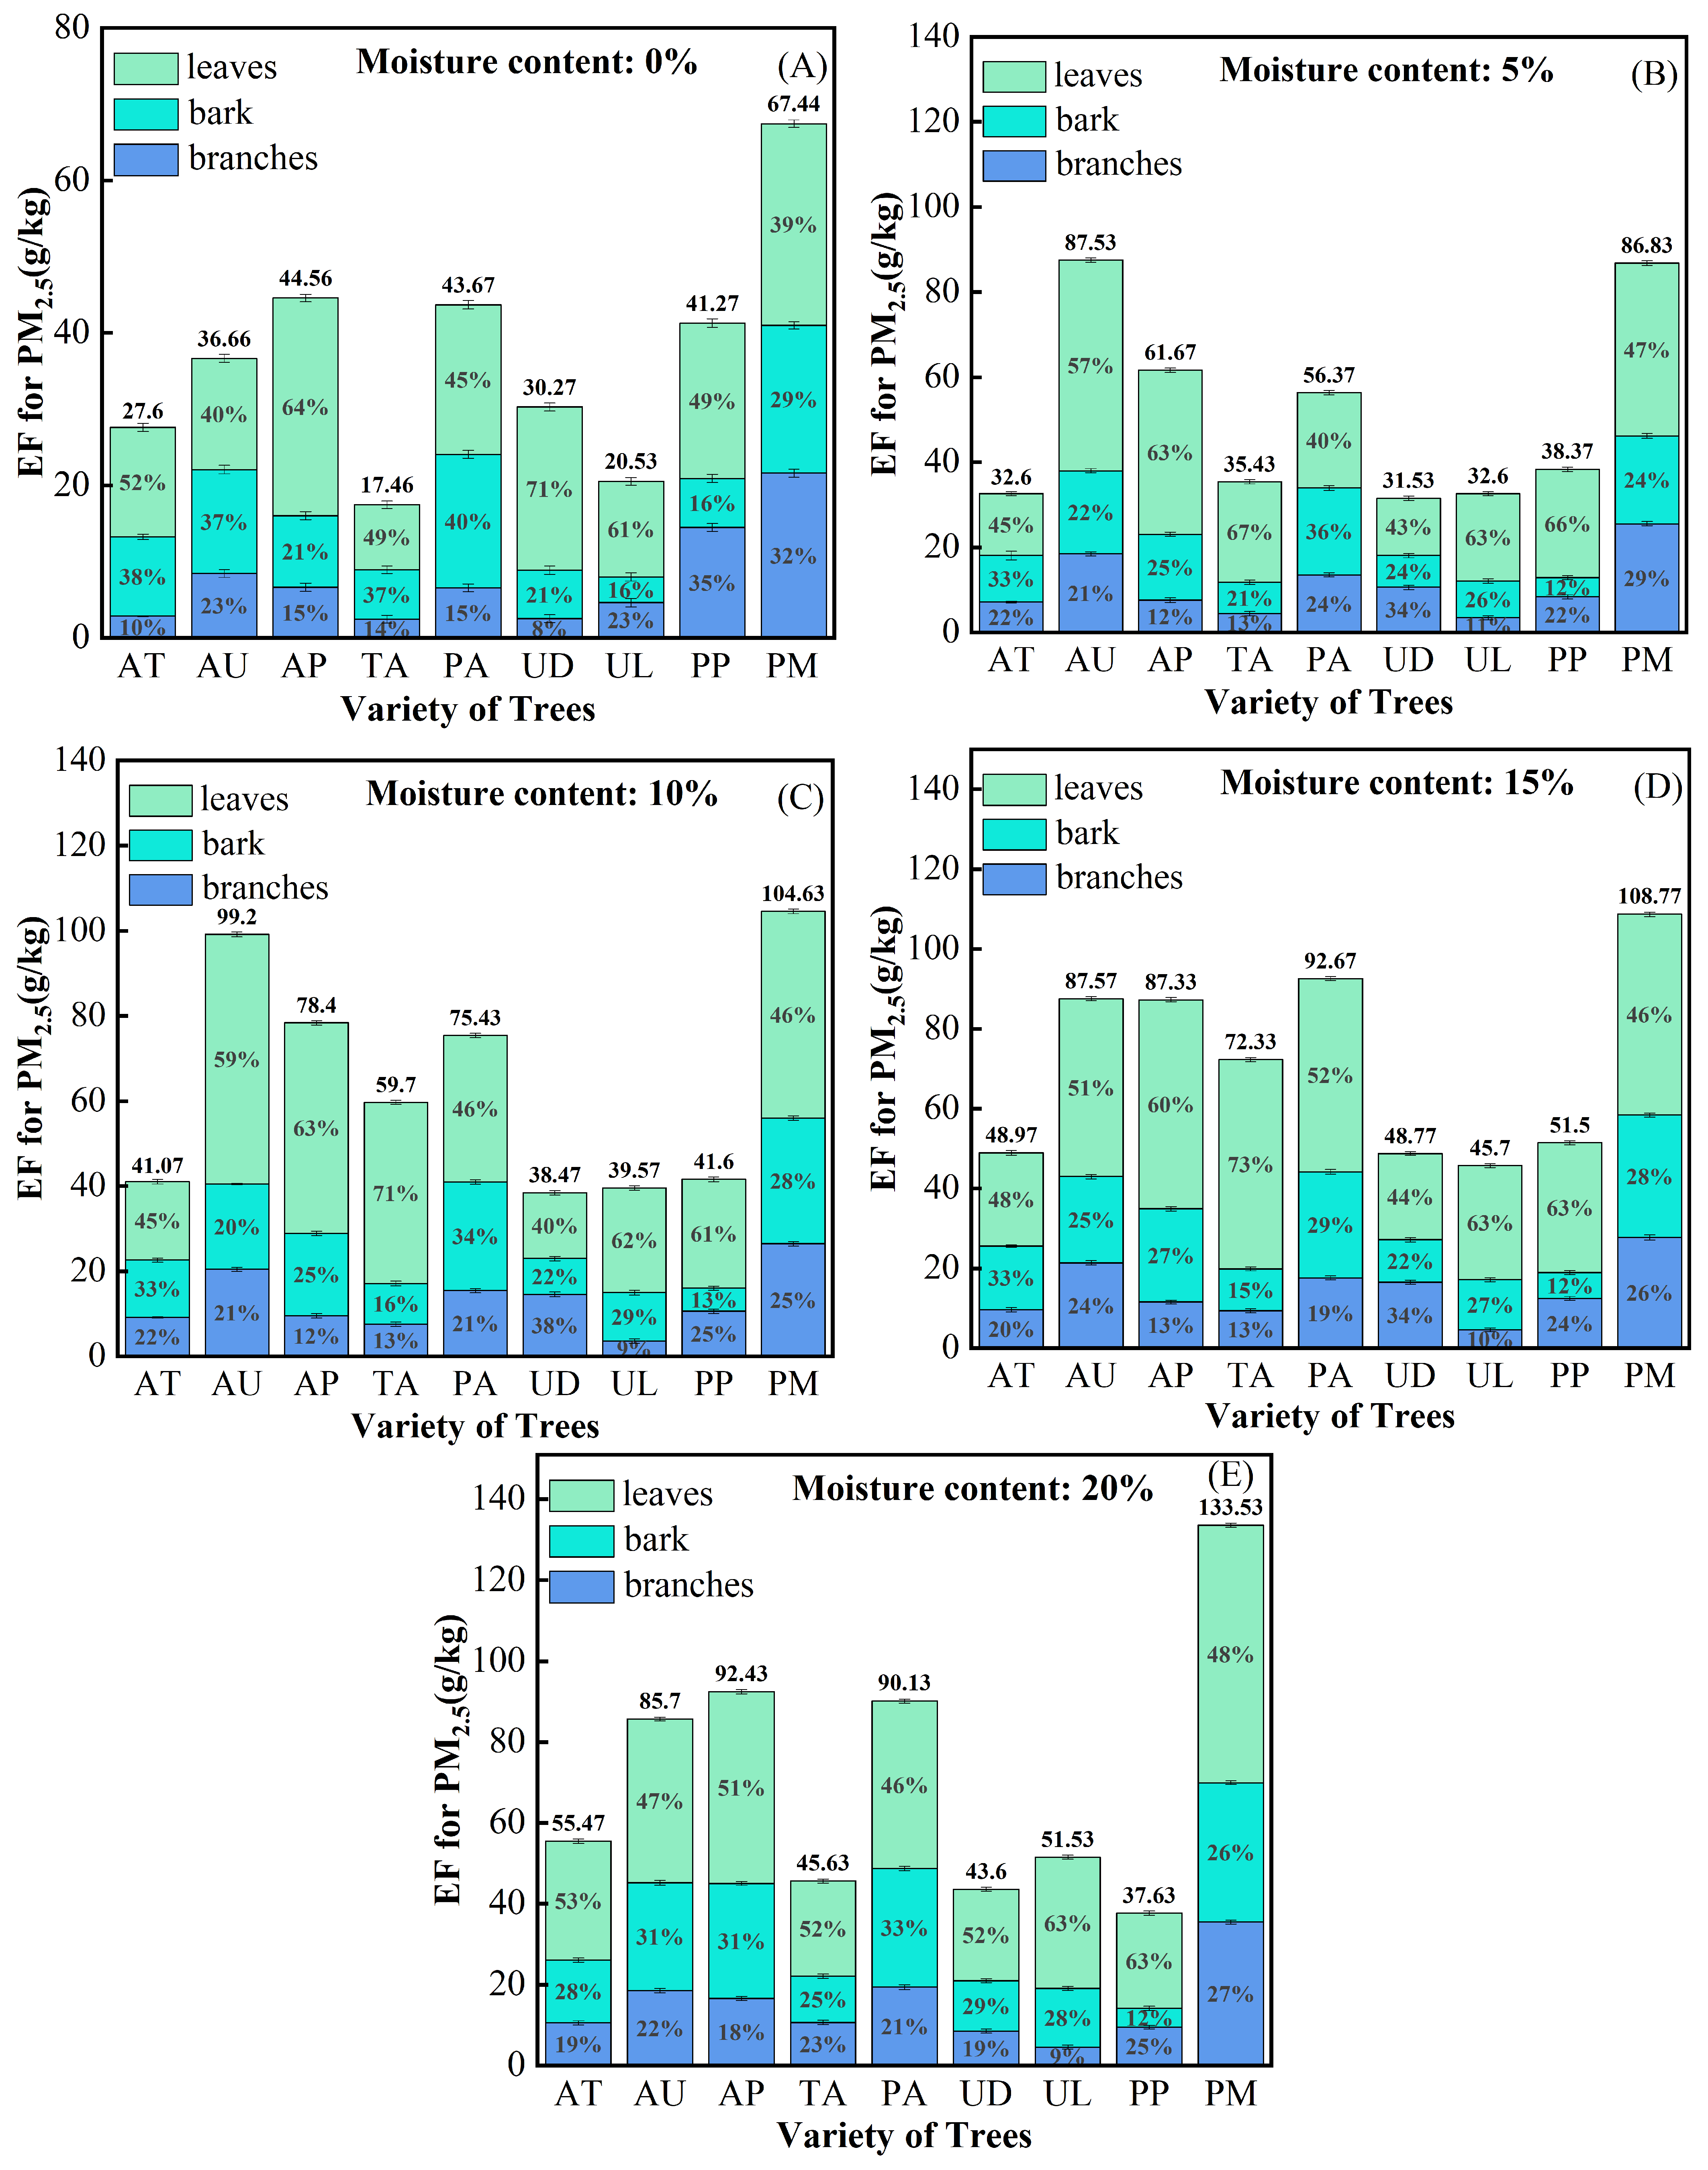
Our comparative analysis revealed substantial interspecies variation in PM2.5 emission characteristics among the studied broadleaf species (p < 0.05). Ulmus laciniata (UL) consistently demonstrated the lowest emission rates across all experimental conditions, while Prunus maackii (PM) exhibited the highest emission outputs. These differences likely stem from variations in leaf morphology and biochemical composition [31,53].
(2)
At the tree parts level, we observed distinct emission patterns: foliar components accounted for over 40% of total PM2.5 emissions, whereas branch emissions remained consistently below 30% of the total output. This disparity may be attributed to the greater surface-area-to-volume ratio and higher volatile content in leaves compared to woody tissues [54].

4.2. Moisture-Dependent Emission Dynamics

(1)
The moisture-PM2.5 emission relationship followed a characteristic unimodal pattern, with minimum emissions at 0% moisture content and peak emissions consistently occurring at 15% moisture across all study species. This optimal moisture range likely represents a balance between sufficient water content to facilitate combustion while avoiding excessive moisture that would suppress burning efficiency [55].
(2)
Notably, Acer tegmentosum (AT), Ulmus laciniata (UL), and Prunus maackii (PM) displayed a unique linear response to increasing moisture content (0%–20%), contrasting with the unimodal pattern observed in other species. This divergence suggests fundamental differences in combustion physiology that warrant further investigation.

4.3. Phenological Influences on Emission Patterns

(1)
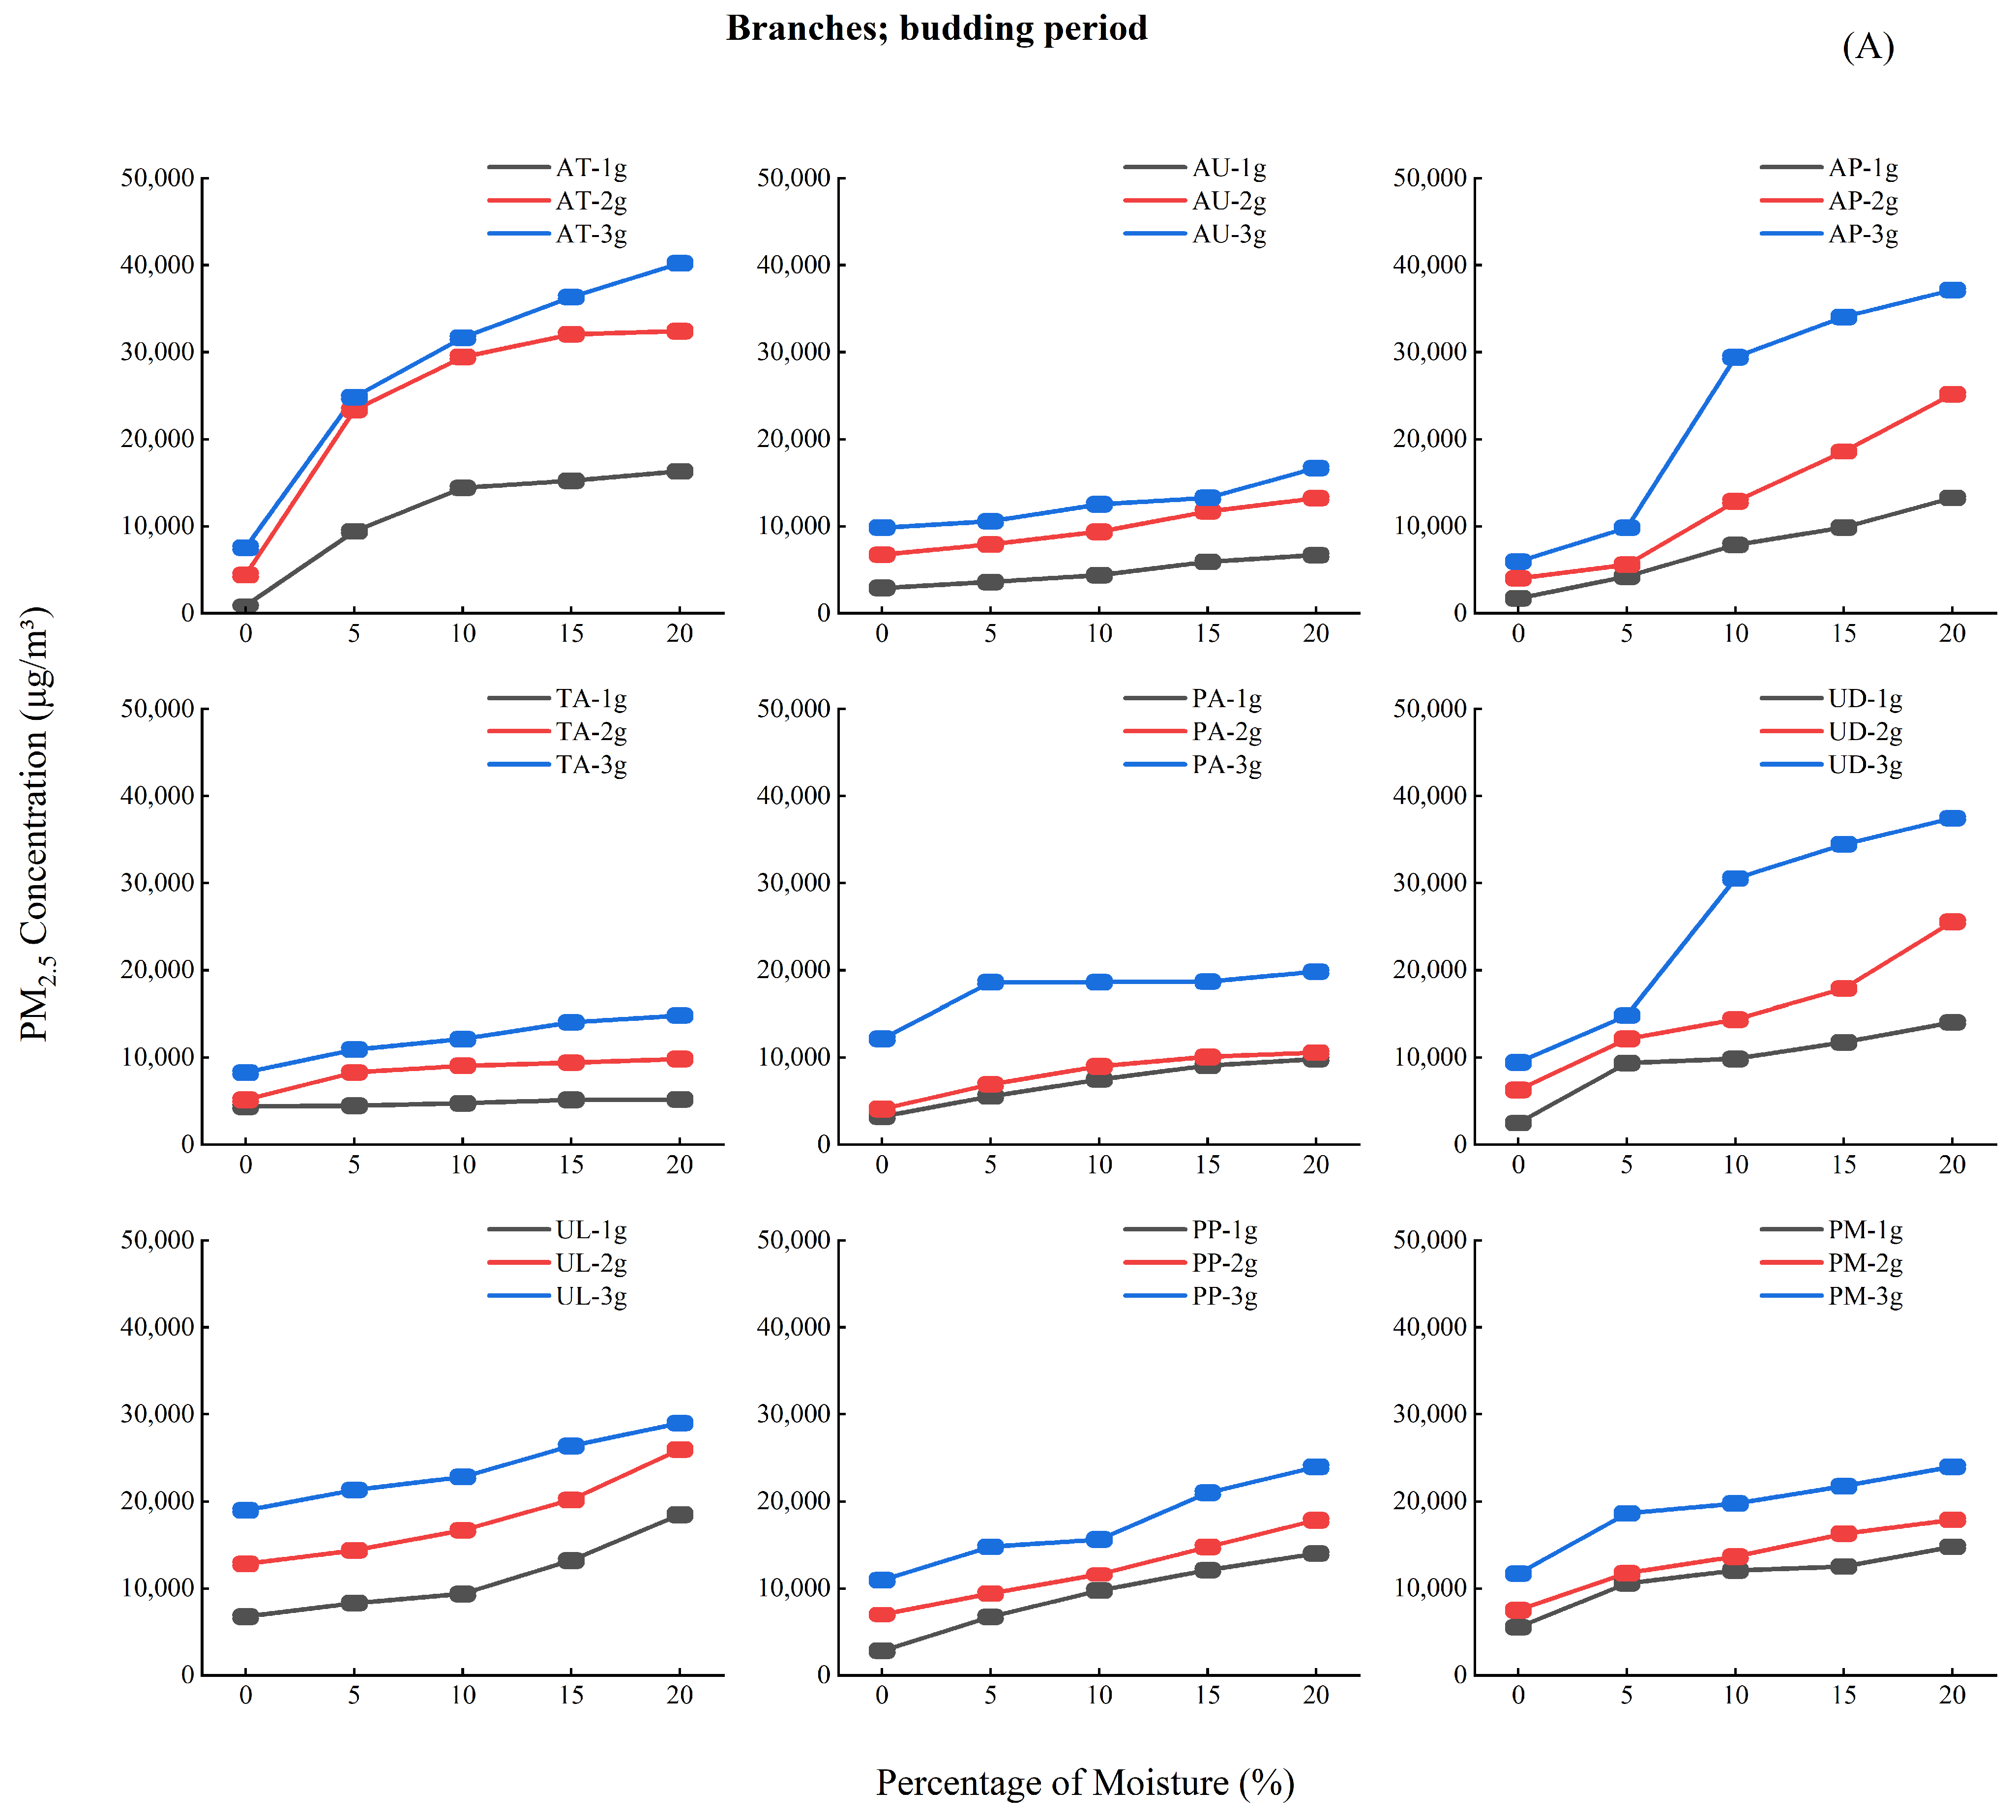
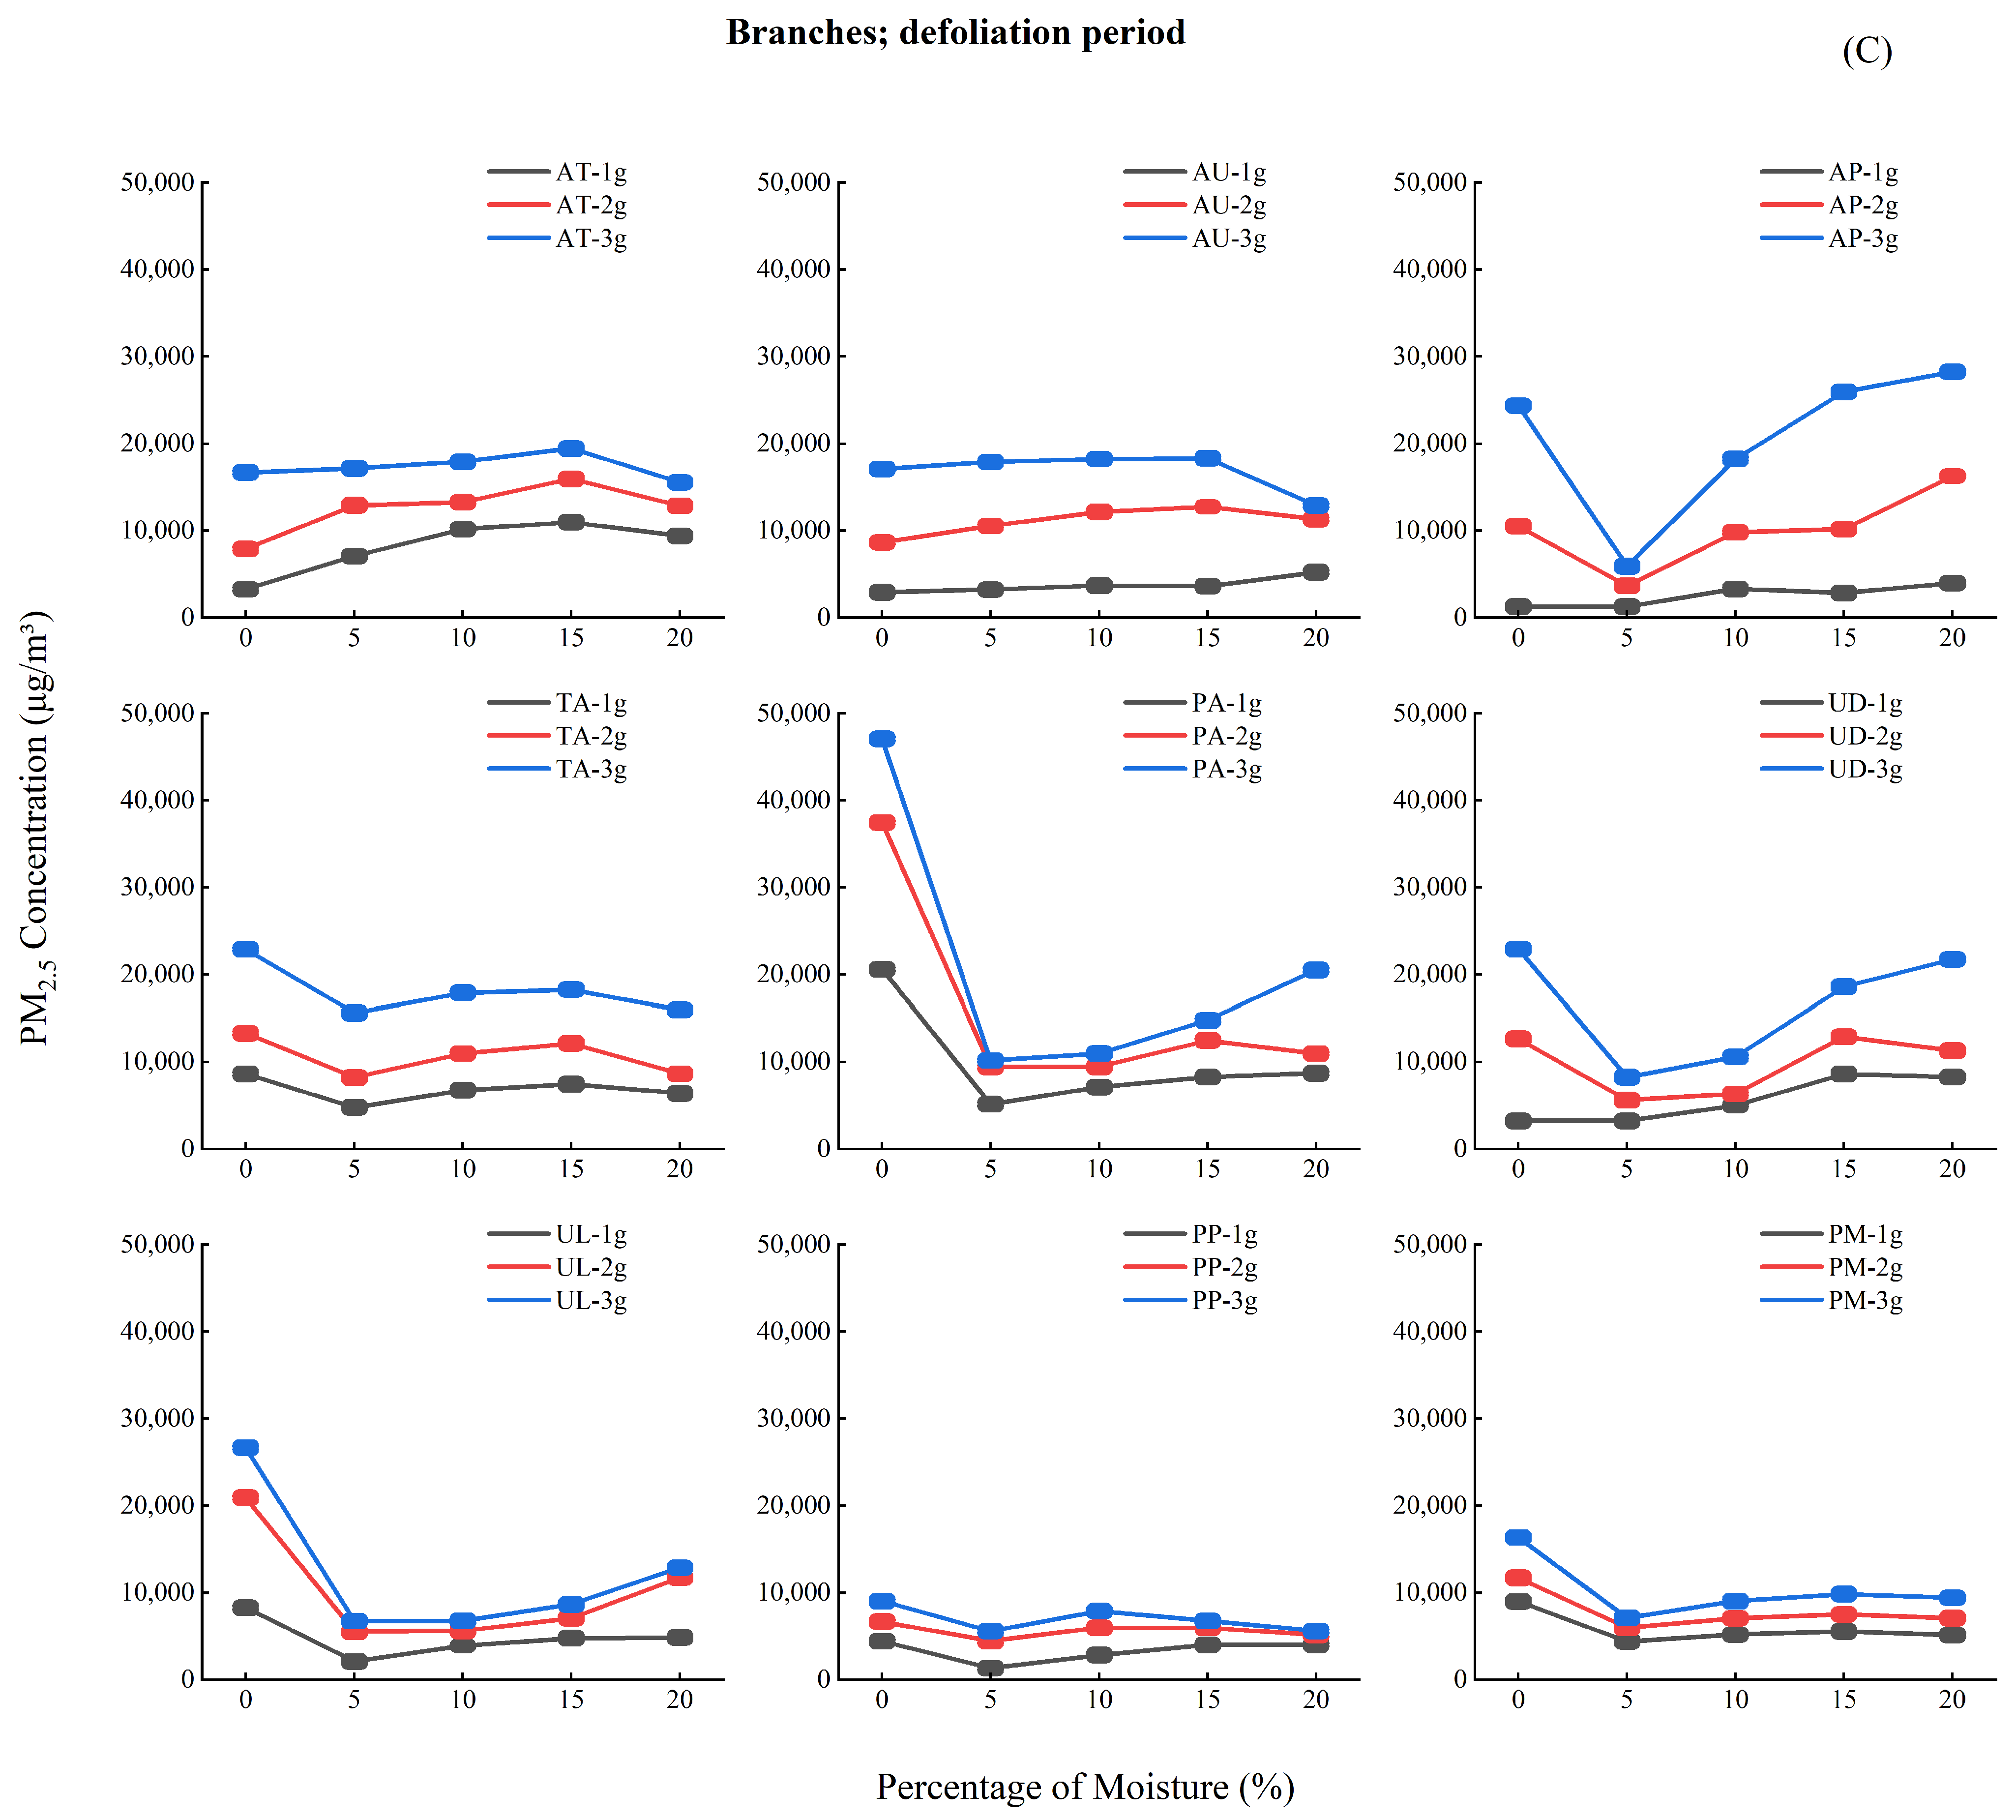
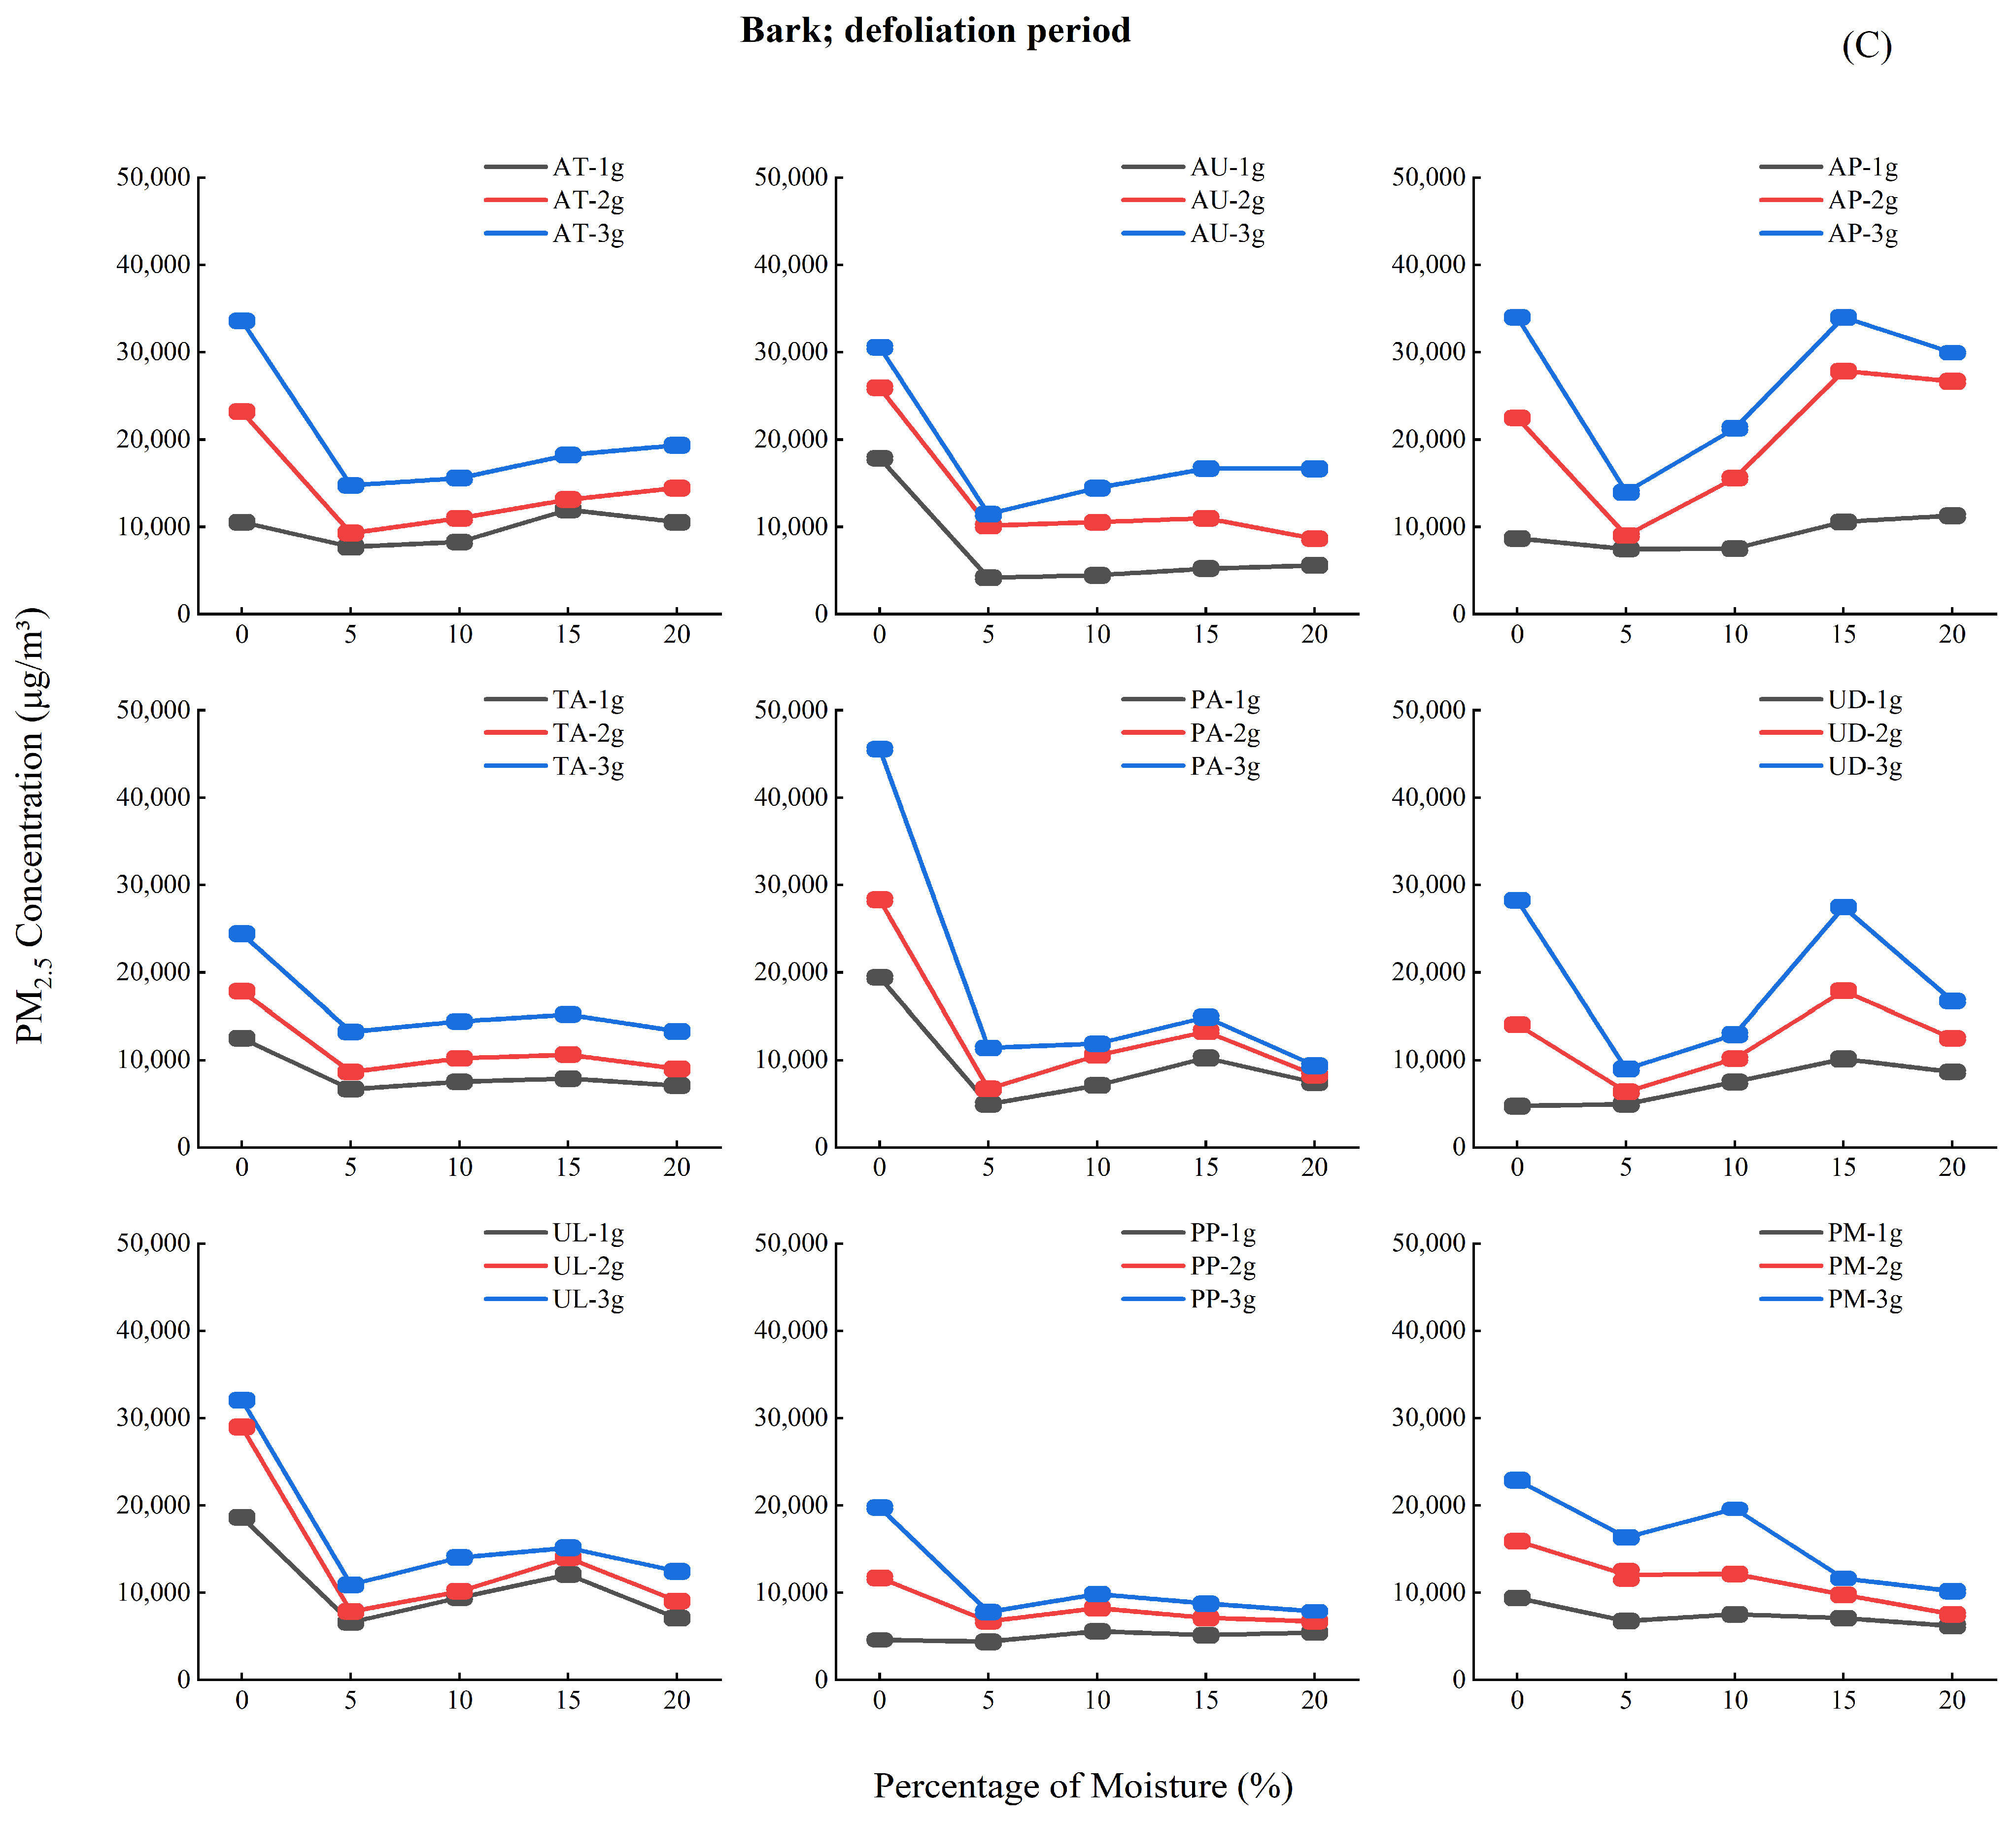
The budding period (A) exhibited a straightforward positive correlation between moisture content and PM2.5 emissions. In contrast, both the growing period (B) and defoliation period (C) displayed complex triphasic (“decline-rise-decline”) emission patterns. These phase-specific responses likely reflect seasonal changes in plant physiology [55], including variations in stomatal conductance [56] and secondary metabolite production [57].
(2)
During the defoliation period (C), we observed a 30%–50% amplification in emission variability compared to other phenological stages. This enhanced variability may result from the combined effects of leaf senescence processes [58] and changes in tissue water distribution [59] during autumn.

5. Conclusions

5.1. Key Findings

(1)
This study establishes that PM2.5 emissions from broadleaf tree combustion are governed by a complex interplay of species-specific traits, moisture content, and phenological stage. Our results demonstrate that leaves with foliar components are consistently the dominant emission source.
(2)
The identification of 15% moisture content as the peak emission condition across multiple species provides crucial data for wildfire emission modeling and forest management strategies. This finding has particular relevance for predicting air quality impacts during periods of moderate drought conditions.

5.2. Practical Implications

(1)
Our results suggest that wildfire mitigation efforts should prioritize monitoring and management during the defoliation phase (C), particularly when moisture conditions approach the 15% threshold. This combination of factors represents the highest risk scenario for substantial PM2.5 release.
(2)
The developed LightGBM model, with its demonstrated predictive accuracy for within-range conditions (R2 = 0.97), offers a valuable tool for regional air quality forecasting during fire seasons. However, users should exercise caution when extrapolating beyond the studied moisture range (0%–20%).

5.3. Future Research Directions

(1)
Subsequent studies should incorporate detailed characterization of leaf surface properties and biochemical composition to better explain the observed interspecies variation in emission patterns.
(2)
We recommend expanding the experimental scope to include a wider range of moisture conditions (particularly, 20%–30%) to improve model generalizability. Parallel studies should investigate the chemical composition of emitted particulates to assess health and climate impacts.

Author Contributions

Conceptualization, B.L. and Z.S.; data curation, T.Z. and Y.G.; methodology, Z.S.; resources, H.H.; software, Z.W.; funding acquisition, Z.S.; writing—original draft preparation, B.L.; writing—review and editing, F.W. and Z.S. All authors have read and agreed to the published version of the manuscript.

Funding

This research was funded by “Foreign Expert Key Support Project (Northeast Special Project), Northeast Asia Biodiversity Survey and Monitoring (D20240164)”.

Data Availability Statement

The novel and original contributions made within the scope of this study are comprehensively documented and incorporated within the article. For any additional or further inquiries regarding these contributions or other aspects of the research, interested parties are encouraged to direct their questions to the corresponding authors.

Acknowledgments

The authors hereby extend their heartfelt appreciation to the College of Forestry at Northeast Forestry University. The financial assistance and the provision of essential facilities from the college have been instrumental in enabling the successful completion of this research. Additionally, the authors are deeply grateful for the invaluable and constructive feedback generously offered by the anonymous reviewers. Their insightful comments have significantly enhanced the quality and rigor of this manuscript, contributing substantially to its overall improvement.

Conflicts of Interest

The authors declare no conflicts of interest.

Abbreviations

PM2.5refers to fine particulate matter in the atmosphere with a diameter of 2.5 μm
ATAcer tegmentosum
AUAcer ukurunduense
APAcer pictum
TATilia amurensis
PAPhellodendron amurense
UDUlmus davidiana
ULUlmus laciniata
PPPrunus padus
PMPrunus maackii
OBBopen biomass burning
SVMsupport vector machine
RSMResponse Surface Methodology
GBDTGradient Boosting Decision Tree
LightGBMLight Gradient Boosting Machine
DBHdiameter at breast height
GOSSgradient-based one-side sampling
EFBexclusive feature bundling
MSEMean Square Error
RMSERoot Mean Square Error
MAEMean Absolute Error
MAPEMean Absolute Percentage Error

References

  1. Elmarakby, E.; Elkadi, H. Comprehending particulate matter dynamics in transit-oriented developments: Traffic as a generator and design as a captivator. Sci. Total Environ. 2024, 931, 172528. [Google Scholar] [CrossRef] [PubMed]
  2. Tian, X.; Cheng, Y.; Chen, S.; Liu, S.; Wang, Y.; Niu, X.; Sun, J. The Emission Characteristics and Health Risks of Firefighter-Accessed Fire: A Review. Toxics 2024, 12, 739. [Google Scholar] [CrossRef] [PubMed]
  3. Zhang, H.; Li, H.; Liu, X.; Ma, Y.; Zhou, Q.; Sa, R.; Zhang, Q. Emissions Released by Forest Fuel in the Daxing’an Mountains, China. Forests 2022, 13, 1220. [Google Scholar] [CrossRef]
  4. Gomes, L.; Schüler, J.; Silva, C.; Alencar, A.; Zimbres, B.; Arruda, V.; Silva, W.V.d.; Souza, E.; Shimbo, J.; Marimon, B.S.; et al. Impacts of Fire Frequency on Net CO2 Emissions in the Cerrado Savanna Vegetation. Fire 2024, 7, 280. [Google Scholar] [CrossRef]
  5. Chen, X.; Wang, M.; Li, B.; Wang, L.; Ning, J.; Yang, G.; Yu, H. Effects of Fuel Removal on the Flammability of Surface Fuels in Betula platyphylla in the Wildland–Urban Interface. Fire 2024, 7, 261. [Google Scholar] [CrossRef]
  6. Kayet, N.; Eregowda, T.; Likitha, M.P.; Ganeshker, A.K.V.; Hegde, G. Development of 1 ×1 km gridded emission inventory for air quality assessment and mitigation strategies from open biomass burning in Karnataka, India. Urban Clim. 2024, 58, 102168. [Google Scholar] [CrossRef]
  7. Shan, Y.; Chen, X.; Yin, S.; Cao, L.; Tang, S.; Yu, B.; Cui, C. Study on the Limit of Moisture Content of the Sub-Surface Fires Converted to the Surface Fires in the Boreal Forests of China. Fire 2023, 6, 364. [Google Scholar] [CrossRef]
  8. Meneses, O.M.; Ribeiro, N.S.; Shirvani, Z.; Andrew, S.M. Spatio-Temporal Analysis of Wildfire Regimes in Miombo of the LevasFlor Forest Concession, Central Mozambique. Fire 2024, 7, 264. [Google Scholar] [CrossRef]
  9. Pereira, M.G.; Gonçalves, N.; Amraoui, M. The Influence of Wildfire Climate on Wildfire Incidence: The Case of Portugal. Fire 2024, 7, 234. [Google Scholar] [CrossRef]
  10. Afolayan, S.; Mekonnen, A.; Gamelin, B.; Lin, Y.-L. Multiscale Interactions between Local Short- and Long-Term Spatio-Temporal Mechanisms and Their Impact on California Wildfire Dynamics. Fire 2024, 7, 247. [Google Scholar] [CrossRef]
  11. Duarte, E.; Rubilar, R.; Matus, F.; Garrido-Ruiz, C.; Merino, C.; Smith-Ramirez, C.; Aburto, F.; Rojas, C.; Stehr, A.; Dörner, J.; et al. Drought and Wildfire Trends in Native Forests of South-Central Chile in the 21st Century. Fire 2024, 7, 230. [Google Scholar] [CrossRef]
  12. Dalias, P.; Hadjisterkotis, E.; Omirou, M.; Michaelidou, O.; Ioannides, I.M.; Neocleous, D.; Christou, A. Wildfire Effects on the Soil Respiration and Bacterial Microbiota Composition in Mediterranean-Type Ecosystems. Fire 2024, 7, 213. [Google Scholar] [CrossRef]
  13. Shahzad, F.; Mehmood, K.; Hussain, K.; Haidar, I.; Anees, S.A.; Muhammad, S.; Ali, J.; Adnan, M.; Wang, Z.; Feng, Z. Comparing machine learning algorithms to predict vegetation fire detections in Pakistan. Fire Ecol. 2024, 20, 57. [Google Scholar] [CrossRef]
  14. Sharma, S.; Khanal, P. Forest Fire Prediction: A Spatial Machine Learning and Neural Network Approach. Fire 2024, 7, 205. [Google Scholar] [CrossRef]
  15. Jian, M.; Jian, Y.; Zeng, H.; Cao, D.; Cui, X. Current Status and Prospects of Plant Flammability Measurements. Fire 2024, 7, 266. [Google Scholar] [CrossRef]
  16. Shapchenkova, O.A.; Kukavskaya, E.A.; Groisman, P.Y. Fire-Induced Changes in Geochemical Elements of Forest Floor in Southern Siberia. Fire 2024, 7, 243. [Google Scholar] [CrossRef]
  17. Souane, A.A.; Khurram, A.; Huang, H.; Shu, Z.; Feng, S.; Belgherbi, B.; Wu, Z. Utilizing Machine Learning and Geospatial Techniques to Evaluate Post-Fire Vegetation Recovery in Mediterranean Forest Ecosystem: Tenira, Algeria. Forests 2024, 16, 53. [Google Scholar] [CrossRef]
  18. Romanov, A.A.; Tamarovskaya, A.N.; Gusev, B.A.; Leonenko, E.V.; Vasiliev, A.S.; Krikunov, E.E. Catastrophic PM2.5 emissions from Siberian forest fires: Impacting factors analysis. Environ. Pollut. 2022, 306, 119324. [Google Scholar] [CrossRef]
  19. Nguyen, H.D.; Bang, H.Q.; Quan, N.H.; Quang, N.X.; Duong, T.A. Effect of Biomass Burnings on Population Exposure and Health Impact at the End of 2019 Dry Season in Southeast Asia. Atmosphere 2024, 15, 1280. [Google Scholar] [CrossRef]
  20. Siregar, S.; Idiawati, N.; Berekute, A.K.; Maulana, M.; Pan, W.-C.; Yu, K.-P. Association between long-term PM2.5 exposure and mortality on Sumatra Island: Indonesian Family Life Survey (IFLS) 2000–2014. Environ. Monit. Assess. 2024, 196, 1173. [Google Scholar] [CrossRef]
  21. Borchers-Arriagada, N.; Morgan, G.G.; Van Buskirk, J.; Gopi, K.; Yuen, C.; Johnston, F.H.; Guo, Y.; Cope, M.; Hanigan, I.C. Daily PM2.5 and Seasonal-Trend Decomposition to Identify Extreme Air Pollution Events from 2001 to 2020 for Continental Australia Using a Random Forest Model. Atmosphere 2024, 15, 1341. [Google Scholar] [CrossRef]
  22. Wu, Z.; Hasham, A.; Zhang, T.; Gu, Y.; Lu, B.; Sun, H.; Shu, Z. Analysis of PM2.5 Concentration Released from Forest Combustion in Liangshui National Natural Reserve, China. Fire 2024, 7, 311. [Google Scholar] [CrossRef]
  23. Ma, Y.; Tigabu, M.; Guo, X.; Zheng, W.; Guo, L.; Guo, F. Water-Soluble Inorganic Ions in Fine Particulate Emission During Forest Fires in Chinese Boreal and Subtropical Forests: An Indoor Experiment. Forests 2019, 10, 994. [Google Scholar] [CrossRef]
  24. Lu, J.; Wu, J.; Chen, Y. Indoor environment and brain health across the life course: A systematic review. Build. Environ. 2025, 267, 112156. [Google Scholar] [CrossRef]
  25. Guerrero, F.; Espinoza, L.; Vidal, V.; Carmona, C.; Krecl, P.; Targino, A.C.; Ruggeri, M.F.; Toledo, M. Black carbon and particulate matter concentrations amid central Chile’s extreme wildfires. Sci. Total Environ. 2024, 951, 175541. [Google Scholar] [CrossRef]
  26. Hughes, F.; Parsons, L.; Levy, J.H.; Shindell, D.; Alhanti, B.; Ohnuma, T.; Kasibhatla, P.; Montgomery, H.; Krishnamoorthy, V. Impact of Wildfire Smoke on Acute Illness. Anesthesiology 2024, 141, 779–789. [Google Scholar] [CrossRef]
  27. Panumasvivat, J.; Sapbamrer, R.; Sittitoon, N.; Khacha-ananda, S.; Kiratipaisarl, W.; Sirikul, W.; Insian, W.; Assavanopakun, P. Exploring the adverse effect of fine particulate matter (PM2.5) on wildland firefighters’ pulmonary function and DNA damage. Sci. Rep. 2024, 14, 7932. [Google Scholar] [CrossRef]
  28. Thongsak, N.; Chitapanarux, T.; Chotirosniramit, A.; Chakrabandhu, S.; Traisathit, P.; Nakharutai, N.; Srikummoon, P.; Thumronglaohapun, S.; Supasri, T.; Hemwan, P.; et al. Air pollutants and primary liver cancer mortality: A cohort study in crop-burning activities and forest fires area. Front. Public Health 2024, 12, 1389760. [Google Scholar] [CrossRef]
  29. Ning, J.; Di, X.; Yu, H.; Yuan, S.; Yang, G. Spatial distribution of particulate matter 2.5 released from surface fuel combustion of Pinus koraiensis—A laboratory simulation study. Environ. Pollut. 2021, 287, 117282. [Google Scholar] [CrossRef]
  30. Ning, J.; Yang, G.; Liu, X.; Geng, D.; Wang, L.; Li, Z.; Zhang, Y.; Di, X.; Sun, L.; Yu, H. Effect of fire spread, flame characteristic, fire intensity on particulate matter 2.5 released from surface fuel combustion of Pinus koraiensis plantation-A laboratory simulation study. Environ. Int. 2022, 166, 107352. [Google Scholar] [CrossRef]
  31. Ma, B.; Liu, X.; Tong, Z.; Zhang, J.; Wang, X. Coupled Effects of High Temperatures and Droughts on Forest Fires in Northeast China. Remote Sens. 2024, 16, 3784. [Google Scholar] [CrossRef]
  32. Huang, C.; Cai, Y.; Cao, J.; Deng, Y. Stock complex networks based on the GA-LightGBM model: The prediction of firm performance. Inf. Sci. 2025, 700, 121824. [Google Scholar] [CrossRef]
  33. Meng, S.; Shi, Z.; Xia, C.; Zhou, C.; Zhao, Y. Exploring LightGBM-SHAP: Interpretable predictive modeling for concrete strength under high temperature conditions. Structures 2025, 71, 108134. [Google Scholar] [CrossRef]
  34. Wang, Y.; Hu, W.; Xiao, B.; Yuan, Q.; Zhang, R. Fault detection of line-averaged plasma density on EAST using LightGBM. Fusion Eng. Des. 2025, 211, 114772. [Google Scholar] [CrossRef]
  35. Zhong, J.; Zhang, X.; Gui, K.; Wang, Y.; Che, H.; Shen, X.; Zhang, L.; Zhang, Y.; Sun, J.; Zhang, W. Robust prediction of hourly PM2.5 from meteorological data using LightGBM. Natl. Sci. Rev. 2021, 8, nwaa307. [Google Scholar] [CrossRef]
  36. Liu, X.; Zhao, K.; Liu, Z.; Wang, L. PM2.5 Concentration Prediction Based on LightGBM Optimized by Adaptive Multi-Strategy Enhanced Sparrow Search Algorithm. Atmosphere 2023, 14, 1612. [Google Scholar] [CrossRef]
  37. Sun, Y.; Zhang, F.; Lin, H.; Xu, S. A Forest Fire Susceptibility Modeling Approach Based on Light Gradient Boosting Machine Algorithm. Remote Sens. 2022, 14, 4362. [Google Scholar] [CrossRef]
  38. Jing, X.; Zhang, D.; Li, X.; Zhang, W.; Zhang, Z. Prediction of Forest Fire Occurrence in Southwestern China. Forests 2023, 14, 1797. [Google Scholar] [CrossRef]
  39. Tan, H.; Chen, Y.; Mao, F.; Wilson, J.P.; Zhang, T.; Cui, X.; Li, Z. PM2.5 estimation and its relationship with NO2 and SO2 in China from 2016 to 2020. Int. J. Digit. Earth 2024, 17, 1–20. [Google Scholar] [CrossRef]
  40. Liu, Z.; Liu, X.; Zhao, K. Haze prediction method based on stacking learning. Stoch. Environ. Res. Risk Assess. 2023, 37, 1–12. [Google Scholar] [CrossRef]
  41. Kang, J.; Zou, X.; Tan, J.; Li, J.; Karimian, H. Short-Term PM2.5 Concentration Changes Prediction: A Comparison of Meteorological and Historical Data. Sustainability 2023, 15, 11408. [Google Scholar] [CrossRef]
  42. Wang, Y.; Chen, L.; Qu, M.; Duan, W.; Wang, Z.; Tian, Z.; Yang, W. Response of Soil Aggregate Composition and Stability to Secondary Succession and Plantation of a Broad-Leaved Korean Pine Forest after Clear-Cutting and Its Causes. Forests 2023, 14, 2010. [Google Scholar] [CrossRef]
  43. Si, Y.; Meng, D.; Zhong, H.; Zhu, Z.; Zou, H.; Rong, K. Foraging Niche Differentiation of Five Woodpecker Species in the Primitive Broadleaved Korean Pine Forests of Northeast China. Forests 2023, 14, 2166. [Google Scholar] [CrossRef]
  44. Lu, M.; Jin, G. Variation in functional traits among different mycorrhizal types and life history stages of temperate broadleaf tree species. Perspect. Plant Ecol. Evol. Syst. 2024, 65, 125833. [Google Scholar] [CrossRef]
  45. Ma, J.; Zong, C.; Wu, Q.; Zou, H.; Sun, Y.; Zheng, X. Hoarding habitat selection of squirrels (Sciurus vulgaris) in Liangshui Nature Reserve, China. Acta Ecol. Sin. 2006, 26, 3542–3548. [Google Scholar] [CrossRef]
  46. Cline, J.M. Age-Related Morphology of Montane Populations of Shortleaf Pine (Pinus echinata) and Longleaf Pine (Pinus palustris) in the Uwharrie Mountains, North Carolina, USA. M.A.; The University of North Carolina: Greensboro, NC, USA, 2021. [Google Scholar]
  47. Rosavec, R.; Barčić, D.; Španjol, Ž.; Oršanić, M.; Dubravac, T.; Antonović, A. Flammability and Combustibility of Two Mediterranean Species in Relation to Forest Fires in Croatia. Forests 2022, 13, 1266. [Google Scholar] [CrossRef]
  48. Pétremand, R.; Suárez, G.; Besançon, S.; Dil, J.H.; Guseva Canu, I. A Real-Time Comparison of Four Particulate Matter Size Fractions in the Personal Breathing Zone of Paris Subway Workers: A Six-Week Prospective Study. Sustainability 2022, 14, 5999. [Google Scholar] [CrossRef]
  49. Pillarisetti, A.; Carter, E.; Rajkumar, S.; Young, B.N.; Benka-Coker, M.L.; Peel, J.L.; Johnson, M.; Clark, M.L. Measuring personal exposure to fine particulate matter (PM2.5) among rural Honduran women: A field evaluation of the Ultrasonic Personal Aerosol Sampler (UPAS). Environ. Int. 2019, 123, 50–53. [Google Scholar] [CrossRef]
  50. Lyu, J.; Zheng, P.; Qi, Y.; Huang, G. LightGBM-LncLoc: A LightGBM-Based Computational Predictor for Recognizing Long Non-Coding RNA Subcellular Localization. Mathematics 2023, 11, 602. [Google Scholar] [CrossRef]
  51. Zhao, X.; Liu, Y.; Zhao, Q. Improved LightGBM for Extremely Imbalanced Data and Application to Credit Card Fraud Detection. IEEE Access 2024, 12, 159316–159335. [Google Scholar] [CrossRef]
  52. Liang, J.; Bu, Y.; Tan, K.; Pan, J.; Yi, Z.; Kong, X.; Fan, Z. Estimation of Stellar Atmospheric Parameters with Light Gradient Boosting Machine Algorithm and Principal Component Analysis. Astron. J. 2022, 163. [Google Scholar] [CrossRef]
  53. Zhang, W.; Zhang, Z.; Meng, H.; Zhang, T. How Does Leaf Surface Micromorphology of Different Trees Impact Their Ability to Capture Particulate Matter? Forests 2018, 9, 681. [Google Scholar] [CrossRef]
  54. Liu, M.; Niklas, K.J.; Niinemets, U.; Hölscher, D.; Chen, L.; Shi, P. Comparison of the scaling relationships of leaf biomass versus surface area between spring and summer for two deciduous tree species. Forests 2020, 11, 1010. [Google Scholar] [CrossRef]
  55. Jolly, W.M.; Conrad, E.T.; Brown, T.P.; Hillman, S.C. Combining ecophysiology and combustion traits to predict conifer live fuel moisture content: A pyro-ecophysiological approach. Fire Ecol. 2025, 21, 19. [Google Scholar] [CrossRef]
  56. Zhang, F.P.; Zhao, X.D.; Han, L.J.; Li, H.R. Leaf dry mass per unit area and leaf pigments underlying the higher stomatal conductance of deciduous species relative to evergreen species in Dendrobium. Bot. Stud. 2025, 66, 11. [Google Scholar] [CrossRef]
  57. Ahmed, S.; Griffin, T.S.; Kraner, D.; Schaffner, M.K.; Sharma, D.; Hazel, M.; Leitch, A.R.; Orians, C.M.; Han, W.; Stepp, J.R.; et al. Environmental Factors Variably Impact Tea Secondary Metabolites in the Context of Climate Change. Front. Plant Sci. 2019, 10, 939. [Google Scholar] [CrossRef]
  58. Panozzo, A.; Bolla, P.K.; Barion, G.; Botton, A.; Vamerali, T. Phytohormonal Regulation of Abiotic Stress Tolerance, Leaf Senescence and Yield Response in Field Crops: A Comprehensive Review. BioTech 2025, 14, 14. [Google Scholar] [CrossRef]
  59. Holmlund, H.I.; Lekson, V.M.; Gillespie, B.M.; Nakamatsu, N.A.; Burns, A.M.; Sauer, K.E.; Pittermann, J.; Davis, S.D. Seasonal changes in tissue-water relations for eight species of ferns during historic drought in California. Am. J. Bot. 2016, 103, 1607. [Google Scholar] [CrossRef]
Figure 1. Illustrates the geographical location of Liangshui Experimental Forestry Farm within China.
Forests 16 00836 g001
Figure 2. Diagram of combustion chamber and experimental equipment.
Forests 16 00836 g002
Figure 3. Analysis of the Emission Factor for Total PM2.5 Resulting from the Combustion of Branches, Bark, and Leaves of Nine Different Tree Species. Combustion conditions: fuel moisture content was 0% (A), 5% (B), 10% (C), 15% (D), 20% (E), and fuel load was 1 g. The tree species were Acer tegmentosum (AT), Acer ukurunduense (AU), Acer pictum (AP), Tilia amurensis (TA), Phellodendron amurense (PA), Ulmus davidiana (UD), Ulmus laciniata (UL), Prunus padus (PP) and Prunus maackii (PM).
Forests 16 00836 g003
Figure 4. Mass concentrations of PM2.5 from burning branches of nine tree species under different combustion conditions: budding (A), growing (B), defoliation (C), fuel moisture contents (0%–20%), and fuel loads (1–3 g).
Forests 16 00836 g004aForests 16 00836 g004bForests 16 00836 g004c
Figure 5. Mass concentrations of PM2.5 emitted by burning bark of nine tree species. Combustion conditions: period of budding (A), growing (B), and deciduous (C).
Forests 16 00836 g005aForests 16 00836 g005bForests 16 00836 g005c
Figure 6. Mass concentrations of PM2.5 emission from burning leaves of nine tree species. Combustion conditions: periods of growing (A) and leaf fall (B).
Forests 16 00836 g006aForests 16 00836 g006b
Figure 7. LightGBM Analysis Flowchart.
Forests 16 00836 g007
Figure 8. A pie chart showing the proportion of importance for each feature (independent variable).
Forests 16 00836 g008
Figure 9. LightGBM’s prediction of test data.
Forests 16 00836 g009
Table 1. Predominant tree species inhabiting Liangshui Experimental Forestry Farm.
Species of TreesTaxonomic Families and Genera
Acer tegmentosumAceraceae
Acer ukurunduenseAceraceae
Acer pictumAceraceae
Tilia amurensisTiliaceae
Phellodendron amurenseRutaceae
Ulmus davidianaUlmaceae
Ulmus laciniataUlmaceae
Prunus padusRosaceae
Prunus maackiiRosaceae
Table 2. Model parameters.
Parameter NameParameter Value
Training time0.421 s
Data segmentation0.7
Data shufflingYes
Cross validation5
Base learnergbdt
Number of base learners300
Learning rate0.15
L1 regular term0.5
L2 regular term0
Sample sampling rate0.5
Tree feature sampling rate1
Node split threshold0
Minimum weight of samples in leaf nodes0.001
Maximum tree depth11
Minimum number of samples for leaf nodes20
Table 3. Results of model evaluation.
MSERMSEMAEMAPER2
training set548,867.201740.8557537.12646.11050.988
cross-validation set6,460,880.092536.1011777.26816.1760.912
test set1,331,578.991153.940852.20809.38050.973
Disclaimer/Publisher’s Note: The statements, opinions and data contained in all publications are solely those of the individual author(s) and contributor(s) and not of MDPI and/or the editor(s). MDPI and/or the editor(s) disclaim responsibility for any injury to people or property resulting from any ideas, methods, instructions or products referred to in the content.

