Article

A Digital Replica of a Marteloscope: A Technical and Educational Tool for Smart Forestry Management

1
Department of Agricultural, Food and Environmental Sciences, Università Politecnica delle Marche, 60131 Ancona, Italy
2
Department of Civil Engineering, Construction and Architecture, Università Politecnica delle Marche, 60131 Ancona, Italy
*
Author to whom correspondence should be addressed.
Forests 2025, 16(5), 820; https://doi.org/10.3390/f16050820
Submission received: 12 March 2025 / Revised: 25 April 2025 / Accepted: 12 May 2025 / Published: 15 May 2025
(This article belongs to the Section Forest Inventory, Modeling and Remote Sensing)

Abstract

Rapidly evolving surveying and monitoring methods are leading the transition toward more efficient, data-driven forest management practices. Recent research highlights the potential of advanced remote sensing platforms to support “smart” forestry, enabling precise, timely, and cost-effective assessments which inform multi-function management methods and specialized silvicultural practices for each forest type, composition, and structure. We created a digital replica of a marteloscope, which is a forestry tool to practice silvicultural simulations for technicians and students. The selected stand is an official marteloscope included in the Integrate+ Network project coordinated by the European Forest Institute (EFI). We established a framework for data collection and processing to achieve an accurate digital replica, using a mobile laser scanner (MLS) in a European beech (Fagus sylvatica L.) forest stand. We extracted the main structural forest parameters (diameter at breast height (DBH) and total height (TH)), using the 3DFin software and we graphically returned the obtained digital replica with the CloudCompare software. We compared the MLS-derived values of DBH (1087 trees) and TH (50 trees) with those from a traditional field survey and obtained a root mean square deviation (RMSD) of 2.38 cm for DBH and 2.42 m for TH. The digital marteloscope can help to visualize and assess the effects of selective thinning options on forest structure. The implementation of these virtual reality or augmented reality applications is a useful step toward smarter forestry and could be further improved.

1. Introduction

Forests provide a multitude of benefits to humans in terms of ecosystem services, such as climate regulation, water supply, timber production, carbon sequestration, and cultural services, including aesthetic benefits and opportunities for recreation and education [1,2]. Understanding their importance is essential for managing and preserving these natural resources in a sustainable way [3,4]. Ecosystem services provision can be influenced by the forest structure, forest management practices, and the conditions of the surrounding environments [5,6]. The provision of these services depends on active and sustainable forest management (SFM) options, which can be technically challenging and of little economic convenience [7]. The concepts of SFM [8] are based on a multifunction approach in forestry and have fostered the use of predictive silvicultural simulations for defining the most suited options. This has led to the development of marteloscopes as a technical and educational tool to enhance understanding and decision-making in forestry.
Marteloscopes originated in France. The term comes from a combination of the French word ‘martelage’, meaning tree selection, and the Greek word ‘skopein’, which means ‘to look’. Together, they convey the idea of ‘examining tree selection closely’. A marteloscope is a designated forest plot where each tree’s position, size, health, and ecological and economic value are precisely measured and tracked over time. It serves as an outdoor classroom, enabling students and forestry professionals to practice innovative forest management techniques [9]. Here, users conduct field exercises, marking trees for selective harvesting using specialized tools or virtual simulations [10,11]. These activities, typically conducted within forest plots of at least one hectare, help users to analyze the effects of interventions on forest structure, biodiversity, stand stability, and timber value based on predefined management goals and tree metric data. The Integrate+ Network project ran by the European Forest Institute (EFI) connects the existing marteloscopes within a European network of 247 sites from 26 countries [12].
To set up a marteloscope, forest operators mark each tree with an exclusive identification number, record its spatial coordinates, and measure its main structural parameters [13]. These data include diameter at breast height (DBH), tree height (TH), tree species, wood quality, and the presence of microhabitats [14,15]. The selection of trees to be felled and those to be left standing generates a summary report containing data on DBH distribution, total basal area, and timber volume before and after tree removal, helping the users to assess the work performed [16]. Traditional manual forest measuring is a time-consuming process, susceptible to various errors [17,18]. Consolidated techniques based on Light Detection and Ranging (LiDAR) sensors and the Internet of Things (IoT) can be applied, enabling the semi-automatic and more precise acquisition of forest structure data [19,20]. LiDAR sensors can be mounted on a variety of platforms, such as drones, airplanes, cars, and satellites, to collect data over large areas in a relatively short time [21]. LiDAR data can be used alone or fused with other data or sensors [22]. Ground-based devices (mobile or fixed), which are “close-range” LiDAR systems, can be used for measuring tree characteristics at the individual or plot level [23,24]. These devices provide highly accurate 3D representations of standing trees and allow for the computation of the DBH, TH, and canopy base height (CBH) [25,26]. Mobile laser scanners (MLSs) are hand-held by an operator [27] who then walks within the forest collecting LiDAR data. Compared to terrestrial laser scanners, MLSs have a shorter scanning range, lower accuracy, and less detailed point clouds, but they provide rapid coverage of large areas and avoid occlusion through movement [27,28]. The simultaneous localization and mapping (SLAM) algorithm further enhances these advantages by simultaneously creating a map and determining the mobile platform’s location in unknown space. Therefore, the use of MLS technology in the forests can be an efficient method for collecting 3D data through the generation of point clouds [29]. MLSs capture high-resolution 3D information that can be useful for creating virtual forests and marteloscopes, becoming an important resource for forest management learning and training [30]. Researchers have increasingly adopted mobile platforms, developing more plugins and software to run their algorithms on MLS-acquired data [31,32]. These tools enable the segmentation of individual trees and the acquisition of all the necessary source data to create a comprehensive forest inventory [33], offering a wide range of functions in forest data analysis and management. These tools utilize advanced data processing methods, geometric calculations, and statistical analysis to extract information on individual trees from forest point cloud data. There is stand-alone software such as 3DForest [34] or LiDAR360 [35], or plugins in CloudCompare such as 3DFin [36]. The latter is a recently developed plugin that automatically segments each detected individual tree, provides the location of each tree, and extracts the main tree biometric variables used in forest inventories such as TH and DBH.
The advancement in sensor and simulation technologies makes digital twins and replicas new geomatic tools bridging between the physical and virtual domains, enabling enhanced monitoring, analysis, and decision-making processes. Digital twins are advanced models that serve as virtual counterparts to physical entities, enabling the virtual simulation of objects and processes [37,38]. These models relate to their real-world counterparts, maintaining accurate and timely reflections of physical states and thus empowering stakeholders by enhancing their ability to make precise predictions and improving their decision-making processes [39,40]. On the other hand, digital replicas do not necessarily require real-time data integration, feedback loops, or the same dynamic interaction as digital twins. They are more static and more often used for simulations [41]. The digital replica concept, combined with MLS-derived forest inventories, provides the ability to represent a real forest in 3D, enabling high-fidelity simulations that accurately reflect actual forest conditions [42]. Indeed, our MLS digital replica captured details of each tree, enabling comprehensive analysis and visualization for smart forest management.
Previous research [43] demonstrated the effectiveness of MLSs for tree inventory in marteloscopes. These MLS data collected in three undersized marteloscopes of 50 m × 50 m plot area (0.25 ha), dominated by Douglas-fir (Pseudotsuga menziesii (Mirb.) Franco), Italian cypress (Cupressus sempervirens L.), and Stone pine (Pinus pinea L.), were processed with LiDAR 360 commercial software. Our study introduces the first complete 3D digital replica of an internationally recognized marteloscope composed on European beech (Fagus sylvatica L.), a deciduous species widely distributed across the Apennine region, making it particularly relevant for educational and training purposes. Comparative analyses of different algorithms, software, or devices in forestry are extensively discussed in the literature [44,45,46,47,48], but here we intended to develop a standardized and replicable workflow using free software, including 3DFin for tree segmentation and single-tree metric extraction and CloudCompare for point cloud processing and visualization, prioritizing replicability and versatility for a forestry tool for both academic and professional forestry applications. The individual identification code assigned to each tree enables one to easily handle and analyze the digital forest stand using 3D point cloud processing software. Therefore, the innovative aspect of our study is not related to methodological advancements in segmentation or classification algorithms. It is rather (i) the spatial scale of application within a 1 ha official marteloscope, (ii) the focus on an important deciduous mountain tree species, and (iii) the use of free software, providing a fully operational digital replica for training and educational purposes related to a “smart forestry” approach. Our study is also contributing to the implementation of digital tools for visualizing forest stand structure based on user decisions, as suggested by [49].
The aims of this study are (i) to create a digital replica of a European beech forest stand surveyed with MLSs; (ii) to assess the differences between MLS and traditional forest measurements in a stand; and (iii) to digitally represent a field-based tree marking and thinning operation within a digital replica marteloscope.

2. Materials and Methods
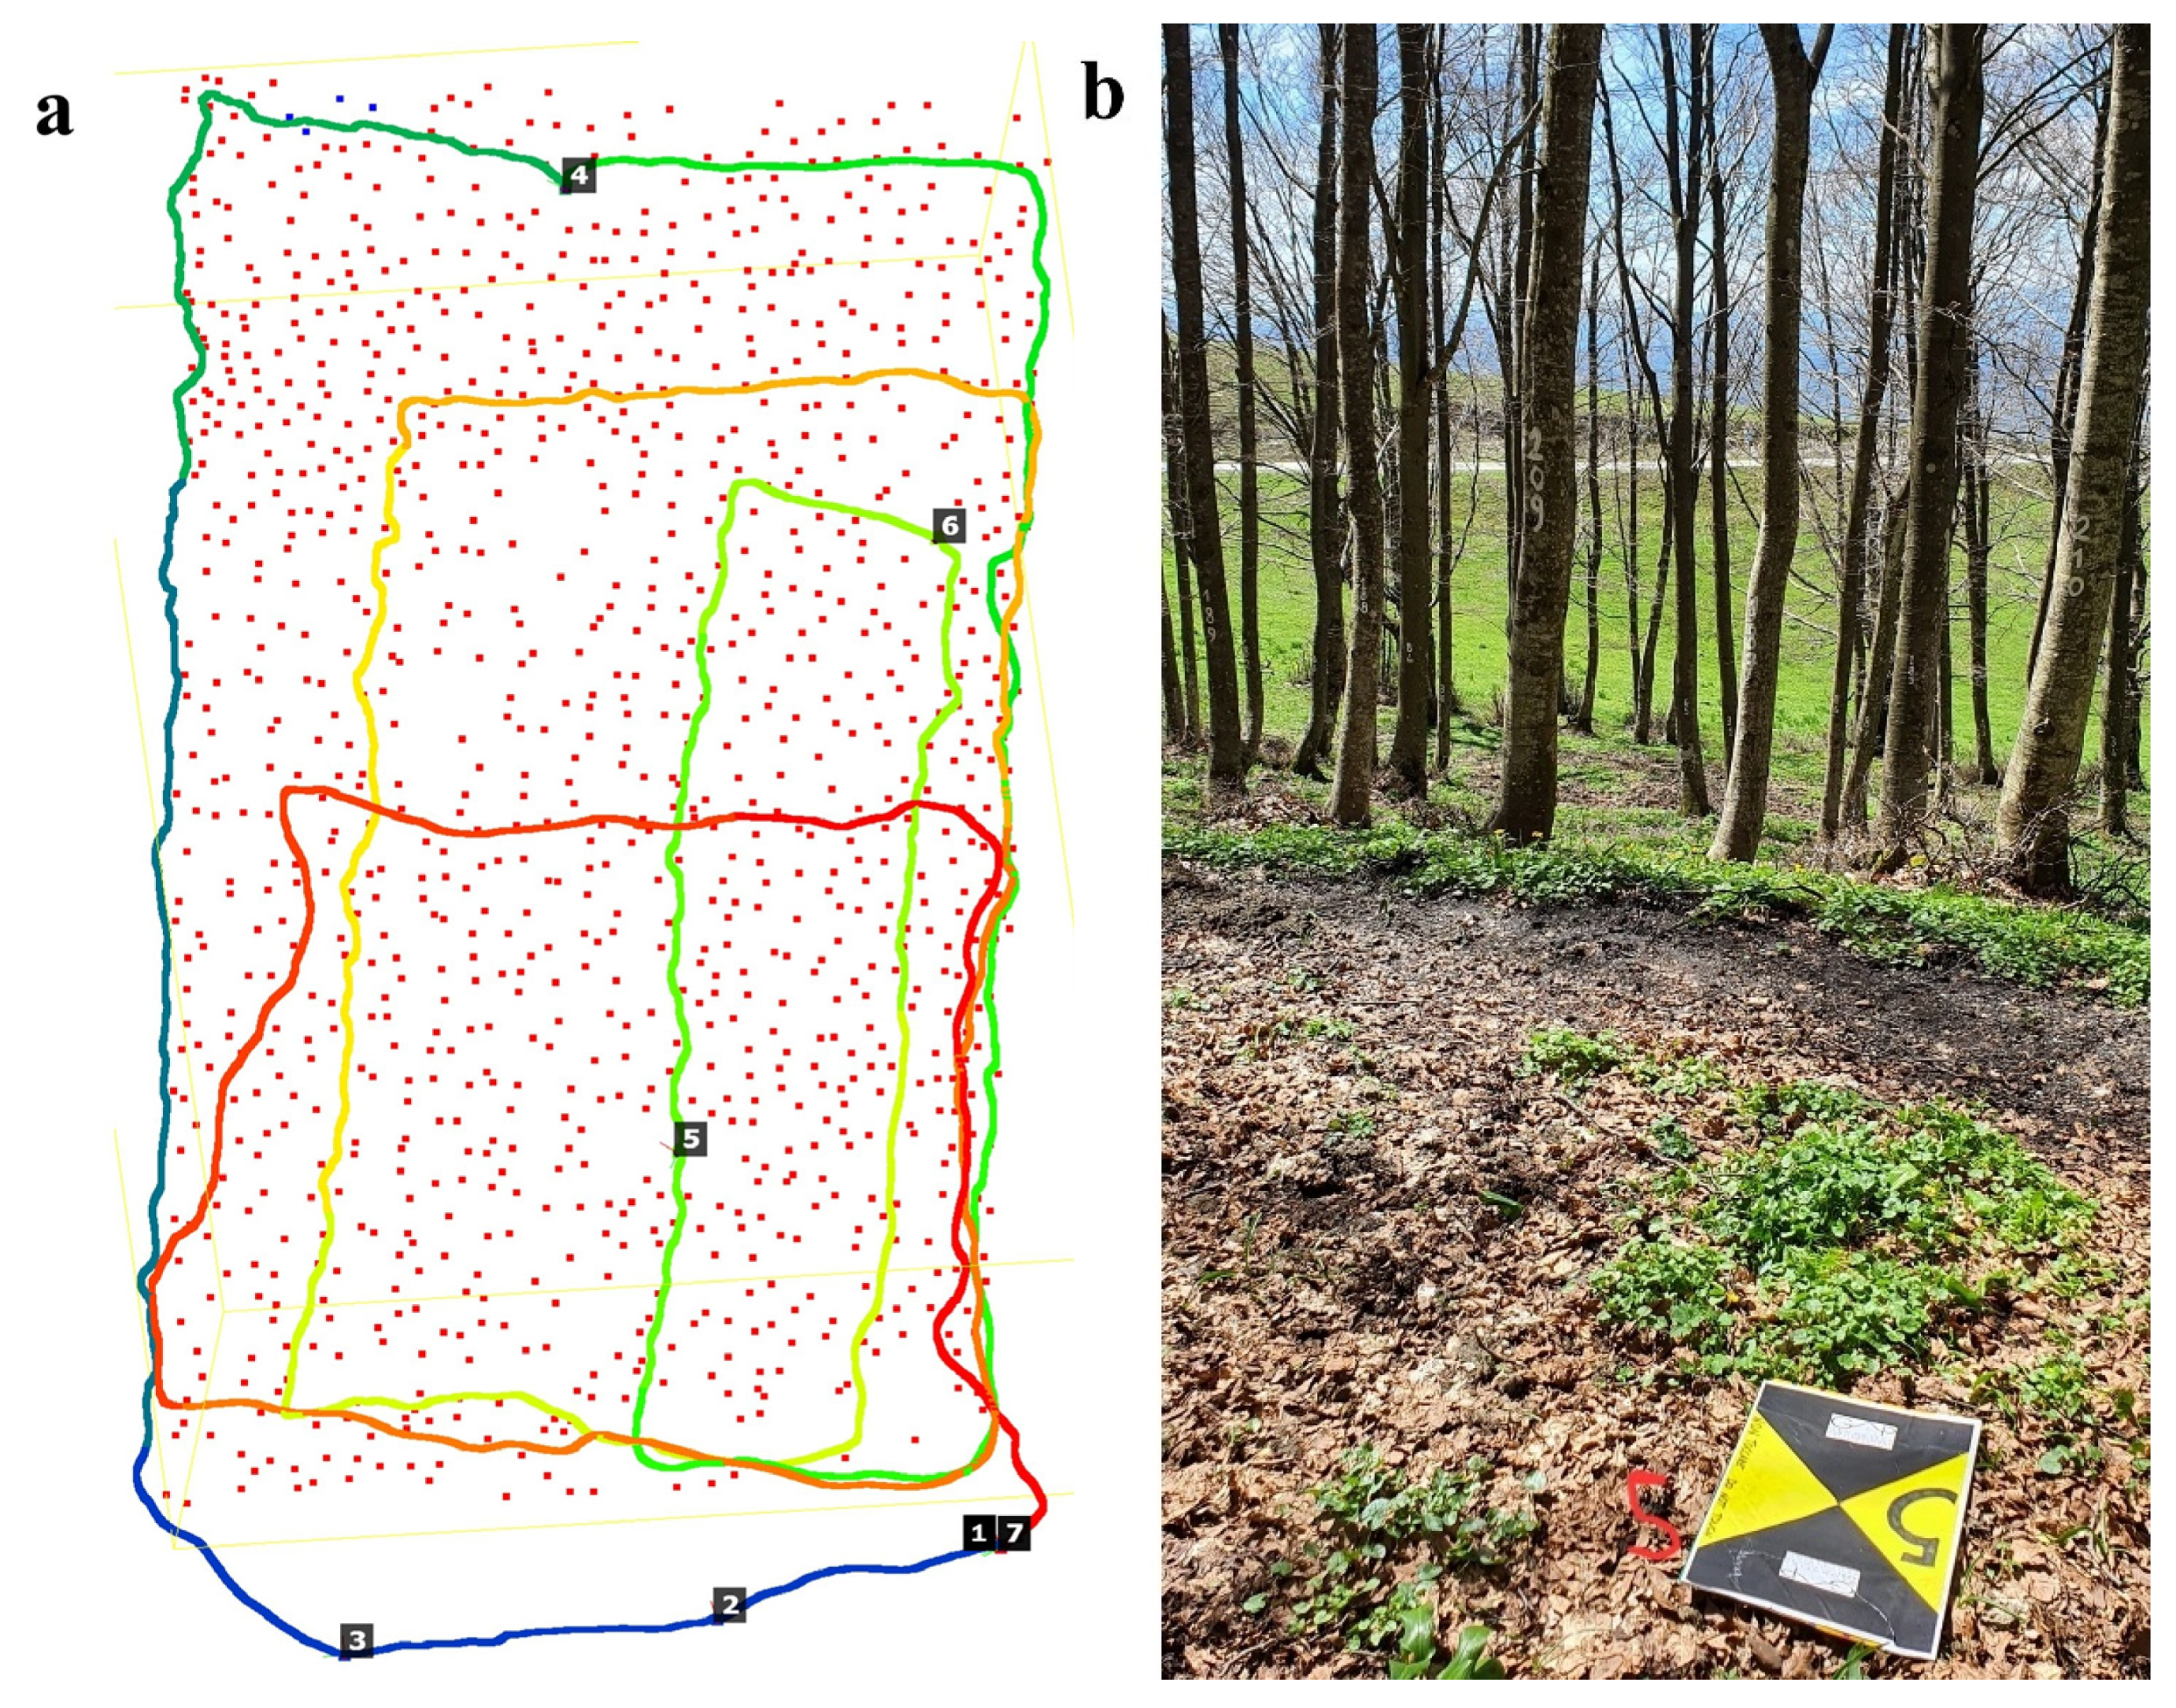
2.1. Study Area

In this study, we selected a one-hectare European beech stand within a larger forest situated on the Mt. Nerone slopes, in the Apennines Mountain range in Central Italy (Figure 1). The stand is an official EFI Integrate+ Network marteloscope [12] (ID number: 215). The stand is located within an elevation ranging of 1265 and 1450 m a.s.l., with an average slope of 35% and a southwest-facing aspect. Mild surface erosion, slight root exposure, and scattered rock outcrops are present in the steeper areas. Forest roads and trails provide good accessibility for logging operations. The stand is a pure beech one-layered forest in advanced conversion from coppice to high forest, with full and regular density providing 100% canopy closure. No seedlings or saplings are present below the canopy. The prevalent cambial age of trees is 60 years, with some former coppice standards reaching 80 years. With a FieldMap system [50] we individually numbered and geolocated all the tree stems and measured their DBH using a digital Bluetooth-operated tree caliper. We also measured the total height of 50 representative trees using a TruPulse laser rangefinder and hypsometer [51]. These selected trees had well-defined, undamaged upper crowns with clearly visible tops, ensuring accurate height measurements. We finally estimated the timber volume through established allometric equations and yield tables used for the National Forest Inventory.

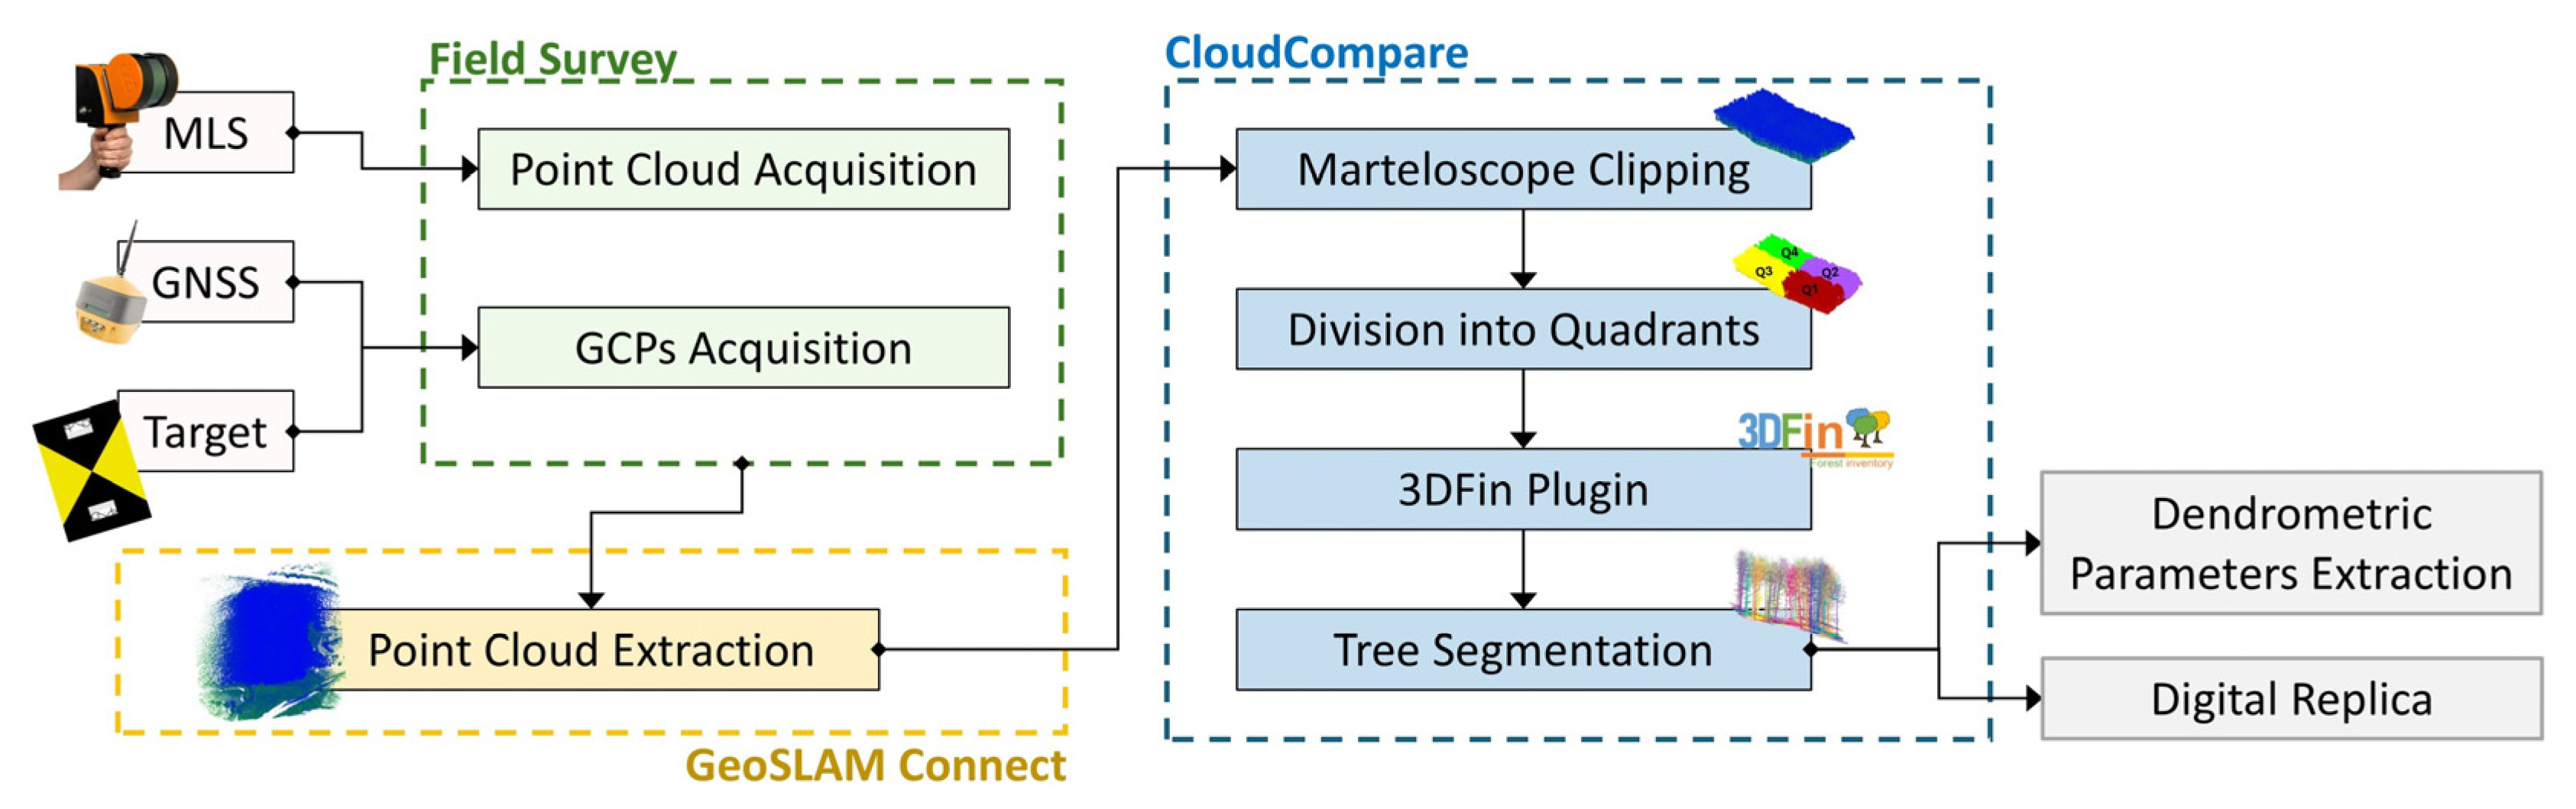
2.2. LiDAR Data Acquisition and Processing

We used the GeoSLAM Zeb Horizon, a hand-held MLS with SLAM technology, to collect the 3D data of the marteloscope. This instrument works at a maximum distance of 100 m, a laser wavelength of 903 nm (near infra-red, NIR), and has an acquisition speed of 300,000 points per second and a relative accuracy of up to 6 mm. We conducted the survey in winter, during the leaf-off vegetation period. We performed the point cloud acquisition through continuous scanning for approximately 25 min covering the boundaries and the entire surface area (1 ha) of the marteloscope along predefined paths (Figure 2a). The path followed a closed-loop configuration, ending at the same point where the acquisition started. We collected a total of 6 ground control points (GCPs) (Figure 2b) and recorded their coordinates using a Topcon HiPer VR GNSS receiver to georeference the MLS point cloud gathered during the survey. We recorded the GCPs by placing the GeoSLAM device on the centre of the targets for 10 s. We divided the marteloscope into four rectangular quadrants (Q1, Q2, Q3, and Q4), each covering an area of 2.500 m2. We calculated the mean slope and the roughness index in each quadrant through the “terra” library [52] in R using the DTM extracted by the MLS point cloud. Using 3DFin, we individually segmented trees for each quadrant. To ensure correct data processing, we further subdivided each quadrant into six smaller plots.
Using GeoSLAM Connect version 2.3, we exported the point cloud acquired with the GeoSLAM Zeb Horizon at the highest quality, ensuring no loss of any points collected during the survey. We used the open-source multiplatform software CloudCompare version 2.13 for the visualization, analysis, processing, and exporting of the marteloscope point cloud. We used the open-source software 3DFin pre-released version 0.2.0rc5 [36] to calculate the tree structural parameters of the trees within the marteloscope. We integrated 3DFin (which is a python-based package) as a plugin in CloudCompare, allowing users to view and export the processed data directly within the software. 3DFin processes point cloud data in .las format and provides a graphical interface with three main windows that allows the user to modify default processing parameters. The “basic window” includes options for normalizing the point cloud and cleaning the noise from the DTM generated. The “advanced window” allows the user to adjust the DBH calculation parameters, such as the expected maximum DBH. Moreover, there is an “expert window” with more specific parameters, such as voxel resolution, for the identification and segmentation of trees in the stripe region. Table A1 details all those parameters and relative settings used for both tree segmentation and tree structure variables extraction in each quadrant. The main parameters modified in 3DFin are “upper_limit” ranging between 3.5 and 4 m, “lower_limit” between 0.7 and 1.8 m, “number_of_iterations” between 2 and 3, “maximum_diameter” between 1 and 2, and “stem_search_diameter” ranging between 1 and 2. With CloudCompare we associated the ID number of each tree with the field ID, enabling an individually segmented tree to be 3D visualized and selected by its specific ID. The workflow summarizes the process of data acquisition, tree structural parameters extraction, and the creation of the digital replica (Figure 3).

2.3. Accuracy Evaluation and Tree Marking Simulation

We computed the bias and root mean square deviation (RMSD) (both absolute and percentage values) of the DBH and TH to verify the difference between values measured digitally and with the traditional survey. The following equations were used:
B i a s = i = 0 n x i x ^ i n ,
R M S D = i = 0 n ( x i x ^ i ) 2 n
R M S D % = R M S D m e a n   ( x ^ i ) × 100
where x i is the tree variables (both DBH and TH) calculated using 3DFin; x ^ i is the correspondent tree values measured in the field; n is the number of values used for the calculation; and m e a n   ( x ^ i ) is the mean value among those obtained in the field.
During an on-site inspection we marked the trees considered either competitors or lacking potential for further quality growth, including dominated trees, low crown insertion, stems with structural defects, dead limbs, etc. We therefore simulated a selective thinning aimed to remove trees with a smaller DBH, poor stem form, or defects, whilst also looking to enhance the growth of promising higher timber quality trees (i.e., 100 candidates per hectare) without excessively opening the canopy cover [53]. These candidate trees showed no defects, damage, or decay. We did not apply an automated algorithm for this selection. We based it on traditional silvicultural principles during a field inspection.

3. Results

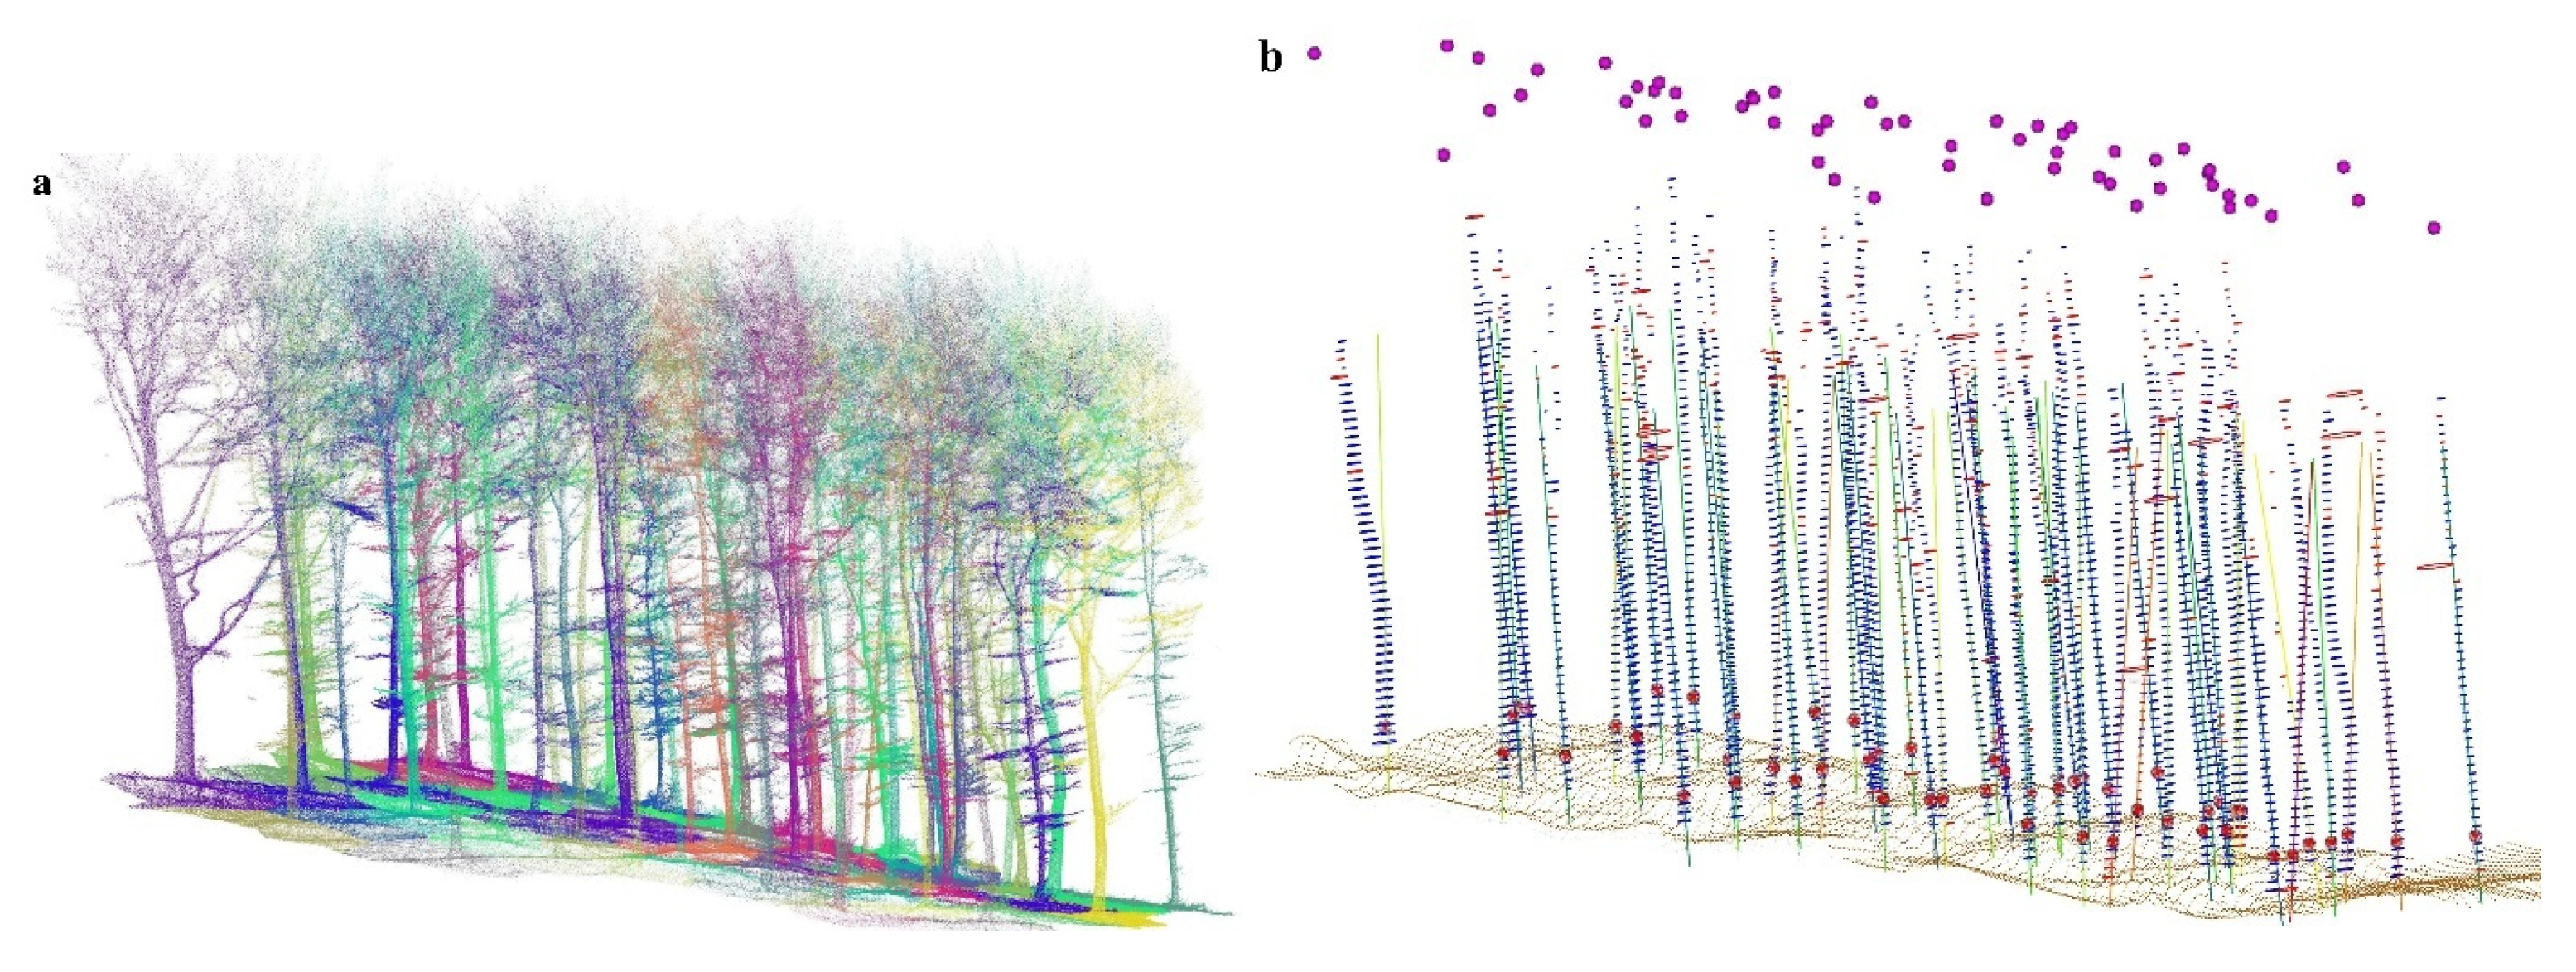
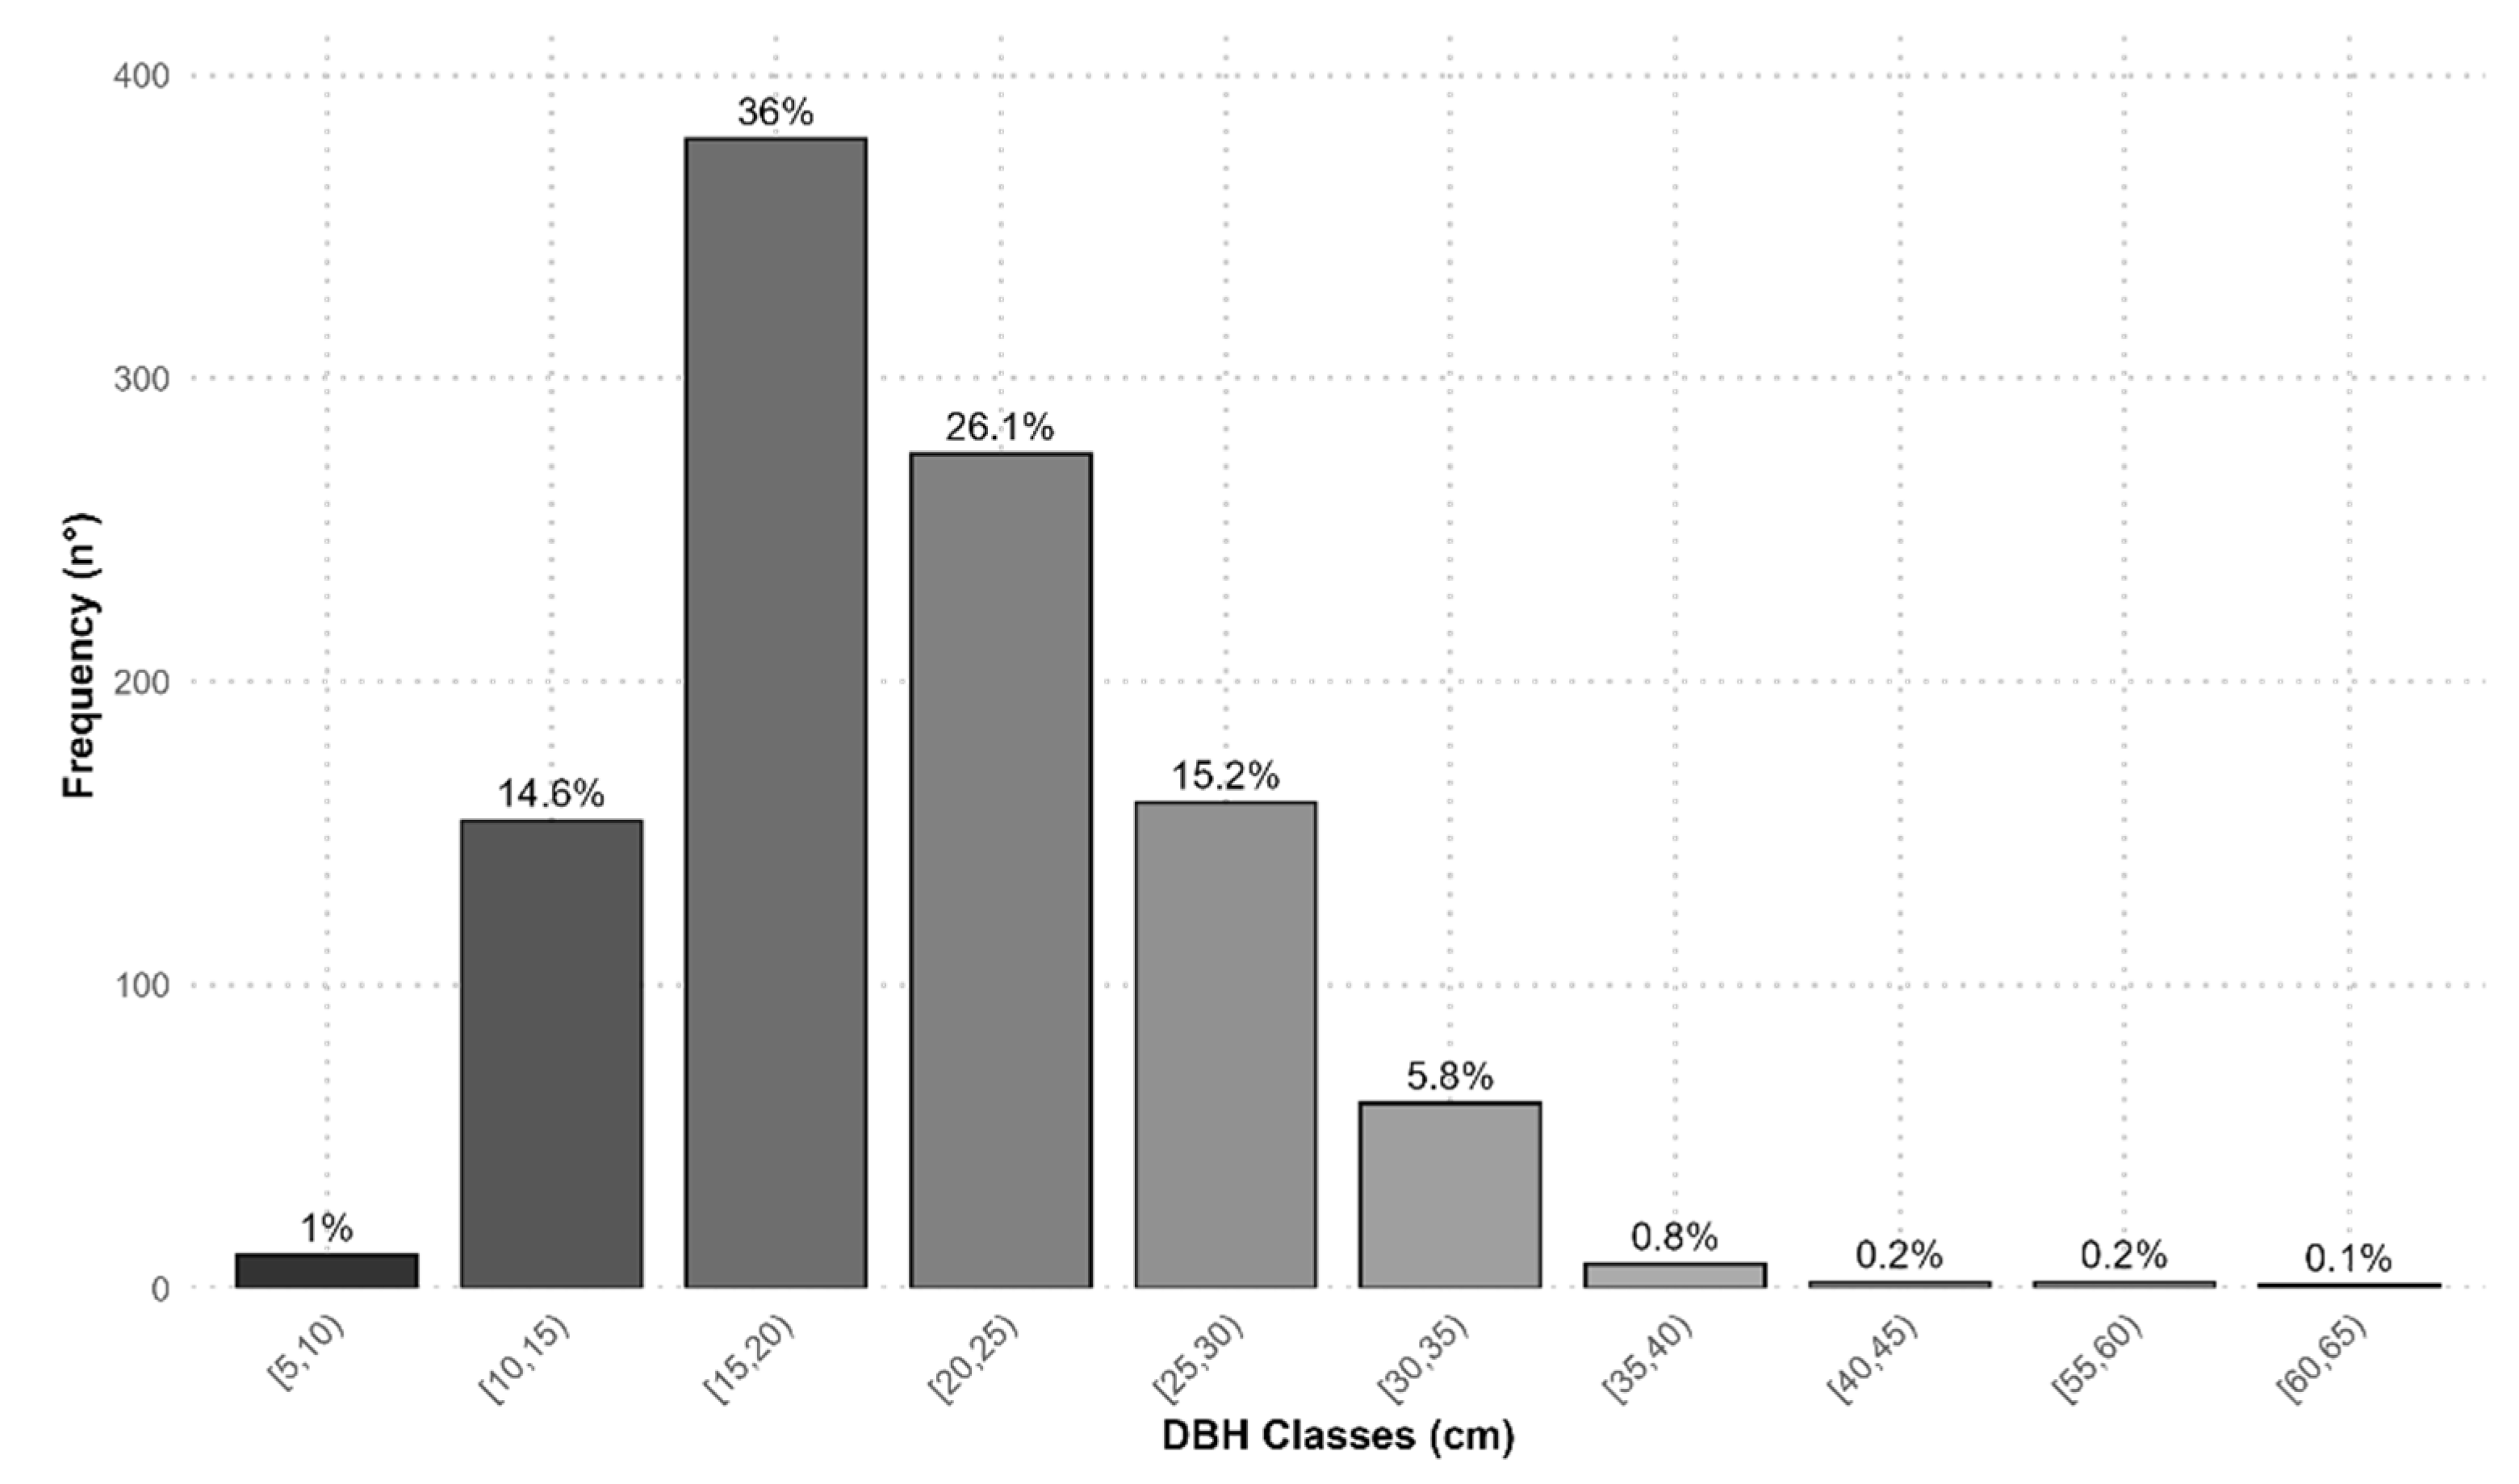
3.1. Tree Structural Parameters Extraction

From the point cloud acquired during the MLS survey (Figure 4), we extracted the tree parameters necessary to complete the marteloscope digital replica. We identified each tree as a distinct point cloud and then we assigned a random RGB colour to all points belonging to that tree, facilitating their visualization and differentiation. For each segmented tree of the marteloscope (Figure 5a), the resulting 3DFin outputs were as follows: DTM, tree axis, tree coordinates, highest crown tip (i.e., TH), and the fitted stem sections (Figure 5b).
With the tree DBH and TH extracted with MLS we obtained the DBH frequency distribution (Figure 6) and the height–diameter curve (Figure 7) of the forest stand. The stand structure exhibits a skewed unimodal Gaussian curve with more than half of the trees falling within the 15–20 cm and 20–25 cm DBH classes, indicating an even-age-like structure. Very few trees show a DBH > 40 cm, highlighting the lack of mature trees in the stand. The height–diameter function, derived from a non-linear regression model, features a parabolic trend typical of dense and homogeneous stands. The curve exhibits a steeper tree height increase with DBH in smaller diameter classes, followed by a gradual tapering of height values as DBH exceeds 25 cm. The marteloscope stand has 1087 trees (per hectare), a DBH average of 20.5 cm, a TH average of 15.3 m, a total basal area of 37.75 m2/ha, and a standing wood volume of 293 m3/ha with an estimated increment of 4.88 m3/ha/year.
The accuracy assessment compared the DBH of all 1087 trees and the TH of the 50 sub-sampled model trees measured in the field, which were assessed both for each quadrant and for the entire marteloscope, with the MLS-related measurements (Table 1). Q1 and Q2 quadrants are located downslope at lower elevation, steepness, and roughness and feature higher DBH and TH values. The slopes in the upper quadrants, particularly Q3, are steeper and with a higher roughness index. The bias values for DBH are all positive, with an overall overestimation of 0.22 cm and the highest values found in Q3 (0.40 cm). On the other hand, the TH values are underestimated, with an overall value of −0.74 m and the lowest ones found in Q2 (−1.70 m). The overall RMSD value for DBH is 2.38 cm (11.74%), whereas the lowest values, both absolute and percentage, are found in Q2 and Q4. The highest absolute values are in Q1, and the highest percentage ones are in Q3. For TH, the lowest RMSD, both absolute and percentage, occurs in Q4 whereas the highest is observed in Q2. The total RMSD for TH is 2.42 m (14%). The findings suggest that metrics derived from MLSs show greater deviations in DBH in Q3, where tree density is higher and the DBH average is smaller. This combination increases the complexity of measurements in both field data collection and point cloud analysis.
In contrast, the RMSD% for TH remains consistently lower in Q3. This is primarily due to the quadrant’s lower mean tree height, which makes the detection of tree tops easier. The reduced height range enhances the accuracy of tree top detection by both traditional and MLS field measurements.

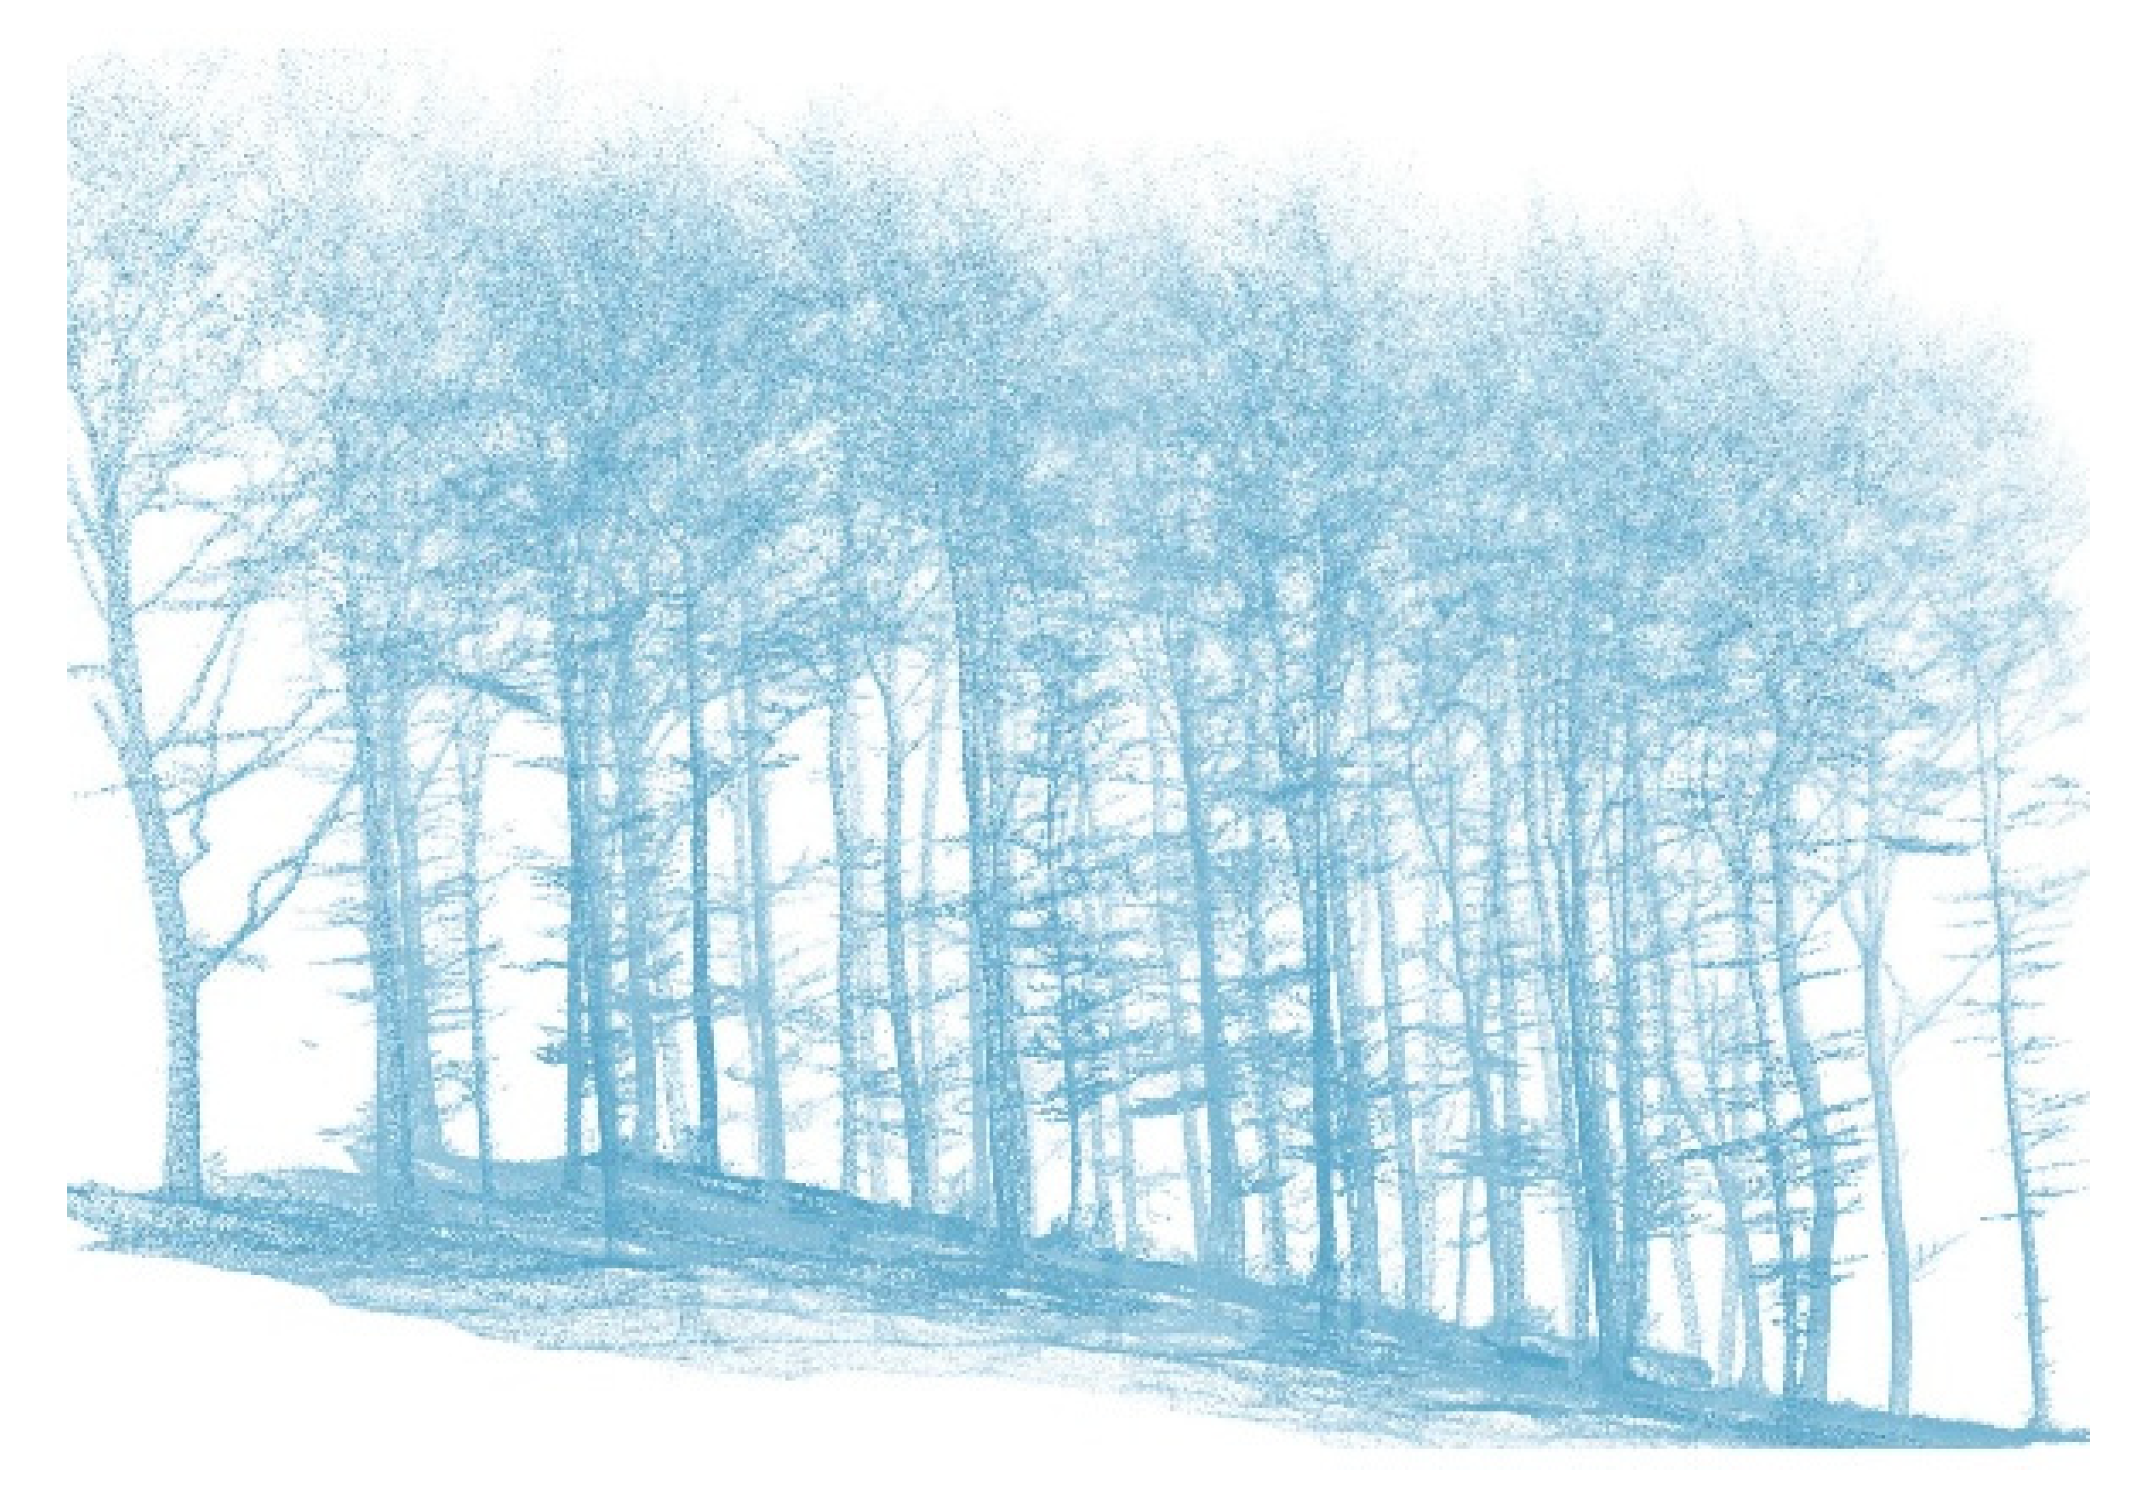
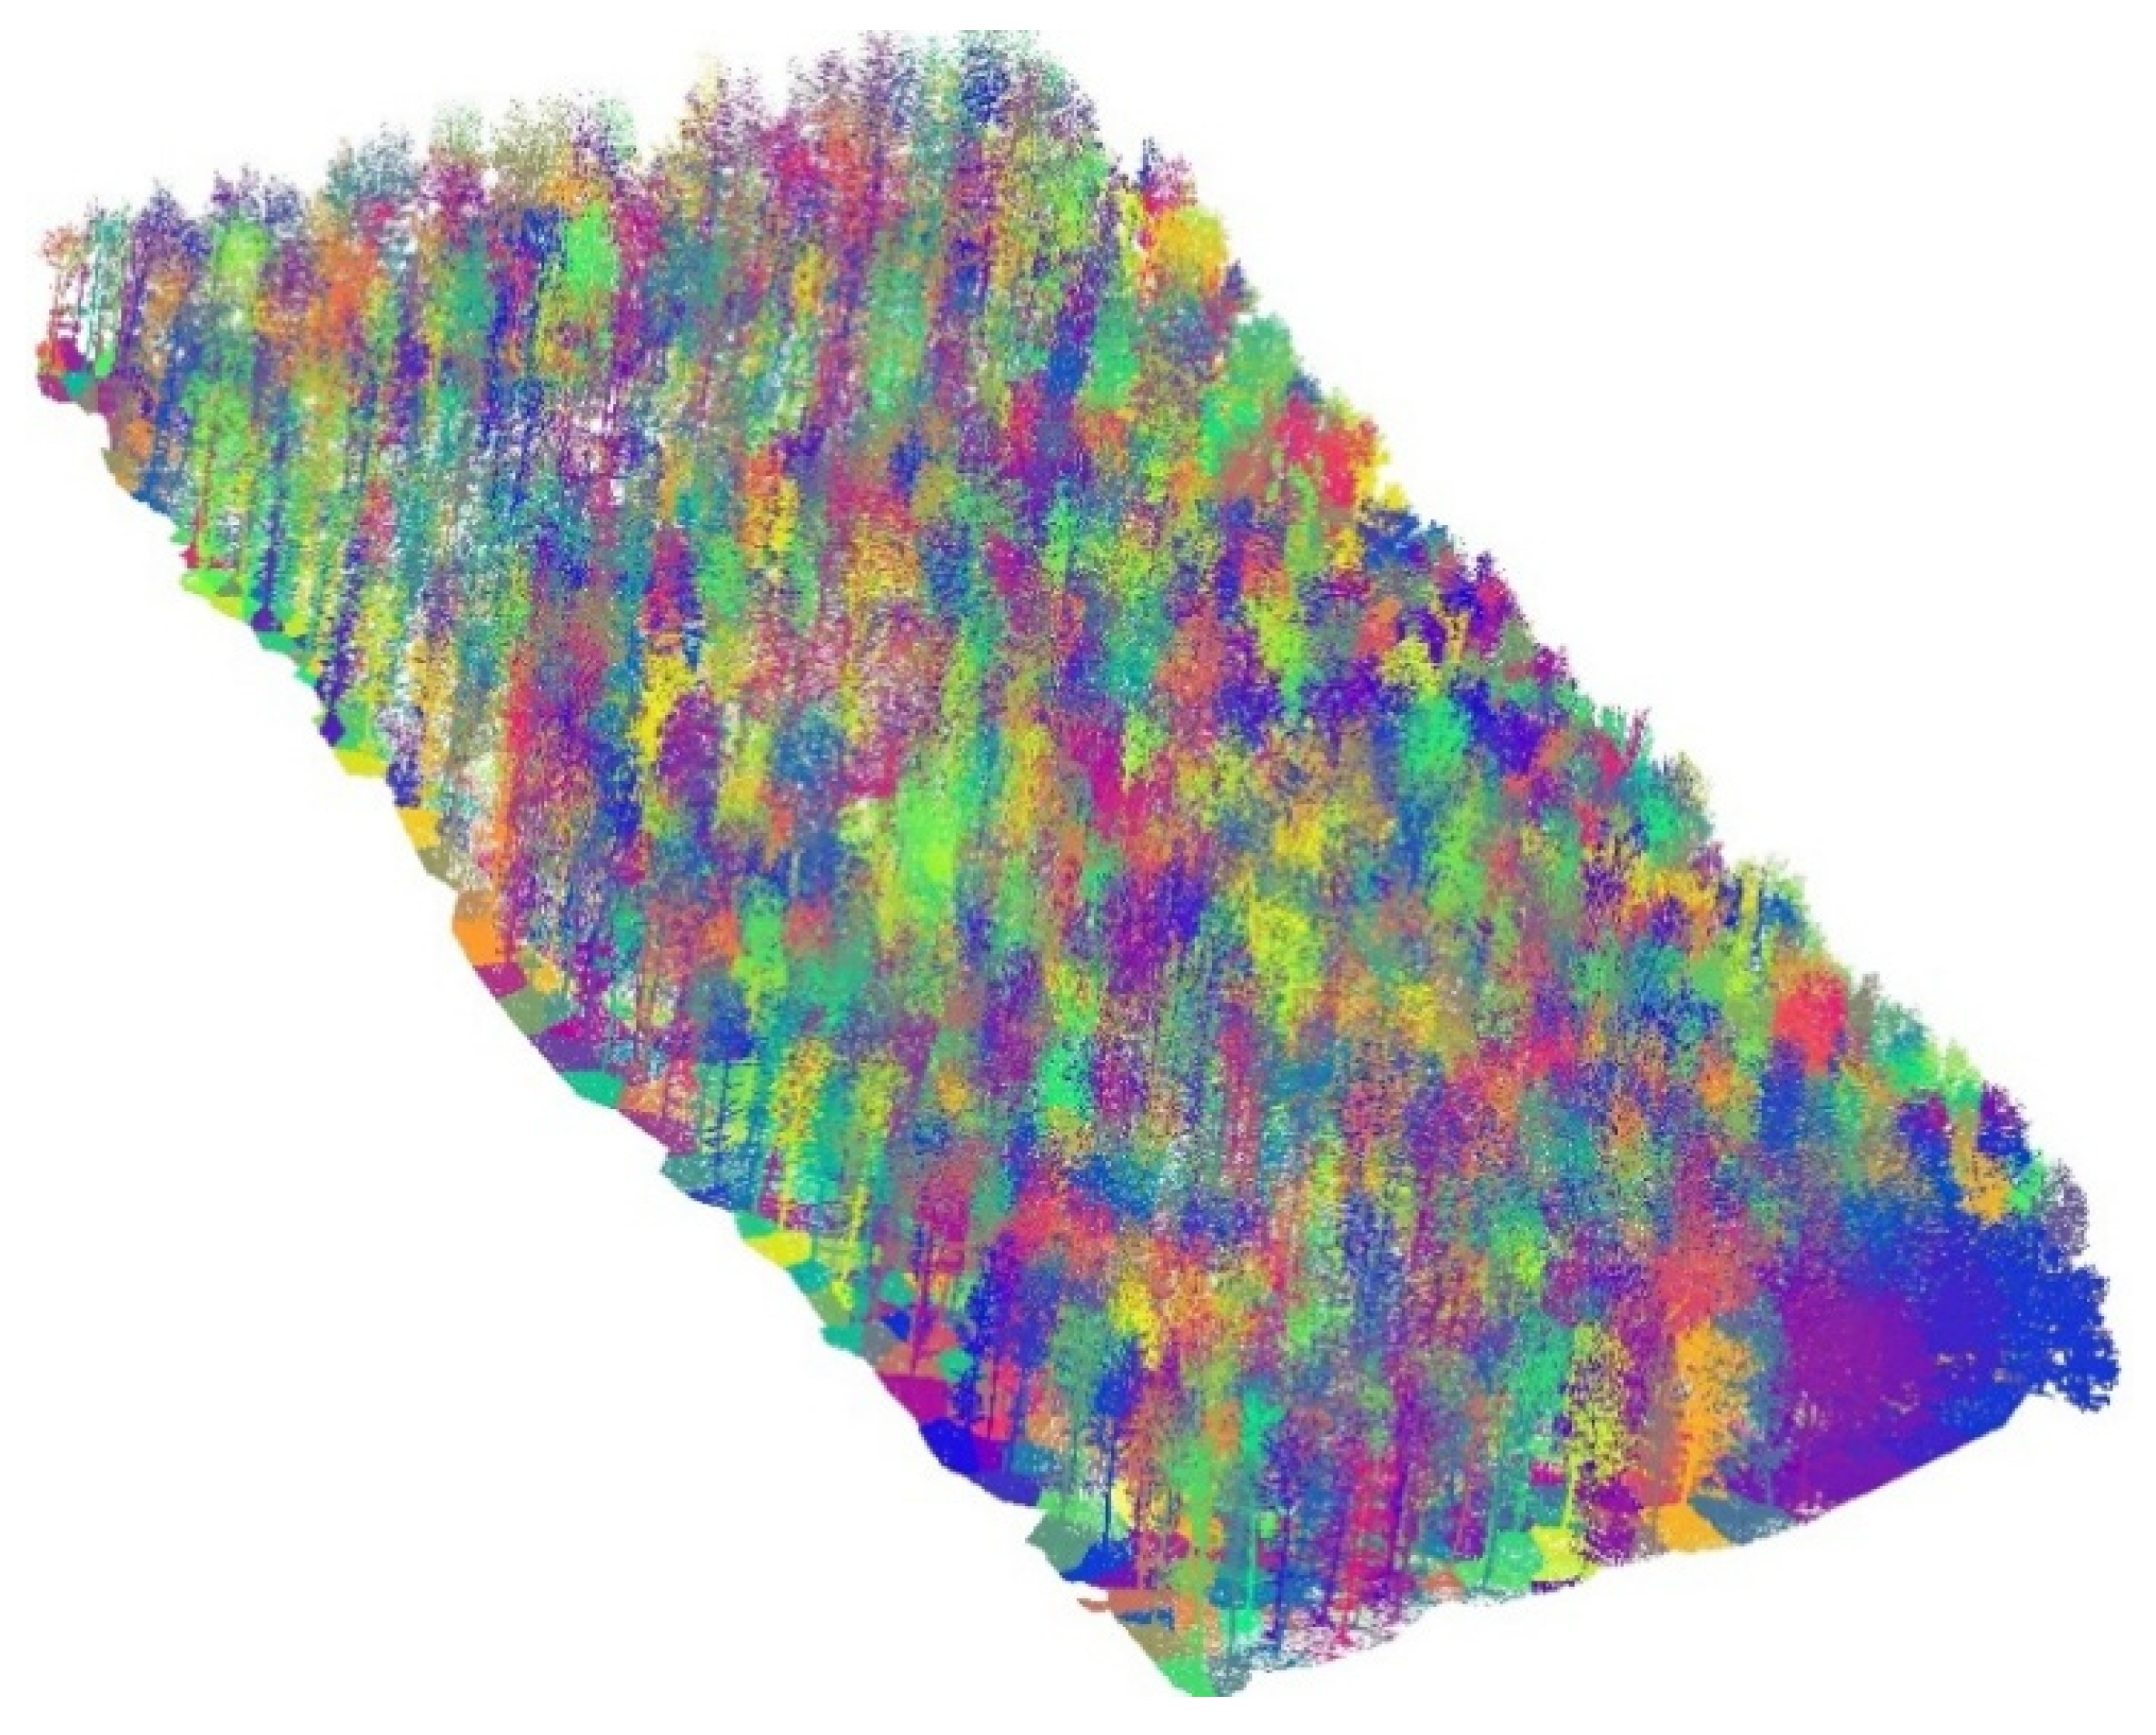
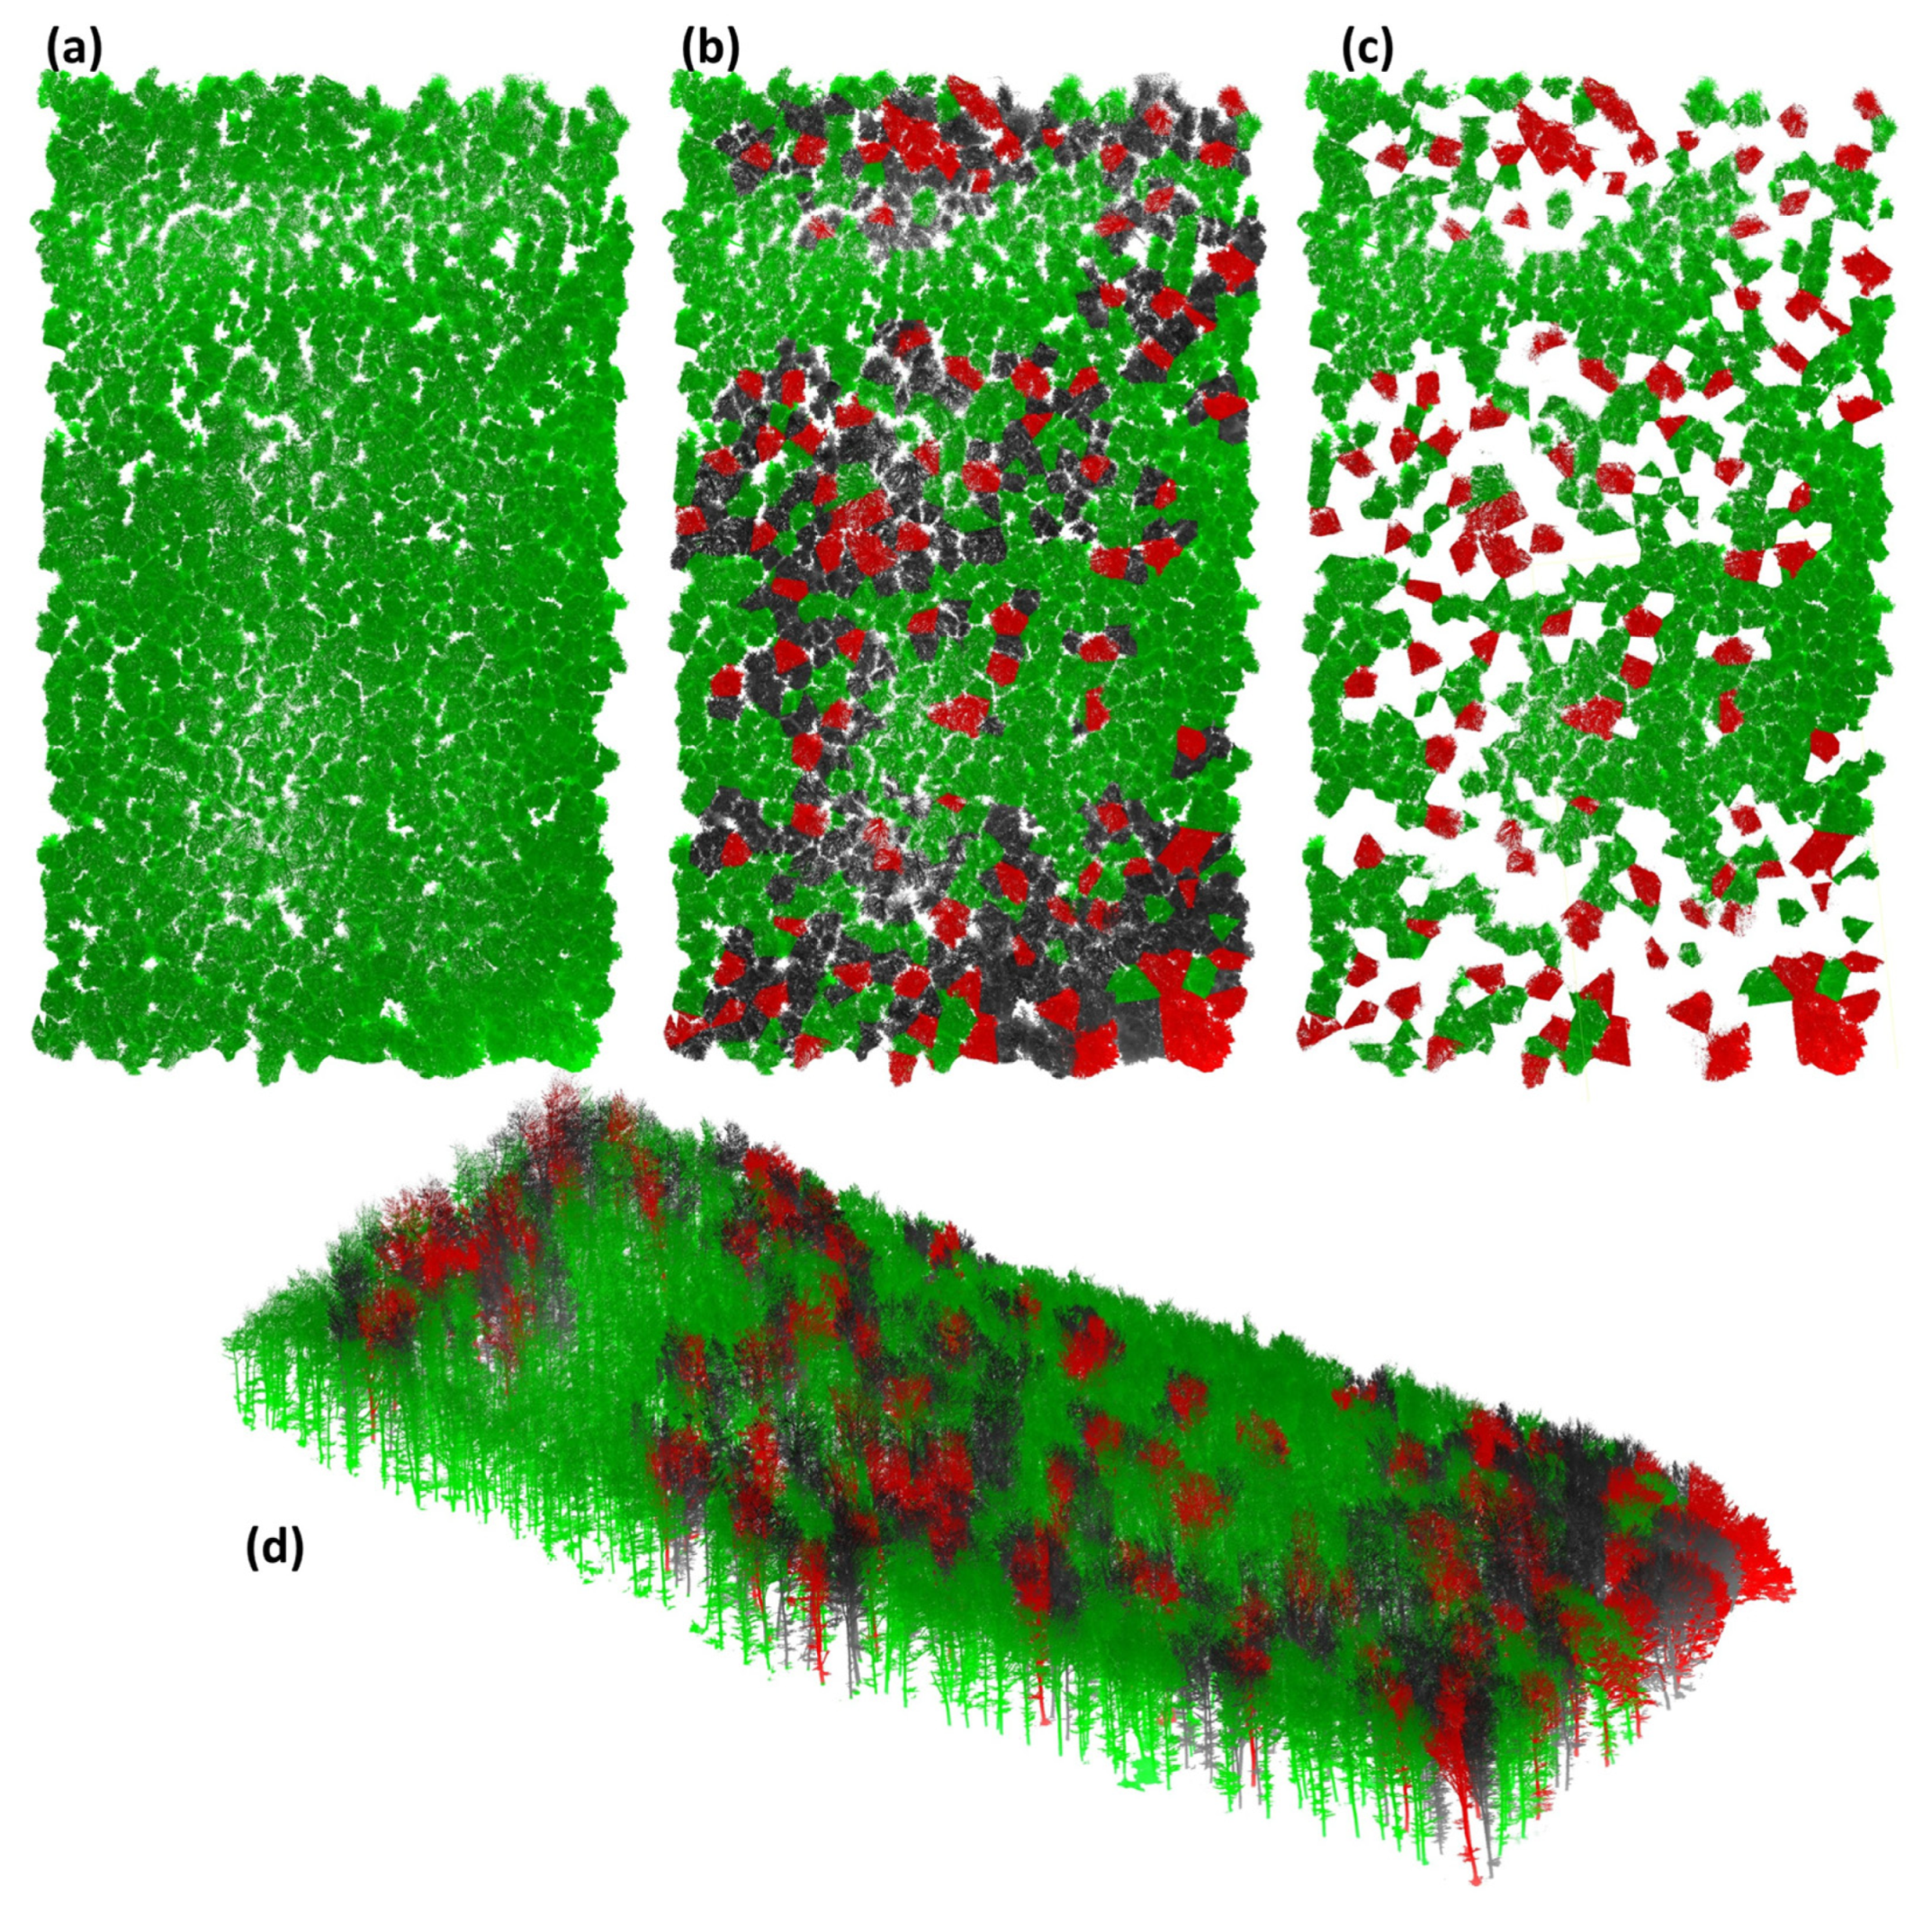
3.2. Three-Dimensional Digital Replica Marteloscope and Tree Marking Visualization

All of the 1087 segmented trees are individually and precisely identified both in the field and in the digital replica (Figure 8), enabling detailed analysis and simulated silvicultural treatments.
Figure 9 shows the sequence of the simulated forest thinning in the digital replica of the marteloscope. The figure shows the following in nadiral view: before the selection (Figure 9a), retention candidates (in red) and trees to be removed (in black) (Figure 9b), and after tree removal (Figure 9c). A side view of 9b is provided (Figure 9d). The digital replica, where each tree is an individual point cloud in CloudCompare, allows us to independently toggle their visibility and role in the simulation. Red dots are trees selected to be retained as future timber quality candidates, whereas black dots are the trees to be removed with the proposed thinning. The effects are immediately visible so that the operator can make some changes if the spatial distribution, of both trees and gaps, does not appear suitable. Field-based tree marking decisions can be replicated within CloudCompare, allowing for detailed 3D visualization of the proposed thinning process.
The effects of the simulated thinning on stand structure and wood volume can be better appreciated in Table 2, where the main tree biometric values are compared before and after the simulated thinning with both the marteloscope digital replica and the traditional field survey data. In general, the thinning simulates the removal of around 30% of trees, basal area, and growing stock volume. The DBH and TH averages are not affected by the thinning. Divergences between the field and digital replica data are not substantial and are only for the growing stock volume where there is an over-estimation of about 10%.

4. Discussion

4.1. Advanced Geomatic Devices for Smart Forestry Applications

LiDAR surveys, in general, guarantee more accurate and objective measurements compared to traditional ground surveying [47]. This is because the values are directly extracted from point clouds, allowing for the replication of various measurements and minimizing the manual errors and subjectivity of data acquisition occurring with traditional techniques. Required expertise and costs for data acquisition and processing are important factors to consider when using point cloud data and automated methods for tree and forest measurements [22].
In our study, some errors in DBH values extracted from the 3DFin plugin are due to the lower detail in certain areas of the point cloud. This derives from disturbed coverage during field data acquisition, hindering the complete scanning of the tree trunk by the laser beam. Even within only one hectare, microtopography influenced the MLS performance, particularly in quadrants Q3 and Q4, where a steeper slope and outcropping rocks raised the roughness indices. The MLS operators in these conditions have greater difficulty in keeping a steady and regular walking step, lowering data recording quality. Noise in the point cloud is also influenced by the laser scanner type; the GeoSLAM Zeb Horizon used in this study provides fewer noise points, with a dispersion lower than 5 cm [27,54] and a good correlation with the DBH values obtained with a TLS system [44]. For further improvement, it is advisable to use additional scans with shorter acquisition time and then combine the datasets in post-processing to achieve a cleaner point cloud. We acknowledge that applying this method to stands with a more complex structure or composition could present greater challenges. In particular, mixed dense forests or stored coppices with multi-stem structures could significantly reduce the digitization accuracy when using MLSs. Dense foliage and overlapping stratified canopies often result in occlusions, leading to inaccuracies in individual stem detection and tree height estimation [55]. In coppiced stumps, very closed stems can increase bias in automatic tree segmentation thus requiring more advanced algorithms to increase accuracy [56]. This is why, so far, most studies focused on mature forests with relatively simple and homogeneous structures. To overcome the limitations of individual sensors in more complex structures data fusion approaches can be applied [22,57], either by integrating data from multiple devices or by combining datasets collected in different seasons (multitemporal data fusion). A recent study emphasized the need to explore alternative approaches including deep learning approaches and the use of shared benchmark forest datasets [58]. The accuracy in tree height measurements depends not only on data quality but also on tree density per hectare. In general, tree height measurements with any kind of hypsometer are commonly biassed, especially in very dense stands with overlapping canopies that hinder a suitable view of the treetops [59]. Therefore, for a more accurate tree height detection it is advisable to conduct the survey when broadleaved trees are leafless. In our study, we mapped trees with the FieldMap system, a time-consuming process not necessarily in line with the requirements of a digital replica. A recently published article [60] introduced a new workflow that automatically detects coloured spray markings on trees using MLSs (GeoSLAM ZEB Horizon) and TLSs (RIEGL VZ-400i). These authors tested several marking types, such as dots, lines, and numbers, and they found that the MLS successfully identified 81 out of 146 total marked trees, but only 4 of the 45 trees marked with dots were recognized, lowering the overall accuracy. In general, the MLS device did not detect small markings (e.g., dots) but it reliably picked up lines and larger painted numbers. If accurately tested, this method could be adopted in future surveys to avoid the manual coupling of each tree with its ID in the field. In terms of tree positions accuracy, in [61] the authors used the GeoSLAM ZEB Horizon across five forest plots with different species composition and, as positional errors, they obtained a sub-20 cm RMSE which is a sufficiently accurate level for forest inventory purposes.
In our study, 3DFin software proved to be reliable in segmenting individual trees in a one-layered pure beech stand. The bias values indicate a slight overestimation of DBH compared to field measurements (0.22 cm), while tree heights are, on average, underestimated compared to field estimates (−0.74 m). The RMSD values indicate an accuracy of 2.38 cm for DBH and of 2.42 m for TH with respect to the total. The bias and RMSD values are consistent with the literature from when researchers applied MLSs in the forestry field due to the occlusion limitations given when using a mobile device. For example, in [62] the authors used an MLS in pure Castanea sativa Mill. stands and they obtained an RMSD of 1.28 cm and a bias of 2.06 cm for the DBH, and 2.15 m and −4.61 m for the TH. In [16], an MLS was used to measure the DBH in 20 forest plots of broadleaved, coniferous, mixed species, or two-layered stands. They reported an RMSE of 2.87 cm and a bias of −0.48 cm for DBH measurements, suggesting a consistent accuracy across different stand types. In [63] the authors, focusing on the inherent stochastic noise in two mature European beech forest plots, used a GeoSLAM ZEB Horizon mobile scanner and a TLS as the ground truth. They found a mean residual of about −0.44 cm, with errors due to the scanning distance, the incidence angle, and the vertical height of the trees. In [64] the authors mounted a GeoSLAM over a quadrupedal robot to improve the collection of forest structural data using different scanning trajectories (circular and star-shaped) across three 200 m2 plots, achieving DBH RMSE values of 2.43 cm and 3.25 cm, respectively.

4.2. Advantages of the Digital Replica Marteloscope

A digital marteloscope is a permanent forestry tool, providing continuous use over time, the possibility to be updated, and the possibility to test silvicultural options. Implementing IoT (Internet of Things) devices in forestry management allows for the updating of digital tree data and related information to assess the forest stand dynamics. The frequency of updating a marteloscope could be approximately every 5 years for mature populations [37], in relation to the growing process of a forest stand [45]. The creation of this digital replica of one EFI Integrate+ Network marteloscope will enable the observation and comparison of information from both traditional and digital methods [17,65]. Recently, an EFI report [66] underlined that marteloscopes allow the integration of key variables such as carbon storage, wood quality, and potential uses, as well as ecological and structural indices that measure ecosystem complexity. This integration could be even improved by including these variables into a digital replica, providing interactive environment which engage users from different background, fostering cross participation and mutual learning.
The visualization of silvicultural simulations can help foresters to better assess the effects of their decisions, considering both the timber economic value and that of the ecosystem services involved. As suggested in [67], forestry strategy games, combined with real-life examples, can be useful educational tools enhancing students’ critical thinking and their approach to sylviculture. Training programmes with direct simulation engagement, like the digital replica, can increase students’ awareness to sustainable forest management.
In this study, the forest 3D representation and the entire workflow was applied to a field-based selective thinning. However, it could also be adapted to forest regeneration process, such as shelterwood systems, defining, for instance, the space needed for seedlings and saplings after simulated partial harvesting. In addition, sharing the visualization of different management options would increase the involvement of stakeholders and the non-technical public, providing valuable feedback and boosting social engagement in forest management [37].

5. Conclusions and Future Directions

In this study, we used an MLS device to assist and train forestry operators by creating a digital replica of an official European marteloscope, enabling precise measurements and facilitating the 3D visualization of tree marking and thinning simulations. In a one-layered beech forest, we proved that 3DFin is reliable and that the marteloscope digital replica could be another step toward a “smart” forestry practice. Sustainable forest management, based on a multifunctional approach, needs appropriate assessments to balance ecological, economic, and social opportunities. In this context, advances in information technology and the IoT significantly improved data collection and analysis, providing new options to optimize forestry practices and support informed decision-making. Data from satellites, airborne UAVs, and terrestrial platforms will enable more accurate forest inventories and monitoring. Also, the use of artificial intelligence and deep learning will make the various steps more automatic [68,69], enhancing the ability to work with complex forest-related datasets. After the COVID-19 pandemic, which dramatically increased online and blended learning, researchers have developed several projects to create tools based on virtual (VR) or augmented reality (AR) technology, advancing academic e-learning for forest management. However, the VR/AR integration in forestry still faces several significant challenges [30]. AR and VR can be applied in a forestry context as visual representation of field decisions, facilitating their technical assessment [30,70]. In the literature [71], some authors applied AR technologies to enhance productivity and safety using heavy machinery in forestry. In [72] they employed AR technologies in natural environments for educational case studies, enabling interactions with trees and leaves and revealing aspects “hidden” to the human eye. The potential to apply digital age concepts and technologies to the forestry sector expands the possibilities for using 3D data [65,73], although challenges persist in collecting MLS data in forest environments. Addressing these challenges will require further research into optimization techniques for real-time visualization, as well as interdisciplinary collaboration to refine VR/AR applications for forestry professionals. Moreover, the transition to VR/AR forestry environments introduces a paradigm shift for users accustomed to traditional hands-on approaches. While VR/AR-based visualization methods are of great potential for forestry, their use has not increased as expected [30,70].

Author Contributions

Conceptualization, M.B., R.P., C.U. and A.V.; methodology, M.B. and R.P.; software, M.B., L.L. and R.P.; investigation, M.B., E.T., L.L. and A.V.; data curation, M.B., E.T., R.P. and L.L.; writing—original draft preparation, M.B.; writing—review and editing, M.B., R.P., C.U. and A.V.; supervision, R.P., C.U. and A.V.; funding acquisition, C.U. All authors have read and agreed to the published version of the manuscript.

Funding

This work was supported by the EU Rural Development Programme—PSR Marche 2014/2020 Measure 16.1—Action 2—grant number BIOSEIFORTE—ID 41339.

Data Availability Statement

The data presented in this study are available on request from the corresponding author.

Acknowledgments

We would like to sincerely thank everyone who contributed to the data collection and fieldwork for this project. We especially want to recognize Veronica Pazzaglia, Andrea Cameli, Lorena Baglioni, Francesco Malandra, Massimo Prosdocimi, Stefano Chiappini, and our mascot Django, for their exceptional support during the field activities. Additionally, we are grateful to Consorzio Forestale del Monte Nerone, Università Agraria di Serravalle di Carda, and Unione Montana del Catria e Nerone for their support, which played a significant role in completing this study.

Conflicts of Interest

The authors declare no conflicts of interest.

Appendix A

Table A1. Parameters used in 3DFin to segment each tree and to extract the dendrometric data in each quadrant.
3DFin WindowVariableQ1Q2Q3Q4
Baseupper_limit4443.5
lower_limit1.81.81.80.7
number_of_iterations3322
Advancedmaximum_diameter2111
stem_search_diameter2212
minimum_height0.30.30.30.3
maximum_height25252525
section_len0.20.20.20.2
section_wid0.050.050.050.05
Expertres_xy_stripe0.020.020.020.02
res_z_stripe0.020.020.020.02
number_of_points1000100010001000
verticality_scale_stripe0.10.10.10.1
verticality_thresh_stripe0.70.70.70.7
height_range0.70.70.70.7
res_xy0.0350.0350.0350.035
res_z0.0350.0350.0350.035
minimum_points200200200200
verticality_scale_stems0.10.10.10.1
verticality_thresh_stem0.70.70.70.7
maximum_d15151515
distance_to_axis1.51.51.51.5
res_heights0.030.030.030.03
maximum_dev25252525
number_points_section15301020
diameter_proportion0.50.50.50.5
minimum_diameter0.060.040.050.06
point_threshold5555
point_distance0.020.020.020.02
number_sectors16161616
m_number_sectors9689
circle_width0.020.020.020.02
circa200200200200
p_interval0.010.010.010.01
axis_downstep0.50.50.50.5
axis_upstep10101010
res_ground0.0350.0350.030.02
min_points_ground2222
res_cloth0.050.050.050.05

References

  1. Kreye, M.M.; Adams, D.C.; Ghimire, R.; Morse, W.; Stein, T.; Bowker, J.M. Forest Ecosystem Services: Cultural Values. In Trees At Work: United States Department of Agriculture Forest Service Southern Research Station General Technical Report SRS-226 November 2017 Economic Accounting for Forest Ecosystem Services in the US South; Southern Research Station: Asheville, NC, USA, 2017. [Google Scholar]
  2. Kosanic, A.; Petzold, J. A Systematic Review of Cultural Ecosystem Services and Human Wellbeing. Ecosyst. Serv. 2020, 45, 101168. [Google Scholar] [CrossRef]
  3. Baskent, E.Z. A Framework for Characterizing and Regulating Ecosystem Services in a Management Planning Context. Forests 2020, 11, 102. [Google Scholar] [CrossRef]
  4. Jenkins, M.; Schaap, B. Forest Ecosystem Services. Backgr. Anal. Study 2018, 2–41. [Google Scholar]
  5. Ali, A. Linking Forest Ecosystem Processes, Functions and Services under Integrative Social–Ecological Research Agenda: Current Knowledge and Perspectives. Sci. Total Environ. 2023, 892, 164768. [Google Scholar] [CrossRef]
  6. Harrison, P.A.; Berry, P.M.; Simpson, G.; Haslett, J.R.; Blicharska, M.; Bucur, M.; Dunford, R.; Egoh, B.; Garcia-Llorente, M.; Geamănă, N.; et al. Linkages between Biodiversity Attributes and Ecosystem Services: A Systematic Review. Ecosyst. Serv. 2014, 9, 191–203. [Google Scholar] [CrossRef]
  7. Sforza, F.; Ziesak, M.; Lingua, E.; Starke, M. Optimizing Tree Selection for Planning Cable Yarding Operations: A Multi-Objective Modelling Approach. For. Ecol. Manag. 2025, 578, 122489. [Google Scholar] [CrossRef]
  8. Sustainable Forest Management—ForestEurope 1998. Available online: https://foresteurope.org/workstreams/sustainable-forest-management/ (accessed on 22 April 2025).
  9. John, M.; Wirth, K.; Kaufmann, A.; Ertelt, H.; Frei, T. Forest Deliberations: Marteloscopes as Sites of Encounter between Climate Activists and Forest Managers. For. Policy Econ. 2024, 169, 103356. [Google Scholar] [CrossRef]
  10. Cosyns, H.; Kraus, D.; Krumm, F.; Schulz, T.; Pyttel, P. Reconciling the Tradeoff between Economic and Ecological Objectives in Habitat-Tree Selection: A Comparison between Students, Foresters, and Forestry Trainers. For. Sci. 2019, 65, 223–234. [Google Scholar] [CrossRef]
  11. Pommerening, A.; Pallarés Ramos, C.; Kędziora, W.; Haufe, J.; Stoyan, D. Rating Experiments in Forestry: How Much Agreement Is There in Tree Marking? PLoS ONE 2018, 13, e0194747. [Google Scholar] [CrossRef]
  12. EFI—Integrated+ Network. Available online: http://iplus.efi.int/marteloscopes-data.html (accessed on 8 December 2024).
  13. Kraus, D.; Schuck, A.; Krumm, F.; Bütler, R.; Cosyns, H.; Courbaud, B.; Larrieu, L.; Mergner, U.; Pyttel, P.; Varis, S. Seeing Is Building Better Understanding-the Integrate+ Marteloscopes; HAL Open Science Location: Lyon, France, 2018. [Google Scholar]
  14. Kadavý, J.; Kneiflová, J.; Kneifl, M.; Uherková, B. Using Marteloscope in Selection Forestry–Study Case from Pokojná Hora’ (Czech Republic). J. For. Sci. 2024, 70, 447–457. [Google Scholar] [CrossRef]
  15. Larrieu, L.; Paillet, Y.; Winter, S.; Bütler, R.; Kraus, D.; Krumm, F.; Lachat, T.; Michel, A.K.; Regnery, B.; Vandekerkhove, K. Tree Related Microhabitats in Temperate and Mediterranean European Forests: A Hierarchical Typology for Inventory Standardization. Ecol. Indic. 2018, 84, 194–207. [Google Scholar] [CrossRef]
  16. Kruse, L.; Erefur, C.; Westin, J.; Ersson, B.T.; Pommerening, A. Towards a Benchmark of National Training Requirements for Continuous Cover Forestry (CCF) in Sweden. Trees For. People 2023, 12, 100391. [Google Scholar] [CrossRef]
  17. Gollob, C.; Ritter, T.; Nothdurft, A. Forest Inventory with Long Range and High-Speed Personal Laser Scanning (PLS) and Simultaneous Localization and Mapping (SLAM) Technology. Remote Sens. 2020, 12, 1509. [Google Scholar] [CrossRef]
  18. Freißmuth, L.; Mattamala, M.; Chebrolu, N.; Schaefer, S.; Leutenegger, S.; Fallon, M. Online Tree Reconstruction and Forest Inventory on a Mobile Robotic System. arXiv 2024, arXiv:2403.17622. [Google Scholar]
  19. Coops, N.C.; Tompalski, P.; Goodbody, T.R.H.; Queinnec, M.; Luther, J.E.; Bolton, D.K.; White, J.C.; Wulder, M.A.; van Lier, O.R.; Hermosilla, T. Modelling Lidar-Derived Estimates of Forest Attributes over Space and Time: A Review of Approaches and Future Trends. Remote Sens. Environ. 2021, 260, 112477. [Google Scholar] [CrossRef]
  20. Singh, R.; Gehlot, A.; Vaseem Akram, S.; Kumar Thakur, A.; Buddhi, D.; Kumar Das, P. Forest 4.0: Digitalization of Forest Using the Internet of Things (IoT). J. King Saud. Univ.-Comput. Inf. Sci. 2022, 34, 5587–5601. [Google Scholar] [CrossRef]
  21. Wulder, M.A.; White, J.C.; Nelson, R.F.; Næsset, E.; Ørka, H.O.; Coops, N.C.; Hilker, T.; Bater, C.W.; Gobakken, T. Lidar Sampling for Large-Area Forest Characterization: A Review. Remote Sens. Environ. 2012, 121, 196–209. [Google Scholar] [CrossRef]
  22. Balestra, M.; Marselis, S.; Sankey, T.T.; Cabo, C.; Liang, X.; Mokroš, M.; Peng, X.; Singh, A.; Stereńczak, K.; Vega, C. LiDAR Data Fusion to Improve Forest Attribute Estimates: A Review. Curr. For. Rep. 2024, 10, 281–297. [Google Scholar] [CrossRef]
  23. Kaartinen, E.; Dunphy, K.; Sadhu, A. LiDAR-Based Structural Health Monitoring: Applications in Civil Infrastructure Systems. Sensors 2022, 22, 4610. [Google Scholar] [CrossRef]
  24. Balestra, M.; Tonelli, E.; Vitali, A.; Urbinati, C.; Frontoni, E.; Pierdicca, R. Geomatic Data Fusion for 3D Tree Modeling: The Case Study of Monumental Chestnut Trees. Remote Sens. 2023, 15, 2197. [Google Scholar] [CrossRef]
  25. Herrero-Huerta, M.; Lindenbergh, R.; Rodríguez-Gonzálvez, P. Automatic Tree Parameter Extraction by a Mobile LiDAR System in an Urban Context. PLoS ONE 2018, 13, e0196004. [Google Scholar] [CrossRef] [PubMed]
  26. Stefanidou, A.; Gitas, I.Z.; Korhonen, L.; Stavrakoudis, D.; Georgopoulos, N. LiDAR-Based Estimates of Canopy Base Height for a Dense Uneven-Aged Structured Forest. Remote Sens. 2020, 12, 1565. [Google Scholar] [CrossRef]
  27. Di Stefano, F.; Chiappini, S.; Gorreja, A.; Balestra, M.; Pierdicca, R. Mobile 3D Scan LiDAR: A Literature Review. Geomat. Nat. Hazards Risk 2021, 12, 2387–2429. [Google Scholar] [CrossRef]
  28. Dash, J.; Pont, D.; Brownlie, R.; Dunningham, A.; Watt, M.; Pearse, G. Remote Sensing for Precision Forestry. N. Z. J. For. 2016, 60, 15–24. [Google Scholar]
  29. Čeňava, J.; Tuček, J.; Chudá, J.; Koreň, M. Mobile Laser Scanning Data Collected under a Forest Canopy with GNSS/INS-Positioned Systems: Possibilities of Processability Improvements. Remote Sens. 2024, 16, 1734. [Google Scholar] [CrossRef]
  30. Murtiyoso, A.; Holm, S.; Riihimäki, H.; Krucher, A.; Griess, H.; Griess, V.C.; Schweier, J. Virtual Forests: A Review on Emerging Questions in the Use and Application of 3D Data in Forestry. Int. J. For. Eng. 2024, 35, 29–42. [Google Scholar] [CrossRef]
  31. Liang, X.; Hyyppä, J.; Kaartinen, H.; Lehtomäki, M.; Pyörälä, J.; Pfeifer, N.; Holopainen, M.; Brolly, G.; Francesco, P.; Hackenberg, J. International Benchmarking of Terrestrial Laser Scanning Approaches for Forest Inventories. ISPRS J. Photogramm. Remote Sens. 2018, 144, 137–179. [Google Scholar] [CrossRef]
  32. Bienert, A.; Georgi, L.; Kunz, M.; Maas, H.-G.; Von Oheimb, G. Comparison and Combination of Mobile and Terrestrial Laser Scanning for Natural Forest Inventories. Forests 2018, 9, 395. [Google Scholar] [CrossRef]
  33. Aijazi, A.K.; Checchin, P.; Malaterre, L.; Trassoudaine, L. Automatic Detection and Parameter Estimation of Trees for Forest Inventory Applications Using 3D Terrestrial LiDAR. Remote Sens. 2017, 9, 946. [Google Scholar] [CrossRef]
  34. Krůček, M.; Král, K.; Cushman, K.C.; Missarov, A.; Kellner, J.R. Supervised Segmentation of Ultra-High-Density Drone Lidar for Large-Area Mapping of Individual Trees. Remote Sens. 2020, 12, 3260. [Google Scholar] [CrossRef]
  35. LiDAR360. Available online: https://www.greenvalleyintl.com/LiDAR360 (accessed on 19 December 2024).
  36. Laino, D.; Cabo, C.; Prendes, C.; Janvier, R.; Ordonez, C.; Nikonovas, T.; Doerr, S.; Santin, C. 3DFin: A Software for Automated 3D Forest Inventories from Terrestrial Point Clouds. For. An. Int. J. For. Res. 2024, 97, 479–496. [Google Scholar] [CrossRef]
  37. Qiu, H.; Zhang, H.; Lei, K.; Zhang, H.; Hu, X. Forest Digital Twin: A New Tool for Forest Management Practices Based on Spatio-Temporal Data, 3D Simulation Engine, and Intelligent Interactive Environment. Comput. Electron. Agric. 2023, 215, 108416. [Google Scholar] [CrossRef]
  38. Grieves, M. Digital Twin: Manufacturing Excellence through Virtual Factory Replication. White Pap. 2014, 1, 1–7. [Google Scholar]
  39. Buonocore, L.; Yates, J.; Valentini, R. A Proposal for a Forest Digital Twin Framework and Its Perspectives. Forests 2022, 13, 498. [Google Scholar] [CrossRef]
  40. Onwude, D.; Cronje, P.; North, J.; Defraeye, T. Digital Replica to Unveil the Impact of Growing Conditions on Orange Postharvest Quality. Sci. Rep. 2024, 14, 14437. [Google Scholar] [CrossRef]
  41. Singh, M.; Srivastava, R.; Fuenmayor, E.; Kuts, V.; Qiao, Y.; Murray, N.; Devine, D. Applications of Digital Twin across Industries: A Review. Appl. Sci. 2022, 12, 5727. [Google Scholar] [CrossRef]
  42. Nitoslawski, S.A.; Wong-Stevens, K.; Steenberg, J.W.N.; Witherspoon, K.; Nesbitt, L.; Konijnendijk van den Bosch, C.C. The Digital Forest: Mapping a Decade of Knowledge on Technological Applications for Forest Ecosystems. Earths Future 2021, 9, e2021EF002123. [Google Scholar] [CrossRef]
  43. Giannetti, F.; Passarino, L.; Aleandri, G.; Borghi, C.; Vangi, E.; Anzilotti, S.; Raddi, S.; Chirici, G.; Travaglini, D.; Maltoni, A.; et al. Efficiency of Mobile Laser Scanning for Digital Marteloscopes for Conifer Forests in the Mediterranean Region. Forests 2024, 15, 2202. [Google Scholar] [CrossRef]
  44. Balestra, M.; Cabo, C.; Murtiyoso, A.; Vitali, A.; Alvarez-Taboada, F.; Cantero-Amiano, A.; Bolaños, R.; Laino, D.; Pierdicca, R. Advancing Forest Inventory: A Comparative Study of Low-Cost MLS Lidar Device with Professional Laser Scanners. Int. Arch. Photogramm. Remote Sens. Spat. Inf. Sci. 2024, XLVIII-2/W8-2024, 9–15. [Google Scholar] [CrossRef]
  45. Murtiyoso, A.; Cabo, C.; Singh, A.; Obaya, D.P.; Cherlet, W.; Stoddart, J.; Fol, C.R.; Beloiu Schwenke, M.; Rehush, N.; Stereńczak, K.; et al. A Review of Software Solutions to Process Ground-Based Point Clouds in Forest Applications. Curr. For. Rep. 2024, 10, 401–419. [Google Scholar] [CrossRef]
  46. Kushwaha, S.K.P.; Singh, A.; Jain, K.; Cabo, C.; Mokros, M. Accuracy Assessment of Stem Classification Obtained from Forest Point Cloud Using FSCT Algorithm. In Proceedings of the Institute of Electrical and Electronics Engineers (IEEE), Pasadena, CA, USA, 20 October 2023; pp. 4447–4450. [Google Scholar]
  47. Liang, X.; Kukko, A.; Balenovic, I.; Saarinen, N.; Junttila, S.; Kankare, V.; Holopainen, M.; Mokros, M.; Surovy, P.; Kaartinen, H.; et al. Close-Range Remote Sensing of Forests: The State of the Art, Challenges, and Opportunities for Systems and Data Acquisitions. IEEE Geosci. Remote Sens. Mag. 2022, 10, 32–71. [Google Scholar] [CrossRef]
  48. Mokroš, M.; Liang, X.; Surový, P.; Valent, P.; Čerňava, J.; Chudý, F.; Tunák, D.; Saloň, Š.; Merganič, J. Evaluation of Close-Range Photogrammetry Image Collection Methods for Estimating Tree Diameters. ISPRS Int. J. Geoinf. 2018, 7, 93. [Google Scholar] [CrossRef]
  49. Holm, S.; Schweier, J. Virtual Forests for Decision Support and Stakeholder Communication. Environ. Model. Softw. 2024, 180, 106159. [Google Scholar] [CrossRef]
  50. FieldMap Software and Device. Available online: https://www.fieldmap.cz/ (accessed on 19 December 2024).
  51. TruPulse 360i. Available online: https://lasertech.com/product/trupulse-360i/ (accessed on 19 December 2024).
  52. Hijmans, R.J.; Barbosa, M.; Bivand, R.; Brown, A.; Chirico, M.; Cordano, E.; Dyba, K.; Pebesma, E.; Rowlingson, B.; Sumner, M.D. Terra: Spatial Data Analysis 2023. Available online: https://cran.r-project.org/web/packages/terra/index.html (accessed on 27 April 2025).
  53. Cameron, A.D. Importance of Early Selective Thinning in the Development of Long-term Stand Stability and Improved Log Quality: A Review. Forestry 2002, 75, 25–35. [Google Scholar] [CrossRef]
  54. Chiappini, S.; Pierdicca, R.; Malandra, F.; Tonelli, E.; Malinverni, E.S.; Urbinati, C.; Vitali, A. Comparing Mobile Laser Scanner and Manual Measurements for Dendrometric Variables Estimation in a Black Pine (Pinus Nigra Arn.) Plantation. Comput. Electron. Agric. 2022, 198, 107069. [Google Scholar] [CrossRef]
  55. Neudam, L.; Annighöfer, P.; Seidel, D. Exploring the Potential of Mobile Laser Scanning to Quantify Forest Structural Complexity. Front. Remote Sens. 2022, 3, 861337. [Google Scholar] [CrossRef]
  56. Dorji, Y.; Schuldt, B.; Neudam, L.; Dorji, R.; Middleby, K.; Isasa, E.; Körber, K.; Ammer, C.; Annighöfer, P.; Seidel, D. Three-Dimensional Quantification of Tree Architecture from Mobile Laser Scanning and Geometry Analysis. Trees-Struct. Funct. 2021, 35, 1385–1398. [Google Scholar] [CrossRef]
  57. Ghamisi, P.; Rasti, B.; Yokoya, N.; Wang, Q.; Hofle, B.; Bruzzone, L.; Bovolo, F.; Chi, M.; Anders, K.; Gloaguen, R. Multisource and Multitemporal Data Fusion in Remote Sensing: A Comprehensive Review of the State of the Art. IEEE Geosci. Remote Sens. Mag. 2019, 7, 6–39. [Google Scholar] [CrossRef]
  58. Puliti, S.; Lines, E.R.; Müllerová, J.; Frey, J.; Schindler, Z.; Straker, A.; Allen, M.J.; Winiwarter, L.; Rehush, N.; Hristova, H.; et al. Benchmarking Tree Species Classification from Proximally Sensed Laser Scanning Data: Introducing the FOR-species20K Dataset. Methods Ecol. Evol. 2025, 16, 801–818. [Google Scholar] [CrossRef]
  59. Jurjević, L.; Liang, X.; Gašparović, M.; Balenović, I. Is Field-Measured Tree Height as Reliable as Believed–Part II, A Comparison Study of Tree Height Estimates from Conventional Field Measurement and Low-Cost Close-Range Remote Sensing in a Deciduous Forest. ISPRS J. Photogramm. Remote Sens. 2020, 169, 227–241. [Google Scholar] [CrossRef]
  60. Wagner, S.; Angerschmid, A.; Saranti, A.; Gollob, C.; Ritter, T.; Krassnitzer, R.; Tockner, A.; Witzmann, S.; Holzinger, A.; Stampfer, K.; et al. Automatic Detection of Color Markings and Numbers on Trees in Point Clouds from Personal Laser Scanning (PLS) and Terrestrial Laser Scanning (TLS). Ecol. Inform. 2024, 82, 102709. [Google Scholar] [CrossRef]
  61. Chudá, J.; Výbošťok, J.; Tomaštík, J.; Chudý, F.; Tunák, D.; Skladan, M.; Tuček, J.; Mokroš, M. Prompt Mapping Tree Positions with Handheld Mobile Scanners Based on SLAM Technology. Land 2024, 13, 93. [Google Scholar] [CrossRef]
  62. Del Perugia, B.; Giannetti, F.; Chirici, G.; Travaglini, D. Influence of Scan Density on the Estimation of Single-Tree Attributes by Hand-Held Mobile Laser Scanning. Forests 2019, 10, 277. [Google Scholar] [CrossRef]
  63. Kuželka, K.; Surový, P. Noise Analysis for Unbiased Tree Diameter Estimation from Personal Laser Scanning Data. Remote Sens. 2024, 16, 1261. [Google Scholar] [CrossRef]
  64. de Simone, L.; Fanfarillo, E.; Maccherini, S.; Fiaschi, T.; Alfonso, G.; Angelini, F.; Garabini, M.; Angiolini, C. One Small Step for a Robot, One Giant Leap for Habitat Monitoring: A Structural Survey of EU Forest Habitats with Robotically-Mounted Mobile Laser Scanning (RMLS). Ecol. Indic. 2024, 160, 111882. [Google Scholar] [CrossRef]
  65. Döllner, J.; de Amicis, R.; Burmeister, J.-M.; Richter, R. Forests in the Digital Age: Concepts and Technologies for Designing and Deploying Forest Digital Twins. In Proceedings of the 28th International ACM Conference on 3D Web Technology, San Sebastian, Spain, 9–11 October 2023; pp. 1–12. [Google Scholar]
  66. O’Brien, L.; Derks, J.; Schuck, A. The Use of Marteloscopes in Science; A Review of Past Research and Suggestions for Further Application; European Forest Institue: Joensuu, Finland, 2022. [Google Scholar]
  67. Waeber, P.O.; Melnykovych, M.; Riegel, E.; Chongong, L.V.; Lloren, R.; Raher, J.; Reibert, T.; Zaheen, M.; Soshenskyi, O.; Garcia, C.A. Fostering Innovation, Transition, and the Reconstruction of Forestry: Critical Thinking and Transdisciplinarity in Forest Education with Strategy Games. Forests 2023, 14, 1646. [Google Scholar] [CrossRef]
  68. Wielgosz, M.; Puliti, S.; Xiang, B.; Schindler, K.; Astrup, R. SegmentAnyTree: A Sensor and Platform Agnostic Deep Learning Model for Tree Segmentation Using Laser Scanning Data. arXiv 2024, arXiv:2401.15739. [Google Scholar] [CrossRef]
  69. Xiang, B.; Wielgosz, M.; Kontogianni, T.; Peters, T.; Puliti, S.; Astrup, R.; Schindler, K. Automated Forest Inventory: Analysis of High-Density Airborne LiDAR Point Clouds with 3D Deep Learning. Remote Sens. Environ. 2024, 305, 114078. [Google Scholar] [CrossRef]
  70. Zürcher, R.; Zhao, J.; Lau Sarmiento, A.; Brede, B.; Klippel, A. Advancing Forest Monitoring and Assessment through Immersive Virtual Reality. Agil. GIScience Ser. 2023, 4, 15. [Google Scholar] [CrossRef]
  71. Sitompul, T.A.; Wallmyr, M. Using Augmented Reality to Improve Productivity and Safety for Heavy Machinery Operators: State of the Art. In Proceedings of the 17th International Conference on Virtual-Reality Continuum and Its Applications in Industry, Brisbane, QLD, Australia, 14–16 November 2019; pp. 1–9. [Google Scholar]
  72. Lilligreen, G.; Wiebel, A. Near and Far Interaction for Outdoor Augmented Reality Tree Visualization and Recommendations on Designing Augmented Reality for Use in Nature. SN Comput. Sci. 2023, 4, 248. [Google Scholar] [CrossRef]
  73. Jaung, W. Digital Forest Recreation in the Metaverse: Opportunities and Challenges. Technol. Forecast. Soc. Change 2022, 185, 122090. [Google Scholar] [CrossRef]
Figure 1. (a) Location (red dot) of the Mt. Nerone study area in the Marche region (Central Italy); (b) 3D view of the study area, with the marteloscope field; (c) the one hectare marteloscope divided into four quadrants (see text below).
Forests 16 00820 g001
Figure 2. (a) Loop-close path for 3D data acquisition with 6 GCPs recorded with the GNSS receiver. The path colour indicates the travel time, starting in blue with point 1 and ending in red with point 7, which overlaps point 1. The red dots indicate the trees position in the marteloscope. (b) One of the targets used to record the GNSS and GeoSLAM GCPs. We placed the targets in areas with lower tree density to reduce satellite signal obstruction caused by the canopy and to ensure accurate GCP acquisition with RTK correction.
Forests 16 00820 g002
Figure 3. The experiment workflow: from data collection with active sensors (MLSs) and GCPs acquisition (GNSS + target) to data processing with dedicated software. Green boxes refer to the data collection process in the field, the yellow ones the raw point cloud extraction in GeoSLAM Connect software, and the blue ones the CloudCompare processing. At all steps we could extract the tree metrics and the digital replica.
Forests 16 00820 g003
Figure 4. Close-up view of the raw point cloud extracted by the MLS.
Forests 16 00820 g004
Figure 5. (a) Display of a plot with the active scalar field of the segmented trees, represented with random colours. This RGB visualization facilitates clear differentiation among individual trees segmented within the plot. (b) DTM region (brown), highest crown tip (purple dots), fitted sections (blue sections), tree axes (yellow lines), and tree locators (red dots).
Forests 16 00820 g005
Figure 6. DBH classes frequency distribution (absolute and percentage) of the marteloscope trees from MLS data.
Forests 16 00820 g006
Figure 7. Allometric relationship between DBH and TH from MLS data.
Forests 16 00820 g007
Figure 8. The digital replica of the 1 ha marteloscope with the 1087 randomly RGB coloured segmented trees.
Forests 16 00820 g008
Figure 9. A selective thinning simulation in the marteloscope digital replica: (a) nadiral view of all the trees before thinning, all displayed in green; (b) nadiral view of the selected trees marked in red and the trees designated for removal marked in black; (c) nadiral view of the gaps remaining after thinning; (d) side view with all the standing trees before the simulated thinning with the candidates (red) and the trees designated for removal (black).
Forests 16 00820 g009
Table 1. Number of trees, mean slope, roughness index, MLS tree metrics with relative standard deviations in square brackets, bias, and RMSD values for each quadrant and the entire marteloscope.
MLS Tree MetricsBiasRMSD
QN° TreesMean Slope (°)Roughness IndexDBH Average [SD] (cm)TH Average [SD] (m)DBH (cm)TH (m)DBH (cm)TH (m)
abs.abs.abs.%abs.%
Q1254230.0921.93 [−0.12]16.34 [+0.91]0.12−0.832.9613.572.6415.30
Q2258220.0821.37 [−0.19]16.05 [+1.39]0.19−1.701.728.142.9616.99
Q3304310.1219.13 [−0.39]14.21 [+1.92]0.40−0.282.8114.991.8711.61
Q4271270.1019.82 [−0.17]14.65 [+0.80]0.16−0.091.728.761.6610.77
Total1087 20.51 [−0.22]15.27 [+1.44]0.22−0.742.3811.742.4214.48
Table 2. The thinning simulation results. Pre- and post-intervention and change (Δ) values for tree density, basal area, volume, mean DBH, and mean TH. Values in square brackets are deviations from corresponding measurements obtained with the traditional field-generated report after the on-field tree selection.
Stand ParametersPre-ThinningΔPost-Thinning
Trees/ha (N)1087328759
Trees/ha (%)1003070
Basal area (m2/ha)37.75 [+0.58]11.96 [+0.37]25.79 [+0.21]
Basal area (%)10031.68 [+0.52]68.32 [−0.52]
Growing Stock Volume (m3/ha)292.94 [+23.05]94.82 [+7.86]198.12 [+15.19]
Growing Stock Volume (%)10032.36 [+0.14]67.63 [−0.13]
DBH average (cm)20.51 [+0.63]0.33 [−0.14]20.18 [+0.77]
TH average (m)15.27 [+1.05]0.19 [−0.18]15.08 [+1.23]
Disclaimer/Publisher’s Note: The statements, opinions and data contained in all publications are solely those of the individual author(s) and contributor(s) and not of MDPI and/or the editor(s). MDPI and/or the editor(s) disclaim responsibility for any injury to people or property resulting from any ideas, methods, instructions or products referred to in the content.

