Article

Changes in Net Primary Productivity in the Wuyi Mountains of Southern China from 2000 to 2022

1
Co-Innovation Center for Sustainable Forest in Southern China, Nanjing Forestry University, Nanjing 210037, China
2
College of Ecology and Environment, Nanjing Forestry University, Nanjing 210037, China
3
The Scientific Research and Monitoring Center of Wuyi Mountain National Park, Wuyishan 354300, China
*
Author to whom correspondence should be addressed.
Forests 2025, 16(5), 809; https://doi.org/10.3390/f16050809
Submission received: 9 April 2025 / Revised: 10 May 2025 / Accepted: 11 May 2025 / Published: 13 May 2025
(This article belongs to the Section Forest Ecology and Management)

Abstract

:
Forest carbon sinks have faced significant challenges with the accelerating warming trend in the 21st century. Net primary productivity (NPP) serves as a critical indicator of the carbon cycle in forest ecosystems and is intricately influenced by both human activities and climate change. This study focuses on the subtropical Southern Forests of China as the research object, using the Wuyi Mountains as a representative study area. The positive and negative contributions of ecologically oriented human activities driven by China’s forestry construction over the past few decades were investigated along with potential extreme climate factors affecting the forest NPP from an altitude gradient perspective and regional-scale forest NPP changes from a novel viewpoint. MODIS NPP, climate, and land use data, along with a vegetation type transfer matrix and statistical methods, were utilized for this purpose. The results are summarized as follows. (1) From 2000 to 2022, NPP in the Wuyi Mountains exhibited a high distribution pattern in the northeastern and southern areas and a low distribution pattern in the central region, with a weak overall increase and an average annual growth increment of only 0.11 gC·m−2·year−1. NPP increased with altitude, with a mean growth rate of 5.0 gC·m−2·hm−1. Notably, the growth rate of NPP was most pronounced in the altitude range below 298 m in both temporal and vertical dimensions. (2) In the context of China’s long-term Forestry Ecological Engineering Projects and Natural Forest Protection Projects, as well as climate warming, the transformation of vegetation types from relatively low NPP types to high NPP types in the Wuyi Mountains has resulted in a total NPP increase of 211.58 GgC over the past 23 years. Specifically, only the altitude range below 298 m showed negative vegetation type transformation, leading to an NPP decrease of 119.44 GgC. The expansion of urban and built-up lands below 500 m over the 23-year period reduced NPP by 147.92 GgC. (3) The climatic factors inhibiting NPP in the Wuyi Mountains were extreme nighttime high temperatures from June to September, which significantly weakened the NPP of evergreen broadleaf forests above 500 m in elevation. This inhibitory effect still resulted in a reduction of 127.36 GgC in the NPP of evergreen broadleaf forests within this altitude range, despite a cumulative increment in the area of evergreen broadleaf forests above 500 m over the past 23 years. In conclusion, the growth in NPP in the southern inland subtropical regions of China slowed after 2000, primarily due to the significant rise in nighttime extreme high temperatures and the expansion of human-built areas in the region. This study provides valuable data support for the adaptation of subtropical forests to climate change.

1. Introduction

Global warming has been intensifying since the start of the 21st century. The latest Intergovernmental Panel on Climate Change report published in early 2023 pointed out that during 2011–2020, the global surface temperature was 1.1 °C higher than that during 1850–1900, and the CO2 concentration reached the highest level in the last 2 million years. Carbon sinks have become a key topic in ecological research [1]. As a core component of terrestrial ecosystems, forests can offset about 25% of global carbon dioxide emissions caused by fossil fuel combustion [2]. Therefore, forests have been regarded as one of the most economical, safe, and effective carriers for carbon sequestration and carbon sink enhancement and play a crucial role in the global carbon cycle [3]. Net primary productivity (NPP) is the most important indicator of the forest carbon cycle, representing the carbon sequestration capacity of a forest ecosystem [4].
The dynamics of the NPP of forest vegetation are influenced by both human activities and climate change. Global data indicate that human activities, such as deforestation, overgrazing, and agricultural expansion, are reducing forest carbon pools. For example, approximately 2.5 × 10⁶ km2 of the Amazon rainforest is currently undergoing degradation as a result of deforestation [5]. About 27% of the global decline in forest NPP can be attributed to excessive deforestation from 2001 to 2005 [6]. In the past decade, the primary cause of the reduction in forest carbon sinks in Eastern Europe was also human activities [7]. In view of climate change, the extension of the vegetation growing season and the enhanced CO2 fertilization effect of warming on the carbon sequestration capacity of forests have received a great deal of attention [8]. However, while climate warming may potentially suppress NPP, human activities can also positively contribute to forest NPP. For example, the effective implementation of forestry policies by humans can increase NPP [9]. Through the implementation of Forestry Ecological Engineering Projects in China [10], more than 32 million hectares of agricultural land have been converted into forest vegetation since the 1970s [11]. China’s vegetated area, which constitutes 6.6% of the global total, has experienced a leaf area increment equivalent to 25% of the global value, with forests contributing 40% of this increase [12]. In 1998, China launched the Natural Forest Protection Project [13], a forestry management policy that has facilitated the transition of natural forest vegetation from vegetation types with a relatively low normalized difference vegetation index (NDVI) to relatively high-NDVI vegetation types, including, for instance, the transformation of savannas into evergreen broadleaf and mixed forests in southwest China [14]. The increasing frequency of extreme weather events linked to climate change, such as heatwaves and droughts, can damage forest ecosystems and lead to a decrease in forest NPP [15].
In this study, we examined the changes in NPP in Chinese forest regions after 2000, taking into account the positive contributions from the implementation of ecologically oriented forestry projects and the negative effects caused by extreme climate conditions. This study period also presents an excellent opportunity to evaluate the implementation of ecologically oriented forestry policies over the past few decades under warming conditions. There are three major natural forest regions in China, namely, the Northeast Forests (the Changbai Mountains and the Daxinganling and Xiaoxinganling Mountains, mostly located in the cold–temperate and temperate zones), the Southwest Forests (the Yunnan–Guizhou Plateau and the Sichuan Basin, mostly located in the high-altitude cold areas), and the Southern Forests (mainly in the southern part of the Yangtze River Basin). The NPP of forests in these three regions has increased to varying degrees as a result of nearly half a century of forestry development. Numerous studies have investigated the negative effects on NPP in the Northeast Forest due to droughts and fires [16], as well as the decline in NPP in the Southwest Forests caused by lightning-induced fires and droughts [17,18]. The differences in fire-related NPP losses between the Southwest and Northeast Forests have also been analyzed [18]. Nevertheless, given the mild climate change [19] and relatively stable forest ecosystem [20], in the case of forests in southern China, it remains unclear whether some extreme climate events or factors have disrupted the NPP and whether such disruptions reversed the increasing trend of forest NPP in this region.
The Southern Forests extend across 13 provincial-level administrative districts to the south of the Yangtze River. According to the ninth national forest inventory in 2018, the forest area in this region accounts for 33.37% of the total forest area in China. In terms of interference from meteorological disasters, the southeastern coastal areas of the Southern Forests in China have been affected by typhoons for a long time, while typhoon disasters are rare in the vast inland forest areas [21]. According to the China Natural Disaster Yearbook, in the first two decades of the 21st century, the Southern Forests experienced 394 typhoons [22], which were much less frequent than extreme precipitation/flood (1613 times), droughts (3899 times), and extreme high temperature (4935 times) in the inland areas. Among these three high-frequency meteorological disasters, the risk of flooding disasters was low in southeast China [23]; moreover, only extreme high temperature was calculated to show a significant increasing trend (R2 = 0.35, p < 0.05). Studies have shown that heatwaves caused by extreme high temperatures reduce the biodiversity of forest ecosystems [24], promote the proliferation of pests and diseases [25], and act as the major driver in the reduction in NPP in subtropical and tropical forests [26].
The majority of the Southern Forests consists of mid-subtropical forests, predominantly located in the Wuyi Mountains and the Nanling Mountains. The Wuyi Mountains harbor the largest and most well-preserved mid-subtropical forest ecosystem in southeastern China [21]. Studies on the Southern Forests in recent years, particularly those in the Wuyi Mountains, have yielded partial insights into biodiversity [27] and the response of natural forests to climate change [28]. The changes in NPP along an altitudinal gradient in the Wuyi Mountains, a representative region of the Southern Forests, were investigated in this study using NPP, climate, and land use data from 2000 to 2022. The NPP changes were evaluated by means of a vegetation transfer matrix and statistical methods, such as Pearson correlation analysis and significance testing from two perspectives: the negative contributions of major extreme climatic disturbances and the positive contributions of ecologically oriented human activities driven by China’s forestry construction over the past few decades under warming conditions. The findings will provide a scientific foundation for addressing climate change and promoting ecological restoration in subtropical forests.

2. Materials and Methods

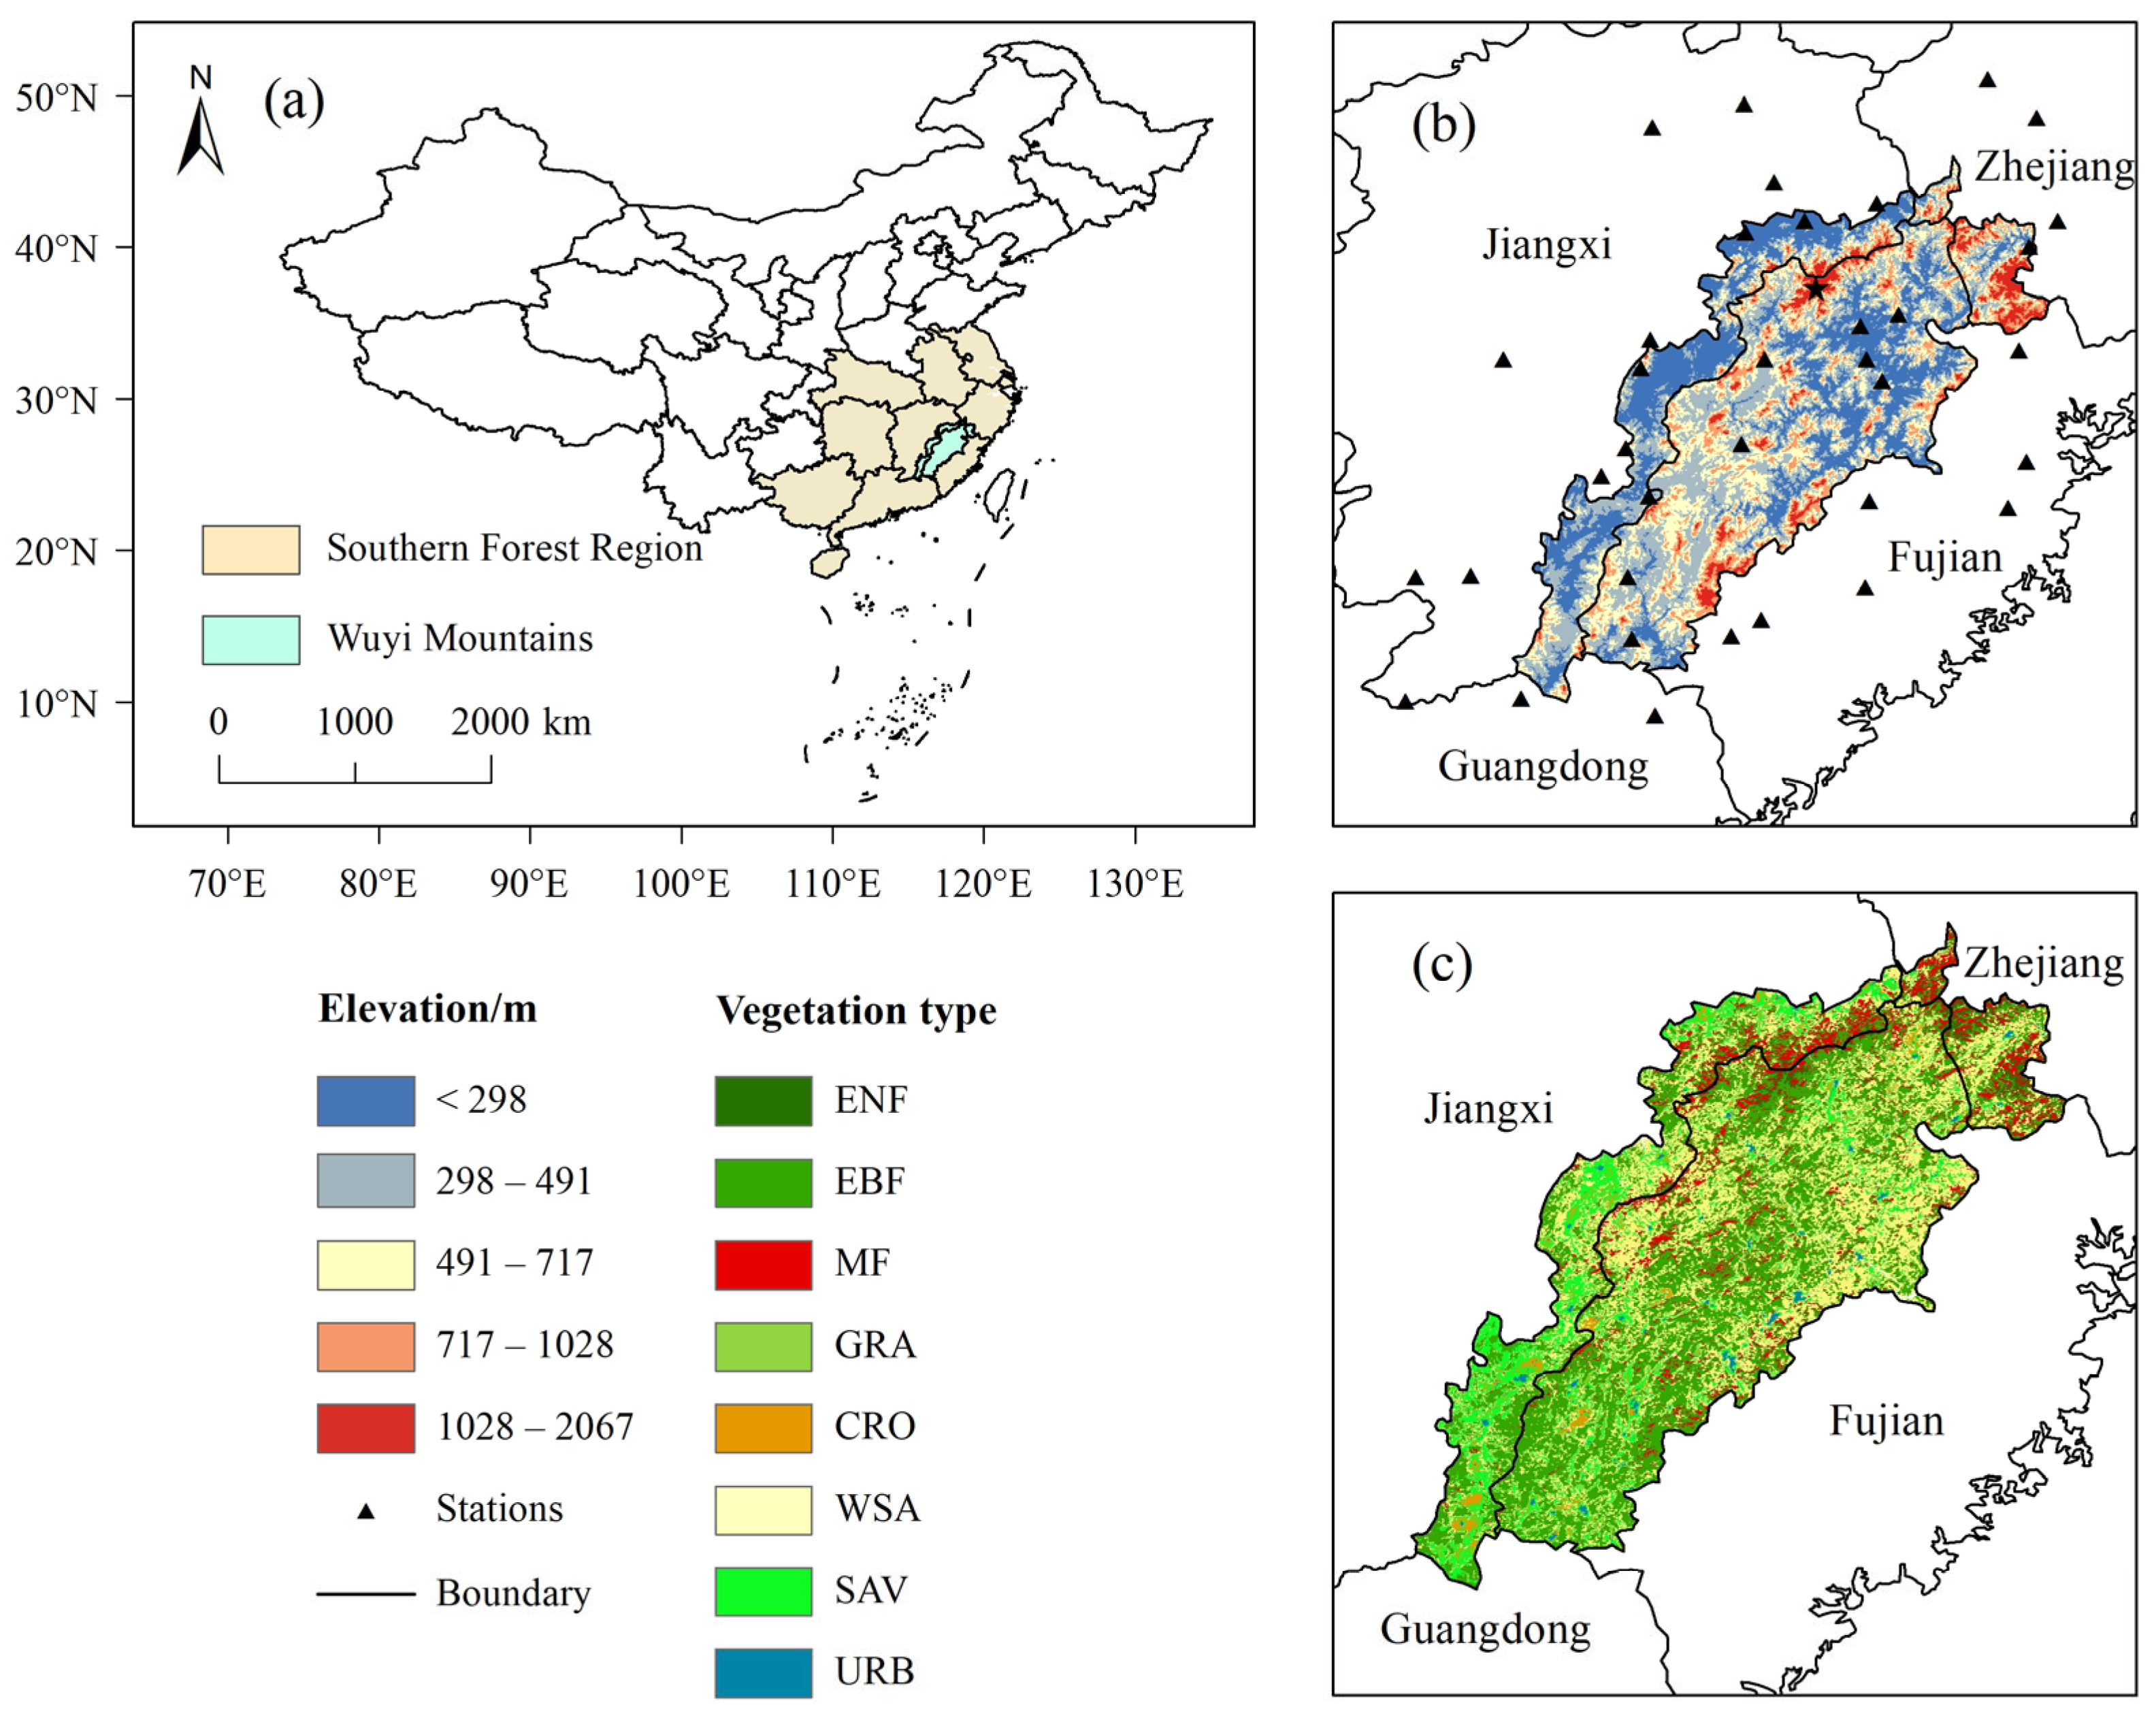
2.1. Overview of the Study Area

The Wuyi Mountain Range denotes the mountain system extending in a north–south direction between Fujian, Jiangxi, and Zhejiang Provinces in China, as illustrated in Figure 1. This range connects with the Xianxia Ridge between Zhejiang and Jiangxi Provinces, spanning a broad area (24°30′–28°20′ N, 115°33′–118°50′ E), with a total area of 8.81 × 10⁴ km2. The terrain is characterized by undulating topography, with the highest elevation reaching 2067 m. The high-altitude regions are predominantly covered by forests, while grasslands and farmlands are primarily distributed in the low-altitude areas. The forest coverage rate in this region is approximately 50.76%. The area exhibits a typical subtropical monsoon climate, with annual precipitation ranging from 920 to 2100 mm and an average annual temperature ranging from 17 to 21 °C.

2.2. Identification of the Predominant Types of Climate Disturbances in the Study Area

As discussed above, it is evident that extreme high temperatures have become one of the predominant types of meteorological disturbances in the Southern Forests since 2000. To validate this finding in the Wuyi Mountains, we selected data from two local weather stations based on the principle of data continuity: the local weather station of Wuyi Mountain, located at an altitude of 223.3 m (118.02° E, 27.46° N), and the Tongmucun station, situated at 772 m (117.68° E, 27.75° N). The approximate positions of the two are shown in Figure 2b. Table 1 presents the basic climatic background and potential types of meteorological disasters in the region during the period of 2000–2020.
The annual count of days with an average daily temperature greater than or equal to 35 °C serves as the high temperature indicator, i.e., extreme high temperature frequency, signifying a greater likelihood of heat damage. The annual count of days with an average daily temperature below 0 °C functions as the low temperature indicator, i.e., extreme low temperature frequency, indicating a higher probability of frost and freezing disasters. The annual count of days with daily precipitation exceeding 20 mm represents the heavy rainfall indicator, i.e., heavy rain frequency, suggesting an increased risk of flooding. Drought occurrence is characterized by the percentage anomaly of annual precipitation [29]. As shown in Table 1, only the values of the extreme high temperature indicator are similar, and they exhibit significant increases in both altitude segments, thereby confirming that the most critical type of meteorological disaster in the Wuyi Mountains in recent years has been extreme high temperatures. Consequently, the impact of extreme high temperatures in the Wuyi Mountains on NPP was primarily investigated in this study. Table 1 additionally reveals a “mild drought” [29] at an elevation of 772 m; however, drought disasters were not considered due to the significant upward trend in precipitation anomalies.

2.3. Data and Methods

2.3.1. NPP Data and Land Use Data

The NPP data and land use data from 2000 to 2022 were obtained from the Moderate-Resolution Imaging Spectroradiometer (MODIS) data products MOD17A3 and MCD12Q1 of NASA (https://ladsweb.modaps.eosdis.nasa.gov/, accessed on 5 October 2024), respectively. Both datasets have a temporal resolution in years and a spatial resolution of 500 m. MOD17A3 incorporates the latest Biome Property Look-Up Table and the new daily meteorological data from the Global Modeling and Assimilation Office, enhancing the accuracy of NPP [30], and it is widely used in related research fields. Based on the classification scheme of the International Geosphere–Biosphere Program and in accordance with the research requirements [31], MCD12Q1 land use data were divided into seven types of vegetation and three other non-vegetation types in the Wuyi Mountains. The specific distribution proportions of land cover types are presented as follows: EBF (40.14%), WSA (33.70%), SAV (12.09%), MF (8.41%), CRO (1.78%), ENF (1.74%), GRA (1.19%), URB (0.79%), WET (0.11%), and WAT (0.05%). The last two types, due to their small proportion and small variation, were not analyzed in this study. Overall, the coverage rate of vegetation types in the Wuyi Mountains is 99.05%, which is much higher than that of non-vegetation types.

2.3.2. Elevation Data and Their Gradient Classification

The elevation data were obtained from the DEM (Digital Elevation Model) data on the Geospatial Data Cloud website (http://www.gscloud.cn/, accessed on 10 October 2024), with a spatial resolution of 30 m. These data were resampled to a resolution of 500 m using ArcGIS10.8 software to match the NPP data.
In the Wuyi Mountain region, the natural breaks method was utilized for altitude classification using ArcGIS software [32]. This approach is advantageous as it minimizes variation within the same altitude range while maximizing the contrast between different altitude ranges. In this study, the Wuyi Mountains were stratified into five altitude gradients, as presented in Table 2, denoted as R1–R5, which account for 26.68%, 32.46%, 23.55%, 12.48%, and 4.83% of the total area, respectively.

2.3.3. Extreme High Temperature Indices and Their Processing Method

The temperature data from 2000 to 2022 were obtained from the National Meteorological Science Data Center (http://data.cma.cn/site/index.html, accessed on 22 January 2025), that is, the station data of the 36 meteorological stations mentioned above. Six extreme high temperature indices (TXX, TXN, TX90p, TN90p, SU, and TR) were recommended by the Expert Team on Climate Change Detection, and indices established by the World Meteorological Organization in response to climate change were adopted. These indices are widely used to assess the variation characteristics and ecological impacts of high-temperature events [33]. Their specific meanings are shown in Table 3. The corresponding extreme high temperature indices can be calculated by means of R4.1.3 software [34].
The calculated extreme high temperature indices in the format of txt were interpolated to a continuous spatial dataset with a spatial resolution of 500 m using ANUsplin4.2 software, and the DEM data in txt format were interpolated by means of ArcGIS [35]. During the interpolation process, longitude and latitude, as well as altitude, were taken into account; that is, the temperature gradient changes at high altitudes in mountainous areas were scientifically considered. Compared with other interpolation methods, this method can more accurately reflect the spatial distribution characteristics of meteorological elements, and it is suitable for interpolating meteorological elements under complex terrain conditions [36].

2.3.4. Calculation of the Vegetation Transfer Matrix

The distribution and area values of various vegetation types were extracted based on the MCD12Q1 land use data of the starting research year, 2000. The MCD12Q1 dataset was analyzed year by year and grid by grid from 2000 to 2022 using ArcGIS software. The annual vegetation transition types and changed area values in the Wuyi Mountains were obtained by comparing subsequent years with the previous years. Specifically, this included the annual transfer-in areas and corresponding transfer-in vegetation types for each vegetation type, as well as the transfer-out areas and corresponding vegetation types. This process yielded the annual vegetation change types and their respective change areas in the Wuyi Mountains, providing fundamental data for quantifying NPP changes induced by vegetation type transitions.

2.3.5. Change in NPP Caused by the Conversion of Vegetation Types

The initial stock of vegetation areas in 2000 was initially obtained. Then, the MOD17A3 NPP values in 2000 were taken as the benchmark data of the Wuyi Mountains to obtain the average NPP of each vegetation type. The specific process is roughly as follows. The corresponding NPP values for each vegetation type are read grid by grid using ArcGIS software, and the sum of the readings of each grid is divided by the total distributed area of the vegetation type.
Based on the basic data of the annual vegetation transfer matrix, the corresponding NPP changed values were calculated using the following formula grid by grid (1):
N P P i j = N P P ¯ i N P P ¯ j × n i j
where N P P i j represents the change in NPP caused by the conversion of the i-th vegetation type to the j-th vegetation type in a unit grid; N P P ¯ i and N P P ¯ j represent the mean NPP of the i-th and j-th vegetation types, respectively; and n i j represents the number of grids where the i-th vegetation type is converted to the j-th vegetation type. Positive N P P i j indicates the conversion from a vegetation type with low NPP to one with high NPP and vice versa.

2.3.6. Spatiotemporal Statistical Methods

Theil–Sen median trend analysis was applied in this study in conjunction with the Mann–Kendall trend test to assess the trends and statistical significance of forest vegetation NPP changes on a per-grid basis [37]. This method was employed to test the significance of both the spatiotemporal variation trend of NPP and the relationships between NPP and the six extreme high temperature indices. The significance of the changing trend in the sample data was evaluated at the significance level α = 0.05. An absolute value |Z| of Z, which quantifies the strength of the trend, exceeding 1.96 indicates that the trend has passed the significance test at a 95% confidence level. If the significance level is set at α = 0.01, |Z| exceeds 2.58, indicating that the trend has passed the significance test at the 99% confidence level.
The temporal variation trend of NPP in the Wuyi Mountains during 2000−2022 was characterized using linear regression analysis [38]. The slope of the linear regression model fitted with the least squares method indicates the annual rate of change in vegetation NPP, where positive values denote an increasing trend and negative values signify a decreasing trend.
The relationships between NPP and the six extreme high temperature indices were investigated using Pearson correlation analysis [39]. The Pearson correlation coefficient (R) is used to quantify the strength and direction of the relationship between two variables. It is defined as the ratio of covariance to standard deviation between two variables, and it is a widely employed method for analyzing variable relationships in the fields of ecology and meteorology [40,41]. The value range of R is between −1 and 1, with R < 0 implying a negative correlation and R > 0 suggesting a positive correlation. The strength of the correlation increases with the absolute value of R.
These statistical methods are all conventional approaches for spatiotemporal data analysis in the field of ecology and widely utilized. The specific principles and formulas will not be detailed here. For more information, please refer to the corresponding references. All of these methods are, of course, subject to certain errors. However, the obtained results remain statistically significant when analyzed from the perspective of trends and with a focus on identifying significant factors affecting NPP.

3. Results

3.1. Spatiotemporal Distribution of Forest Vegetation NPP in the Wuyi Mountains

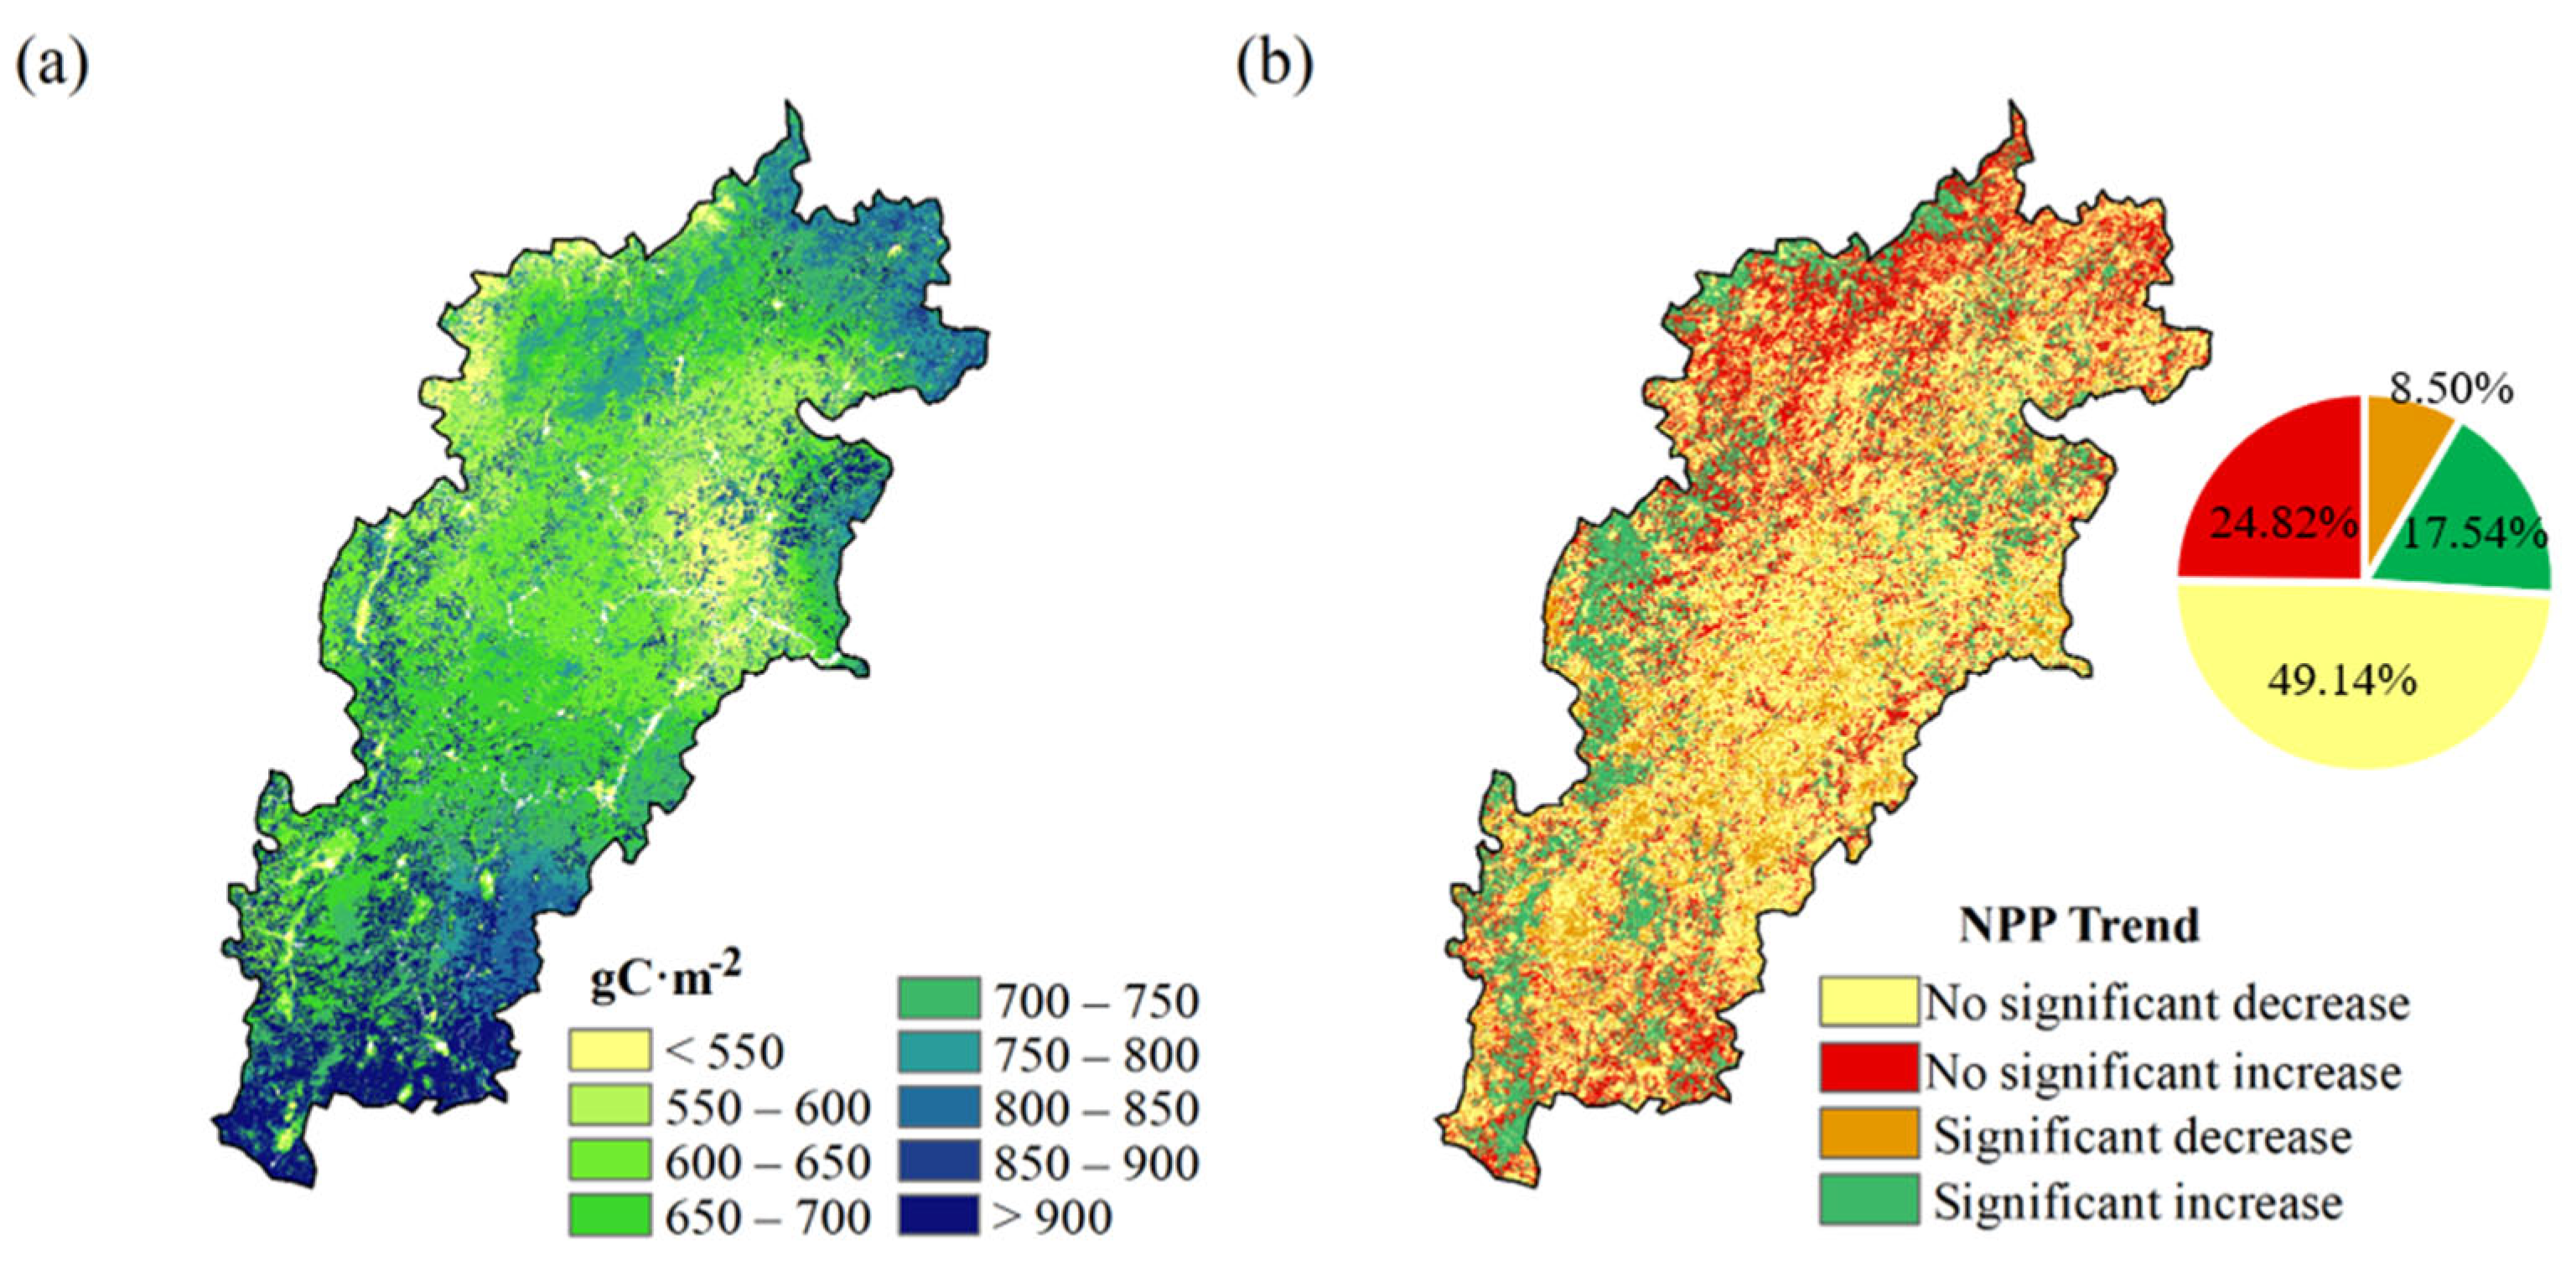
3.1.1. Horizontal Distribution

Figure 2 shows the spatial distribution (Figure 2a) and the changing trend (Figure 2b) of NPP in the Wuyi Mountains during 2000–2022. The average vegetation NPP in the Wuyi Mountains was 746.92 gC·m−2, and it remained largely stable over the years, with a growth increment of only 0.11 gC·m−2·year−1, which is lower than that of the forest vegetation NPP in the Northeast Forests [42] and Southwest Forests [43] during the same period in China. As shown in Figure 2a, the NPP values were higher in the northeast and south (blue) and lower in the central region (yellow, green). The high NPP areas had a value of around 800 gC·m−2, while the low NPP areas mostly had a value of around 600 gC·m−2. In terms of the trend of NPP during 2000–2022, the areas with non-significant changes accounted for 73.96% (p > 0.05) of the total according to grid-by-grid Theil–Sen median trend analysis coupled with the Mann–Kendall test, as shown in Figure 2b. The areas with significant increases in NPP, accounting for 17.54% (p < 0.05) of the total, were mainly located along the edges of the study area. The areas with significant decreases (p < 0.05) in NPP were scattered in parts of the central region studied.

3.1.2. Vertical Distribution

The distributions of the different vegetation types and URB areas varied with elevation. Figure 3 shows the vertical zonation of different vegetation types in the Wuyi Mountains during 2000–2022. As shown in Figure 3, both regions R1 and R2 encompassed all eight land use types (see Figure 1c). Starting from region R3, the CRO (dark blue) and URB (brown) were no longer present, the GRA (light red) disappeared in R4, and the SAV (cyan) became absent in R5. The distribution area of the WSA (light green) decreased with the increase in elevation for the same vegetation types. Specifically, the area of WSA in R5 accounted for only 3.30% of that in R1, and its extent in each elevational zone consistently decreased annually between 2000 and 2022. Conversely, the area of ENF (light blue) increased with elevation. The ENF area in R5 was 16.76 times larger than that in R1, and, within each elevational zone, its area demonstrated a clear increasing trend over time. The area of EBF (orange) initially increased and subsequently decreased with elevation, reaching its maximum extent of 1132 × 103 hm2 in R3. Within each elevation zone, the EBF area showed an increasing trend over the years, with the most pronounced increase occurring in R1 (R2 = 0.74). The area of MF (dark green) exhibited an analogous trend of an initial increase followed by a decrease with the increase in elevation. However, the magnitude of this change was notably smaller than that of EBF, and the annual variations within each elevational zone were not statistically significant.
The variation in vegetation distribution with altitude results in differences in NPP across altitudinal gradients. The mean NPP values at every 1 m elevation in the Wuyi Mountains were calculated. A scatter plot of NPP versus the elevation gradient was drawn using the 1679 pairs of altitude–NPP values in the vertical direction, as shown in Figure 4. It suggested that, in the Wuyi Mountains, NPP increased with the increase in elevation (R2 = 0.25, p < 0.01), with an average increase rate of 5.0 gC·m−2·hm−1. The increase in R1 was the highest, reaching 71.0 gC·m−2·hm−1, while the changes in the R2 to R5 sections were relatively stable. It was calculated that the average NPP values for seven vegetation types, ranked in descending order, were as follows: EBF: 753.78 gC·m−2; ENF: 734.51 gC·m−2; WSA: 681.49 gC·m−2; MF: 670.09 gC·m−2; SAV: 621.92 gC·m−2; GRA: 612.95 gC·m−2; and CRO: 550.02 gC·m−2. The higher NPP values in the high-elevation zones were clearly caused by the absence of low NPP vegetation types, such as CRO and GRA (Figure 3).
Overall, during 2000–2022, the temporal changes in NPP only significantly increased in R1 (p < 0.05), with a growth rate of 2.34 gC·m−2·year−1, while NPP exhibited non-significant decreasing trends over time in R4–R5.

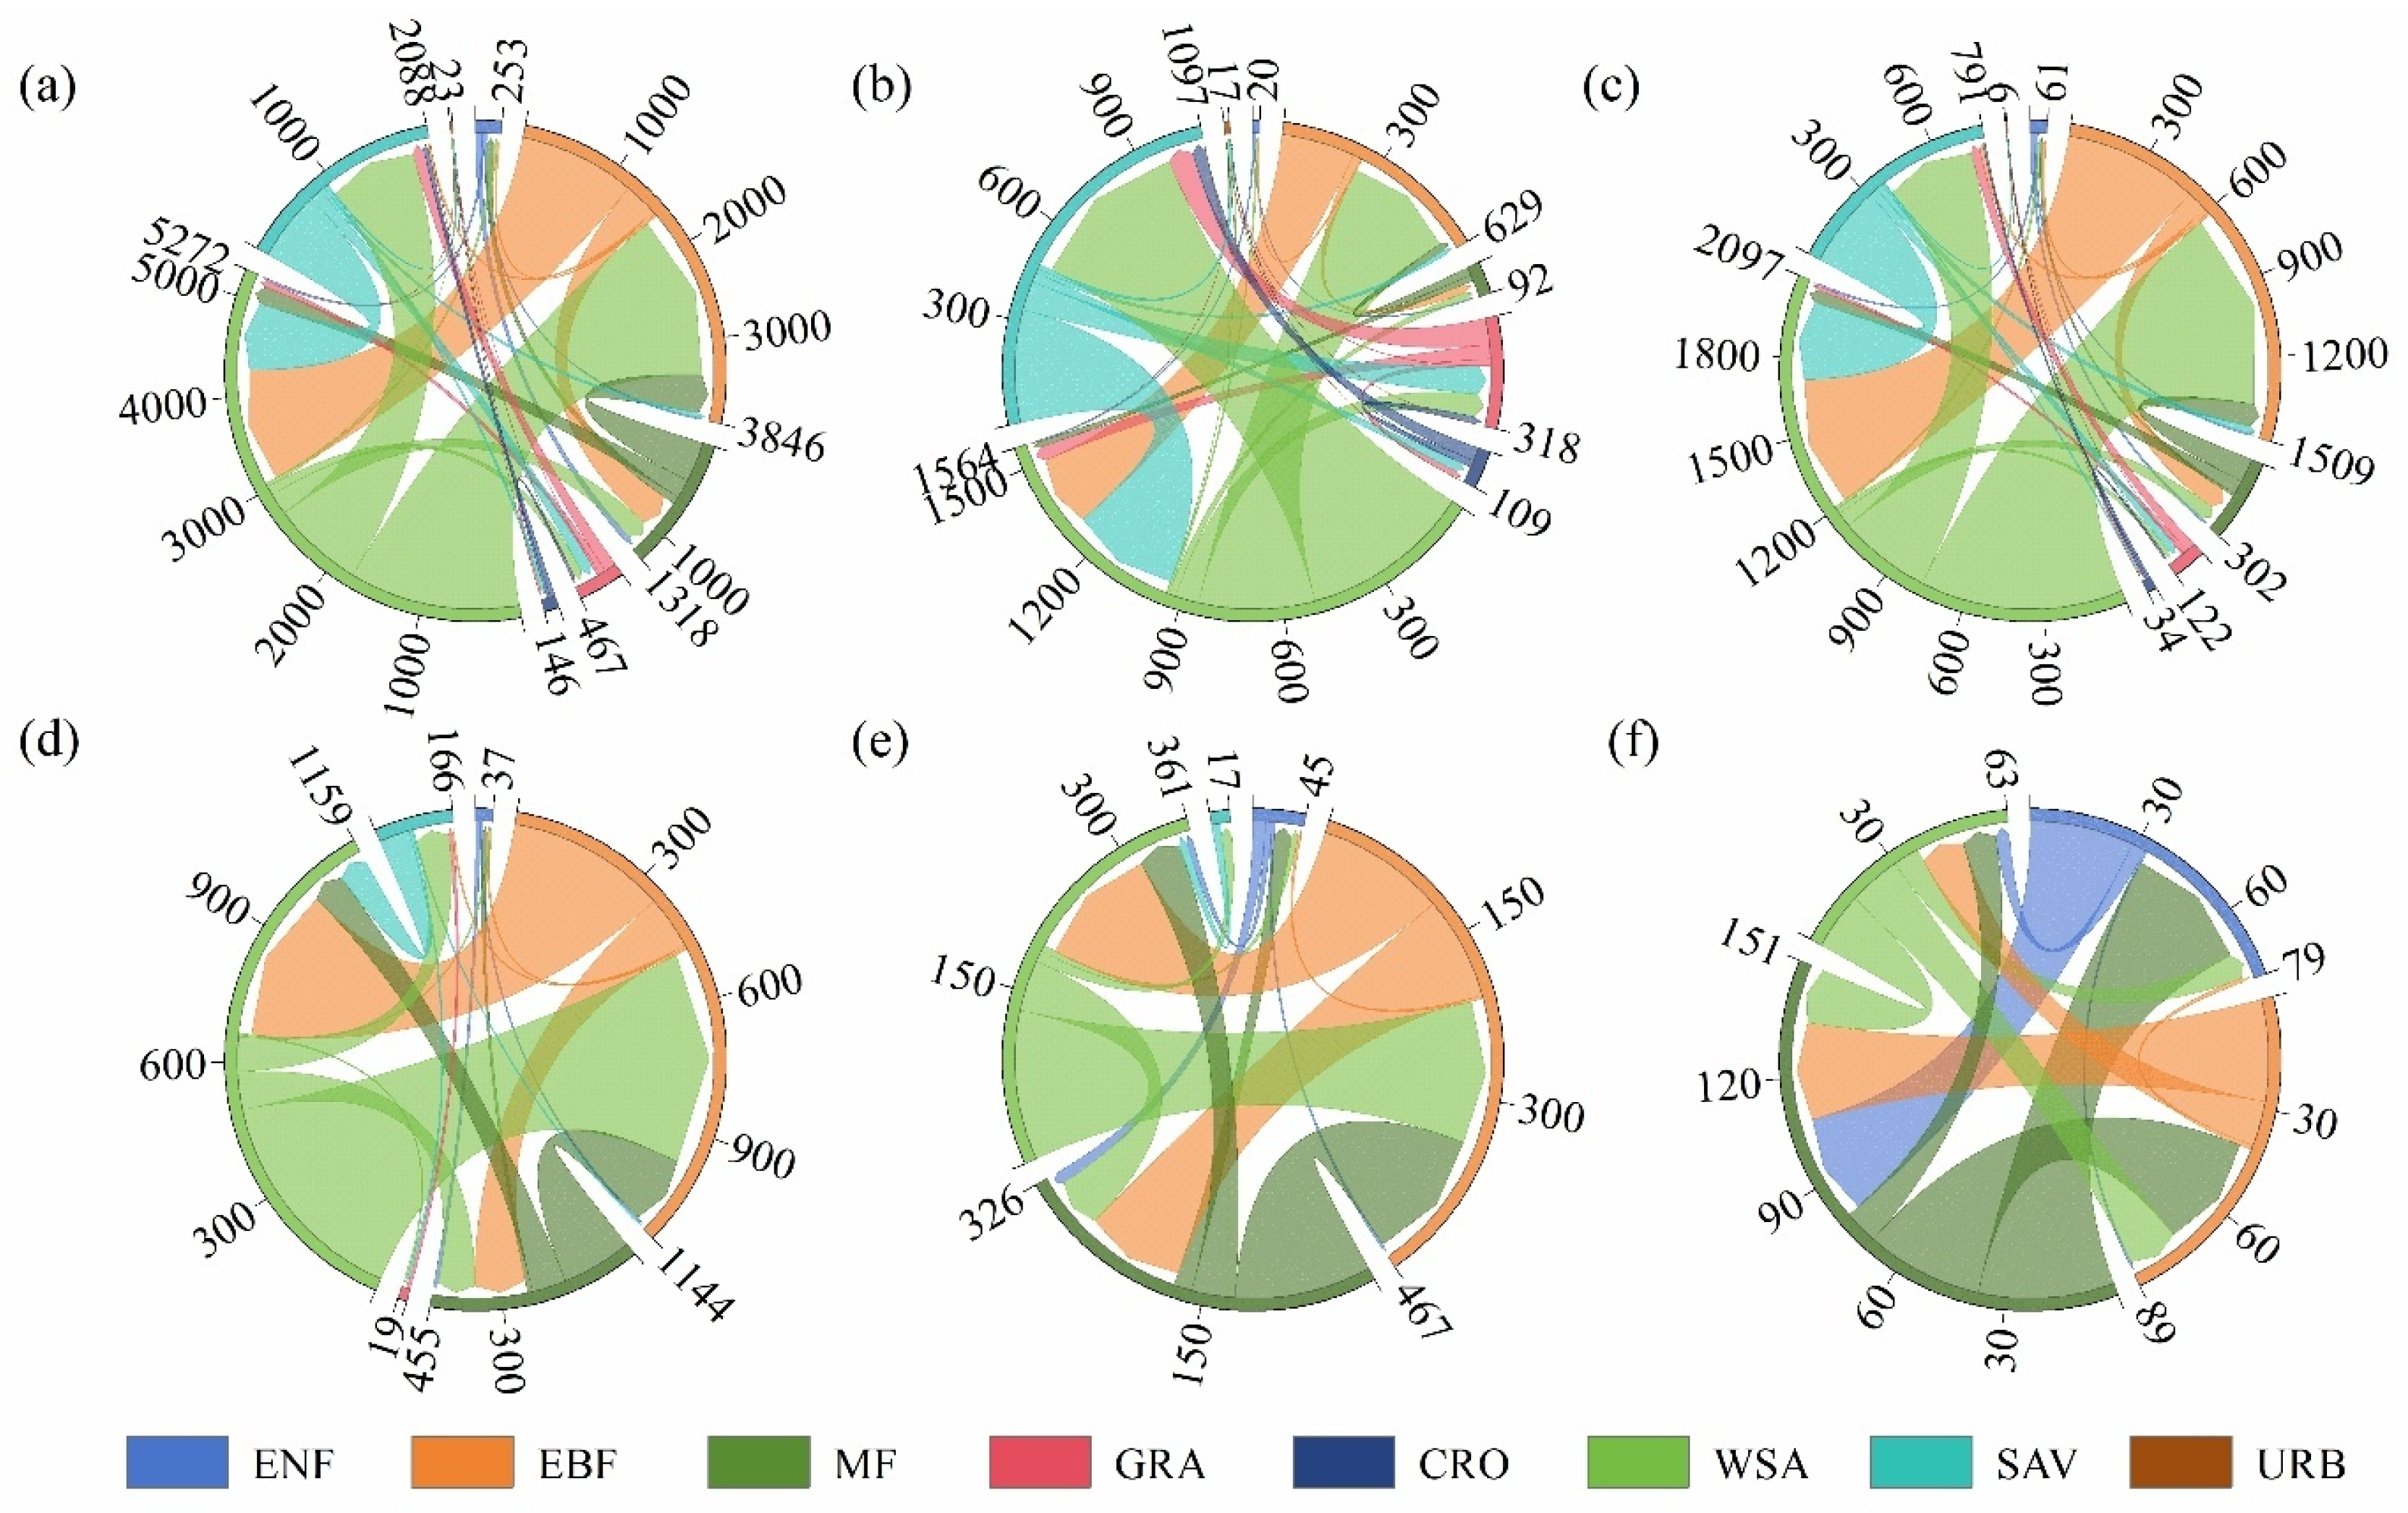
3.2. Land Use Type Transition Induced NPP Changes in the Wuyi Mountains During 2000–2022

Figure 5 and Table 4 present the area values of land use type transitions that occurred during 2000–2022 (Figure 5), as well as the change in NPP calculated based on the base data in 2000 in the Wuyi Mountains (Table 4). As shown in Figure 5a, the woody–savanna-type vegetation experienced the largest reduction in area during 2000–2022, with a total decrease of 3061.90 × 103 hm2. The evergreen broadleaf forest exhibited the largest increase in area, expanding by 2244.43 × 103 hm2. Overall, there was a shift in vegetation types from relatively low NPP to relatively high NPP categories. It can be calculated that, if only through these “low to high” positive vegetation transfers over 23 years, the total NPP should increase by 353.64 GgC. However, in both the R1 and R2 altitude sections, the situation of NPP loss caused by the encroachment of urban and built-up lands on vegetation occurred, such as cropland, grassland, and some savanna, as shown in Figure 5b,c. This loss amounts to a total of 147.92 GgC, as shown in Table 4. The NPP loss of the savanna type was the greatest, with a total reduction of 122.33 GgC in these two altitude sections. Therefore, from 2000 to 2022, the total NPP of the Wuyi Mountains increased by 211.58 GgC (Table 4).
The transformation of vegetation types at different altitude segments varied. As shown in Figure 5b, in R1, woody savanna vegetation (relatively high NPP) was mainly replaced by savanna vegetation (relatively low NPP), covering 26.02% of the total area where vegetation transitions occurred. This shift led to a decrease in NPP in R1 by 119.44 GgC (Table 4). In contrast, in R2, R3, and R4, it was mainly found that woody savanna (relatively low NPP) transitioned to evergreen broadleaf forest (relatively high NPP; Figure 5c–e), accounting for 31.27%, 33.13%, and 21.83% of the total transition area, respectively. Consequently, the NPP values in these three elevation zones increased by 149.89 GgC, 128.10 GgC, and 38.28 GgC, respectively (Table 4). In R5 (Figure 5f), mixed forest (relatively low NPP) was largely replaced by evergreen coniferous forest and evergreen broadleaf forest (relatively high NPP), covering 36.44% of the total transformation area. As a result, NPP in this zone increased by 14.75 GgC (Table 4).

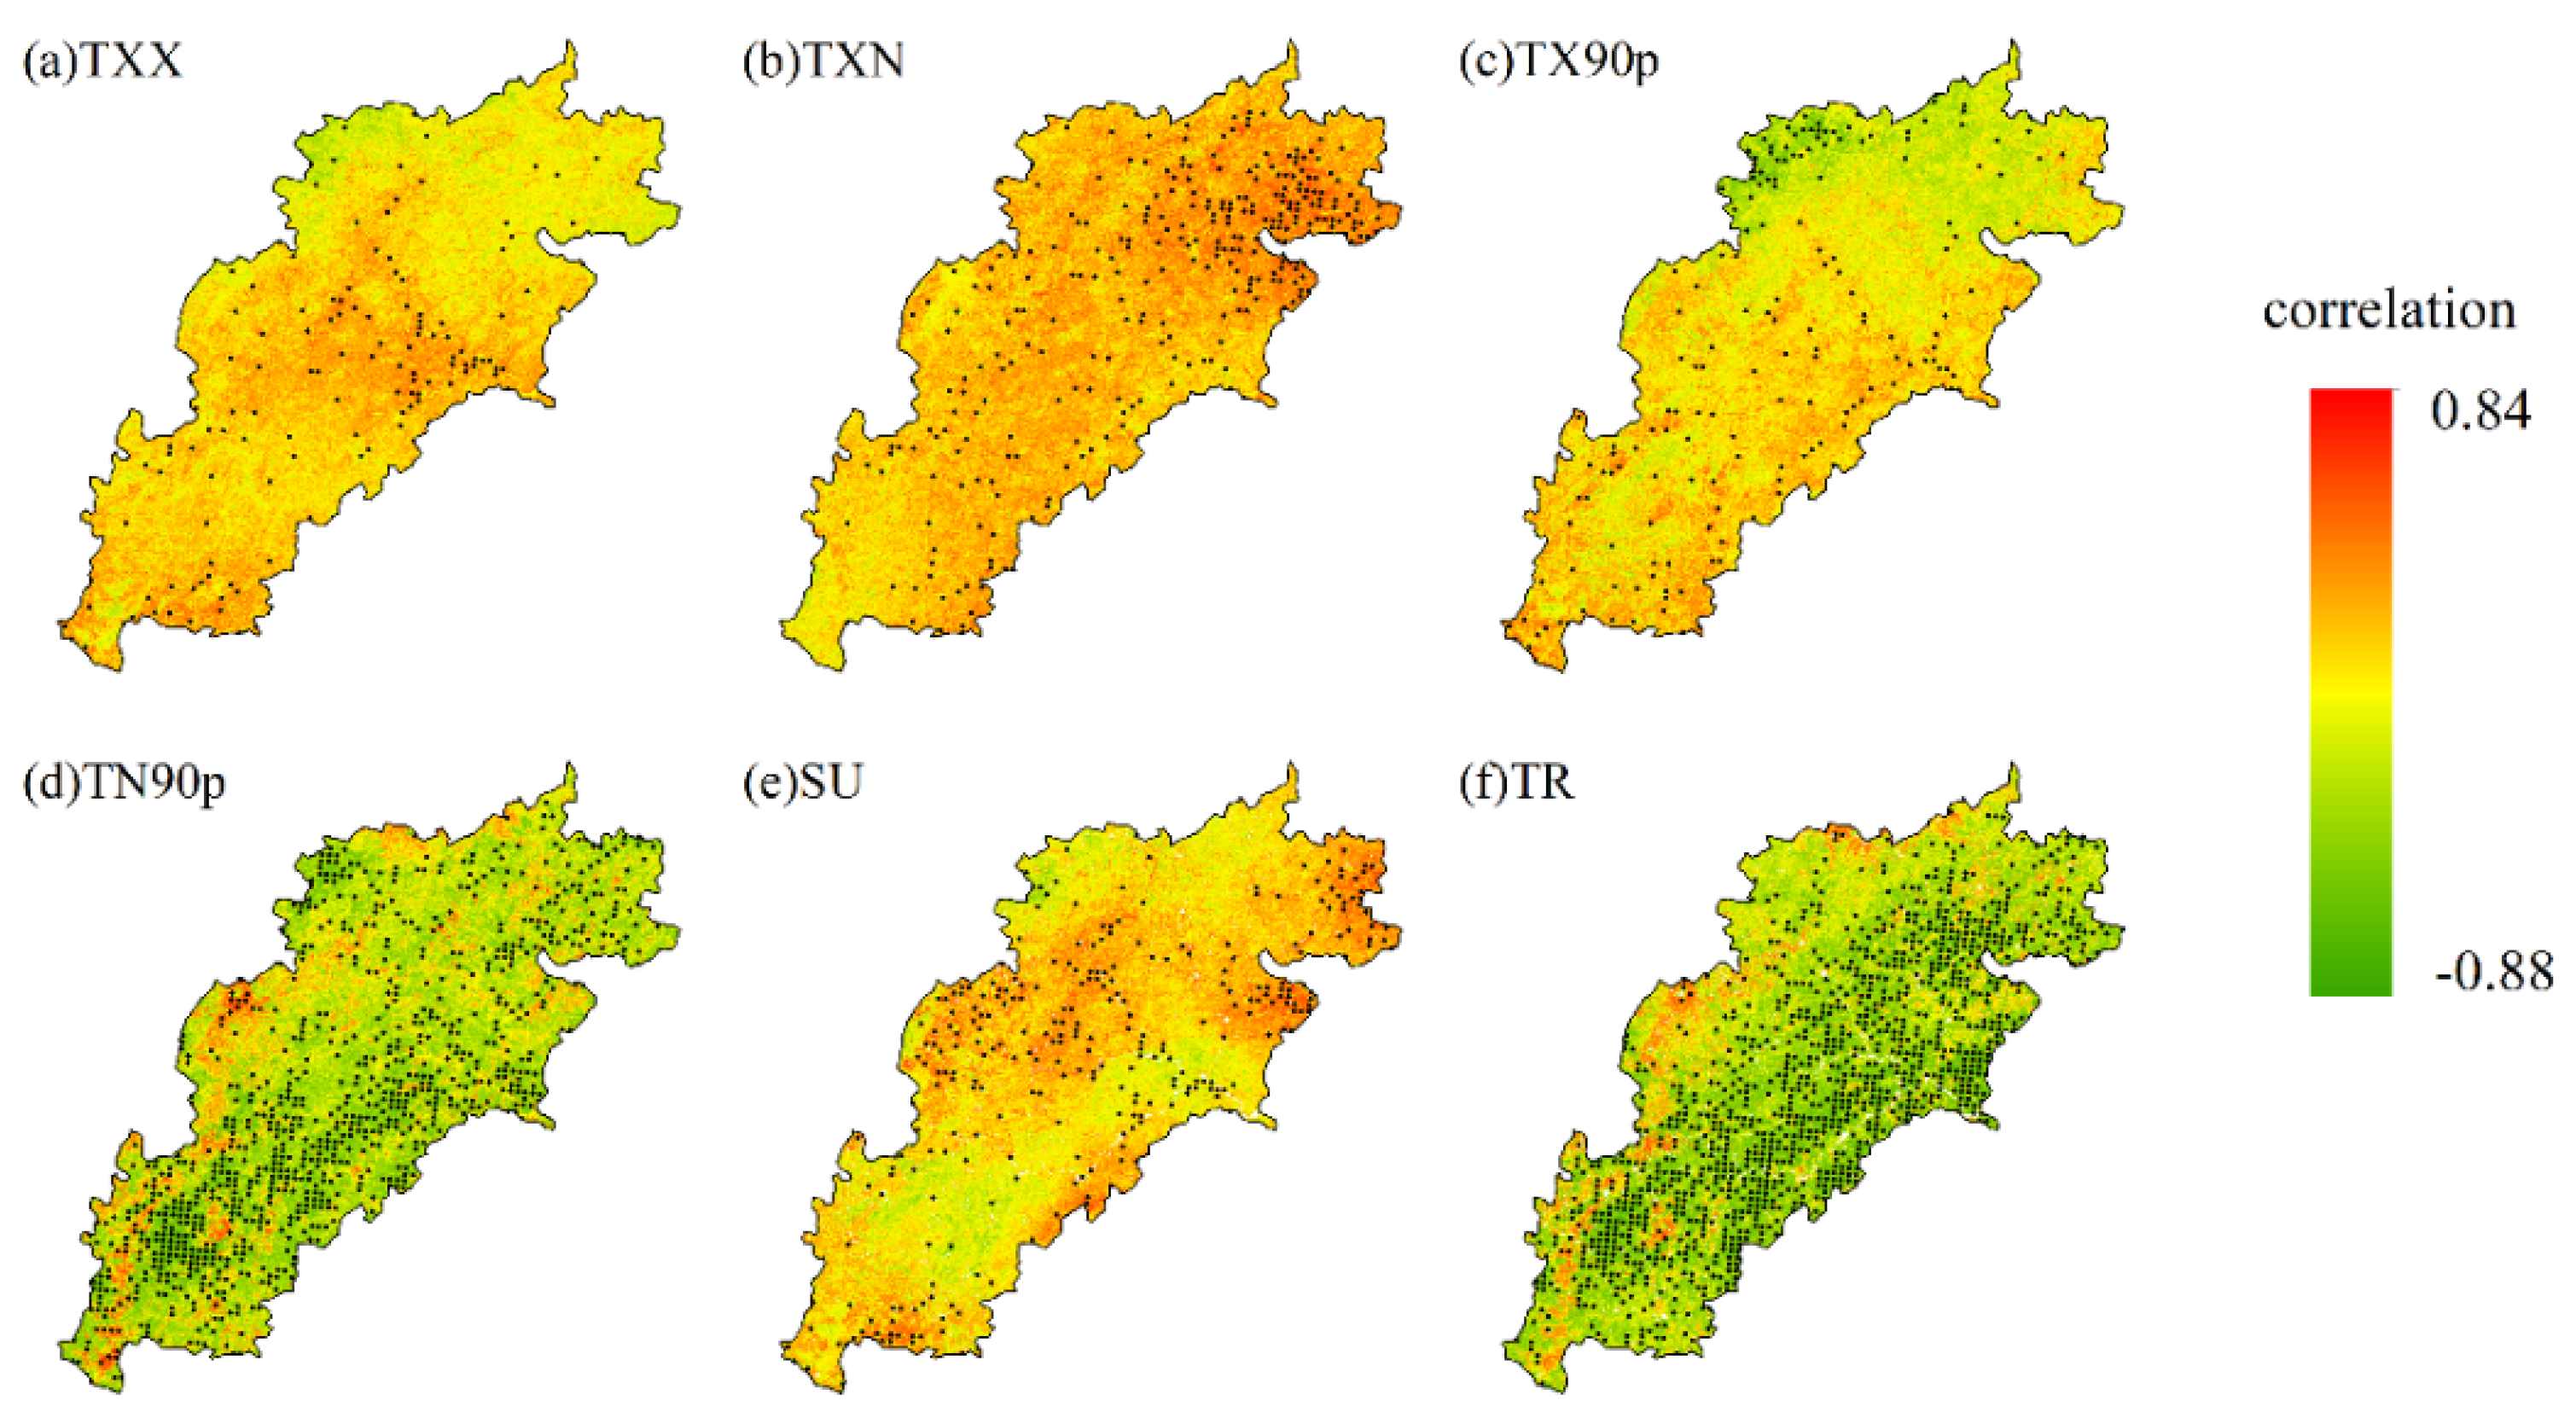
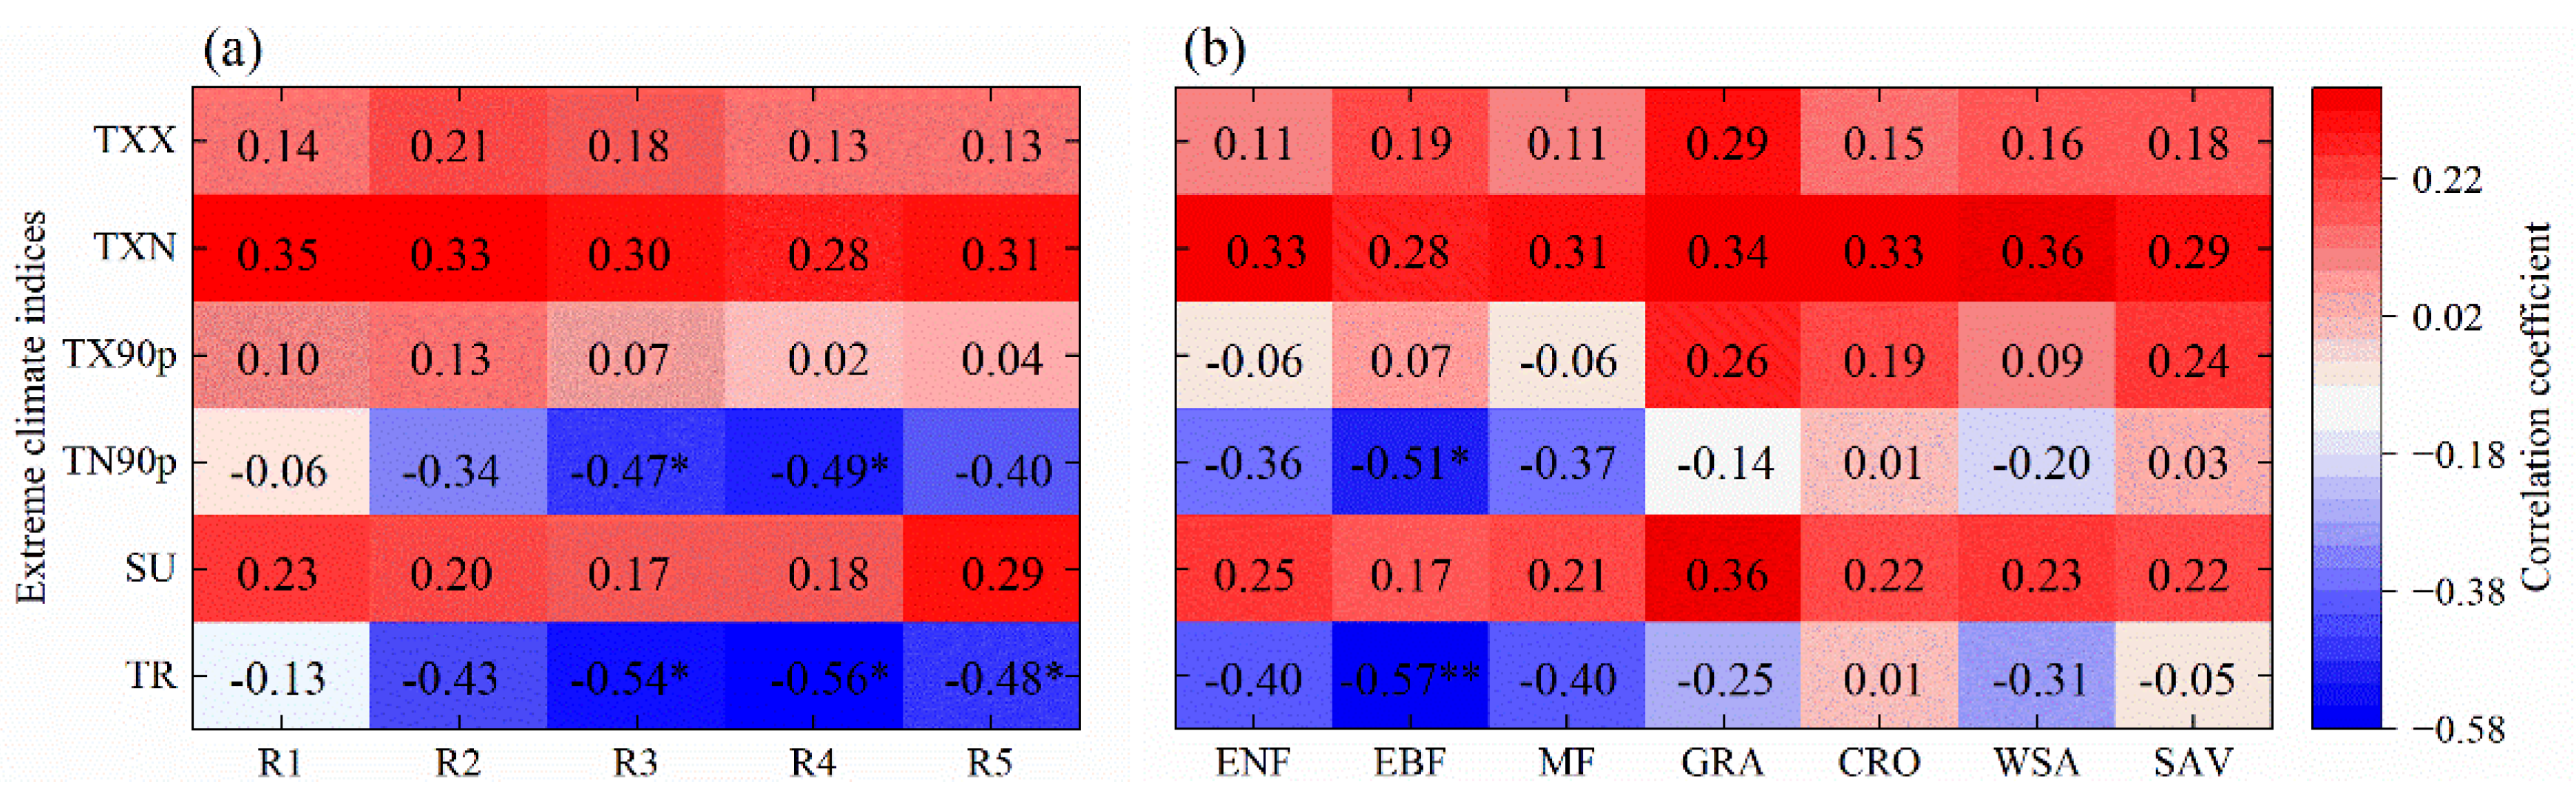
3.3. Effect of Disturbance of Extreme High Temperatures on NPP in the Wuyi Mountains During 2000–2022

The spatial distributions of the correlations between NPP and six types of extreme high temperature indices in the Wuyi Mountains during 2000–2022 are presented in Figure 6. It is evident that the response of NPP to different extreme high temperature indices varied significantly. Some indices even exhibited a positive contribution to NPP; that is, higher values of these extreme temperature indices were associated with greater NPP values. For instance, TXX, TXN, and SU demonstrated strong positive correlations with NPP in 70.40% (Figure 6a), 88.62% (Figure 6b), and 70.62% (Figure 6e) of the study area, respectively. Additionally, TX90p showed a positive correlation in over 60% of the study area (Figure 6c). These four extreme high temperature indices represent maximum temperatures and daytime temperatures, which are closely linked to abundant precipitation in the study area [44]. In contrast, the remaining two indices, TN90p and TR, representing extreme nighttime high temperatures, exhibited negative correlations with NPP in 79.28% (Figure 6d) and 82.39% (Figure 6f) of the study area, respectively. The correlations were significant in 32.25% and 42.56% of these areas (p < 0.05), respectively. These regions are predominantly located in the eastern and southern parts of the study area.
The impact of extreme high temperatures on NPP varied with elevation and vegetation types. Figure 7a,b illustrate the correlations between the six extreme high temperature indices and NPP across different elevation zones and vegetation type. As shown in Figure 7a,b, indices representing daytime extreme high temperatures (TXX, TXN, TX90p, and SU) exhibited weak positive correlations with NPP for most vegetation types and elevation zones, with all correlation coefficients below 0.4 (p > 0.05). In contrast, nighttime extreme high temperature indices (TN90p and TR) showed negative correlations with NPP for nearly all vegetation types across all elevation zones in the Wuyi Mountains. Notably, TN90p and TR were significantly negatively correlated with evergreen broadleaf forests (the two correlation coefficients are less than −0.5; p < 0.01; Figure 7b), which is particularly evident in the altitudes of R3 and R4 (p < 0.05; Figure 7a), which were also the primary altitude ranges for EBF distribution in the study area (Figure 3). Furthermore, compared to TN90p, TR demonstrated a stronger negative correlation with NPP, extending its negative influence on EBF even into the R5 section (Figure 7a). Temporal trend analysis of the six high temperature indices revealed that only TN90p and TR significantly increased over time from 2000 to 2022, with R2 values of 0.56 and 0.39 (p < 0.05), respectively. Therefore, evergreen broadleaf forests at elevations above 500 m in the Wuyi Mountains may experience NPP loss due to rising nighttime extreme high temperatures.
The interannual changes in EBF’s NPP in R3, R4, and R5 of the Wuyi Mountains during 2000–2022 were investigated. The results showed that despite increases in EBF areas by 203.58 × 10³, 52.53 × 10³, and 5.18 × 10³ hm2 in these three elevation zones, respectively, the corresponding NPP values exhibited a continuous decreasing trend. The cumulative reductions in EBF NPP for these zones over the study period were 100.86, 52.00, and 14.09 GgC, respectively, resulting in a total reduction of 166.95 GgC. These reductions were closely associated with the effects of “hot nights” and “warm nights.” The average values of TR and TN90p during the study period were 130.37 days and 10.4 days, respectively. In years when both TR and TN90p exceeded their mean values (e.g., 2005, 2014–2016, and 2020), the corresponding total reduction in EBF NPP in R3–R5 was 127.36 GgC, accounting for 76.29% of the total reduction in these three elevation zones. Additionally, it was found that 82.4% of TR and 98.19% of TN90p occurred between June and September, corresponding to the summer and early autumn seasons in subtropical regions, which coincide with the peak growing seasons of EBF. Therefore, it can be concluded that the increase in nighttime extreme high temperatures significantly inhibited the NPP of evergreen broadleaf forests at elevations greater than 500 m in the Wuyi Mountains.

4. Discussion

The spatial resolution of MOD17A3 (i.e., the NPP data from MODIS used in this study) is 500 m, generating a total of 328,763 grid cells across the Wuyi Mountains region. This number of grids still might not adequately capture the fine-scale structural details of mountain NPP [45], as the data are affected by the terrain factors in the identification of meteorological [46] and vegetation information [47] necessary for NPP inversion in mountain regions, resulting in inevitable errors. Currently, the most reliable NPP data still originate from plot-based observations; however, extending such work into mountainous regions poses significant challenges. Global Land Surface Satellite data (http://www.geodata.cn, accessed on 5 August 2024) offering higher temporal resolution are available, although the spatial resolution has yet to be improved. Additionally, while the widely used Carnegie–Ames–Stanford Approach (CASA) can simulate NPP values, its performance in mountainous regions also remains limited [48]. MOD17A3 data were employed in this study. Despite being relatively coarse, these data provided excellent spatiotemporal continuity, facilitating the analysis of NPP trends. For instance, the NPP increased along with the altitude in the Wuyi Mountains in this study. Although the increase trend is certain, the value of the vertical NPP increment change rate of 5.0 gC·m−2·hm−1 requires careful consideration.
The statistical methods employed in this study may have introduced errors into the numerical results. For example, based on 23 consecutive years of data, the relationship between NPP and the six extreme high temperature factors was analyzed individually for 328,763 grid cells using Pearson correlation, and significance testing was conducted to derive the spatial distribution of the relationship between them. While the conclusion is evident in this study, it is important to note that ecological data exhibit spatial autocorrelation, which may lead to inflated correlation values in adjacent regions [49]. Similarly, the natural breakpoint method, as a statistical approach for altitude segmentation, inherently overlooks spatial autocorrelation. Factors like slope and aspect were not taken into consideration, and, therefore, this method may exhibit limitations when applied to NPP research [50]. Additionally, the contribution of warming and ecologically oriented human activities to NPP in the Wuyi Mountains was not separately quantified. These issues are complex and may necessitate advanced methods, such as mixed-effects models [51] or geographic detectors [52], which can be applied in conjunction with Pearson correlation analysis. However, adopting these methods would increase computational demands and introduce additional statistical uncertainties [53], thereby complicating result interpretation. The method used in this study can effectively identify the impact of extreme high temperatures on NPP and provides meaningful insights into its statistical characteristics from a “trend” perspective [26]. Based on this, the weakening effect of nighttime extreme high temperatures on BEF NPP at altitudes above 500 m was successfully elucidated in this study, and this effect is aligned with the accumulated temperature effect influencing plant growth [54]. Nevertheless, precise quantification of these effects requires further rigorous validation.
The year 2000—several decades after the initiation of China’s forestry ecological engineering and natural forest protection projects—was selected as the starting point in this study to investigate changes in NPP. It provided a good opportunity to evaluate the productivity of forest vegetation management, verify the effect of ecological restoration [55], and put forward some references for further adjusting local forestry policies [56]. After analyzing 23 years of data, clear conclusions were drawn in this study regarding trends, and the effectiveness of forest management practices was affirmed.
The forest NPP in China has shown an overall increasing trend with the persistent implementation of forestry ecological engineering projects and the Natural Forest Protection Project in consideration of continuous climate warming [20]. However, this trend has exhibited significant temporal and spatial variability. At the end of the 20th century, the NPP of the Southern Forests in China had the highest annual rate of increase at 2.0% [57], surpassing the rates of 1.2% and 0.5% for the Southwest Forests [58] and the Northeast Forests [59], respectively. However, the increasing frequency of extreme climate events driven by global warming, along with changes in soil nutrients [60], may weaken or offset the positive effects of warming and CO2 fertilization, gradually slowing the growth in NPP in the Southern Forests in China [61]. In this study, we found that the average annual increment of NPP in the Wuyi Mountains during 2000–2022 was 0.11 C·m−2·year¹, corresponding to an average annual rate of increase of only 0.37%. This rate was lower than the increases observed in the Southwest Forests [43] and the Northeast Forests [42] during the same period and in the Southern Forests at the end of the 20th century. The reasons for the slowdown in the growth rate of NPP in the Wuyi Mountains region may be related to the expansion of human activity areas, the intensification of soil acidification caused by industrial pollution in the south of China [62], etc. This is clearly related to the extreme high temperatures at night, which were analyzed in this study.
In mountainous regions, the vegetation NPP generally reaches its maximum value at an elevation of around 2000 m and then decreases with the increase in elevation [63]. In the Wuyi Mountains, the variation in NPP was only manifested as an increase with the rise in altitude during 2000–2022, mainly because the elevations of the majority of the vegetation areas are less than 2000 m. Nevertheless, some areas with elevations of greater than 1500 m also exhibited a decreasing NPP trend with the increase in elevation of about –21.88 gC·m−2·hm−1 (Figure 4). This is consistent with the reason for the fastest NPP growth rate in the R1 low-altitude section of the region, and it is aligned with the influence of altitude-driven variations in temperature, precipitation, sunlight, and CO2 concentration on forest NPP in mountainous areas [64].
During 2000–2022, the forest area in the Wuyi Mountains exhibited a slightly decreasing trend, while NPP showed an overall increasing trend. According to calculations conducted in this study, the increase in NPP was primarily attributed to the transition of vegetation from low NPP types to high NPP types, which was closely associated with the implementation of ecologically oriented forestry policies, including the tending of woods and the establishment of nature reserves. This conclusion is supported by regional data. For instance, sustainable forest management in Europe has increased NPP by approximately 10% in managed areas [65]. NPP has risen by 5–10% in biodiversity conservation areas within the Amazon rainforest [66] and, since the initiation of forestry ecological engineering projects and the Natural Forest Protection Project in China, NPP has increased by about 10–15% in natural forest areas [67]. Of course, as many studies have highlighted, the increase in NPP is also linked to warming and the CO2 fertilization effect. However, the unprecedentedly high CO2 concentrations observed in the 21st century, combined with the slowing growth rate of NPP in the Southern Forests, indicate that the impact of warming on NPP increase is non-linear [68]. In fact, the influences of warming and forest management on NPP often interact synergistically and are difficult to disentangle. For example, forest management practices that promote the expansion of forest area can help mitigate the negative impacts of extreme climate events on NPP [69]. However, large-scale planting may increase the risk of forest pests and diseases under changing climatic conditions [69] and enhance the release of carbon from forest soils, particularly in high-latitude regions [70], underscoring the complexity of the NPP issue.
Climate change exhibits a dual effect on NPP that is similar to how human activities have both positive and negative impacts on vegetation NPP in the Wuyi Mountains. Nighttime extreme high temperatures tend to suppress NPP, whereas daytime high temperatures generally promote it in the Wuyi Mountains. This phenomenon may be related to the fact that NPP is typically more sensitive to nighttime warming under climate change conditions [71], particularly in Southeastern China [72]. However, the effects of nighttime warming and extreme high temperatures vary across regions. For example, in high-latitude areas, nighttime high temperatures may enhance NPP [73]. The impact of nighttime high temperatures also differs among vegetation types. In subtropical regions, evergreen broadleaf forests appear to be more sensitive to nighttime high temperatures compared to evergreen coniferous and mixed forests [60]. Nevertheless, the data analyzed in this study suggest that the positive effects of both human activities and climate change on NPP in the Wuyi Mountains outweigh their negative effects, resulting in a continuous increase in overall NPP during the study period.
In terms of meteorological disasters affecting NPP, studies on subtropical forest ecosystems focus more on typhoons, floods, and low-temperature frost damage [74]. Fewer studies have examined the inhibitory effects of extreme high temperatures, and specific analyses of different high-temperature indicators are even scarcer. This paper provides an example of how extreme nighttime high temperatures impact the NPP of subtropical forests. Of course, variations in NPP are also influenced by intrinsic changes in trees, such as alterations in forest age [75]. However, after 2000, the forests in the Wuyi Mountains were predominantly middle-aged and near-mature forests [76]. This forest age composition reduced the influence of the approximately 20-year temporal change on NPP [77], which might be another reason for the slowdown in the growth rate of NPP in the Wuyi Mountains [78]. Nevertheless, the impact of forest age on NPP in young and old forests remains a critical factor for long-term analysis.

5. Conclusions

From 2000 to 2022, the NPP of vegetation in the Wuyi Mountains exhibited a slight increasing trend, with spatial distribution characterized by unevenness. Specifically, higher NPP values were observed in the northeastern and southern regions, while lower values were recorded in the central area. Over the 23-year period, NPP demonstrated an average increase with altitude. Among different altitudinal segments, the R1 segment (below 298 m) exhibited the lowest NPP values but showed the most significant increasing trend over time and along the vertical gradient. Continuous forestry policies and climate warming in China have facilitated the transition of relatively low NPP vegetation types (e.g., farmland and savannas) to high NPP vegetation types (e.g., evergreen broadleaf and evergreen coniferous forests). This transformation resulted in a cumulative NPP increase of 211.58 GgC in the Wuyi Mountains over the past 23 years. However, two factors have also contributed to weakening NPP: the expansion of human activity areas below 500 m, reducing NPP by 147.92 GgC, and the suppression of NPP in evergreen broadleaf forests above 500 m due to increased nighttime extreme high temperatures under climate change conditions, reducing NPP by 127.36 GgC. This study provides valuable data support for understanding forest responses to global change in regions affected by relatively mild climate change.

Author Contributions

Conceptualization, Y.Y., Q.L., Y.Z. and W.W.; methodology, Y.Y., Q.L. and S.W.; software, Q.L., Y.Y. and S.W.; formal analysis, Y.Y., C.Z. and Q.L.; data curation, Q.L., Y.Y., S.W. and C.Z.; writing—original draft preparation, Y.Y. and Q.L.; writing—review and editing, Y.Y., Y.Z., W.W., Q.L. and S.W. All authors have read and agreed to the published version of the manuscript.

Funding

This research was jointly funded by the National Key Research and Development Program of China (2021YFD2200404), the Fujian Forestry science and technology project (2022FKJ28) and the National Natural Science Foundation of China (grant number 31971670).

Data Availability Statement

The original contributions presented in the study are included in the article; further inquiries can be directed to the corresponding author.

Acknowledgments

We thank the reviewers for their insightful suggestions and comments.

Conflicts of Interest

The authors declare no conflicts of interest.

References

  1. Chen, J.D.; Li, Z.W.; Song, M.L.; Dong, Y.Z. Decomposing the Global Carbon Balance Pressure Index: Evidence from 77 Countries. Environ. Sci. Pollut. Res. 2021, 28, 7016–7031. [Google Scholar] [CrossRef] [PubMed]
  2. Pan, Y.D.; Birdsey, R.A.; Phillips, O.L.; Houghton, R.A.; Fang, J.Y.; Kauppi, P.E.; Keith, H.; Kurz, W.A.; Ito, A.; Lewis, S.L.; et al. The Enduring World Forest Carbon Sink. Natrue 2024, 631, 563–569. [Google Scholar] [CrossRef] [PubMed]
  3. Ke, S.F.; Zhang, Z.; Wang, Y.M. China’s Forest Carbon Sinks and Mitigation Potential from Carbon Sequestration Trading Perspective. Ecol. Indic. 2023, 148, 110054. [Google Scholar] [CrossRef]
  4. Field; Behrenfeld; Randerson; Falkowski. Primary Production of the Biosphere: Integrating Terrestrial and Oceanic Components. Science 1998, 281, 237–240. [Google Scholar] [CrossRef]
  5. Lapola, D.M.; Pinho, P.; Barlow, J.; Aragao, L.E.O.C.; Berenguer, E.; Carmenta, R.; Liddy, H.M.; Seixas, H.; Silva, C.V.J.; Silva-Junior, C.H.L.; et al. The Drivers and Impacts of Amazon Forest Degradation. Science 2023, 379, 349. [Google Scholar] [CrossRef]
  6. Curtis, P.G.; Slay, C.M.; Harris, N.L.; Tyukavina, A.; Hansen, M.C. Classifying Drivers of Global Forest Loss. Science 2018, 361, 1108–1111. [Google Scholar] [CrossRef]
  7. Winkler, K.; Yang, H.; Ganzenmueller, R.; Fuchs, R.; Ceccherini, G.; Duveiller, G.; Grassi, G.; Pongratz, J.; Bastos, A.; Shvidenko, A.; et al. Changes in Land Use and Management Led to a Decline in Eastern Europe’s Terrestrial Carbon Sink. Commun. Earth Environ. 2023, 4, 237. [Google Scholar] [CrossRef]
  8. Nabuurs, G.J.; Pussinen, A.; Karjalainen, T.; Erhard, M.; Kramer, K. Stemwood Volume Increment Changes in European Forests Due to Climate Change—A Simulation Study with the EFISCEN Model. Glob. Chang. Biol. 2002, 8, 304–316. [Google Scholar] [CrossRef]
  9. Xue, H.Z.; Chen, Y.P.; Dong, G.T.; Li, J.Y. Quantitative Analysis of Spatiotemporal Changes and Driving Forces of Vegetation Net Primary Productivity (NPP) in the Qimeng Region of Inner Mongolia. Ecol. Indic. 2023, 154, 110610. [Google Scholar] [CrossRef]
  10. Lu, F.; Hu, H.F.; Sun, W.J.; Zhu, J.J.; Liu, G.B.; Zhou, W.M.; Zhang, Q.F.; Shi, P.L.; Liu, X.P.; Wu, X.; et al. Effects of National Ecological Restoration Projects on Carbon Sequestration in China from 2001 to 2010. Proc. Natl. Acad. Sci. USA 2018, 115, 4039–4044. [Google Scholar] [CrossRef]
  11. Geng, Q.L.; Ren, Q.F.; Yan, H.M.; Li, L.H.; Zhao, X.I.; Mu, X.M.; Wu, P.; Yu, Q. Target Areas for Harmonizing the Grain for Green Programme in Chinas Loess Plateau. Land Degrad. Dev. 2020, 31, 325–333. [Google Scholar] [CrossRef]
  12. Chen, C.; Park, T.; Wang, X.H.; Piao, S.L.; Xu, B.D.; Chaturvedi, R.K.; Fuchs, R.; Brovkin, V.; Ciais, P.; Fensholt, R.; et al. China and India Lead in Greening of the World through Land-Use Management. Nat. Sustain. 2019, 2, 122–129. [Google Scholar] [CrossRef] [PubMed]
  13. Bryan, B.A.; Gao, L.; Ye, Y.Q.; Sun, X.F.; Connor, J.D.; Crossman, N.D.; Stafford-Smith, M.; Wu, J.G.; He, C.Y.; Yu, D.Y.; et al. China’s Response to a National Land-System Sustainability Emergency. Nature 2018, 559, 193–204. [Google Scholar] [CrossRef]
  14. Yang, Y.; Hou, Z.; Zhang, Z. NDVI Changes and Driving Factors in Southwest China from 2001 to 2018. Bull. Soiland Water Conserv. 2021, 2, 338–343. [Google Scholar] [CrossRef]
  15. Bastos, A.; Ciais, P.; Friedlingstein, P.; Sitch, S.; Pongratz, J.; Fan, L.; Wigneron, J.P.; Weber, U.; Reichstein, M.; Fu, Z.; et al. Direct and Seasonal Legacy Effects of the 2018 Heat Wave and Drought on European Ecosystem Productivity. Sci. Adv. 2020, 6, eaba2724. [Google Scholar] [CrossRef]
  16. Sun, B.F.; Zhao, H.; Wang, X.K. Effects of Drought on Net Primary Productivity: Roles of Temperature, Drought Intensity, and Duration. Chin. Geogr. Sci. 2016, 26, 270–282. [Google Scholar] [CrossRef]
  17. Jing, X.D.; Zhang, D.H.; Li, X.S.; Zhang, W.C.; Zhang, Z.J. Prediction of Forest Fire Occurrence in Southwestern China. Forests 2023, 14, 1797. [Google Scholar] [CrossRef]
  18. Zhang, W.Y.; Yang, Y.R.; Hu, C.; Zhang, L.Y.; Hou, B.; Wang, W.F.; Li, Q.Q.; Li, Y.S. NPP and Carbon Emissions under Forest Fire Disturbance in Southwest and Northeast China from 2001 to 2020. Forests 2023, 14, 999. [Google Scholar] [CrossRef]
  19. Qi, X.; Liu, S.H.; Wu, S.A.; Wang, J.; Wang, J.M.; Zheng, C.; Wang, Y.; Liu, Y.; Luo, Q.; Li, Q.L.; et al. Interannual Variations in Terrestrial Net Ecosystem Productivity and Climate Attribution in the Southern Hilly Region of China. Plants 2024, 13, 246. [Google Scholar] [CrossRef]
  20. Piao, S.L.; Wang, X.H.; Park, T.; Chen, C.; Lian, X.; He, Y.; Bjerke, J.W.; Chen, A.; Ciais, P.; Tommervik, H.; et al. Characteristics, Drivers and Feedbacks of Global Greening. Nat. Rev. Earth Environ. 2020, 1, 14–27. [Google Scholar] [CrossRef]
  21. Wu, J.S.; Zhao, Y.H.; Yuan, T.; Chen, B.K. Evolution of Typhoon Disasters Characteristics and Non-Structural Disaster Avoidance Measures in the China Coastal Main Functional Area. Int. J. Disaster Risk Reduct. 2020, 46, 101490. [Google Scholar] [CrossRef]
  22. Song, L.C. Yearbook of Meteorological Disasters in China (2000–2022); Meteorological Press: Beijing, China, 2022.
  23. Wei, L.; Hu, K.H.; Hu, X.D. Rainfall Occurrence and Its Relation to Flood Damage in China from 2000 to 2015. J. Mt. Sci. 2018, 15, 2492–2504. [Google Scholar] [CrossRef]
  24. Zhou, G.Y.; Peng, C.H.; Li, Y.L.; Liu, S.Z.; Zhang, Q.M.; Tang, X.L.; Liu, J.X.; Yan, J.H.; Zhang, D.Q.; Chu, G.W. A Climate Change-Induced Threat to the Ecological Resilience of a Subtropical Monsoon Evergreen Broad-Leaved Forest in Southern China. Glob. Chang. Biol. 2013, 19, 1197–1210. [Google Scholar] [CrossRef] [PubMed]
  25. Hu, G.; Lu, M.H.; Reynolds, D.R.; Wang, H.K.; Chen, X.; Liu, W.C.; Zhu, F.; Wu, X.W.; Xia, F.; Xie, M.C.; et al. Long-Term Seasonal Forecasting of a Major Migrant Insect Pest: The Brown Planthopper in the Lower Yangtze River Valley. J. Pest Sci. 2019, 92, 417–428. [Google Scholar] [CrossRef]
  26. Yuan, W.P.; Cai, W.W.; Chen, Y.; Liu, S.G.; Dong, W.J.; Zhang, H.C.; Yu, G.R.; Chen, Z.Q.; He, H.G.; Guo, W.D.; et al. Severe Summer Heatwave and Drought Strongly Reduced Carbon Uptake in Southern China. Sci. Rep. 2016, 6, 18813. [Google Scholar] [CrossRef]
  27. Ding, H.; Fang, Y.M.; Yang, Q.; Chen, X.; Yuan, F.Y.; Xu, H.; He, L.H.; Yan, J.; Chen, T.T.; Yu, C.J.; et al. Community Characteristics of a Mid-Subtropical Evergreen Broad-Leaved Forest Plot in the Wuyi Mountains, Fujian Province, Southeastern China. Biodivers. Sci. 2015, 23, 479–492. [Google Scholar] [CrossRef]
  28. He, J.; Yang, M.M.; Liu, J.; Chen, J.M.; Xie, X.Y. Impacts of Vegetation Greening and Climate Change on Trend and Interannual Variability in Vegetation Productivity in the Wuyi Mountain Region. Geo-Spat. Inf. Sci. 2025, 28, 224–245. [Google Scholar] [CrossRef]
  29. Li, Q.F.; Yang, G.J. Temporal Distribution Characteristics of Alpine Precipitation and Their Vertical Differentiation: A Case Study from the Upper Shule River. Water 2017, 9, 284. [Google Scholar] [CrossRef]
  30. Ge, W.Y.; Deng, L.Q.; Wang, F.; Han, J.Q. Quantifying the Contributions of Human Activities and Climate Change to Vegetation Net Primary Productivity Dynamics in China from 2001 to 2016. Sci. Total Environ. 2021, 773, 145648. [Google Scholar] [CrossRef]
  31. Wei, X.K.; Wang, G.J.; Chen, T.X.; Hagan, D.F.T.; Ullah, W. A Spatio-Temporal Analysis of Active Fires over China during 2003–2016. Remote Sens. 2020, 12, 1787. [Google Scholar] [CrossRef]
  32. Wang, J.N.; Wang, Y.Q.; Li, M.Y.; Qi, Z.H.; Li, C.; Qi, H.M.; Zhang, X.M. Improved Landslide Susceptibility Assessment: A New Negative Sample Collection Strategy and a Comparative Analysis of Zoning Methods. Ecol. Indic. 2024, 169, 112948. [Google Scholar] [CrossRef]
  33. Zscheischler, J.; Martius, O.; Westra, S.; Bevacqua, E.; Raymond, C.; Horton, R.M.; van den Hurk, B.; AghaKouchak, A.; Jezequel, A.; Mahecha, M.D.; et al. A Typology of Compound Weather and Climate Events. Nat. Rev. Earth Environ. 2020, 1, 333–347. [Google Scholar] [CrossRef]
  34. Yang, Q.R.; Jiang, C.; Ding, T. Impacts of Extreme-High-Temperature Events on Vegetation in North China. Remote Sens. 2023, 15, 4542. [Google Scholar] [CrossRef]
  35. Tao, J.; Xu, T.Q.; Dong, J.W.; Yu, X.Q.; Jiang, Y.B.; Zhang, Y.G.; Huang, K.; Zhu, J.T.; Dong, J.X.; Xu, Y.M.; et al. Elevation-Dependent Effects of Climate Change on Vegetation Greenness in the High Mountains of Southwest China during 1982–2013. Int. J. Climatol. 2018, 38, 2029–2038. [Google Scholar] [CrossRef]
  36. Guo, B.B.; Zhang, J.; Meng, X.Y.; Xu, T.B.; Song, Y.Y. Long-term spatio-temporal precipitation variations in China with precipitation surface interpolated by ANUSPLIN. Sci Rep. 2020, 10, 81. [Google Scholar] [CrossRef]
  37. Wang, G.J.; Peng, W.F.; Zhang, L.D.; Zhang, J. Quantifying the Impacts of Natural and Human Factors on Changes in NPP Using an Optimal Parameters-Based Geographical Detector. Ecol. Indic. 2023, 155, 111018. [Google Scholar] [CrossRef]
  38. Wu, Y.Z.; Tang, G.P.; Gua, H.; Liu, Y.L.; Yang, M.Z.; Sun, L. The Variation of Vegetation Greenness and Underlying Mechanisms in Guangdong Province of China during 2001-2013 Based on MODIS Data. Sci. Total Environ. 2019, 653, 536–546. [Google Scholar] [CrossRef] [PubMed]
  39. Ren, Y.T.; Zhang, F.; Zhao, C.L.; Cheng, Z.Q. Attribution of Climate Change and Human Activities to Vegetation NDVI in Jilin Province, China during 1998–2020. Ecol. Indic. 2023, 153, 110415. [Google Scholar] [CrossRef]
  40. Lin, N.; Li, J.X.; Jiang, R.Z.; Li, X.; Liu, S. Quantifying the Spatiotemporal Variation of NPP of Different Land Cover Types and the Contribution of Its Associated Factors in the Songnen Plain. Forests 2023, 14, 1841. [Google Scholar] [CrossRef]
  41. Yin, S.Y.; Du, H.Q.; Mao, F.J.; Li, X.J.; Zhou, G.M.; Xu, C.H.; Sun, J.Q. Spatiotemporal Patterns of Net Primary Productivity of Subtropical Forests in China and Its Response to Drought. Sci. Total Environ. 2024, 913, 169439. [Google Scholar] [CrossRef]
  42. Wang, C.L.; Jiang, Q.O.; Deng, X.Z.; Lv, K.X.; Zhang, Z.H. Spatio-Temporal Evolution, Future Trend and Phenology Regularity of Net Primary Productivity of Forests in Northeast China. Remote Sens. 2020, 12, 3670. [Google Scholar] [CrossRef]
  43. Wang, Y.H.; Dai, E.; Wu, C.S. Spatiotemporal Heterogeneity of Net Primary Productivity and Response to Climate Change in the Mountain Regions of Southwest China. Ecol. Indic. 2021, 132, 108273. [Google Scholar] [CrossRef]
  44. Xu, X.; Jiang, H.L.; Guan, M.X.; Wang, L.F.; Huang, Y.M.; Jiang, Y.; Wang, A.L. Vegetation Responses to Extreme Climatic Indices in Coastal China from 1986 to 2015. Sci. Total Environ. 2020, 744, 140784. [Google Scholar] [CrossRef]
  45. Turner, D.P.; Ritts, W.D.; Cohen, W.B.; Gower, S.T.; Running, S.W.; Zhao, M.S.; Costa, M.H.; Kirschbaum, A.A.; Ham, J.M.; Saleska, S.R.; et al. Evaluation of MODIS NPP and GPP Products across Multiple Biomes. Remote Sens. Environ. 2006, 102, 282–292. [Google Scholar] [CrossRef]
  46. Heinsch, F.A.; Zhao, M.S.; Running, S.W.; Kimball, J.S.; Nemani, R.R.; Davis, K.J.; Bolstad, P.V.; Cook, B.D.; Desai, A.R.; Ricciuto, D.M.; et al. Evaluation of Remote Sensing Based Terrestrial Productivity from MODIS Using Regional Tower Eddy Flux Network Observations. IEEE Trans. Geosci. Remote Sens. 2006, 44, 1908–1925. [Google Scholar] [CrossRef]
  47. Chen, R.; Yin, G.F.; Liu, G.X.; Li, J.; Verger, A. Evaluation and Normalization of Topographic Effects on Vegetation Indices. Remote Sens. 2020, 12, 2290. [Google Scholar] [CrossRef]
  48. Long, B.Y.; Zeng, C.L.; Zhou, T.; Yang, Z.H.; Rao, F.P.; Li, J.J.; Chen, G.; Tang, X.L. Quantifying the Relative Importance of Influencing Factors on NPP in Hengduan Mountains of the Tibetan Plateau from 2002 to 2021: A Dominance Analysis. Ecol. Inform. 2024, 81, 102636. [Google Scholar] [CrossRef]
  49. Beale, C.M.; Lennon, J.J.; Yearsley, J.M.; Brewer, M.J.; Elston, D.A. Regression Analysis of Spatial Data. Ecol. Lett. 2010, 13, 246–264. [Google Scholar] [CrossRef]
  50. Shaikh, S.F.E.A.; See, S.C.; Richards, D.; Belcher, R.N.; Gret-Regamey, A.; Torres, M.G.; Carrasco, L.R. Accounting for Spatial Autocorrelation Is Needed to Avoid Misidentifying Trade-Offs and Bundles among Ecosystem Services. Ecol. Indic. 2021, 129, 107992. [Google Scholar] [CrossRef]
  51. Alexander, J.D.; McCafferty, M.K.; Fricker, G.A.; James, J.J. Climate Seasonality and Extremes Influence Net Primary Productivity across California’s Grasslands, Shrublands, and Woodlands. Environ. Res. Lett. 2023, 18, 064021. [Google Scholar] [CrossRef]
  52. Liu, G.S.; Pan, J.; Jiang, Y.X.; Ye, X.Q.; Shao, F. Exploring the Effects of Urban Development in Ten Chinese Node Cities along the Belt and Road Initiative on Vegetation Net Primary Productivity. Sustainability 2024, 16, 4845. [Google Scholar] [CrossRef]
  53. Dormann, C.F.; McPherson, J.M.; Araujo, M.B.; Bivand, R.; Bolliger, J.; Carl, G.; Davies, R.G.; Hirzel, A.; Jetz, W.; Kissling, W.D.; et al. Methods to Account for Spatial Autocorrelation in the Analysis of Species Distributional Data: A Review. Ecography 2007, 30, 609–628. [Google Scholar] [CrossRef]
  54. Way, D.A.; Yamori, W. Thermal Acclimation of Photosynthesis: On the Importance of Adjusting Our Definitions and Accounting for Thermal Acclimation of Respiration. Photosynth. Res. 2014, 119, 89–100. [Google Scholar] [CrossRef] [PubMed]
  55. Wang, H.; He, M.Y.; Ran, N.; Xie, D.; Wang, Q.; Teng, M.J.; Wang, P.C. China’s Key Forestry Ecological Development Programs: Implementation, Environmental Impact and Challenges. Forests 2021, 12, 101. [Google Scholar] [CrossRef]
  56. Hua, F.Y.; Bruijnzeel, L.A.; Meli, P.; Martin, P.A.; Zhang, J.; Nakagawa, S.; Miao, X.R.; Wang, W.Y.; McEvoy, C.; Pena-Arancibia, J.L.; et al. The Biodiversity and Ecosystem Service Contributions and Trade-Offs of Forest Restoration Approaches. Science 2022, 376, 839. [Google Scholar] [CrossRef]
  57. Sun, S.L.; Zhou, S.Q.; Shi, J.H.; Lin, Y.; Xue, G.Y.; Lai, A.W.; Li, H.L. Calculation and Comparison of Vegetation Net Primary Productivity(NPP) in Zhejiang Province with Three Models. Chin. J. Agrometeorol. 2010, 31, 271. [Google Scholar]
  58. Wang, J.; Meng, J.J.; Cai, Y.L. Assessing Vegetation Dynamics Impacted by Climate Change in the Southwestern Karst Region of China with AVHRR NDVI and AVHRR NPP Time-Series. Environ. Geol. 2008, 54, 1185–1195. [Google Scholar] [CrossRef]
  59. Mao, D.H.; Wang, Z.M.; Wu, C.S.; Song, K.S.; Ren, C.Y. Examining Forest Net Primary Productivity Dynamics and Driving Forces in Northeastern China during 1982–2010. Chin. Geogr. Sci. 2014, 24, 631–646. [Google Scholar] [CrossRef]
  60. Qie, L.; Lewis, S.L.; Sullivan, M.J.P.; Lopez-Gonzalez, G.; Pickavance, G.C.; Sunderland, T.; Ashton, P.; Hubau, W.; Abu Salim, K.; Aiba, S.I.; et al. Long-Term Carbon Sink in Borneo’s Forests Halted by Drought and Vulnerable to Edge Effects. Nat. Commun. 2017, 8, 1966. [Google Scholar] [CrossRef]
  61. Xie, M.L.; Zhu, Y.; Liu, S.G.; Deng, D.M.; Zhu, L.J.; Zhao, M.F.; Wang, Z. Simulating the Impacts of Drought and Warming in Summer and Autumn on the Productivity of Subtropical Coniferous Forests. Forests 2022, 13, 2147. [Google Scholar] [CrossRef]
  62. Zhao, B.; Wang, S.X.; Dong, X.Y.; Wang, J.D.; Duan, L.; Fu, X.; Hao, J.M.; Fu, J. Environmental Effects of the Recent Emission Changes in China: Implications for Particulate Matter Pollution and Soil Acidification. Environ. Res. Lett. 2013, 8, 024031. [Google Scholar] [CrossRef]
  63. Chen, S.S.; Ma, M.H.; Wu, S.J.; Tang, Q.Q.; Wen, Z.F. Topography Intensifies Variations in the Effect of Human Activities on Forest NPP across Altitude and Slope Gradients. Environ. Dev. 2023, 45, 100826. [Google Scholar] [CrossRef]
  64. Esteban, G.J.; Robert, B.J. Global controls of forest line elevation in the northern and southern hemispheres. Glob. Ecol. Biogeogr. 2003, 9, 253–268. [Google Scholar] [CrossRef]
  65. Nabuurs, G.J.; Lindner, M.L.; Verkerk, P.J.; Gunia, K.; Deda, P.; Michalak, R.; Grassi, G. First Signs of Carbon Sink Saturation in European Forest Biomass. Nat. Clim. Chang. 2013, 3, 792–796. [Google Scholar] [CrossRef]
  66. Barlow, J.; Lennox, G.D.; Ferreira, J.; Berenguer, E.; Lees, A.C.; Mac Nally, R.; Thomson, J.R.; de Barros Ferraz, S.F.; Louzada, J.; Fonseca Oliveira, V.H.; et al. Anthropogenic Disturbance in Tropical Forests Can Double Biodiversity Loss from Deforestation. Nature 2016, 535, 144. [Google Scholar] [CrossRef]
  67. Cai, Y.L.; Liu, X.P.; Liu, K.Y.; Zeng, L.; Pei, F.S.; Zhuang, H.M.; Wen, Y.Y.; Wu, C.J.; Li, B.J. Human Activities Significantly Impact China’s Net Primary Production Variation from 2001 to 2020. Prog. Phys. Geogr. Earth Environ. 2024, 48, 251–274. [Google Scholar] [CrossRef]
  68. Ainsworth, E.A.; Long, S.P. What Have We Learned from 15 Years of Free-Air CO2 Enrichment (FACE)? A Meta-Analytic Review of the Responses of Photosynthesis, Canopy Properties and Plant Production to Rising CO2. New Phytol. 2005, 165, 351–372. [Google Scholar] [CrossRef]
  69. Choi, Y.; Lim, C.H.; Chung, H.I.; Kim, Y.; Cho, H.J.; Hwang, J.; Kraxner, F.; Biging, G.S.; Lee, W.K.; Chon, J.; et al. Forest Management Can Mitigate Negative Impacts of Climate and Land-Use Change on Plant Biodiversity: Insights from the Republic of Korea. J. Environ. Manag. 2021, 288, 112400. [Google Scholar] [CrossRef]
  70. Zhao, J.F.; Ma, J.Y.; Zhu, Y.J. Evaluating impacts of climate change on net ecosystem productivity (NEP) of global different forest types based on an individual tree-based model FORCCHN and remote sensing. Glob. Planet. Chang. 2019, 182, 103010. [Google Scholar] [CrossRef]
  71. Meehl, G.A.; Tebaldi, C. More Intense, More Frequent, and Longer Lasting Heat Waves in the 21st Century. Science 2004, 305, 994–997. [Google Scholar] [CrossRef]
  72. Zhou, L.M.; Dickinson, R.E.; Tian, Y.H.; Fang, J.Y.; Li, Q.X.; Kaufmann, R.K.; Tucker, C.J.; Myneni, R.B. Evidence for a Significant Urbanization Effect on Climate in China. Proc. Natl. Acad. Sci. USA 2004, 101, 9540–9544. [Google Scholar] [CrossRef]
  73. Berner, L.T.; Massey, R.; Jantz, P.; Forbes, B.C.; Macias-Fauria, M.; Myers-Smith, I.; Kumpula, T.; Gauthier, G.; Andreu-Hayles, L. Summer warming explains widespread but not uniform greening in the Arctic tundra biome. Nat. Commun. 2020, 11, 4621. [Google Scholar] [CrossRef]
  74. Ross, M.S.; Ruiz, P.L.; Sah, J.P.; Hanan, E.J. Chilling Damage in a Changing Climate in Coastal Landscapes of the Subtropical Zone: A Case Study from South Florida. Glob. Chang. Biol. 2009, 15, 1817–1832. [Google Scholar] [CrossRef]
  75. Shang, R.; Chen, J.M.; Xu, M.Z.; Lin, X.D.; Li, P.; Yu, G.R.; He, N.P.; Xu, L.; Gong, P.; Liu, L.Y.; et al. China’s Current Forest Age Structure Will Lead to Weakened Carbon Sinks in the near Future. Innov. Camb. Mass. 2023, 4, 100515. [Google Scholar] [CrossRef]
  76. Zhang, Z.R.; Zhong, Q.L.; Cheng, D.L.; Huang, Z.Q.; Xu, C.B.; Yu, H.; Xiao, S.H. Carbon Dynamics in Three Subtropical Forest Ecosystems in China. Environ. Sci. Pollut. Res. 2020, 27, 15552–15564. [Google Scholar] [CrossRef]
  77. Jiang, N.; Zhang, Q.Q.; Zhang, S.C.; Zhao, X.M.; Cheng, H. Spatial and Temporal Evolutions of Vegetation Coverage in the Tarim River Basin and Their Responses to Phenology. Catena 2022, 217, 106489. [Google Scholar] [CrossRef]
  78. Liu, J.Y.; Yan, Q.Q.; Zhang, M.H. Ecosystem Carbon Storage Considering Combined Environmental and Land-Use Changes in the Future and Pathways to Carbon Neutrality in Developed Regions. Sci. Total Environ. 2023, 903, 166204. [Google Scholar] [CrossRef]
Figure 1. Spatial distribution map of the Wuyi Mountain Range. (a) Geographical distribution of the Southern Forests and the Wuyi Mountain Range in China. (b) Elevation distribution of the Wuyi Mountain Range based on a geospatial data cloud (http://www.gscloud.cn/, accessed on 10 October 2024). Here, the black triangles in the figure indicate the locations of meteorological observation stations, with a total of 36. In addition, an asterisk is employed to denote the locations of the two local weather stations referenced below. Given that these two stations are in close proximity to each other in the horizontal direction, a single asterisk is utilized to represent both. (c) The distribution of land cover types of the Wuyi Mountains according to data from MCD12Q1 from 2022 (https://ladsweb.modaps.eosdis.nasa.gov, accessed on 5 October 2024). There are a total of 10 types of land use, among which 7 types are vegetation cover types, namely, evergreen broadleaf forest (EBF), woody savanna (WSA), savanna (SAV), mixed forest (MF), cropland (CRO), evergreen needleleaf forest (ENF), and grassland (GRA), and the 3 others are non-vegetation cover types, namely, urban built-up lands (URB), wetlands (WET), and water bodies (WAT). The last two types are not shown in Figure 1 because their area proportions are too small.
Forests 16 00809 g001
Figure 2. Spatial distribution of mean NPP value segments in the Wuyi Mountains from 2000 to 2022 (a) and its changing trend (b). The pie chart on the right side of (b) indicates the proportion of the areas.
Forests 16 00809 g002
Figure 3. Elevation curve of land use type distribution in Wuyi Mountains from 2000 to 2022. Different types are shown in different colors.
Forests 16 00809 g003
Figure 4. The scatter plot of the changes in the NPP of vegetation and altitude in the Wuyi Mountains from 2000 to 2022, “**” indicates p < 0.01. The black line denotes the trend line, while the red shaded area indicates the 95% confidence interval.
Forests 16 00809 g004
Figure 5. The converted areas of various land use types in the Wuyi Mountains from 2000 to 2022. (a) The entire study area, (b) R1 altitude, (c) R2 altitude, (d) R3 altitude, (e) R4 altitude, and (f) R5 altitude. The area unit is ×103 hm2. The transitions between WSA (light green), EBF (orange), and SAV (cyan) are shown in Figure 5a as an example for explanation. Regarding the transferred-out WSA, the light green area at the lower left corner of the circle indicates the cumulative conversion area of WSA in the entire study area over 23 years, which is 5271 × 103 hm2; the light green arrows (WSA) starting from this location and pointing to the orange (EBF) and cyan (SAV) parts of the circle indicate the types converted from the WSA, with areas of 1763.33 × 103 (EBF) and 944.08 × 10³ hm2 (SAV), respectively. Regarding the transferred-in WSA, the orange (EBF) and cyan (SAV) arrows starting from the top of the circle and pointing to the WSA’s light green area indicate the conversion of these two types converted into WSA, with areas of 1208.28 × 103 (EBF) and 719 × 103 hm2 (SAV), respectively.
Forests 16 00809 g005
Figure 6. Spatial correlation distribution of six extreme high temperature indices and NPP. (a) TXX, (b) TXN, (c) TX90p, (d) TN90p, (e) SU, and (f) TR. Warm tones in the figure indicate positive correlations; the redder the color, the stronger the positive correlation. Cool tones indicate negative correlations; the greener the color, the stronger the negative correlation. The black dots on the figure indicate statistical significance (p < 0.05). To prevent the background color from being obscured, the spatial resolution of the black dots was enlarged tenfold.
Forests 16 00809 g006
Figure 7. The correlation between six extreme high temperature indices and vegetation NPP at different altitudinal gradients (a) and for different vegetation types (b). Blue indicates negative correlation, red indicates positive correlation, and “*” and “**” represent p < 0.05 and p < 0.01, respectively.
Forests 16 00809 g007
Table 1. Climate background and potential meteorological disaster factors at different altitudes in the Wuyi Mountains from 2000 to 2020.
AltitudeMean Temperature/°CPrecipitation/mmWind Speed
/m·s−1
Extreme High Temperature
Frequency
Extreme Low
Temperature
Frequency
Heavy Rain
Frequency
Precipitation Anomaly
Percentage/%
223 m18.37, ↑**1988.761.1438.55, ↑**37.78, ↓**310
772 m15.362505.630.92, ↑**37.67, ↑**37.540.92−28%, ↑**
Note: “↑” indicates increasing trends, “↓” indicates decreasing trends, and “**” indicates p < 0.01. Unmarked arrows indicate no significant change.
Table 2. Classification of elevation gradients in the Wuyi Mountain Range.
Elevation GradientRange
R1<298 m
R2298−491 m
R3491−717 m
R4717−1028 m
R51028−2067 m
Table 3. Descriptions of extreme high temperature indices.
NameDescriptionUnit
TXXThe maximum of the daily highest temperature°C
TXNThe minimum of the daily highest temperature°C
TX90pNumber of warm days, i.e., the number of days in a year when the daily maximum temperature exceeds the 90th percentiled
TN90pNumber of warm nights, i.e., the number of days in a year when the daily minimum temperature exceeds the 90th percentiled
SUNumber of summer days, i.e., the number of days in a year when the daily maximum temperature is above 25 °Cd
TRNumber of hot nights, i.e., the number of days in a year when the daily minimum temperature is above 20 °Cd
Table 4. Changes in NPP caused by land use type conversion in the Wuyi Mountains from 2000 to 2022.
ELVeg. TypesChanges
ENFEBFMFGRACROWSASAVURBSUM
R1ENF-0.62−2.56--−2.64--−4.58
EBF−0.76-−21.07−2.18-−156.85−9.33-−190.19
MF2.1719.73-−0.10-2.02--23.82
GRA-4.47--−12.2428.606.96−9.8117.98
CRO---12.25--28.51−2.7538.01
WSA3.74249.99−2.45−47.72--−300.90−8.01−105.35
SAV-17.60 −7.79−20.28198.17-−90.0797.63
URB---0.610.280.172.18-3.24
R2ENF-1.74−7.30--−4.67−0.03-−10.26
EBF−1.88-−68.24−0.70-−366.07−21.79-−458.68
MF6.8676.14---5.83−0.14-88.69
GRA-0.92--−4.7210.233.28−1.997.72
CRO---5.82--6.79−3.039.58
WSA5.96556.63−6.39−13.69--−208.33-334.18
SAV-32.27-−2.97−5.23184.23-−32.26176.04
URB---0.150.14-2.33-2.62
R3ENF-1.16−6.30--−2.19- −7.33
EBF−1.11-−98.47−0.32-−255.67−6.30-−361.87
MF7.04131.42---8.61−0.07-147.00
GRA-----2.450.77-3.22
CRO---------
WSA2.44357.78−9.54−2.93--−45.29-302.46
SAV-5.41-−0.55-39.76--44.62
URB---------
R4ENF-0.55−7.21--−3.09--−9.75
EBF−0.52-−76.96- −83.15−0.73-−161.36
MF10.47101.86---4.47--116.80
GRA---------
CRO------- -
WSA3.1596.04−5.20---−5.79-88.20
SAV-----4.39--4.39
URB---------
R5ENF-0.14−15.39--−2.09--−17.34
EBF−0.23 −23.42--−9.02--−32.67
MF24.1627.01---1.08--52.25
GRA---------
CRO---------
WSA3.8410.46−1.79---- 12.51
SAV---------
URB---------
SUM65.331691.94−352.29−60.12−42.05−395.43−547.88−147.92211.58
Note: the units of the figures in the table are GgC. A “-” before a value indicates the reduction in NPP caused by the conversion, and only a “-” indicates that there is no conversion. EL: Elevation.
Disclaimer/Publisher’s Note: The statements, opinions and data contained in all publications are solely those of the individual author(s) and contributor(s) and not of MDPI and/or the editor(s). MDPI and/or the editor(s) disclaim responsibility for any injury to people or property resulting from any ideas, methods, instructions or products referred to in the content.

