Article

Deep Learning-Based Urban Tree Species Mapping with High-Resolution Pléiades Imagery in Nanjing, China

1
Co-Innovation Center for Sustainable Forestry in Southern China, Nanjing Forestry University, Nanjing 210037, China
2
Faculty of Forestry, University of British Columbia, 2424 Main Mall, Vancouver, BC V6T 1Z4, Canada
3
Zhejiang Forest Resources Monitoring Centre, Hangzhou 310020, China
4
Zhejiang Forestry Survey Planning and Design Company Limited, Hangzhou 310020, China
*
Authors to whom correspondence should be addressed.
Forests 2025, 16(5), 783; https://doi.org/10.3390/f16050783
Submission received: 12 April 2025 / Revised: 30 April 2025 / Accepted: 3 May 2025 / Published: 7 May 2025
(This article belongs to the Section Forest Inventory, Modeling and Remote Sensing)

Abstract

:
In rapidly urbanizing regions, encroachment on native green spaces has exacerbated ecological issues such as urban heat islands and flooding. Accurate mapping of tree species distribution is therefore vital for sustainable urban management. However, the high heterogeneity of urban landscapes, resulting from the coexistence of diverse land covers, built infrastructure, and anthropogenic activities, often leads to reduced robustness and transferability of remote sensing classification methods across different images and regions. In this study, we used very high–resolution Pléiades imagery and field-verified samples of eight common urban trees and background land covers. By employing transfer learning with advanced segmentation networks, we evaluated each model’s accuracy, robustness, and efficiency. The best-performing network delivered markedly superior classification consistency and required substantially less training time than a model trained from scratch. These findings offer concise, practical guidance for selecting and deploying deep learning methods in urban tree species mapping, supporting improved ecological monitoring and planning.

1. Introduction

In the process of urbanization, green vegetation, as an important part of urban ecosystems, plays an irreplaceable role in improving urban environments and the life quality of urban residents [1]. Particularly, among them, the distribution and health status of arbor tree species constitute the most important backbone components to play these eco-environmental improvement functions [2]. Whereas the frequent construction or renovation of artificial structures such as buildings and roads, traffic accidents, disease and pests, and directional windthrow events make the distribution of urban tree species ever-changing, leading to a highly fragmented urban green space and bringing about great challenges to the management and maintenance of urban green spaces [3]. Thus, timely and accurate extraction of urban arbor species from the highly fragmented and ever-changing urban context contributes to the strategic development of sustainable management of urban green spaces, the accurate quantification of the ecological values of urban tree species, e.g., carbon fixation benefit, and the formulation of targeted custodial measures according to different locations and seasons for these arbor trees [4].
Traditional ground surveys are the most accurate method to collect in-situ urban tree species information; however, they are constrained by high time and labor costs and are impractical for large-scale monitoring in complex urban environments [5]. Although many developed cities have established urban green space management information systems to maintain tree species inventories, frequent stochastic disturbances, such as construction and renovation activities, heavy metal pollution, and extreme weather events, result in continual changes to urban tree distributions throughout the year [6]. These dynamic changes often cannot be updated in a timely manner within management systems, leading to information gaps and inconsistencies that hinder the effective planning, maintenance, and restoration of urban green spaces [7]. Recent advances in remote sensing technologies offer viable alternatives by providing multi-source, multi-temporal, and high-spatial resolution observations for urban tree species mapping over extensive areas [8]. A variety of platforms, including airborne hyperspectral imaging, WorldView and Pléiades satellites, and emerging sources such as PlanetScope and GaoFen series satellites, have been increasingly utilized to capture fine-scale urban vegetation characteristics [9]. Moreover, LiDAR data, either standalone or integrated with optical imagery, has also been explored to enhance tree species classification accuracy. Collectively, these developments have significantly advanced the capacity for timely and detailed urban forest monitoring [10].
The spatial resolution of satellite imagery significantly influences the reliability of urban tree species classification. Accurate mapping of individual trees using moderate-resolution imagery, such as Landsat or Sentinel-2, remains challenging in highly heterogeneous urban environments, especially when tree species are closely intermingled and canopy structures are fragmented [11]. In such cases, the moderate resolution often cannot fully resolve individual tree crowns. Advances in satellite sensor technology have enabled high-resolution and very high-resolution imagery, such as IKONOS, QuickBird, and Pléiades, to demonstrate strong potential for urban tree species identification [11]. Early studies, such as Sugumaran et al. (2003), used maximum likelihood classification based on 1-m IKONOS imagery in Columbia, Missouri, achieving promising results [12]. Similarly, Xiao et al. utilized hyperspectral AVIRIS data to classify several evergreen species with reasonable accuracy [13]. However, the classification performance often varied depending on species characteristics, canopy complexity, and environmental context [14]. More recent studies, such as Abdollahnejad et al. (2017), demonstrated that integrating high-resolution QuickBird imagery with environmental variables could achieve high prediction accuracy of dominant forest tree species, indicating that when appropriate methods and ancillary data are used, high-resolution imagery can yield acceptable to excellent classification performance even in complex forest environments [15]. Therefore, rather than relying solely on imagery resolution, developing flexible classification frameworks tailored to urban landscape complexity is essential to improving tree species mapping accuracy.
There are various traditional classification methods that have been applied to urban tree species classification, such as the classic statistical process like minimum distance and maximum likelihood classifiers [16], and machine learning algorithms including support vector machines [17], decision trees [18], and random forests [18,19]. However, the classification performance of these algorithms is highly dependent on the chosen classification features and model parameters, which are usually determined through iterative trials and operators’ expertise and experience. Obviously, the determination manner is both subjective and inefficient [20]. Deep learning, which can automatically extract more abstract higher-order features by combining shallow features like spectra, texture, etc., and discover more discriminative features with higher recognition accuracy, is becoming more and more prevalent in the current field of remote sensing classification [21,22,23,24], and the application of deep learning to high-resolution imagery is even more superior for vegetation classification [25]. Although Convolutional Neural Network (CNN) and its derived network models have been widely used in high-resolution image classification, the classification accuracy varies across different satellite images and application scenarios [10]. HRNet combined with high-resolution remote sensing imagery has been shown to improve the urban green space classification accuracy [25], and U-Net also performs well in urban TOF classification [26] (TOF refers to trees and shrubs that exist on land outside of contiguous forest areas), and Fully Convolutional Network (FCN) and DeeplabV+ and other models have also been shown to have better classification accuracy and wider application areas [23]. However, the complexity of urban tree distribution, the variety of available deep learning models, and the uncertainties of numerous training modes make it necessary to further investigate the suitability of various deep learning models and training methods for urban tree classification by using high-resolution satellite images.
In urban environments, the number of tree species sampled is usually uneven due to the highly fragmented and sporadic vegetation cover, characterized by fewer samples of some tree species than others. This situation has been verified in many studies; for example, Akbar et al. (2014) found that the distribution of trees was very uneven, with an abundance of broadleaf deciduous species, while conifers and palms appeared only occasionally in the parks of the Sahiwal urban area [27]. Against such a backdrop, the DeeplabV3+ model is considered to have great potential because it combines Atrous Spatial Pyramid Pooling (ASPP) and depthwise separable convolution, which can effectively cope with imbalanced datasets [28]. However, despite the advantages of DeeplabV3+, other models may show unique performance in certain scenarios. For example, the strong performance of UNet in small sample scenarios [29,30], the ability of HRNet with its high-resolution feature retention [31], and the advantages of PSPNet in global context information extraction provide different perspectives and technical paths for tree species classification tasks [32]. Therefore, for the purpose of comprehensive evaluation, this study does not only focus on DeeplabV3+, but will also systematically compare the performance of models such as UNet, HRNet, and PSPNet. Through the multi-dimensional evaluation of these models in classification accuracy, computational efficiency, and processing ability of imbalanced datasets, this study hopes to find the best model for urban tree species classification and provide a more comprehensive technical reference for urban ecological monitoring.
Transfer learning is a training method that applies a pre-trained model from one task to another, especially useful in situations with limited data. Chen et al. (2020) demonstrated significant performance improvements by pre-training models on ImageNet and then fine-tuning them on other datasets [33]. This approach not only reduced training time and computational resources but also achieved an average classification accuracy of 92.00% in predicting categories of rice plant images. Reinforcement learning [34] guides a model’s gradual improvement through a reward mechanism, making it suitable for sequential decision-making problems. The success of Mnih et al.’s (2015) Deep Q-Network in the gaming field showcases the potential of reinforcement learning, although its application in classification tasks is relatively rare [35]. It excels in multi-step decision-making and dynamic environments. Wang et al. (2023) demonstrated that the combination of transfer learning and deep learning could substantially improve the classification accuracy and efficiency in the complex urban environments based on different spatial resolution images [36].
In urban tree species classification, the selection of appropriate deep learning models and training methods is crucial. In existing studies, although a variety of deep learning models have been applied to image classification, there are still differences in their effectiveness in the urban tree classification tasks. Compared to previous studies that employed high-resolution satellite imagery combined with environmental variables to predict dominant forest species, such as the work by Abdollahnejad et al. (2017) using QuickBird data, this study focuses specifically on urban environments characterized by greater landscape fragmentation and tree species diversity [15]. Furthermore, rather than relying on ancillary environmental data, our approach emphasizes direct classification based on very high spatial resolution Pléiades imagery, leveraging deep learning models to enhance the robustness and generalization capability for urban tree species mapping. By systematically testing the performance of the commonly used deep learning models (e.g., DeeplabV3+, UNet, HRNet, and PSPNet) and comparing the effects of different training methods (e.g., transfer learning), the optimal model selection and training strategies for urban tree species classification based on high spatial resolution satellite images can be determined to provide valuable technical references.
Therefore, this study aims to determine which deep learning model performs best when classifying tree species through high spatial resolution Pleiades satellite imagery in urban environments. Meanwhile, this study will also investigate the impact of transfer learning strategies on model performance, including the effect of transfer learning using pre-trained models, such as the model trained on the PASCAL Visual Object Classes 2012 (VOC12) dataset. This study comprehensively compared the classification accuracy, computational efficiency, generalization ability, and other multidimensional evaluation indicators based on the model in order to provide more efficient and accurate technical solutions for the field of urban tree species classification and promote the further development of urban greenery and ecological monitoring.

2. Study Area and Dataset
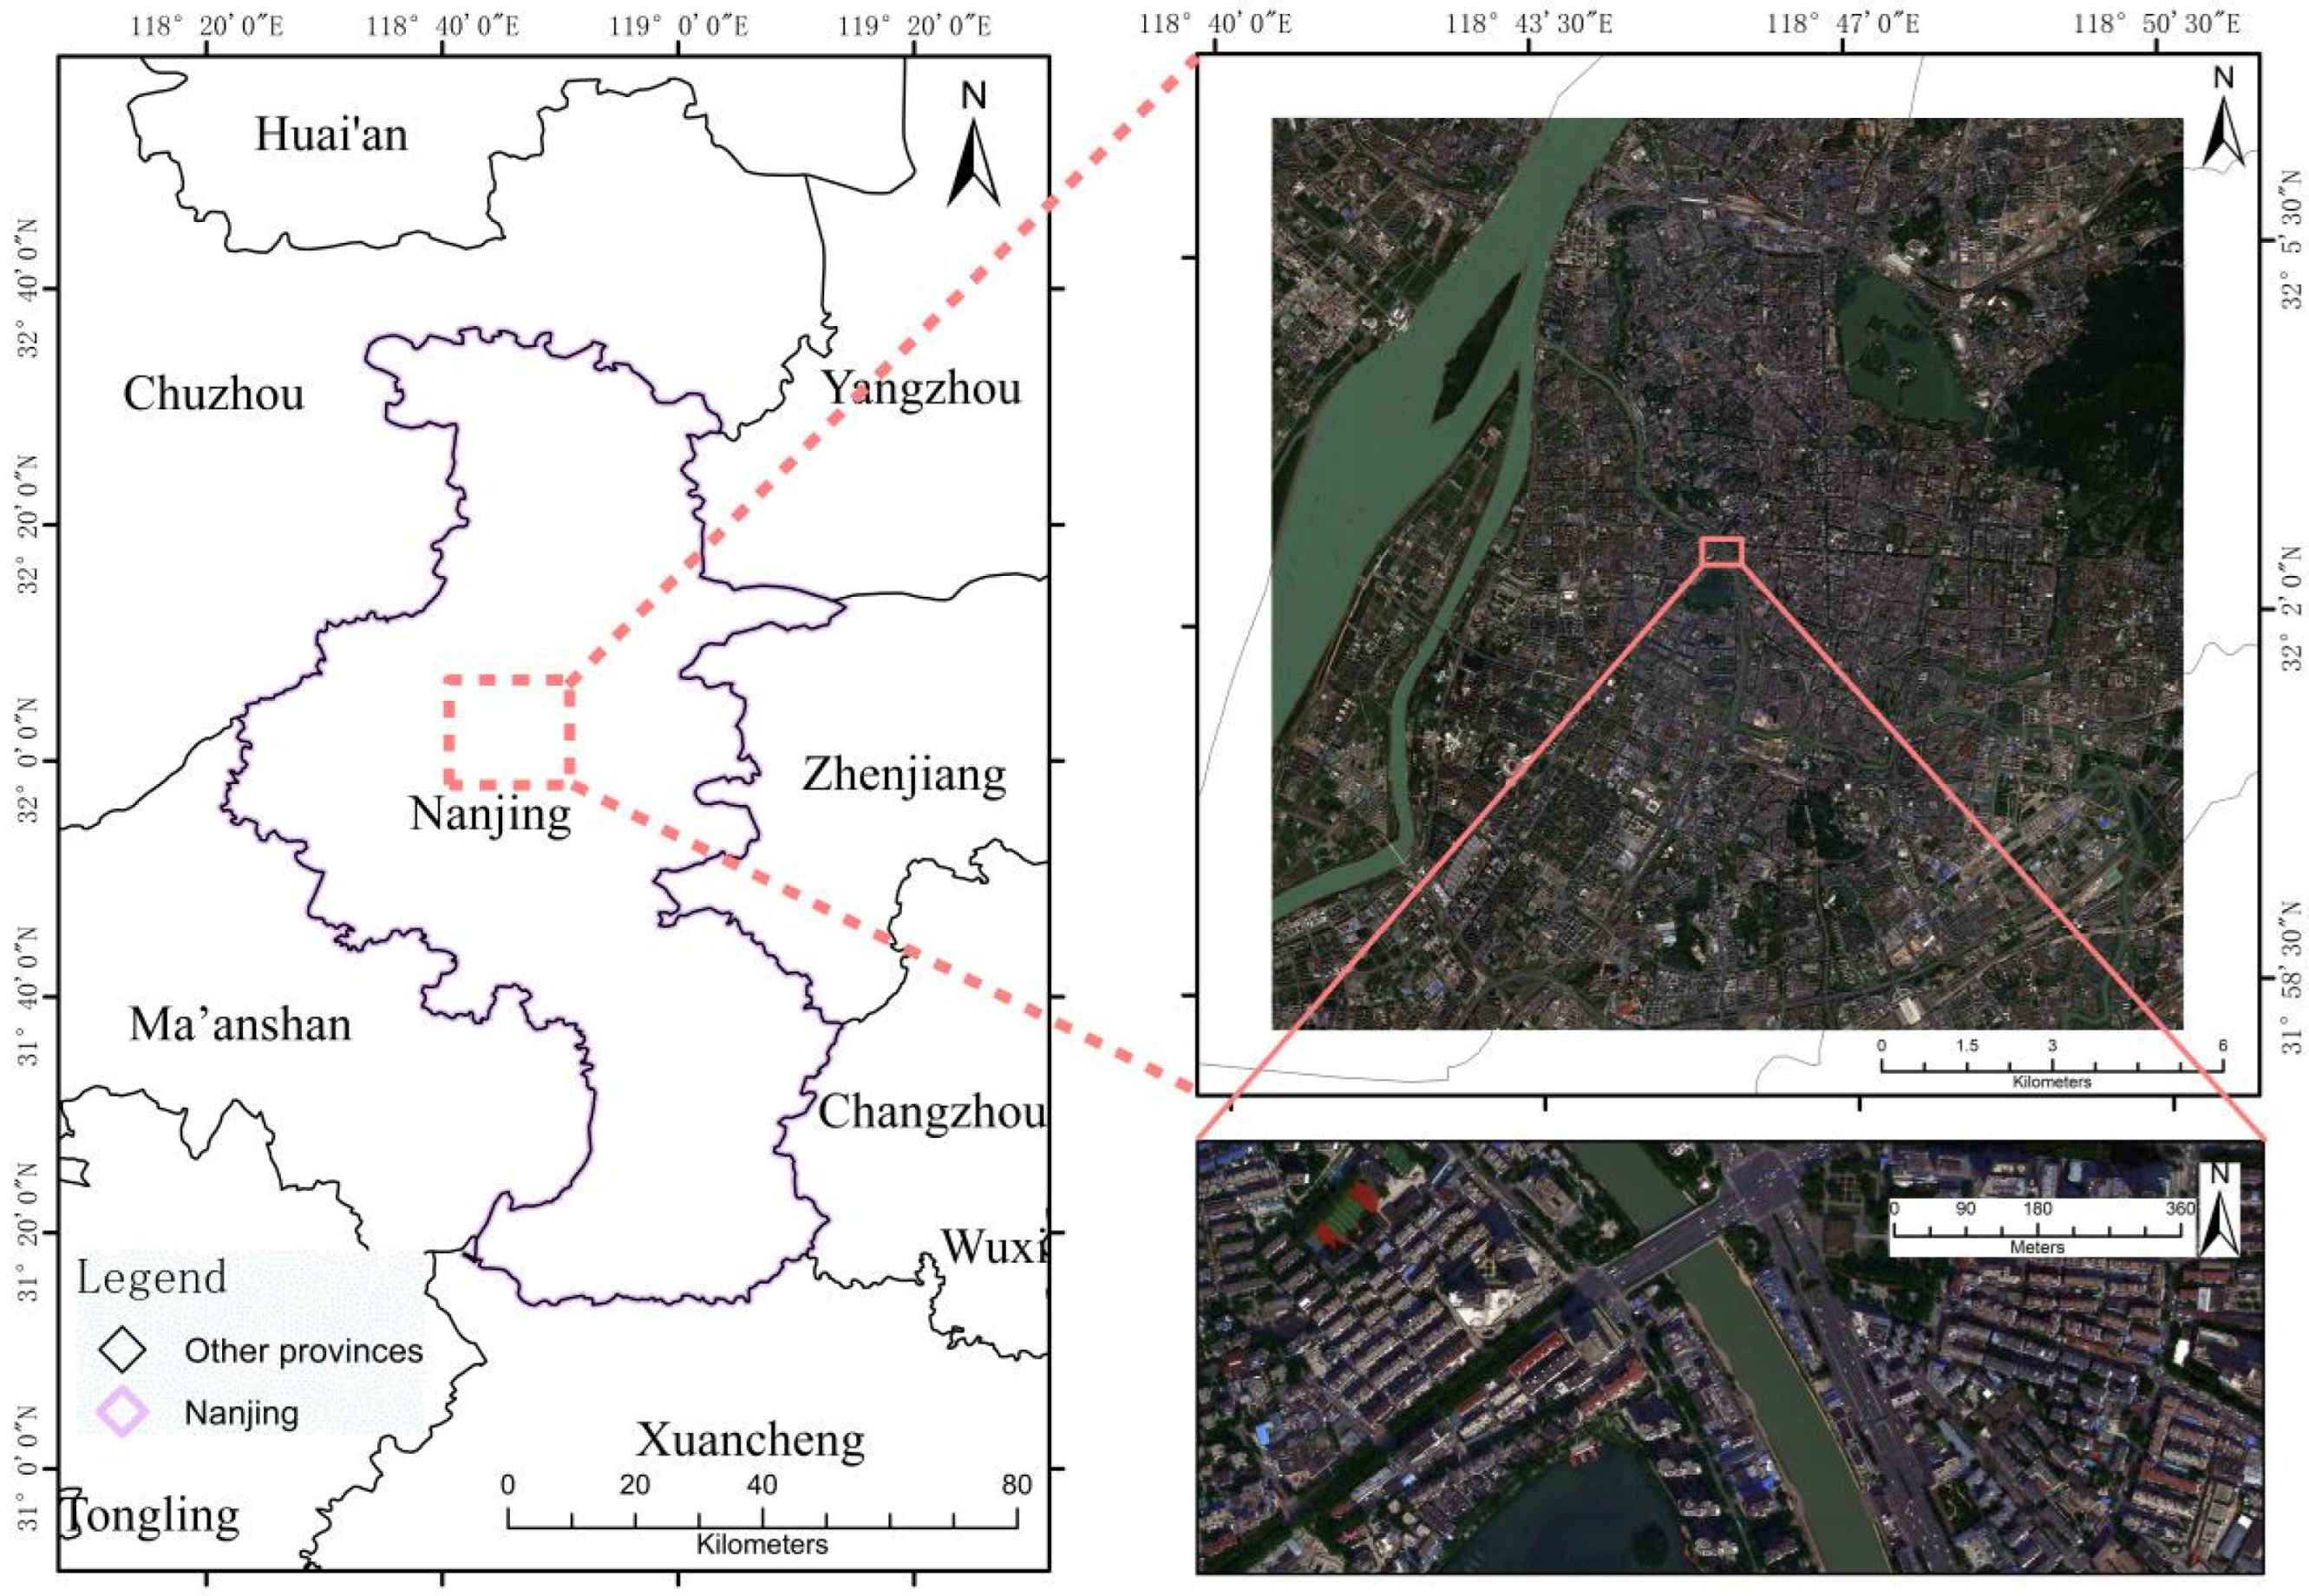
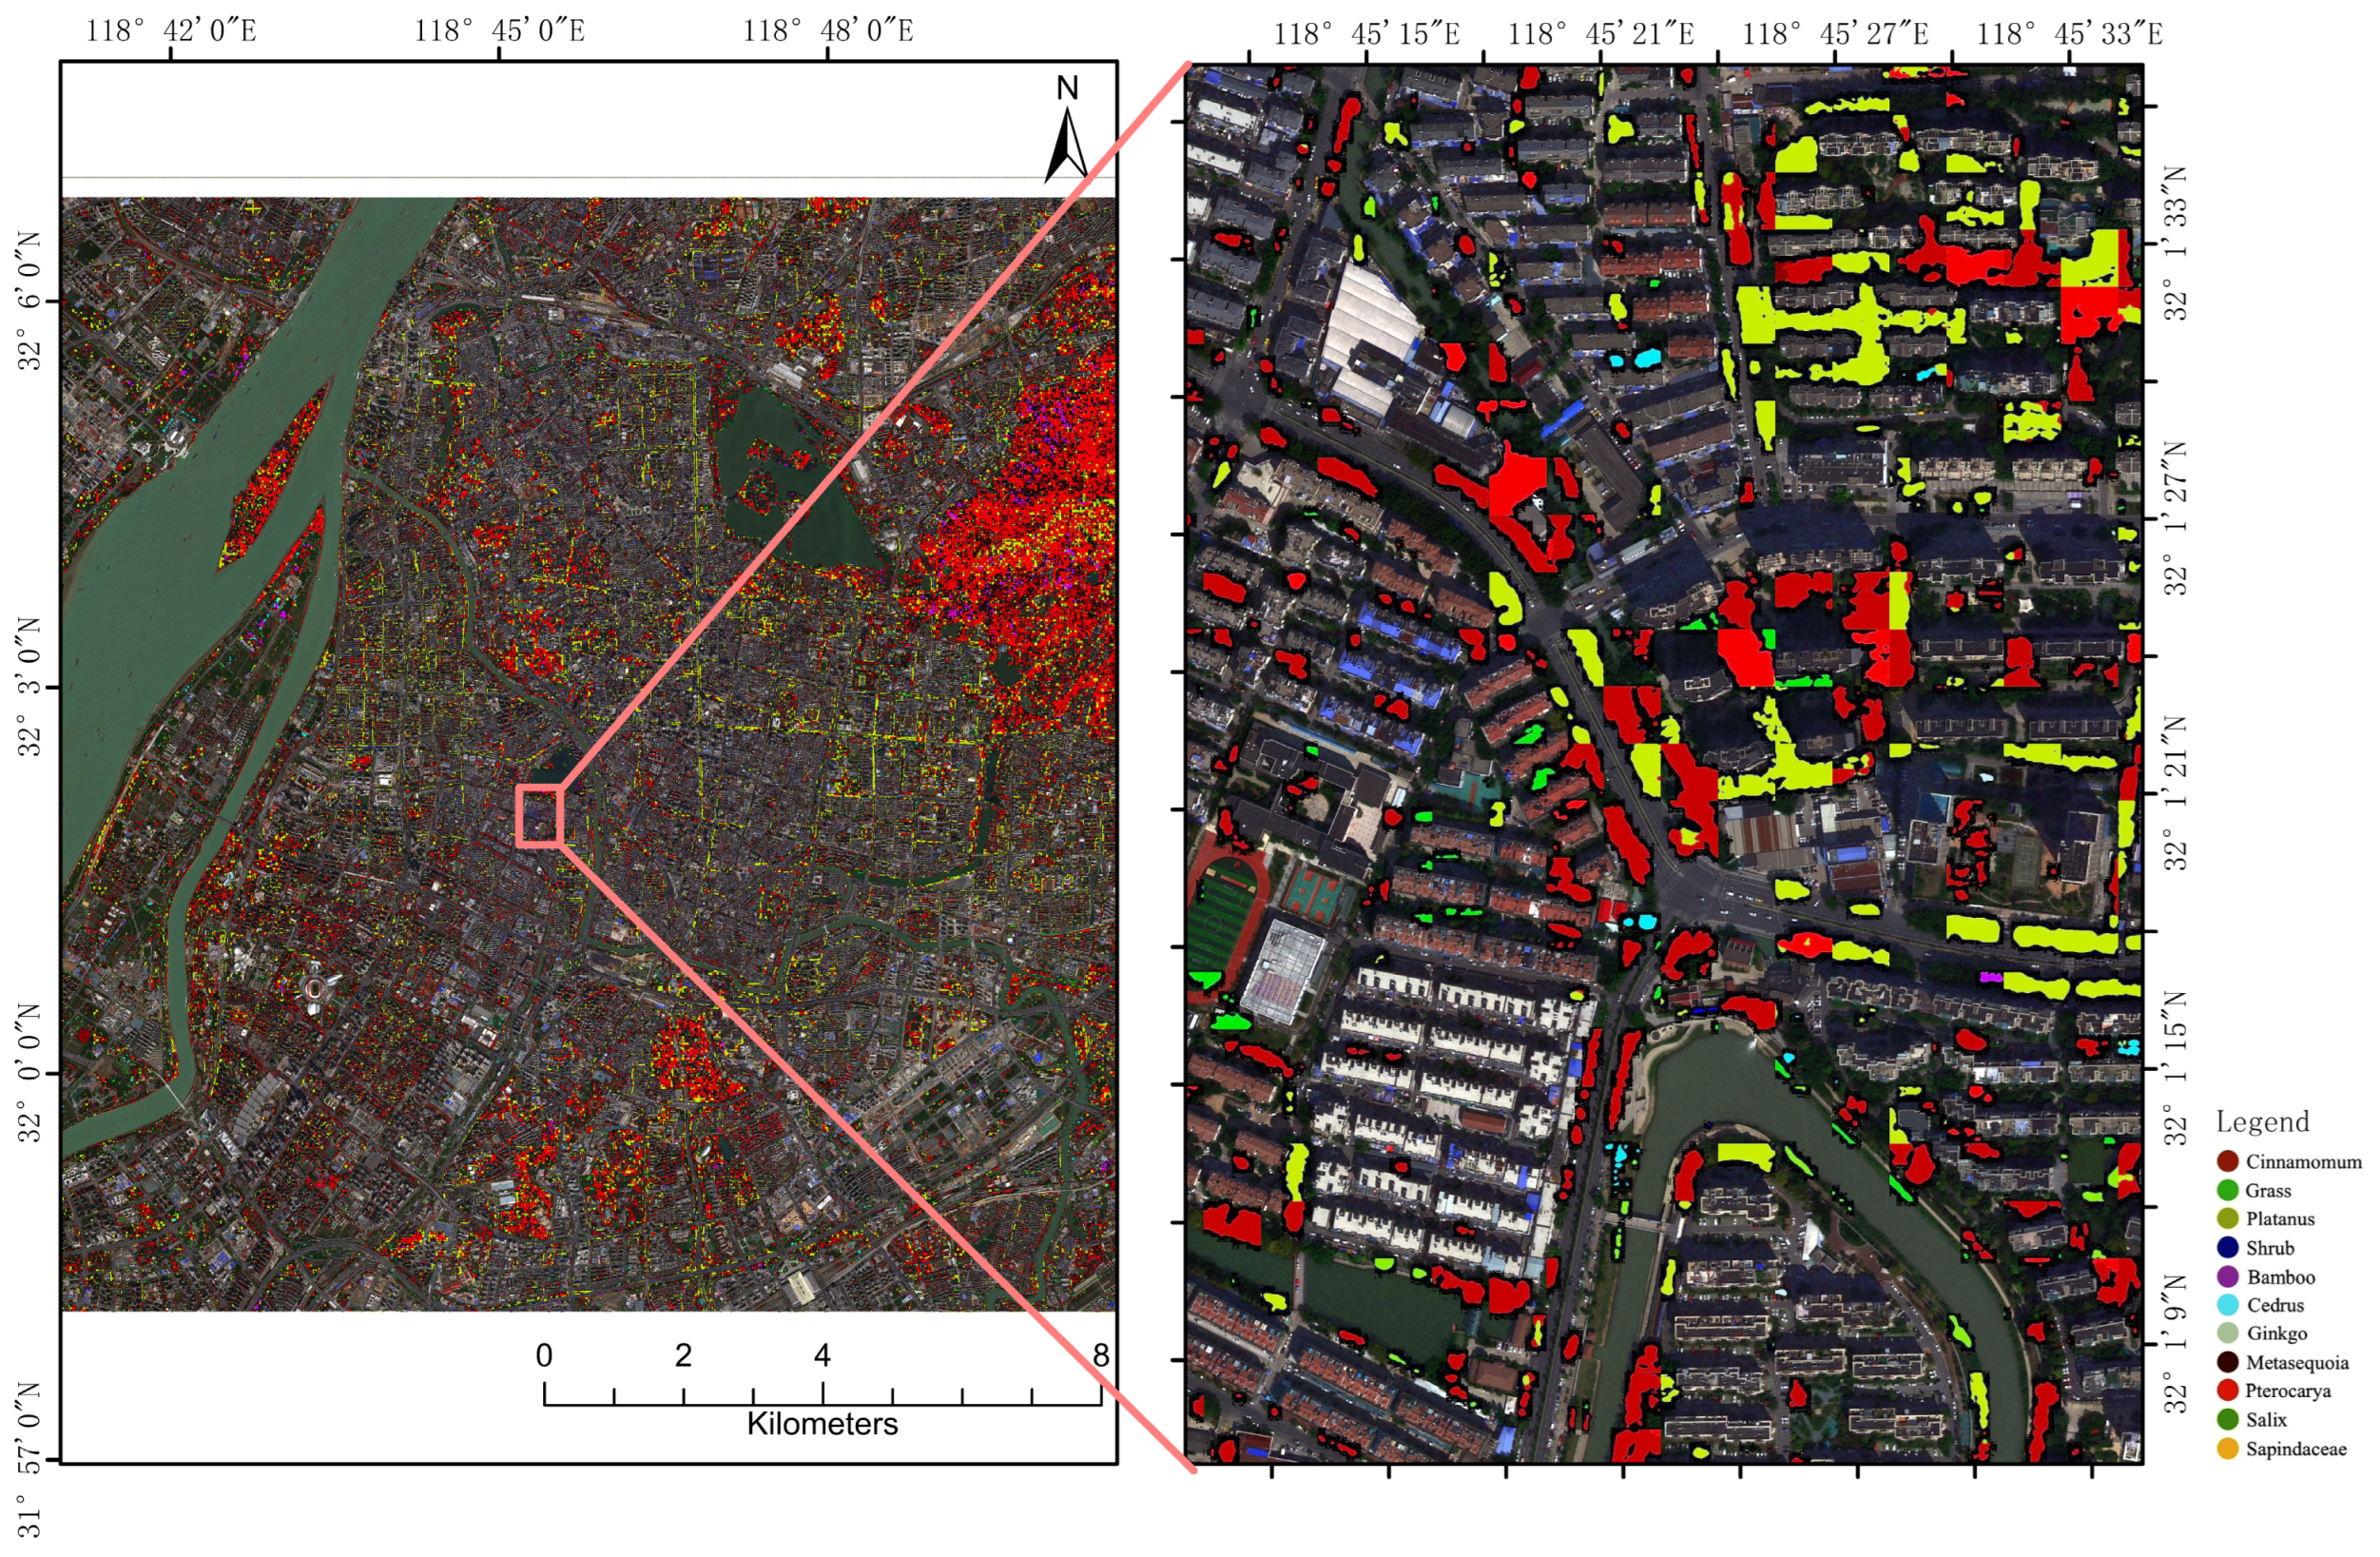
2.1. Study Area

Nanjing, the capital of Jiangsu Province in eastern China, is located in the lower reaches of the Yangtze River, The city lies between 118°22′E and 119°14′E longitude and between 31°14′N to 32°37′N latitude (Figure 1). The city experiences a typical northern subtropical monsoon climate, characterized by hot, humid summers and mild, wet winters. The annual average temperature is approximately 16 °C, with July being the hottest month, averaging 28 °C, and January the coldest, averaging 3 °C. The city receives an average annual precipitation of about 1100 mm, with most of it occurring during the summer months [37]. The plant species in Nanjing are abundant, with the metropolitan area transitioning from deciduous broad-leaved forests to deciduous and evergreen broad-leaved mixed forests. Nanjing’s varied urban landscape makes it an ideal location for studying urban greening tree species classification.
The specific study site covers a total area of 225 km2 within the downtown area of Nanjing, corresponding to the spatial extent covered by the Pléiades Neo imagery used for tree species classification (Figure 1, upper right). This site was selected to ensure comprehensive coverage of diverse urban landscapes and vegetation types found in Nanjing, providing a robust dataset for the analysis.

2.2. Remote Sensing Data and Preprocessing

2.2.1. Pléiades Images

Considering the highly fragmented nature of urban green spaces, as well as the major objective of urban tree species classification, the French Pléiades Neo satellite data, with a sub-meter resolution covering the downtown area of Nanjing, was purchased to support the tree species classification mission in this study. The imagery used in this study offers a dynamic range of 16 bits per pixel, as indicated by the pixel depth information. This provides a high dynamic range suitable for capturing subtle spectral variations important for tree species classification. The cloud-free imagery acquired on 22 September 2022, covering a total area of 225 square kilometers (Figure 1, upper right), was collected.
The Pléiades constellation, consisting of two VHR satellites, Pléiades 1A and Pléiades 1B, was launched in 2011 under the supervision of the Centre National d’Etudes Spatiales (CNES) and Airbus Defence & Space [38]. In our study, the used imagery originated from the latest Pléiades Neo satellite. Compared to the first-generation Pléiades satellite, this new generation of satellites has enhanced its data accuracy by incorporating additional spectral channels, thereby expanding its applicability. For instance, the red-edge band provides richer information on crop growth, while the deep blue band, due to its shorter wavelength, can penetrate water bodies more effectively [39]. The highest spatial resolution of the new generation Pléiades Neo satellite panchromatic band reaches 0.3 m, and the other six multispectral bands have a spatial resolution of 1.2 m. Table 1 displays the technical details of the used Pléiades Neo satellite imagery in this analysis.

2.2.2. Remote Sensing Image Preprocessing

The effective processing of high-resolution remote sensing images acquired by the Pléiades satellite can improve the data’s accuracy and consistency. The Pléiades image in the study area was pre-processed by using the Environment for Visualizing Images (ENVI, version 5.6) software. The specific preprocessing involved several steps [40]: (1) FLAASH-based atmospheric correction. Atmospheric correction of satellite observations, as a crucial step in quantitative remote sensing, aims to derive true radiance, surface reflectance, or surface temperature of objects by implementing complicated radiative transfer equations to simulate the effects of atmospheric scattering and absorption on the sensor’s radiance. In this study, the FLAASH module embedded in the ENVI 5.6 package was employed for atmospheric correction of the Pléiades Neo images [19]. (2) Image fusion: ENVI 5.6 provides the commonly used fusion methods such as HSV fusion, Brovey fusion, Gram-Schmidt fusion [41], PCA fusion, and NNDiffuse fusion. Of which, the Gram-Schmidt fusion method has the advantages of addressing the issue of information over-concentration in PCA, being unlimited by bands, maintaining spatial texture information well, especially preserving spectral characteristics with high fidelity, and supporting fusion of any number of bands with panchromatic bands [42,43,44]. Thus, this analysis chose the Gram-Schmidt method to fuse the panchromatic band and multi-spectral bands of the Pléiades Neo imagery to generate 30-cm resolution multi-spectral images to potentially facilitate the classification of urban greening tree species. (3) RPC orthorectification: The Rational Polynomial Coefficients (RPC) model is a generalized and high-precision imaging model for new satellite sensors [45]. Using RPC and regularization parameters, the direct mapping between object space and image space coordinates is established to realize the orthographic correction of remote sensing images [46].

2.2.3. Extraction of Shadow Areas from Imagery

In the classification of tree species using high-resolution imagery in urban areas, one prominent issue is the presence of shadows caused by tall building structures. To reduce the complexity of tree species classification in the current work, we employed a shadow extraction method based on multi-feature remote sensing imagery to remove shadow areas from the Pléiades Neo image [47]. Thus, we just focused on the tree species classification of the sunlit areas. Since the high-resolution imagery used for tree species classification is in RGB format, the brightness calculation method based on the human eye’s sensitivity to the RGB channels aligns better with human visual perception than traditional methods like the mean or maximum value approach [48]. Conventional shadow extraction techniques, such as those based on thresholding, color space transformations, and morphological operations, often suffer from reduced accuracy due to variations in lighting conditions and noise [49]. In contrast, this method, by comprehensively considering chromaticity, brightness, and vegetation features and utilizing a dynamically calculated Otsu threshold, is more adaptable to different scenes and effectively reduces noise interference. As a result, it allows for fast and accurate shadow extraction in complex urban environments. The specific steps for shadow areas extraction were as follows:
By comparing the original color space with the normalized color space, we extracted shadow features f 1 from the imagery to capture the contrast between shadowed and highly illuminated areas. Here, R, G, and B represent the values of the red, green, and blue channels of the original image, respectively.
r = R ( R + G + B )
g = G ( R + G + B )
f 1 = m e a n ( | r R | + | g G | )
Shadow areas typically exhibit lower brightness. We adopted a brightness calculation method based on the human eye’s sensitivity to the RGB channels to more accurately reflect the shadow feature f 2 in the imagery.
f 2 = 0.04 × R + 0.5 × G + 0.46 × B
This shadow extraction method also takes into account the speckled shadow areas formed by gaps between leaves in vegetated regions. To address this, a vegetation feature f 3 was constructed by subtracting the minimum value of the red and blue bands from the green band, effectively removing these speckles and obtaining a cleaner shadow area.
f 3 = G m i n ( R , B )
f 3 ( f 3 < 0 ) = 0
Finally, by combining multiple features, a decision formula f was developed to comprehensively account for the relative relationships between shadow, vegetation, and highly illuminated areas. The Otsu thresholding method was then applied to achieve effective shadow extraction [50]. In Equation (7), α, β, and λ represent the weights corresponding to the three features, and T is a non-fixed value dynamically generated based on the brightness distribution of the input image, used to distinguish shadow from non-shadow areas.
f = α f 1 β f 2 λ f 3
S h a d o w = 1     if ( f > T ) 0     if ( f < T )

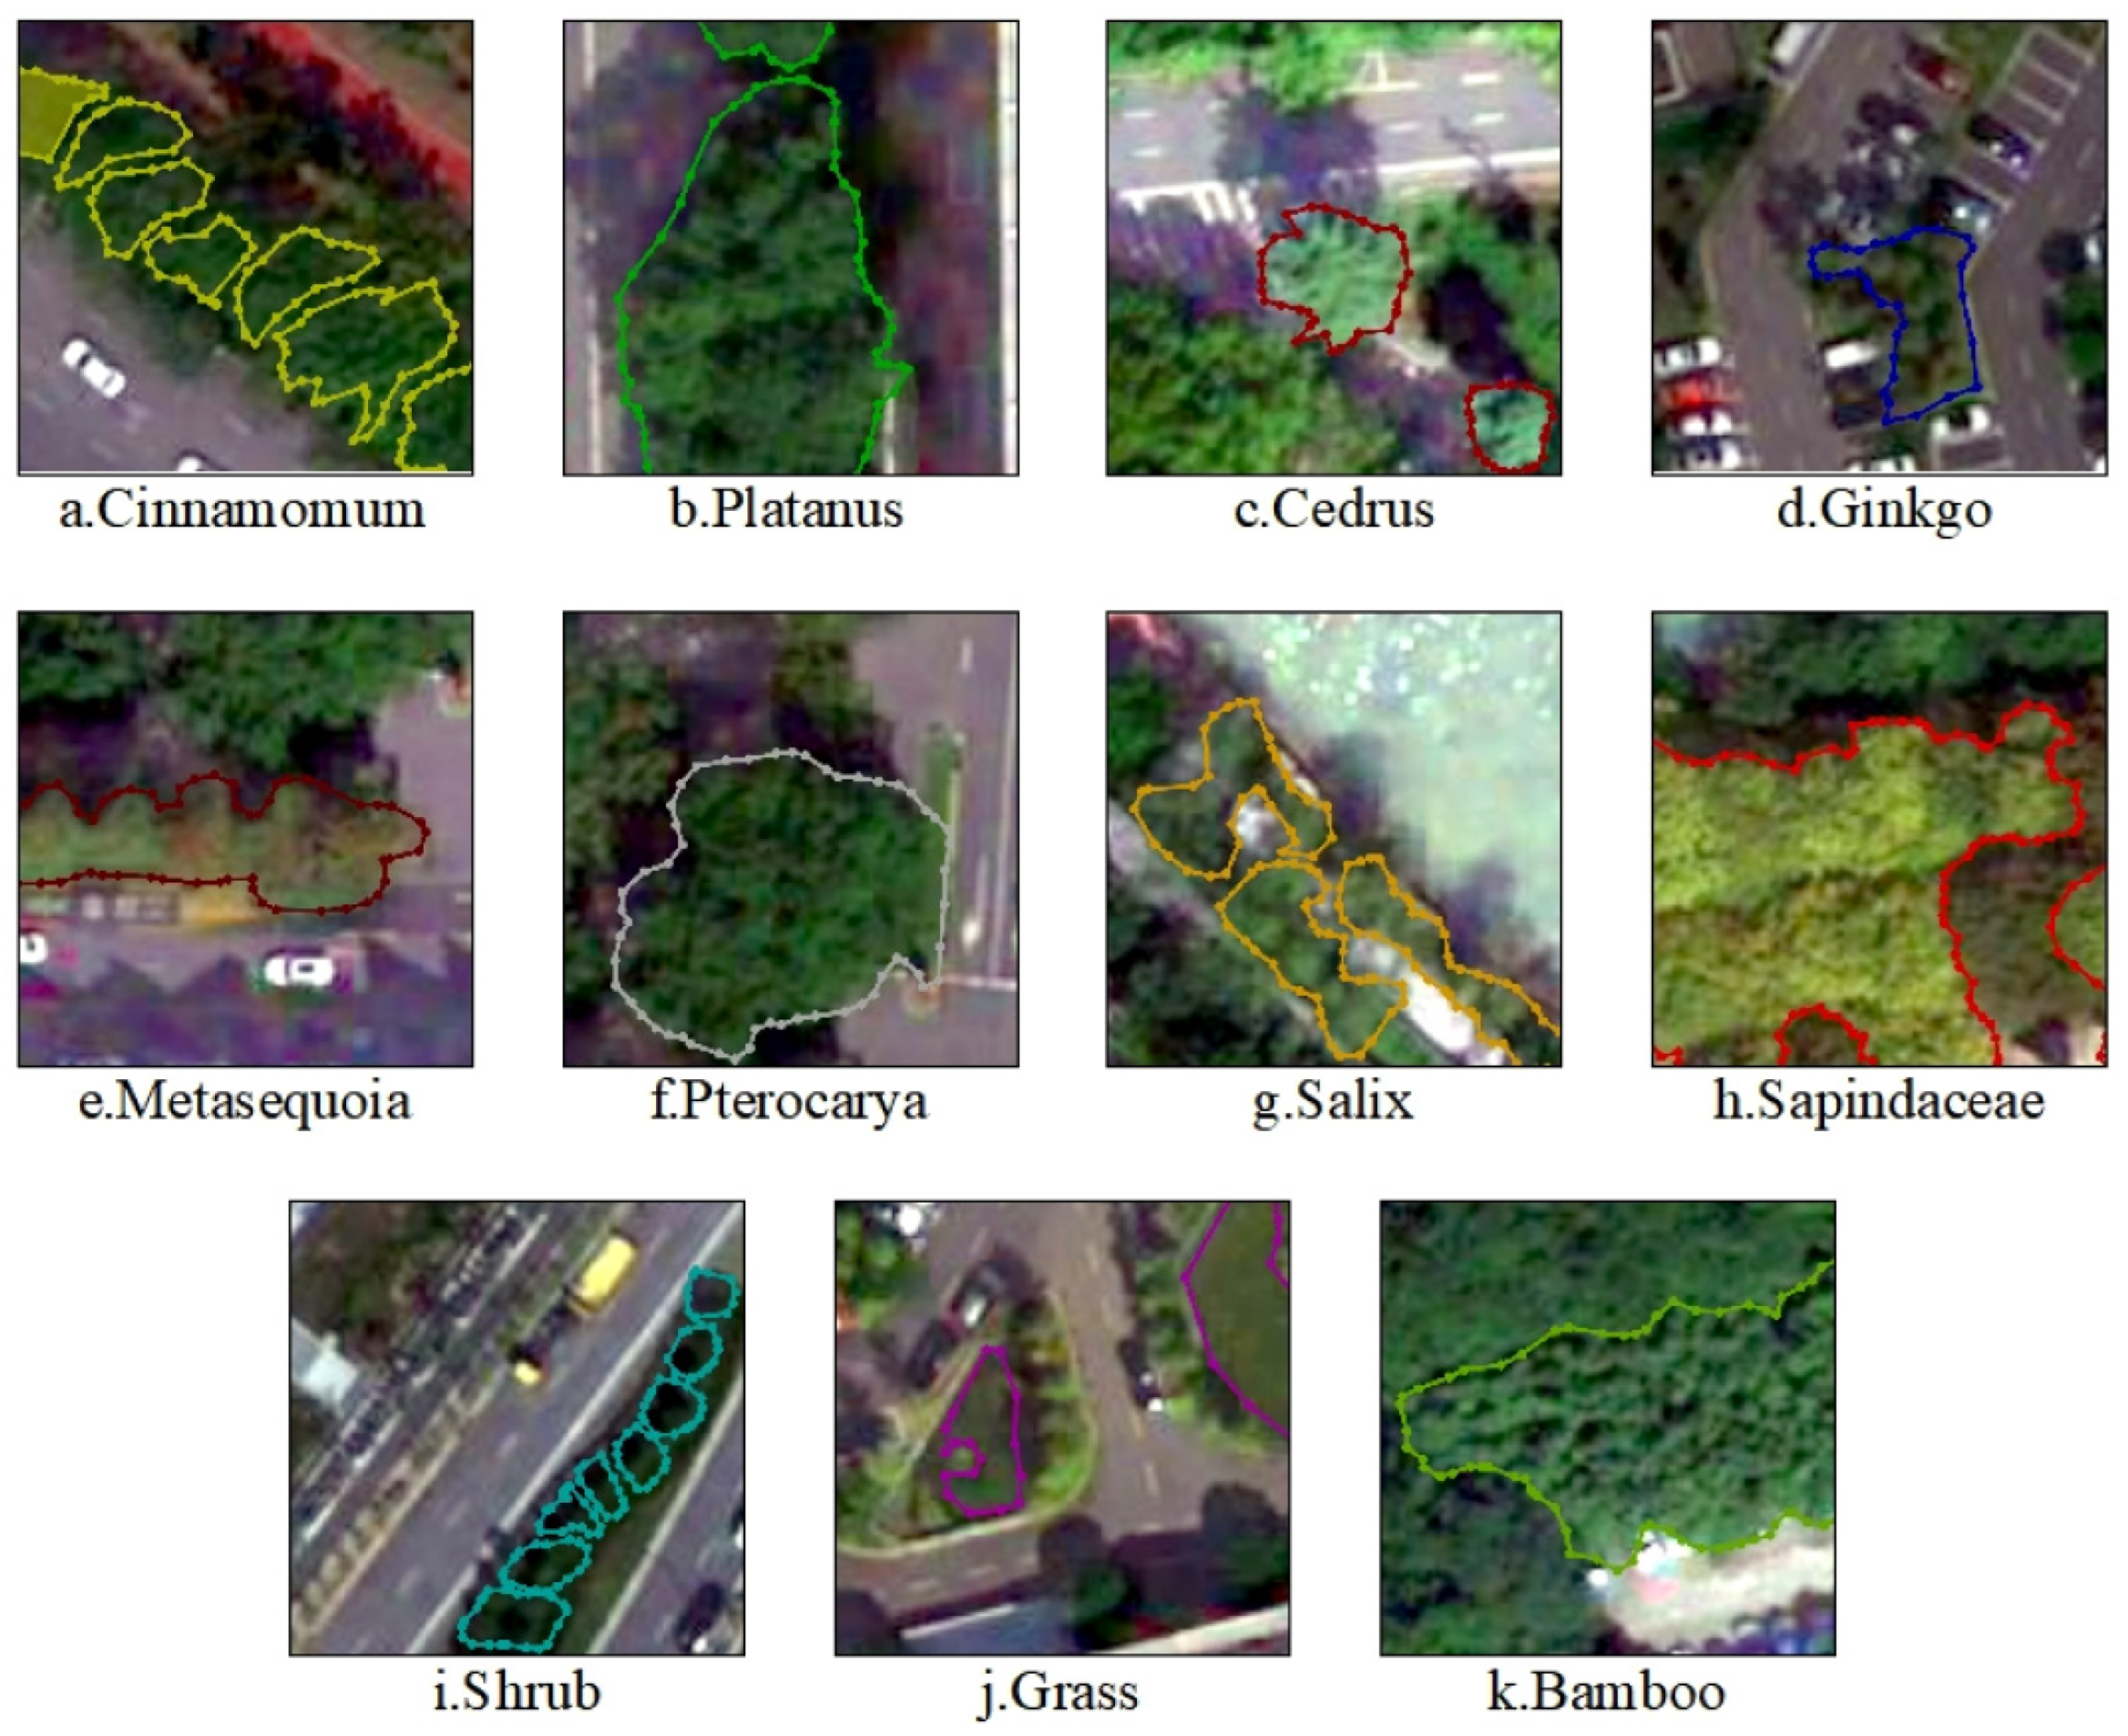
2.3. Field Survey Data

We carried out field investigations from July 2023 to August 2023 and collected 4848 patches from the urban tree areas and recorded the coordinates and dominant tree species of each patch center. Based on the field survey information, a total of 4848 semantic annotation datasets of the Pléiades Neo images, each with an image block of 128 × 128 pixels, were manually created using the Labelme labeling tool [51]. The selected spectral bands included red, green, blue, and near-infrared. The annotated objects encompassed eight categories of deciduous tree species in urban green spaces in Nanjing, as well as shrubs, grass, and bamboo. The target dominant tree species included Cinnamon (Cinnamomum verum J.Presl), Oriental plane (Platanus orientalis L.), Deodar cedar (Cedrus deodara (Roxb.) G.Don), Ginkgo (Ginkgo biloba L.), Dawn redwood (Metasequoia glyptostroboides Hu & W. C. Cheng), Chinese wingnut (Pterocarya stenoptera C. DC.), Weeping willow (Salix babylonica L.), and Soapberry (Sapindus mukorossi Gaertn.). Subsequently, sample images were generated with corresponding labels as illustrated in Figure 2. Of these, ninety percent of these samples were used as the training dataset, and the remaining 10% were allocated as the validation dataset.

3. Methods

In this experiment, we chose DeeplabV3+ as the classification model to classify samples within the study area. Similar to other supervised classification methods, our approach consisted of three stages: the training stage, the classification stage, and the accuracy evaluation stage. In the training phase, image-label pairs with pixel-level correspondence were utilized as training samples and input into the DeeplabV3+ network. The cross-entropy loss between the predicted class labels and the ground truth (GT) labels was computed. The gradients were then calculated using the chain rule and backpropagated through the network. Subsequently, the network parameters of DeeplabV3+ were updated by employing the Adam optimizer, with carefully selected hyperparameters, including appropriate learning rate values. These hyperparameters were tuned based on prior experiments or empirical knowledge to ensure stable and efficient convergence of the network during the training process. During the inference stage, the input images were passed through the trained DeeplabV3+ network to obtain class predictions. Finally, in the accuracy evaluation stage, the accuracy of the classification results was quantified and validated using appropriate evaluation metrics, such as Mean Intersection over Union (Miou), on a separate validation dataset [52]. Driven by CNN, several popular segmentation models have been developed, such as Fully Convolutional Networks (FCN), U-net, SegNet, PSPNet, HRNet, and Deeplab. These models have performed well in civil infrastructure and play a crucial role in urban tree species segmentation and classification [53]. To showcase the superiority of DeeplabV3+ in urban tree species classification tasks, we selected three popular end-to-end structured networks—U-Net, PSPNet, and HRNet—as competing networks for contrast. All four networks employed identical training strategies and parameters, using the same training dataset mentioned earlier. The overall flowchart of this study is illustrated in Figure 3.

3.1. Deep Transfer Learning

Transfer Learning (TL) [54] involves utilizing neural network weights previously trained on extensive datasets and applying these weights to a similarly structured experimental network. This technique addresses issues such as inadequate hardware capabilities and prolonged learning times. Through this approach, weights trained on large datasets in the past can be used in new experiments, requiring only fine-tuning of the model to achieve superior results [55].
TL includes inductive, transductive, and unsupervised TL, aiming to leverage knowledge obtained from existing tasks to address new tasks relevant to the existing ones [55]. In transfer learning, the source domain and target domain are usually represented as D S and D t respectively; x i represent the samples or features of the two domains; y i represent the labels, i.e., the knowledge of D t is learned with the help of the labeled D S , which is equivalent to the following Equations (9) and (10):
D S = x i , y i i = 1 n
D t = x i j = n + 1 n + m
Transfer learning was chosen for this study because it allows for the adaptation of pre-trained convolutional neural network models to new tasks with minimal adjustments. This approach is particularly advantageous because the initial layers of these networks contain universal features that can be effectively transferred, thus reducing the need for extensive retraining. Additionally, transfer learning has demonstrated superior performance in various applications, making it an ideal choice for our tree species classification task using high spatial resolution Pléiades imagery in Nanjing.
Therefore, in this experiment, we uniformly utilized the pre-trained weights of the PASCAL VOC12 (VOC12) dataset for all experimental models for urban tree species classification. The VOC12 dataset was initially created for the PASCAL VOC challenge, covering 20 different object categories, including people, animals, vehicles, etc. It includes annotations for tree categories, making it suitable for urban tree species classification to some extent. We imported the weights of this model into the backbone network of the urban tree species classification task of the current work. The module constructed with shallow convolution and pooling layers served as the feature extractor, supplemented with a new classifier to accomplish the task of urban tree species segmentation and classification. In the task of urban tree species classification, the urban environment presents a high level of complexity, and the VOC12 dataset encompasses mixed scenes of both urban and natural environments. Pre-training with the VOC12 dataset enables the model to more effectively capture the distinct characteristics of various tree species, thereby enhancing the classification accuracy for sparse data.

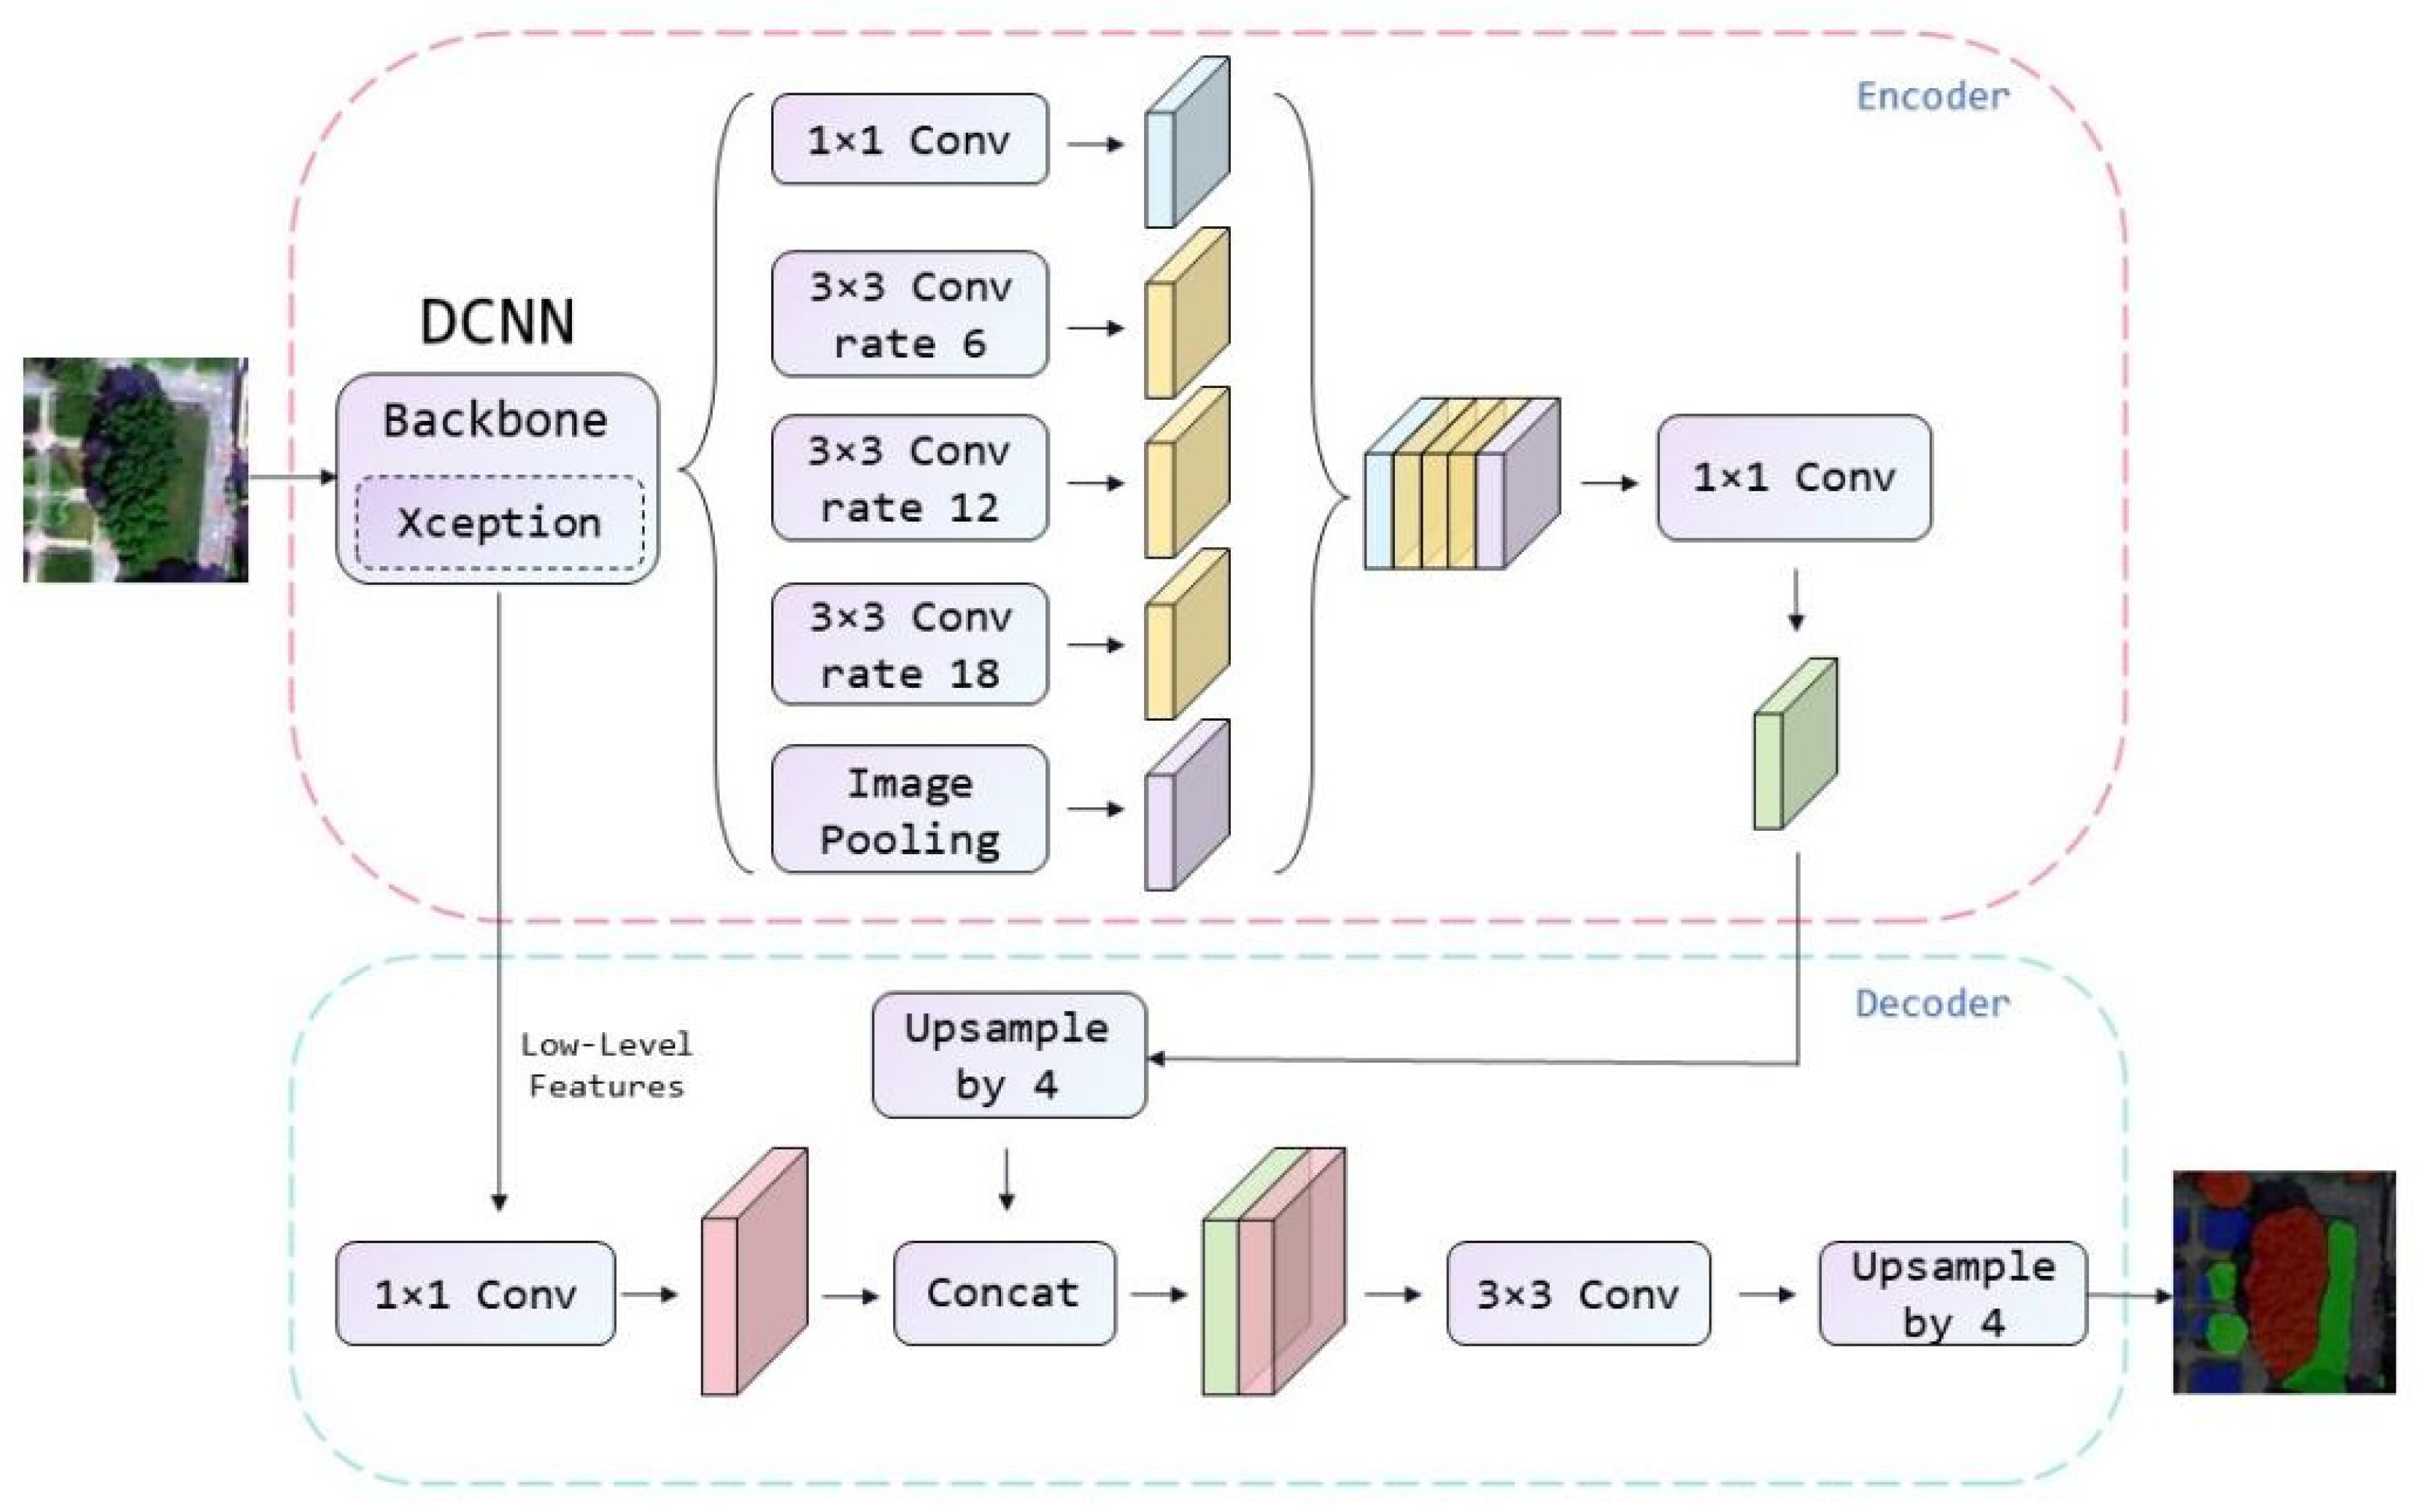
3.2. Network Architecture

DeeplabV3+ is a deep neural network belonging to the Deeplab series [56], designed specifically for improving the accuracy of image semantic segmentation. The DeeplabV3 model enhances the Atrous Spatial Pyramid Pooling (ASPP) module by integrating convolutional kernels, different dilation rates, and diverse receptive fields to address the multi-scale challenges of image segmentation. Built upon the improvements of DeeplabV3, the DeeplabV3+ model aims to enhance segmentation accuracy and efficiency [57]. The DeeplabV3+ model introduces global average pooling in the ASPP module to capture global semantic information. It also incorporates a simple decoder module inspired by the encoder-decoder structure to compress low-level feature maps. Additionally, through operations such as 3 × 3 convolutions and upsampling, the feature maps processed by the ASPP module are gradually upsampled to restore the original resolution. This enables finer boundary detection and pixel-level semantic segmentation. Figure 4 illustrates the detailed model structure of DeeplabV3+.
This experiment utilized the Xception architecture as the backbone network because Xception as the backbone was expected to enhance the accuracy of ImageNet [58]. Xception is based on a depthwise separable convolution structure, known for its high computational efficiency and reliability, allowing for a significant reduction in computational complexity while maintaining performance [59]. In particular, the last few blocks of the backbone are replaced by atrous convolutions, which can extract dense features in variable receptive fields to control the size of feature maps. Subsequently, features extracted from the backbone are passed through the Atrous Spatial Pyramid Pooling (ASPP) to capture and aggregate multi-scale contextual information, which typically demonstrates good performance in semantic segmentation tasks.

3.3. Evaluation Methods

3.3.1. Basic Evaluation Indicators

For deep learning models in semantic segmentation tasks, performance evaluation is crucial for determining the accuracy and reliability of the model. We employed a variety of metrics to comprehensively evaluate the model’s performance on different tasks and datasets, including the Mean Intersection over Union (Miou), Accuracy, and Precision, as well as the Kappa coefficient and Recall. Together, these metrics provide a multidimensional assessment of the performance of deep learning models in semantic segmentation tasks.
IoU is a commonly used semantic segmentation metric [60], as shown in Equation (11), while Miou averages this across all classes in multi-class tasks [61,62], as shown in Equation (12). The closer Miou is to 1, the higher the segmentation accuracy, and the more precise each segmentation category.
I o U = T P ( T P + F P + F N )
M I o u = 1 K + 1 i = 1 K p i i j = 0 k p i j + j = 0 k p j i + p i i
Here, TP represents the true positives, FP represents the false positives, and FN represents the false negatives. K is the total number of landscape label categories, p i i is the total number of pixels correctly predicted as category i; p i j is the total number of pixels belonging to category i but predicted as category j; p j i and is the total number of pixels belonging to category j but predicted as category i.
Accuracy is the ratio of the correctly predicted pixels to the total pixels used in the validation process, indicating the model’s overall performance in classification [63] (OA: Overall Accuracy). The accuracy is usually represented as:
A c c u r a c y = ( T P + T N ) ( T P + T N + F P + F N )
where TN represents the true negatives, other symbols have the same meaning as Equation (11) indicates.
Precision refers to the proportion of samples predicted as positive by the model that are indeed positive [64], evaluating the model’s performance for a specific category (PA: Producer’s Accuracy). A high precision value for a specific class means that if the model predicts this class, the prediction is likely to be correct. The precision is usually represented as:
P r e c i s i o n = T P ( T P + F P )
The Kappa coefficient measures how well a model’s predictions agree with actual classifications, adjusting for chance. A value near 1 indicates high agreement [52]. The complete Kappa coefficient is calculated as in Equation (15):
K a p p a = O A p e 1 p e
p e = 1 n 2 i n i 1 n i 2
O A = i n i i n
where n i k is the number of times rater k predicted category i. The equations show that OA (Overall Accuracy) is the relative observed agreement among raters, namely the Accuracy in Formula (13), and p e is the hypothetical probability of chance agreement. If the raters are in complete agreement, then K a p p a = 1. If there is no agreement among the raters other than what would be expected by chance (as given by p e ), K a p p a = 0.
Recall measures the model’s ability to identify all positive samples. It is calculated as the ratio of true positives to the sum of true positives and false negatives, meaning it reflects the proportion of actual positive samples that the model correctly identified as positive. The recall is usually represented as:
R e c a l l = T P ( T P + F N )
Through the combined use of these evaluation metrics, we could gain a more comprehensive understanding of the model’s performance on different datasets and tasks, identify its strengths and weaknesses, and provide valuable guidance for further improvement and optimization of the model.

3.3.2. 10-Fold Cross-Validation

10-fold cross-validation is a widely used method for evaluating classifier performance. It involves dividing the dataset into 10 subsets, using one subset as the validation set and the remaining 9 subsets as the training set [65]. Because the urban tree species dataset collected in the field is usually limited in size and the number of samples is relatively small, the distribution of data are more critical to the performance of the model. Through 10-fold cross-validation, the limited data can be fully utilized so that each sample has the opportunity to appear in the training set and verification set so as to reflect the internal characteristics and distribution law of the data more comprehensively. This helps to avoid the problem of overfitting or underfitting caused by improper data set division so that the model can better capture the subtle differences and common characteristics between different tree species and then more stably show the performance of different models in the tree species classification task in Nanjing. Moreover, in the face of limited and precious field data collection, this method can maximize the value of the data, provide a more reliable and convincing basis for the optimization and evaluation of the urban tree species classification model, and ensure that the model can accurately identify different urban tree species in practical application [66].

3.4. Implementation Details and Metrics

The hardware and software configuration for implementing the deep learning models in this study was as follows: 12th Gen Intel(R) Core(TM) i7-12700KF 3.60 GHz, equipped with 32.0 GB RAM, NVIDIA GeForce RTX 3080 graphics card, 64-bit Windows 11 operating system, CUDA version 11.6, TensorFlow version 1.8.0+cu11.1, and Python version 3.7. To avoid the impact of hyperparameters on experimental results, a consistent configuration for the hyperparameters of each network was applied. After conducting repeated experiments, the determined hyperparameters were as follows: a learning rate of 0.0005, 400 epochs, 93 iterations per epoch, a batch size of 30, and the Adam optimizer.

4. Experimental Process and Comparison Results

4.1. Comparison Setting

Comparative experiments are a crucial factor in evaluating model performance. In this experiment, in addition to using the DeeplabV3+ model for the classification of major tree species in Nanjing, we conducted comparative experiments by employing three other different models (UNet, HRNet, PSPNet) under the same training strategy, training parameters, and training dataset. However, due to the differences in network structures, the backbone network was chosen based on the universality of each model. These comparative experiments were conducted in the same environment to assess the performance of DeeplabV3+ against the three alternative models.

4.1.1. UNet

UNet is a classical Convolutional Neural Network (CNN) and has been widely used in image segmentation tasks. Its unique architecture and design make it one of the preferred models in the field of image segmentation. The architecture of UNet consists of an encoder and a decoder, forming a U-shaped network structure. This U-shaped structure enables UNet to capture both global information and local details in images, allowing for precise identification and segmentation of objects at the pixel level. The encoder is responsible for feature extraction and downsampling, transforming the input image into a high-level abstract feature representation through multiple layers of convolutional operations. These feature representations contain global contextual information of the image. In the decoder, the feature maps are upsampled and concatenated with corresponding layer features from the encoder. The purpose of this is to progressively reintegrate local detail information, thereby restoring resolution and accurately performing pixel-level classification. This process helps generate accurate segmentation masks and ultimately restores the segmentation results to the same size as the original image [67].
In this experiment, ResNet50 was used as the backbone network, and training was conducted on 128 × 128 pixel input images. The training process employed the Adam optimizer and a cosine decay learning rate scheduling strategy.

4.1.2. HRNet

HRNet (High-Resolution Network) is a deep learning architecture designed to address computer vision tasks on high-resolution images. The key idea behind HRNet is to maintain multi-level connections of feature maps with different resolutions within the network. Traditional Convolutional Neural Networks (CNNs) often decrease the resolution of feature maps within the network to reduce computational costs, potentially leading to the loss of detailed information of high-resolution images. HRNet addresses this by preserving feature maps with multiple resolutions within the network, allowing the network to simultaneously process information at different levels. The core component of HRNet is the High-Resolution Feature Pyramid, which includes feature maps at different resolutions and integrates these features through multi-level connections. This fusion of multi-resolution features makes HRNet powerful in handling both global and local information simultaneously, which is beneficial for tasks such as image segmentation, object detection, and pose estimation [68].
In this experiment, hrnetv2_w48 was used as the backbone network, and training was conducted on 128 × 128 pixel input images. The training process employed the Adam optimizer and a cosine decay learning rate scheduling strategy.

4.1.3. PSPNet

PSPNet (Pyramid Scene Parsing Network) is a deep convolutional neural network designed for image segmentation. It utilizes a pyramid pooling module to handle contextual information at different scales. The core idea of PSPNet is to capture global information through pooling at different scales to improve the accuracy of image segmentation. The pyramid pooling module in the network allows for multi-scale feature extraction on input images. This means that the network can simultaneously focus on both local and global information without resizing the image. This module uses multiple pooling sizes, enabling the network to understand the image from different scales and integrate information from these scales [32].
In this experiment, ResNet50 was used as the backbone network, and training was conducted on 128 × 128 pixel input images. The training process employed the Adam optimizer and a cosine decay learning rate scheduling strategy.

4.2. Results

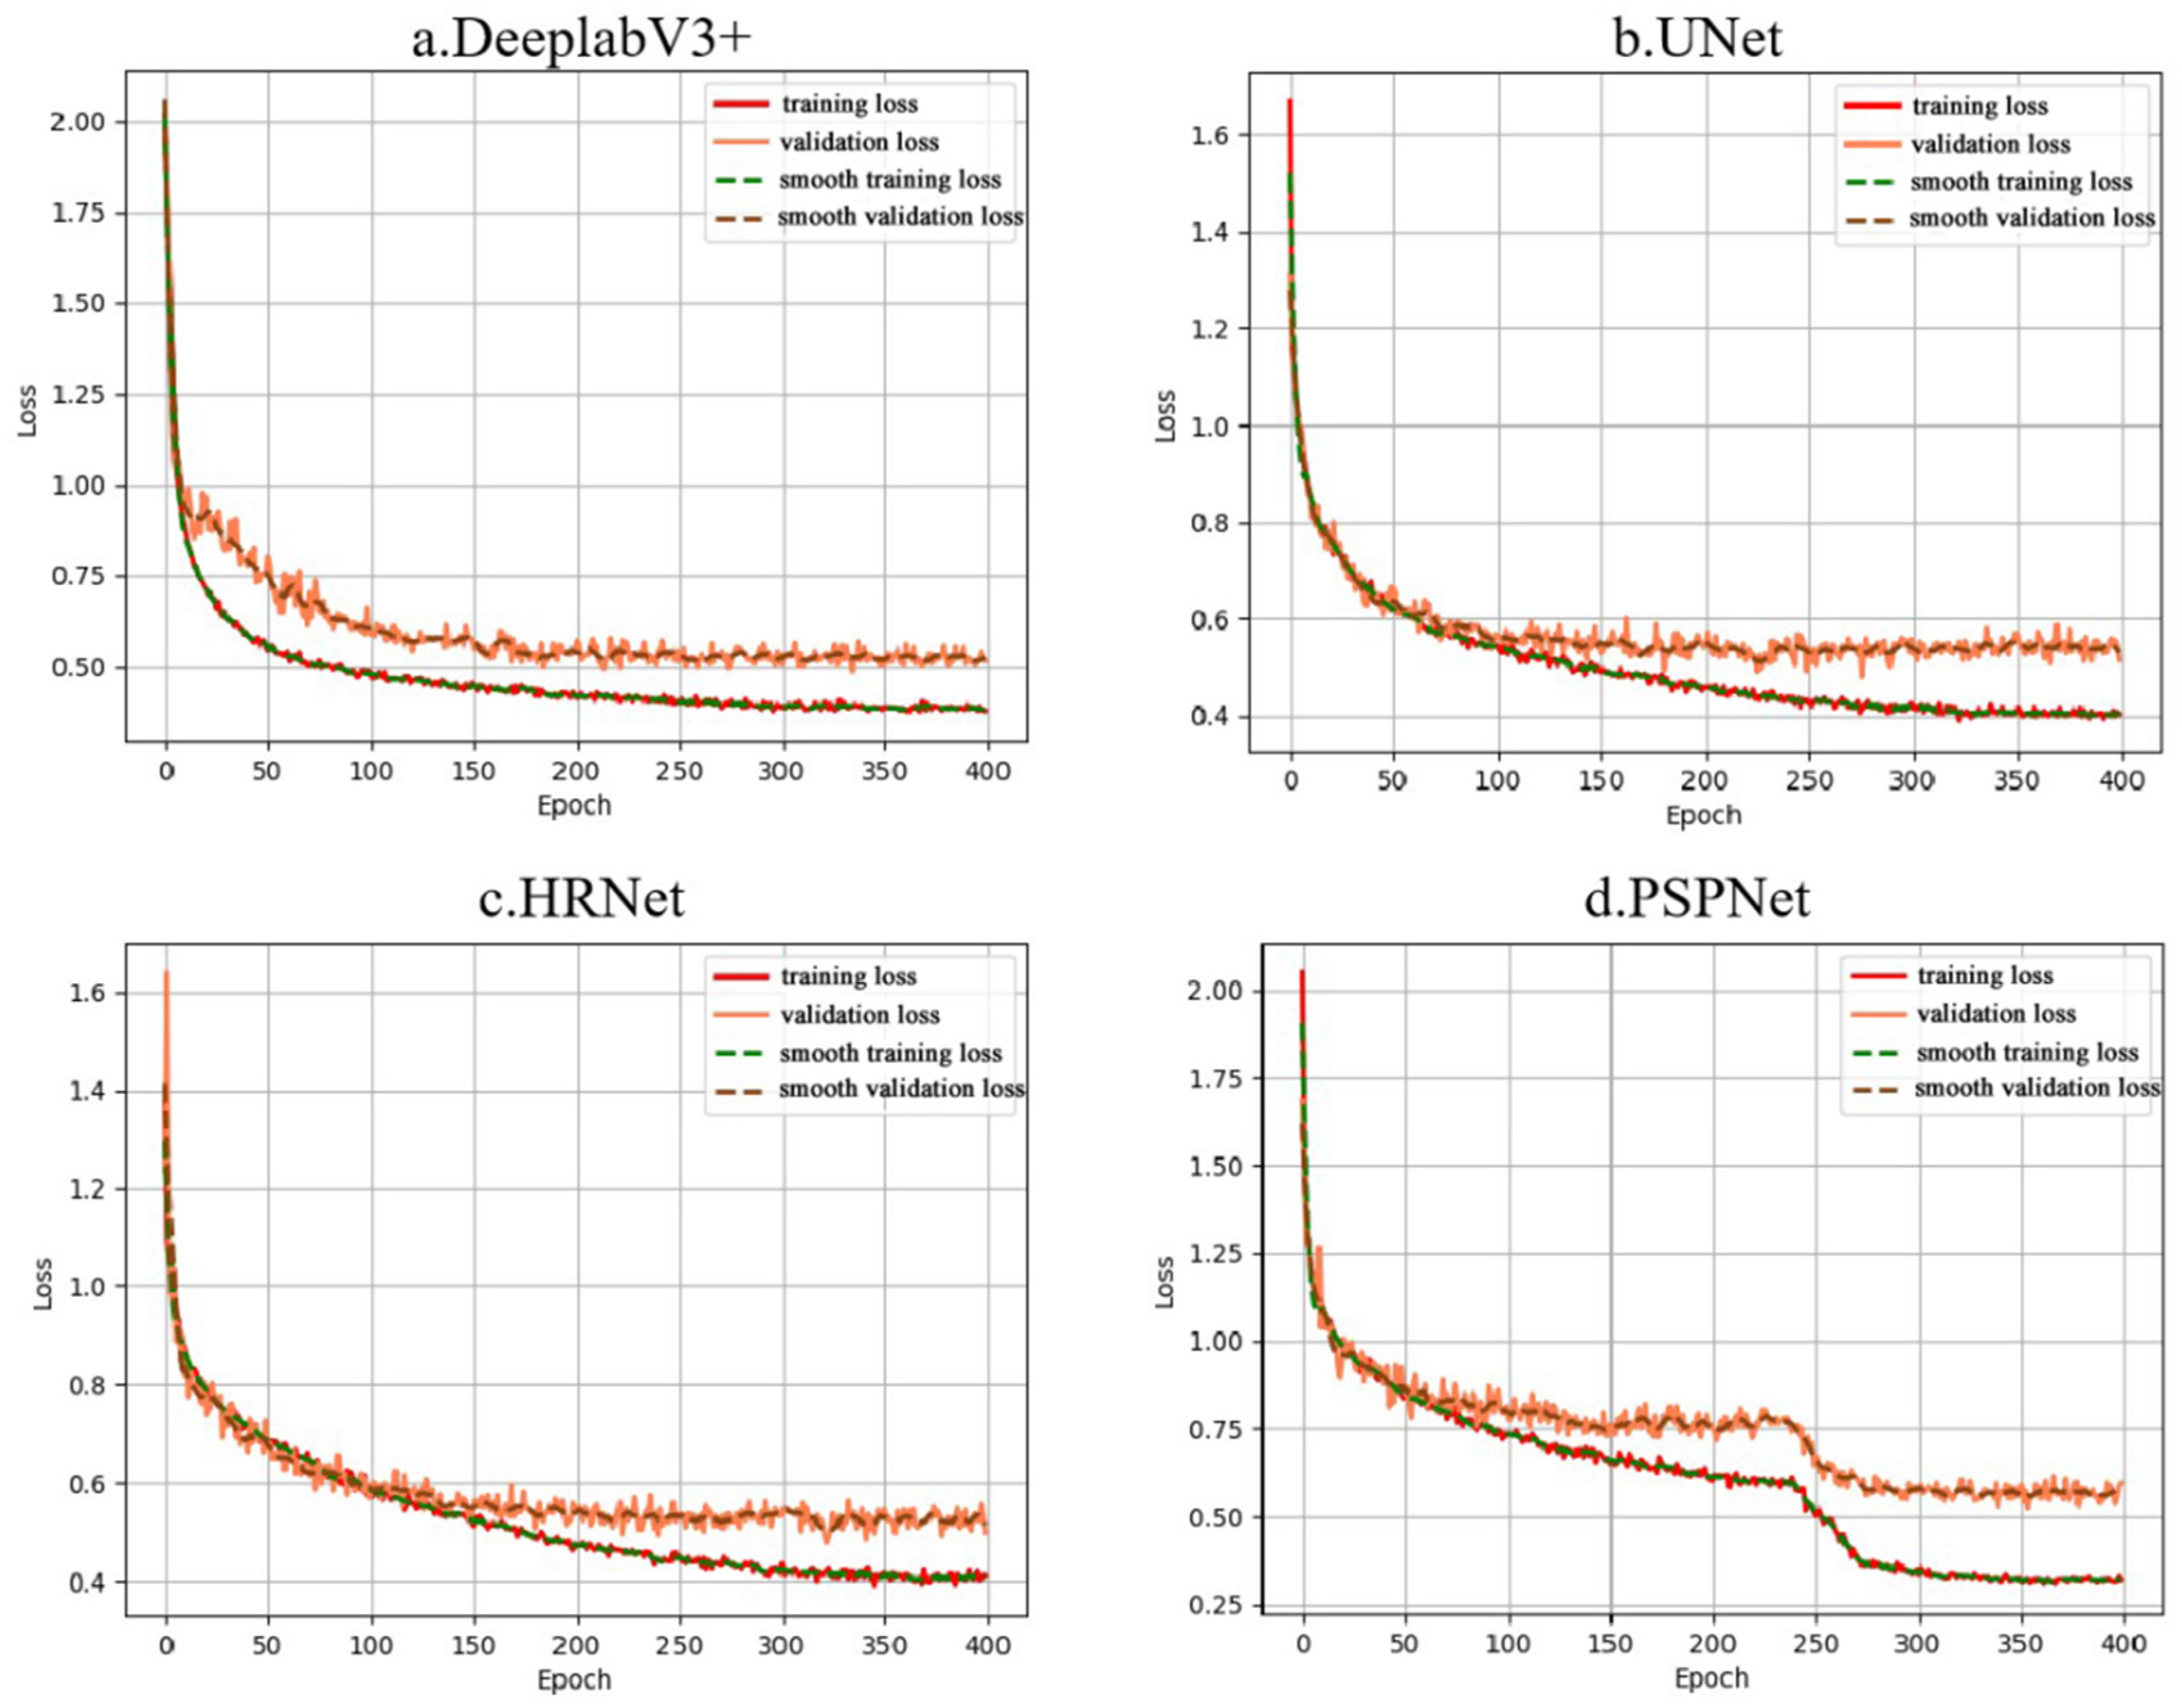
4.2.1. Comparison of Loss Curves of Deep Learning Models

Figure 5 illustrates the average training and validation loss curves of the four deep learning models, including DeeplabV3+, UNet, HRNet, and PSPNet, under the strategy of ten-fold cross-validation. For the DeeplabV3+ model, although its initial loss value was relatively high, above 2.0, its loss curve dropped rapidly in the training process and finally converged to about 0.5. Its validation loss value was always higher than the training loss value, as shown in Figure 5a. This indicates that the DeeplabV3+ model demonstrates strong fitting capability on the training set but may be at risk of overfitting. In contrast, although UNet and HRNet models had relatively low loss values in the initial training stage, the convergence loss value in the later training period was slightly lower than DeeplabV3+, and the volatility of their validation loss curve was less (Figure 5b,c), reflecting better generalization ability of the models.
The loss value change trends of the UNet and HRNet models were quite similar, especially the training loss value curves almost being the same (Figure 5b,c). There were slight differences between the two validation loss curves, and the two loss curves almost maintained flat after the 150th iteration, higher than their corresponding training loss value curves (Figure 5b,c). As the training proceeded, the rate of loss reduction gradually slowed down but maintained a stable decreasing trend, suggesting the models gradually converged during the learning, as depicted in Figure 5b,c. The UNet model had a faster reduction in loss values than HRNet (Figure 5b,c), indicating that the UNet model has a faster learning ability in this specific classification task. Only the PSPNet model exhibited some fluctuations in the early stages but quickly got stabilized during the subsequent training. Its training and validation losses started steadily decreasing after a certain number of epochs, revealing the model’s ability to learn and integrate information at different scales, as shown in Figure 5d.
Observing the four sub-figures, one could discover that after the 250th iterations, the training and validation loss values of the four models dropped to below 0.5 and 0.6, respectively. Although there was still a slight decline in the loss values after this iteration, they got gradually stabilized, maintaining a relatively steady trend from the 300th to the 400th iterations, indicating that the models achieved good convergence of the loss functions, which contributes to improving the accuracy of tree species identification.

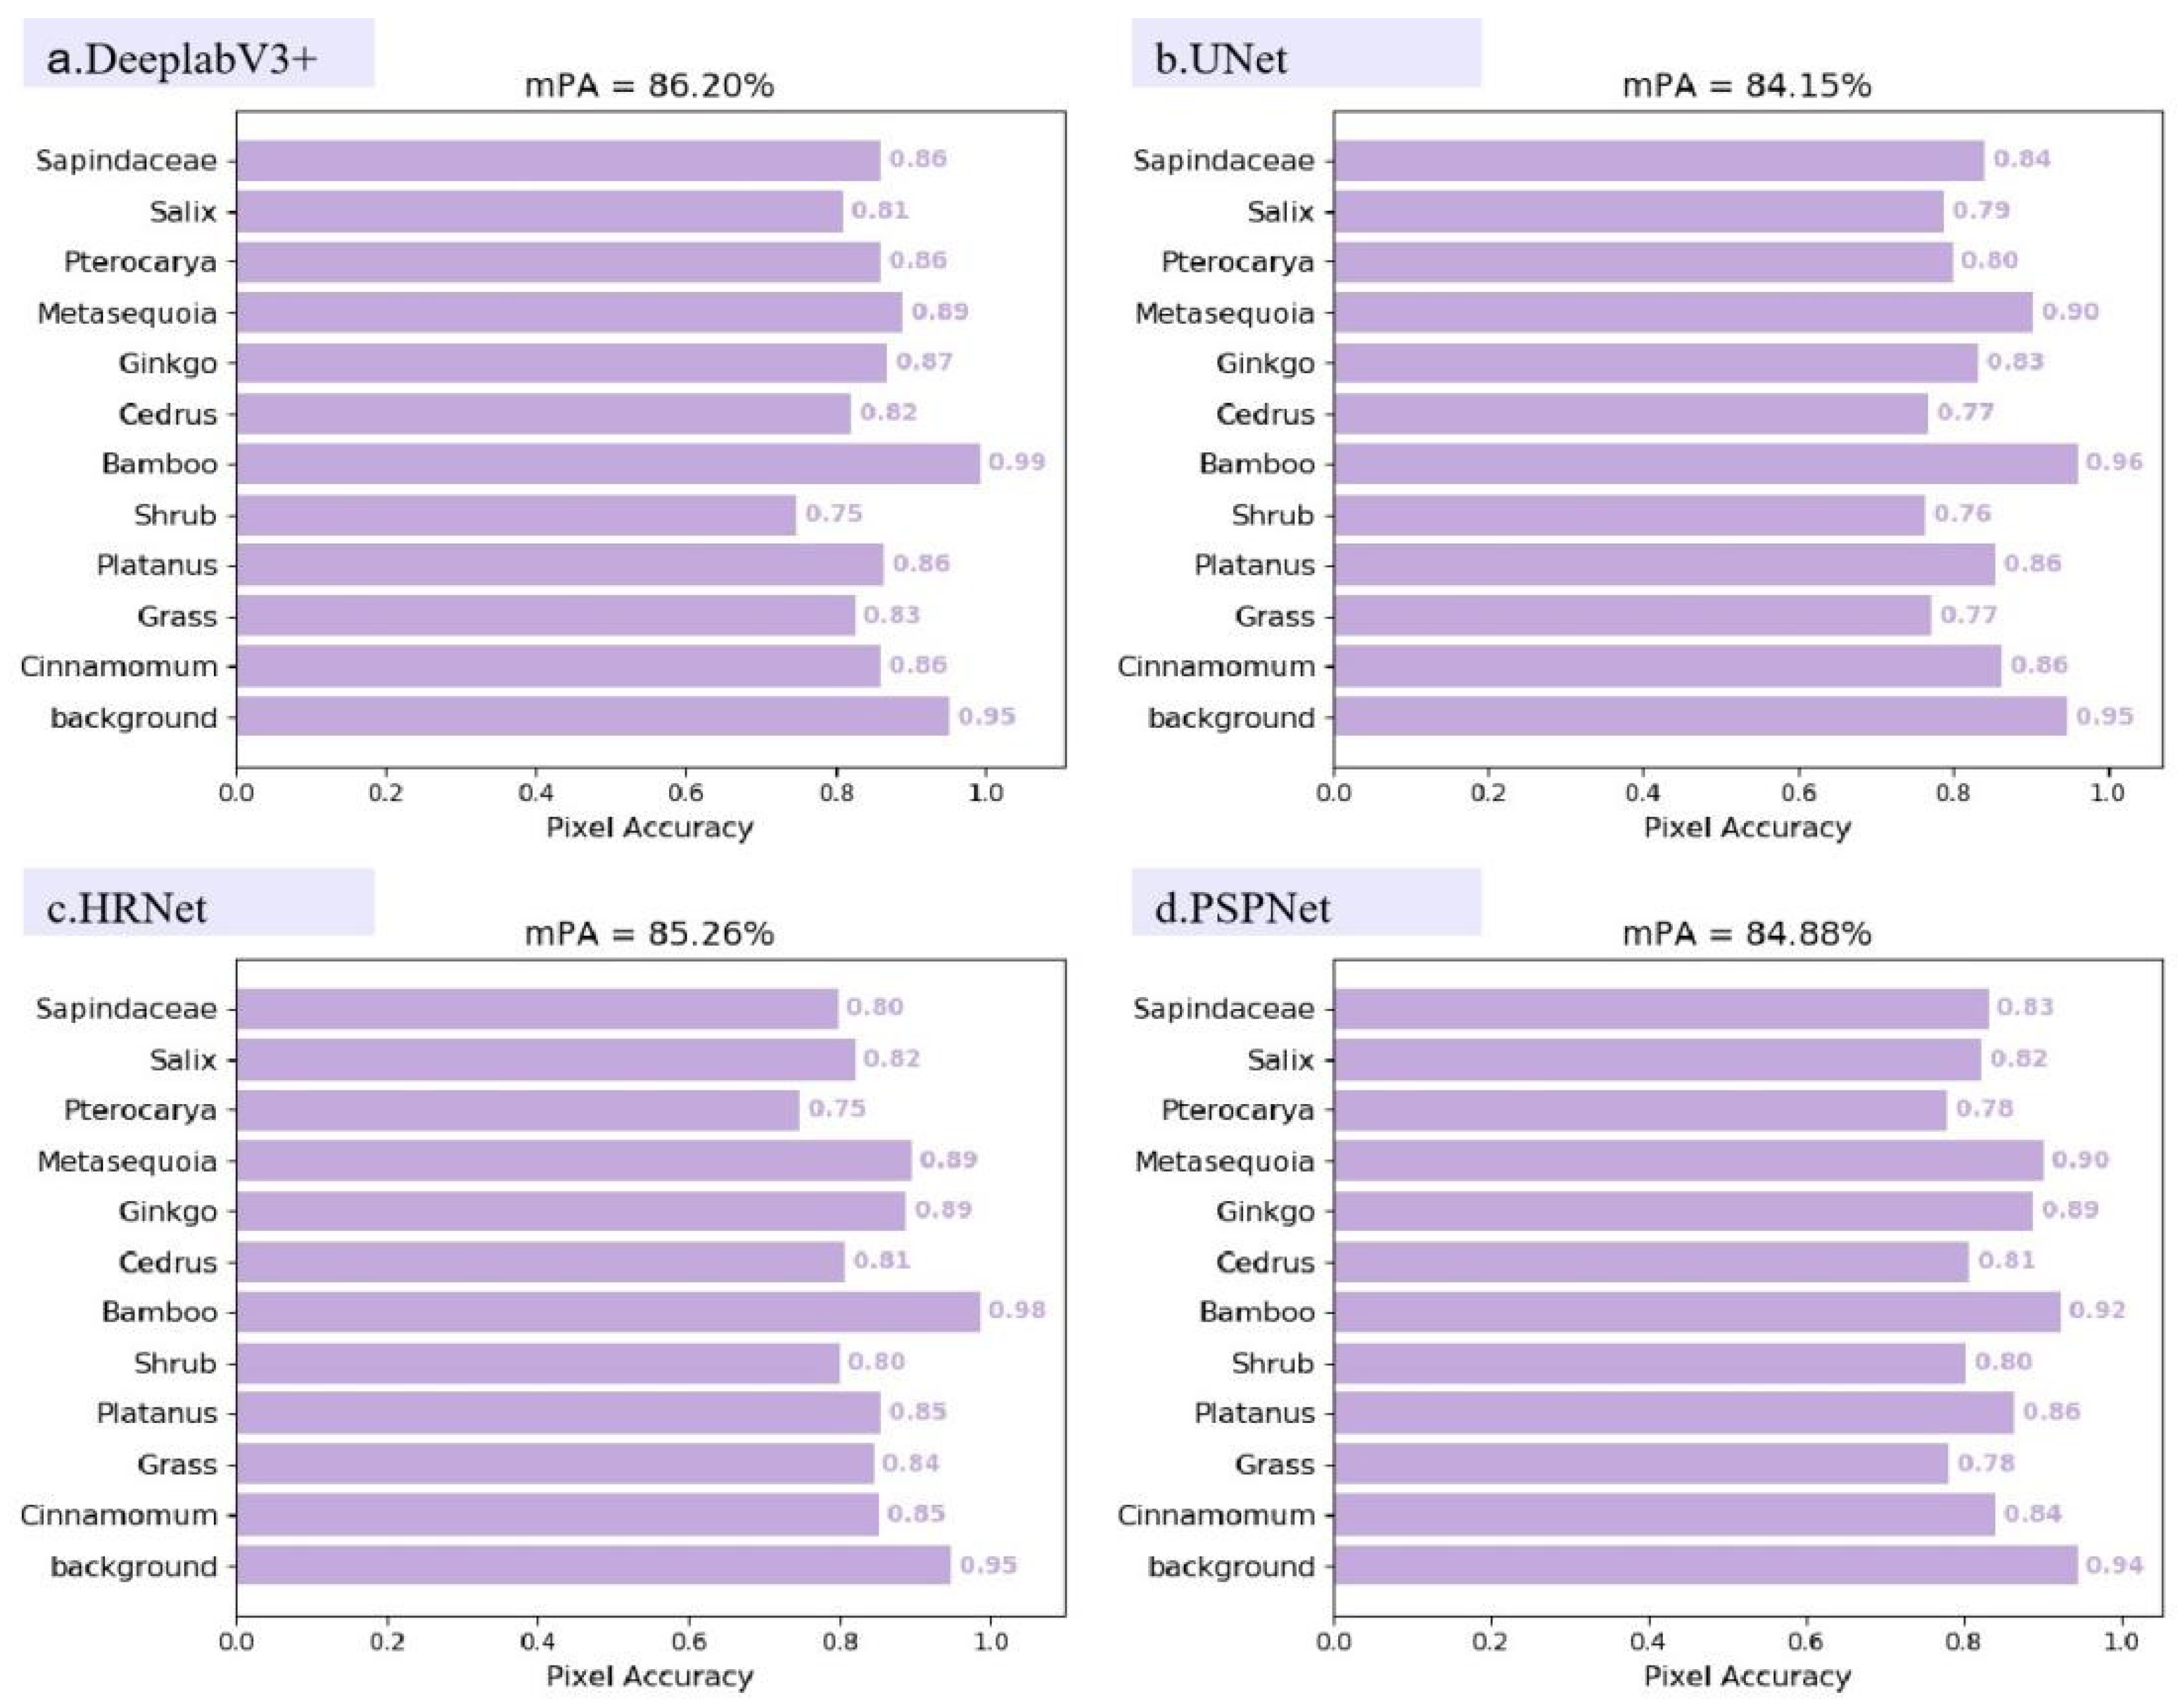
4.2.2. Performance Comparison of Deep Learning Models in Urban Tree Species Classification

Table 2 presents a performance comparison of the four deep learning models (DeeplabV3+, UNet, HRNet, PSPNet) in the urban tree species classification task in terms of four evaluation metrics (Miou, mPA, mRecall, mPrecision) under the 10-fold cross-validation strategy.
The DeeplabV3+ model achieved the highest Miou value, approaching 66.90%, followed by PSPNet (66.78%), UNet (66.42%), and HRNet (66.32%). The DeeplabV3+ model had the highest mPA value at 80.70%, followed by PSPNet (80.32%), UNet (79.72%), and HRNet (79.70%). Still, the DeeplabV3+ model gained the highest mRecall value at 80.70%, followed by PSPNet (80.35%), UNet (79.73%), and HRNet (79.70%). Whereas the DeeplabV3+ model obtained the lowest mPrecision value at 78.73%, Unet (79.61%, highest), HRNet (79.05%), and PSPNet (79.42%). Based on these evaluation measures, overall, the DeeplabV3+ model demonstrated the best performance in the current urban tree species classification task.

4.2.3. Comparison Between Transfer Learning and Non-Transfer Learning

Figure 6 illustrates a training performance comparison in the urban tree species classification task between Transfer Learning (TL)-based DeeplabV3+ and Non-Transfer Learning-based (No TL).
Figure 6a,b compare the changes in the loss functions during the training for the DeeplabV3+ model between the transfer learning scenario and the non-transfer learning scenario. It was clear that when using TL, there was a faster and smoother convergence in the loss functions, with the loss value stabilizing gradually after 50 epochs and a minimal validation loss fluctuation value at about 0.52 (Figure 6b). When without TL, a slower convergence in the loss function took place after over 200 epochs, and a higher fluctuation in the validation loss function was observed (Figure 6a).
Figure 6c,d show the variation in the Miou value across the training epochs. Obviously, when using TL, the Miou value of the DeeplabV3+ model rapidly improved within the first 50 epochs and got stabilized at a higher value (above 70.00%) after the 200th epoch. But when there was no TL, the Miou value fluctuated within the first 200 within the first 50 epochs and increased to near 70.00% and got stabilized at 67.00% after 200 epochs. Overall, transfer learning significantly improved the training efficiency and convergence speed of the DeeplabV3+ model, reducing the training time from 5.35 h to 3.45 h and enhancing both model stability and accuracy. Additionally, transfer learning could lead to a higher accuracy level of the model (Figure 6).

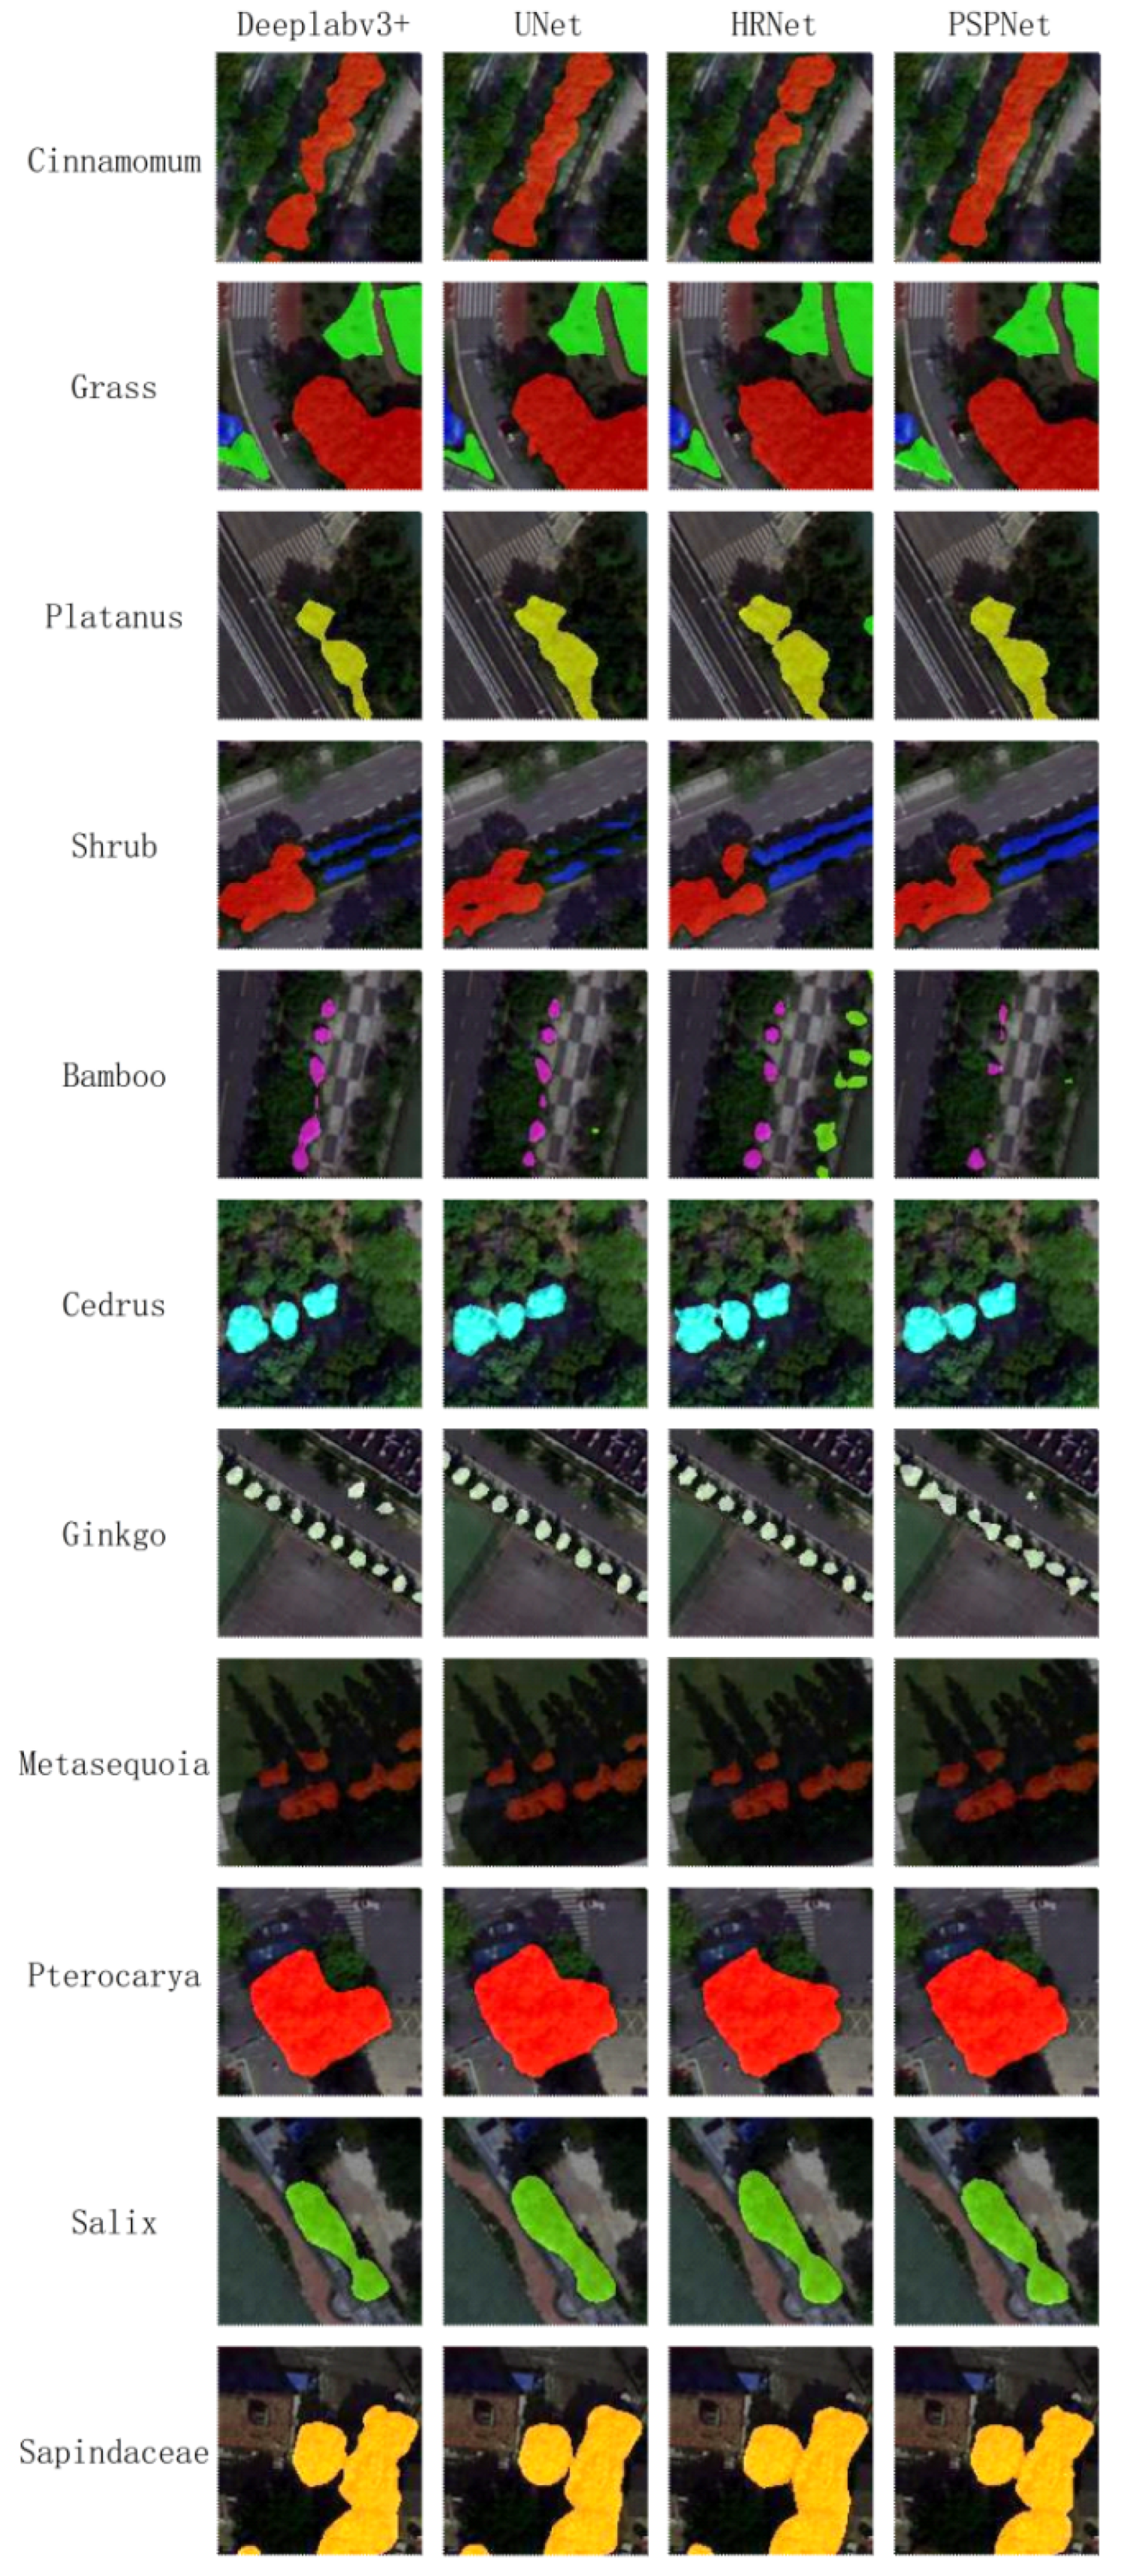
4.2.4. Comparison Results of Models Based on Classification Effects of Major Tree Species

Figure 6 and Figure 7 illustrate the classification accuracy and detailed performance of different urban green space objects across four deep learning models (DeeplabV3+, UNet, HRNet, PSPNet).
The four models performed well in classifying Metasequoia and Bamboo, with accuracies exceeding 0.89. However, the classification performance for tree species such as Shrub and Salix was relatively weaker, with accuracy notably lower, especially for Shrub, where the accuracy hovered around 0.75. For Pterocarya, whose crown shape is easily confused with other tree species, the accuracy was lower in the UNet, HRNet, and PSPNet models. However, the DeeplabV3+ model achieved an excellent accuracy of 0.86 for Pterocarya. The performance for other tree species was balanced across the four models. Overall, based on individual classification accuracy, the DeeplabV3+ model outperformed the other three models in classifying urban green space objects.
Figure 8 compares the segmentation details of DeeplabV3+, UNet, HRNet, and PSPNet models across different tree species.
DeeplabV3+ performed exceptionally well in segmenting Cinnamomum, Grass, Shrub, and Bamboo, with clear boundaries and high segmentation accuracy. In contrast, UNet and HRNet, while able to complete classification, produced blurred boundaries with more omissions and misclassifications, and PSPNet performed poorly in handling complex details. Particularly in the classification of Ginkgo, Metasequoia, and Pterocarya, DeeplabV3+ achieved more precise boundary segmentation and was able to clearly define boundaries even in dense crown areas, with high classification accuracy. Other models performed poorly on these tree species, with significant segmentation errors. Overall, DeeplabV3+ demonstrated the best performance in most tree species segmentation tasks, showing notable advantages in handling complex backgrounds, boundary clarity, and detail processing.
Based on the above results, the DeeplabV3+ model has the strongest comprehensive performance. Figure 9 shows the tree species segmentation and classification results of the main urban area of Nanjing (different colors represent different tree species, and the specific corresponding relationship is shown in Figure 8), which is characterized by the optimal comprehensive indicators, such as segmentation effect compared with other models, and is adopted as the final tree species map.
Overall, these models exhibit varying degrees of accuracy in the classification of specific tree species. The DeeplabV3+ model performs more outstandingly than the other models in the classification of tree species in the main urban areas of Nanjing. UNet, HRNet, and PSPNet show slightly inferior performances, possibly influenced by the clarity of tree species features and the diversity and quality of the training dataset. Future improvements may require richer training data, optimization of model structures, or better extraction of specific tree species features to enhance the accuracy and consistency of classification.

5. Discussion

5.1. Applicability of Various Deep Learning Models in Urban Tree Species Classification

In this study, we compared the performance of four mainstream deep learning models (DeeplabV3+, UNet, HRNet, PSPNet) in the tree species classification task in the main urban areas of Nanjing. Based on the training and validation loss curves displayed in the Results section (Figure 5) and the mean terms of the four evaluation metrics (Table 2), the DeeplabV3+ model demonstrated the best overall performance; an average accuracy of 81.15% can be achieved, which is a great improvement compared to Oghaz et al. (2022) [69], who classified urban tree species with an accuracy of 73.54%. It was able to clearly delineate the boundaries of different objects or areas, segment and classify multiple categories in the images, and achieve accurate identification for each category. This finding is consistent with existing literature. Studies by Yu et al. (2022) [70] and Xia et al. (2021) [71] have also demonstrated that the Deeplab series models outperform other classical segmentation models in agricultural and forestry segmentation tasks. In addition, the accuracy of the model’s classification of specific tree species, such as shrubs and willows, still needs to be further optimized. In contrast, although the accuracy of UNet is slightly lower, its computing cost is relatively low, and it is suitable for resource-limited application scenarios.
In this study, the DeeplabV3+ model incorporated a simple weighting strategy called median frequency weighting and emphasized large-scale contextual information [72], making it not only sensitive to a small number of categories but also more attentive to vegetation types in highly fragmented urban landscapes. This effectively addresses the sample imbalance problem and ensures accurate classification of urban tree species. DeeplabV3+ uses atrous convolution, which allows flexible adjustment of the receptive field of the convolution kernel to capture broader contextual information. This is crucial for complex urban environments, especially for large-scale vegetation classification tasks, as it provides more comprehensive semantic information. DeeplabV3+ also introduces the Atrous Spatial Pyramid Pooling (ASPP) module [28], which extracts features at different scales, aiding in the capture of features of trees of various sizes. This is particularly important given the diversity and size variation in urban trees. In contrast, models like UNet, HRNet, and PSPNet may fail to capture fine details in images under certain conditions, leading to lower classification accuracy.
Previous studies have also focused on the application of deep learning models in classification, but the performance of different models varies across different scenarios. For instance, in the Chang-Zhu-Tan urban agglomeration, Chen et al. (2023) experimentally demonstrated that the UNet++ network outperforms U-Net and DeeplabV3+ models in urban vegetation extraction accuracy by 9.38% and 3.05% [73], respectively. In the study of Boston, Guo et al. (2019) showed that the Deeplab model delivers better segmentation quality in urban imagery compared to SegNet and PSPNet models [74]. The uniqueness of this study lies in the selection of four common deep learning models and conducting comprehensive comparative experiments, thus providing an objective evaluation of their applicability in urban tree species classification. Our findings indicate that the DeeplabV3+ model excels in boundary recognition and multi-class classification, offering significant reference value for future research in tree species classification.

5.2. The Impact of Transfer Learning and Non-Transfer Learning in Tree Species Classification

The method in this paper is primarily based on transfer learning techniques of deep learning models. By consciously choosing a pre-trained model suitable for city classification, the Miou value is improved by about 5%, and the training duration is significantly shortened by about 2 h compared to not using the migration learning model, as shown in Figure 6. Most studies employing popular deep learning architectures utilize transfer learning [75], which involves leveraging existing knowledge from related tasks or domains to improve learning efficiency by fine-tuning pretrained models. A common transfer learning technique is using pretrained CNN models that have been trained on relevant datasets. This study investigates the impact of transfer learning and non-transfer learning on urban tree species classification.
Previous research has also focused on the application of deep learning models in transfer and non-transfer learning. For example, survey papers by Zhuang et al. (2020) and Alzubaidi et al. (2021) provide comprehensive summaries and discussions on transfer learning, emphasizing its importance and potential applications in various fields [55,76]. In urban tree species classification, Diego et al. significantly improved tree species recognition in urban environments through transfer learning [77]. Transfer learning adapts a pre-trained convolutional neural network model to fit a new task through simple adjustments. In 2016, Yosinski and a team from Cornell University conducted a study exploring the transfer learning characteristics of deep neural networks [78]. Their research indicated that the first three layers of deep neural networks usually contained universal features that could be transferred to new tasks, saving a significant amount of retraining work. In some cases, the performance on the new task was even better than on the original task. Wurm et al. (2019) focused on slum mapping and used inductive transfer learning to transfer a pre-trained FCN model from QuickBird to Sentinel-2 and TerraSAR-X [79]. The results of the study showed that the pre-trained FCN significantly improved segmentation accuracy when combined with Sentinel-2. The use of transfer learning, utilizing pre-trained VOC12 dataset weights, significantly improved both accuracy and efficiency. The DeeplabV3+ model converged faster and achieved higher accuracy than non-transfer models, confirming findings from Wang (2023) [36] and Xue et al. (2023) [80]. This shows the potential of transfer learning in enhancing urban tree species classification tasks. VOC12’s diverse categories contribute to the model’s success in handling complex urban environments. However, there is potential for improving the generalization of models through the inclusion of more diverse datasets.
Moreover, the widespread application of the VOC12 dataset in object detection and semantic segmentation tasks also provided valuable insights for this study. In urban tree species classification tasks, deep learning models pretrained on the VOC12 dataset exhibit clear advantages and superior Miou values. We hypothesize that pretrained models based on the VOC12 dataset converge faster and perform better in accuracy. The VOC12 dataset contains 20 different categories, covering people, animals, vehicles, and other objects that appear in complex urban environments. This rich semantic information significantly reduces the likelihood of misclassification in complex urban settings. Pretraining on the VOC12 dataset helps models better understand the characteristics of trees in urban environments, avoiding the extensive time and computational resources required for training from scratch and improving classification accuracy and generalization capability.

5.3. The Influence of Urban Tree Species Dataset on Classification Model

The dataset used in this study does not encompass all variations of urban green spaces, so the model’s generalization capability needs further validation. A significant drawback and obstacle of using deep learning is the requirement for large datasets [79]. Urban environments are highly variable, field surveys are time-consuming and labor-intensive, and errors can occur in data labeling by experts or volunteers, such as identifying visually similar tree species or determining if an image contains weeds [69,81]. Achieving ideal accuracy requires ample datasets, depending on the complexity of the problem. For example, authors Mohanty et al. [82] and Sa et al. [83] commented on the need for more diverse training datasets to improve classification performance.
The dataset used in this study covered 11 types of urban green spaces, achieving a classification accuracy of 86.20%. Comparatively, Oghaz et al. (2022) [69] achieved a much lower accuracy (54.60%) when classifying 73 species. This highlights the importance of regional specificity in dataset construction, where focusing on dominant species and the urban context can improve classification performance. Nanjing’s predominant tree species and orderly plantings make classification relatively straightforward, but expanding the dataset to include more geographical and seasonal variations would enhance generalizability. In urban planning, regular planting can be very helpful for urban green space management, and even though the diversity of training samples can strengthen the model, more studies have shown that reducing the number of species can improve the classification accuracy [19].

5.4. Urban Shadow Problem and Its Influence

In urban tree species classification tasks, the shadow issue is a significant challenge. Shadows can greatly affect the spectral information of remote sensing images, making it difficult to distinguish spectral features between different tree species and thereby impacting classification accuracy. Therefore, in this experiment, the trees in the shadow part of the urban remote sensing image were masked to optimize the tree classification effect. However, for the problem of including shadow trees in training and classification, we also carried out some exploration and thinking during the experiment so as to further evaluate the applicability of common deep learning models for urban tree species classification.
Figure 10 shows some of the selected images with shadow interference in the urban tree classification and the corresponding segmentation classification results of this image in different classification models.
In the shadow region images without additional processing, Figure 10 shows that DeeplabV3+ weakened in shadow vegetation recognition compared to the other three models, frequently resulting in missed or misclassified instances. Although HRNet was more sensitive to vegetation in shadow areas than DeeplabV3+, it still encountered misclassification issues. Compared with the above two models, UNet and PSPNet are more sensitive and accurate for vegetation identification at shadows and are more expected to further solve the shadowing problem of green space classification in urban high-resolution images based on this model.
When the training set includes tree species labels with shaded parts, we find that the classifier automatically ignores some images with shaded parts during the classification process. In previous studies, it has been extremely difficult to identify canopy boundaries in shadows alone [81]. For example, under strong sunlight, the contrast between the sunlit and shadowed sides of a tree canopy may lead to misjudgments by the model in distinguishing the canopy boundary. This problem is exacerbated in complex urban green spaces where shadows cast by buildings, roads, and other man-made objects further complicate the scene, making the spectral features of the canopy more ambiguous and increasing classification difficulty. However, under the training of a large number of non-shaded tree samples, the deep learning model tends to learn those non-shaded tree features with obvious consistency and regularity so that, in the actual classification, the shadow regions that do not conform to these feature patterns will be ignored.
Secondly, in areas with severe shadows, the model may fail to identify the tree species present. This issue is particularly evident in urban green spaces with high tree species diversity and dense spatial distribution [84]. The spectral information of canopies in shadowed areas is often distorted, making it challenging for the model to extract effective classification features. This not only reduces overall classification accuracy but may also result in missing certain tree species.
In addition, if we force shadow trees into the training, although it may theoretically increase the adaptability of the model to complex scenes, it will bring many problems in practice. First of all, due to the variable spectral characteristics of the shadow region, which is affected by various factors such as illumination angle and building material, the complexity and uncertainty of the training data are greatly increased, making it difficult for the model to converge to a stable and accurate classification decision boundary. Secondly, in order for the model to fully learn the features of shadow trees, a large number of shadow tree samples are needed, and it is extremely difficult and costly to obtain these samples and accurately label them, and labeling errors are easy to be introduced, which will further affect the training effect and generalization ability of the model. In addition, excessive pursuit of the classification of shaded trees may lead to a decline in the performance of the model in the classification of non-shaded trees, because the model’s resources and learning ability need to be allocated between the two, and it is difficult to take care of both.
To address the impact of shadows on classification, various improvement methods have been proposed. For instance, Chen et al. (2013) found that shadows distort the spectral information in images, affecting classification accuracy [85]. Zhou et al. (2009) proposed shadow correction techniques to enhance classification precision, indicating that using shadow-corrected high-resolution images could improve urban land cover classification accuracy by nearly 8.00% compared to using untreated images [86]. In addition, Zhang (2012) proposed that the combination of Lidar and hyperspectral images can also avoid the shadowing problem in species classification based on tree crowns to some extent [87,88].
Our current study has certain limitations in dealing with shaded trees, but this is a phased choice after weighing many factors such as research objectives, data complexity, and model feasibility. Although the DeeplabV3+ model shows good stability in general urban tree classification, our experimental results show that the DeeplabV3+ model performs generally in urban shaded areas, with much room for improvement, and subsequent studies can combine the advantages of UNet and PSPNet in identifying vegetation in shaded areas and focus on how to gradually solve the problem of classifying shaded trees in big cities by improving the model structure, optimizing the training algorithm, and combining more auxiliary information so that the tree species classification model can be closer to the real application needs of the urban environment.

5.5. Limitations and Future Directions

The results of this study, particularly the creation of accurate tree species distribution maps, have significant practical implications for urban planning and ecological management. These maps can be leveraged by city authorities to monitor urban biodiversity, enabling more precise ecological monitoring and promoting sustainable green space development. For instance, urban greening departments can utilize this information to optimize tree planting strategies [89], tailoring species selection to specific areas based on environmental conditions and tree characteristics. Moreover, the distribution data can inform targeted irrigation, pest control, and pruning measures, improving the efficiency of maintenance operations [90]. Additionally, in the context of smart city initiatives, the integration of such detailed vegetation maps can support climate resilience strategies, such as wind management and heat island mitigation, by planting species with appropriate canopy sizes and densities in strategic locations [91]. This dataset provides a foundation for future advancements in urban forestry management, contributing to greener, more sustainable cities.
However, there are still some limitations in the study. Firstly, the impact of shadow issues on classification results has not been fully resolved, which may lead to decreased classification accuracy for specific tree species. Secondly, the model’s performance in classifying certain species, such as shrubs and willows, still needs improvement. Future research could consider incorporating more high-resolution data and integrating multi-source data fusion techniques to further enhance classification accuracy. Additionally, reducing computational costs while maintaining high precision is an important direction for future research. By optimizing model structure and algorithms, it is hoped that more efficient tree species classification can be achieved in resource-constrained environments.

6. Conclusions

In this study, we classified multiple tree species in Nanjing’s urban green spaces using high-resolution Pléiades imagery, leveraging transfer learning with the DeeplabV3+ model. The key findings are:
DeeplabV3+ Superiority: DeeplabV3+ outperformed UNet, PSPNet, and HRNet, particularly in handling large-scale contextual information, crucial for accurately classifying urban vegetation.
Transfer Learning Efficiency: Using pre-trained VOC12 weights significantly improved classification accuracy and reduced training time, demonstrating the effectiveness of transfer learning in urban tree species classification.
Dataset Diversity: The dataset’s richness, covering various vegetation types, contributed to improved model performance and adaptation to real-world conditions.
Future research should explore combining different models and expanding the dataset to further enhance model generalization and applicability.

Author Contributions

Conceptualization, M.L. and X.Z.; methodology, X.C.; software, X.C.; validation, X.C.; formal analysis, X.C.; investigation, X.C., M.S. and Z.C.; resources, M.L. and X.Z.; data curation, M.L.; writing—original draft preparation, X.C.; writing—review and editing, X.C. and M.L.; visualization, X.C.; supervision, M.L.; project administration, M.L. and X.Z.; funding acquisition, M.L. All authors have read and agreed to the published version of the manuscript.

Funding

This research was funded by the National Natural Science Foundation of China (grant No. 31971577), the Priority Academic Program Development (PAPD) of Jiangsu Higher Education Institutions, and is supported by the China Scholarship Council Foundation.

Data Availability Statement

The data presented in this study are available on request from the corresponding author.

Conflicts of Interest

Author Xiaowei Zhang was employed by the Zhejiang Forestry Survey Planning and Design Company Limited. The remaining authors declare that the research was conducted in the absence of any commercial or financial relationships that could be construed as a potential conflicts of interest.

References

  1. Haase, D.; Larondelle, N.; Andersson, E.; Artmann, M.; Borgstrom, S.; Breuste, J.; Gomez-Baggethun, E.; Gren, A.; Hamstead, Z.; Hansen, R.; et al. A quantitative review of urban ecosystem service assessments: Concepts, models, and implementation. Ambio 2014, 43, 413–433. [Google Scholar] [CrossRef] [PubMed]
  2. de Groot, R.S.; Wilson, M.A.; Boumans, R. A typology for the classification, description and valuation of ecosystem functions, goods and services. Ecol. Econ. 2002, 41, 393–408. [Google Scholar] [CrossRef]
  3. Yang, J.; Li, Y.; Hay, I.; Huang, X. Decoding national new area development in China: Toward new land development and politics. Cities 2019, 87, 114–120. [Google Scholar] [CrossRef]
  4. Jim, C.Y.; Zhang, H. Species diversity and spatial differentiation of old-valuable trees in urban Hong Kong. Urban Urban Gree 2013, 12, 171–182. [Google Scholar] [CrossRef]
  5. Chen, P.; Xu, W.; Zhan, Y.; Yang, W.; Wang, J.; Lan, Y. Evaluation of Cotton Defoliation Rate and Establishment of Spray Prescription Map Using Remote Sensing Imagery. Remote Sens. 2022, 14, 4206. [Google Scholar] [CrossRef]
  6. Zhang, W.; Zhang, X.; Li, L.; Zhang, Z. Urban forest in Jinan City: Distribution, classification and ecological significance. Catena 2007, 69, 44–50. [Google Scholar] [CrossRef]
  7. Jensen, R.R.; Hardin, P.J.; Hardin, A.J. Classification of urban tree species using hyperspectral imagery. Geocarto Int. 2012, 27, 443–458. [Google Scholar] [CrossRef]
  8. Mairota, P.; Cafarelli, B.; Didham, R.K.; Lovergine, F.P.; Lucas, R.M.; Nagendra, H.; Rocchini, D.; Tarantino, C. Challenges and opportunities in harnessing satellite remote-sensing for biodiversity monitoring. Ecol. Inform. 2015, 30, 207–214. [Google Scholar] [CrossRef]
  9. Abbas, S.; Peng, Q.; Wong, M.S.; Li, Z.; Wang, J.; Ng, K.T.K.; Kwok, C.Y.T.; Hui, K.K.W. Characterizing and classifying urban tree species using bi-monthly terrestrial hyperspectral images in Hong Kong. ISPRS J. Photogramm. 2021, 177, 204–216. [Google Scholar] [CrossRef]
  10. Wang, L.Y.; Lu, D.N.; Xu, L.L.; Robinson, D.T.; Tan, W.K.; Xie, Q.; Guan, H.Y.; Chapman, M.A.; Li, J. Individual tree species classification using low-density airborne LiDAR data via attribute-aware cross-branch transformer. Remote Sens. Environ. 2024, 315, 114456. [Google Scholar] [CrossRef]
  11. Pu, R.; Landry, S. A comparative analysis of high spatial resolution IKONOS and WorldView-2 imagery for mapping urban tree species. Remote Sens. Environ. 2012, 124, 516–533. [Google Scholar] [CrossRef]
  12. Sugumaran, R.; Pavuluri, M.K.; Zerr, D. The use of high-resolution imagery for identification of urban climax forest species using traditional and rule-based classification approach. IEEE Trans. Geosci. Remote Sens. 2003, 41, 1933–1939. [Google Scholar] [CrossRef]
  13. Xiao, Q.; Ustin, S.L.; McPherson, E.G. Using AVIRIS data and multiple-masking techniques to map urban forest tree species. Int. J. Remote Sens. 2004, 25, 5637–5654. [Google Scholar] [CrossRef]
  14. Zhang, X.; Feng, X.; Jiang, H. Object-oriented method for urban vegetation mapping using IKONOS imagery. Int. J. Remote Sens. 2010, 31, 177–196. [Google Scholar] [CrossRef]
  15. Abdollahnejad, A.; Panagiotidis, D.; Shataee Joybari, S.; Surový, P. Prediction of Dominant Forest Tree Species Using QuickBird and Environmental Data. Forests 2017, 8, 42. [Google Scholar] [CrossRef]
  16. Shojanoori, R.; Shafri, H.Z.M.; Mansor, S.; Ismail, M.H. The Use of WorldView-2 Satellite Data in Urban Tree Species Mapping by Object-Based Image Analysis Technique. Sains Malays. 2016, 45, 1025–1034. [Google Scholar]
  17. Mustafa, Y.T.; Habeeb, H.N.; Stein, A.; Sulaiman, F.Y. Identification and Mapping of Tree Species in Urban Areas Using Worldview-2 Imagery. ISPRS Jt. Int. Geoinf. Conf. 2015, II-2, 175–181. [Google Scholar] [CrossRef]
  18. Zhang, K.; Hu, B. Individual Urban Tree Species Classification Using Very High Spatial Resolution Airborne Multi-Spectral Imagery Using Longitudinal Profiles. Remote Sens. 2012, 4, 1741–1757. [Google Scholar] [CrossRef]
  19. Qin, H.; Wang, W.; Yao, Y.; Qian, Y.; Xiong, X.; Zhou, W. First Experience with Zhuhai-1 Hyperspectral Data for Urban Dominant Tree Species Classification in Shenzhen, China. Remote Sens. 2023, 15, 3179. [Google Scholar] [CrossRef]
  20. Yu, H.; Zhang, S.; Kong, B. Vector Distance Algorithm for Optimal Segmentation Scale Selection of Object-oriented Remote Sensing Image Classification. In Proceedings of the 2009 17th International Conference on Geoinformatics, Fairfax, VA, USA, 12–14 August 2009; Volumes 1 and 2, p. 743. [Google Scholar]
  21. Huang, Z.L.; Pan, Z.X.; Lei, B. What, Where, and How to Transfer in SAR Target Recognition Based on Deep CNNs. IEEE Trans. Geosci. Remote Sens. 2020, 58, 2324–2336. [Google Scholar] [CrossRef]
  22. Li, J.X.; Hong, D.F.; Gao, L.R.; Yao, J.; Zheng, K.; Zhang, B.; Chanussot, J. Deep learning in multimodal remote sensing data fusion: A comprehensive review. Int. J. Appl. Earth Obs. 2022, 112, 102926. [Google Scholar] [CrossRef]
  23. Shi, F.; Yang, B.; Li, M. An improved framework for assessing the impact of different urban development strategies on land cover and ecological quality changes—A case study from Nanjing Jiangbei New Area, China. Ecol. Indic. 2023, 147, 109998. [Google Scholar] [CrossRef]
  24. Gui, S.X.; Song, S.; Qin, R.J.; Tang, Y. Remote Sensing Object Detection in the Deep Learning Era-A Review. Remote Sens. 2024, 16, 327. [Google Scholar] [CrossRef]
  25. Xu, Z.; Zhou, Y.; Wang, S.; Wang, L.; Li, F.; Wang, S.; Wang, Z. A Novel Intelligent Classification Method for Urban Green Space Based on High-Resolution Remote Sensing Images. Remote Sens. 2020, 12, 3845. [Google Scholar] [CrossRef]
  26. Vinod, P.V.; Trivedi, S.; Hebbar, R.; Jha, C.S. Assessment of Trees Outside Forest (TOF) in Urban Landscape Using High-Resolution Satellite Images and Deep Learning Techniques. J. Indian. Soc. Remote 2023, 51, 549–564. [Google Scholar] [CrossRef]
  27. Akbar, K.F.; Ashraf, I.; Shakoor, S. Analysis of Urban Forest Structure, Distribution and Amenity Value: A Case Study. J. Anim. Plant Sci. 2014, 24, 1636–1642. [Google Scholar]
  28. Sun, X.Z.; Xie, Y.C.; Jiang, L.M.; Cao, Y.; Liu, B.Y. DMA-Net: DeepLab With Multi-Scale Attention for Pavement Crack Segmentation. IEEE Trans. Intell. Transp. Syst. 2022, 23, 18392–18403. [Google Scholar] [CrossRef]
  29. Wu, Z.Q.; Lv, J.L.; Sun, X.G.; Niu, W.L. MCAC-UNet: Multi scale Attention Cascade Compensation U-Net Network for Rail Surface Defect Detection. In Proceedings of the 2nd Asia Conference on Computer Vision, Image Processing and Pattern Recognition (CVIPPR), Xiamen, China, 26–28 April 2024. [Google Scholar]
  30. Qi, H.; Zhou, H.Y.; Dong, J.Y.; Dong, X.H. Small Sample Image Segmentation by Coupling Convolutions and Transformers. IEEE Trans. Circuits Syst. Video Technol. 2024, 34, 5282–5294. [Google Scholar] [CrossRef]
  31. Tang, Q.S.; Jiang, Z.Y.; Pan, B.L.; Guo, J.T.; Jiang, W.M. Scene Text Detection Using HRNet and Spatial Attention Mechanism. Program. Comput. Softw. 2023, 49, 954–965. [Google Scholar] [CrossRef]
  32. Zhao, H.S.; Shi, J.P.; Qi, X.J.; Wang, X.G.; Jia, J.Y. Pyramid Scene Parsing Network. In Proceedings of the 30th IEEE/CVF Conference on Computer Vision and Pattern Recognition (CVPR), Honolulu, HI, USA, 21–26 July 2017; pp. 6230–6239. [Google Scholar]
  33. Chen, J.D.; Chen, J.X.; Zhang, D.F.; Sun, Y.D.; Nanehkaran, Y.A. Using deep transfer learning for image-based plant disease identification. Comput. Electron. Agric. 2020, 173, 105393. [Google Scholar] [CrossRef]
  34. Selvaraju, R.R.; Cogswell, M.; Das, A.; Vedantam, R.; Parikh, D.; Batra, D. Grad-CAM: Visual Explanations from Deep Networks via Gradient-Based Localization. Int. J. Comput. Vision 2020, 128, 336–359. [Google Scholar] [CrossRef]
  35. Mnih, V.; Kavukcuoglu, K.; Silver, D.; Rusu, A.A.; Veness, J.; Bellemare, M.G.; Graves, A.; Riedmiller, M.; Fidjeland, A.K.; Ostrovski, G.; et al. Human-level control through deep reinforcement learning. Nature 2015, 518, 529–533. [Google Scholar] [CrossRef] [PubMed]
  36. Wang, Z. Mapping the Urban Landscape: A Remote Sensing and Deep Learning Approach to Identifying Forests and Land Cover Features in a Desert City; University of Idaho: Moscow, ID, USA, 2023; p. 160. [Google Scholar]
  37. He, J.J.; Gong, S.L.; Yu, Y.; Yu, L.J.; Wu, L.; Mao, H.J.; Song, C.B.; Zhao, S.P.; Liu, H.L.; Li, X.Y.; et al. Air pollution characteristics and their relation to meteorological conditions during 2014–2015 in major Chinese cities. Environ. Pollut. 2017, 223, 484–496. [Google Scholar] [CrossRef] [PubMed]
  38. Le Louarn, M.; Clergeau, P.; Briche, E.; Deschamps-Cottin, M. “Kill Two Birds with One Stone”: Urban Tree Species Classification Using Bi-Temporal Pleiades Images to Study Nesting Preferences of an Invasive Bird. Remote Sens. 2017, 9, 916. [Google Scholar] [CrossRef]
  39. Jérôme, S. Shaping the Future of Earth Observation with Pleiades Neo. In Proceedings of the IEEE 9th International Conference on Recent Advances in Space Technologies (RAST), Istanbul, Turkey, 11–14 June 2019; pp. 399–401. [Google Scholar]
  40. Pu, R.L.; Landry, S.; Yu, Q.Y. Assessing the potential of multi-seasonal high resolution Pleiades satellite imagery for mapping urban tree species. Int. J. Appl. Earth Obs. 2018, 71, 144–158. [Google Scholar] [CrossRef]
  41. Aiazzi, B.; Baronti, S.; Selva, M. Improving component substitution pansharpening through multivariate regression of MS plus Pan data. IEEE Trans. Geosci. Remote Sens. 2007, 45, 3230–3239. [Google Scholar] [CrossRef]
  42. Aiazzi, B.; Alparone, L.; Baronti, S.; Garzelli, A. Context-driven fusion of high spatial and spectral resolution images based on oversampled multiresolution analysis. IEEE Trans. Geosci. Remote Sens. 2002, 40, 2300–2312. [Google Scholar] [CrossRef]
  43. Lillo-Saavedra, M.; Gonzalo, C. Multispectral images fusion by a joint multidirectional and multiresolution representation. Int. J. Remote Sens. 2007, 28, 4065–4079. [Google Scholar] [CrossRef]
  44. Restaino, R.; Mura, M.D.; Vivone, G.; Chanussot, J. Context-Adaptive Pansharpening Based on Image Segmentation. IEEE Trans. Geosci. Remote Sens. 2017, 55, 753–766. [Google Scholar] [CrossRef]
  45. Fraser, C.S.; Dial, G.; Grodecki, J. Sensor orientation via RPCs. ISPRS J. Photogramm. 2006, 60, 182–194. [Google Scholar] [CrossRef]
  46. Shean, D.E.; Alexandrov, O.; Moratto, Z.M.; Smith, B.E.; Joughin, I.R.; Porter, C.; Morin, P. An automated, open-source pipeline for mass production of digital elevation models (DEMs) from very-high-resolution commercial stereo satellite imagery. ISPRS J. Photogramm. 2016, 116, 101–117. [Google Scholar] [CrossRef]
  47. Xie, Y.K.; Feng, D.J.; Xiong, S.F.; Zhu, J.; Liu, Y.G. Multi-Scene Building Height Estimation Method Based on Shadow in High Resolution Imagery. Remote Sens. 2021, 13, 2862. [Google Scholar] [CrossRef]
  48. Singh, M.; Nain, N.; Panwar, S.; Chbeir, R. Foreground Object Extraction using Thresholding With Automatic Shadow Removal. In Proceedings of the 2015 11th International Conference on Signal-Image Technology & Internet-Based Systems (SITIS), Bangkok, Thailand, 23–27 November 2015; pp. 655–662. [Google Scholar]
  49. Ganesan, P.; Rajini, V.; Sathish, B.S.; Shaik, K.B. HSV Color Space Based Segmentation of Region of Interest in Satellite Images. In Proceedings of the International Conference on Control, Instrumentation, Communication and Computational Technolo-gies (ICCICCT), Kanyakumari, India, 10–11 July 2014; pp. 101–105. [Google Scholar]
  50. Houssein, E.H.; Abdelkareem, D.A.; Emam, M.M.; Hameed, M.A.; Younan, M. An efficient image segmentation method for skin cancer imaging using improved golden jackal optimization algorithm. Comput. Biol. Med. 2022, 149, 106075. [Google Scholar] [CrossRef]
  51. Russell, B.C.; Torralba, A.; Murphy, K.P.; Freeman, W.T. LabelMe: A database and web-based tool for image annotation. Int. J. Comput. Vision. 2008, 77, 157–173. [Google Scholar] [CrossRef]
  52. Du, Z.; Yang, J.; Ou, C.; Zhang, T. Smallholder Crop Area Mapped with a Semantic Segmentation Deep Learning Method. Remote Sens. 2019, 11, 888. [Google Scholar] [CrossRef]
  53. Pan, Y.; Zhang, L. Dual attention deep learning network for automatic steel surface defect segmentation. Comput. Civ. Infrastruct. Eng. 2022, 37, 1468–1487. [Google Scholar] [CrossRef]
  54. Li, Z.; Dong, J. A Framework Integrating DeeplabV3+, Transfer Learning, Active Learning, and Incremental Learning for Mapping Building Footprints. Remote Sens. 2022, 14, 4738. [Google Scholar] [CrossRef]
  55. Zhuang, F.Z.; Qi, Z.Y.; Duan, K.Y.; Xi, D.B.; Zhu, Y.C.; Zhu, H.S.; Xiong, H.; He, Q. A Comprehensive Survey on Transfer Learning. Proc. IEEE 2020, 109, 43–76. [Google Scholar] [CrossRef]
  56. Chen, L.; Zhu, Y.K.; Papandreou, G.; Schroff, F.; Adam, H. Encoder-Decoder with Atrous Separable Convolution for Semantic Image Segmentation. In Proceedings of the COMPUTER VISION—15th European Conference on Computer Vision (ECCV), PT VII, Munich, Germany, 8–14 September 2018; Volume 11211, pp. 833–851. [Google Scholar]
  57. Zheng, S.X.; Lu, J.C.; Zhao, H.S.; Zhu, X.T.; Luo, Z.K.; Wang, Y.B.; Fu, Y.W.; Feng, J.F.; Xiang, T.; Torr, P.; et al. Rethinking Semantic Segmentation from a Sequence-to-Sequence Perspective with Transformers. In Proceedings of the IEEE/CVF Conference on Computer Vision and Pattern Recognition (CVPR), Nashville, TN, USA, 20–25 June 2021; pp. 6877–6886. [Google Scholar]
  58. Akcay, O.; Kinaci, A.C.; Avsar, E.O.; Aydar, U. Semantic Segmentation of High-Resolution Airborne Images with Dual-Stream DeepLabV3+. ISPRS Int. J. Geo-Inf. 2022, 11, 23. [Google Scholar] [CrossRef]
  59. Chollet, F. Xception: Deep Learning with Depthwise Separable Convolutions. In Proceedings of the 30th IEEE/CVF Conference on Computer Vision and Pattern Recognition (CVPR), Honolulu, HI, USA, 21–26 July 2017; pp. 1800–1807. [Google Scholar]
  60. Cai, Z.W.; Vasconcelos, N. Cascade R-CNN: High Quality Object Detection and Instance Segmentation. IEEE Trans. Pattern Anal. Mach. Intell. 2021, 43, 1483–1498. [Google Scholar] [CrossRef]
  61. Chen, L.C.; Papandreou, G.; Kokkinos, I.; Murphy, K.; Yuille, A.L. DeepLab: Semantic Image Segmentation with Deep Convolutional Nets, Atrous Convolution, and Fully Connected CRFs. IEEE Trans. Pattern Anal. Mach. Intell. 2018, 40, 834–848. [Google Scholar] [CrossRef]
  62. Ghorbanzadeh, O.; Blaschke, T.; Gholamnia, K.; Meena, S.R.; Tiede, D.; Aryal, J. Evaluation of Different Machine Learning Methods and Deep-Learning Convolutional Neural Networks for Landslide Detection. Remote Sens. 2019, 11, 196. [Google Scholar] [CrossRef]
  63. Ren, S.Q.; He, K.M.; Girshick, R.; Sun, J. Faster R-CNN: Towards Real-Time Object Detection with Region Proposal Networks. IEEE Trans. Pattern Anal. Mach. Intell. 2017, 39, 1137–1149. [Google Scholar] [CrossRef]
  64. Higham, N.J.; Mary, T. Mixed precision algorithms in numerical linear algebra. Acta Numer. 2022, 31, 347–414. [Google Scholar] [CrossRef]
  65. Kim, J.H. Estimating classification error rate: Repeated cross-validation, repeated hold-out and bootstrap. Comput. Stat. Data Anal. 2009, 53, 3735–3745. [Google Scholar] [CrossRef]
  66. Wong, T.T.; Yeh, P.Y. Reliable Accuracy Estimates from k-Fold Cross Validation. IEEE Trans. Knowl. Data Eng. 2020, 32, 1586–1594. [Google Scholar] [CrossRef]
  67. Ronneberger, O.; Fischer, P.; Brox, T. U-Net: Convolutional Networks for Biomedical Image Segmentation. Med. Image Comput. Comput.-Assist. Interv. Pt. III 2015, 9351, 234–241. [Google Scholar] [CrossRef]
  68. Wang, J.; Sun, K.; Cheng, T.; Jiang, B.; Deng, C.; Zhao, Y.; Liu, D.; Mu, Y.; Tan, M.; Wang, X.; et al. Deep High-Resolution Representation Learning for Visual Recognition. IEEE Trans. Pattern Anal. Mach. Intell. 2021, 43, 3349–3364. [Google Scholar] [CrossRef]
  69. Oghaz, M.; Saheer, L.B.; Zarrin, J. Urban Tree Detection and Species Classification Using Aerial Imagery. In Intelligent Computing, Vol. 2, Computing Conference on Intelligent Computing, Shenzhen, China, 9–11 August 2022; Arai, K., Ed.; Springer: Cham, Switzerland, 2022; Volume 507, pp. 469–483. [Google Scholar]
  70. Yu, H.L.; Che, M.H.; Yu, H.; Zhang, J. Development of Weed Detection Method in Soybean Fields Utilizing Improved DeepLabv3+ Platform. Agronomy 2022, 12, 2889. [Google Scholar] [CrossRef]
  71. Xia, L.; Zhang, R.; Chen, L.; Li, L.; Yi, T.; Wen, Y.; Ding, C.; Xie, C. Evaluation of Deep Learning Segmentation Models for Detection of Pine Wilt Disease in Unmanned Aerial Vehicle Images. Remote Sens. 2021, 13, 3594. [Google Scholar] [CrossRef]
  72. Ayhan, B.; Kwan, C. Tree, Shrub, and Grass Classification Using Only RGB Images. Remote Sens. 2020, 12, 1333. [Google Scholar] [CrossRef]
  73. Chen, S.D.; Zhang, M.; Lei, F. Mapping Vegetation Types by Different Fully Convolutional Neural Network Structures with Inadequate Training Labels in Complex Landscape Urban Areas. Forests 2023, 14, 1788. [Google Scholar] [CrossRef]
  74. Guo, S.C.; Jin, Q.Z.; Wang, H.Z.; Wang, X.Z.; Wang, Y.G.; Xiang, S.M. Learnable Gated Convolutional Neural Network for Semantic Segmentation in Remote-Sensing Images. Remote Sens. 2019, 11, 1922. [Google Scholar] [CrossRef]
  75. Pan, S.J.; Yang, Q.A. A Survey on Transfer Learning. IEEE Trans. Knowl. Data Eng. 2010, 22, 1345–1359. [Google Scholar] [CrossRef]
  76. Alzubaidi, L.; Zhang, J.L.; Humaidi, A.J.; Al-Dujaili, A.; Duan, Y.; Al-Shamma, O.; Santamaría, J.; Fadhel, M.A.; Al-Amidie, M.; Farhan, L. Review of deep learning: Concepts, CNN architectures, challenges, applications, future directions. J. Big Data 2021, 8, 83. [Google Scholar] [CrossRef]
  77. Pacheco-Prado, D.; Bravo-López, E.; Ruiz, L.A. Tree Species Identification in Urban Environments Using TensorFlow Lite and a Transfer Learning Approach. Forests 2023, 14, 1050. [Google Scholar] [CrossRef]
  78. Yosinski, J.; Clune, J.; Bengio, Y.; Lipson, H. How transferable are features in deep neural networks? In Advances in Neural Information Processing Systems 27 (NIPS 2014), Proceedings of the 28th Conference on Neural Information Processing Systems (NIPS), Montreal, QC, Canada, 7–12 December 2015; Ghahramani, Z., Welling, M., Cortes, C., Lawrence, N.D., Weinberger, K.Q., Eds.; Neural Information Processing Systems Foundation: La Jolla, CA, USA, 2014; Volume 27. [Google Scholar]
  79. Wurm, M.; Stark, T.; Zhu, X.X.; Weigand, M.; Taubenböck, H. Semantic segmentation of slums in satellite images using transfer learning on fully convolutional neural networks. ISPRS J. Photogramm. 2019, 150, 59–69. [Google Scholar] [CrossRef]
  80. Xue, X.Y.; Luo, Q.; Bu, M.F.; Li, Z.; Lyu, S.; Song, S.R. Citrus Tree Canopy Segmentation of Orchard Spraying Robot Based on RGB-D Image and the Improved DeepLabv3+. Agronomy 2023, 13, 2059. [Google Scholar] [CrossRef]
  81. Wang, K.P.; Wang, T.J.; Liu, X.H. A Review: Individual Tree Species Classification Using Integrated Airborne LiDAR and Optical Imagery with a Focus on the Urban Environment. Forests 2019, 10, 1. [Google Scholar] [CrossRef]
  82. Mohanty, S.P.; Hughes, D.P.; Salathé, M. Using deep learning for image-based plant disease detection. Front. Plant Sci. 2016, 7, 215232. [Google Scholar] [CrossRef]
  83. Sa, I.; Ge, Z.; Dayoub, F.; Upcroft, B.; Perez, T.; McCool, C. Deepfruits: A fruit detection system using deep neural networks. Sensors 2016, 16, 1222. [Google Scholar] [CrossRef] [PubMed]
  84. Guo, Y.S.; Zhang, H.S.; Li, Q.S.; Lin, Y.Y.; Michalski, J. New morphological features for urban tree species identification using LiDAR point clouds. Urban For. Urban Green. 2022, 71, 127558. [Google Scholar] [CrossRef]
  85. Chen, M.; Seow, K.; Briottet, X.; Pang, S.K. Efficient Empirical Reflectance Retrieval in Urban Environments. IEEE J. Sel. Top. Appl. Earth Obs. Remote. Sens. 2013, 6, 1596–1601. [Google Scholar] [CrossRef]
  86. Zhou, W.Q.; Huang, G.L.; Troy, A.; Cadenasso, M.L. Object-based land cover classification of shaded areas in high spatial resolution imagery of urban areas: A comparison study. Remote Sens. Environ. 2009, 113, 1769–1777. [Google Scholar] [CrossRef]
  87. Zhang, C.Y.; Qiu, F. Mapping Individual Tree Species in an Urban Forest Using Airborne Lidar Data and Hyperspectral Imagery. Photogramm. Eng. Remote Sens. 2012, 78, 1079–1087. [Google Scholar] [CrossRef]
  88. Guan, H.Y.; Yu, Y.T.; Ji, Z.; Li, J.; Zhang, Q. Deep learning-based tree classification using mobile LiDAR data. Remote Sens. Lett. 2015, 6, 864–873. [Google Scholar] [CrossRef]
  89. Estacio, I.; Hadfi, R.; Blanco, A.; Ito, T.; Babaan, J. Optimization of tree positioning to maximize walking in urban outdoor spaces: A modeling and simulation framework. Sustain. Cities Soc. 2022, 86, 104105. [Google Scholar] [CrossRef]
  90. Rice, P.J.; Horgan, B.P.; Rittenhouse, J.L. Evaluation of core cultivation practices to reduce ecological risk of pesticides in runoff from Agrostis palustris. Environ. Toxicol. Chem. 2010, 29, 1215–1223. [Google Scholar] [CrossRef]
  91. Sharifi, A. Co-benefits and synergies between urban climate change mitigation and adaptation measures: A literature review. Sci. Total Environ. 2021, 750, 141642. [Google Scholar] [CrossRef]
Figure 1. Location of the study area within the downtown area of Nanjing metropolitan area (upper right) in Jiangsu province (left) and the zoomed-in subimage of the Pléiades Neo true color composite (lower right).
Forests 16 00783 g001
Figure 2. Presentation of Classification Labels for Different Tree Species, shrub, grass and bamboo.
Forests 16 00783 g002
Figure 3. A flowchart illustrating the main steps of the urban tree species classification methodology applied in this study.
Forests 16 00783 g003
Figure 4. Structure of the Encoder-Decoder Network with Atrous Convolution for Multi-Scale Contextual Information and Boundary Refinement.
Forests 16 00783 g004
Figure 5. Training and validation loss curves of the four deep learning models.
Forests 16 00783 g005
Figure 6. Epoch-loss and epoch-Miou plots for transfer learning (TL) vs. non-transfer learning (No TL) of the DeeplabV3+ model.
Forests 16 00783 g006
Figure 7. Classification accuracy of four deep learning models for each tree species.
Forests 16 00783 g007
Figure 8. Categorical target detail display.
Forests 16 00783 g008
Figure 9. Tree species classification map of major urban areas in Nanjing.
Forests 16 00783 g009
Figure 10. Classification of various models in urban shaded areas.
Forests 16 00783 g010
Table 1. Technical details of the Pléiades Neo satellite imagery used for urban tree species classification.
Band NumberSpectral BandsWavelength (nm)Resolution (m)
Band 1Deep Blue400–4501.2
Band 2Blue450–5201.2
Band 3Green530–5901.2
Band 4Red620–6901.2
Band 5Red Edge700–7501.2
Band 6NIR770–8801.2
Band 7Panchromatic450–8000.3
Table 2. Training results of four deep learning models.
ModelMiou (%)mPA (%)mPrecision (%)mRecall (%)Kappa
DeeplabV3+72.3386.2081.1586.200.82
UNet70.8184.1580.9384.150.81
HRNet70.3285.2679.6585.260.81
PSPNet70.0684.8879.4684.880.80
Disclaimer/Publisher’s Note: The statements, opinions and data contained in all publications are solely those of the individual author(s) and contributor(s) and not of MDPI and/or the editor(s). MDPI and/or the editor(s) disclaim responsibility for any injury to people or property resulting from any ideas, methods, instructions or products referred to in the content.

