Article

Development of Poplar Wood/Bio-Based Composite Phase-Change Material as Novel Ecofriendly Thermo-Regulative Material

1
Department of Forest Industrial Engineering, Bartin University, 74100 Bartin, Türkiye
2
Forest Products Application and Research Center, Bartin University, 74100 Bartin, Türkiye
3
Civil Engineering Department, Faculty of Engineering, Architecture and Design, Bartin University, 74100 Bartin, Türkiye
4
Department of Metallurgical and Material Engineering, Karadeniz Technical University, 61080 Trabzon, Türkiye
5
Interdisciplinary Research Center of Renewable Energy and Power Systems (IRC-REPS), King Fahd University of Petroleum & Minerals, Dhahran 31261, Saudi Arabia
6
Mechanical Engineering Department, Faculty of Engineering, Architecture and Design, Bartin University, 74100 Bartin, Türkiye
7
Department of Forest Industrial Engineering, Karadeniz Technical University, 61080 Trabzon, Türkiye
8
Department of Environmental Engineering, Faculty of Engineering, Architecture and Design, Bartin University, 74100 Bartin, Türkiye
*
Author to whom correspondence should be addressed.
Forests 2025, 16(5), 763; https://doi.org/10.3390/f16050763
Submission received: 3 March 2025 / Revised: 18 April 2025 / Accepted: 28 April 2025 / Published: 30 April 2025

Abstract

:
This study examined the enhancement of thermal properties in wood through impregnation with tallow (TW) and myristic acid (MA) to create a bio-based phase-change material (BPCM) suitable for energy-storing interior building materials. Poplar sapwood was impregnated with TW/MA mixtures in ratios of 30:70, 50:50, and 70:30. Leakage tests revealed a maximum leakage of 2.8% for the 30:70 ratio at 70 °C for 20 min. The weight percentage gain (WPG) reached 112.0%. Fourier transform infrared spectroscopy (FTIR) confirmed the physical combination of the TW/MA mixture and poplar wood. The mixture exhibited a phase-change temperature of 50.5 °C and latent heat of 172 J/g. The differential scanning calorimetry (DSC) results showed a latent heat capacity of 73.6 J/g and a melting temperature of 45.9 °C for the ratio of 50:50. Thermoregulation tests demonstrated an indoor temperature that was sustained within tolerable ranges and reduced room temperature fluctuation. Thermal conductivity decreased by 41.4% in tallow impregnated samples but increased by 10% in the TW/MA mixture. Wood samples impregnated with phase-change materials exhibited 90.71% fungal resistance. Overall, BPCMW showed promise for the practical storage and release of solar thermal energy, with tallow-impregnated wood (TW-W) displaying a superior performance, offering significant benefits in reducing building heating and cooling loads.

1. Introduction

Biomaterials from renewable sources will be required to harmonize the living environment for people in future technologies [1]. Over the past ten years, a significant percentage of timber has been used in single- and multi-story structures, which has a favorable perspective and ensures future interest in bio-based goods [2,3,4]. Using renewable bio-resource building materials to create better interior conditions with less impact on the climate and human health is a sustainable approach. In recent years, there has been a notable surge in the demand for green, renewable, and ecologically friendly building materials, and increasing the use of biomaterials is crucial for achieving sustainable development goals. Engineered building materials are a promising alternative to traditional materials, as they require less energy and are recyclable [5,6,7].
Phase-change materials (PCMs) are categorized into solid–solid, solid–liquid, liquid–gas, and solid–gas types based on their heat storage form. The benefits of solid–liquid PCMs include their broad range of phase transition temperatures, the high latent heat of phase change, and their low cost. Inorganic PCMs, made up of non-organic substances, provide special qualities and benefits for applications involving thermal energy storage. For cold-weather countries with a keen interest in biomaterials, organic phase-change materials (OPCMs) offer a more viable option, as they can be used to regulate internal temperature fluctuations in residential buildings [8,9]. Paraffins and non-paraffins are the two categories of OPCMs. Despite not being bio-based, paraffins and polyethylene glycols are commonly employed as reference materials. With a high latent heat, no supercooling, phase separation, reduced flammability, and thermal and chemical stability for loads of cycles, non-paraffin BPCMs are made from raw materials such as vegetable oils and animal fat [10,11,12,13,14,15,16,17,18].
Many studies have looked at shape-stabilized composite PCMs that are microencapsulated in polymer shells [19,20,21,22] or integrated into a porous supporting material [20] to prevent PCM leakage during the phase transition process. To create a composite PCM, Wen et al. [23] used expanded vermiculite as a support material and lauric acid as the PCM. Jeong et al. [24] developed shape-stabilized composite PCMs for energy savings by impregnating diatomite as the support material with three paraffins.
Wood is a widely used bio-based material in the construction industry, with multi-story wooden buildings gaining popularity in recent years. Another significant development in the building sector is the modification of wood to enhance its functionality for diverse applications. One such innovation involves impregnating wood with phase-change materials (PCMs) to develop novel wood-based materials capable of storing thermal energy. The porous nature of wood makes it an ideal candidate for adsorbing PCMs, enabling the creation of composite materials, as noted by Ma et al. [20]. Most research in this area has focused on using wood flour as a support material in the fabrication of PCM–wood composites. For instance, Yang et al. [25] developed a waste sawdust composite with polyethylene glycol (PEG) as a PCM, while Jiang et al. [21] employed wood flour with four different fatty acids as PCMs. To enhance thermal conductivity, expanded graphite was incorporated into these composites. Additionally, Ma et al. [26] prepared composite PCMs using a blend of lauric and myristic acids impregnated into modified porous wood flour. Despite these advancements, relatively few studies have explored the impregnation of solid wood with PCMs. Notable exceptions include Ma et al. [20], who impregnated delignified solid wood with a eutectic capric–palmitic acid PCM, and Yang et al. [27], who developed composite PCMs using delignified wood and 1-tetradecanol. Further studies have analyzed the hygroscopic, mechanical, and thermal energy storage properties of PCM-impregnated wood, such as Can and Zigon [28], who used N-Heptadecane, and Can [29], who microencapsulated palmitic acid with an ethyl cellulose shell before impregnation. Additionally, Harting and Haller [30] impregnated spruce, beech and poplar wood species with a paraffinic phase-change material (PCM). This study aims to increase the thermal energy storage capacity of wood by impregnating it with tallow (TW) and myristic acid (MA). While wood flour or delignified wood is mostly used in literature, in this study, solid wood is directly impregnated with PCM mixtures. This approach aims to improve the energy storage performance of building materials by providing a sustainable alternative to traditional PCM carriers. The authors have a deep knowledge of wood science, wood protection and energy storage, and this study contributes to the literature on PCM-impregnated wood materials.

2. Materials and Methods

The materials used in our study include poplar (Populus tremula), myristic acid and tallow. Poplar wood (Populus tremula) samples were selected from timber boards with a density of 660 Kg/m3 and were supplied by Kartal Ahsap/Bartın. The samples were cut entirely from the sapwood area and were used for decay experiments with dimensions of 5 mm (R) × 15 mm (T) × 30 mm (L). Myristic acid (tetradecanoic acid, MA), (C14H28O2, melting point: 54.4 °C) was used as the phase-change material. Tallow (TW) was obtained from the Öztürk Beef & Chicken Charcuterie (Bartın, Türkiye) and heated at 80 °C.
Bio-based phase-change materials (BPCMs) were obtained by mixing liquid tallow with molten myristic acid at weights of 30:70, 50:50, and 70:30. The mixture was prepared by stirring at 80 °C and 300 rpm for 5 h.
Wood samples (5 mm (R) × 15 mm (T) × 30 mm (L)) and BPCMs were heated separately to 80 °C before both were placed in an open plastic container. Wood samples were fixed in plastic containers so that they would not float in BPCMs. Liquid BPCMs were then poured onto the wood samples. Samples were kept under vacuum in BPCM. The plastic container containing the samples was placed in a vacuum oven (KNF Laboport) at the level of 0.08 MPa for 4 h with the temperature set at 80 °C. Following the completion of the impregnation procedure, the wood samples were taken out of the liquid PCM and let to cool naturally. Following solidification, the wood samples’ surplus BPCMs were mechanically removed, and the mass of the impregnated samples was quantified to ascertain the absorption of PCMs. Six replicates were used in the study. The difference between the starting mass (mi) and final mass (mf) of the wood sample was used to compute the weight percent gain (WPG), which was then reported as a percentage (Equation (1)). Then, the oven-dry density values of the control and test samples were calculated according to Equation (2). While the m value in Equation (2) denotes weight, the V value denotes volume. The average WPG (%) and wood density are shown in Table 1.
W P G ( % ) = ( m f m i ) m i × 100
where mf represents the oven-dry weights of the treated samples and mi represents the oven-dry weights of the untreated samples.
d ( Kg / m 3 ) = m ( K g ) V ( m 3 )
where d represents density, m the weights and V the value of the untreated samples.
The Fourier Transform Infrared (FT-IR) spectroscopy method was used to analyze the chemical structure of wood and the impregnated wood samples. The infrared spectra of the TW, MA and impregnated wood samples in the wavelength range of 400–4000 cm−1 were determined with the JASCO 430 (Easton, MD, USA) model device. In addition, the Hitachi-7020 (Ankara, Turkey) model differential scanning calorimetry (DSC) device was used to examine the thermal energy storage (TES) properties of the TW, MA and impregnated wood samples. DSC analyses were performed in a nitrogen gas environment at a heating and cooling rate of 3 °C per minute. In addition, X-ray diffraction (XRD) analysis was performed with a Rigaku (Tokyo, Japan) brand device in the 5° to 60° 2θ scanning range. The thermal conductivity properties of the samples were analyzed with the KD2 Pro device. Using the TR1 sensor (Pullman, WA, USA), values ranging from 0.1 to 4.00 W/mK were measured and the average results obtained from three repetitions were considered.
The schematic representation of the test cabin is illustrated in Figure 1. The evaluation of the thermal regulation performance was conducted under real environmental conditions using both reference samples and wood impregnated with phase-change materials (PCMs). Four identical test cabins were fabricated using a 2 cm thick medium-density fiberboard (MDF). To facilitate energy gain, a rooftop installation was equipped with a double-glazed window (14 cm × 14 cm × 2 cm) featuring a solar transmissivity of 0.77. The inner walls, floor, and window frames were insulated using expanded polystyrene foam (EPS). Wooden specimens were positioned on the floors of both the reference and experimental cabins. The testing procedure was conducted on the rooftop at the geographic coordinates 41°38′8.99″ N, 32°20′15″ E during partly cloudy and sunny days (28 February to 1 March 2024). Solar radiation and temperature readings were systematically recorded using a Hioki LR8450 data logger. Global solar radiation levels were determined using an Eco MS-410 first-class pyranometer (Tokyo, Japan), while direct and diffuse radiation components were derived accordingly. Ambient temperature measurements were obtained using T-type thermocouples. Figure 2 depicts the experimental setup for thermal performance assessment under actual weather conditions, including the placement of thermocouples within the test and reference cabins.
The decay resistance of poplar sapwood treated with PCM specimens measuring 5 mm × 15 mm × 30 mm was determined in petri dishes. The specimens were subjected to the brown rot fungus Coniophora puteana (BAM Ebw. 15), cultivated on 3% malt extract agar within petri dishes. Prior to the decay test, the wood samples were sterilized. These samples were then incubated for eight weeks at a controlled environment of 22 °C and 65% relative humidity. After the decay test, the samples were removed from the petri dishes and dried at 65 °C until constant weight. The efficacy of the decay was quantified by the mass loss percentage of the samples, which was determined using the following equation:
Massloss(%) = ((Mo − Md)/Mo) × 100
where Mo represents the initial oven-dry mass of the samples before the test, and Md is the oven-dry mass after fungal exposure.

3. Results

3.1. Weight Percent Gain, Density and Leaching Properties of Wood/Bio-Based Composite

The weight percent gain (WPG, %) of TW-W, MA-W, PCM1W, PCM2W, and PCM3W was determined to be 62.2, 71.1, 107.23, 85.23, and 111.97%; this indicates that higher WPG ratios are the result of TW/MA mixtures. The poplar wood samples had an initial density of 400 Kg/m3, on average. All PCMs studied increased the wood density due to the filling of wood cavities. Dong et al. [31] describe a similar situation in which increasing the rosin concentration used for impregnation of poplar wood led to an increased weight percentage gain and density. This suggests that the PCM can enter the wood matrix, which includes the cell wall and lumen.
Given that the WPG value of the wood samples impregnated with the TW/MA mixture of PCM1W and PCM3W exceeded the average observed in the other sample groups, the research focused on the PCM2W samples for further investigation. Also, since the leaching value in PCM2W samples is less than PCM1W and PCM2W samples. To assess the filtration rate of wood samples, each sample was prepared with dimensions identical to those of the treated sample and conditioned at room temperature prior to testing.
All samples were kept at 30 °C, 50 °C, and 70 °C for 10, 20, and 30 min. At the end of each period, the samples were weighed and the weight losses (%) were calculated (likewise, Equation (1)). Since no leakage occurred in the wood samples at 30 °C and 50 °C, they were not included in Table 2. Table 2 shows the weight loss observed over various time intervals at 70 °C. After a waiting period of 20 min at 70 °C, the maximum leakage was observed. The infiltration rates remained below 3% within 30 min at 70 °C. After the waiting period, the highest observed leakage was 3.3% in MA samples. Figure 3 shows the leakage rates recorded in the samples at various times and temperatures.
As is known, the PCMs we used undergo a solid–liquid phase change when they reach the phase transition temperature of 50 °C. When MA and TW turn into liquid, there will be a decrease in the energy storage density due to the natural fluidity of the liquid. To determine the sealing performance of this shape-stabilized PCM composite, MA, TW and PCM at three different mixing ratios were impregnated into poplar wood samples, then placed on white A4 paper in an oven at 30, 50 and 70 °C. As can be seen in the DSC results, the melting temperature of pure MA and TW samples is 53.50 °C and 48.14 °C. However, it was observed that MA and TW trapped in poplar wood pores did not leak through the wood up to 70 °C (Figure 3). The leaching places were guided by a red line so that each sample could be examined and compared more easily. TW and MA had an almost 2% decline when kept at 70 °C for 20 min; more leaching was observed in the prepared TW/MA mixtures. Compared with MA (3.3%), the PCM2W blend (1.9%) exhibited much better shape stabilization performance. Based on the TW content, PCM-impregnated poplar wood samples were able to maintain a good shape during the heating process.
Top Row: All three samples show no signs of leaking after 30 min at 50 °C. Middle Row: Leakage becomes more apparent after 20 min at 70 °C. There is some leakage in MA-W and TW-W; the regions highlighted in red are more noticeable than they are in the 50 °C situation. In comparison to MA-W, PCM2W exhibits less leakage, which suggests improved form stabilization. Bottom Row (70 °C for 30 min): All samples exhibit significant leakage, with MA-W exhibiting the biggest leaked area. TW-W has significant leakage as well. Even though PCM2W still leaks, its confinement is comparatively better than the other two, suggesting that its shape stability performance has increased. Liquid PCM leaking from wood pores is a serious problem since it lowers the material’s effectiveness for thermal storage and can eventually cause material degradation and the loss of functionality. A higher leaching rate may occur if there is an excessive amount of PCM material in the wood cell cavities. Reducing the WPG rate can help mitigate this issue.

3.2. FT-IR Spectrum of Wood/Bio-Based Composite

The FT-IR spectra of TW, MA, and PCM2 are shown in Figure 4. Figure 4 shows that the stretching vibration of the C-H bond in the single-bond CH2 and single-bond CH3 groups of fatty acids is responsible for the absorption bands at 2917 cm−1 to 2851 cm−1. The absorption band at 721 cm−1 is associated with the C-H bond in the single-bond CH2 group’s rocking vibration. A long-chain alkane structure is indicated by these absorption bands. Many studies in the literature show that the band between 1700 and 1737 cm−1 is the C=O bond in the carboxylic acid or ester bond [30,32,33]. The stretching peak at 942 cm−1 was due to the -OH swinging or rocking mode, which was characteristic of the aliphatic chain of MA.
In this study, the characteristic peaks of poplar wood were identified, aligning with findings from previous research. The primary OH and CH stretching vibrations were observed at 3354 cm−1 and 2915 cm−1, respectively. The C=O bond, associated with carboxylic acid or ester groups, was detected at 1735 cm−1. Lignin-related bands were identified at 1421 cm−1 (C-H deformation vibration), 1504 cm−1 (aromatic skeleton vibration), and 1593 cm−1 (C=C benzene ring vibration). Additionally, the band at 1026 cm−1 was attributed to C-O-C stretching vibrations in lignin [30].
The impregnation process led to notable spectral changes. The sharp increase in the peaks at 2848–2900 cm−1 and 1738 cm−1 in TW-treated samples indicates the presence of C=O groups linked to fatty acids [32]. A shift from 1717 cm−1 (untreated wood) to 1738 cm−1 after TW impregnation was observed, consistent with previous studies [33]. Furthermore, new absorption bands at 2924 cm−1 and 2854 cm−1, corresponding to the asymmetric and symmetric stretching vibrations of methylene groups in fatty acids, support the presence of oleic acid.
The primary absorption peaks of MA were also identified (Figure 4). Peaks at 2918 cm−1 and 2846 cm−1 corresponded to the symmetric and asymmetric stretching vibrations of the C-H bond in the -CH2 group [34]. Peaks at 1471 cm−1 and 1307 cm−1 were associated with C-H bending vibrations [35]. The stretching vibration of the C=O bond appeared at 1692 cm−1, shifting to 1698 cm−1 after impregnation. The -OH out-of-plane wagging vibration was detected at 934 cm−1. Additionally, the -CH2 rocking vibration was observed at 719 cm−1, indicating the presence of four or more -CH2 groups [36].
For samples impregnated with TW/MA mixtures, characteristic peaks of both components were present (Figure 5). Specifically, in PCM2W, the MA-associated peak at 1680 cm−1 shifted to 1702 cm−1, while the TW-associated peak at 1737 cm−1 shifted to 1741 cm−1, confirming the successful incorporation of both materials into the wood structure.

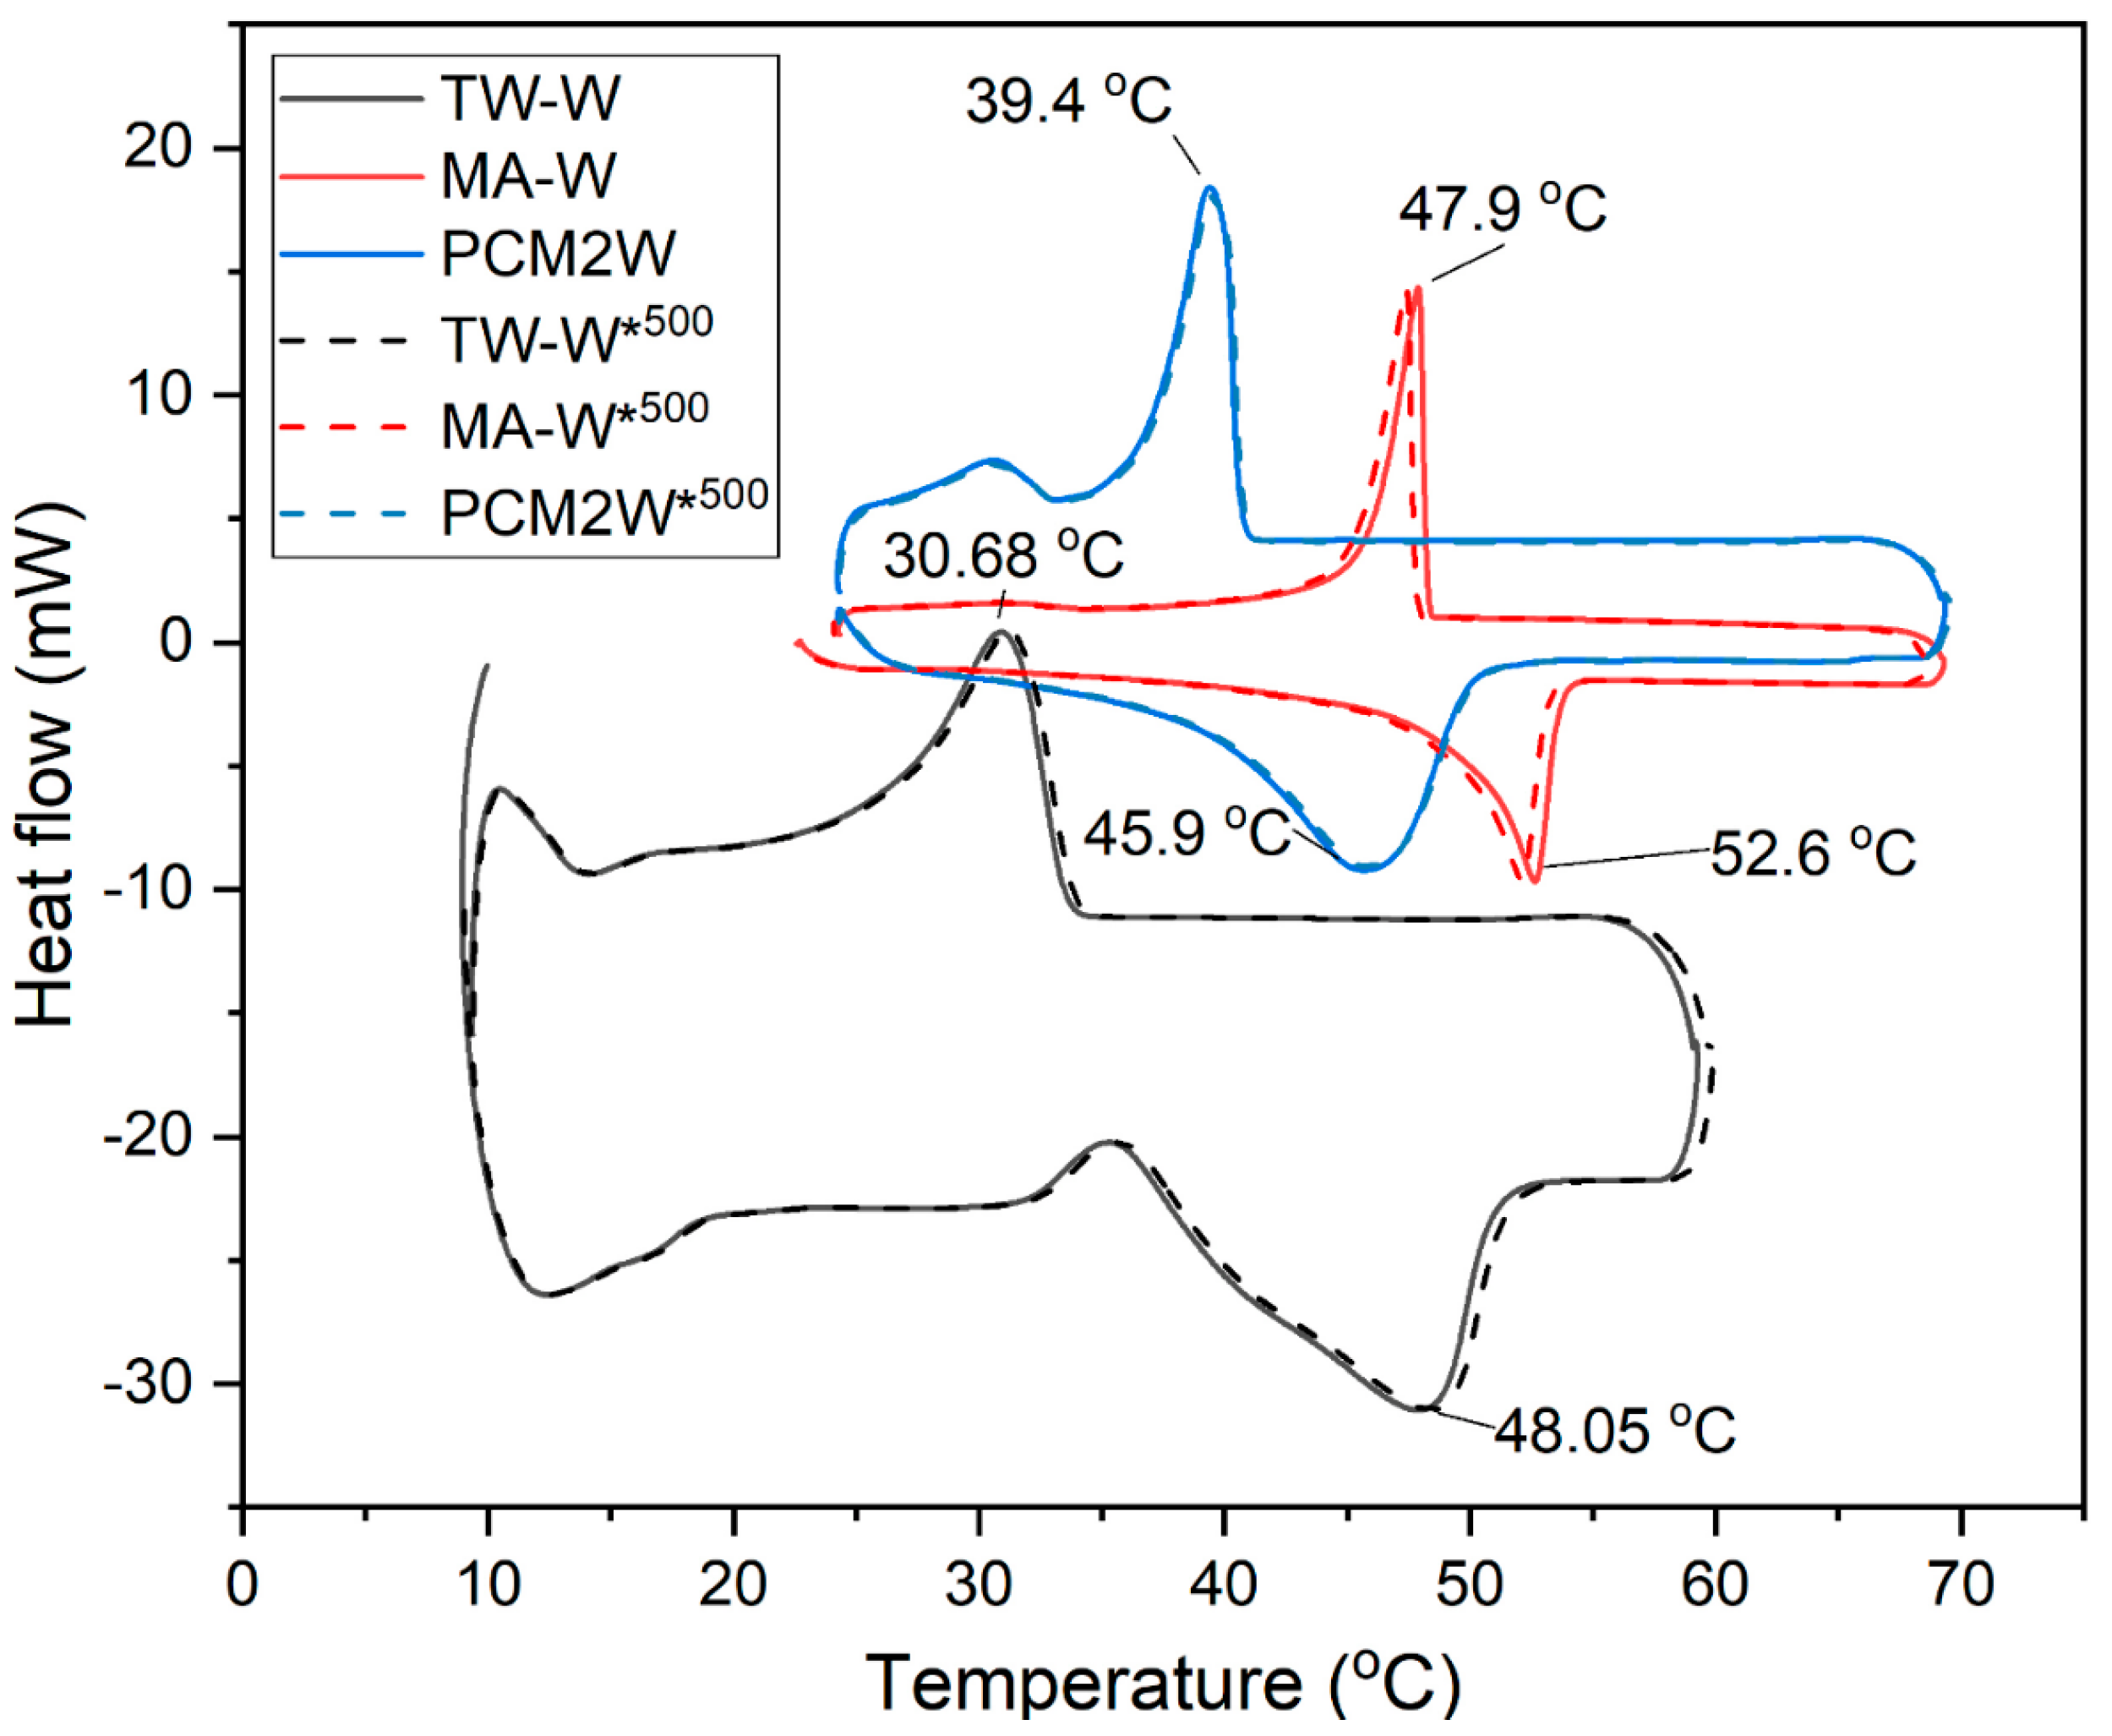
3.3. Thermal Properties of Wood/Bio-Based Composite

The DSC peaks of PCMs and the PCM-impregnated wood are seen in Figure 6 and Figure 7, respectively.
The DSC curves of TW, MA, TW/MA, and the mix of TW and MA (PCM2) are presented in Figure 6. The phase transition temperatures (TML) and enthalpies of the phase transition (ΔHML) for TW are 30.5 °C and 48.1 J/g, while for MA, these values are 53.5 °C and 221 J/g, respectively. Similarly, the crystallization temperatures (TSL) and enthalpies of solidification (ΔHSL) are 30.2 °C and 49.3 J/g for TW, and 49.2 °C and 221 J/g for MA. Notably, the DSC curve of TW exhibits two distinct peaks in its melting profile. For the TW/MA mixture (PCM2), the phase transition temperature and enthalpy are recorded as 50.53 °C and 172 J/g, respectively, whereas the crystallization temperature and enthalpy are 44.1 °C and 152 J/g. The DSC curve of PCM2 displays similarity to those of TW and MA but with a single peak, confirming that PCM2 is a homogeneous mixture of TW and MA. During crystallization, two peaks are visible, i.e., two different crystalline phases are formed. During melting, the melting peaks of the two components overlap, resulting in an increase in the peak width and a shoulder appearing on the lower temperature side, which corresponds to the second component. A decrease in the latent heat values of the impregnated wood samples was observed. When PCM was added to wood, a similar pattern was seen [28,37]. In their study of carbonized wood entirely impregnated with 1-tetradecanol as PCM, Yang et al. [37] found that the latent heat of fusion was lower than that of pure PCM due to the decrease in latent heat per mass. It was demonstrated that the latent heat of the PCM/wood composite is mostly dependent on the amount of PCM that is integrated into the composite by contrasting carbonized and non-carbonized wood as the supporting material. A lower latent heat of fusion than that of pure PCM was found in another work [28] using delignified wood as the substrate and a PCM retention of 65%.
In the assessment of BPCM-modified wood using DSC, temperatures ranging from 0 °C to 70 °C revealed endothermic peaks, as illustrated in Figure 7 and detailed in Table 3. The initial endothermic peak, identified at around 48.0 °C 52.6 °C, 45.9 °C (TML) for TW-W, MA-W and PCM2W, respectively, involved a heat absorption of 42.0 J/g, 75.2 J/g, and 73.7 J/g (ΔHML), respectively. Exothermic peaks were seen throughout the temperature drop from 70 °C to 0 °C, as seen in Figure 7 and summed up in Table 3. The thermal characteristics of PCMC are clarified by this thorough analysis, which offers insightful information to maximize its use in thermal energy storage systems and associated technologies. An exothermic peak was discovered during a more thorough DSC analysis of the BPCM-modified wood, providing important insights into the material’s thermal behavior. For TW-W, MA-W, and PCM2W, the first exothermic peak (TSL) was found at around 30.7 °C, 47.9 °C, and 39.4 °C, respectively (Figure 7). These peaks correspond to the latent heat of solidification (ΔHSL), which is 33.6 J/g for TW-W, 68.4 J/g for MA-W, and 71.4 J/g for PCM2W. This peak indicated the thermal release of heat during the transition of PCMC from a liquid to a solid state, marking the solidification process. Unlike the phase-change-related peak, another peak formation is observed at approximately 30 °C in the PCM2W sample; this exothermic event was attributed to the thermal release of tallow during the solid state without undergoing a phase change. A comparison of PCM2W’s DSC results with those in the literature is given in Table 4. PCM2W has a higher melting point and latent heat value than similar studies.
Figure 7 also displays the DSC thermograms of these samples following 500 cycles of melting and solidification. The results from these 500 cycles test show that there are no significant changes in the melting or solidification peaks of the composites. Specifically, the data reveal that after 500 cycles, the melting and solidification of enthalpy decreased slightly in the ranges of 0.20 to 0.46 J/g and 0.30 to 0.47 J/g, respectively, as observed in Table 3. A comparison of the thermal properties of the form-stable PCM2W with those of a composite PCM in the literature is shown in Table 4. These observations demonstrate that the composites exhibit excellent thermal stability, suggesting that the PCMs are well-integrated into the wood matrix and can undergo phase transitions during heating and cooling without an alteration in their thermal performance.

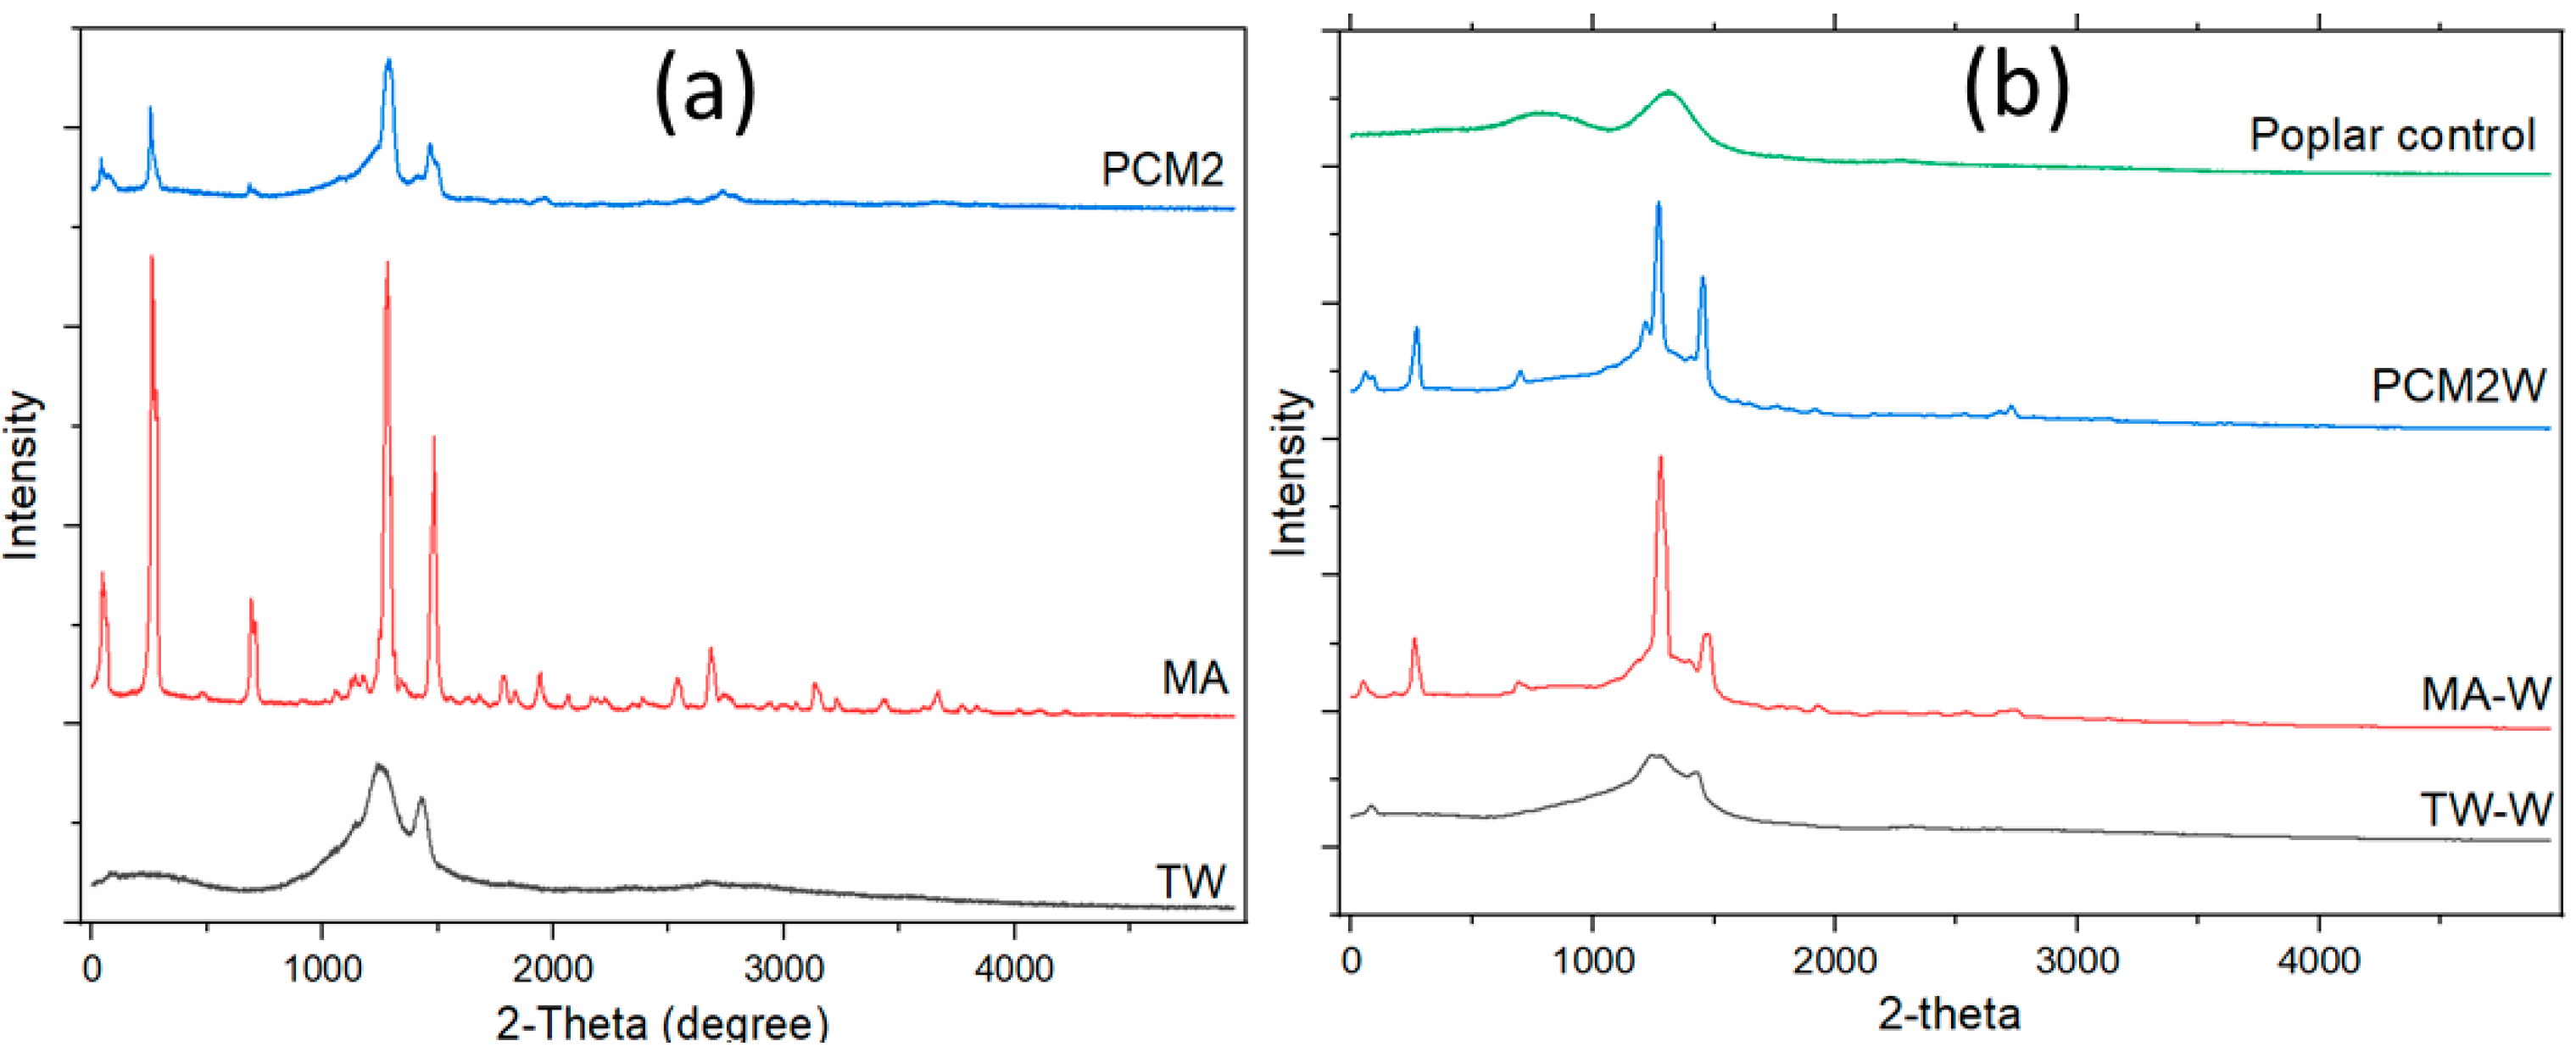
3.4. Crystal Structure Analysis (XRD) of Wood/Bio-Based Composite

The crystal morphology can be inferred from the specific peaks observed in the DSC analysis, which correspond to the phase transitions of the material. In particular, the melting or solidification peaks indicate the presence of ordered crystalline regions within the material. These peaks typically appear as sharp, well-defined transitions at specific temperatures, reflecting a highly ordered structure. In contrast, broad or weak peaks may suggest the presence of amorphous or less-ordered regions. By analyzing the sharpness, temperature, and area of these peaks, we can gain insights into the degree of crystallinity and the arrangement of the crystalline structure. According to the XRD analysis results, it was observed that tallow peaked only at 21° and 23° (Figure 8a), indicating that tallow has a certain crystal structure. On the other hand, myristic acid showed peaks at 5°, 8°, 14°, 21°, 24° and 40°, suggesting that myristic acid has a more complex crystal structure; the prominence of the peaks at 21° and 24° is especially remarkable. The XRD spectrum of PCM2 can be interpreted as the combination of peaks of tallow and myristic acid; this suggests that PCM2 originates from a mixture of tallow and myristic acid and combines the properties of these two compounds. In particular, the strong peaks of PCM2 at 21° and 24° suggest that this mixture has a certain TW/MA structure. These findings are important for understanding the crystal structural properties of the TW/MA mixture of tallow and myristic acid and optimizing it for use in energy storage applications.
The peaks at 15° and 22° of 2θ were identified as the diffraction peaks of the cellulose crystal planes of (1 0 1) and (0 0 2), respectively. Like the impregnation with PCMs, the diffraction intensity of the characteristic peaks and the crystalline degree is shown (Figure 8b). A few of the weaker peaks can be found at 6°, 20°, and 23° for TW-W and 14.0°, 30.5°, and 38.3° for MA-W. The two main peaks in Figure 8b are at 21.5° and 24.6° for PCM2W, corresponding to indices for the crystal face of (1 1 0) and (1 1 2), respectively. The MA and TW crystal features (Figure 8a) are reflected in the PCM2W samples. That is, the peak occurring at 21° and 23° comes from TW and 21° and 24° from MA.

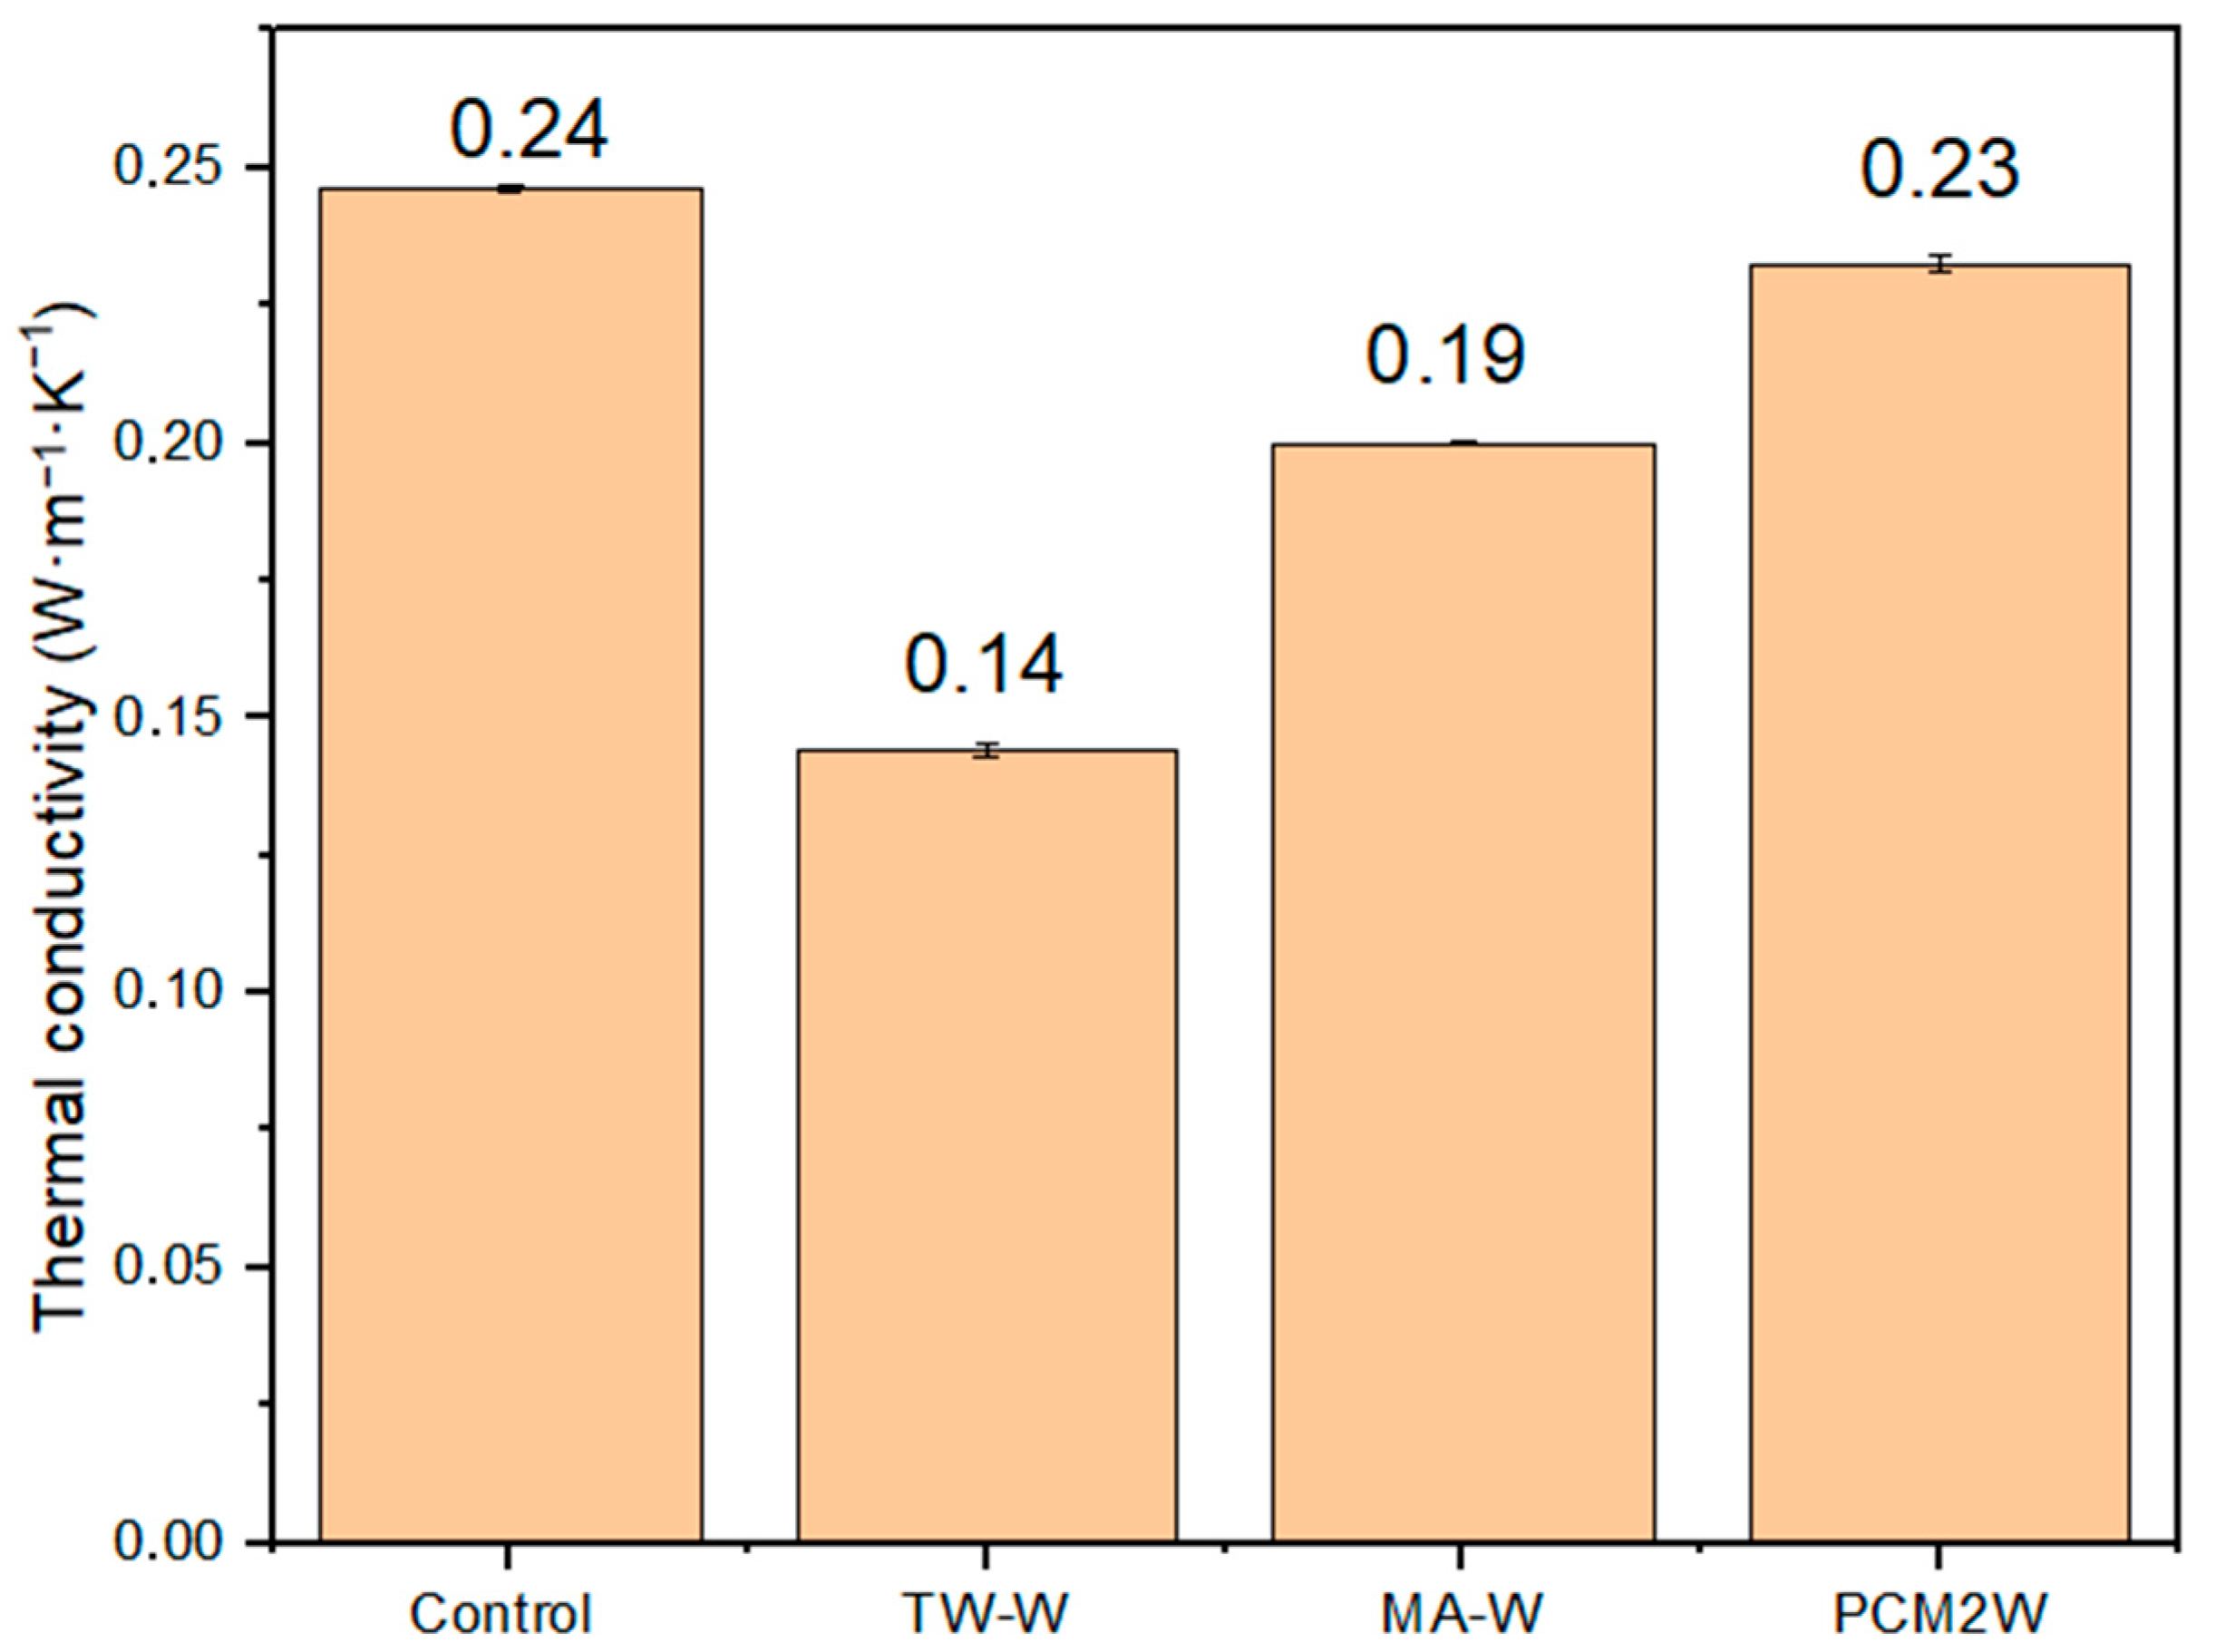
3.5. Thermal Conductivity of Wood/Bio-Based Composite

Thermal conductivity stands out as one of the most important factors in PCM selection. As mentioned before, PCMs or composite PCMs with low thermal conductivity can delay the response time of latent heat storage and release processes. Therefore, increasing the thermal conductivity is a critical element to be considered for the effective use of composite PCMs in various real-world applications. In this context, the findings regarding the thermal conductivity values of each component and composite PCM are presented in Figure 9. The thermal conductivities of the control group (poplar wood), TW-W, MA-W and PCM2W were measured as 0.24, 0.14, 0.19 and 0.23 W/mK, respectively. These results revealed that the thermal conductivity of PCM2W was approximately 1.71 times higher than that of TW-W and approximately 1.26 times higher than that of MA-W. In addition, the thermal conductivity values of the prepared PCM2W were compared with previously reported different wood-based composite PCMs (Table 5). After PCM impregnation, the thermal conductivity of PCM2W was measured as 0.23 W/mK, which was the same as that of pure wood. This is because MA with higher thermal conductivity creates a continuous heat transfer path by eliminating air gaps within the wood.

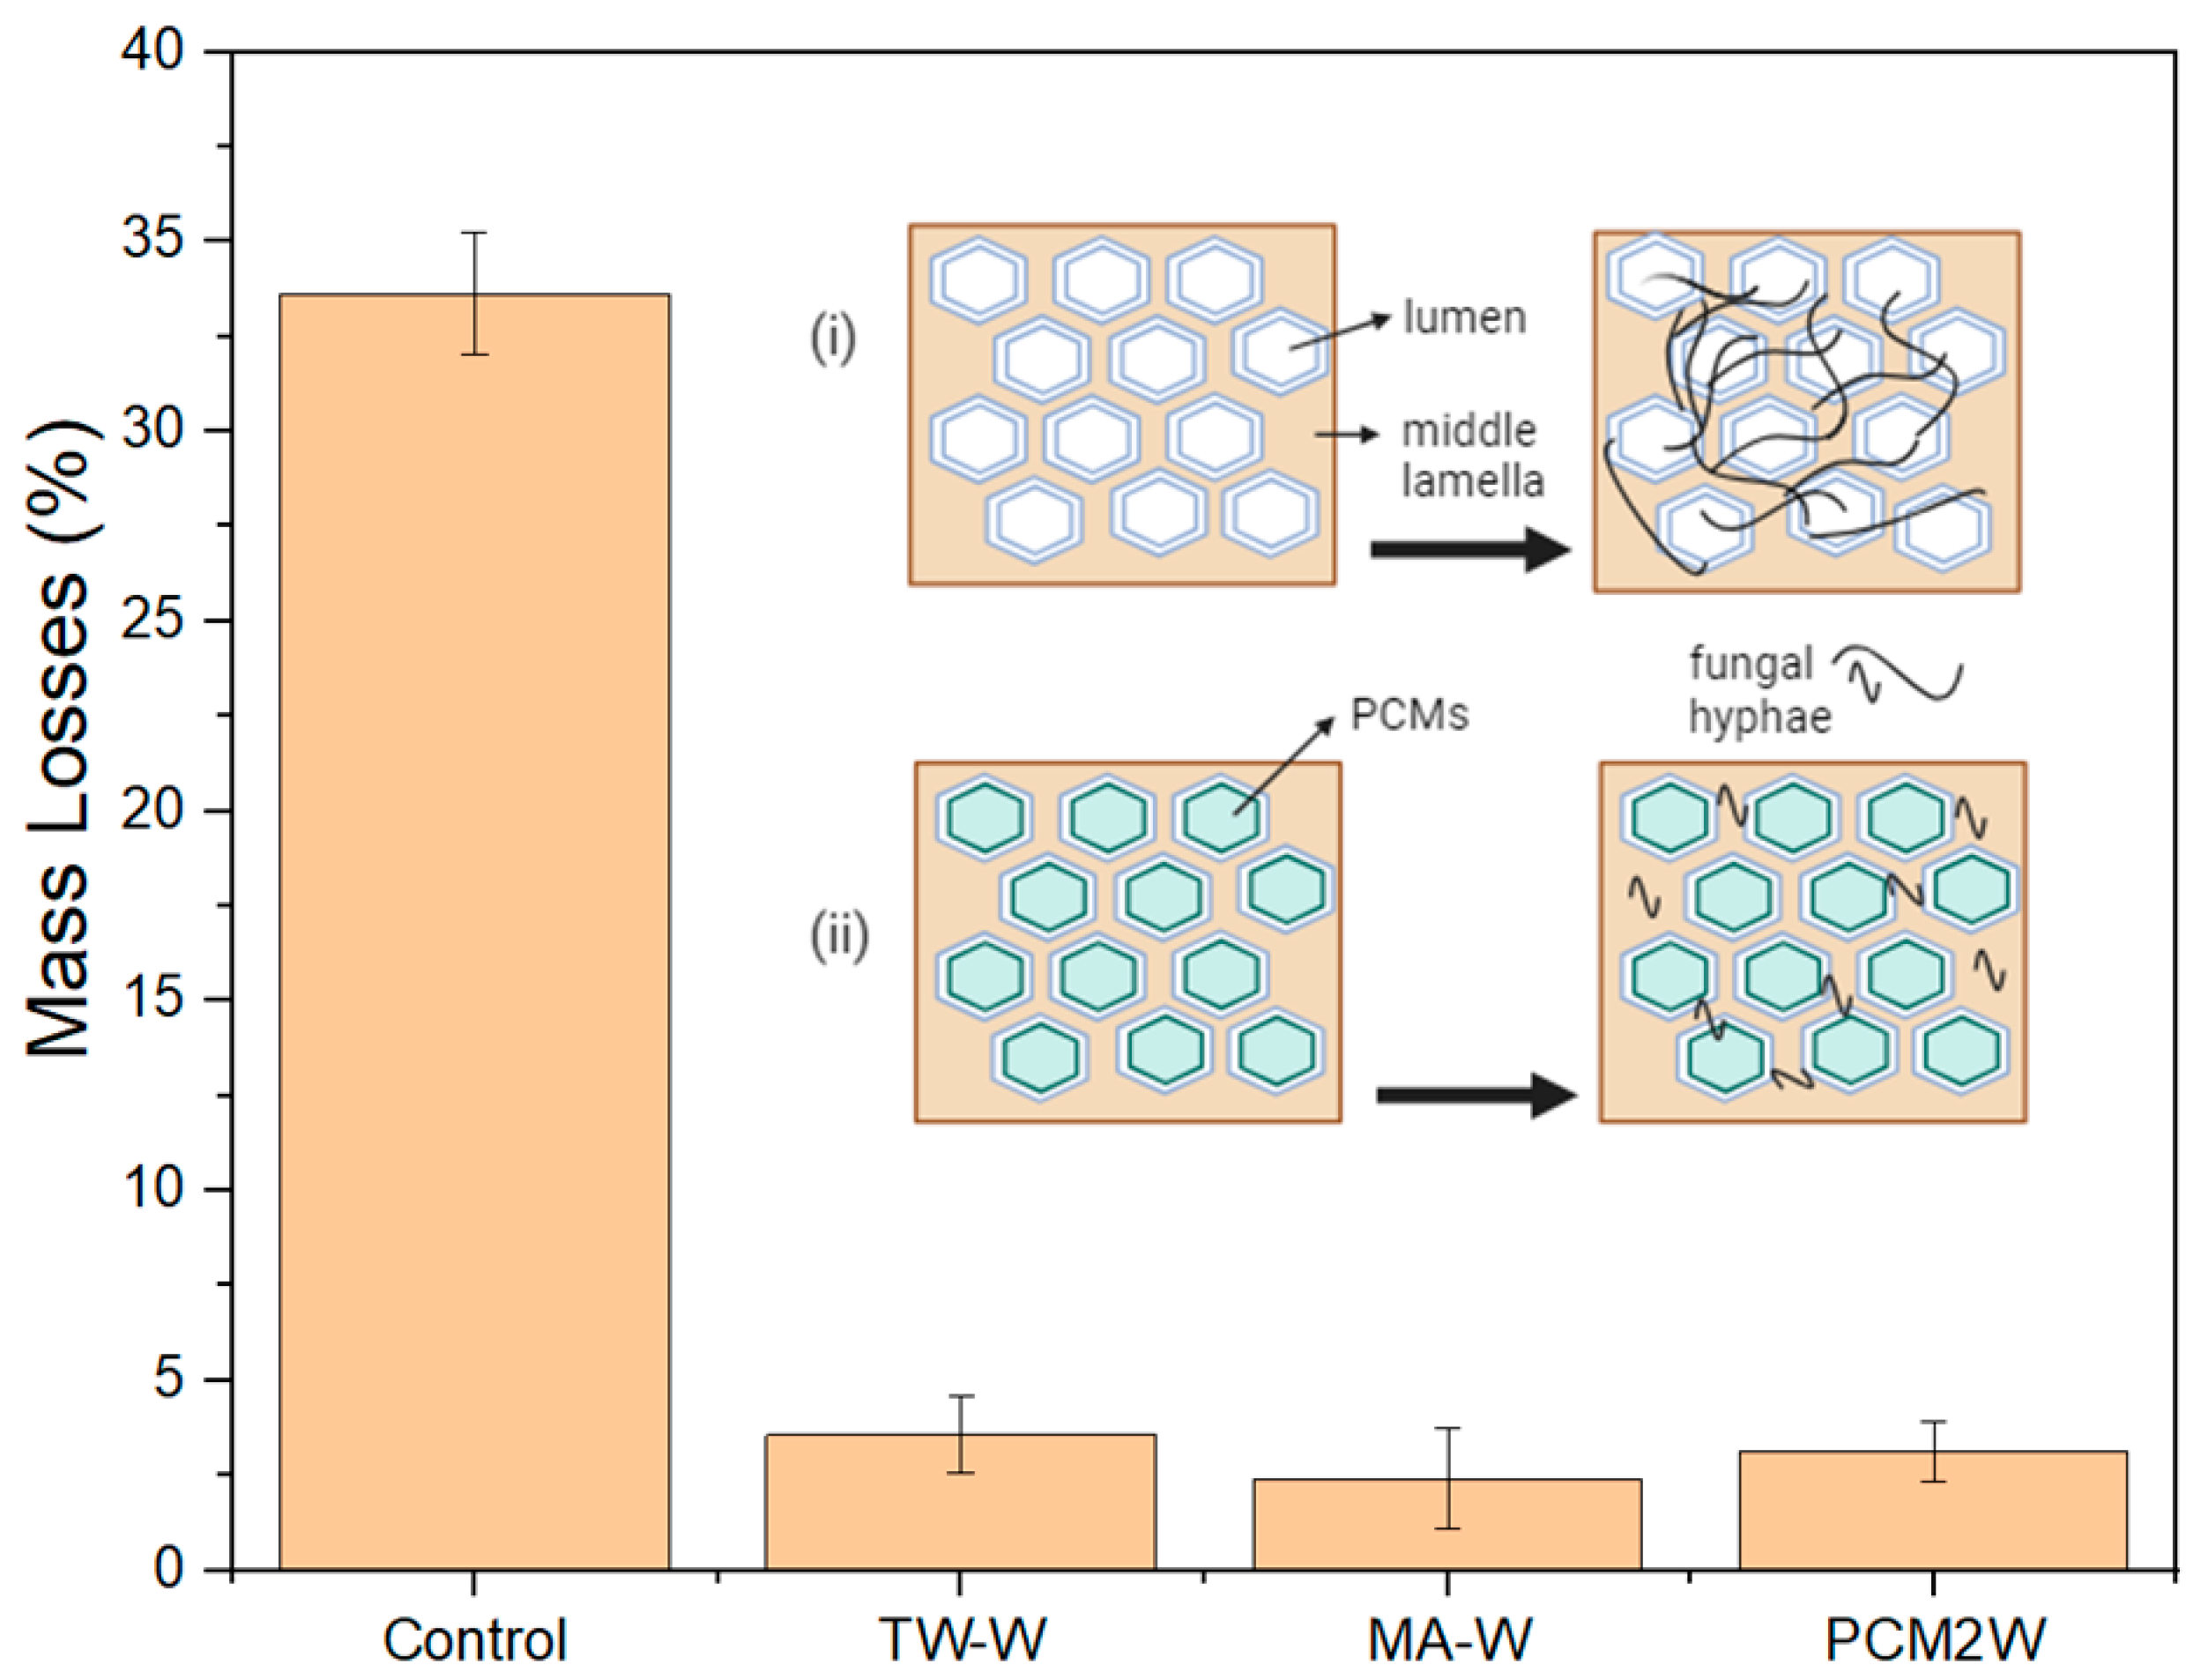
3.6. Decay Resistance of Wood/Bio-Based Composite

The greatest mass loss (33.62%) was seen when the untreated control sample was incubated for 8 weeks with the brown rot fungus Coniophora puteana (Mad-515). According to the decay test standard EN 113-2, 2020, the control samples’ minimum mass loss should not have been more than 20%. Consequently, these values matched the durability ratings for the “nondurable” class.
During the same time frame, TW-W, MA-W, and PCM2W had respective rates of 3.57%, 2.42%, and 3.12%. It was claimed that the CP fungus’s deterioration of the wood was the reason for the control samples’ more than 30% weight loss. This demonstrates the validity of the experiment and the provision of ideal growing conditions for the fungus. The failure to establish the conditions required for the fungus to live in the impregnated wood is the reason for the test samples’ modest weight loss. The impregnated wood samples are schematically represented in Figure 10(ii), which demonstrates how the water and oxygen content is decreased by packing the cell wall and lumens with PCMs, preventing the fungal hyphae from accessing adequate nutrients.

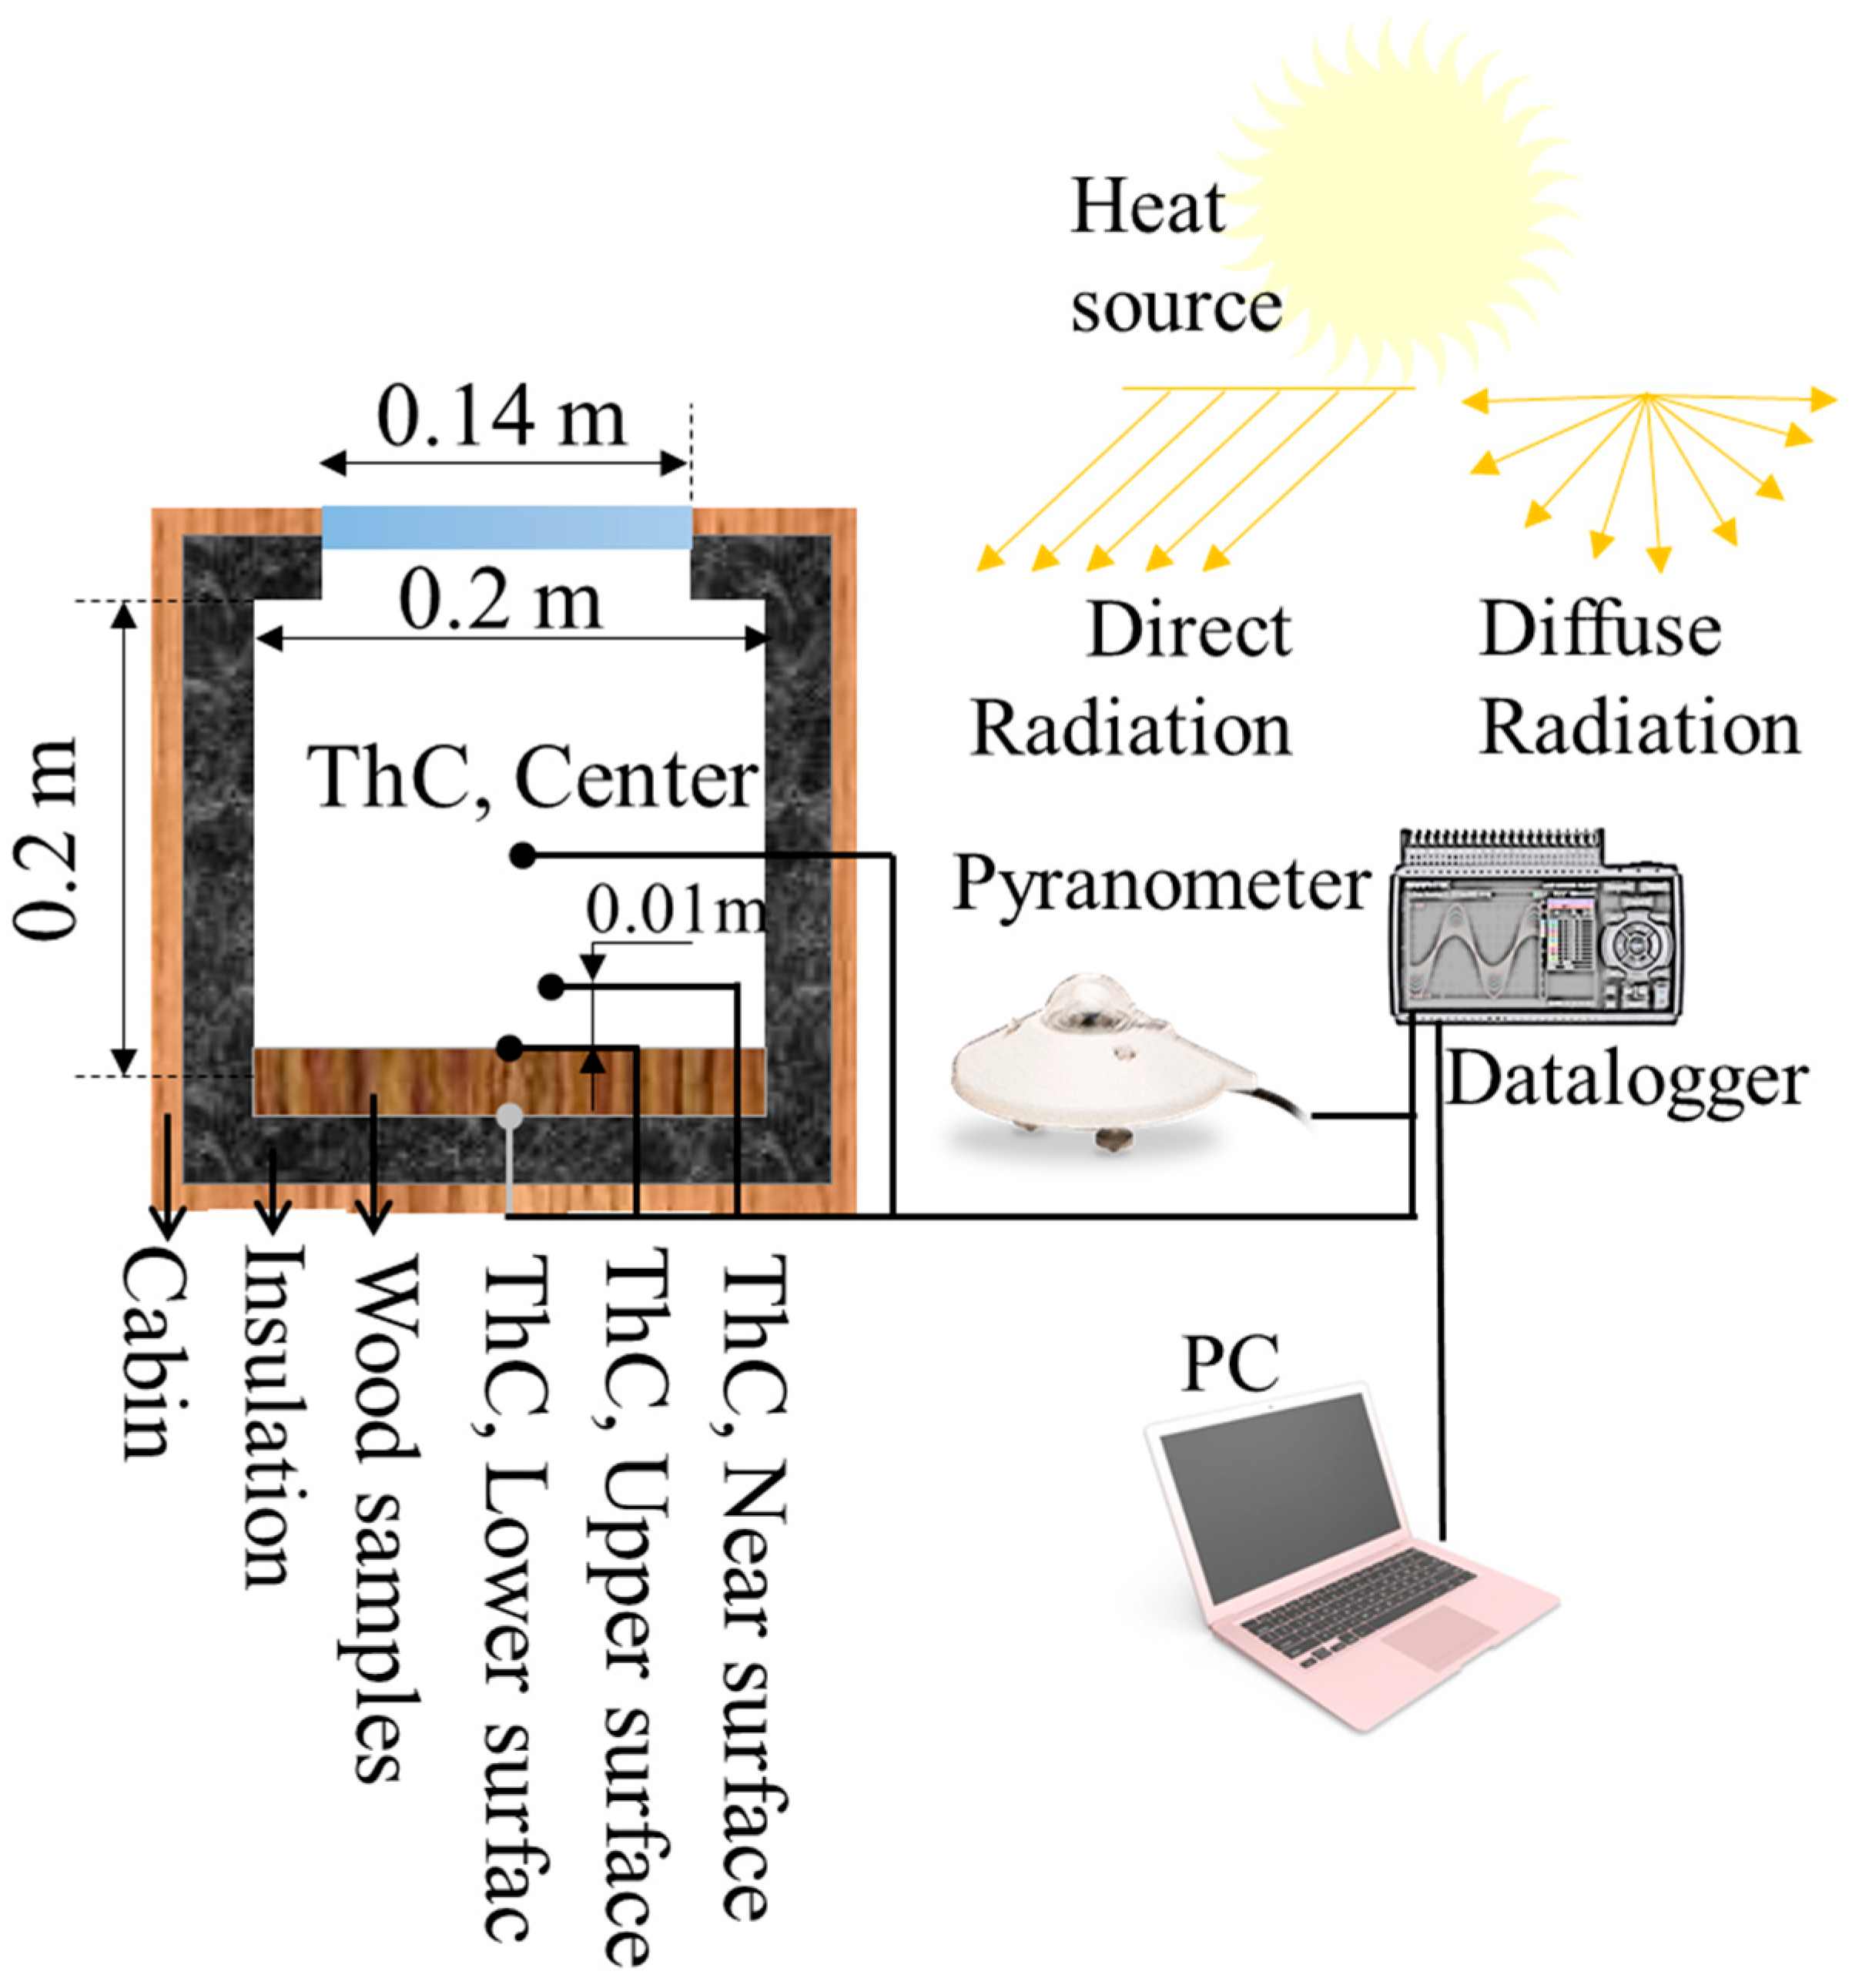
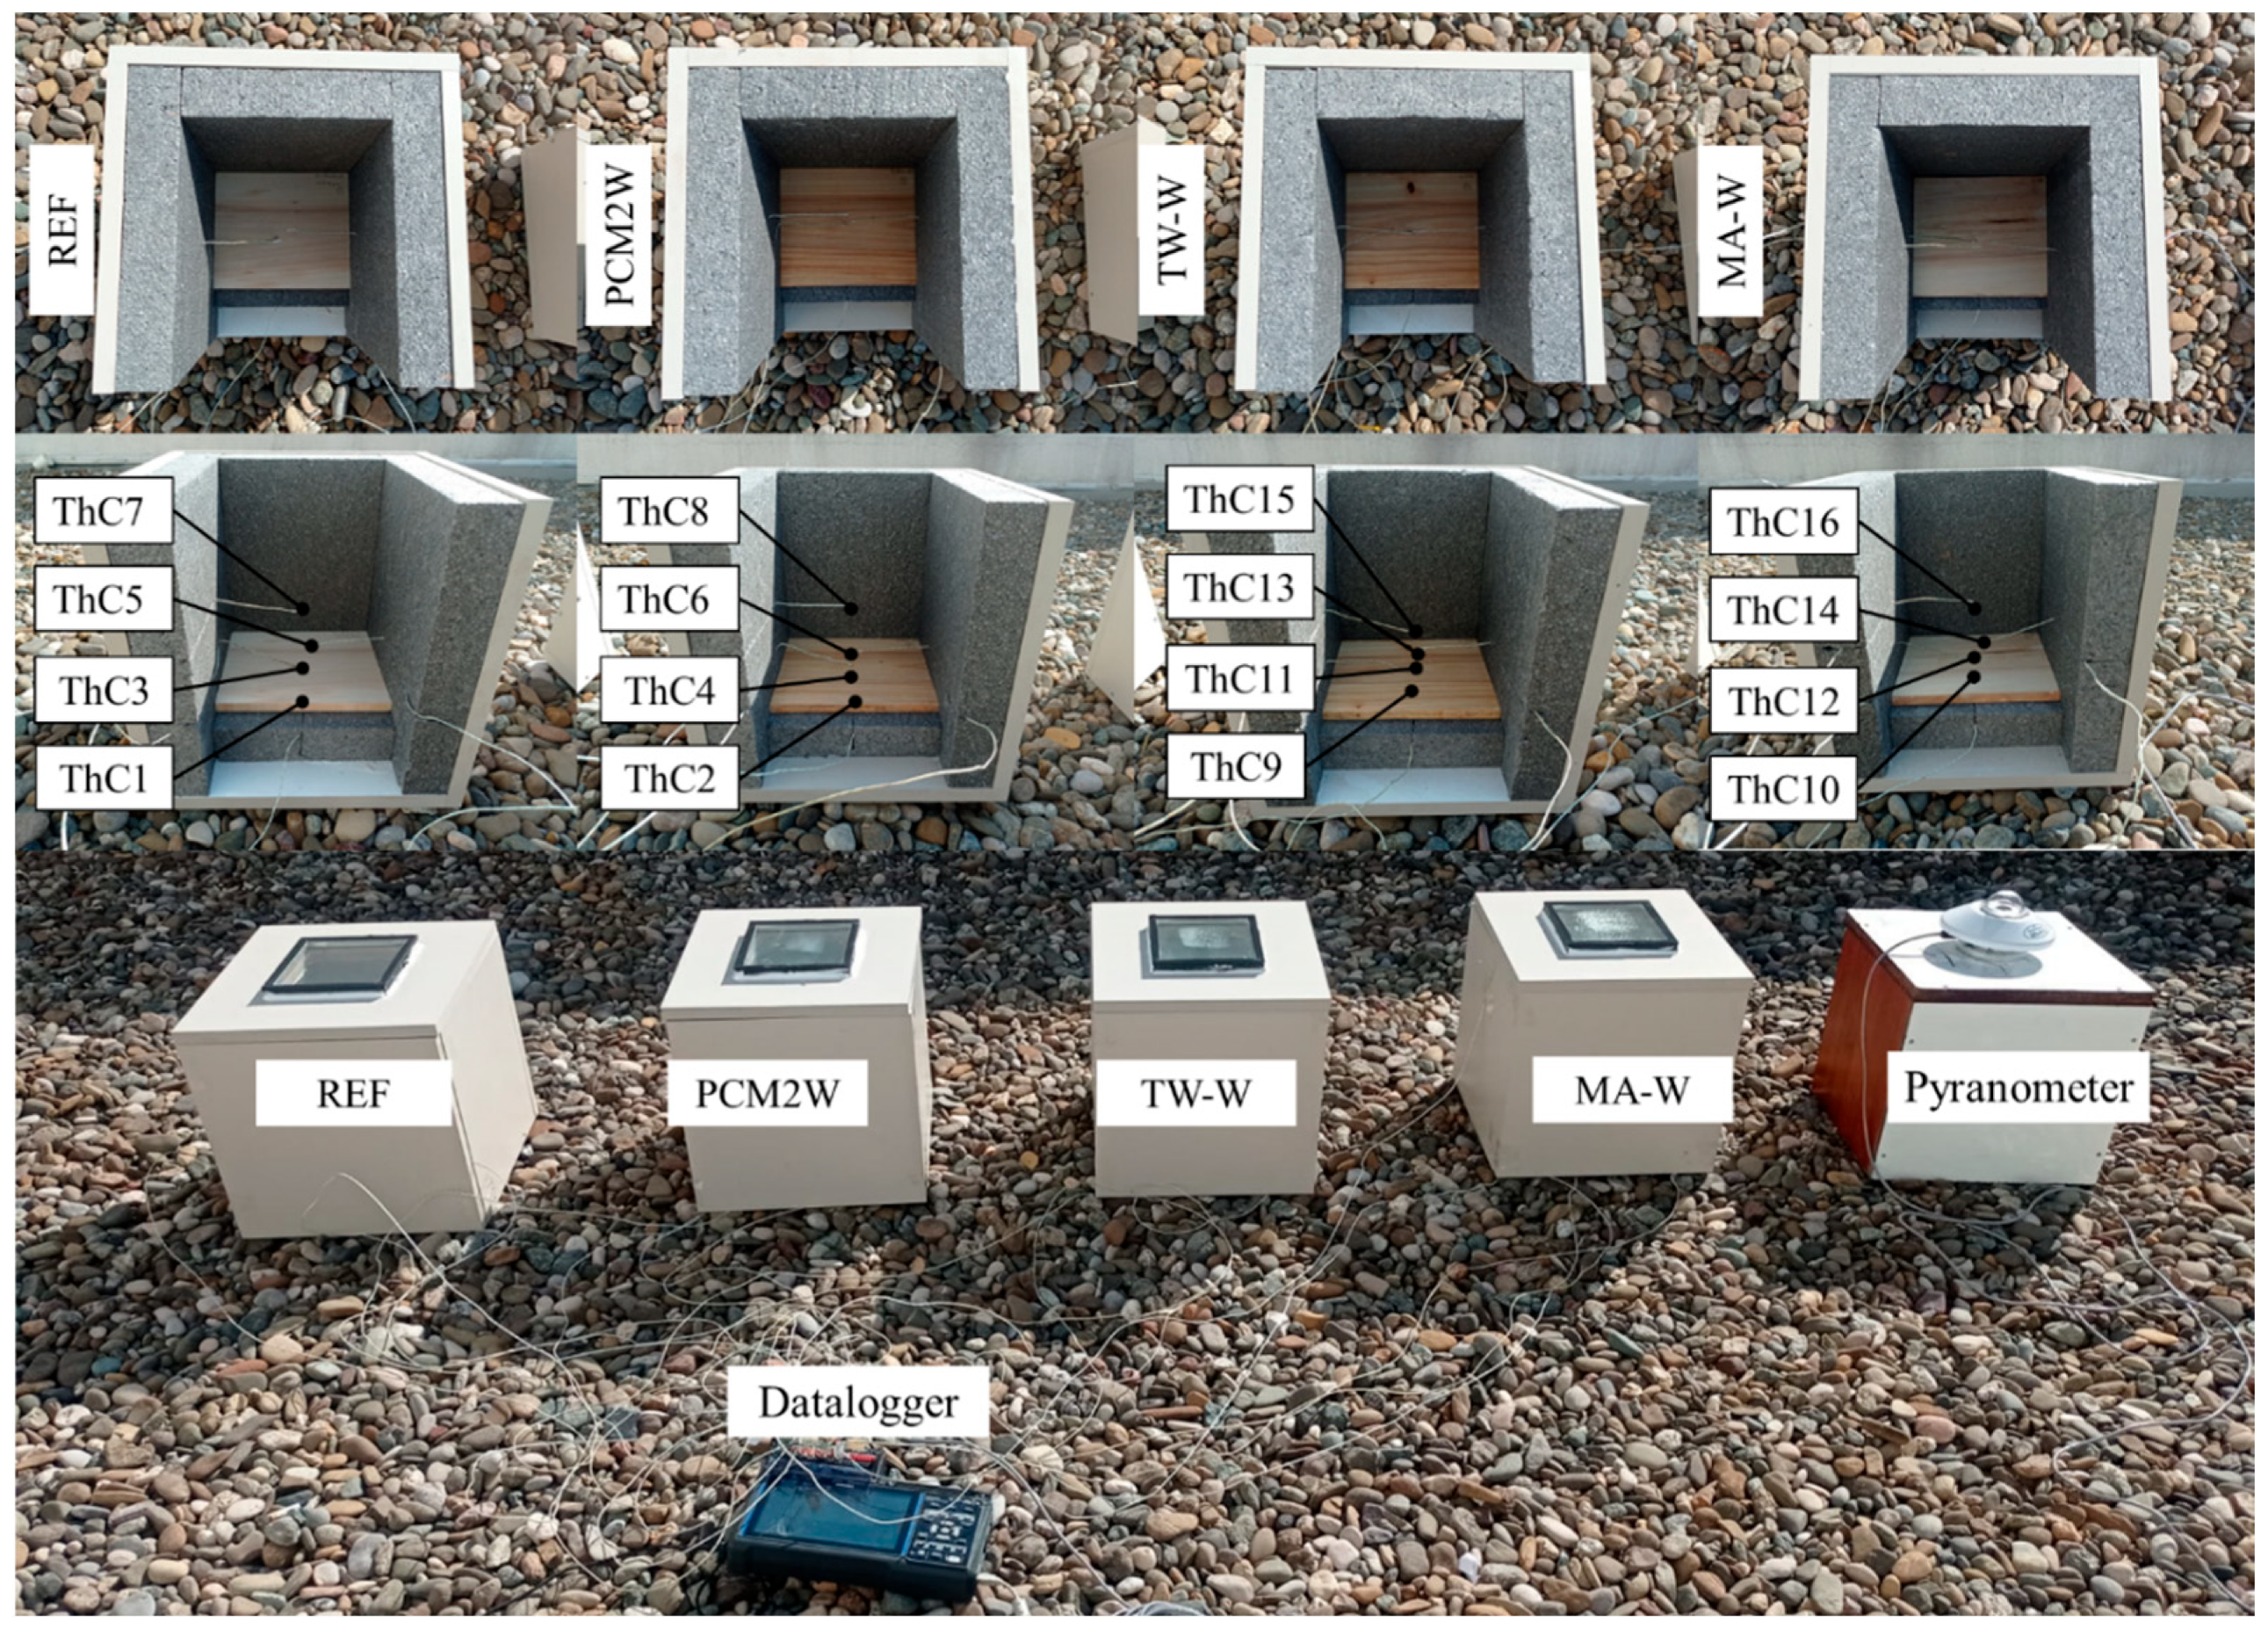
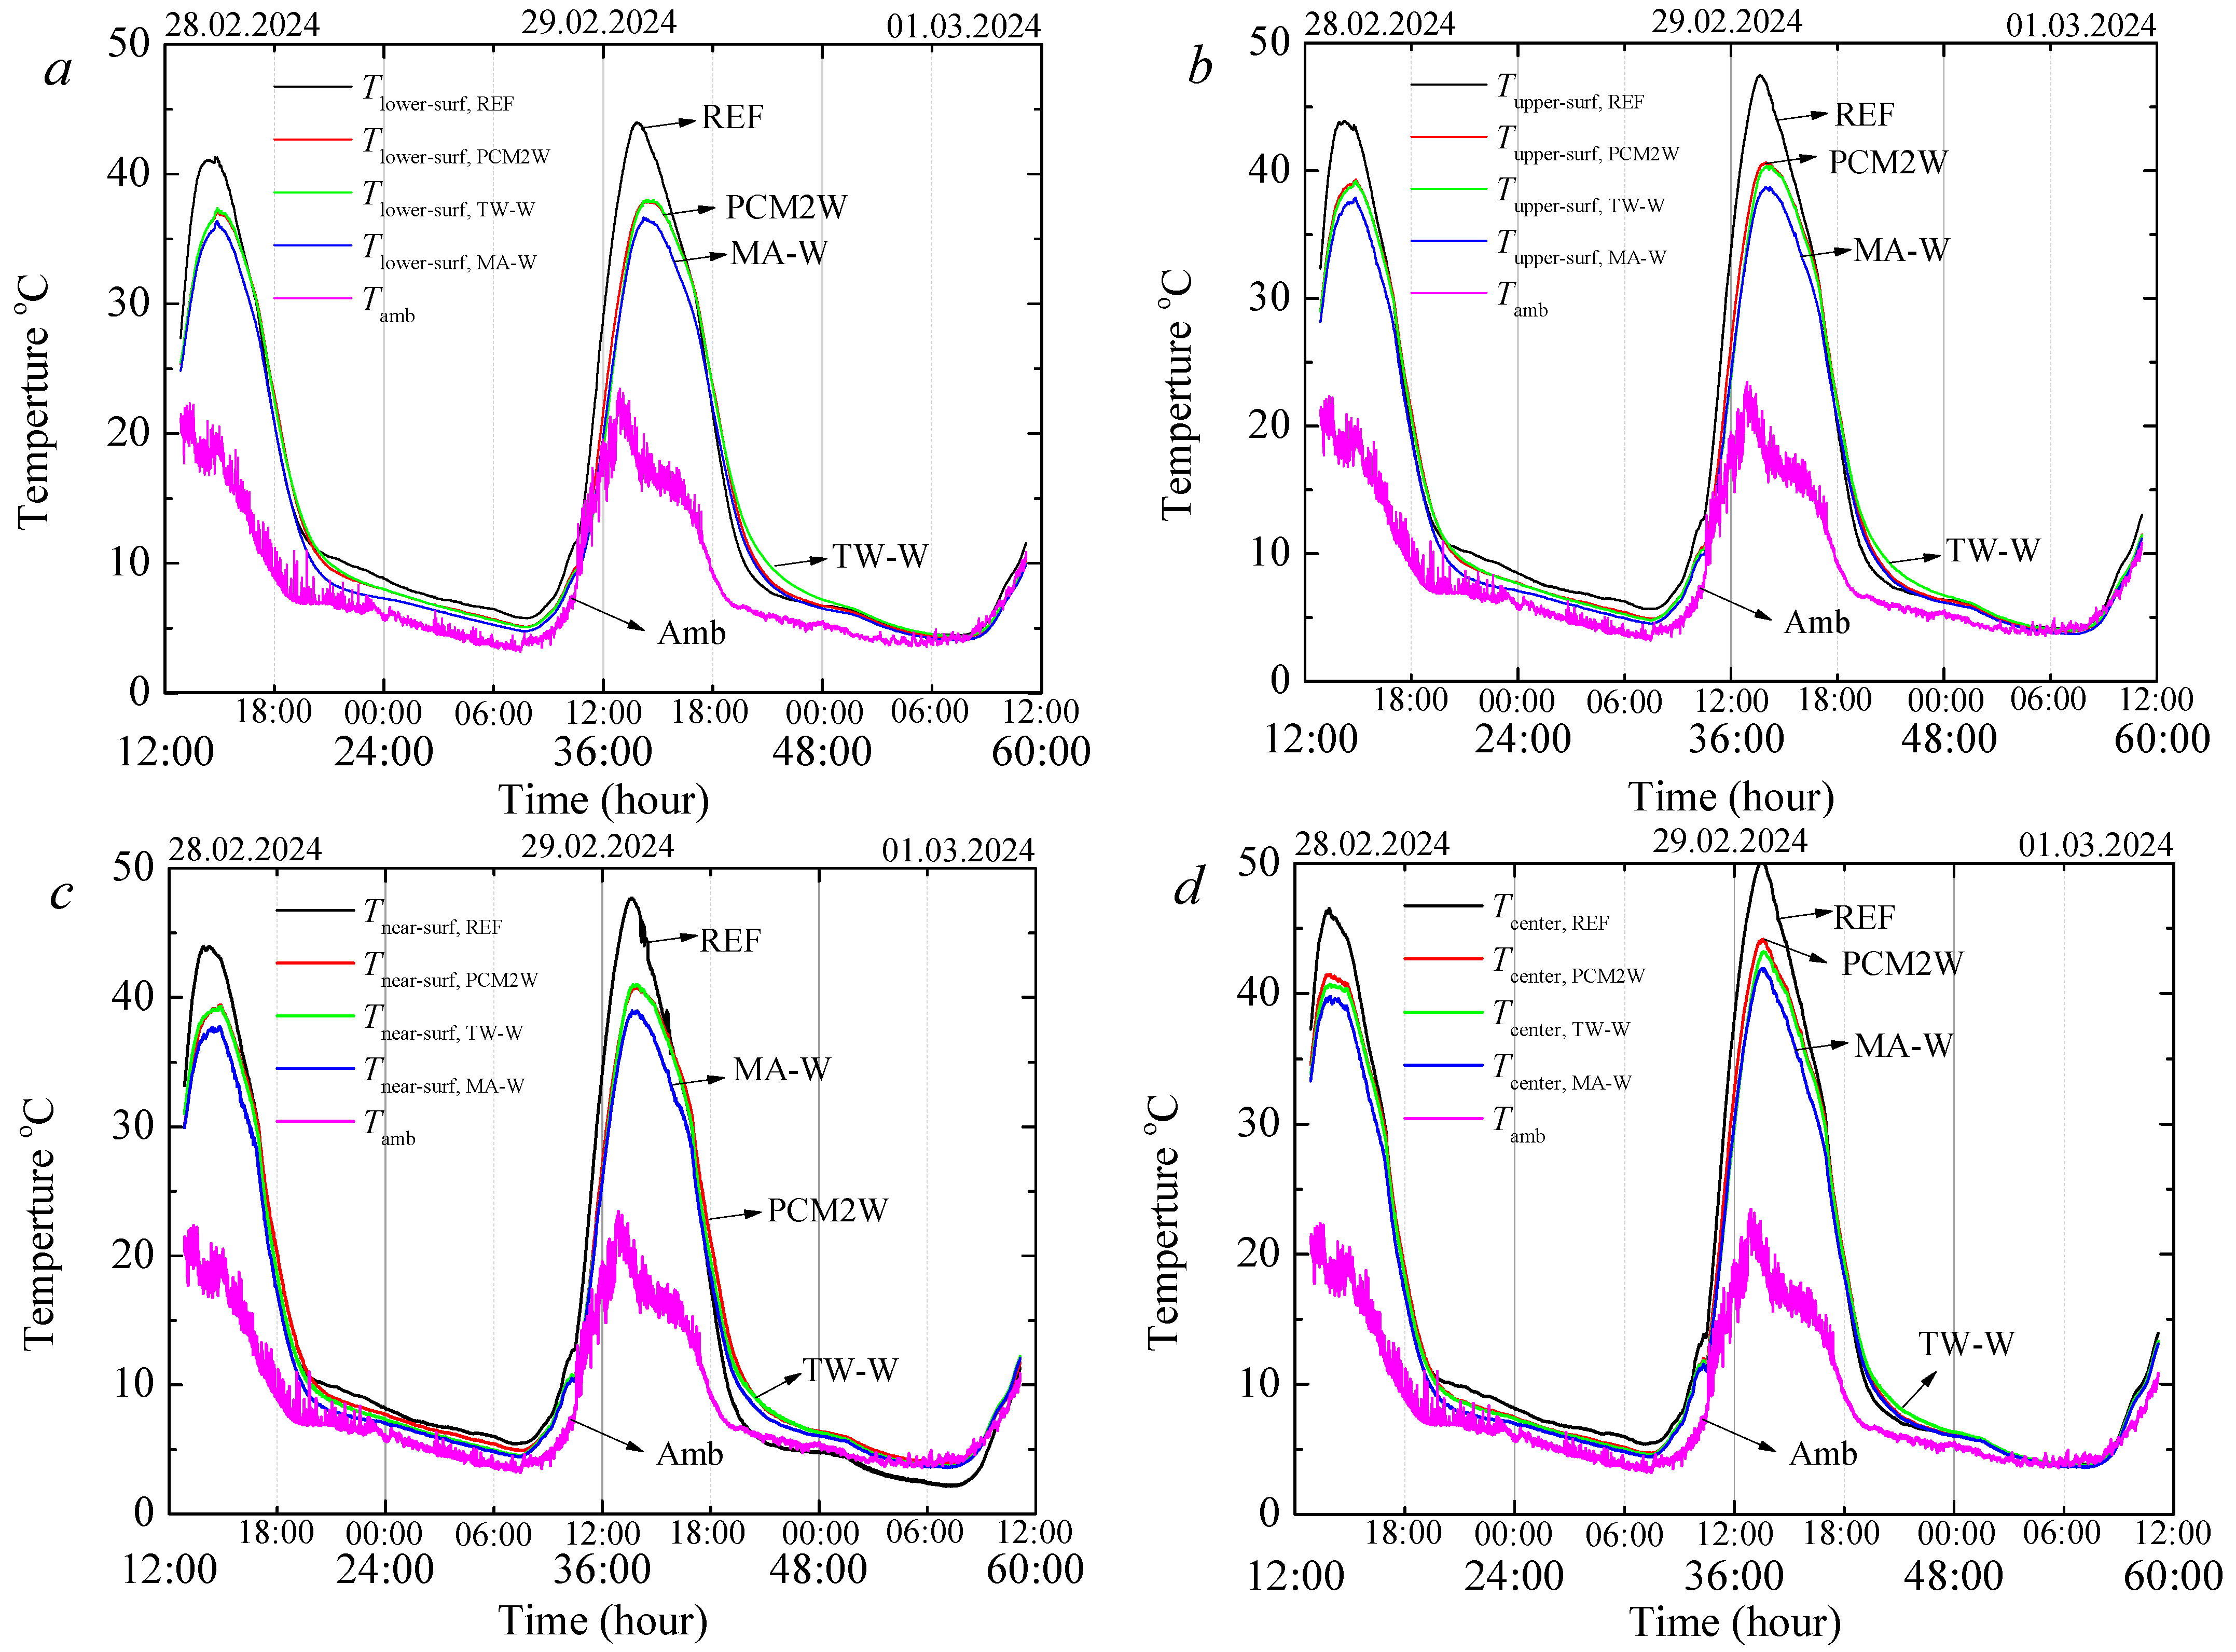
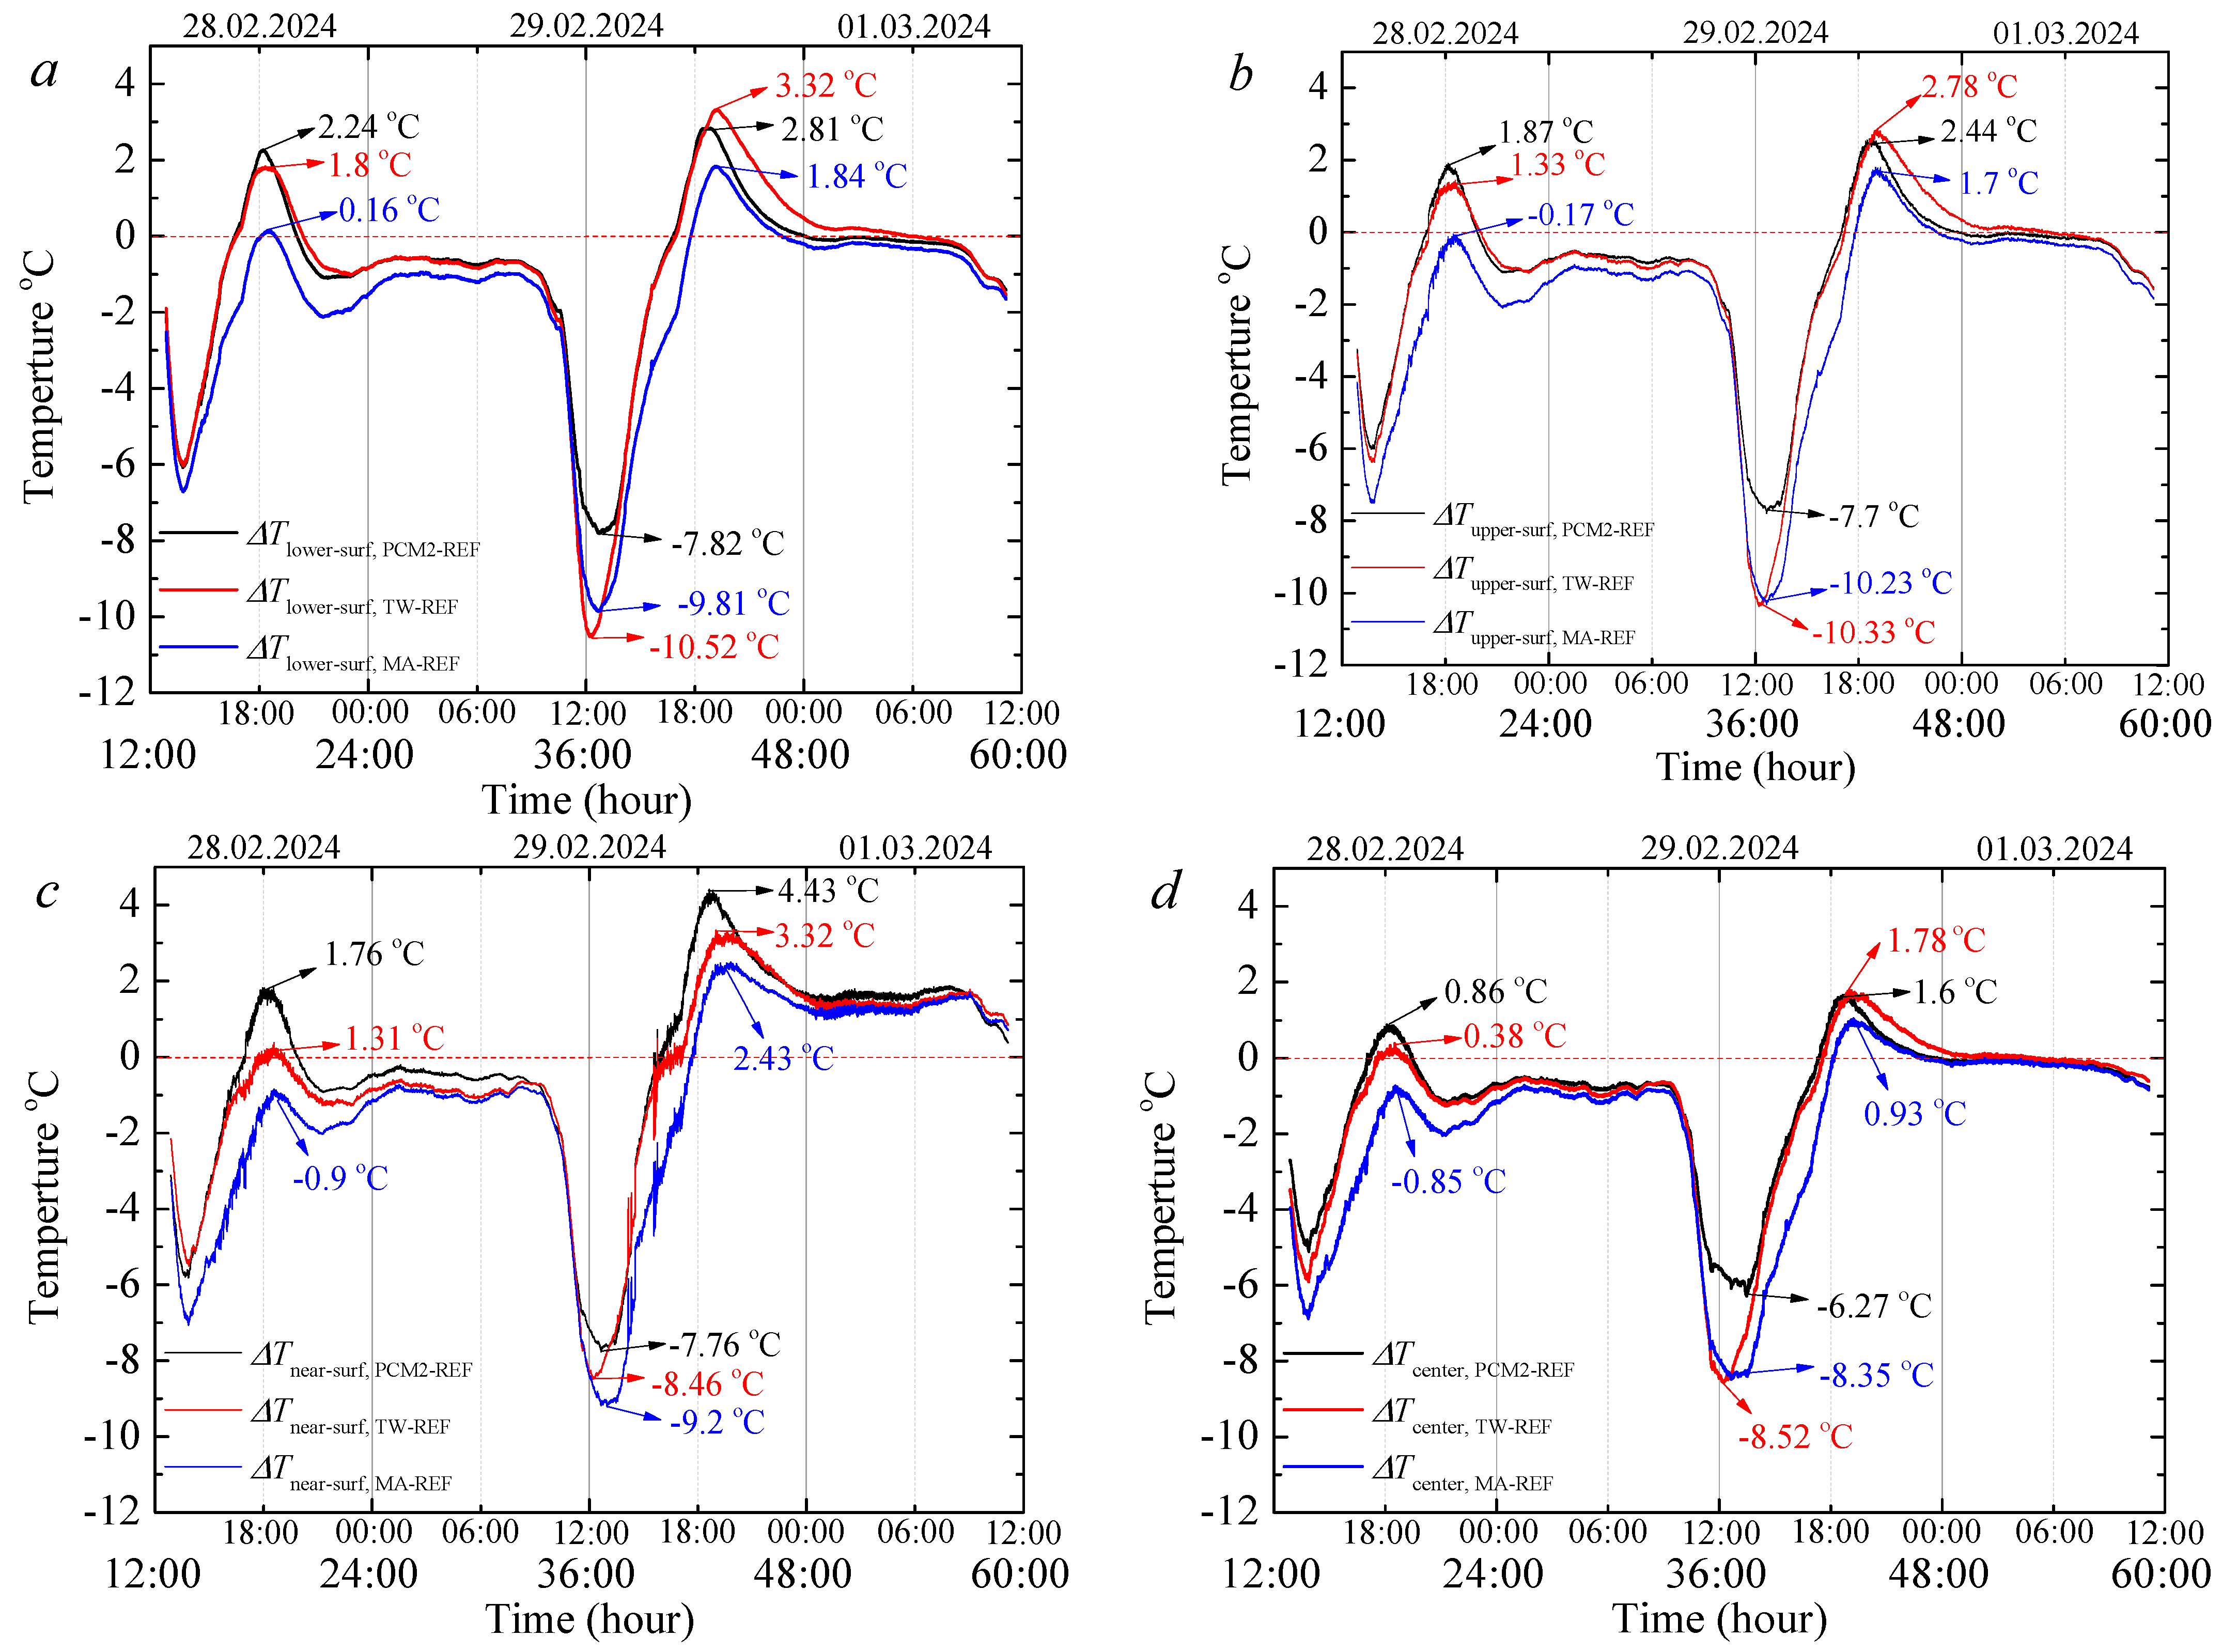
3.7. Thermal Regulation Performance Tests

The global, direct, and diffuse sun irradiation during the daytime experiments conducted is depicted in Figure 11. The weather was mostly sunny and partly cloudy when the experiment began. On the 28th and 29th of February, mainly sunny skies continued. Direct solar radiation peaked at 574 W/m2, while global radiation reached a maximum intensity of 665 W/m2 between 12:30 and 13:30 on the 29th. At midday, the direct radiation rate on the horizontal surface within the global radiation was around 86.3%. Cloudy weather and a clear sky were noted during the trial.
The temperatures of the samples’ bottom and top surfaces, the room center, and the near-surface temperature, which denotes a 0.01 m elevation above the surface, are displayed in Figure 12. The temperatures grew and reduced progressively due to a mostly clear sky for every measured point in the experiment. On the 29th of February, the highest recorded ambient temperature was 23.2 °C at 12:50. The indoor temperatures reached their peak in the afternoon at about 13:55. The largest temperatures were found in the room’s center and the lowest were on the lower surfaces. This is because some incoming solar energy is initially reflected on the top surface due to comparatively lower absorptivity. Moreover, the thermal conductivity is relatively lower compared to a common structure material such as concrete, brick, etc. Therefore, the temperature of the room center is elevated faster.
The energy is absorbed by wooden samples impregnated with PCM, which lowers the near-surface and upper-surface ambient temperature due to the phase-change process. As a result, the near-surface’s temperature dropped compared to the room’s center. The MA-W sample provided an 18.5% cooler lower surface at the peak temperature value of the reference sample (44 °C), while TW and PCM2W provided a 6.6 °C lower temperature. MA-W provided a 7.24 °C lower temperature at the room center compared to the reference case. This value becomes 14.4% and 12.06% for TW-W and PCM2W, respectively.
The temperature differential between the reference rooms and the test room with PCM is shown in Figure 13. Positive numbers show that the test room’s temperature with PCM-impregnated wood is greater, while negative values show that it is lower. In Figure 12a, the temperature difference between the reference and other cases for lower surfaces is displayed. Although MA-W performs better in the reference case’s peak temperature value, the TW-W provided a better performance before 12:56. Then, MA-W achieved an about 9.8 °C lower temperature. It is expected that the PCM-impregnated samples should provide a warmer temperature during cold ambient durations. When the cold weather hours were considered, TW-W provided an about 3.32 °C warmer lower surface temperature. Although the MA-T provided a cooler lower surface for a longer time, when the whole duration of the experiment is taken into consideration, TW-W may be preferable for the lower surface temperature investigation. In Figure 13b, the room center temperature differences are depicted. TW-W and MA-W show a similar performance during the hot temperature hours. However, in the cold hours, the TW-W provided an about 1.78 °C warmer temperature, while it reached 1.6 °C for the case of MA-W on the 29th of February. On the 28th of February, PCM2 performed better after sunset compared to the other cases. However, it stays behind the TW-W and MA-W cases. In conclusion, the overall performance of TW-W was significantly better compared to the other samples since it provided an about 8.5 °C cooler temperature in the high-temperature hours while it achieved an about 1.78 °C warmer temperature in the room’s center. Thus, it has a substantial advantage in decreasing the heating and cooling load of a building.

4. Conclusions

This study demonstrated that solid wood impregnated with bio-based phase-change materials (PCMs), such as myristic acid (MA) and tallow (TW), exhibits enhanced thermal energy management and storage capabilities. Differential scanning calorimetry (DSC) analysis confirmed the heat storage capacities and phase transformation temperatures of TW, MA, and their mixture (PCM2), with PCM2 showing a high heat absorption/release enthalpy of 172 J/g. Thermogravimetric analysis (TGA) provided insights into the thermal degradation behavior of PCMs and impregnated wood, revealing a three-stage degradation process for PCM2W. X-ray diffraction (XRD) analysis indicated the presence of crystalline peaks of both MA and TW in the PCM2W samples, confirming successful impregnation. Thermal conductivity measures showed that PCM2W exhibited values 1.64 times higher than the control wood and 1.21 times higher than MA-W.
The findings of this study support the potential use of PCM-impregnated wood as a sustainable material for energy-efficient construction applications. By integrating the complementary properties of organic PCMs and wood, the developed materials can contribute to passive heating and cooling strategies, such as Trombe wall systems, reducing energy consumption in buildings. Additionally, the improved resistance to fungal decay further enhances the material’s durability. These results highlight the feasibility of PCM-impregnated wood as a dual-purpose material for both thermal energy storage and structural applications, aligning with sustainable development goals and promoting the use of renewable resources in the construction industry.

Author Contributions

A.C.: Writing—original draft, Visualization, Methodology, Investigation, Conceptualization. O.G.: Writing-original draft, Visualization, Investigation. A.S.: Writing—review and editing, Methodology, Investigation, Funding acquisition, Conceptualization. G.H.: Investigation, Formal analysis. A.U.: Writing—original draft, Visualization, Investigation, Formal analysis. A.T.: Investigation, Formal analysis. E.E.: Investigation, Formal analysis Ö.N.E.: Investigation, Formal analysis. All authors have read and agreed to the published version of the manuscript.

Funding

This research received no external funding.

Data Availability Statement

The original contributions presented in this study are included in the article. Further inquiries can be directed to the corresponding author.

Conflicts of Interest

The authors declare no conflicts of interest.

Abbreviations

The following abbreviations are used in this manuscript:
TWTallow
MAMyristic acid
BPCMBio-based phase-change material
WPGThe weight percentage gain
FTIRFourier transform infrared spectroscopy
DSCDifferential scanning calorimetry
TW-WTallow impregnated wood
PCMsPhase-change materials
OPCMsOrganic phase-change materials
CACapric acid
PEGPolyethylene glycol
SAStearic acids
PCMWBio-based phase-change material impregnated wood
PCM1W30 TW + 70 MA
PCM2W50 TW + 50 MA
PCM3W70 TW + 30 MA
MiInitial mass
MfFinal mass
dDensity
mWeights
VValue
TGAThermogravimetric Analysis
XRDX-Ray diffraction analysis
W/m KWatt/meter kelvin degree
CCarbon
HHydrogen
OOxygen

References

  1. Ramage, M.H.; Burridge, H.; Busse-Wicher, M.; Fereday, G.; Reynolds, T.; Shah, D.U.; Wu, G.; Yu, L.; Fleming, P.; Densley-Tingley, D.; et al. The wood from the trees: The use of timber in construction. Renew. Sustain. Energy Rev. 2017, 68, 333–359. [Google Scholar] [CrossRef]
  2. Hepburn, C.; Adlen, E.; Beddington, J.; Carter, E.A.; Fuss, S.; MacDowell, N.; Minx, J.C.; Smith, P.; Williams, C.K.W. The technological and economic prospects for CO2 utilization and removal. Nature 2019, 575, 87–97. [Google Scholar] [CrossRef] [PubMed]
  3. Amiri, A.; Ottelin, J.; Sorvari, J.; Junnila, S. Cities as carbon sinks—Classification of wooden buildings. Environ. Res. Lett. 2020, 15, 094076. [Google Scholar] [CrossRef]
  4. Omer, M.A.; Noguchi, T. A conceptual framework for understanding the contribution of building materials in the achievement of sustainable development goals (SDGs). Sustain. Cities Soc. 2020, 52, 101869. [Google Scholar] [CrossRef]
  5. Toppinen, A.; Röhr, A.; Pätäri, S.; Lähtinen, K.; Toivonen, R. The future of wooden multistory construction in the forest bioeconomy—A Delphi study from Finland and Sweden. J. For. Econ. 2018, 31, 3–10. [Google Scholar] [CrossRef]
  6. Wen, B.; Musa, S.N.; Onn, C.C.; Ramesh, S.; Liang, L.; Wang, W.; Ma, K. The role and contribution of green buildings on sustainable development goals. Build. Environ. 2020, 185, 107091. [Google Scholar] [CrossRef]
  7. Falk, R.H. Wood as a sustainable building material. For. Prod. J. 2009, 59, 6–12. [Google Scholar]
  8. Tatsidjodoung, P.; Le Pierrès, N.; Luo, L. A review of potential materials for thermal energy storage in building applications. Renew. Sustain. Energy Rev. 2013, 18, 327–349. [Google Scholar] [CrossRef]
  9. Xie, N.; Huang, Z.; Luo, Z.; Gao, X.; Fang, Y.; Zhang, Z. Inorganic salt hydrate for thermal energy storage. Appl. Sci. 2017, 7, 1317. [Google Scholar] [CrossRef]
  10. Sharma, A.; Tyagi, V.; Chen, C.; Buddhi, D. Review on thermal energy storage with phase change materials and applications. Renew. Sustain. Energy Rev. 2009, 13, 318–345. [Google Scholar] [CrossRef]
  11. Guo, Z.; Zhang, H.; Li, J.; Leng, J.; Zhang, Y.; Chang, T. An intrinsic energy conversion mechanism via telescopic extension and retraction of concentric carbon nanotubes. Nanoscale 2018, 10, 4897–4903. [Google Scholar] [CrossRef] [PubMed]
  12. Souayfane, F.; Fardoun, F.; Biwole, P.H. Phase change materials (PCM) for cooling applications in buildings: A review. Energy Build. 2016, 129, 396–431. [Google Scholar] [CrossRef]
  13. Agyenim, F.; Hewitt, N.J.; Eames, P.; Smyth, M. A review of materials, heat transfer and phase change problem formulation for latent heat thermal energy storage systems (LHTESS). Renew. Sustain. Energy Rev. 2010, 14, 615–628. [Google Scholar] [CrossRef]
  14. Baetens, R.; Jelle, B.; Gustavsen, A. Phase change materials for building applications: A state-of-the-art review. Energy Build. 2010, 42, 1361–1368. [Google Scholar] [CrossRef]
  15. Sarier, N.; Onder, E. Organic phase change materials and their textile applications: An overview. Thermochim. Acta 2012, 540, 7–60. [Google Scholar] [CrossRef]
  16. Jeong, S.G.; Chung, O.; Yu, S.; Kim, S.; Kim, S. Improvement of the thermal properties of bio-based PCM using exfoliated graphite nanoplatelets. Sol. Energy Mater. Sol. Cells 2013, 117, 87–92. [Google Scholar] [CrossRef]
  17. Yu, S.; Jeong, S.G.; Chung, O.; Kim, S. Bio-based PCM/carbon nanomaterials composites with enhanced thermal conductivity. Sol. Energy Mater. Sol. Cells 2014, 120, 549–554. [Google Scholar] [CrossRef]
  18. Jeong, S.G.; Lee, J.H.; Seo, J.; Kim, S. Thermal performance evaluation of bio-based shape stabilized PCM with boron nitride for energy saving. Int. J. Heat Mass Transf. 2014, 71, 245–250. [Google Scholar] [CrossRef]
  19. Li, J.; Xue, P.; Ding, W.; Han, J.; Sun, G. Micro-encapsulated paraffin/high-density polyethylene/wood flour composite as form-stable phase change material for thermal energy storage. Sol. Energy Mater. Sol. Cells 2009, 93, 1761–1767. [Google Scholar] [CrossRef]
  20. Ma, L.; Wang, Q.; Li, L. Delignified wood/capric acid-palmitic acid mixture stable-form phase change material for thermal storage. Sol. Energy Mater. Sol. Cells 2019, 194, 215–221. [Google Scholar] [CrossRef]
  21. Jiang, L.; Liu, Z.; Yuan, Y.; Wang, Y.; Lei, J.; Zhou, C. Fabrication and characterization of fatty acid/wood-flour composites as novel form-stable phase change materials for thermal energy storage. Energy Build. 2018, 171, 88–99. [Google Scholar]
  22. Zhang, H.; Zhang, L.; Li, Q.; Huang, C.; Guo, H.; Xiong, L.; Chen, X. Preparation and characterization of methyl palmitate/palygorskite composite phase change material for thermal energy storage in buildings. Constr. Build. Mater. 2019, 226, 212–219. [Google Scholar] [CrossRef]
  23. Wen, R.; Huang, Z.; Huang, Y.; Zhang, X.; Min, X.; Fang, M.; Liu, Y.; Wu, X. Synthesis and characterization of lauric acid/expanded vermiculite as form-stabilized thermal energy storage materials. Energy Build. 2016, 116, 677–683. [Google Scholar] [CrossRef]
  24. Jeong, S.G.; Jeon, J.; Lee, J.H.; Kim, S. Optimal preparation of PCM/diatomite composites for enhancing thermal properties. Int. J. Heat Mass Transf. 2013, 62, 711–717. [Google Scholar] [CrossRef]
  25. Yang, H.; Wang, Y.; Liu, Z.; Liang, D.; Liu, F.; Zhang, W.; Di, X.; Wang, C.; Ho, S.H.; Chen, W.H. Enhanced thermal conductivity of waste sawdust-based composite phase change materials with expanded graphite for thermal energy storage. Bioresour. Bioprocess. 2017, 4, 1–12. [Google Scholar] [CrossRef]
  26. Ma, L.; Guo, C.; Ou, R.; Sun, L.; Wang, Q.; Li, L. Preparation and characterization of modified porous wood flour/lauric-myristic acid eutectic mixture as a form-stable phase change material. Energy Fuels 2018, 32, 5453–5461. [Google Scholar] [CrossRef]
  27. Yang, H.; Wang, Y.; Yu, Q.; Cao, G.; Yang, R.; Ke, J.; Di, X.; Liu, F.; Zhang, W.; Wang, C. Composite phase change materials with good reversible thermochromic ability in delignified wood substrate for thermal energy storage. Appl. Energy 2018, 212, 455–464. [Google Scholar] [CrossRef]
  28. Can, A.; Žigon, J. n-Heptadecane-Impregnated Wood as a Potential Material for Energy-Saving Buildings. Forests 2022, 13, 2137. [Google Scholar] [CrossRef]
  29. Can, A. Preparation, characterization, and thermal properties of microencapsulated palmitic acid with ethyl cellulose shell as phase change material impregnated wood. J. Energy Storage 2023, 66, 107382. [Google Scholar] [CrossRef]
  30. Hartig, J.U.; Haller, P. Combustion characteristics and mechanical properties of wood impregnated with a paraffinic phase change material. Eur. J. Wood Wood Prod. 2024, 82, 329–339. [Google Scholar] [CrossRef]
  31. Dong, Y.; Yan, Y.; Wang, K.; Li, J.; Zhang, S.; Xia, C.; Shi, S.Q.; Cai, L. Improvement of water resistance, dimensional stability, and mechanical properties of poplar wood by rosin impregnation. Eur. J. Wood Wood Prod. 2016, 74, 177–184. [Google Scholar] [CrossRef]
  32. Zhu, Y.; Wang, W.; Cao, J. Improvement of hydrophobicity and dimensional stability of thermally modified southern pine wood pretreated with oleic acid. BioResources 2014, 9, 2431–2445. [Google Scholar] [CrossRef]
  33. Tang, Y.J.; Su, D.; Huang, X.; Alva, G.; Liu, L.K.; Fang, G.Y. Synthesis and thermal properties of the MA/HDPE composites with nano–additives as form–stable PCM with improved thermal conductivity. Appl. Energy 2016, 180, 116–129. [Google Scholar] [CrossRef]
  34. Alva, G.; Huang, X.; Liu, L.K.; Fang, G.Y. Synthesis and characterization of microencapsulated myristic acid–palmitic acid eutectic mixture as phase change material for thermal energy storage. Appl. Energy 2017, 203, 677–685. [Google Scholar] [CrossRef]
  35. Lin, Y.; Zhu, C.; Alva, G.; Fang, G. Microencapsulation and thermal properties of myristic acid with ethyl cellulose shell for thermal energy storage. Appl. Energy 2018, 231, 494–501. [Google Scholar] [CrossRef]
  36. Grzybek, J.; Paschová, Z.; Meffert, P.; Petutschnigg, A.; Schnabel, T. Impregnation of Norway spruce with low melting-point binary fatty acid as a phase-change material. Wood Mater. Sci. Eng. 2023, 18, 1755–1764. [Google Scholar] [CrossRef]
  37. Yang, H.; Wang, Y.; Yu, Q.; Cao, G.; Sun, X.; Yang, R.; Zhang, Q.; Liu, F.; Di, X.; Li, J.; et al. Low-cost, three-dimension, high thermal conductivity, carbonized wood-based composite phase change materials for thermal energy storage. Energy 2018, 159, 929–936. [Google Scholar] [CrossRef]
  38. Can, A.; Ergun, M.E.; Özlüsoylu, İ. Properties of oak wood incorporating microencapsulated phase change material. BioResources 2023, 18, 6068. [Google Scholar] [CrossRef]
  39. Nazari, M.; Jebrane, M.; Terziev, N. New hybrid bio-composite based on epoxidized linseed oil and wood particles hosting ethyl palmitate for energy storage in buildings. Energy 2023, 278, 127692. [Google Scholar] [CrossRef]
  40. Can, A.; Lee, S.H.; Antov, P.; Abd Ghani, M.A. Phase-change-material-impregnated wood for potential energy-saving building materials. Forests 2023, 14, 514. [Google Scholar] [CrossRef]
  41. Fabiani, C.; Pisello, A.L.; Barbanera, M.; Cabeza, L.F.; Cotana, F. Assessing the potentiality of animal fat based-bio phase change materials (PCM) for building applications: An innovative multipurpose thermal investigation. Energies 2019, 12, 1111. [Google Scholar] [CrossRef]
  42. Yang, Z.; Deng, Y.; Li, J. Preparation of porous carbonized woods impregnated with lauric acid as shape-stable composite phase change materials. Appl. Therm. Eng. 2019, 150, 967–976. [Google Scholar] [CrossRef]
  43. Lin, X.; Chen, X.; Weng, L.; Hu, D.; Qiu, C.; Liu, P.; Zhang, Y.; Sun, W.; Guo, X. In-situ copper ion reduction and micro encapsulation of wood-based composite PCM with effective anisotropic thermal conductivity and energy storage. Sol. Energy Mater. Sol. Cells 2022, 242, 111762. [Google Scholar] [CrossRef]
  44. Nazari, M.; Jebrane, M.; Gao, J.; Terziev, N. Thermal performance and mold discoloration of thermally modified wood containing bio-based phase change material for heat storage. Energy Storage 2022, 4, e340. [Google Scholar] [CrossRef]
  45. Schilling, M.; Farine, S.; Péros, J.P.; Bertsch, C.; Gelhaye, E. Wood degradation in grapevine diseases. In Advances in Botanical Research; Academic Press: London, UK, 2021; Volume 99, pp. 175–207. [Google Scholar]
Figure 1. Schematic diagram of test cabin.
Forests 16 00763 g001
Figure 2. Experimental setup and thermocouple positions.
Forests 16 00763 g002
Figure 3. Leakage test results for impregnated wood samples.
Forests 16 00763 g003
Figure 4. FT-IR spectra of PCMs.
Forests 16 00763 g004
Figure 5. FT-IR spectra of wood/bio-based composite.
Forests 16 00763 g005
Figure 6. The DSC curves of TW, MA and PCM2.
Forests 16 00763 g006
Figure 7. The DSC curves and 500th cycles of the melting–solidification thermograms of the wood/bio-based composite.
Forests 16 00763 g007
Figure 8. XRD analysis of PCMs, poplar wood, and PCM-impregnated wood: (a) Crystallization of PCMs, (b) Crystallization of Poplar Wood, MA-W, TW-W, and PCM2W.
Forests 16 00763 g008
Figure 9. Thermal conductivity of control and PCM-impregnated wood.
Forests 16 00763 g009
Figure 10. The mass losses (%) of samples exposed to the decay test, (i) control wood and (ii) PCM-impregnated wood.
Forests 16 00763 g010
Figure 11. Global, direct and diffuse solar radiation measurement in the real ambient conditions (28 February 2024–1 March 2024).
Forests 16 00763 g011
Figure 12. Temperature of the lower-surface (a), upper-surface (b), near-surface (c) and room center (d) in the experimental room with the reference, PCM2W, TW-W and MA-W samples (28 February 2024–1 March 2024). The ‘Amb’ curve represents the overall ambient temperature in the experimental chamber. It was used for comparison to evaluate the effect of samples with and without PCM.
Forests 16 00763 g012
Figure 13. Temperature difference between PCM2W, TW-W, MA-W and reference samples for lower-surface (a), upper-surface (b), near-surface (c) and room center (d) cases (28 February 2024–1 March 2024).
Forests 16 00763 g013
Table 1. WPG (%) and density (g/cm3) of the control and PCM-treated wood.
AbbreviationsWPG (%)Density (Kg/m3)
ControlControl-400 ± 120
TW 100%TW-W62.2 ± 3.74980 ± 195
MA 100% MA-W71.1 ± 1.52980 ± 64
30 TW + 70 MAPCM1W107.3 ± 5.971000 ± 364
50 TW + 50 MAPCM2W85.3 ± 1.64990 ± 126
70 TW + 30 MAPCM3W112.0 ± 2.45980 ± 100
Table 2. Leakage rates occurring in PCM-impregnated wood samples at 70 °C for different periods of time (%).
Initial Weight70 °C
10 min
70 °C
20 min
70 °C
30 min
TW-W2.10.01.90.5
MA-W2.20.01.93.3
PCM2W2.20.02.71.9
Table 3. The temperature and latent heat of the TW, MA, TW/MA mixtures (PCM2), and PCM-impregnated wood.
(Endothermic)
0 °C → 70 °C
(Exothermic)
70 °C → 0 °C
TML (°C)ΔHML (J/g)TSL (°C)ΔHSL (J/g)
TW48.169.230.240.1
MA53.5221.049.3221.0
PCM250.5172.044.1152.0
TW-W48.142.030.733.6
TW-W*50048.141.830.733.3
MA-W52.675.247.968.4
MA-W 1 50052.574.947.668.0
PCM2W45.973.739.471.4
PCM2W*50045.973.239.470.9
1 500 indicates after 500 melting–solidification cycles.
Table 4. Comparison of thermal properties of the form-stable PCM2W with that of a composite PCM in the literature.
Composite PCMMelting Point (°C)Solidification Point (°C)Latent Heat (J/g)Reference
10% CA/wood27.625.349.7[38]
ethyl palmitate/wood~19~25.045.0[39]
MicroPCM/wood23.218.03.0[40]
Paraffin/wood26.625.130.3[41]
Animal fat25.023.123.2[42]
TW-W48.030.742.0Present study
PCM2W45.939.473.7Present study
Table 5. The thermal conductivities of the PCM2W were compared with the different wood-based composite PCMs.
Wood SourcesPCMThermal Conductivity (W/mK)Reference
WoodLauric acid0.23[37]
Poplar wood1-Tetradecanol0.67[43]
Thermally modified beechCoFA (coconut oil fatty acids) and LA (linoleic acid) mixed0.13[44]
Thermally modified pine0.07
Thermally modified spruce0.12
Balsa woodMPCM (core: n-octadecane)0.37[43]
Thermally modified beechCapric acid0.21[45]
Poplar woodTallow/myristic acid0.23Present study
Disclaimer/Publisher’s Note: The statements, opinions and data contained in all publications are solely those of the individual author(s) and contributor(s) and not of MDPI and/or the editor(s). MDPI and/or the editor(s) disclaim responsibility for any injury to people or property resulting from any ideas, methods, instructions or products referred to in the content.

