Abstract
The Brazilian Atlantic Forest (AF) is recognized as one of the most threatened biodiversity hotspots by global climate change. Here, we examined the leaf traits (leaf mass area, leaf thickness, and chlorophyll content) and leaf thermotolerance (T50 and TCrit) of seedlings of nine species of AF trees grown experimentally in order to foresee how extreme heat events will affect the forest’s regeneration and diversity. Based on geographic range size, the species were classified into three groups, namely, species with a restricted-range distribution (endemic to the AF), species with an intermediate-range distribution (throughout the Brazilian tropical territory), and species with a wide-range distribution (Latin America). We found that the restricted-range group did not present lower thermotolerance compared to intermediate- and wide-range species groups. Surprisingly, leaf mass area had no effect on thermotolerance indices, while chlorophyll content and leaf thickness positively influenced T50 and TCrit. Some species-specific responses to high-temperature stress deserve attention for tropical tree conservation, as is the case of Arapatiella psylophylla, a vulnerable endemic species with a very restricted-range distribution. Our results suggest that the species-specific leaf thermotolerance is an important criterion to be considered for tropical tree forest conservation in the context of global climate change.
1. Introduction
The impact of global climate change on biodiversity is undoubtedly one of the greatest concerns of scientists, governments, and environmental managers in the 21st century. This phenomenon is closely related to the emission of greenhouse gases by human activities and has led to a gradual increase in average temperature worldwide [1,2]. Not only is the temperature rising, but the occurrence of extreme events such as heat waves and intense droughts has also become more frequent [3,4]. These events are predicted to increase in intensity and frequency in the coming years [2], which could affect the regeneration and establishment of seedlings of tree species in natural forest ecosystems and degraded restoration sites.
In particular, the impacts of climate change may be more intense in tropical forests, which have a more stable environment with less temperature variability than temperate and boreal zones [5,6]. In the tropics, the Atlantic Forest (hereafter AF) is one of the three hotspots in the world most threatened by global change, together with the Cape Floristic Province (South Africa) and the Polynesian and Micronesian islands [7]. Furthermore, the Brazilian AF is considered one of the most important biodiversity hotspots and hosts many endemic tree species [8]. The Central region of the Brazilian AF, which covers the south of the state of Bahia and the north of the state of Espírito Santo, has been considered a hot-point due to the high diversity of endemic and non-endemic plant species [9,10,11,12]. Currently, the AF is also under severe threat due to land-use changes and global climate change [9,11,13]. In this sense, a better understanding of how the increase in heat extremes will affect the diversity and endemic rates of the entire AF, including its central region, is fundamental for conservation.
Endemic species are generally more vulnerable to climate change than non-endemic species [14]. More than 60% of endemic tropical diversity is threatened with extinction in future climate scenarios [15]. This risk is usually associated with a small population size, habitat loss [16], a narrow range of distribution, and a small ecological niche [17]. Among the various factors influencing geographic range size variation (such as evolutionary time, dispersal potential, niche characteristics like tolerance to abiotic conditions), niche breadth has shown a strong relationship with range size [18]. Narrow niches tend to lead to smaller ranges and lower population size [18], a pattern often observed in endemic species. Consequently, a broader thermal niche is one of the most important aspects that may allow non-endemic species to occupy a larger geographic range than endemic species [19,20]. In particular, the ecological niche of endemic AF species is the Atlantic coastal area, which has a lower temperature variability and higher pluviosity than continental areas [21]. In this sense, endemic species, which have a restricted niche and restricted distribution near the coast, could be less thermotolerant than non-endemic species with a broader niche and range distribution. If this scenario is confirmed, the diversity of endemic species in the hot-point of the Central AF will decrease, with far-reaching consequences for the conservation of tropical ecosystems.
Studies that attempt to understand the limits of a species’ thermal stress can help decipher species’ vulnerability to temperature increases [22]. In this sense, the thermotolerance test has proven useful in identifying morphotypes and species that are more sensitive to heat stress [23,24]. Different approaches can be used for thermotolerance testing, such as visual damage, and changes in electrolyte loss, leaf gas exchange, and chlorophyll fluorescence [22]. In particular, the thermotolerance of chlorophyll a is one of the most commonly used techniques to assess the thermotolerance of wild and cultivated plant species, especially for ecological purposes [22,25]. This method is used to analyze how temperature affects the photochemical efficiency of photosystem II (PSII), which is the most heat-sensitive part of photosynthesis [26]. Although there are many studies on the thermotolerance of chlorophyll a that differ slightly in methodology, e.g., as the use of entire leaves, disks, or the timing of temperature heating, this technique is interesting because it is non-destructive, provides rapid results, and is relatively simple and inexpensive compared to other techniques [22]. The effect of heat stress on the photochemical efficiency of PSII can be measured using the Fv/Fm ratio to characterize the loss of photochemical efficiency as a function of temperature. This allows the calculation of thermotolerance traits such as T50 (the maximum temperature at which 50% of the initial Fv/Fm is lost) and TCrit (the temperature at which Fv/Fm drastically decreases) and thus the comparison of different species, treatments, or individuals [27].
The present study was conducted with the aim of investigating the responses of nine AF species to extreme heat events. Considering that the ecological niche of AF geographically restricted endemic species is less variable and more restricted compared to wide-range non-endemic species, we hypothesize that endemic species have a lower thermotolerance than species with a broader geographic range distribution. We also assume that leaf traits are positively correlated with thermotolerance, particularly leaf mass area (LMA). Given these assumptions, we seek to answer the following questions: (i) Can Atlantic Forest tree species with different geographic range sizes cultivated under nursery conditions be distinguished in terms of their thermotolerance? (ii) Is there a relationship between thermotolerance and species leaf traits, such as LMA, leaf thickness, and chlorophyll content? (iii) Can leaf thermotolerance indices be used as a tool for conservation physiology? Using these questions, we examine the relationship between the thermotolerance, leaf traits, and range distribution of Atlantic Forest tree species.
2. Materials and Methods
2.1. Tree Species and Growth Conditions
In our study, we selected nine tropical tree species that are commonly used for forest restoration and silvicultural management [28,29]: Arapatiella psilophylla (Harms) Cowan, Byrsonima stipulacea hunb., Cariniana legalis (Mart.) Kuntze, Cedrela odorata Ruiz & Pav., Copaifera lucens Dwyer, Eschweilera ovata (Cambess.) Mart. ex Miers, Gallesia integrifolia (Spreng.) Harms, Garcinia gardneriana (Planch. & Triana) Zappi, and Trema micrantha (L.) Blume. All nine species occur spontaneously in the Central AF. The seeds came from different matrix sources all from the Central AF region and were acquired from the Arboretum Institute nursery in Teixeira de Freitas, Brazil (39°72′44″ W; 17°56′98″ S). The Central Atlantic Forest region has a hot and humid climate, classified as Af according to the Köppen system, without a pronounced dry season. Rainfall follows a gradient that decreases from the coast to the interior and from north to south. The annual rainfall is more than 1200 mm and reaches over 2000 mm in the wettest areas. The average annual temperature is between 22 °C and 25 °C [29]. In total, there are more than 150 rainy days per year in the region, with total precipitation exceeding 2000 mm per year [16]. All tree species have ecological and silvicultural importance and occur naturally in tropical and seasonal rainforests [30] and agroforestry systems associated with cocoa plantations in Brazil [29]. Also, three of the nine species in this study, C. legalis, A. psilophylla, and C. odorata, are vulnerable to extinction [31] (Table 1 and Table S1).

Table 1.
Distribution range, conservation status, and habitat of nine AF tree species used in this study.
Based on the available literature [39], we categorized the tree species into three distribution range categories: restricted, intermediate, and wide. We defined restricted distribution as species endemic to the AF of southern Bahia and northern Espírito Santo (i.e., A. psilophylla, C. legalis, and C. lucens), whereas intermediate-range species are those restricted to the Brazilian territory and also found in other biomes and states (i.e., E. ovata, and G. integrifolia). Species distributed throughout Latin America (i.e., B. stipulacea C. odorata, G. gardneriana, and T. micrantha) were defined as wide-range species.
Ten seedlings per species were transferred to the nursery of Santa Cruz State University (UESC), located in the Central AF region in Ilhéus, Brazil (39°13′59″ W; 14°45′15″ S), and transplanted into 1.7 L pots containing forest soil. All plants grew under the same light, soil, and water conditions to avoid environmental bias when comparing the different species. The nursery had a light attenuation of 60% (around 20 mol photons m−2 day−1), which is an intermediate light condition for all species. The seedlings were watered regularly. The lowest temperature recorded in the region during the growing period of the seedlings was 15.1 °C, while the highest temperature was 33 °C.
After four months, we estimated three leaf traits and started the photosynthetic thermotolerance test. On the day before the tests, the plants were irrigated abundantly and, at the beginning of the following morning, we selected one healthy, fully expanded, and mature leaf per plant for the evaluation of leaf traits and performance of thermotolerance tests.
2.2. Leaf Traits
For each tree seedling, we assessed leaf mass per area (LMA), leaf thickness (LT), and total chlorophyll content of a selected leaf (i.e., one leaf per individual, totaling 10 leaves per species). Chlorophyll concentration was measured with a SPAD-502 portable chlorophyll meter (Minolta, Japan) using the SPAD index, which was later converted to µg cm−2 [40]. Leaf thickness (LT) was measured using an analogic micrometer (Zaas Precision, Brazil). Leaf or leaflet area (LA) was estimated using ImageJ 1.53e software [41,42] from photographs taken with a smartphone. The leaves and leaflets were placed on a standard white background sheet, which contained a scale used to calculate the LA. At the end of the thermotolerance essays, the leaves and leaflets were dried in a forced-air circulation oven at 60 °C until constant mass to obtain the dry mass (DM). The LMA was calculated through the formula LMA = DM/LA.
2.3. Test of Photosynthesis Thermotolerance
Immediately after the evaluation of leaf attributes, the chlorophyll fluorescence emission of each leaf was measured using a Pocket PEA portable fluorometer (Hansatech Instruments, King’s Lynn, UK) to calculate the maximum quantum efficiency of photosystem II (Fv/Fm). This measurement corresponds to the initial Fv/Fm value at standard laboratory temperature (23 °C). To avoid the mechanical stress of cutting the leaf disks that resulted in water loss problems in previous tests (unpublished data), we used entire leaves or leaflets for all the thermotolerance tests. Entire leaves or leaflets have also been used previously for thermotolerance tests [21,43,44,45]. After measuring chlorophyll fluorescence, the leaves or leaflets were placed in sealed plastic bags to avoid water loss and direct contact with hot water. The bags were then immersed in a preheated water bath with a sous-vide system for slow cooking (Huispark, Zhihui Chen, China). In particular, the leaves or leaflets were exposed to six categories of temperature (i.e., 30, 35, 40, 45, 50, 55, and 60 °C) whose irreversible damage was already visually recognizable. The water temperature was measured using the multi-purpose thermometer TM879 (Equitherm, Porto Alegre, Brazil) and no differences were found between the pre-programmed values on the sous-vide water heater and the reference thermometer. After 15 min at each temperature, the leaves or leaflets were placed between two layers of moist paper towels for a further 15 min in the dark at room temperature to measure Fv/Fm. Then, the leaves or leaflets were heated again at more 5 °C and the process was repeated up to 60 °C. The use of the same leaves occurred due to a limitation in the number of leaves available to the seedlings and to simulate the gradual increase in temperature [22]. The water temperature and Fv/Fm data were used to determine the maximum temperature that promotes the loss of 50% of the initial Fv/Fm (referred as T50) and the temperature at which Fv/Fm decreases dramatically (referred to as TCrit) [6,44,46]. We used the equations described in [24] to estimate T50 and TCrit using the formula of Equation (1):
where Fv/FmMax is the upper horizontal asymptote representing Fv/Fm associated with healthy, non-stressed leaves; b is the steepness of the decrease in Fv/Fm around T50; and TLeaf is the incubation temperature (°C) of the leaf. During the thermotolerance tests, the temperature of the laboratory’s air conditioning was set at 23 °C.
2.4. Statistical Analysis
The thermotolerance curves were fitted with the “nlsLM” function from the minpack.lm package in R version 4.2.1 [47]. From the curves, we estimated the individual values of T50 and Fv/FmMax for each plant individual and calculated the mean species’ values with their standard errors. TCrit was estimated as the temperature at which a line describing the slope of the Fv/Fm decline at T50 intersected with a horizontal line indicating Fv/FmMax (data available in Table S4) [24]. For a better fit of the models by species, we excluded the curves from individuals (plants) deemed outliers (i.e., R2 < 0.60). Consequently, we removed the complete dataset of one individual each from A. psilophylla, C. legalis, C. odorata, E. ovata, and G. gardneriana. Likewise, in C. lucens, we excluded individuals with low initial Fv/Fm values at 22 °C leaf disk heating (i.e., Fv/FmMax < 0.650), leaving only three individuals for this species (data available in Table S5). Curves were compared using maximum likelihood for the best fit and were selected according to the lowest Akaike information criterion corrected (AICc) for small samples [48].
The thermotolerance parameters (T50 and TCrit) and the leaf trait variables (LMA, LT, and total chlorophyll content) were compared between the species using Fisher’s one-way ANOVA or the Kruskal–Wallis test with post hoc Tukey’s Honest Significant Difference test or Bonferroni’s test (respectively) in order to describe and compare the species thermotolerance.
Using generalized linear mixed models, we assessed the effects of leaf traits (LMA, LT, or chlorophyll content) on thermotolerance indexes (T50 or TCrit), including the distribution range categories (restricted, intermediate, and wide) as fixed effects. To account for the species effect, we also used the species as the random effect in the model. The Tweedie family distribution was selected for the model according to the test of singularity, convergence, zero inflation, and overdispersion. The model showed convergence but no singularity. All statistical analyses were performed using R statistical software with the glmmTMB function from the glmmTMB package [49].
In order to test whether the species thermotolerance differed along different range groups, we compared the values to T50 and TCrit among the three distribution range categories (i.e., restricted, intermediate, and wide) using the Kruskal–Wallis test. All statistical analysis were performed in R version 4.2.1.
3. Results
3.1. Thermal Tolerance in AF Species
The nine tropical tree species exhibited an initial maximum photosystem efficiency Fv/Fm varying between 0.7 and 0.8, implying no photodamage or other stress (Figure 1). In particular, high Fv/Fm values were maintained at a room temperature of 23 °C up to 30 °C for most species. However, a sharp decline was observed above 40 °C to 50 °C in all species, with the TCrit ranging from 45 °C to 51 °C. In our study, we also detected that the T50 ranged from 49 °C to 54 °C. Only G. gardneriana maintained an Fv/Fm above 0.2 at 60 °C, while most tree species reached an Fv/Fm value equal to zero at this temperature (Figure 1). Among the studied tree species, G. gardneriana and G. integrifolia achieved the highest mean values of T50 (Figure 2), with, respectively, 54.84 °C and 54.59 °C. The lowest mean values of T50 were observed in A. psilophylla, E. ovata, C. odorata, and T. micrantha, ranging between 49.50 °C and 50.71 °C. The other three species, B. stipulacea, C. legalis, and C. lucens, remained in between those extremes.
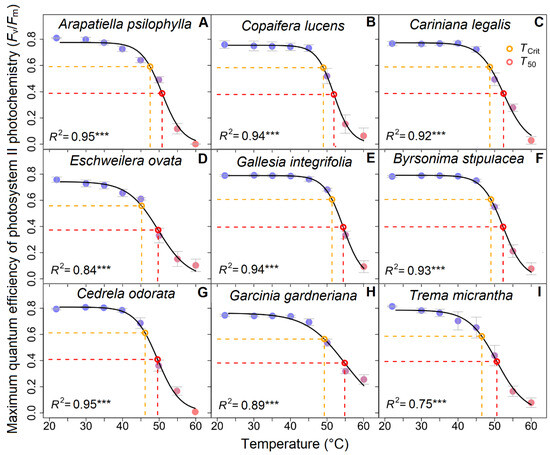
Figure 1.
Thermotolerance curves of nine tropical tree species with different geographical range sizes. Species with (A–C) restricted geographic range (endemic AF species), (D,E) intermediate geographic range (occurring along the Brazilian territory), and (F–I) wide geographic range distributions (occurring throughout Latin America). The red dashed lines represent the T50 and the orange dashed lines indicate TCrit (p > 0.001 represented ***).
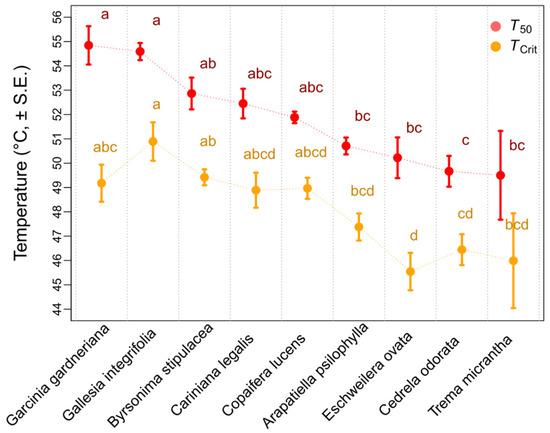
Figure 2.
T50 and Tcrit of nine tropical tree species. Different letters indicate significant difference (p ≤ 0.05) among species. Values are represented by mean and standard error of temperature.
Among the species analyzed, G. integrifolia and B. stipulacea had the highest TCrit values, at 50.89 °C and 49.42 °C, respectively. G. gardneriana, C. legalis, and C. lucens reached middle values (around 53 °C), while A. psilophylla, E. ovata, C. odorata, and T. micrantha presented the lowest values ranging between 45.54 °C and 47.38 °C (Figure 2 and Table S2).
3.2. Leaf Traits and Thermotolerance
Regarding the leaf traits, we observed that the mean LMA values ranged from 40 to 160 g m−2, LT ranged from 0.15 to 0.35 mm, and the plants’ chlorophyll content ranged from 28 to 61 μg cm−2 (Figure 2). Chlorophyll content was not related to species range distribution. According to the Kruskal–Wallis test, the lowest and highest values of leaf mass area and chlorophyll content were recorded in the wide-range species C. odorata and G. gardneriana, respectively (Figure 3).
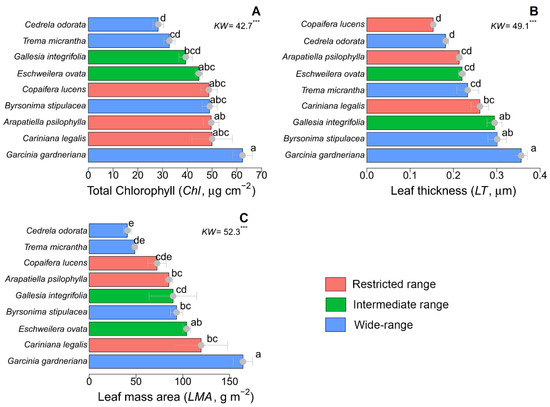
Figure 3.
Leaf traits of nine tropical tree species grouped into three range distribution categories: restricted range (endemic AF species), medium intermediate range (occurring along the Brazilian territory), and wide distribution range (occurring throughout Latin America). (A) Total chlorophyll content, (B) leaf thickness, and (C) leaf mass area. Different letters indicate significant differences among species (*** represents p > 0.001; values: mean ± standard error).
Regarding the relationship between the leaf traits and thermotolerance, chlorophyll content positively influenced T50. The same was found for leaf thickness in TCrit (Figure 4; Table S3).
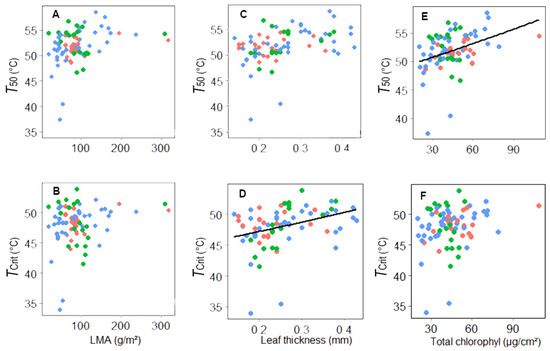
Figure 4.
Relationship between thermotolerance indexes T50 (A,C,E) or TCrit (B,D,F) of nine tropical tree species and their leaf traits: leaf mass area—LMA (A,B); leaf thickness (C,D); and chlorophyll content (E,F). Red, green, and blue represent, respectively, restricted-, intermediate-, and wide-range species. The black line represents the fitted regression line of the generalized linear mixed model.
3.3. Species Range Distribution and Tolerance
Species with a wide distribution had TCrit values of around 49 to 45 °C and 49 to 54 °C of T50. For intermediate-range species, TCrit was 45 to 50 °C and T50 was 50 to 54 °C. Restricted-range species presented T50 values of 45 to 50 and TCrit of 50 to 52 °C. Our findings indicated no significant differences in T50 and TCrit among the three distribution range categories (Figure 5).
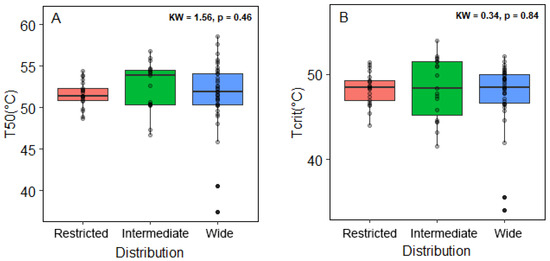
Figure 5.
Thermotolerance indexes of the tree tropical species grouped in three distribution range categories: restricted range (red), intermediate range (green), and wide range (blue). (A) T50 indicates the temperature that promotes the loss of 50% of the initial Fv/Fm, and (B) TCrit represents the temperature at which Fv/Fm decreases dramatically. In the upper right corner, we indicate the values of the Kruskal–Wallis test and the significance.
4. Discussion
Our study aimed to answer how nine species of the Central AF will respond to extreme heat events according to their geographic range size and leaf traits. We expected geographically restricted AF species (endemic to AF) to show less variability in leaf traits and thermotolerance than intermediate- and wide-range (non-endemic) species due to their restricted ecological niche. A similar hypothesis has been tested before, but no consensus has yet been found. For example, in bromeliads, the endemic species Vriesea minarum did not exhibit a lower thermotolerance than the two widespread bromeliad species, Vriesea bituminousa and Aechmea nudicaulis [45]. In tropical trees, there is some evidence of a positive relationship between the maximum leaf temperature across different geographic distributions and thermotolerance (T50) [6]. A negative relationship was also observed between habitat elevation, a factor associated with species distribution, and thermotolerance [27]. In our study, we compared endemic plant species of the Central region of AF, characterized by a restricted-range distribution and stable habitat (low temperature variability), with other species with a wide-range distribution, found throughout Latin America, and found no significant difference in thermotolerance. Thus, our results suggested that thermotolerance is not directly related to species geographic range size, and the hypothesis that endemic species with restricted ranges have a lower thermotolerance than species with wider range sizes was refuted. In this sense, species geographic range size likely has little influence on the thermotolerance of trees in the habitats and species studied.
The fact that no lower thermotolerance was found in the restricted-range species group suggests that the range size restriction for these species is not driven by thermal tolerance, and may be related to other abiotic factors (such as soil) or biotic factors (such as dispersion or competition) [50]. Arapatiella psilophylla, Eschweilera ovata, Cedrela odorata, and Trema micrantha are among the least thermotolerant species, indicating a high vulnerability to future extreme heat events. Specifically, A. psilophylla is on the IUCN Red List of Threatened Species [51] and is endemic to the Central AF region. This species is recommended in forest restoration because it attracts general fauna and increases soil nutrient content [52]. The small population, limited niche, and barochorous dispersal contribute to the classification of this restricted-distribution species as vulnerable to extinction (IUCN Vulnerable category) [53]. Further concerns arise from the low thermotolerance observed in this species, which emphasizes the need for measures to protect it [52]. Another iconic species is C. odorata, which is also a threatened species, but with anemochory dispersion and a wide-range distribution through Latin America [54]. Although C. odorata is more thermotolerant than A. psilophylla, its conservation remains critical given its role as a keystone species. This tree is an emergent species with a large canopy that plays a key role in maintaining biodiversity by providing shelter, food, shade, moisture, and other resources to other species [51]. Thus, among the nine species studied, these two stand out for their higher risk of extinction, which could be aggravated by climate change, emphasizing how fragile the diversity of the AF can be.
We could not detect any effects of LMA on thermotolerance indices, but we found that chlorophyll content and leaf thickness positively affected T50 and TCrit. Functional traits such as seed weight, LMA, wood density, and tree height are used to reveal ecological differences among tropical tree species [5]. In particular, LMA is an important, widely used leaf trait in the context of ecology and the regional distribution of plant species [55]. Higher LMA is generally associated with less favorable environmental conditions, as seen in sclerophyllous and xeromorphic plants in warm or dry environments [55,56]. In this sense, we expected LMA to be positively related to thermotolerance, as observed in some previous studies [27,57]. However, there was no significant correlation between thermotolerance (T50 and Tcrit) and LMA.
Differences in leaf traits among species could also be related to ecophysiological strategies associated with the survival and growth of tree seedlings in the forest understory [58,59] or defense against herbivory [60], rather than species-specific thermotolerance [61]. In this sense, Garcinia gardneriana had the highest values for LMA, LT, and chlorophyll content among the species studied and was among the species showing the highest thermotolerance indices, being the only species that did not reach 0 Fv/Fm at 60 °C. The species in question occupies a wide ecological niche, growing in ecosystems with different temperatures and water availability, such as the Amazon, the Caatinga, the Cerrado, and the Atlantic Forest [39]. Thus, although there is no relationship between leaf traits and thermotolerance, they could contribute to the establishment of the plant in different environments, especially for G. gardneriana.
Tropical species generally have a photosynthetic thermal optimum around 30 °C and a further decline at 40 °C and 50 °C, corresponding to TCrit [46,57,62,63]. Similar results were also found in the nine species studied in this experiment. The critical temperature threshold of 40–50 °C is only a few degrees above the temperature experienced by leaves in the upper canopy of tropical trees, which exceed 40 °C at midday [63,64]. With the increasing frequency and intensity of extreme events, such temperatures will be reached and exceeded more frequently [65,66]. These changes will affect populations, and it is important to take action to protect the most vulnerable species [67].
Thermotolerance tests using chlorophyll fluorescence have proven to be a useful tool for determining the limits of a species’ heat stress and deciphering species’ vulnerability to temperature increases, which can aid in conservation efforts [22]. It is important to emphasize that all tested seedlings originate from the Central AF, the only place where all species occur together. The genotype of the populations could be adapted to the local environmental conditions and possibly influence their thermotolerance. To our knowledge, there are only a few studies looking at the differences in thermotolerance between different genotypes [68], but there is no study with T50 and Tcrit. However, recent studies suggest that thermotolerance, although it may vary depending on the site of origin [69], has a lower plasticity compared to other leaf traits [45,57,70]. Therefore, the thermotolerance indices, especially the T50, could help improve the criteria for classifying species according to their extinction risk due to climate change in the context of conservation physiology [71,72]. Conservation physiology is a scientific discipline that aims to solve conservation problems using physiological concepts and tools [71]. In this sense, T50 could be a particularly interesting tool to determine which species should be prioritized for conservation efforts and management planning in a broader framework of in situ and ex situ conservation efforts [72]. It is also recommended that conservation institutions preserve genetic material from multiple populations of these species for germplasm banks, seedlings for botanical gardens, and seeds for seed banks and thus partially perpetuate the variability in the species.
5. Conclusions
Our study suggests that there is unlikely to be a displacement of AF endemic species by non-endemic species due to future heat waves. We found no difference in the T50 and TCrit of species with different range sizes, showing that the restriction of the occurrence of endemic species is not driven by thermotolerance. T50 has a greater potential to improve the criteria for classifying species according to their extinction risk in future climate scenarios compared to TCrit. This study contributes to the development of theoretical approaches and conservation practices related to species composition. This is especially important since tree diversity is one of the most vulnerable hotspots due to global climate change.
Supplementary Materials
The following supporting information can be downloaded at: https://www.mdpi.com/article/10.3390/f16050764/s1, References [73,74,75,76,77] are cited in the supplementary materials. Table S1: Botanical family, geographical range, conservation status and other aspects of nine tropical tree species used in our study. Table S2: Distribution range, thermotolerance and leaf traits values of nine tropical tree species. Table S3: Results of the generalized linear mixed models used to assess the influence leaf traits and distribution range categories on thermotolerance indexes. Table S4: Leaf traits and fluorescence parameters over temperature increasing from nine forest species studied. Table S5: Model results for the determination the response of Fv/Fm over temperature increasing for nine forest species studied.
Author Contributions
All authors contributed to the study conception and design. Material preparation, data collection, and analysis were performed by C.R.d.B., J.P.P.-M. and M.S.M. The first draft of the manuscript was written by C.R.d.B. with contributions of all authors including M.S.d.S. and L.R.-S. All authors have read and agreed to the published version of the manuscript.
Funding
This research was funded by Coordenação de Aperfeiçoamento de Pessoal de Nível Superior—Brasil (CAPES, Finance Code 001); Fundo Brasileiro para a Biodiversidade, Instituto Humanize, and Eurofins Foundation (Funbio, 013/2022); the Brazilian Council for Scientific and Technological Development (CNPq, 405989/2021-0 and 308860/2021-7); and Universidade Estadual de Santa Cruz (UESC, 073.11009.2021.0027053-48).
Data Availability Statement
The datasets generated and used in this study are available in the supplementary material.
Acknowledgments
Special recognition goes to Roberto A Cordero Solórzano for the manuscript contributions and José Carlos Morante, Ricardo Bovendorp, and Camila Cassano for the contributions in the class of scientific writing.
Conflicts of Interest
The authors declare no conflicts of interest.
References
- IPCC. The Physical Science Basis Summary for Policymakers Working Group I Contribution to the Sixth Assessment Report of the Intergovernmental Panel on Climate Change; IPCC: Geneva, Switzerland, 2021. [Google Scholar]
- IPCC. Climate Change 2023: Synthesis Report; Arias, P., Bustamante, M., Elgizouli, I., Flato, G., Howden, M., Méndez-Vallejo, C., Pereira, J.J., Pichs-Madruga, R., Rose, S.K., Saheb, Y., et al., Eds.; IPCC: Geneva, Switzerland, 2023. [Google Scholar]
- Niu, S.; Luo, Y.; Li, D.; Cao, S.; Xia, J.; Li, J.; Smith, M.D. Plant Growth and Mortality under Climatic Extremes: An Overview. Environ. Exp. Bot. 2014, 98, 13–19. [Google Scholar] [CrossRef]
- Browne, L.; Markesteijn, L.; Engelbrecht, B.M.J.; Jones, F.A.; Lewis, O.T.; Manzané-Pinzón, E.; Wright, S.J.; Comita, L.S. Increased Mortality of Tropical Tree Seedlings during the Extreme 2015–2016 El Niño. Glob. Chang. Biol. 2021, 27, 5043–5053. [Google Scholar] [CrossRef]
- Wright, S.J.; Muller-landau, H.C.; Schipper, J.A.N. The Future of Tropical Species on a Warmer Planet. Conserv. Biol. 2009, 23, 1418–1426. [Google Scholar] [CrossRef]
- Perez, T.M.; Feeley, K.J. Photosynthetic Heat Tolerances and Extreme Leaf Temperatures. Funct. Ecol. 2020, 34, 2236–2245. [Google Scholar] [CrossRef]
- Bellard, C.; Leclerc, C.; Leroy, B.; Bakkenes, M.; Veloz, S.; Thuiller, W.; Courchamp, F. Vulnerability of Biodiversity Hotspots to Global Change. Glob. Ecol. Biogeogr. 2014, 23, 1376–1386. [Google Scholar] [CrossRef]
- Cezar, M.; Paul, J.; Camargo, A.; Jorge, F. The Brazilian Atlantic Forest: How Much Is Left, and How Is the Remaining Forest Distributed ? Implications for Conservation. Biol. Conserv. 2009, 142, 1141–1153. [Google Scholar] [CrossRef]
- Wayt Thomas, W.;  V De Carvalho, A.M.;  A Amorim, A.M.; Garrison, J.; Arbela  Ez, A.L. Plant Endemism in Two Forests in Southern Bahia, Brazil. Biodivers. Conserv. 1998, 7, 311–322. [Google Scholar]
- Amorim, A.M.; Jardim, J.G.; Fiaschi, P.; Augusto, R.; Borges, X.; Perdiz, R.D.O.; Thomas, W.W.; Estadual, U.; Cruz, D.S.; De Janeiro, R.; et al. Angiospermas Em Remanescentes de Floresta Montana No Sul Da Bahia, Brasil. Biota. Neotrop. 2012, 9, 313–348. [Google Scholar]
- Martini, A.M.Z.; Fiaschi, P.; Amorim, A.M.; Paixão, J.L. Da A Hot-Point within a Hot-Spot: A High Diversity Site in Brazil’s Atlantic Forest. Biodivers. Conserv. 2007, 16, 3111–3128. [Google Scholar] [CrossRef]
- Carnaval, A.C.; Hickerson, M.J.; Haddad, C.F.B.; Rodrigues, M.T.; Moritz, C. Stability Predicts Genetic Diversity Inthe Brazilian Atlantic Forest Hotspot. Science 2009, 323, 785–789. [Google Scholar] [CrossRef]
- Colombo, A.; Joly, C. Brazilian Atlantic Forest Lato Sensu: The Most Ancient Brazilian Forest, and a Biodiversity Hotspot, Is Highly Threatened by Climate Change. Braz. J. Biol. 2010, 70, 697–708. [Google Scholar] [PubMed]
- Vancine, M.H.; Muylaert, R.L.; Niebuhr, B.B.; Oshima, J.E.d.F.; Tonetti, V.; Bernardo, R.; De Angelo, C.; Rosa, M.R.; Grohmann, C.H.; Ribeiro, M.C. The Atlantic Forest of South America: Spatiotemporal Dynamics of the Vegetation and Implications for Conservation. Biol. Conserv. 2024, 291, 110499. [Google Scholar] [CrossRef]
- Manes, S.; Costello, M.J.; Beckett, H.; Debnath, A.; Devenish-Nelson, E.; Grey, K.A.; Jenkins, R.; Khan, T.M.; Kiessling, W.; Krause, C.; et al. Endemism Increases Species’ Climate Change Risk in Areas of Global Biodiversity Importance. Biol. Conserv. 2021, 257, 109070. [Google Scholar] [CrossRef]
- Sambuichi, R.H.R.; de Oliveira, R.M.; Neto, E.M.; Thévenin, J.M.R.; Júnior, C.P.d.J.; Oliveira, R.L.; Pelição, M.C. Conservation Status of Ten Endemic Trees from the Atlantic Forest in the South of Bahia-Brazil. Nat. E Conservação. 2008, 6, 208–225. [Google Scholar]
- Staude, I.R.; Navarro, L.M.; Pereira, H.M. Range Size Predicts the Risk of Local Extinction from Habitat Loss. Glob. Ecol. Biogeogr. 2020, 29, 16–25. [Google Scholar] [CrossRef]
- Slatyer, R.A.; Hirst, M.; Sexton, J.P. Niche Breadth Predicts Geographical Range Size: A General Ecological Pattern. Ecol. Lett. 2013, 16, 1104–1114. [Google Scholar]
- Feeley, K.J.; Rehm, E.M.; Machovina, B. The Responses of Tropical Forest Species to Global Climate Change: Acclimate, Adapt, Migrate or Go Extinct? Front. Biogeogr. 2012, 4, 69–84. [Google Scholar] [CrossRef]
- Yu, F.; Groen, T.A.; Wang, T.; Skidmore, A.K.; Huang, J.; Ma, K. Climatic Niche Breadth Can Explain Variation in Geographical Range Size of Alpine and Subalpine Plants. Int. J. Geogr. Inf. Sci. 2017, 31, 190–212. [Google Scholar] [CrossRef]
- Godoy, O.; de Lemos-Filho, J.P.; Valladares, F. Invasive Species Can Handle Higher Leaf Temperature under Water Stress than Mediterranean Natives. Environ. Exp. Bot. 2011, 71, 207–214. [Google Scholar] [CrossRef]
- Geange, S.R.; Arnold, P.A.; Catling, A.A.; Coast, O.; Cook, A.M.; Gowland, K.M.; Leigh, A.; Notarnicola, R.F.; Posch, B.C.; Venn, S.E.; et al. The Thermal Tolerance of Photosynthetic Tissues: A Global Systematic Review and Agenda for Future Research. New Phytol. 2021, 229, 2497–2513. [Google Scholar] [CrossRef]
- Slot, M.; Kitajima, K. Whole-Plant Respiration and Its Temperature Sensitivity during Progressive Carbon Starvation. Funct. Plant Biol. 2015, 42, 579–588. [Google Scholar] [CrossRef] [PubMed]
- Slot, M.; Nardwattanawong, T.; Hernández, G.G.; Bueno, A.; Riederer, M.; Winter, K. Large Differences in Leaf Cuticle Conductance and Its Temperature Response among 24 Tropical Tree Species from across a Rainfall Gradient. New Phytol. 2021, 232, 1618–1631. [Google Scholar] [CrossRef]
- Winter, K.; Krüger Nuñez, C.R.; Slot, M.; Virgo, A. In Thermotolerance Tests of Tropical Tree Leaves, the Chlorophyll Fluorescence Parameter Fv/Fm Measured Soon after Heat Exposure Is Not a Reliable Predictor of Tissue Necrosis. Plant Biol. 2024, 27, 146–153. [Google Scholar] [CrossRef]
- Münchinger, I.K.; Hajek, P.; Akdogan, B.; Caicoya, A.T.; Kunert, N. Leaf Thermal Tolerance and Sensitivity of Temperate Tree Species Are Correlated with Leaf Physiological and Functional Drought Resistance Traits. J. Res. 2023, 34, 63–76. [Google Scholar] [CrossRef]
- Slot, M.; Cala, D.; Aranda, J.; Michaletz, S.T.; Winter, K. Leaf Heat Tolerance of 147 Tropical Forest Species Varies with Elevation and Leaf Functional Traits, but Not with Phylogeny. Plant Cell Environ. 2021, 44, 2414–2427. [Google Scholar] [CrossRef] [PubMed]
- de Almeida, C.; Reid, J.L.; Ferreira de Lima, R.A.; Pinto, L.F.G.; Viani, R.A.G. Restoration Plantings in the Atlantic Forest Use a Small, Biased, and Homogeneous Set of Tree Species. Ecol. Manag. 2024, 553, 121628. [Google Scholar] [CrossRef]
- Sambuichi, R.H.R.; Vidal, D.B.; Piasentin, F.B.; Jardim, J.G.; Viana, T.G.; Menezes, A.A.; Mello, D.L.N.; Ahnert, D.; Baligar, V.C. Cabruca Agroforests in Southern Bahia, Brazil: Tree Component, Management Practices and Tree Species Conservation. Biodivers. Conserv. 2012, 21, 1055–1077. [Google Scholar] [CrossRef]
- Thomas, W.W.; Jardim, J.G.; Fiaschi, P.; Mariano, E.; Amorim, A.M. Composição Florística e Estrutura Do Componente Arbóreo de Uma Área Transicional de Floresta Atlântica No Sul Da Bahia, Brasil. Rev. Bras. Botânica 2009, 32, 65–78. [Google Scholar] [CrossRef]
- IUCN IUCN Red List of Threatened Species. Available online: https://www.iucnredlist.org/ (accessed on 1 June 2024).
- Stolarski, O.C.; Gorenstein, M.R.; Lubke, M.; Lubke, L.; O’connor, P.H.P.; Bechara, F.C. Trema micrantha (L.) Blume. in Plantations for Ecological Restoration: Early Development in the Brazilian Subtropical Forest. Cienc. Florest. 2018, 28, 1217–1229. [Google Scholar] [CrossRef]
- Rocha, A.P.; Matoc, V.P.; Sena, L.H.d.M.; Pacheco, M.V.; Ferreira, R.L.C. Métodos Para Superação Da Dormência Em Sementes de Garcinia Gardneriana(Planch. & Triana) Zappi. Ciência Florest. 2018, 28, 505–514. [Google Scholar]
- Barros, S.S.; da Silva, A.; Aguiari, I.B. Germinação de Sementes de Gallesia Integrifolia (Spreng.) Harms (Pau-d’alho) Sob Diferentes Condições de Temperatura, Luz e Umidade Do Substrato. Rev. Bras. Botânica 2005, 28, 727–733. [Google Scholar] [CrossRef]
- Santos, A.S.; Borges, D.B.; Vivas, C.V.; Van Den Berg, C.; Rodrigues, P.S.; Tarazi, R.; Gaiotto, F.A. Gene Pool Sharing and Genetic Bottleneck Effects in Subpopulations of Eschweilera Ovata (Cambess.) Mart. Ex Miers (Lecythidaceae) in the Atlantic Forest of Southern Bahia, Brazil. Genet. Mol. Biol. 2019, 42, 655–665. [Google Scholar] [CrossRef] [PubMed]
- Fontana, C.; Pérez-de-Lis, G.; Nabais, C.; Lousada, J.L.P.C.; Olmedo, G.M.; Botosso, P.C.; Oliveira, J.M. Climatic Signal in Growth-Rings of Copaifera Lucens: An Endemic Species of a Brazilian Atlantic Forest Hotspot, Southeastern Brazil. Dendrochronologia 2018, 50, 23–32. [Google Scholar] [CrossRef]
- Cavers, S.; Navarro, C.; Lowe, A.J. Chloroplast DNA Phylogeography Reveals Colonization History of a Neotropical Tree, Cedrela odorata L., in Mesoamerica. Mol. Ecol. 2003, 12, 1451–1460. [Google Scholar] [CrossRef]
- Sanches, M.C.; Ribeiro, S.P.; Dalvi, V.C.; da Silva Junior, M.B.; de Sousa, H.C.; de Lemos-Filho, J.P. Differential Leaf Traits of a Neotropical Tree Cariniana Legalis (Mart.) Kuntze (Lecythidaceae): Comparing Saplings and Emergent Trees. Trees-Struct. Funct. 2010, 24, 79–88. [Google Scholar] [CrossRef]
- Brasil Flora Do Brasil. Jardim Botânico do Rio de Janeiro. 2019. Available online: https://floradobrasil.jbrj.gov.br (accessed on 2 July 2024).
- Coste, S.; Baraloto, C.; Leroy, C.; Marcon, É.; Renaud, A.; Richardson, A.D.; Roggy, J.; Schimann, H.; Uddling, J.; Hérault, B. Assessing Foliar Chlorophyll Contents with the SPAD-502 Chlorophyll Meter: A Calibration Test with Thirteen Tree Species of Tropical Rainforest in French Guiana. Ann. Sci. 2010, 67, 607. [Google Scholar]
- Abràmoff, M.D.; Magalhães, P.J.; Ram, S.J. Image Processing with ImageJ Part II. Biophotonics Int. 2005, 11, 36–43. [Google Scholar]
- Brito-Rocha, E.; dos Anjos, L.; Schilling, A.C.; Dalmolin, Â.C.; Mielke, M.S. Individual Leaf Area Estimations of a Dioecious Tropical Tree Species Carpotroche Brasiliensis (Raddi) A. Gray, Achariaceae. Agrofor. Syst. 2017, 91, 9–15. [Google Scholar] [CrossRef]
- Molina-bravo, R.; Arellano, C.; Sosinski, B.R.; Fernandez, G.E. A Protocol to Assess Heat Tolerance in a Segregating Population of Raspberry Using Chlorophyll Fluorescence. Sci. Hortic. 2011, 130, 524–530. [Google Scholar] [CrossRef]
- Marias, D.E.; Meinzer, F.C.; Still, C. Leaf Age and Methodology Impact Assessments of Thermotolerance of Coffea Arabica. Trees 2017, 31, 1091–1099. [Google Scholar] [CrossRef]
- Chaves, C.J.N.; Leal, B.S.S.; Lemos-filho, J.P. de How Are Endemic and Widely Distributed Bromeliads Responding to Warming Temperatures ? A Case Study in a Brazilian Hotspot. Flora 2018, 238, 110–118. [Google Scholar] [CrossRef]
- Kumarathunge, D.P.; Medlyn, B.E.; Drake, J.E.; Tjoelker, M.G.; Michael, J.; Battaglia, M.; Cano, F.J.; Carter, K.R.; Cavaleri, M.A.; Lucas, A.; et al. Acclimation and Adaptation Components of the Temperature Dependence of Plant Photosynthesis at the Global Scale. New Phytol. 2019, 222, 768–784. [Google Scholar] [CrossRef]
- Elzhov, V.; Mullen, K.M.; Spiess, A.-N.; Maintainer, B.B. minpack.lm: R interface to the Levenberg-Marquardt nonlinear least-squares algorithm found in minpack, plus support for bounds 2022. Available online: https://cran.r-project.org/web/packages/minpack.lm/index.html (accessed on 1 March 2025).
- Berk, M. Smoothing-Splines Mixed-Effects Models in R Using the Sme Package: A Tutorial. R. Found. Stat. Comput. 2018, 1–17. Available online: https://rdrr.io/cran/sme/f/inst/doc/Tutorial.pdf (accessed on 1 July 2024).
- Brooks, M.; Bolker, B.; Kristensen, K.; Maechler, M.; Magnusson, A.; McGillycuddy, M.; Skaug, H.; Nielsen, A.; Berg, C.; van Bentham, K.; et al. Package “glmmTMB” Title Generalized Linear Mixed Models Using Template Model Builder 2023. Available online: https://www.researchgate.net/publication/323384790_glmmTMB_Generalized_linear_mixed_models_using_Template_Model_Builder (accessed on 1 June 2024).
- Vleminckx, J.; Barrantes, O.V.; Fortunel, C.; Paine, C.E.T.; Bauman, D.; Engel, J.; Petronelli, P.; Dávila, N.; Rios, M.; Valderrama Sandoval, E.H.; et al. Niche Breadth of Amazonian Trees Increases with Niche Optimum across Broad Edaphic Gradients. Ecology 2023, 104, e4053. [Google Scholar] [CrossRef]
- Sampayo-maldonado, S.; Ordoñez-salanueva, C.A.; Mattana, E.; Ulian, T.; Way, M.; Castillo-lorenzo, E.; Patricia, D.D.; Lira-saade, R.; Oswaldo, T.; Rodriguez-arevalo, N.I.; et al. Thermal Time and Cardinal Temperatures for Germination of Cedrela odorata L. Forests 2019, 10, 1–17. [Google Scholar] [CrossRef]
- Sambuichi, R.H.R. Nossas Árvores: Conservação, Uso e Manejo de Árvores Nativas No Sul Da Bahia; EDITUS: Ilhéus, Brazil, 2009. [Google Scholar]
- ICMBio Plano de Manejo Parque Nacional Do Pau Brasil—Volume I 2015. Available online: https://www.gov.br/icmbio/pt-br/assuntos/biodiversidade/unidade-de-conservacao/unidades-de-biomas/mata-atlantica/lista-de-ucs/parna-do-pau-brasil (accessed on 1 March 2025).
- Mark, J.; Rivers, M.C. Cedrela odorata. The IUCN Red List of Threatened Species 2017. e.T32292A68080590. Available online: https://www.iucnredlist.org/species/32292/68080590 (accessed on 1 June 2024).
- Gratani, L.; Bombelli, A. Leaf Anatomy, Inclination, and Gas Exchange Relationships in Evergreen Sclerophqldous and Drought Semideciduous Shrub Species. Photosynthetica 2000, 37, 573–585. [Google Scholar] [CrossRef]
- Pariyar, S.; Chang, S.C.; Zinsmeister, D.; Zhou, H.; Grantz, D.A.; Hunsche, M.; Burkhardt, J. Xeromorphic Traits Help to Maintain Photosynthesis in the Perhumid Climate of a Taiwanese Cloud Forest. Oecologia 2017, 184, 609–621. [Google Scholar] [CrossRef]
- Sastry, A.; Barua, D. Leaf Thermotolerance in Tropical Trees from a Seasonally Dry Climate Varies along the Slow-Fast Resource Acquisition Spectrum. Sci. Rep. 2017, 7, 11246. [Google Scholar] [CrossRef]
- Kitajima, K. Ecophysiology of Tropical Tree Seedlings. In Tropical Forest Plant Ecophysiology; Mulkey, S.S., Chazdon, R.L., Smith, A.P., Eds.; Springer: Boston, MA, USA, 1996; pp. 559–596. [Google Scholar] [CrossRef]
- Lusk, C.H.; Reich, P.B.; Montgomery, R.A.; Ackerly, D.D.; Cavender-Bares, J. Why Are Evergreen Leaves so Contrary about Shade? Trends Ecol. Evol. 2008, 23, 299–303. [Google Scholar] [CrossRef]
- Nabeshima, E.; Murakami, M.; Hiura, T. Effects of Herbivory and Light Conditions on Induced Defense in Quercus Crispula. J. Plant Res. 2001, 114, 403–409. [Google Scholar] [CrossRef]
- Mielke, M.S.; Oliveira, L.A.; dos Santos, M.S.; Pérez-Molina, J.P.; Cerqueira, A.F.; Dalmolin, Â.C.; Sousa-Santos, C.; de Brito, C.R. Photochemical Efficiency and Lethal Leaf Dehydration in Seedlings of Nine Tropical Tree Species. New For. 2023, 55, 505–521. [Google Scholar] [CrossRef]
- Krause, G.H.; Winter, K.; Krause, B.; Virgo, A. Light-Stimulated Heat Tolerance in Leaves of Two Neotropical Tree Species, Ficus insipida and Calophyllum longifolium. Funct. Plant Biol. 2015, 42, 42–51. [Google Scholar] [CrossRef]
- Slot, M.; Winter, K. The Effects of Rising Temperature on the Ecophysiology of Tropical Forest Trees. In Tropical Tree Physiology; Goldstein, G., Santiago, L.S., Eds.; Springer: Cham, Switzerland, 2016; pp. 385–412. [Google Scholar]
- Ntawuhiganayo, E.B.; Uwizeye, F.K.; Zibera, E.; Dusenge, M.E.; Ziegler, C.; Ntirugulirwa, B.; Nsabimana, D.; Wallin, G.; Uddling, J. Traits Controlling Shade Tolerance in Tropical Montane Trees. Tree Physiol. 2019, 40, 183–197. [Google Scholar] [CrossRef]
- Perkins-Kirkpatrick, S.E.; Lewis, S.C. Increasing Trends in Regional Heatwaves. Nat. Commun. 2020, 11, 3357. [Google Scholar] [CrossRef]
- Torres, R.R.; Benassi, R.B.; Martins, F.B.; Lapola, D.M. Projected Impacts of 1.5 and 2 °C Global Warming on Temperature and Precipitation Patterns in South America. Int. J. Climatol. 2022, 42, 1597–1611. [Google Scholar] [CrossRef]
- Cavaleri, M.A.; Reed, S.C.; Smith, W.K.; Wood, T.E. Urgent Need for Warming Experiments in Tropical Forests. Glob. Chang. Biol. 2014, 21, 2111–2121. [Google Scholar] [CrossRef]
- Oukarroum, A.; El Madidi, S.; Strasser, R.J. Differential Heat Sensitivity Index in Barley Cultivars (Hordeum vulgare L.) Monitored by Chlorophyll a Fluorescence OKJIP. Plant Physiol. Biochem. 2016, 105, 102–108. [Google Scholar] [CrossRef]
- Zhu, L.; Bloomfield, K.J.; Hocart, C.H.; Egerton, J.J.G.; O’Sullivan, O.S.; Penillard, A.; Weerasinghe, L.K.; Atkin, O.K. Plasticity of Photosynthetic Heat Tolerance in Plants Adapted to Thermally Contrasting Biomes. Plant Cell Environ. 2018, 41, 1251–1262. [Google Scholar] [CrossRef]
- Konôpková, A.; Kurjak, D.; Kmeť, J.; Klumpp, R.; Longauer, R.; Ditmarová, Ľ.; Gömöry, D. Differences in Photochemistry and Response to Heat Stress between Silver Fir (Abies Alba Mill.) Provenances. Trees 2018, 32, 73–86. [Google Scholar] [CrossRef]
- Cooke, S.J.; Sack, L.; Franklin, C.E.; Farrell, A.P.; Beardall, J.; Wikelski, M.; Chown, S.L. What Is Conservation Physiology? Perspectives on an Increasingly Integrated and Essential Science. Conserv. Physiol. 2013, 1, cot001. [Google Scholar] [CrossRef]
- Wikelski, M.; Cooke, S.J. Conservation Physiology. Trends Ecol. Evol. 2006, 21, 38–46. [Google Scholar] [CrossRef] [PubMed]
- Lorenzi, H. Árvores Brasileiras; Plantarum: Nova Odessa, Brazil, 1992; Volume 1, 368p. [Google Scholar]
- Lorenzi, H. Árvores Brasileiras; Plantarum: Nova Odessa, Brazil, 1998; Volume 2, 1088p. [Google Scholar]
- Firmino, T.P.; Barbeiro, C.; Romagnolo, M.B.; Pastorini, L.H. Gallesia Integrifolia (Spreng.) Harms. Growth under Different Shade and Water Availability Conditions. Floresta E Ambiente 2020, 27, e20180452. [Google Scholar] [CrossRef]
- Lopes, C.G.R.; Ferraz, E.M.N.; Araújo, E.D.L. Physiognomic-Structural Characterization of Dry- and Humid-Forest Fragments (Atlantic Coastal Forest) in Pernambuco State, NE Brazil. Plant Ecol. 2008, 198, 1–18. [Google Scholar] [CrossRef]
- Barros, M.D.C.R.; Schliewe, M.A.; Schliewe, M.A. Morfo-Anatomia de Folhas de Apeiba Tibourbou Aubl. Malvaceae. Fronteiras 2017, 6, 212–229. [Google Scholar] [CrossRef]
Disclaimer/Publisher’s Note: The statements, opinions and data contained in all publications are solely those of the individual author(s) and contributor(s) and not of MDPI and/or the editor(s). MDPI and/or the editor(s) disclaim responsibility for any injury to people or property resulting from any ideas, methods, instructions or products referred to in the content. |
© 2025 by the authors. Licensee MDPI, Basel, Switzerland. This article is an open access article distributed under the terms and conditions of the Creative Commons Attribution (CC BY) license (https://creativecommons.org/licenses/by/4.0/).