You are currently viewing a new version of our website. To view the old version click .
Forests
  • Article
  • Open Access

21 April 2025

Refined Classification of Mountainous Vegetation Based on Multi-Source and Multi-Temporal High-Resolution Images

,
,
,
,
,
and
1
School of Earth Sciences and Engineering, China University of Mining and Technology (Beijing), Beijing 100083, China
2
School of Geomatics and Marine Information, Jiangsu Ocean University, Lianyungang 222002, China
3
Lianyungang Forestry Technical Guidance Station, Lianyungang 222000, China
4
Fujian Province Satellite Data Development Co., Ltd., Fuzhou 350003, China
This article belongs to the Section Forest Inventory, Modeling and Remote Sensing

Abstract

Distinguishing vegetation types from satellite images has long been a goal of remote sensing, and the combination of multi-source and multi-temporal remote sensing images for vegetation classification is currently a hot topic in the field. In species-rich mountainous environments, this study selected four remote sensing images from different seasons (two aerial images, one WorldView-2 image, and one UAV image) and proposed a vegetation classification method integrating hierarchical extraction and object-oriented approaches for 11 vegetation types. This method innovatively combines the Random Forest algorithm with a decision tree model, constructing a hierarchical strategy based on multi-temporal feature combinations to progressively address the challenge of distinguishing vegetation types with similar spectral characteristics. Compared to traditional single-temporal classification methods, our approach significantly enhances classification accuracy through multi-temporal feature fusion and comparative experimental validation, offering a novel technical framework for fine-grained vegetation classification under complex land cover conditions. To validate the effectiveness of multi-temporal features, we additionally performed Random Forest classifications on the four individual remote sensing images. The results indicate that (1) for single-temporal images classification, the best classification performance was achieved with autumn images, reaching an overall classification accuracy of 72.36%, while spring images had the worst performance, with an accuracy of only 58.79%; (2) the overall classification accuracy based on multi-temporal features reached 89.10%, which is an improvement of 16.74% compared to the best single-temporal classification (autumn). Notably, the producer accuracy for species such as Quercus acutissima Carr., Tea plantations, Camellia sinensis (L.) Kuntze, Pinus taeda L., Phyllostachys spectabilis C.D.Chu et C.S.Chao, Pinus thunbergii Parl., and Castanea mollissima Blume all exceeded 90%, indicating a relatively ideal classification outcome.

1. Introduction

Accurate spatial distribution and quantitative information on forest vegetation are crucial for sustainable forest management in natural environments, where a diverse range of tree species provides economic, biological, and ecosystem value. Over the past two decades, researchers have made significant efforts to obtain forest vegetation information through remote sensing imagery, especially with the increased availability of high-temporal, -spatial, and -spectral resolution satellite data [1,2,3,4]. However, two key challenges remain: (1) High-temporal-resolution satellite imagery, such as Sentinel series data, demonstrates unique advantages in vegetation phenology monitoring due to its high-frequency observation capability. However, its relatively low spatial resolution struggles to meet the detailed requirements for fine-scale mountain vegetation classification. This contradiction is particularly pronounced in complex topographic regions: Firstly, the high fragmentation of vegetation patches in mountainous environments leads to mixed vegetation types within individual pixels under low spatial resolution, causing severe mixed-pixel effects. Secondly, accurate extraction of vertical structural information for mountain vegetation requires sub-meter-level spatial details, whereas existing high-temporal-resolution satellite imagery fails to capture critical transition zone features, such as mixed-species tree boundaries. (2) There is a need for a robust analytical method to integrate different sensor images for the refined classification of mountainous vegetation.
Researchers have investigated the impact of temporal resolution or phenology on the extraction of vegetation information in natural environments using high-spatial-resolution imagery [5,6,7,8]. They have demonstrated the advantages of using multi-temporal or multi-temporal images over single high-resolution remote sensing images for vegetation classification [9,10,11]. multi-temporal high-resolution image is crucial for capturing key phenological developmental characteristics of tree species during different transitional periods. In wetland environments, Kristie [12] explored the use of bi-seasonal and single-temporal WorldView-2 satellite data to map four adjacent plant communities and three mangrove types. The results indicated that bi-seasonal data were more effective in distinguishing all areas of interest compared to single-temporal data. For forested areas, Li Zhe [13]. found that among the timing, feature selection, and classifiers, the timing had the greatest impact on tree species classification results, based on GF-2 images from January, April, and November. These previous studies were limited by the timing of image acquisition, with each study covering only 2–3 phenological phases during the growing season. Therefore, there is a need for more systematic research that utilizes images captured during each phenological phase across four growing seasons to fill this gap. Such studies would provide a comprehensive understanding of the importance of phenology at different taxonomic levels, facilitating the refined classification of mountainous vegetation.
With the rapid development of remote sensing technology, UAV aerial images has demonstrated unique advantages in vegetation classification due to its centimeter-level spatial resolution and flexible acquisition cycles [14,15]. Compared to traditional satellite remote sensing, UAV platforms can overcome cloud interference and revisit cycle limitations. Particularly in heterogeneous terrains such as mountainous areas and urban green spaces, their multi-angle and multi-temporal data acquisition capabilities effectively capture spatiotemporal variations in vegetation canopy structure and phenological features, providing a data foundation for refined classification [16]. For instance, Wen Yuting [17] et al. explored technical pathways for precise tree species classification in small regions using UAV visible-light imagery combined with object-oriented classification methods, verifying its application potential in forest resource management. She Jie [18] et al. achieved vegetation classification accuracy exceeding 91% by integrating UAV images with object-oriented segmentation and machine learning algorithms (Support Vector Machine and Random Forest). These studies indicate that the high spatial resolution of UAV images can significantly alleviate mixed-pixel issues in mountainous environments, while its flexible temporal combinations better capture spectral differences during critical phenological phases of vegetation, thereby enhancing classification accuracy in complex scenarios.
Due to limitations in data availability and issues such as cloud contamination, acquiring high-spatial-resolution and high-temporal-frequency imagery can be challenging. By combining images from different sensors, more comprehensive and accurate land cover information can be obtained. For instance, Wang Erli [19] et al. utilized two GF-1 images and two Pleiades images, while Jin Jia [20] combined GF satellite imagery with resource satellite imagery. By analyzing the phenological characteristics of vegetation using three different seasonal images, they demonstrated that in forests with complex species distributions, using multi-source and multi-temporal remote sensing image can significantly enhance classification accuracy when comparing the results of multi-temporal versus single-temporal remote sensing classification. With the continuous advancement of remote sensing technology, UAV aerial imagery has shown great potential for application in vegetation classification [21,22,23]. By complementing UAV imagery with high-resolution satellite imagery, data from multiple sources and seasons can capture greater variations in vegetation conditions, thereby promising to enhance classification accuracy.
High-resolution remote sensing imagery provides rich spatial and spectral information, creating a multidimensional feature space for forest remote sensing classification. However, this also presents challenges for image classification. Traditional pixel-based classification methods struggle to effectively mitigate the “salt-and-pepper effect”, which arises from significant spectral variability among similar land covers. Additionally, issues such as “spectrally similar but different objects” and “spectrally different but similar objects” exacerbate the misclassification of land cover types [24]. To address the characteristics of high-spatial-resolution imagery, researchers have explored the use of object-oriented classification techniques to improve classification accuracy. Multiple studies have shown that object-oriented classification methods can effectively reduce the impact of related issues on classification results, thereby enhancing overall classification precision. The object-oriented classification method involves first segmenting the image using image segmentation techniques to generate independent objects. Based on these independent objects, vegetation classification is then performed. This approach effectively utilizes various types of information, including texture and spectral data, to improve classification accuracy. It has shown promising results in analyzing the classification of complex forest ecosystems [25,26,27,28]. Non-parametric classifiers, such as Random Forest (RF), are often the preferred choice for tree species mapping due to their generally higher predictive accuracy. Additionally, RF classifiers do not require normally distributed input data. Notably, the performance disparities among different classifiers are particularly critical in mountain vegetation classification. Lin Yi et al. [29] conducted a comparative study using UAV imagery and found that when the study area was divided into 10 categories, the object-oriented Support Vector Machine achieved significantly higher overall accuracy (OA = 90%) under small-sample conditions compared to the Mobile-Unet deep learning model (OA = 84%). These results suggest that traditional classification methods may outperform deep learning in mountainous regions characterized by complex vegetation types and sample collection challenges. Although the feature self-learning capability of deep learning is theoretically appealing, its reliance on large-scale annotated data fundamentally conflicts with the scarcity of vegetation samples in mountainous areas. Coupled with the limited generalization capability caused by insufficient model interpretability, object-oriented classification methods remain a more robust choice under current conditions.
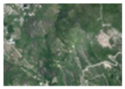
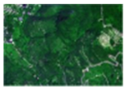
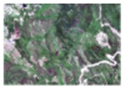
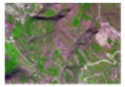
In this study, our objectives are (1) to explore a technique suitable for integrating multi-temporal and different sensor images for the refined classification of mountainous vegetation; (2) to identify the key input variables for accurately distinguishing 11 different vegetation types; and (3) to determine which datasets and seasonal images yield the best accuracy for mountainous vegetation classification. Our research utilizes four high-resolution remote sensing images from different imaging times and data sources, including two aerial images, one WorldView-2 image, and one UAV image. By combining hierarchical extraction based on vegetation phenological characteristics with a Random Forest model, we aim to obtain information on the 11 vegetation types in the study area.

2. Study Area and Data

2.1. Study Area

Yuntai Mountain, located within the urban area of Lianyungang City (34°29′35″–35°08′30″ N, 119°08′08″–119°55′00″ E), is situated in the transitional zone between the North Subtropical and Warm Temperate Zones. The region is influenced by a maritime climate, characterized by abundant rainfall and distinct seasonal variations, exhibiting typical features of a temperate monsoon climate (Figure 1). The study area covers an area of 266.65 hectares. The main vegetation types in the area include species such as the Quercus acutissima, Castanea mollissima, Pinus taeda, Phyllostachys spectabilis, and Tea plantations.
Figure 1. Location of the study area and schematic representation of DEM image.

2.2. Satellite Data and Data Processing

2.2.1. Worldview-2 Images

The WorldView-2 images used in this study comprise panchromatic and multi-spectral images. The panchromatic image has a spatial resolution of 0.5 m, while the multi-spectral image has a spatial resolution of 1.8 m. The image was acquired on 31 August 2020, with good imaging quality. During summer, vegetation in the study area exhibits fully grown leaves, resulting in minimal color differences between various vegetation types in the image. This period corresponds to the smallest spectral distinguishability among different vegetation types due to the reduced variability in their spectral characteristics.

2.2.2. Digital Orthophoto Map

The DOM (Digital Orthophoto Map) data used in this study were provided by the Jiangsu Provincial Bureau of Natural Resources, comprising two temporal datasets from November 2018 and April 2020, with the following specific characteristics:
The April 2020 DOM contains red (R), green (G), and blue (B) bands, with a spatial resolution of 0.2 m. Acquired during the early growth stage of vegetation in spring, this period exhibited limited spectral separability among vegetation types due to low canopy coverage. However, coinciding with the flowering season of Catalpa bungei, its distinct texture and color features provided critical references for specific tree species identification.
The November 2018 DOM also features RGB band composition but with a spatial resolution of 0.3 m. Captured during the late autumn vegetation maturity period, evergreen vegetation (Pinus taeda) and deciduous vegetation showed significant spectral separability due to differences in leaf pigment content, resulting in strong color contrast between vegetation types in the imagery, which facilitated high-precision classification.
Both datasets underwent radiometric and geometric precision corrections, with excellent imaging quality, making them directly applicable for vegetation classification research.

2.2.3. UAV Imagery

The UAV imagery used in this study was acquired by a DJI Phantom 4 RTK drone equipped with an RTK module to provide high-precision positioning information. Data collection occurred on 23 December 2019, from 10:00 to 15:00 local time, with flight altitudes ranging between 50 and 120 m. The camera utilized a 20 MP resolution and an 8.8 mm lens focal length to ensure image detail and clarity. During the flight, the imagery maintained 80% front overlap and 60% side overlap to guarantee post-processing mosaic quality. The data underwent post-processing with ground control points (GCPs) for precision correction, achieving a spatial positioning error of less than 0.5 m. In winter, the study area was dominated by evergreen vegetation, representing the optimal period for distinguishing deciduous and evergreen vegetation. Table 1 shows the remote sensing images used for vegetation classification in this study.
Table 1. Remote sensing image information.

2.2.4. Sample Collection and Classification System

Combining the land change survey data provided by the Lianyungang Forestry Technical Guidance Station, which was verified and accepted by the National Forestry Administration in 2014 (with data up to the end of 2013), and the 2020 forest data, for complex areas where field surveys are difficult to conduct and where there is poor network signal, making sampling challenging, drones are used to assist in sampling. ArcGIS 10.4 software is utilized to check, summarize, and merge the field sampling data, along with additional samples obtained from drone image. The sampling results are divided into training samples and validation samples in a 7:3 ratio. In this study, vegetation types are classified into 11 categories, with the specific classification system and its image characteristics detailed in Table 2.
Table 2. Mountainous vegetation classification system and sampling results.

2.2.5. Preprocessing

The four remote sensing images used in this study have high imaging quality, with no cloud cover in the study area, eliminating the need for cloud removal processing. The aerial data were provided by the Lianyungang Municipal Bureau of Natural Resources and Planning, have undergone orthorectification, and possess accurate spatial positioning and good imaging quality. Before fusing the WorldView-2 images, the 1.8 m resolution multispectral images were subjected to radiometric calibration, and atmospheric correction was performed using the FLAASH (Fast Line-of-Sight Atmospheric Analysis of Spectral Hypertubes) model. Subsequently, image fusion was conducted using Wavelet-PC transformation. The UAV data images and WorldView-2 images exhibit some spatial discrepancies with actual ground features, necessitating the collection of control points for geometric correction. In this study, aerial images from 2018 were used as the base image. Using the ENVI/Registration tool, 28 control points with the same names were selected for precise correction. A polynomial model algorithm was employed for geometric correction, with cubic convolution used for resampling, and the post-correction error was controlled within 0.5 pixels.

3. Research Methods

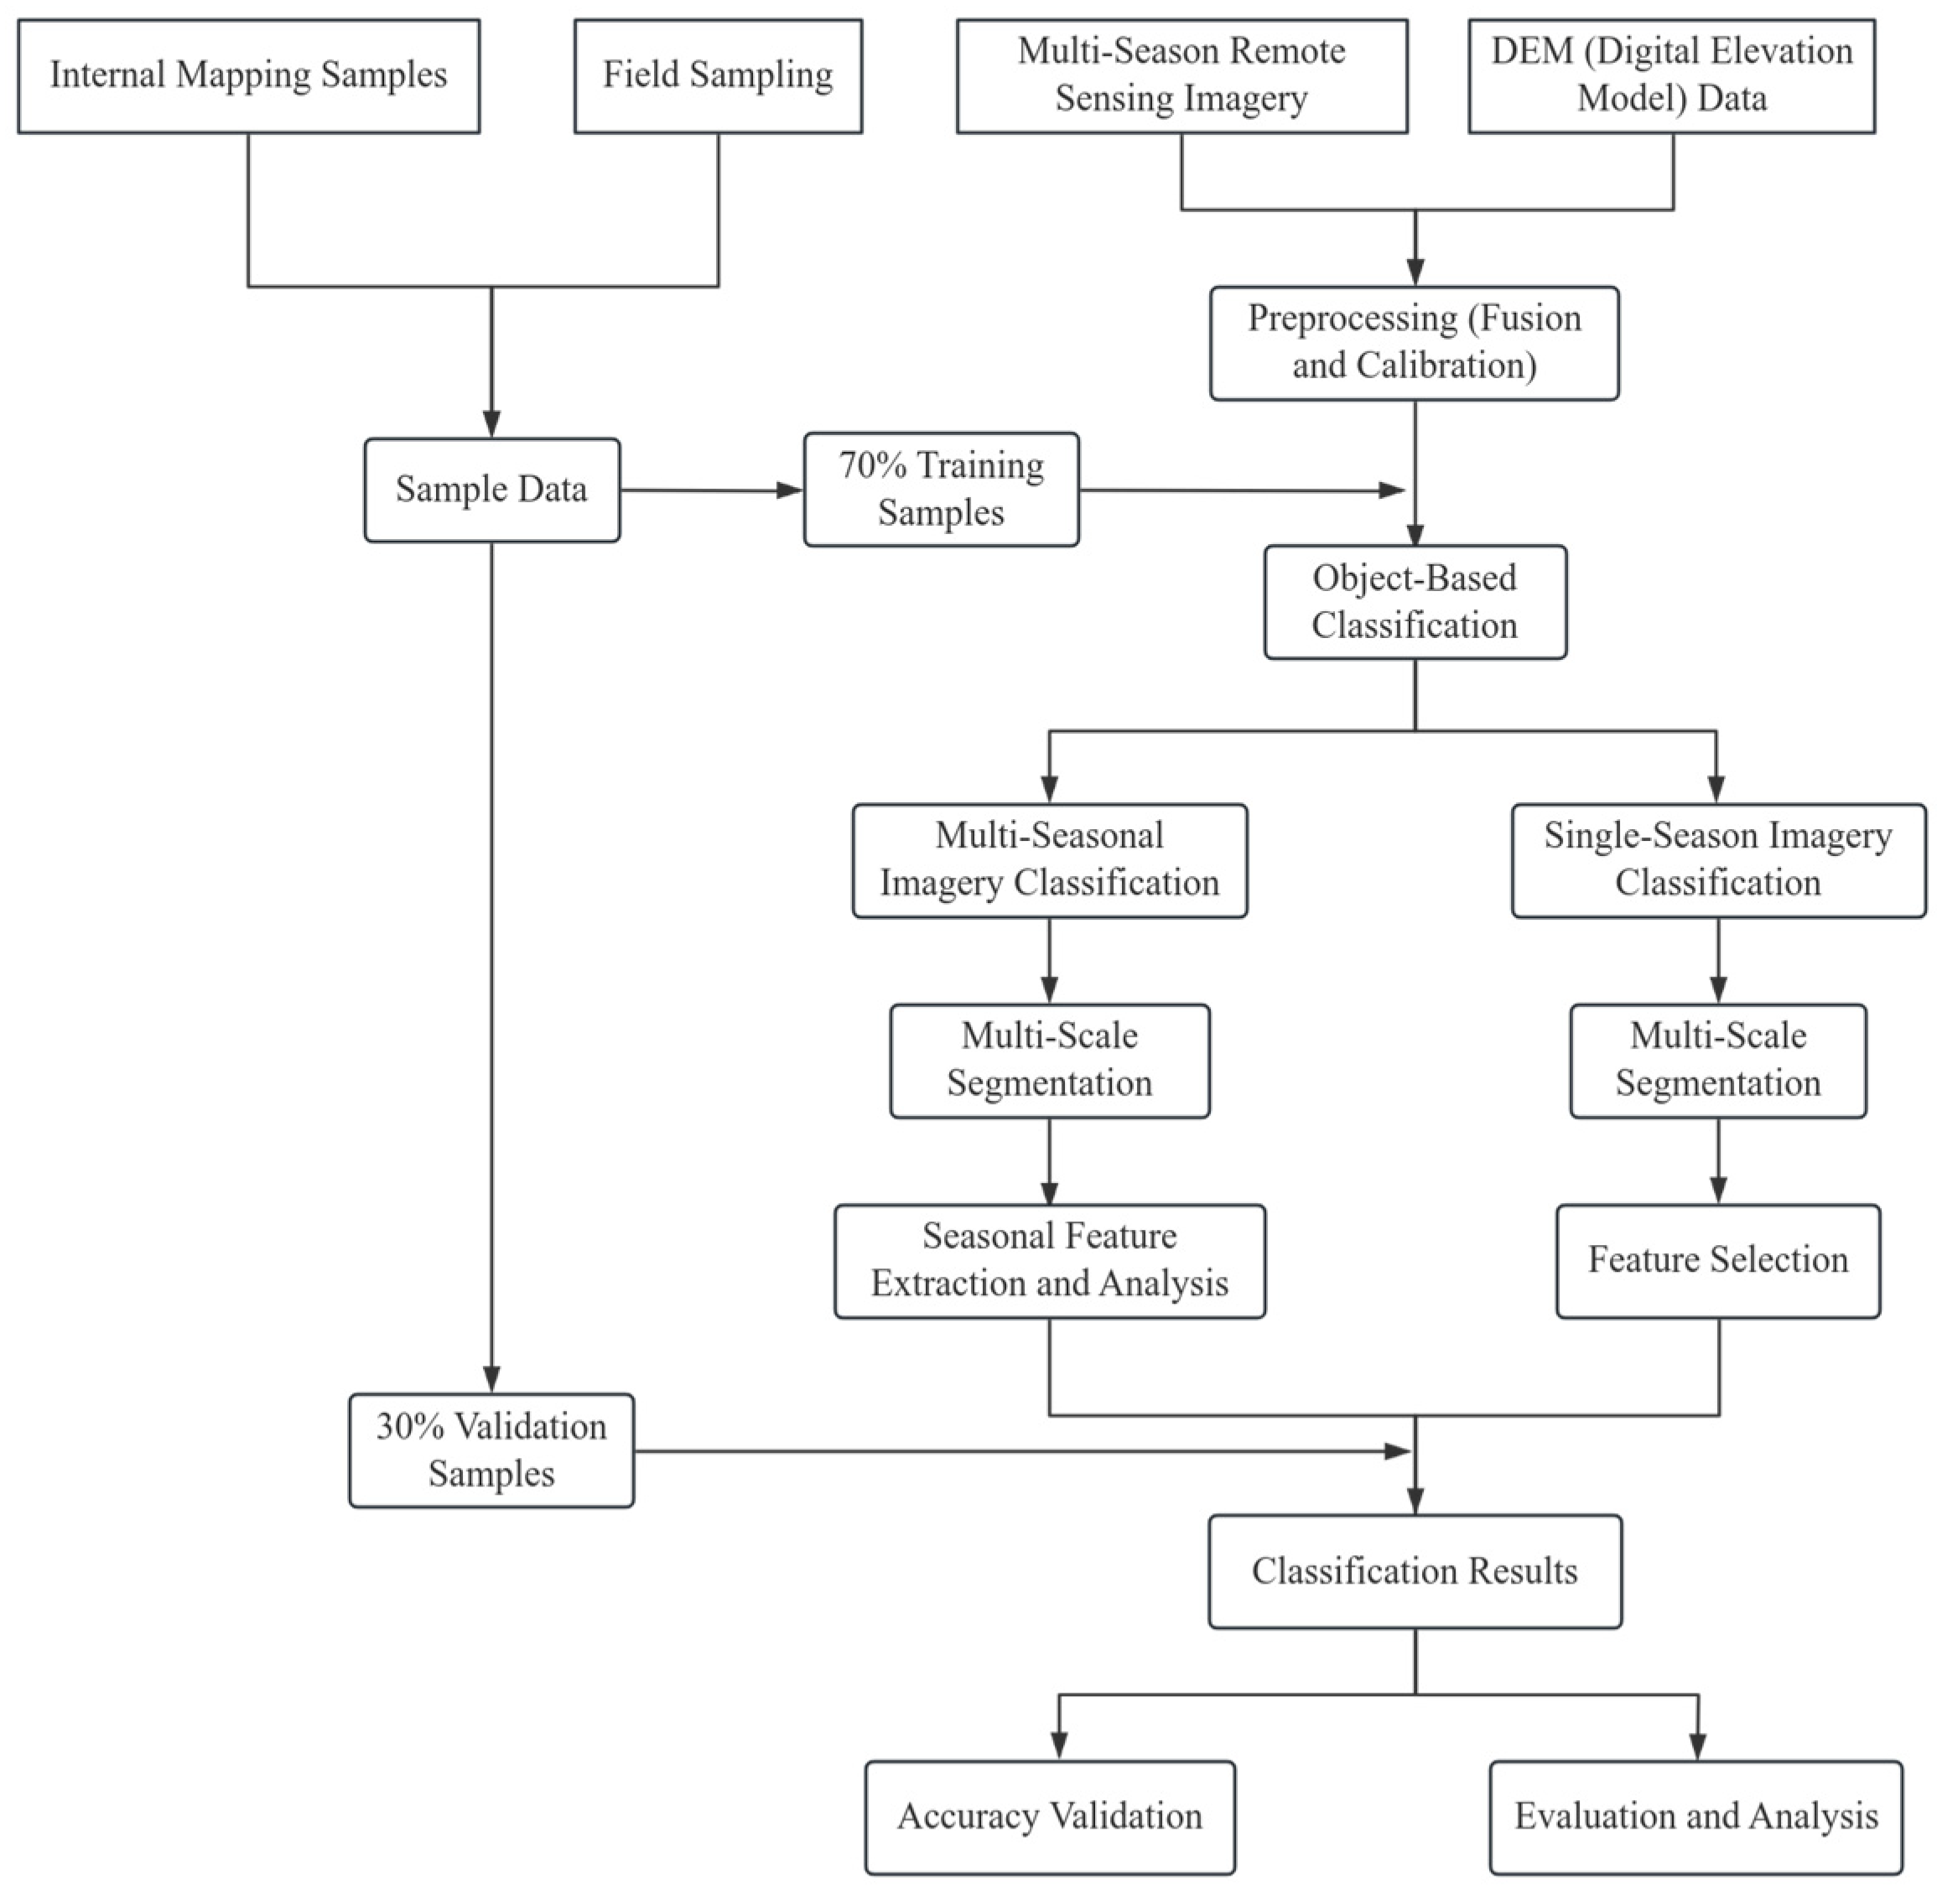
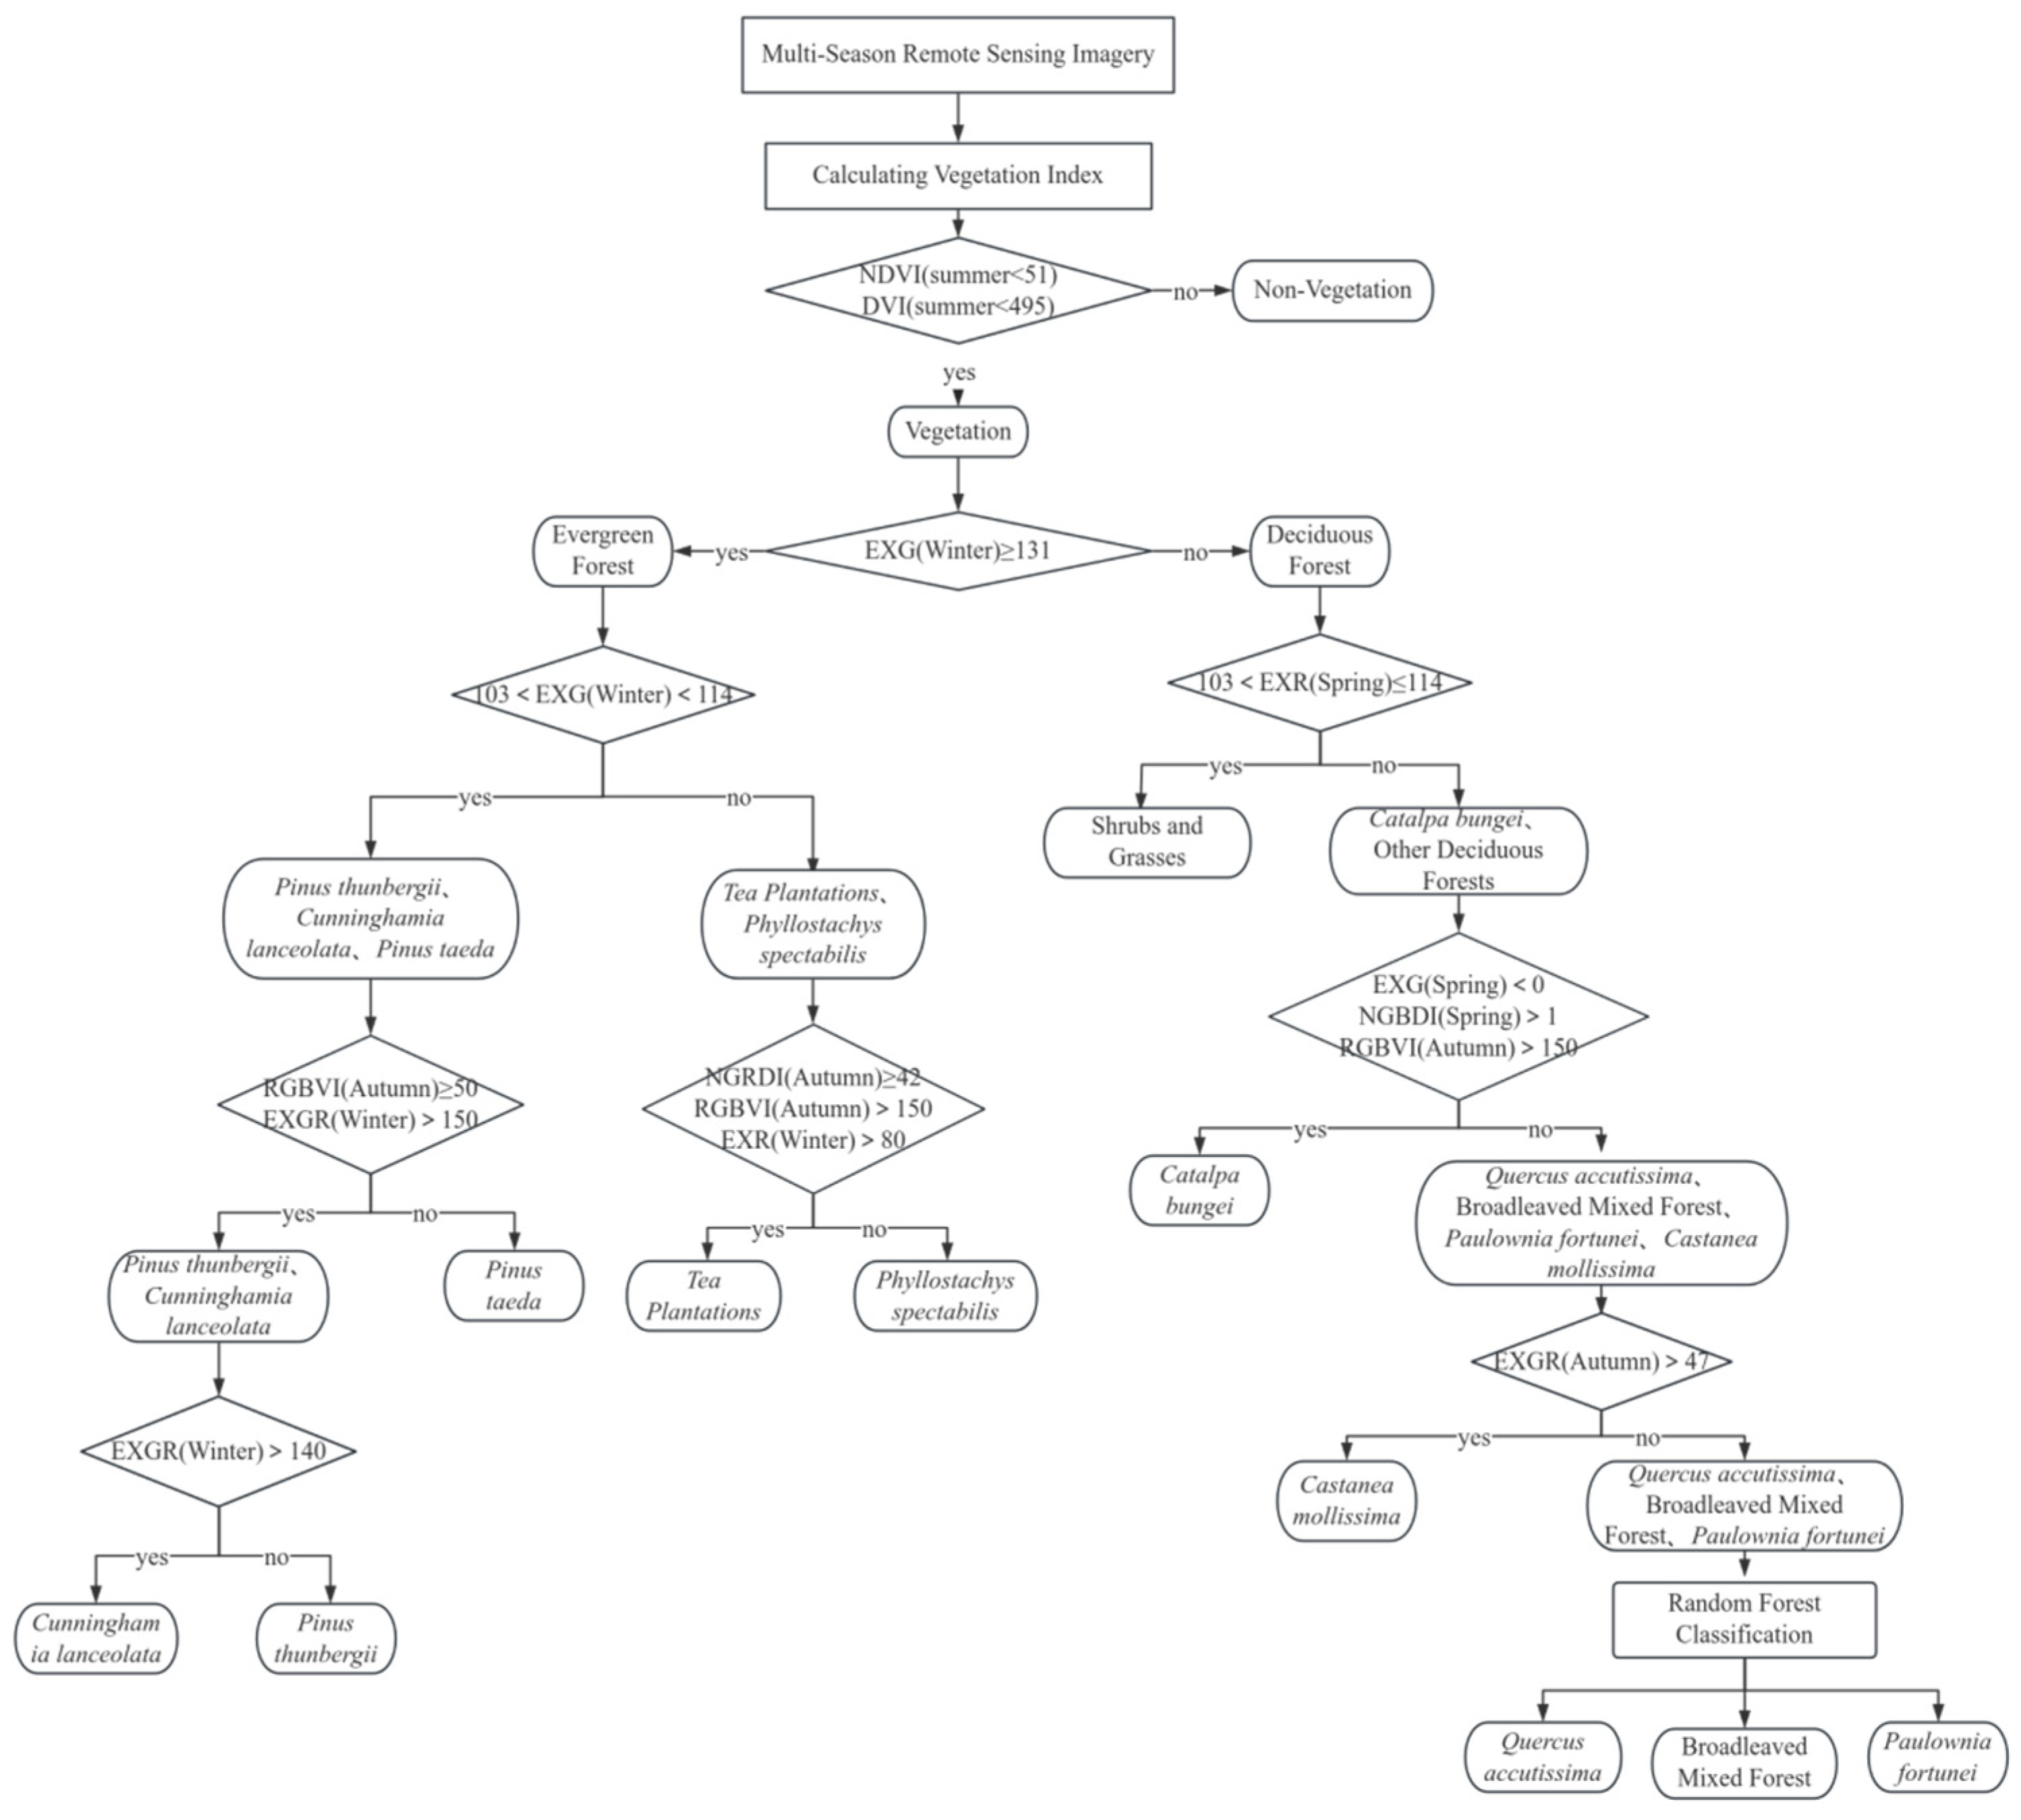
This study focuses on 11 typical vegetation types in Yuntai Mountain as the research subject. It combines stratified extraction based on phenological features of vegetation with object-oriented classification methods to obtain vegetation information for Yuntai Mountain. The study first analyzes the spectral characteristics of vegetation across various images, then extracts vegetation indices and textural features. Stratified extraction of vegetation is performed based on the differences in spectral indices exhibited by the vegetation in different seasonal phases. For vegetation that cannot be stratified based on phenological feature differences, an object-oriented classification method is used for extraction. The classification results are then compared with the single-temporal classification results. The technical approach is illustrated in Figure 2.
Figure 2. Experimental flow chart.

3.1. Spectral Features

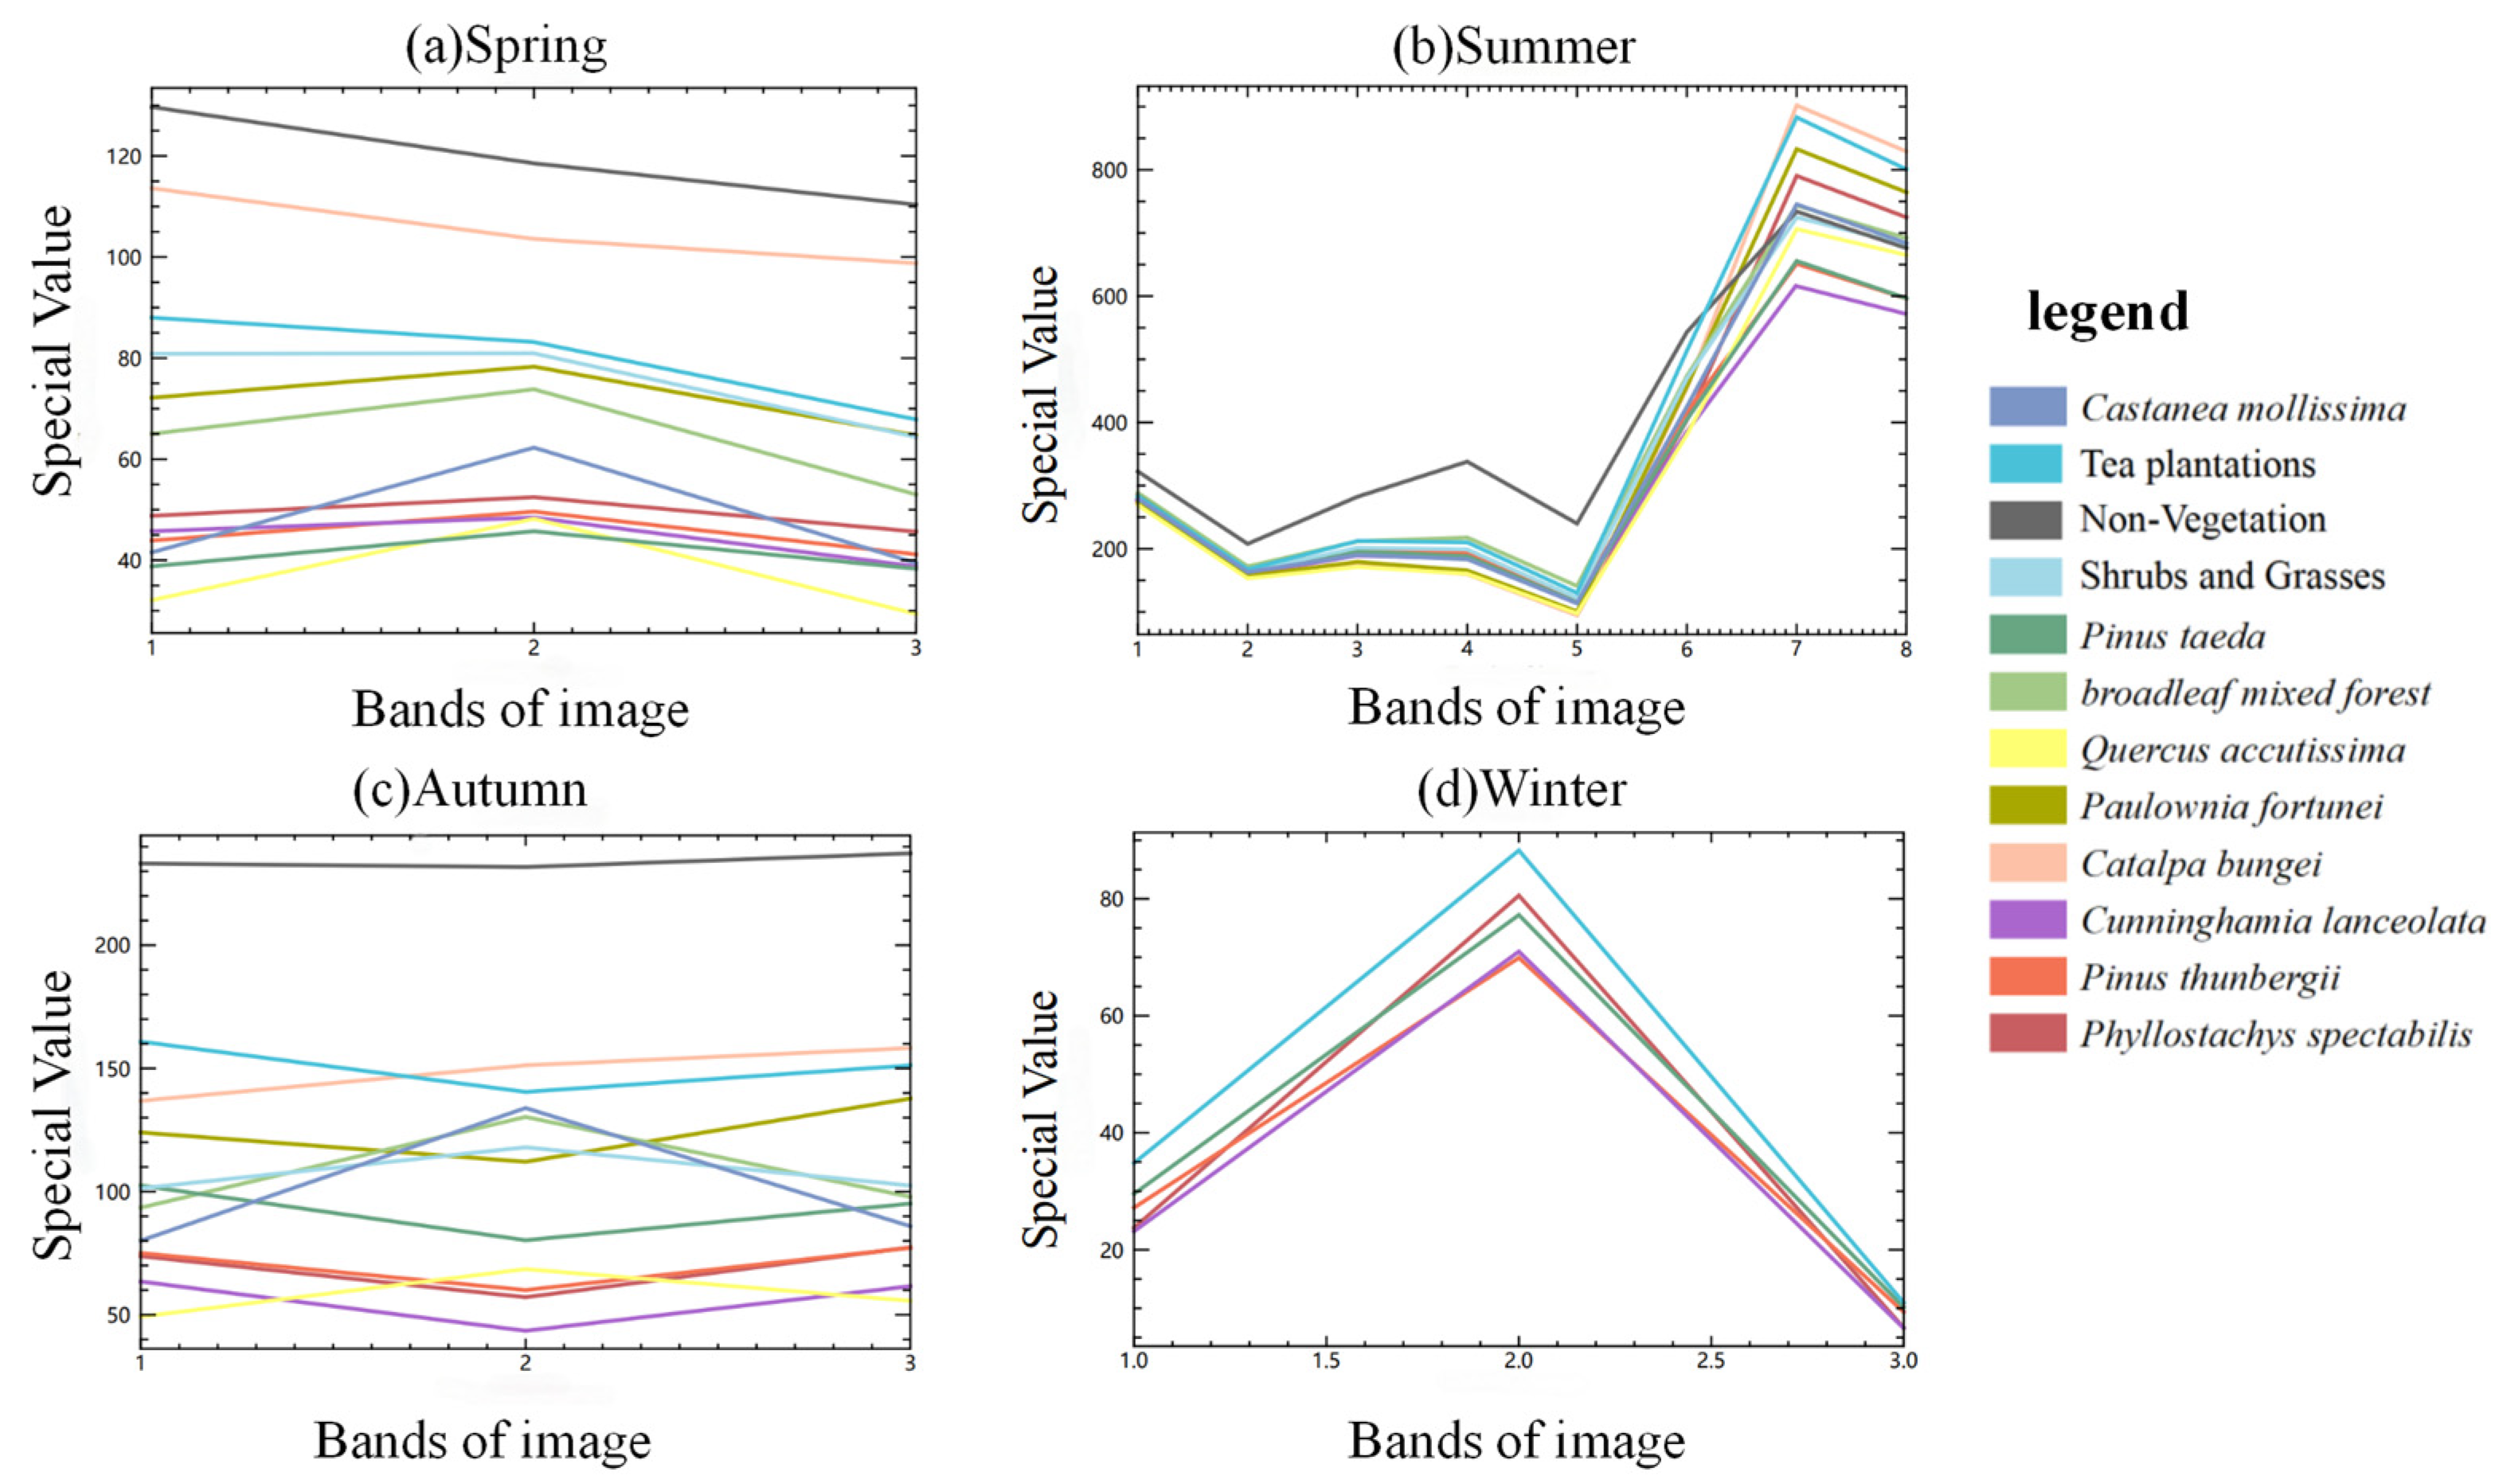
3.1.1. Band Spectral Features

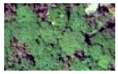
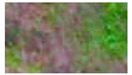
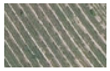
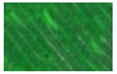
Vegetation exhibits spectral reflectance characteristics that are distinctly different from other typical land features, such as soil, water bodies, and buildings. Commonly used spectral features include mean, brightness, variance, and band gray ratios. Influenced by phenological features, each vegetation type shows significant changes in spectral features across different seasons due to variations in pigment content, leaf moisture content, and other factors. Consequently, the spectral differences of the same vegetation type change significantly in different seasons. Therefore, conducting spectral feature analysis on multi-temporal remote sensing data is essential for extracting vegetation type information for Yuntai Mountain.

3.1.2. Multispectral Image Vegetation Indices

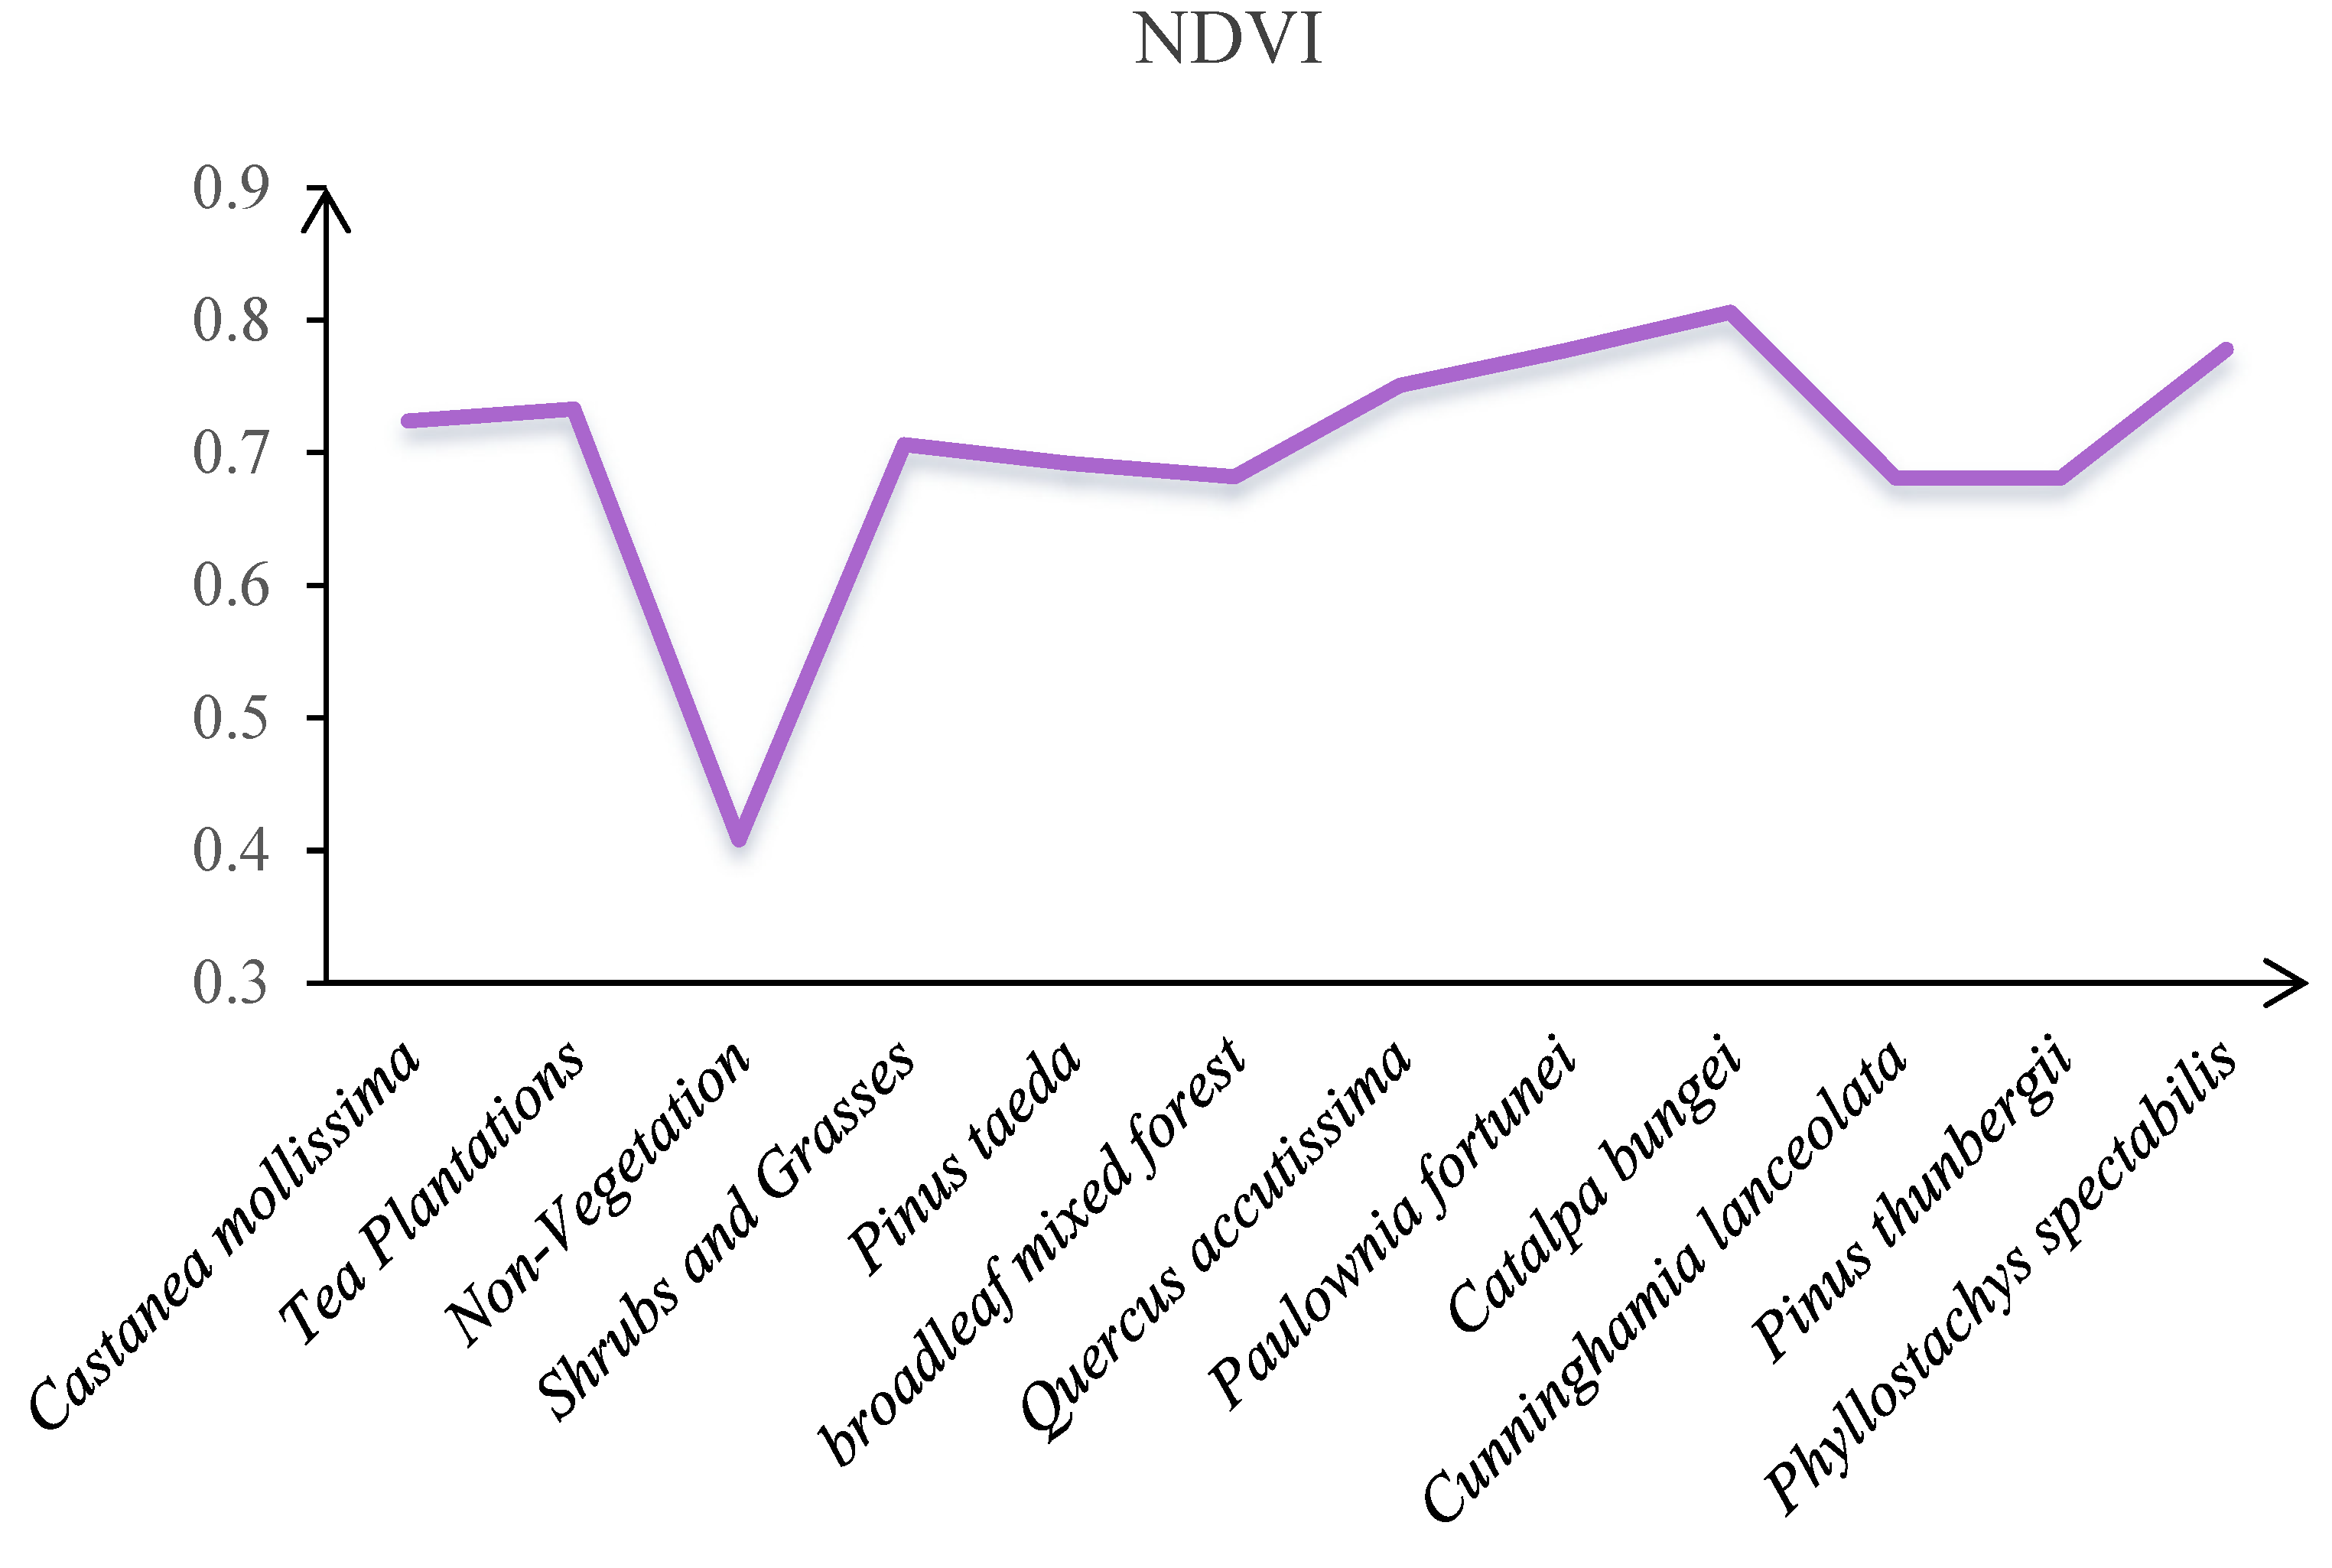
Similarly, vegetation indices are often used in studies for extracting information on different land cover types. Vegetation indices can qualitatively and quantitatively evaluate the health status and coverage of vegetation, and they exhibit clear temporal relevance. The vegetation indices of different seasonal vegetation types show certain differences. To enhance the reliability of vegetation information extraction for Yuntai Mountain, this study selects the Normalized Difference Vegetation Index (NDVI) [30] for extraction based on the summer image.

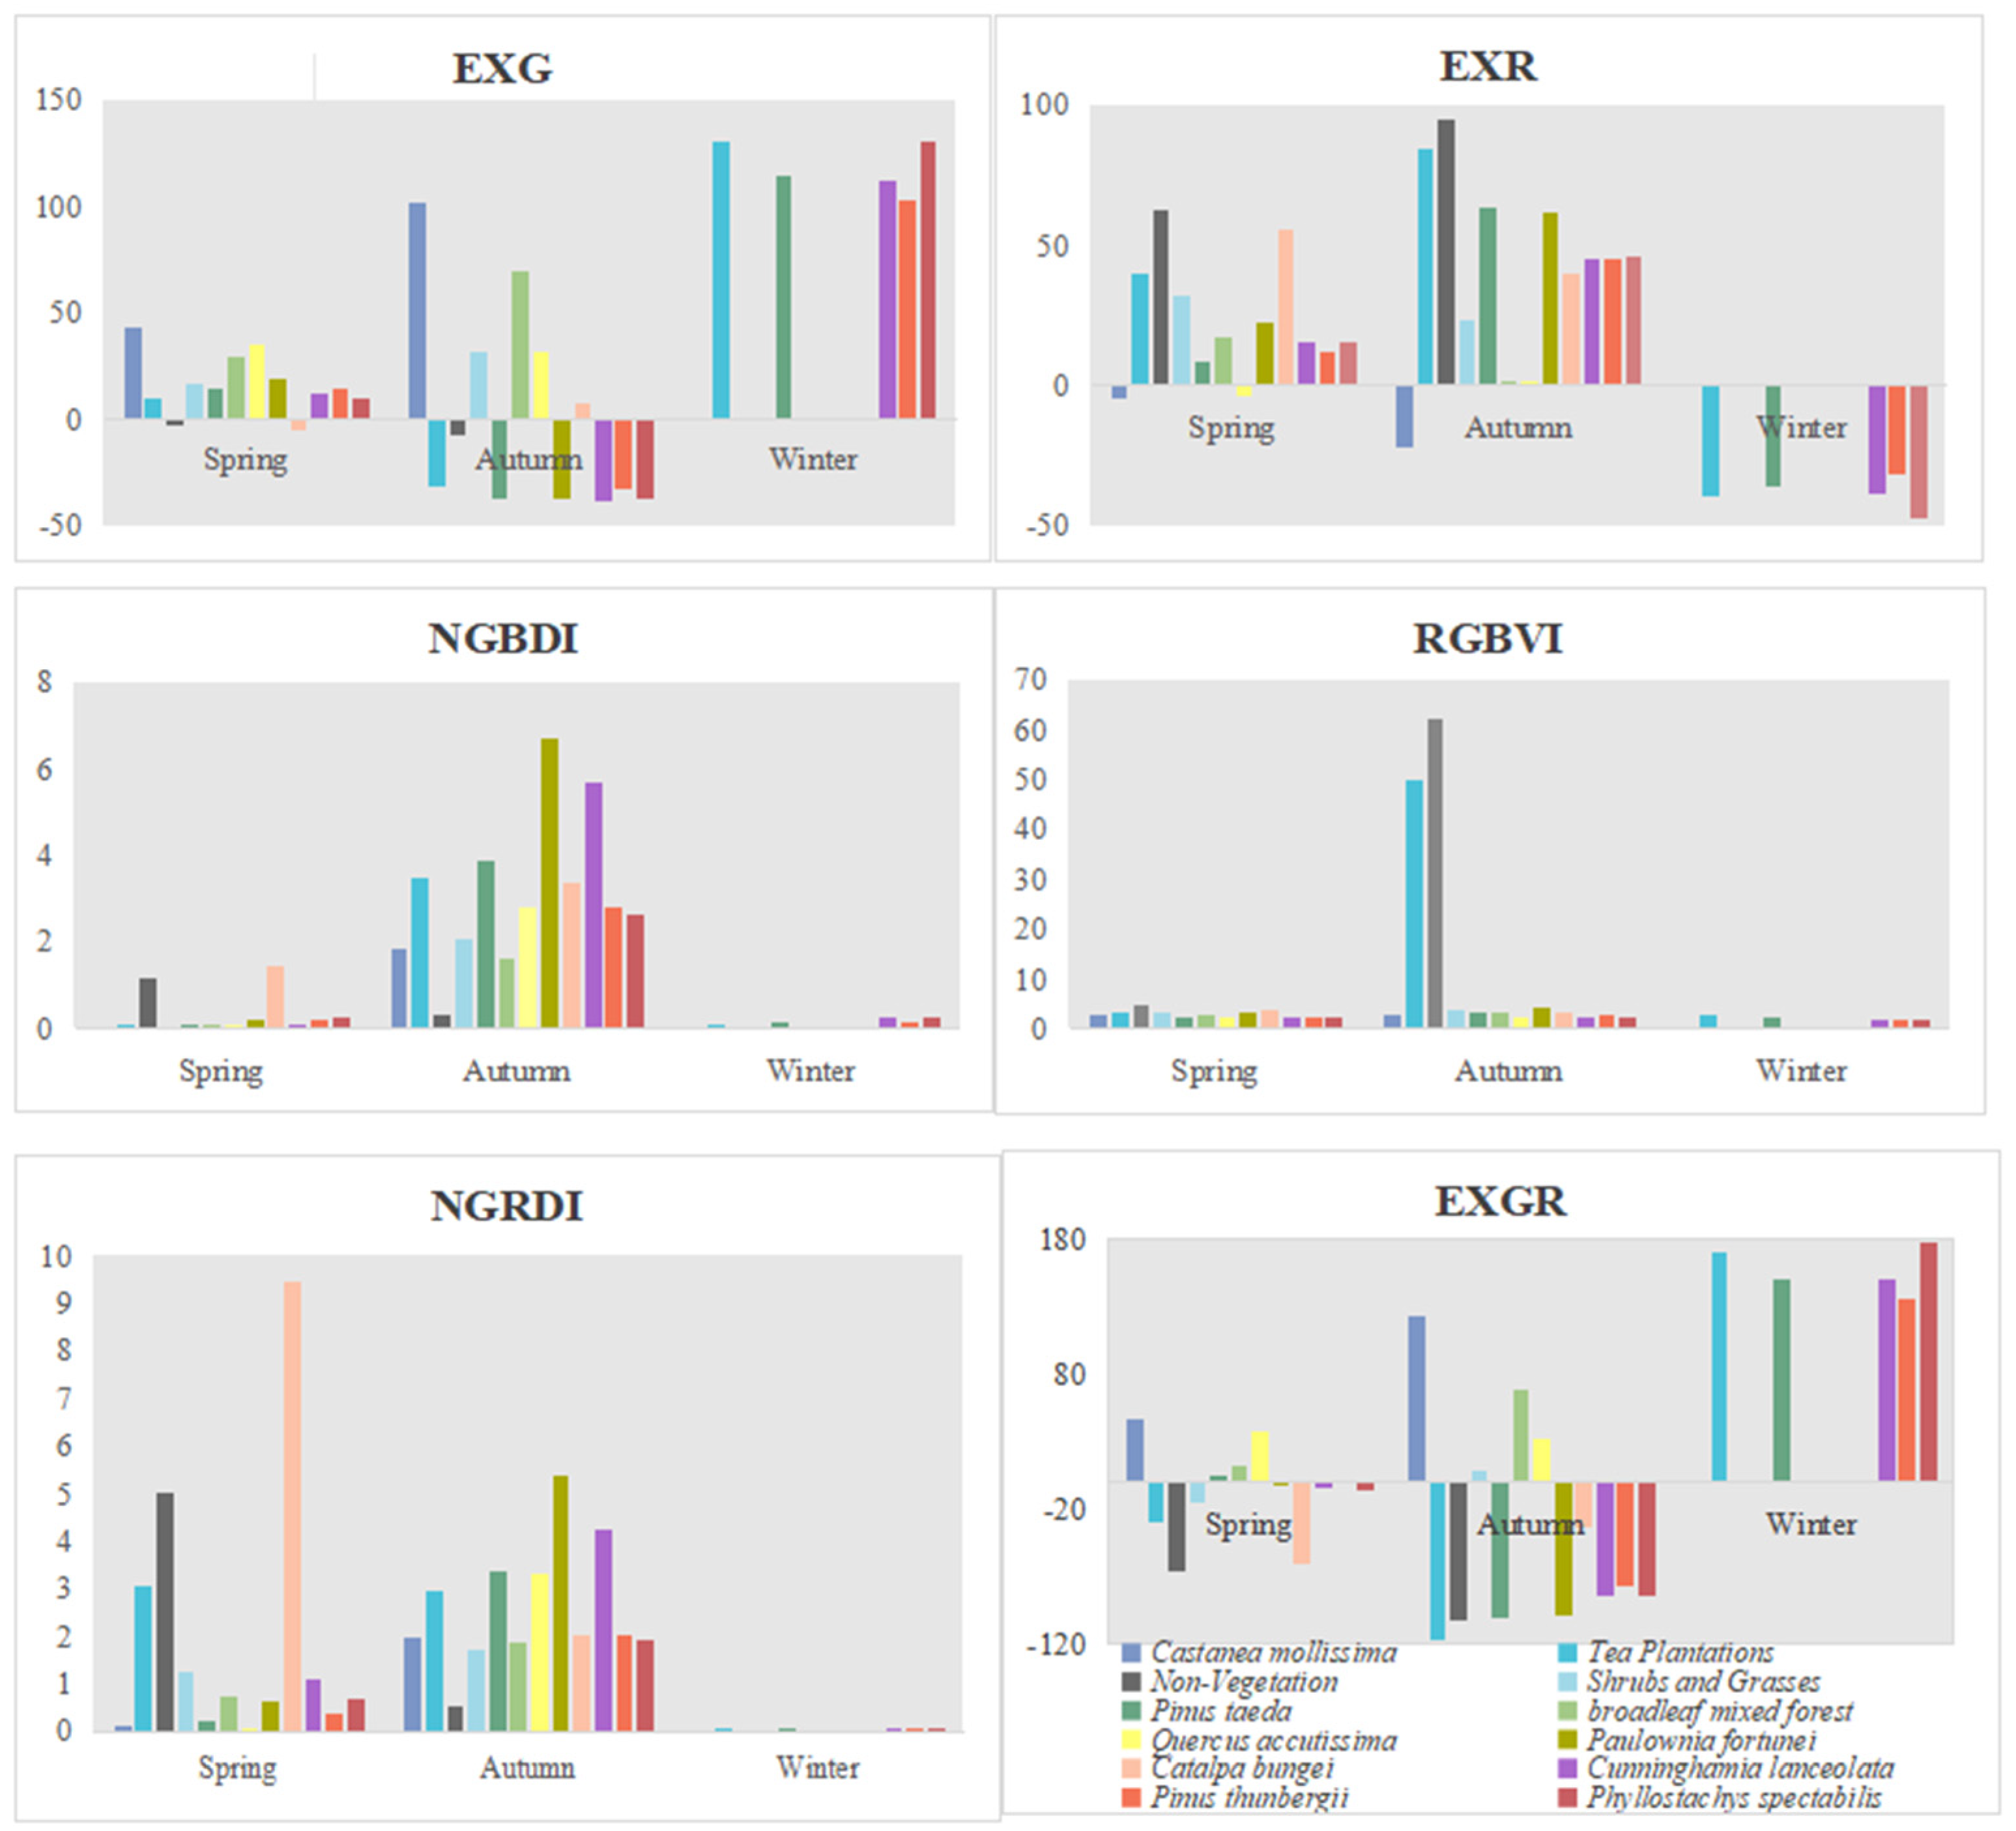
3.1.3. Visible Light Vegetation Indices

Since the aerial image used in this study only includes three visible light bands—red (R), green (G), and blue (B)—and lacks near-infrared bands, it is not possible to extract common vegetation indices. However, within the visible light range, the reflectance of different vegetation types varies across different bands. Therefore, researchers have combined operations on two or three bands to enhance the characteristics of a specific band, aimed at distinguishing different types of vegetation. Currently, commonly used visible light vegetation indices include the Normalized Green–Blue Difference Index (NGBDI), Excess Red Index (EXR), Excess Green Index (EXG), Red–Green–Blue Vegetation Index (RGBV), and Excess Green–Excess Red Difference Index (EXGR), with the calculation formulas shown in Table 3 [31,32,33,34].
Table 3. Calculation formula of visible light vegetation index.

3.2. Object-Oriented Multi-Scale Segmentation

3.2.1. Multi-Scale Segmentation Based on Multi-Temporal Image Classification

Unlike traditional pixel-based classification methods, object-oriented classification approaches process image objects as the fundamental units, which are obtained through scale segmentation. Multiscale segmentation can take into account both the macroscopic and microscopic features of land cover, effectively utilizing the spectral and texture information of high-resolution remote sensing image to achieve better extraction results. Therefore, the concept of multi-scale segmentation is widely applied in experiments for extracting various types of land cover. Commonly used segmentation parameters in multi-scale segmentation include segmentation scale, shape factor, and compactness.
Stratified extraction of vegetation information requires careful consideration of the shape and distribution of classification targets, as well as the size of the coverage area. Vegetation areas are a key focus of the study, with widespread coverage in the research area. At a larger scale, it is possible to effectively segment the vegetation range while also fairly completely separating non-vegetated areas. Based on the vegetation segmentation, multiple tests confirmed that a segmentation scale of 150 effectively extracts the range of evergreen forests in winter image. The evergreen forest vegetation is relatively dispersed in the study area, and a smaller segmentation scale can isolate the sporadically distributed Pinus thunbergii. The deciduous forests identified through decision tree classification include Catalpa bungei and Castanea mollissima. The distribution range of these two types of vegetation in the study area is relatively small, and tests revealed that a scale of 50 effectively segments the small range of Catalpa bungei. Specific segmentation parameters are shown in Table 4.
Table 4. Stratified division parameters.

3.2.2. Multi-Scale Segmentation Based on Single-Temporal Image Classification

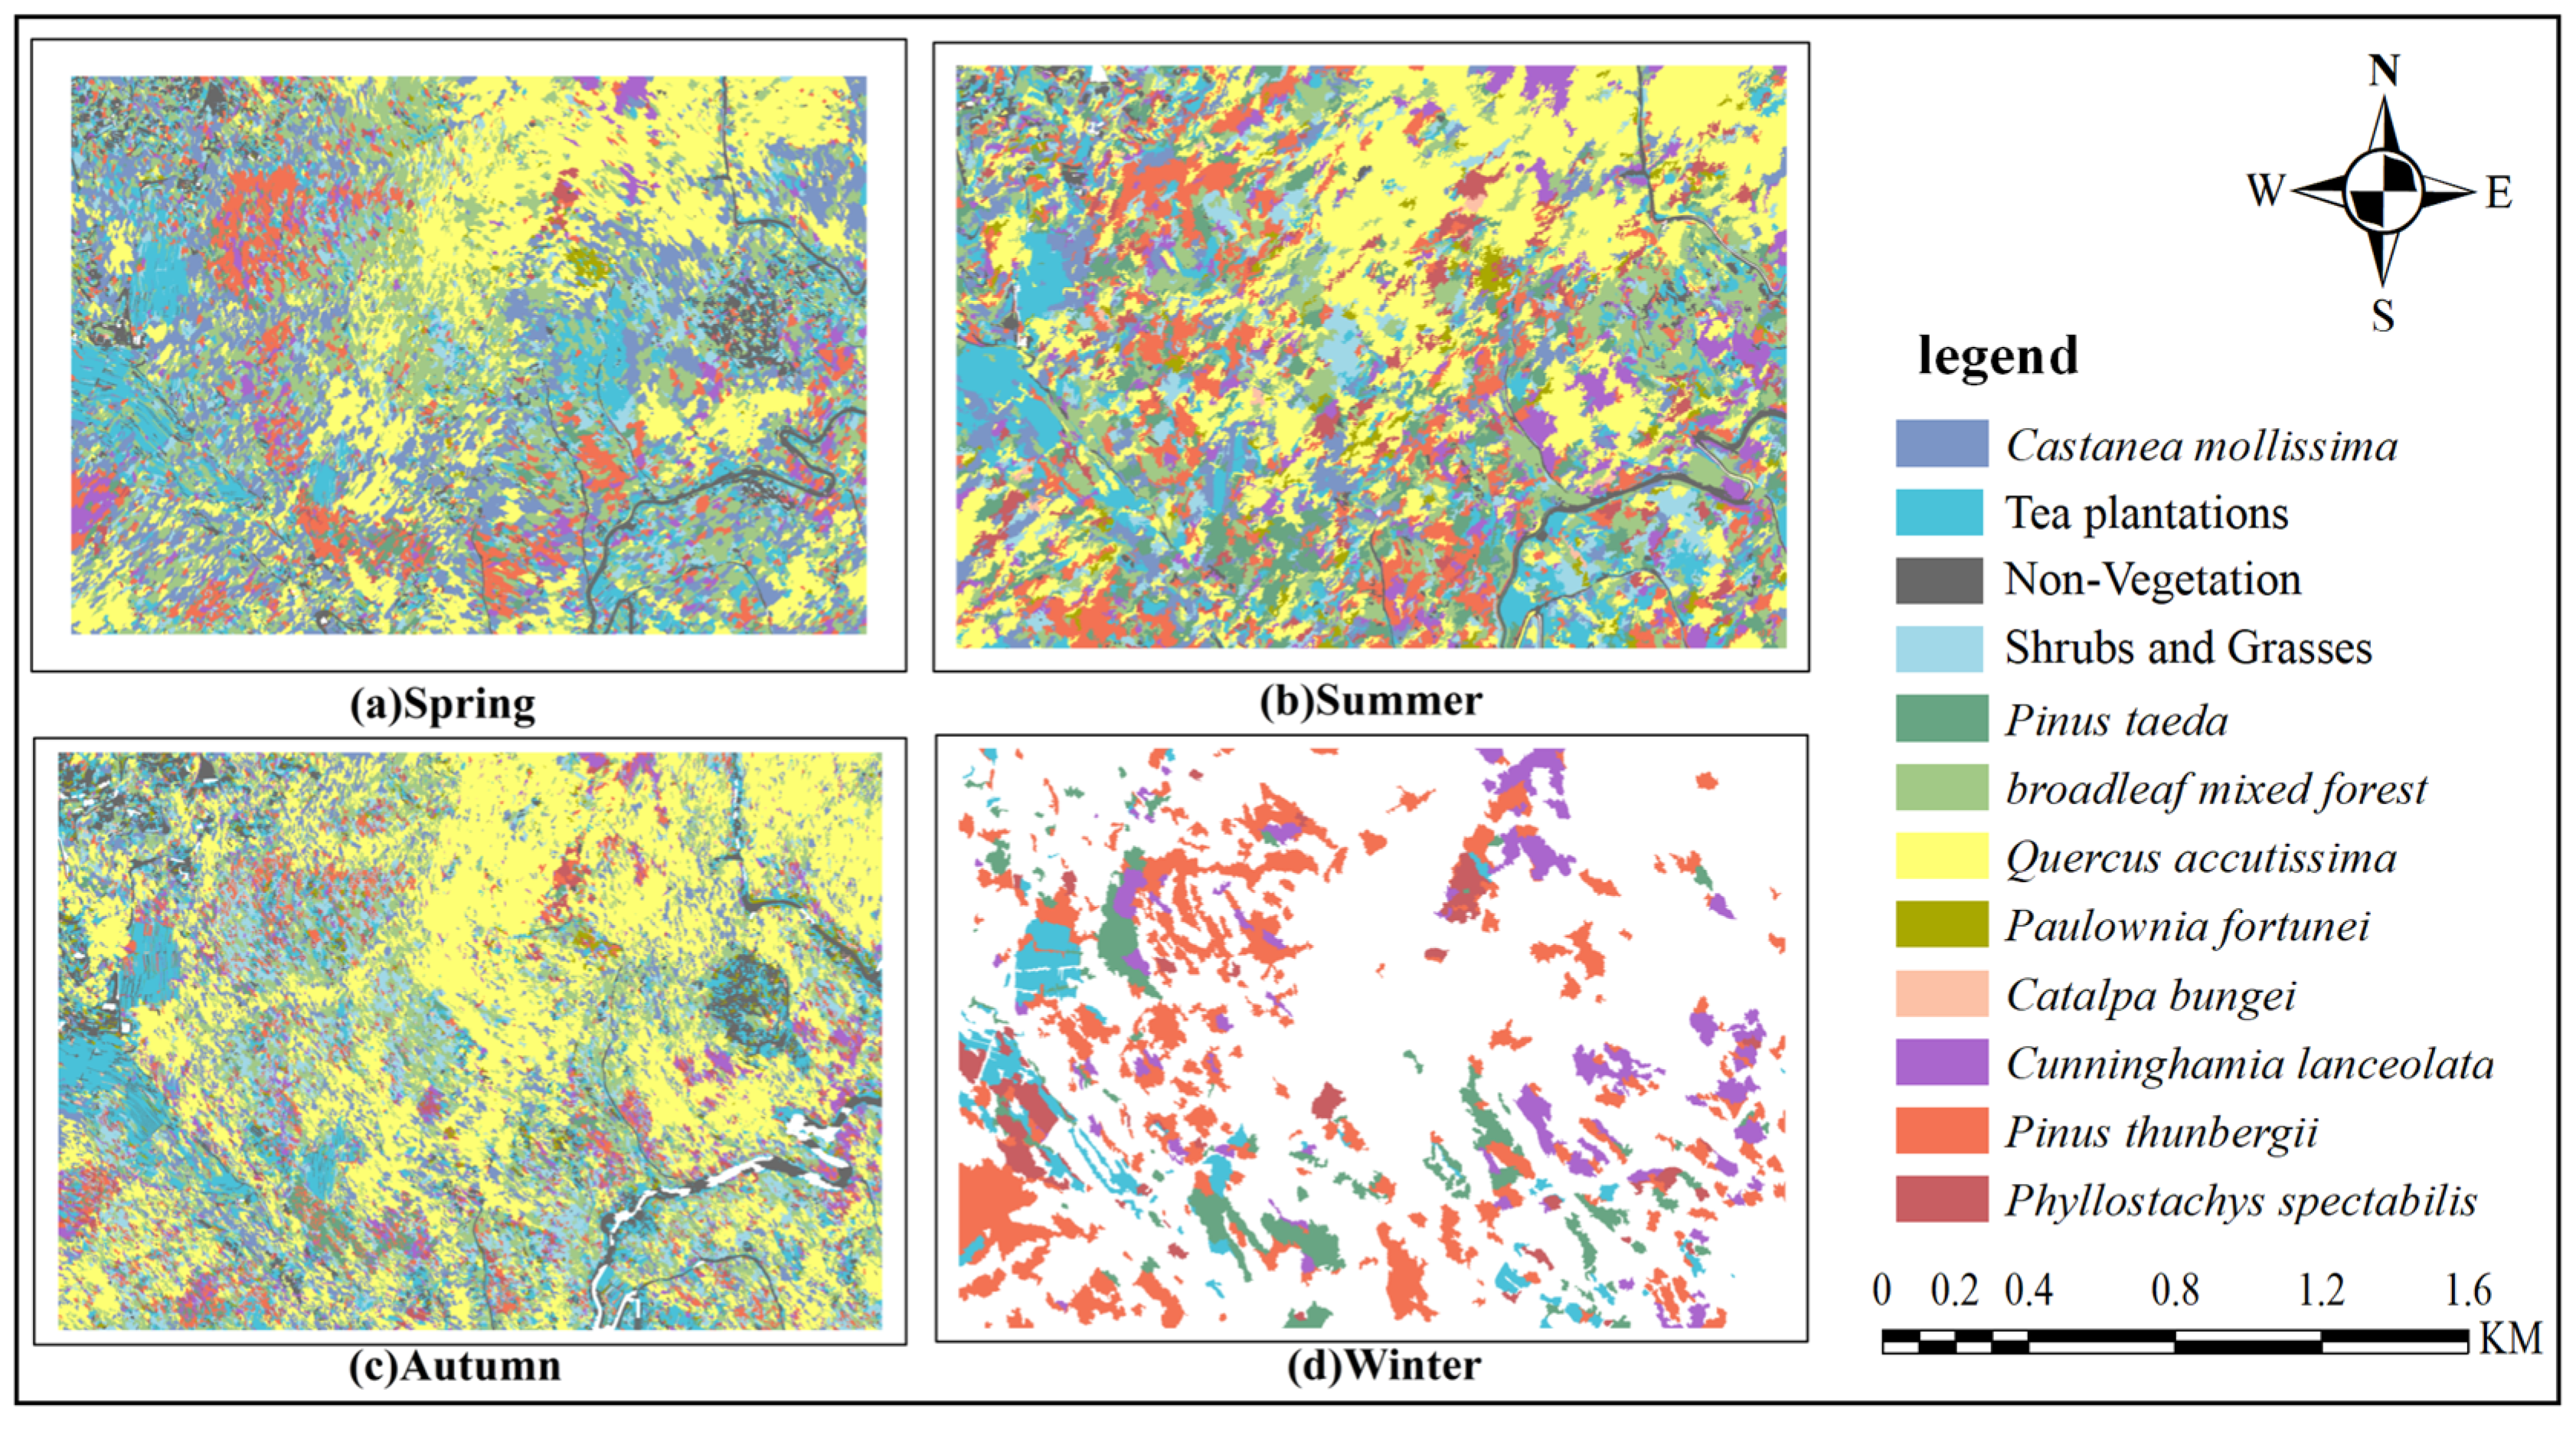
Before conducting vegetation classification, the four sets of images are first subjected to multiscale segmentation. Experiments show that with a shape factor of 0.3 and compactness of 0.5, six scales of 50, 60, 70, 80, 90, and 100 are set for image segmentation. As shown in Table 5, for the spring image, a segmentation scale of 60 effectively separates the main vegetation types, such as Cunninghamia lanceolata and Quercus acutissima. In the summer image, due to the lush growth of vegetation during this seasonal phase, the separability between different vegetation types is low. At a segmentation scale of 80, the roads are completely segmented without fragmentation, and the segmentation results among different vegetation types are satisfactory. In the autumn image, the Catalpa bungei are in bloom, appearing as white circular shapes; at a segmentation scale of 80, they are effectively extracted. For the winter image, which captures only the evergreen portion, comparisons of segmentation effects at different scales reveal that a segmentation scale of 60 effectively extracts sporadically present evergreen vegetation, such as Pinus thunbergii and Pinus taeda.
Table 5. Image segmentation parameters and effects.

3.3. Feature Selection

Due to the diversity and complexity of vegetation in mountainous areas, if the number of selected feature combinations is too small during classification experiments, it becomes difficult to adequately represent the information among different vegetation types, resulting in unsatisfactory classification outcomes. Conversely, if too many feature combinations are selected, it can lead to data redundancy and impose significant operational pressure on the classifier. Therefore, by applying certain computational rules for feature selection, the optimal feature combinations for different images and segmentation scales can be identified. This approach is expected to alleviate the operational pressure on the classifier and reduce time costs while achieving better classification results.
This study selected a total of 20 spectral features, including Mean, Mode, Quantile, Standard Deviation, Skewness, Hue, Saturation, and Intensity. Additionally, 14 textural features were chosen for experimentation, including GLCM Homogeneity, GLCM Dissimilarity, GLDV Entropy, and GLDV Mean. The total number of spring images is 34, summer images is 79, autumn images is 32, and winter images is 34. Using the feature space optimization tool provided by eCognition 9.0, the most suitable feature combinations for classifying vegetation in Yuntai Mountain were selected. Feature Space Optimization is a tool that finds the optimal combination of classification features within a nearest-neighbor classifier by comparing the features of selected classes to identify the feature combinations that produce the maximum average minimum distance (Maximum Separation) between samples of two different classes.

3.4. Vegetation Classification Methods

3.4.1. Decision Tree Model

Decision trees are a commonly used supervised classification method that are easy to understand and implement. During the implementation process, operators do not need extensive background knowledge, allowing for relatively quick attainment of satisfactory classification results. This method is widely applied in remote sensing classification, particularly for land cover classification based on multiple remote sensing images. For regions with widespread distribution and diverse land cover types, the object-oriented CART decision tree method can efficiently achieve good classification results. Yao Bo [35] compared the effectiveness of maximum likelihood, object-oriented nearest-neighbor, and CART decision tree methods based on multi-scale segmentation. The results indicated that the decision tree method is well-suited for extracting vegetation information in coastal wetlands. Additionally, due to the differences in spectral characteristics of vegetation across different seasons, Lei Guangbin [36] designed five classification strategies for vegetation information extraction using the object-oriented CART decision tree method based on multi-source and multi-temporal remote sensing images. The above studies indicate that, in response to the differences in spectral characteristics of vegetation across different seasons, hierarchical extraction using decision tree classification can quickly yield satisfactory classification results. Therefore, this paper constructs a CART decision tree to implement hierarchical classification of vegetation in Yuntai Mountain based on the eCognition 9.0 platform.

3.4.2. Random Forest Model

Random Forest is a classifier that consists of multiple decision trees. It creates random vectors from the input data and then builds multiple decision trees based on these random vectors, ultimately forming a combined decision tree. Random Forest can quickly process a large number of input variables while effectively balancing errors, making it widely used in vegetation classification. Berhane [37] based on high-resolution satellite imagery, compared the classification performance of a complete set of non-parametric classifiers, including Decision Tree (DT), Rule-Based (RB), and Random Forest (RF). The results indicate that although all classifiers appear to be suitable, the RF classification method outperformed both the DT and RB methods, achieving an overall accuracy (OA) greater than 81%. Zhang [38] implemented information extraction of coastal wetlands based on GF-3 polarized SAR imagery using an object-oriented Random Forest algorithm. The classification method with optimal feature combination achieved an accuracy exceeding 90%.

4. Research Results

4.1. Spectral Feature Analysis

4.1.1. Analysis of Spectral Features Across Different Image Bands

Figure 3a–d represent the spectral characteristics of the main vegetation types in the spring, summer, autumn, and winter images. As shown in Figure 3a, the spectral characteristics of Catalpa bungei in spring differ significantly from those of other vegetation types, while the spectral curves of Cunninghamia lanceolata and Pinus thunbergii nearly overlap. In Figure 3b, summer image shows that Cunninghamia lanceolata, Pinus taeda, Pinus thunbergii, and deciduous forests exhibit distinct ‘peak-valley’ characteristics in their spectral responses, appearing in the Near Infrared 1 band (Band 7) and the Red band (Band 5). Different vegetation types display a pronounced ‘spectral similarity among different species’ phenomenon, indicating that non-vegetation and vegetation types differ. This suggests that using only spectral characteristics in summer imagery makes it difficult to achieve effective vegetation classification, necessitating the integration of multi-temporal characteristics or other image features. In Figure 3c, overall, the spectral differences among vegetation in this image are quite evident; however, the spectral characteristics of broadleaf mixed forests and Castanea mollissima, Pinus thunbergii, and Phyllostachys spectabilis nearly overlap, indicating that using only spectral features for classifying broadleaf mixed forests, Castanea mollissima, Pinus thunbergii, and Phyllostachys spectabilis in autumn image is challenging. In Figure 3d, although only evergreen forest vegetation is retained in the winter image, the trends of these evergreen vegetation types are consistent. The Tea plantations, affected by the surface cover context, shows differences from other evergreen forest types.
Figure 3. Spectral curves of vegetation in different images.
Subsequently, the use of band ratios, differences, and other vegetation indices will be employed to accurately extract the extent of evergreen forests and Catalpa bungei. The differences in the spectral response characteristics and variation orders of these vegetation types across different seasonal phases should be considered important classification criteria.

4.1.2. Analysis of Seasonal Features of Different Vegetation Types

By analyzing the differences in vegetation indices across different seasons, it becomes apparent that it is challenging to effectively extract the unique and sparsely distributed Catalpa bungei when their spectral characteristics are extremely similar to those of other vegetation types (Figure 4). However, the spectral characteristics of Catalpa bungei are most distinct in spring during their flowering period, making this the ideal time to extract their range. In summer, due to the high coverage of vegetation and the significant spectral similarity among different types, it is difficult to extract various vegetation types from the image. However, since the Tea plantations do not have any bare ground, NDVI calculations can effectively differentiate between vegetation and non-vegetation areas in this image (Figure 5).
Figure 4. Analysis diagram of seasonal characteristics of vegetation in spring, autumn, and winter.
Figure 5. Analysis of vegetation summer NDVI characteristics.
Observations reveal that the EXR and EXGR indices of Castanea mollissima in autumn are significantly different from those of other vegetation types. In the winter image, the absence of deciduous tree interference allows for effective extraction of evergreen forest and deciduous forest extents, with Pinus thunbergii showing the highest EXGR index during this season. Although the spectral characteristics of vegetation vary across different seasons, some individual vegetation types remain difficult to distinguish solely based on spectral differences.
Table 6 introduces the vegetation types with distinct phenological features in different image. The vegetation classification will be based on these features to design the technical workflow and complete the image classification.
Table 6. Description of spectral characteristics of vegetation.

4.2. Feature Selection Results

4.2.1. Spring Image

Through experimentation, it was found that for spring image, at a segmentation scale of 60, the separability is best in a 31-dimensional feature space. The dimension (Dimension) indicates the number of features in the optimal feature combination. The selected best feature combination is shown in Table 7:
Table 7. Optimal feature combination for the spring image.

4.2.2. Summer Image

For the summer image, at a segmentation scale of 80, the separability is best in a 48-dimensional feature space. The selected best feature combination is shown in Table 8:
Table 8. Optimal feature combination of summer image.

4.2.3. Autumn Image

For the autumn image of 2018, at a segmentation scale of 80, the separability is best in a 13-dimensional feature space. The selected best feature combination is shown in Table 9:
Table 9. Optimal feature combination for the autumn image.

4.2.4. Winter Image

For the winter image, at a segmentation scale of 60, the separability is best in a 14-dimensional feature space. The selected best feature combination is shown in Table 10:
Table 10. Optimal feature combination for the winter image.

4.3. Vegetation Classification Results

4.3.1. Vegetation Classification Results Based on Multi-Temporal Images

Through the analysis of the spectral characteristic differences of vegetation in different seasons, this study designed the classification workflow shown in Figure 6. First, based on the summer image, vegetation is distinguished from non-vegetation areas. Then, the extent of evergreen forest vegetation is extracted from the winter image. Building on this, the range of shrubs and grasses is extracted from the autumn image. Within the known extent of evergreen forests, the spectral differences exhibited by vegetation in the autumn and winter images can effectively be used to extract the main types of evergreen forest vegetation in the study area.
Figure 6. Flow chart of layered extraction of multi-temporal vegetation.
Due to the low separability of Quercus acutissima, broadleaf mixed forests, and Paulownia fortunei, the extraction of these three vegetation types is performed using a Random Forest model that combines spectral and textural features. At this point, the stratified classification based on multi-temporal vegetation characteristics is complete. The results of the stratified classification based on multi-temporal features are shown in Figure 7, along with the accuracy assessment in Table 11.
Figure 7. Classification results of multi-temporal vegetation index.
Table 11. Evaluation table of classification accuracy of multi-temporal vegetation.
From Table 11, it can be seen that vegetation classification based on multi-temporal features achieves high accuracy. In the first layer of classification, visual interpretation effectively extracts non-vegetation areas within the study area. The Tea plantations, due to their low vegetation coverage, may be misclassified as non-building areas if classified directly; however, stratified extraction can alleviate this issue to some extent.
In the second layer of classification, the evergreen range identified from the winter image allows for a relatively accurate distinction between evergreen and deciduous forests, facilitating subsequent vegetation classification. Since the characteristics of evergreen forests are more pronounced in autumn compared to deciduous forests, the extraction of evergreen coniferous areas can lead to a better classification of various evergreen vegetation types based on the autumn aerial image and winter satellite image through a layered approach.
In the study area, deciduous forests are predominant, and both the area coverage and the variety of vegetation types are more complex compared to evergreen forests. Therefore, it is challenging to classify all deciduous forest vegetation using only spectral characteristics. The vegetation type of broadleaf mixed forests is quite complex, and their spectral and textural features are similar to those of other vegetation types, leading to significant misclassification and omissions during the classification process.
Additionally, since Paulownia fortunei occupies a relatively small area in the study region, it is difficult to classify effectively with only a few samples. There is also confusion between Paulownia fortunei and broadleaf mixed forests. Combining spectral features with textural features in the classification process can yield better accuracy. By integrating the multi-temporal characteristics of vegetation, the classification accuracies for Quercus acutissima, Tea plantations, Cunninghamia lanceolata, Pinus taeda, Phyllostachys spectabilis, Pinus thunbergii, and Castanea mollissima all reached over 90%, indicating a relatively ideal classification outcome.

4.3.2. Vegetation Classification Results Based on Single-Temporal Images

As shown in Table 12, during spring image, various types of vegetation are thriving, with overlapping and intermingling coverage, resulting in low separability among vegetation types. The overall accuracy is only 58.79%, with only Catalpa bungei, Quercus acutissima, and Tea plantations achieving relatively good extraction results.
Table 12. Accuracy evaluation of single-temporal vegetation classification.
In the summer image, all types of vegetation in the study area are fully grown, but the color differences between the various vegetation types are minimal, making this the period with the least distinguishable spectral characteristics among different vegetation types. The overall classification accuracy is poor, at only 61.52%.
The autumn image shows better classification accuracy at 72.36%, with the best results for Quercus acutissima, reaching 97%. The winter image primarily features five types of evergreen species: Phyllostachys spectabilis, Cunninghamia lanceolata, Pinus taeda, Pinus thunbergii, and Tea plantations. It is evident that the classification results for Cunninghamia lanceolata, Phyllostachys spectabilis, and Pinus taeda are very good, with Cunninghamia lanceolata achieving an accuracy of 86.02%. The classification accuracies for Pinus thunbergii and Tea plantations are both above 65%.
The experimental results indicate that selecting the leaf-off season, which eliminates the interference of deciduous vegetation, allows for effective extraction of evergreen forest areas in mountainous regions (Figure 8).
Figure 8. Classification results of single-temporal vegetation index.

4.3.3. Accuracy Comparison and Comprehensive Evaluation

Figure 9 shows the overall classification accuracy based on single-temporal and multi-temporal images. It is evident that the classification results based on multi-temporal images significantly outperform those derived from single-temporal images. This is particularly true for summer and spring images, where the high spectral similarity during the peak growing season makes it difficult to effectively extract the ranges of various vegetation types using only a single image. However, multi-temporal remote sensing data enhances the separability among vegetation types by utilizing different phenological features.
Figure 9. Image classification accuracy based on single-temporal and multi-temporal phase classification.
In the spring image, the overall classification accuracy does not exceed 60%, while the classification accuracy using multi-temporal remote sensing data reaches 89%. This represents a 30% improvement in overall classification accuracy, indicating that using multi-temporal phenological features for classification can overcome the limitations of single-temporal classification and effectively enhance image classification accuracy.
Analyzing Figure 10 and Figure 11, it can be observed that Catalpa bungei trees are rare in the study area, and their range cannot be extracted through spectral and textural features during non-flowering seasons. However, during the flowering period, they can be effectively extracted. While the spring aerial image can relatively effectively extract the range of small Catalpa trees, the classification results for other vegetation types with high spectral similarity, such as Castanea mollissima, Pinus thunbergii, shrubs and grasses, and broadleaf mixed forests, are poor. By integrating multi-temporal features, the classification accuracy for these vegetation types can be significantly improved.
Figure 10. Accuracy of vegetation producers based on single-temporal and multi-temporal classification.
Figure 11. Vegetation user accuracy based on single-temporal and multi-temporal classification.
In the winter image, the range of evergreen forest vegetation can be effectively extracted; however, extracting the range of deciduous evergreen forest vegetation requires the assistance of images from other seasons. The study area is predominantly composed of deciduous forests, making it difficult to extract smaller areas of evergreen forest vegetation, such as Pinus thunbergii, primarily found in shrub forms, during single-temporal classification. Winter image coincides with the leaf-off season, allowing for accurate extraction of the evergreen forest range. Pinus taeda is tall and appears in a pinkish-purple hue in the image, resembling the characteristics of Cunninghamia lanceolata and other pines. During single-temporal classification, Pinus taeda is easily misclassified as Cunninghamia lanceolata. However, integrating multi-temporal features significantly improves the classification accuracy between Pinus taeda and Cunninghamia lanceolata.
Due to the high spectral similarity between Castanea mollissima and Quercus acutissima and broadleaf mixed forests, it is easy to misclassify Quercus acutissima and broadleaf mixed forests as Castanea mollissima when using only a single image for classification. Verification against field survey results revealed that the extent of Castanea mollissima in the study area is relatively small, primarily distributed near the tea gardens. In contrast, the color differences of Quercus acutissima across different seasons are very pronounced; in the autumn aerial image, it appears gray-brown with a “cracked” texture, allowing it to be easily distinguished from the area of Castanea mollissima. In the study area, the range of Paulownia fortunei is relatively small, and its spectral similarity to broadleaf mixed forests is high. Using only spectral features makes it difficult to distinguish between the two. However, after incorporating textural features, the classification, while not yet achieving very ideal results, can fundamentally differentiate between the two.
In summary, based on classification accuracy as the evaluation criterion, the classification method using multi-temporal features is more suitable for extracting vegetation information in the Yuntai Mountain area of Lianyungang. Of course, depending on the specific needs and objectives of the classification, appropriate classification methods and image should be selected.

5. Discussion

Different vegetation types exhibit distinct spectral and morphological characteristics due to variations in ecological conditions, organizational structures, and seasonal phenology. Utilizing phenological differences to discriminate vegetation types remains a primary approach in vegetation remote sensing. This study leverages phenological characteristics across different growth stages to analyze and compare spectral features, vegetation indices, and textural features of vegetation types during specific periods. Features and thresholds capable of effectively distinguishing vegetation types were selected to achieve hierarchical extraction. The overall classification accuracy based on multi-temporal features showed a 16.74% improvement over the best single-temporal (autumn) classification result, with a Kappa coefficient increase of 0.19. This demonstrates that phenological characteristics can effectively enhance vegetation information extraction, aligning with conclusions from studies [39,40,41].
Cross-validation of vegetation classification accuracy was conducted using multi-temporal data from different remote sensing platforms. Autumn classification results based on DOM aerial images (OA = 72.36%, Kappa = 0.68) significantly outperformed spring images from the same platform (lowest OA). However, Catalpa bungei achieved the highest recognition accuracy in spring images, as its spring flowering and autumn leaf discoloration/senescence represent critical phenological events driving spectral separability for individual tree species. This observation corroborates findings from multi-temporal remote sensing studies [42,43,44], reaffirming the dominant role of phenological cycles in spectral distinguishability. Notably, winter UAV imagery with lower spatial resolution (0.5 m) achieved higher vegetation classification accuracy compared to higher-resolution spring imagery (0.2 m). Further research is required to verify whether the observed seasonal effects are confounded by scale variations introduced by platform switching. Although this study has demonstrated the improvement in vegetation classification through multi-temporal features, the following aspects of the methodology require further optimization:
(1)
From the perspective of segmentation parameters, this study conducts classification experiments based on an object-oriented classification method, where image segmentation is undoubtedly a crucial step. Although this study performed a comparison of segmentation effects at multiple scales, the evaluation was based solely on visual comparisons without using quantitative metrics to assess the quality of segmentation. Future research will conduct more in-depth experiments from the perspective of segmentation quality effectiveness.
(2)
From the perspective of classification accuracy, this study finds that the classification accuracy for broadleaf mixed forests is relatively low. The spectral differences of broadleaf mixed forests across different seasons are minimal, making it difficult to effectively extract their extent using only spectral and texture information. Therefore, improving the classification accuracy for this vegetation type requires further exploration. At the same time, the classification schemes and strategies for small areas may not be fully applicable to large-area vegetation classification. Therefore, it is advisable to consider future research on vegetation classification at a larger scale.

6. Conclusions

This study is based on high-resolution remote sensing image from four different periods and sensor platforms. The objectives are (1) to explore a technique suitable for integrating multi-temporal and different sensor images for the refined classification of mountainous vegetation; and (2) to identify which datasets and which seasonal images yield the best accuracy for mountainous vegetation classification. Through this research, the study arrives at the following conclusions:
(1)
Our November autumn images successfully captured variations in the spectral characteristics of different vegetation types. For instance, the super red index and the super green minus super red differential index for Castanea mollissima were significantly different from those of other vegetation types in the autumn image. The BGBDI index for Pinus taeda was highest in autumn, showing a clear distinction from other evergreen forest vegetation. Additionally, the RGBVI and EXR indices for Tea plantations were notably higher in autumn compared to other seasons. These significant phenological features contributed to the best classification results based on autumn images, achieving an overall classification accuracy of 72.36% and a Kappa coefficient of 0.68. This finding aligns with the conclusions of Fang [9], which indicate that the most valuable phenological period for distinguishing different tree species is autumn.
(2)
This study utilizes the phenological characteristics of vegetation at different times to analyze and compare the spectral features, vegetation indices, and texture characteristics of various vegetation types. By selecting features and thresholds that effectively distinguish different vegetation types, we achieve hierarchical extraction of vegetation types. Compared to the best classification results based on single-temporal feature selection, the classification based on multi-temporal features shows significant advantages, with an overall classification accuracy of 89.1% and a Kappa coefficient of 0.87. This indicates that utilizing phenological characteristics of vegetation can effectively extract vegetation information, demonstrating great potential for mountainous vegetation classification.

Author Contributions

Conceptualization, X.F. and J.L.; methodology, D.C.; software, Z.W. and J.L.; validation, D.C., X.S. and J.L.; formal analysis, D.C. and X.F.; investigation, D.C.; resources, Y.G. and D.H.; data curation, D.C.; writing—original draft preparation, D.C.; writing—review and editing, X.F. and D.C.; visualization, Z.W.; supervision, X.F.; project administration, X.F.; funding acquisition, X.F. and J.L. All authors have read and agreed to the published version of the manuscript.

Funding

The study was supported by the National Key Research and Development Program of China “Remote Sensing Monitoring Method and Cumulative Effect Evaluation of Forest Carbon Storage in Coal Mining Area in Middle Yellow River Basin” (2022YFE0127700), the key project of the open competition in Jiangsu Forestry (LYKJ[2022]01).

Data Availability Statement

The data presented in this study are available on request from the corresponding author due to these data are being synchronized with other experiments.

Acknowledgments

The financial support mentioned in the Funding section is gratefully acknowledged. We also sincerely thank the experts for their valuable suggestions and the anonymous reviewers of this manuscript.

Conflicts of Interest

Author Xiaowei Shen was employed by the company Fujian Province Satellite Data Development Co., Ltd. The remaining authors declare that the research was conducted in the absence of any commercial or financial relationships that could be construed as a potential conflict of interest.

References

  1. Gafurov, A.; Prokhorov, V.; Kozhevnikova, M.; Usmanov, B. Forest Community Spatial Modeling Using Machine Learning and Remote Sensing Data. Remote Sens. 2024, 16, 1371. [Google Scholar] [CrossRef]
  2. Morales-Martín, A.; Mesas-Carrascosa, F.J.; Gutiérrez, P.A.; Pérez-Porras, F.J.; Vargas, V.M.; Hervás-Martínez, C. Deep Ordinal Classification in Forest Areas Using Light Detection and Ranging Point Clouds. Sensors 2024, 24, 2168. [Google Scholar] [CrossRef] [PubMed]
  3. Harshani, H.S.; Tsakalos, J.L.; Mansfield, T.M.; McComb, J.; Burgess, T.I.; St. J. Hardy, G.E. Impact of Phytophthora cinnamomi on the Taxonomic and Functional Diversity of Forest Plants in a Mediterranean-Type Biodiversity Hotspot. J. Veg. Sci. 2023, 34, e13218. [Google Scholar] [CrossRef]
  4. Zhang, J.; Li, H.; Wang, J.; Liang, Y.; Li, R.; Sun, X. Exploring the Differences in Tree Species Classification Between Typical Forest Regions in Northern and Southern China. Forests 2024, 15, 929. [Google Scholar] [CrossRef]
  5. Li, Q.; Lin, H.; Long, J.; Liu, Z.; Ye, Z.; Zheng, H.; Yang, P. Mapping Forest Stock Volume Using Phenological Features Derived from Time-Serial Sentinel-2 Image in Planted Larch. Forests 2024, 15, 995. [Google Scholar] [CrossRef]
  6. Gašparović, M.; Dobrinić, D.; Pilaš, I. Mapping of Allergenic Tree Species in Highly Urbanized Areas Using PlanetScope Image—A Case Study of Zagreb, Croatia. Forests 2023, 14, 1193. [Google Scholar] [CrossRef]
  7. Pu, R.; Landry, S. Mapping urban tree species by integrating multi-seasonal high resolution pléiades satellite imagery with airborne LiDAR data. Urban For. Urban Green. 2020, 53. [Google Scholar] [CrossRef]
  8. Chen, D.; Fei, X.; Wang, Z.; Gao, Y.; Shen, X.; Han, T.; Zhang, Y. Classifying Vegetation Types in Mountainous Areas with Fused High Spatial Resolution Images: The Case of Huaguo Mountain, Jiangsu, China. Sustainability 2022, 14, 13390. [Google Scholar] [CrossRef]
  9. Fang, F.; McNeil, B.E.; Warner, T.A.; Maxwell, A.E.; Dahle, G.A.; Eutsler, E.; Li, J. Discriminating Tree Species at Different Taxonomic Levels Using Multi-Temporal WorldView-3 Image in Washington D.C., USA. Remote Sens. Environ. 2020, 246, 111811. [Google Scholar] [CrossRef]
  10. Yan, J.; Zhou, W.; Han, L.; Qian, Y. Mapping Vegetation Functional Types in Urban Areas with WorldView-2 Image: Integrating Object-Based Classification with Phenology. Urban For. Urban Green. 2018, 31, 230–240. [Google Scholar] [CrossRef]
  11. Lee, R.E.; Baek, K.W.; Jung, S.H. Mapping Tree Species Using CNN from Bi-Seasonal High-Resolution Drone Optic and LiDAR Data. Remote Sens. 2023, 15, 2140. [Google Scholar] [CrossRef]
  12. Kristie, W.; Daniel, G.; Jennifer, R. Using Bi-Seasonal WorldView-2 Multi-Spectral Data and Supervised Random Forest Classification to Map Coastal Plant Communities in Everglades National Park. Sensors 2018, 18, 829–844. [Google Scholar] [CrossRef]
  13. Li, Z.; Zhang, Q.; Qiu, X.; Peng, D. Selection of Timing and Methods for Tree Species Classification Based on GF-2 Remote Sensing Image. J. Appl. Ecol. 2019, 30, 4059–4070. [Google Scholar]
  14. Wang, X.; Zhang, Y.; Ca, J.; Qin, Q.; Feng, Y.; Yan, J. Semantic Segmentation Network for Mangrove Tree Species Based on UAV Remote Sensing Images. Sci. Rep. 2024, 14, 29860. [Google Scholar] [CrossRef] [PubMed]
  15. Wang, X.; Zhang, Y.; Ca, J.; Qin, Q.; Feng, Y.; Yan, J. Individual Tree Species Identification for Complex Coniferous and Broad-Leaved Mixed Forests Based on Deep Learning Combined with UAV LiDAR Data and RGB Images. Forests 2024, 15, 293. [Google Scholar] [CrossRef]
  16. Huang, Y.; Wen, X.; Gao, Y.; Zhang, Y.; Lin, G. Tree Species Classification in UAV Remote Sensing Images Based on Super-Resolution Reconstruction and Deep Learning. Remote Sens. 2023, 15, 2942. [Google Scholar] [CrossRef]
  17. Wen, Y.T.; Zhao, J.; Lan, Y.B.; Yang, D.; Pan, F. Research on Tree Species Classification Based on UAV Visible Light Images and Object-Oriented Methods. J. Northwest For. Univ. 2022, 37, 74–80+144. [Google Scholar]
  18. She, J.; Shen, A.H.; Shi, Y.; Zhao, N.; Zhang, F. Vegetation Classification in Desert Steppe Based on UAV Remote Sensing Images and Object-Oriented Technology. Acta Prataculturae Sin. 2024, 33, 1–14. [Google Scholar]
  19. Wang, E.; Li, C.; Zhou, J.; Peng, D.; Hu, H.; Dong, X. Tree Species Classification of Artificial Forests in the Beijing Plain Based on Multi-Temporal Remote Sensing Image. J. Beijing Univ. Technol. 2017, 43, 710–718. [Google Scholar]
  20. Jin, J.; Pei, L.; Dai, J. Extraction of Forest Land Information Based on Multi-Source Remote Sensing Data. Surv. Spat. Geogr. Inf. 2016, 39, 166–169. [Google Scholar]
  21. Abdollahnejad, A.; Panagiotidis, D. Tree Species Classification and Health Status Assessment for a Mixed Broadleaf-Conifer Forest with UAS Multispectral Imaging. Remote Sens. 2020, 12, 3722. [Google Scholar] [CrossRef]
  22. Jiang, M.; Kong, J.; Zhang, Z.; Hu, J.; Qin, Y.; Shang, K.; Zhao, M.; Zhang, J. Seeing Trees from Drones: The Role of Leaf Phenology Transition in Mapping Species Distribution in Species-Rich Montane Forests. Forests 2023, 14, 908. [Google Scholar] [CrossRef]
  23. Gu, C.; Liang, J.; Liu, X.; Sun, B.; Sun, T. Application and Prospect of Hyperspectral Remote Sensing in Monitoring Grassland Plant Diversity. J. Appl. Ecol. 2024, 35, 1397–1407. [Google Scholar]
  24. Li, L.; Gao, Q.; He, W.; Chen, M.; Yang, X. Research on Sample Sampling Methods for Complex Scenes in Natural Resources Remote Sensing Intelligent Interpretation. J. Earth Inf. Sci. 2024, 27, 1–19. [Google Scholar]
  25. Dibs, H.; Idrees, M.O.; Alsalhin, G.B.A. Hierarchical Classification Approach for Mapping Rubber Tree Growth Using Per-Pixel and Object-Oriented Classifiers with SPOT-5 Image. Egypt. J. Remote Sens. Space Sci. 2017, 20, 21–30. [Google Scholar]
  26. Wang, M.; Zhang, X.; Wang, J.; Sun, Y.; Jian, G.; Pan, C. Forest Resource Classification Combining Random Forest and Object-Oriented Approaches. J. Geomat. 2020, 49, 235–244. [Google Scholar]
  27. Gln, D.; Akpnar, A. Mapping Urban Green Spaces Based on an Object-Oriented Approach. Bilge Int. J. Sci. Technol. Res. 2018, 2, 71–81. [Google Scholar]
  28. Khosravani, P.; Moosavi, A.A.; Baghernejad, M.; Kebonye, N.M.; Mousavi, S.R.; Scholten, T. Machine Learning Enhances Soil Aggregate Stability Mapping for Effective Land Management in a Semi-Arid Region. Remote Sens. 2024, 16, 4304. [Google Scholar] [CrossRef]
  29. Lin, Y.; Zhang, W.; Yu, J.; Zhang, H. Fine Classification of Urban Vegetation Based on UAV Imagery. China Environ. Sci. 2022, 42, 2852–2861. [Google Scholar]
  30. Myneni, R.B.; Williams, D.L. On the Relationship Between FAPAR and NDVI. Remote Sens. Environ. 1994, 49, 200–211. [Google Scholar] [CrossRef]
  31. Jing, R.; Deng, L.; Zhao, W.; Gong, Z. Object-Oriented Extraction Method for Aquatic Vegetation in Wetlands Based on Visible Light Vegetation Index. J. Appl. Ecol. 2016, 27, 1427–1436. [Google Scholar]
  32. Gitelson, A.A.; Kaufman, Y.J.; Stark, R.; Rundquist, D. Novel Algorithms for Remote Estimation of Vegetation Fraction. Remote Sens. Environ. 2002, 80, 76–87. [Google Scholar] [CrossRef]
  33. He, C.; She, D.; Zhang, X.; Yang, Z. Study on Vegetation Index of Small Watersheds in the Loess Plateau Based on Visible Light Image. Res. Agric. Mod. 2022, 43, 504–512. [Google Scholar]
  34. Liu, S.; Yang, G.; Jing, H.; Feng, H.; Li, H.; Chen, P.; Yang, W. Inversion of Nitrogen Content in Winter Wheat Based on UAV Digital Image. Trans. Chin. Soc. Agric. Eng. 2019, 35, 75–85. [Google Scholar]
  35. Yao, B.; Zhang, H.; Liu, Y.; Liu, H.; Ling, C. Wetland Remote Sensing Classification Using Object-Oriented CART Decision Tree Method. For. Sci. Res. 2019, 32, 91–98. [Google Scholar]
  36. Lei, G.; Li, A.; Tan, J.; Zhang, Z.; Bian, J.; Jin, H.; Zhao, W.; Cao, X. Research on Decision Tree Models for Mountain Forest Classification Based on Multi-Source and Multi-Temporal Remote Sensing Image. Remote Sens. Technol. Appl. 2016, 31, 31–41. [Google Scholar]
  37. Berhane, T.M.; Lane, C.R.; Wu, Q.; Autrey, B.C.; Anenkhonov, O.A.; Chepinoga, V.V.; Liu, H. Decision-Tree, Rule-Based, and Random Forest Classification of High-Resolution Multispectral Image for Wetland Mapping and Inventory. Remote Sens. 2018, 10, 580. [Google Scholar] [CrossRef]
  38. Zhang, X.; Xu, J.; Chen, Y.; Xu, K.; Wang, D. Coastal Wetland Classification with GF-3 Polarimetric SAR Image by Using Object-Oriented Random Forest Algorithm. Sensors 2021, 21, 3395. [Google Scholar] [CrossRef]
  39. Xue, Y.F.; Zhang, S.H.; Bai, N.N.; Yuuan, F.; Liu, J. Mangrove Species Classification Method Coupling Multi-Temporal Sentinel-1/2 Remote Sensing Image Features. J. Geo-Inf. Sci. 2024, 26, 2626–2642. [Google Scholar]
  40. Xu, L.; Ouyang, X.Z.; Pan, P.; Zang, H.; Liu, J.; Yang, K. Identification of Southern Forest Vegetation Types Based on GF-1 WFV and MODIS Spatiotemporal Fusion. Chin. J. Appl. Ecol. 2022, 33, 1948–1956. [Google Scholar]
  41. Xu, R.; Fan, Y.; Fan, B.; Feng, G.; Li, R. Classification and Monitoring of Salt Marsh Vegetation in the Yellow River Delta Based on Multi-Source Remote Sensing Data Fusion. Sensors 2025, 25, 529. [Google Scholar] [CrossRef] [PubMed]
  42. Liu, X.; Frey, J.; Munteanu, C.; Still, N.; Koch, B. Mapping Tree Species Diversity in Temperate Montane Forests Using Sentinel-1 and Sentinel-2 Imagery and Topography Data. Remote Sens. Environ. 2023, 292, 113576. [Google Scholar] [CrossRef]
  43. Kollert, A.; Bremer, M.; Löw, M.; Rutzinger, M. Exploring the Potential of Land Surface Phenology and Seasonal Cloud-Free Composites of One Year of Sentinel-2 Imagery for Tree Species Mapping in a Mountainous Region. Int. J. Appl. Earth Obs. Geoinf. 2021, 94, 102208. [Google Scholar] [CrossRef]
  44. Shi, Y.; Wang, T.; Skidmore, A.K.; Heurich, M. Improving LiDAR-Based Tree Species Mapping in Central European Mixed Forests Using Multi-Temporal Digital Aerial Colour-Infrared Photographs. Int. J. Appl. Earth Obs. Geoinf. 2020, 84, 101970. [Google Scholar] [CrossRef]
Disclaimer/Publisher’s Note: The statements, opinions and data contained in all publications are solely those of the individual author(s) and contributor(s) and not of MDPI and/or the editor(s). MDPI and/or the editor(s) disclaim responsibility for any injury to people or property resulting from any ideas, methods, instructions or products referred to in the content.

Article Metrics

Citations

Article Access Statistics

Multiple requests from the same IP address are counted as one view.