Pixel-Based Mapping of Rubber Plantation Age at Annual Resolution Using Supervised Learning for Forest Inventory and Monitoring
Abstract
1. Introduction
2. Materials and Methods
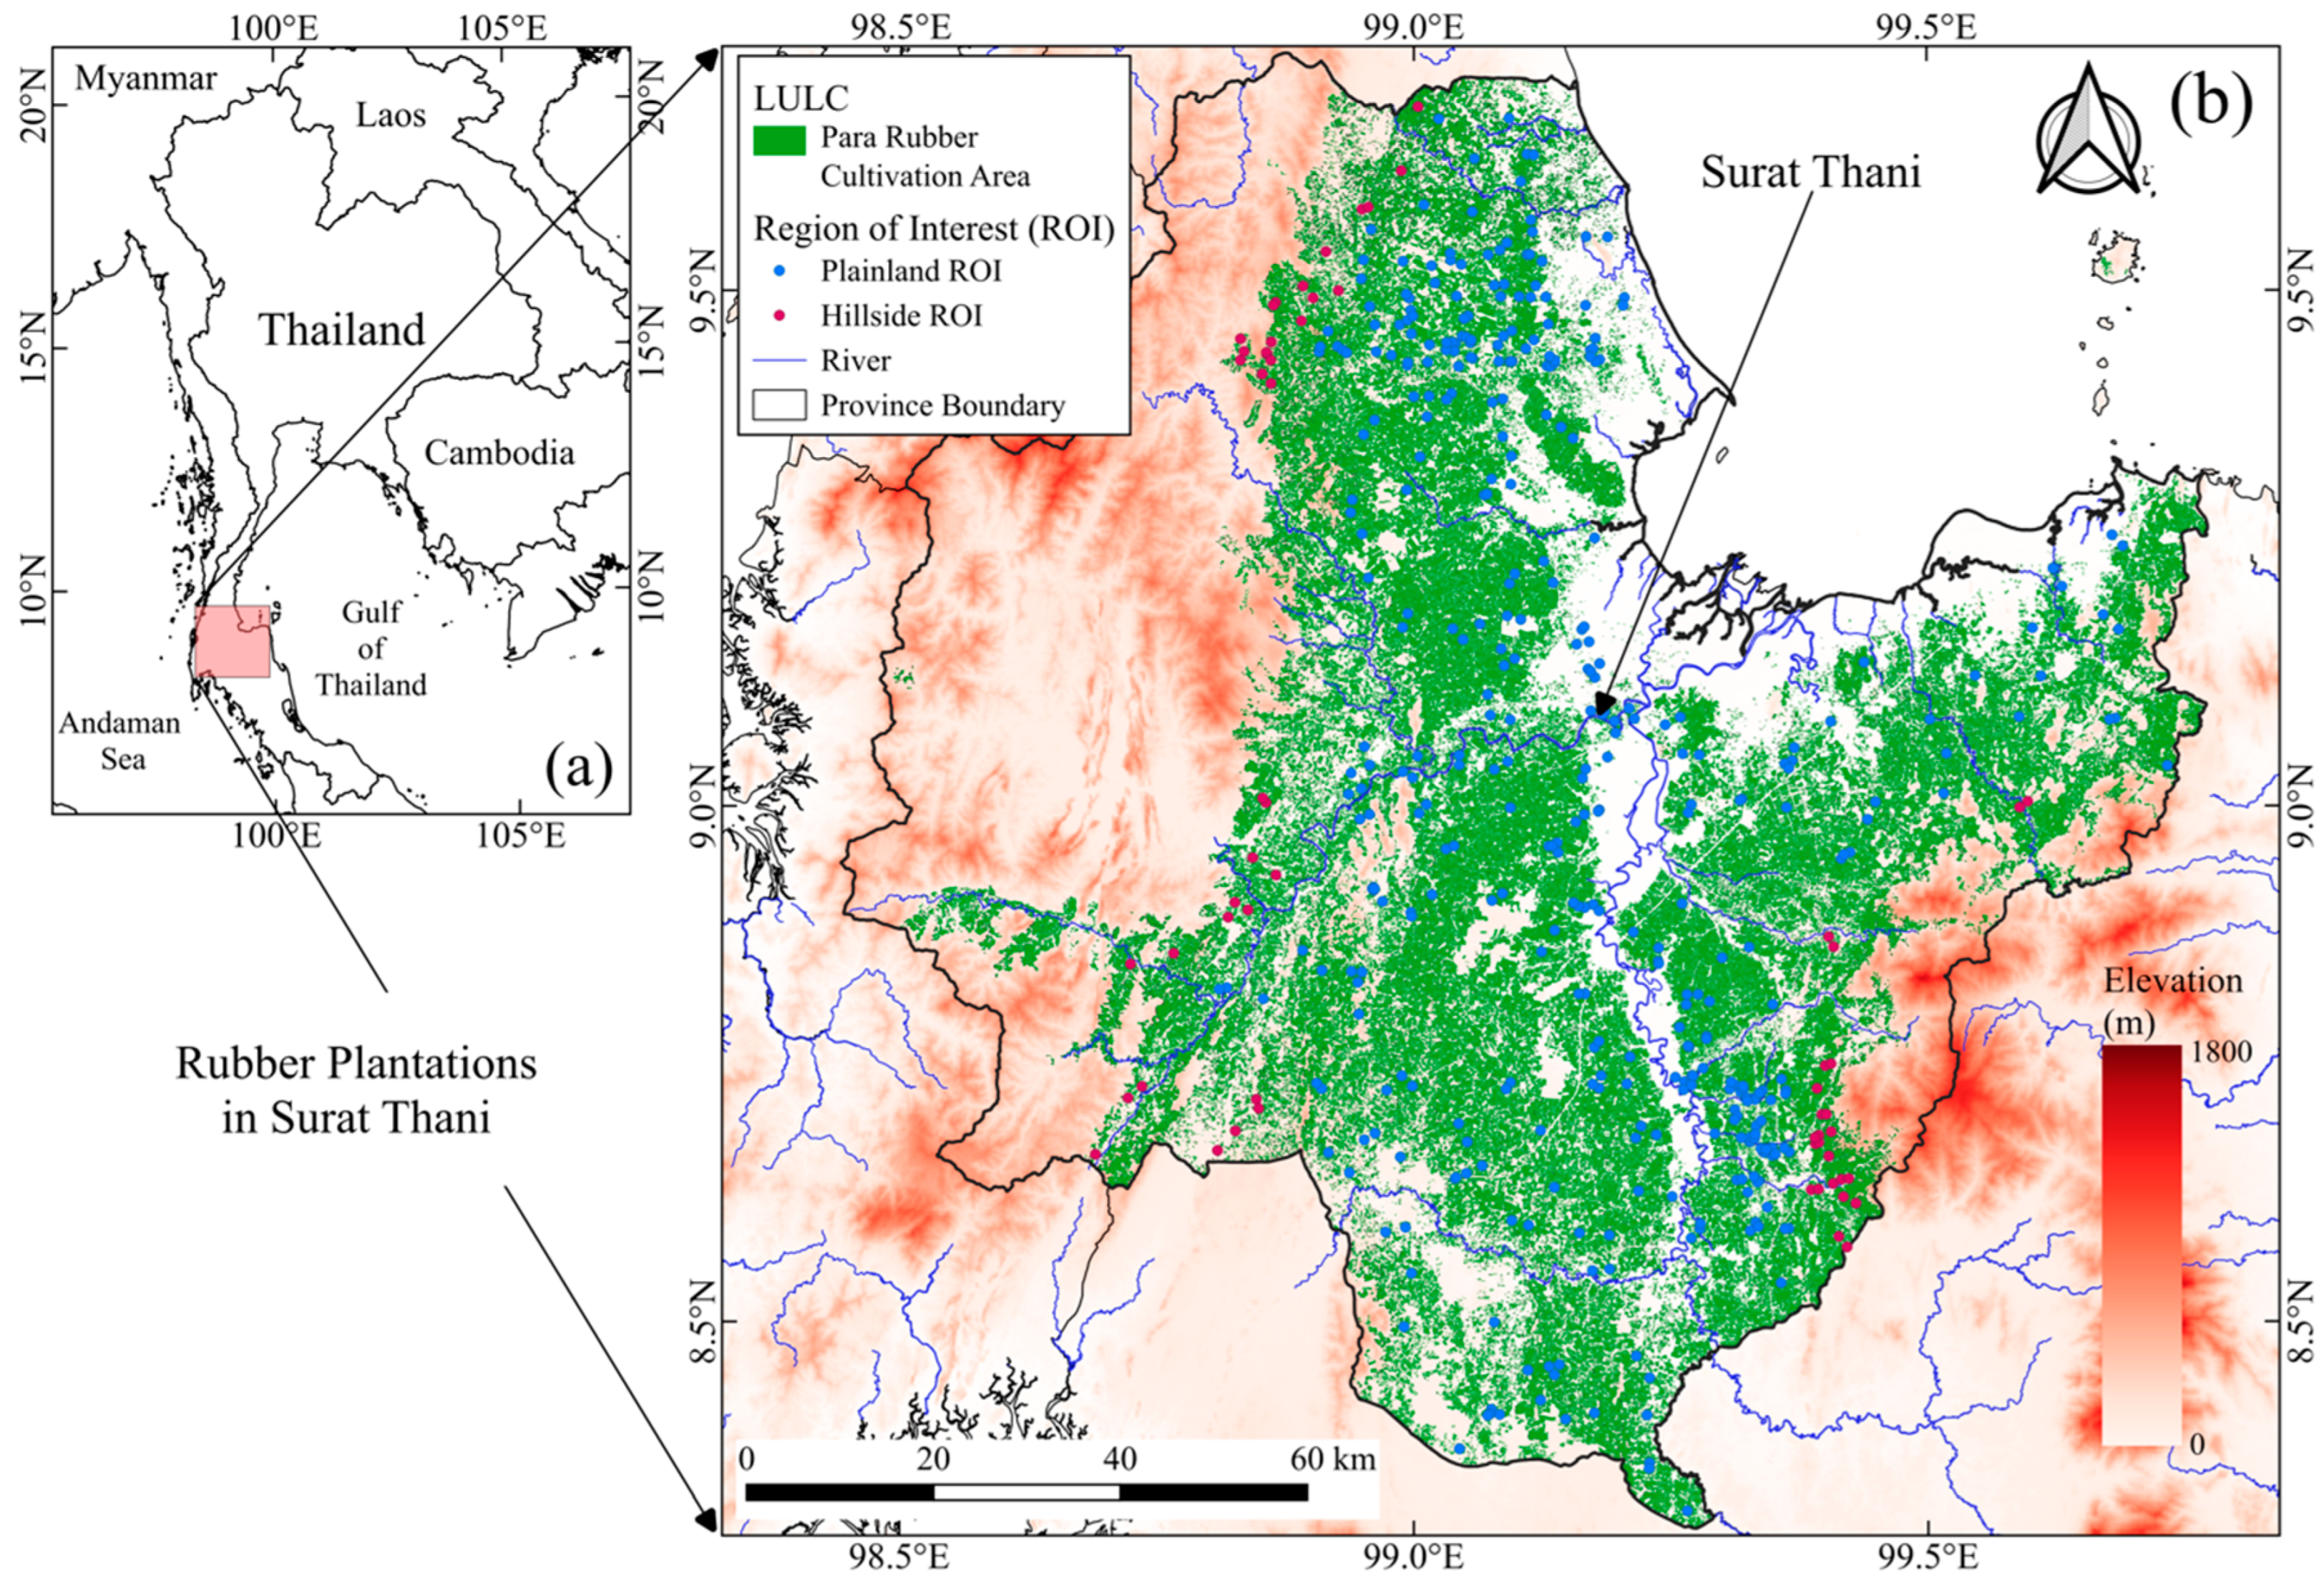
2.1. Study Area
2.2. Data
2.2.1. Landsat Time Series
2.2.2. Land Use and Land Cover (LULC)
2.2.3. Secondary Ground Reference Data
2.3. Mapping Stand Age
2.3.1. Landsat Images Pre-Processing and Interannual Spatial Indices Time Series
2.3.2. On-Screen Reference Sites and Year of Rubber Planting Identification
2.3.3. Features Generation
2.3.4. Features Selection
2.3.5. Model Training and Evaluation
2.3.6. Prediction of Land Clearance Area and Estimating Age of Rubber Plantation
2.4. Accuracy Assessment
3. Results
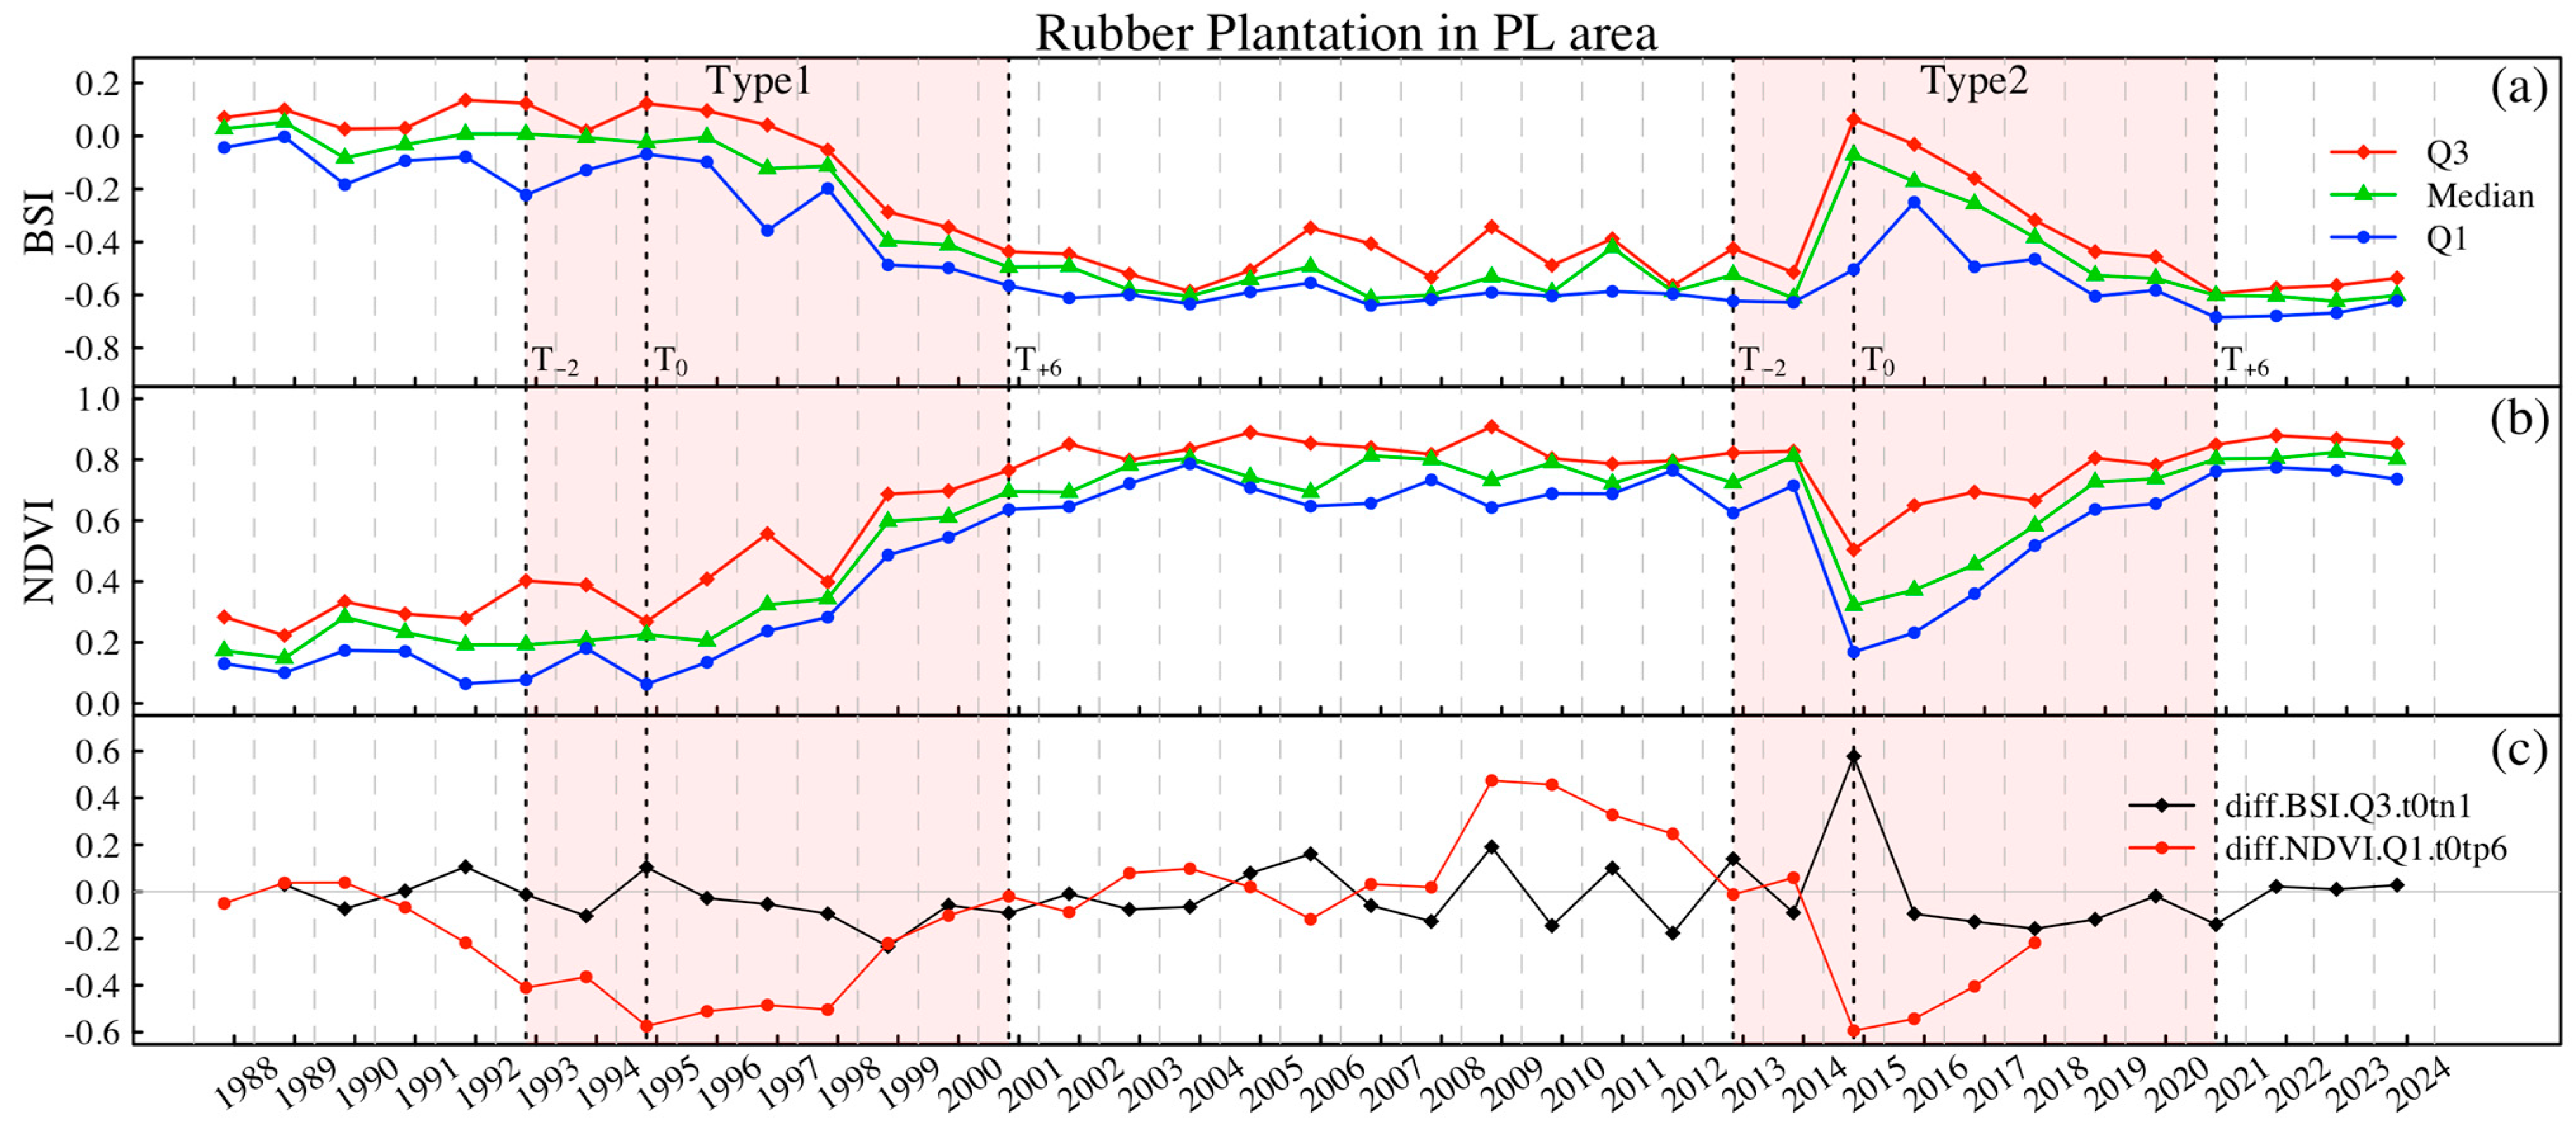
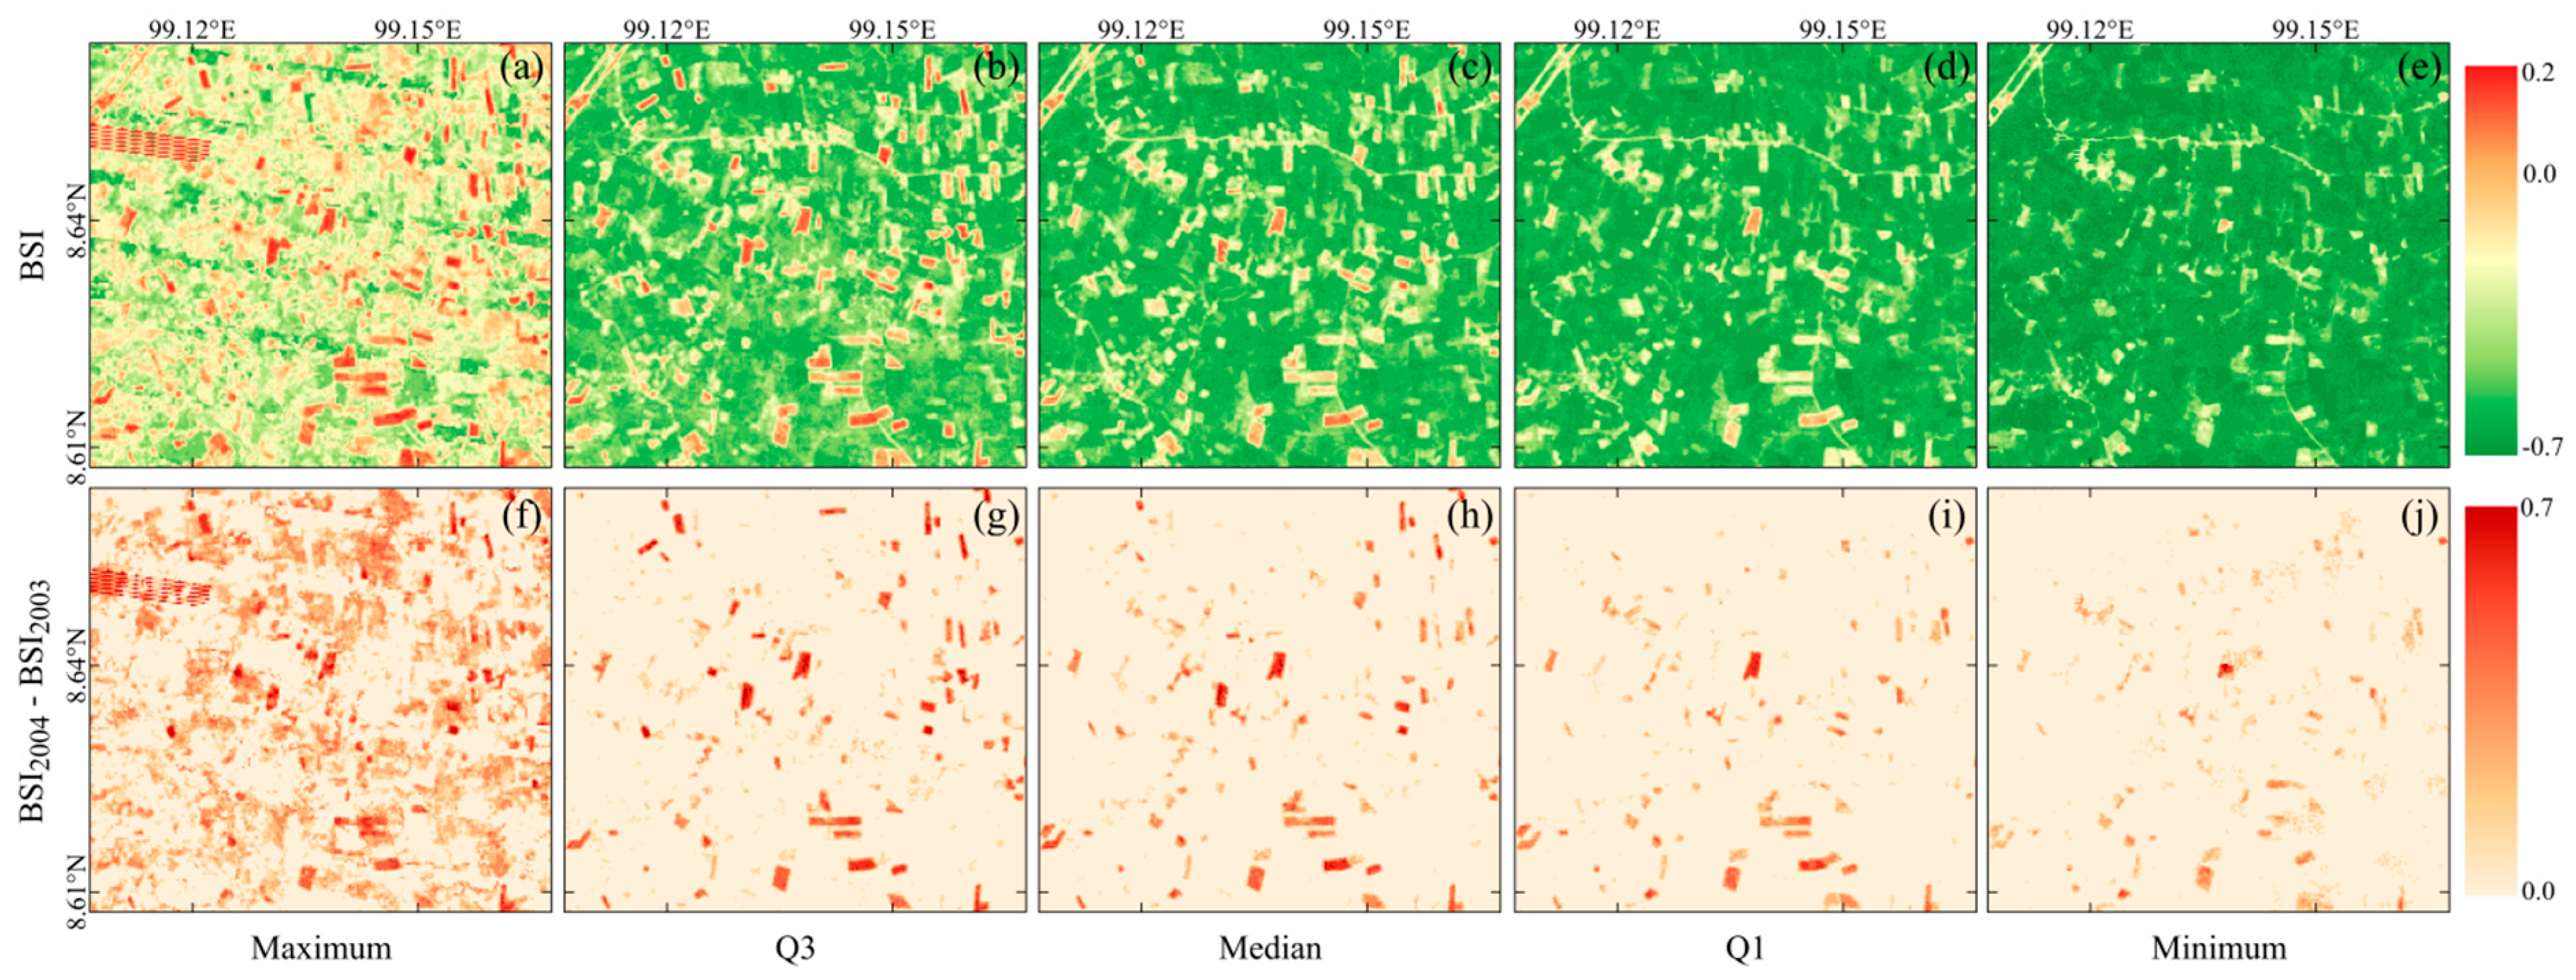
3.1. Time Series Analysis of Distribution Summary BSI Values
3.2. Feature Importance and Hyperparameter Tuning
3.3. Map of Rubber Plantation Stand Age
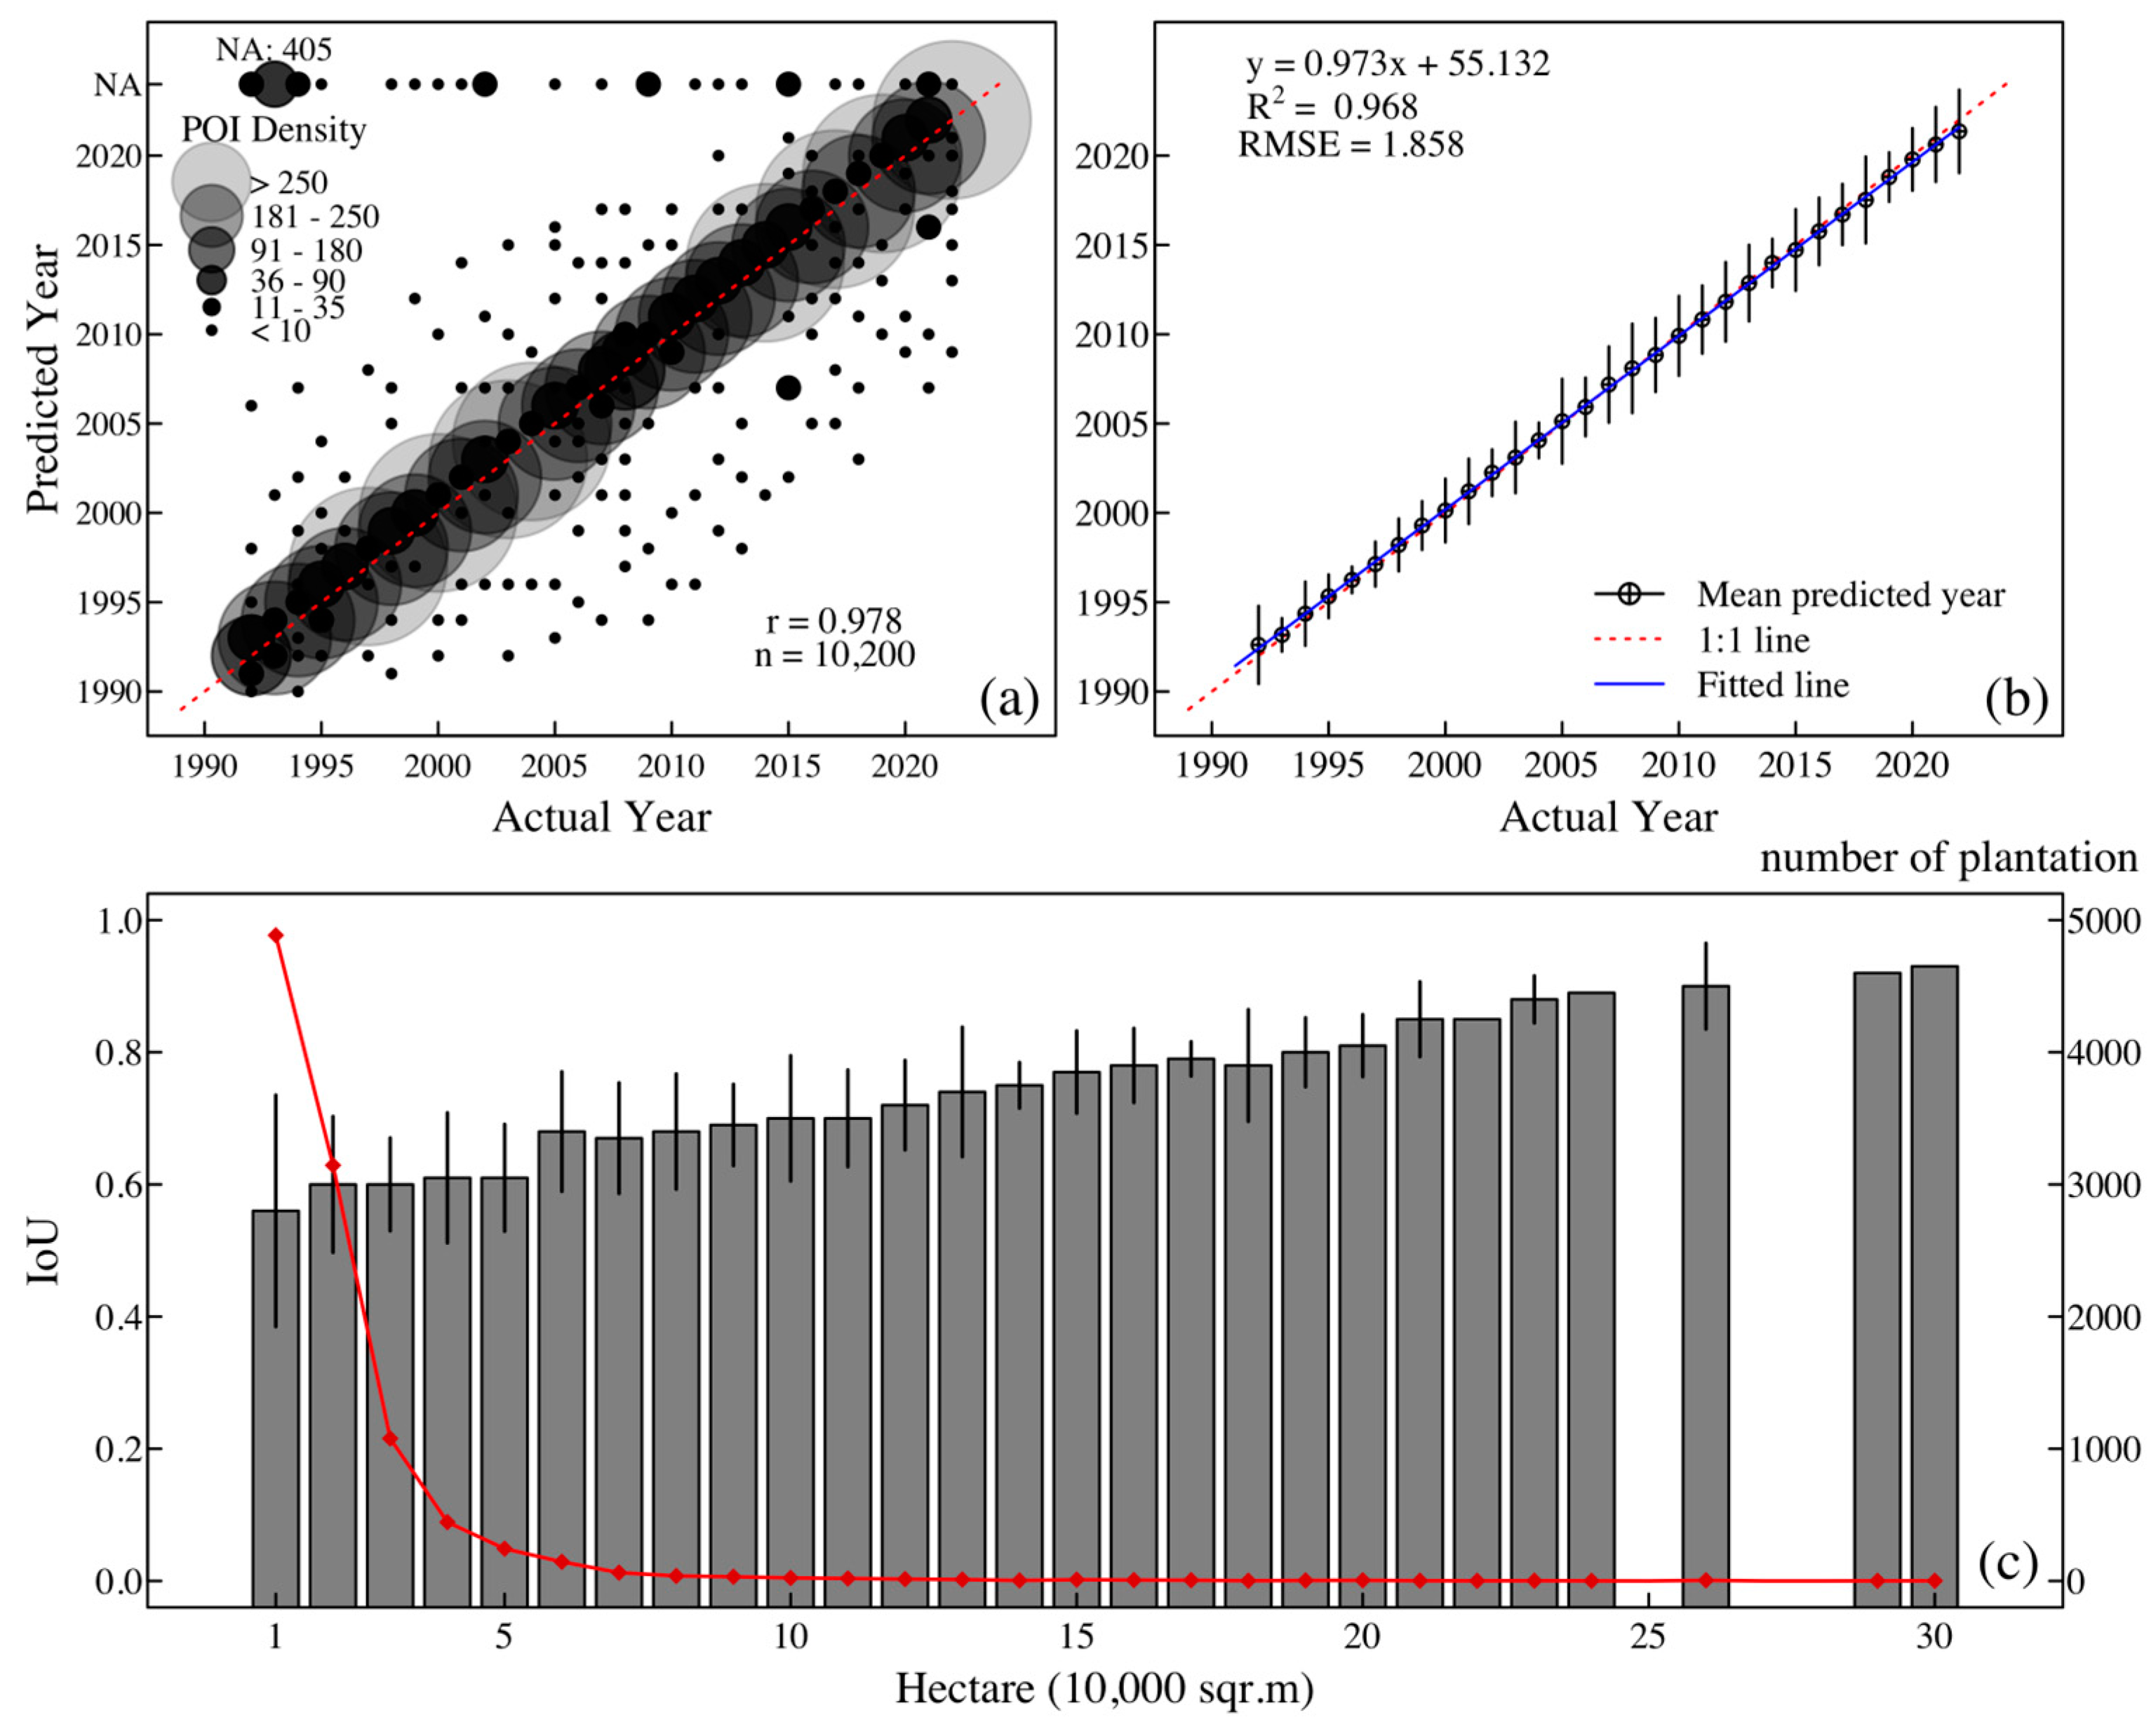
3.4. Accuracy Assessment of Rubber Plantation Age and Area Predictions
4. Discussion
4.1. Model Overfitting and Suitability
4.2. Error Analysis of Prediction Uncertainty
4.2.1. Impact of Image Availability and Cloud Cover on Prediction Accuracy
4.2.2. Impact of Land Clearance Timing on the Annual Distribution of Spectral Indices
4.2.3. Pre-Conversion Land Use and Rubber Cultivation Area
4.3. Underestimated Predictions
5. Conclusions
Author Contributions
Funding
Data Availability Statement
Acknowledgments
Conflicts of Interest
Appendix A
| Index | Feature | Description |
|---|---|---|
| NDVI | NDVI.Q1.tn2, NDVI. Q1.tn1, NDVI. Q1.t0, NDVI.Q1.tp1, NDVI.Q1.tp2, NDVI.Q1.tp3, NDVI.Q1.tp4, NDVI.Q1.tp5, NDVI.Q1.tp6 | The Q1 of NDVI at year T−2 to T+6 |
| diff.NDVI.Q1t0tn2, diff.NDVI.Q1.t0tn1, diff.NDVI.Q1.t0tp1, diff.NDVI.Q1.t0tp2, diff.NDVI.Q1.t0tp3, diff.NDVI.Q1.t0tp4, diff.NDVI.Q1.t0tp5, diff.NDVI.Q1.t0tp6 | Difference in the Q1 NDVI between year T0 and two years before and six years after year T0 | |
| diff.NDVI.Q1.tn1tp6 | Difference in the Q1 NDVI between year T-1 and year T+6 | |
| diff.NDVI.Q1.tp3tp6 | Difference in the Q1 NDVI between year T+3 and year T+6 | |
| ratio.NDVI.Q1.t0p3.p3p6 | Ratio between diff.NDVI.Q1.t0p3 and diff.NDVI.Q1.p3p6 | |
| ratio.NDVI.Q1.p3p6.t0p6 | Ratio between diff.NDVI.Q1.p3p6 and diff.NDVI.Q1.t0p6 | |
| BSI | Similar to NDVI, but replace NDVI with BSI and Q1 with Q3 | |
| Dataset | |||
|---|---|---|---|
| Type1 | Type2_HS | Type2_PL | |
| 1 | BSI.Q3.t0 | diff.BSI.Q3.t0n1 | diff.BSI.Q3.t0n1 |
| 2 | diff.BSI.Q3.t0n1 | BSI.Q3.n1 | diff.NDVI.Q1.t0n1 |
| 3 | diff.NDVI.Q1.t0n1 | diff.NDVI.Q1.t0n1 | BSI.Q3.n1 |
| 4 | diff.NDVI.Q1.t0n2 | diff.BSI.Q3.t0n2 | diff.BSI.Q3.t0p1 |
| 5 | diff.BSI.Q3.t0p6 | diff.NDVI.Q1.t0n2 | diff.BSI.Q3.t0n2 |
| 6 | diff.BSI.Q3.t0n2 | NDVI.Q1.n1 | NDVI.Q1.n1 |
| 7 | diff.NDVI.Q1.t0p3 | BSI.Q3.t0 | BSI.Q3.t0 |
| 8 | diff.BSI.Q3.t0p1 | diff.BSI.Q3.n1.p6 * | BSI.Q3.n2 |
| 9 | NDVI.Q1.t0 | NDVI.Q1.n2 | diff.BSI.Q3.n1.p6 * |
| 10 | diff.BSI.Q3.t0p3 | BSI.Q3.n2 | diff.NDVI.Q1.t0p1 |
| 11 | diff.NDVI.Q1.t0p6 | diff.NDVI.Q1.t0p6 * | diff.NDVI.Q1.t0n2 |
| 12 | NDVI.Q1.t0 | diff.BSI.Q3.t0p3 | |
| 13 | diff.BSI.Q3.t0p6 * | diff.NDVI.Q1.t0p6 * | |
| 14 | diff.NDVI.Q1.t0p3 | NDVI.Q1.t0 | |
| 15 | diff.BSI.Q3.t0p3 | diff.BSI.Q3.t0p6 * | |
| 16 | diff.NDVI.Q1.t0p3 | ||
| Model | Grid of Hyperparameter | Description |
|---|---|---|
| RP | cp = [0.0001, 0.0005, 0.001, 0.005, 0.01, 0.05, 0.1] | Complexity Parameter: Controls pruning |
| maxdepth = [2, 4, 6, 8, 10] | Maximum depth of the tree | |
| minsplit = [2, 5, 10, 20] | Minimum number of observations required to split | |
| RF | mtry = [2, 3, 4, 5, 7, 10] | Number of variables randomly sampled per split |
| ntree = [100, 200, 300] | Number of decision trees built in the forest model | |
| maxnodes = [5, 10, 20, 30] | Maximum number of terminal nodes | |
| XGBoost | nrounds = [100, 300, 500] | Number of boosting iterations (trees) |
| max_depth = [2, 3, 6, 9] | Maximum depth of trees | |
| eta = [0.01, 0.05, 0.1, 0.3, 0.5] | Learning rate: controls step size of updates | |
| gamma = [0, 1, 5] | Minimum loss reduction required to make a split | |
| colsample_bytree = [0.5, 0.7, 1] | Fraction of features randomly selected per tree | |
| subsample = [0.5, 0.8, 1] | Fraction of training samples per boosting round | |
| min_child_weight = [1, 5, 10] | Minimum weight sum of leaf node split | |
| max_delta_step = [0, 1, 3, 5] | Helps prevent large updates, useful for imbalanced datasets | |
| SVM | method = [“svmRadial”, “svmLinear”, “svmPoly”, “svmSigmoid”] | SVM Kernel: Radial Basis Function (RBF), Linear, Polynomial, and Sigmoid models |
| C = [0.1, 0.5, 1, 5, 10] | Cost: regularization parameter (for radial, linear, polynomial, and sigmoid kernel) | |
| degree = [2, 3, 4] | Polynomial kernel degree (only for polynomial kernel) | |
| scale = [0.01, 0.1, 1] | Scaling factor degree (for polynomial kernel, gamma equivalent) | |
| sigma = [0.01, 0.1, 1] | Kernel coefficient that controls flexibility, lower values = more generalized model (only for radial kernel, gamma equivalent) | |
| gamma = [0.01, 0.1, 1] | Kernel coefficient that controls scaling of input features (for radial, sigmoid, polynomial kennel) | |
| coef0 = [0.1, 0.3, 0.5, 0.7, 0.9] | Regularization parameter |
| Model | Hyperparameters | Dataset | ||
|---|---|---|---|---|
| Type1 | Type2_HS | Type2_PL | ||
| RP | cp | 0.001 | 0.005 | 0.001 |
| maxdepth | 8 | 6 | 8 | |
| minsplit | 5 | 10 | 5 | |
| F1-score | 0.954 | 0.985 | 0.986 | |
| RF | mtry | 4 | 2 | 7 |
| ntree | 100 | 200 | 100 | |
| maxnodes | 30 | 30 | 30 | |
| F1-score | 0.957 | 0.987 | 0.987 | |
| XGBoost | nrounds | 500 | 300 | 300 |
| max_dept | 9 | 6 | 6 | |
| eta | 0.1 | 0.01 | 0.1 | |
| gamma | 0 | 1 | 5 | |
| colsample_bytree | 1.0 | 0.5 | 0.7 | |
| subsample | 0.8 | 1.0 | 1.0 | |
| min_child_weight | 1 | 1 | 1 | |
| max_delta_step | 3 | 1 | 0 | |
| F1-score | 0.965 | 0.987 | 0.988 | |
| SVM | method | “svmRadial” | “svmRadial” | “svmRadial” |
| C | 5 | 5 | 10 | |
| degree | - | - | - | |
| scale | - | - | - | |
| sigma | 1 | 0.1 | 0.1 | |
| gamma | - | - | - | |
| Coef1 | - | - | - | |
| F1-score | 0.968 | 0.987 | 0.988 | |
References
- Li, Z.; Fox, J.M. Mapping Rubber Tree Growth in Mainland Southeast Asia Using Time-Series MODIS 250 m NDVI and Statistical Data. Appl. Geogr. 2012, 32, 420–432. [Google Scholar] [CrossRef]
- Fox, J.; Castella, J.C. Expansion of Rubber (Hevea brasiliensis) in Mainland Southeast Asia: What Are the Prospects for Smallholders? J. Peasant Stud. 2013, 40, 155–170. [Google Scholar] [CrossRef]
- Giambelluca, T.W.; Mudd, R.G.; Liu, W.; Ziegler, A.D.; Kobayashi, N.; Kumagai, T.O.; Miyazawa, Y.; Lim, T.K.; Huang, M.; Fox, J.; et al. Evapotranspiration of Rubber (Hevea brasiliensis) Cultivated at Two Plantation Sites in Southeast Asia. Water Resour. Res. 2016, 52, 660–679. [Google Scholar] [CrossRef]
- Beckschäfer, P. Obtaining Rubber Plantation Age Information from Very Dense Landsat TM & ETM+ Time Series Data and Pixel-Based Image Compositing. Remote Sens. Environ. 2017, 196, 89–100. [Google Scholar] [CrossRef]
- Chen, B.; Cao, J.; Wang, J.; Wu, Z.; Tao, Z.; Chen, J.; Yang, C.; Xie, G. Estimation of Rubber Stand Age in Typhoon and Chilling Injury Afflicted Area with Landsat TM Data: A Case Study in Hainan Island, China. For. Ecol. Manag. 2012, 274, 222–230. [Google Scholar] [CrossRef]
- Chen, B.; Xiao, X.; Wu, Z.; Yun, T.; Kou, W.; Ye, H.; Lin, Q.; Doughty, R.; Dong, J.; Ma, J.; et al. Identifying Establishment Year and Pre-Conversion Land Cover of Rubber Plantations on Hainan Island, China Using Landsat Data During 1987–2015. Remote Sens. 2018, 10, 1240. [Google Scholar] [CrossRef]
- Chen, G.; Thill, J.-C.; Anantsuksomsri, S.; Tontisirin, N.; Tao, R. Stand Age Estimation of Rubber (Hevea brasiliensis) Plantations Using an Integrated Pixel- and Object-Based Tree Growth Model and Annual Landsat Time Series. ISPRS J. Photogramm. Remote Sens. 2018, 144, 94–104. [Google Scholar] [CrossRef]
- Razaq, M.; Huang, Q.; Wang, F.; Liu, C.; Gnanamoorthy, P.; Liu, C.; Tang, J. Carbon Stock Dynamics in Rubber Plantations Along an Elevational Gradient in Tropical China. Forests 2024, 15, 1933. [Google Scholar] [CrossRef]
- Dong, J.; Xiao, X.; Chen, B.; Torbick, N.; Jin, C.; Zhang, G.; Biradar, C. Mapping Deciduous Rubber Plantations through Integration of PALSAR and Multi-Temporal Landsat Imagery. Remote Sens. Environ. 2013, 134, 392–402. [Google Scholar] [CrossRef]
- Grogan, K.; Pflugmacher, D.; Hostert, P.; Kennedy, R.; Fensholt, R. Cross-Border Forest Disturbance and the Role of Natural Rubber in Mainland Southeast Asia Using Annual Landsat Time Series. Remote Sens. Environ. 2015, 169, 438–453. [Google Scholar] [CrossRef]
- Trisasongko, B.H. Mapping Stand Age of Rubber Plantation Using ALOS-2 Polarimetric SAR Data. Eur. J. Remote Sens. 2017, 50, 64–76. [Google Scholar] [CrossRef]
- Blaschke, T.; Hay, G.J.; Kelly, M.; Lang, S.; Hofmann, P.; Addink, E.; Feitosa, R.Q.; van der Meer, F.; van der Werff, H.; van Coillie, F.; et al. Geographic Object-Based Image Analysis—Towards a New Paradigm. ISPRS J. Photogramm. Remote Sens. 2014, 87, 180–191. [Google Scholar] [CrossRef]
- Chen, G.; Weng, Q.; Hay, G.J.; He, Y. Geographic Object-Based Image Analysis (GEOBIA): Emerging Trends and Future Opportunities. GISci. Remote Sens. 2018, 55, 159–182. [Google Scholar] [CrossRef]
- Chen, G.; Weng, Q. Special Issue: Remote Sensing of Our Changing Landscapes with Geographic Object-Based Image Analysis (GEOBIA). GISci. Remote Sens. 2018, 55, 155–158. [Google Scholar] [CrossRef]
- Dong, J.; Xiao, X.; Sheldon, S.; Biradar, C.; Xie, G. Mapping Tropical Forests and Rubber Plantations in Complex Landscapes by Integrating PALSAR and MODIS Imagery. ISPRS J. Photogramm. Remote Sens. 2012, 74, 20–33. [Google Scholar] [CrossRef]
- Fu, Y.; Tan, H.; Kou, W.; Xu, W.; Wang, H.; Lu, N. Estimation of Rubber Plantation Biomass Based on Variable Optimization from Sentinel-2 Remote Sensing Imagery. Forests 2024, 15, 900. [Google Scholar] [CrossRef]
- Zhang, C.; Huang, C.; Li, H.; Liu, Q.; Li, J.; Bridhikitti, A.; Liu, G. Effect of Textural Features in Remote Sensed Data on Rubber Plantation Extraction at Different Levels of Spatial Resolution. Forests 2020, 11, 399. [Google Scholar] [CrossRef]
- Somching, N.; Wongsai, S.; Wongsai, N.; Koedsin, W. Using Machine Learning Algorithm and Landsat Time Series to Identify Establishment Year of Para Rubber Plantations: A Case Study in Thalang District, Phuket Island, Thailand. Int. J. Remote Sens. 2020, 41, 9075–9100. [Google Scholar] [CrossRef]
- Chen, B.; Yun, T.; Ma, J.; Kou, W.; Li, H.; Yang, C.; Xiao, X.; Zhang, X.; Sun, R.; Xie, G.; et al. High-Precision Stand Age Data Facilitate the Estimation of Rubber Plantation Biomass: A Case Study of Hainan Island, China. Remote Sens. 2020, 12, 3853. [Google Scholar] [CrossRef]
- Kou, W.; Xiao, X.; Dong, J.; Gan, S.; Zhai, D.; Zhang, G.; Qin, Y.; Li, L. Mapping Deciduous Rubber Plantation Areas and Stand Ages with PALSAR and Landsat Images. Remote Sens. 2015, 7, 1048–1073. [Google Scholar] [CrossRef]
- Pratama, L.D.Y.; Danoedoro, P. Above-Ground Carbon Stock Estimates of Rubber (Hevea brasiliensis) Using Sentinel-2A Imagery: A Case Study in Rubber Plantation of PTPN IX Kebun Getas and Kebun Ngobo, Semarang Regency. In IOP Conference Series: Earth and Environmental Science, Proceedings of the Fifth International Conferences of Indonesian Society for Remote Sensing, West Java, Indonesia, 17–20 September 2019; IOP Publishing Ltd.: Bristol, England, 2020; Volume 500, p. 012087. [Google Scholar] [CrossRef]
- Yasen, K.; Koedsin, W. Estimating Aboveground Biomass of Rubber Tree Using Remote Sensing in Phuket Province, Thailand. J. Med. Bioeng. 2015, 4, 451–456. [Google Scholar] [CrossRef]
- Simien, A.; Penot, E. Current Evolution of Smallholder Rubber-Based Farming Systems in Southern Thailand. J. Sustain. For. 2011, 30, 247–260. [Google Scholar] [CrossRef]
- Huete, A.; Didan, K.; Miura, T.; Rodriguez, E.P.; Gao, X.; Ferreira, L.G. Overview of the Radiometric and Biophysical Performance of the MODIS Vegetation Indices. Remote Sens. Environ. 2002, 83, 195–213. [Google Scholar] [CrossRef]
- Diek, S.; Fornallaz, F.; Schaepman, M.E.; de Jong, R. Barest Pixel Composite for Agricultural Areas Using Landsat Time Series. Remote Sens. 2017, 9, 1245. [Google Scholar] [CrossRef]
- Dong, J.; Xiao, X.; Sheldon, S.; Biradar, C.; Duong, N.D.; Hazarika, M. A Comparison of Forest Cover Maps in Mainland Southeast Asia from Multiple Sources: PALSAR, MERIS, MODIS and FRA. Remote Sens. Environ. 2012, 127, 60–73. [Google Scholar] [CrossRef]
- Chicco, D.; Jurman, G. The Advantages of the Matthews Correlation Coefficient (MCC) over F1 Score and Accuracy in Binary Classification Evaluation. BMC Genom. 2020, 21, 6. [Google Scholar] [CrossRef] [PubMed]
- Powers, D.M.W. What the F-Measure Doesn’t Measure: Features, Flaws, Fallacies and Fixes. arXiv 2015, arXiv:1503.06410. [Google Scholar] [CrossRef]
- Chicco, D.; Warrens, M.J.; Jurman, G. The Matthews Correlation Coefficient (MCC) is More Informative Than Cohen’s Kappa and Brier Score in Binary Classification Assessment. IEEE Access 2021, 9, 78368–78381. [Google Scholar] [CrossRef]
- Halkidi, M.; Batistakis, Y.; Vazirgiannis, M. Cluster Validity Methods: Part I. ACM SIGMOD Rec. 2002, 31, 40–45. [Google Scholar] [CrossRef]
- Wainer, J.; Fonseca, P. How to tune the RBF SVM hyperparameters? An empirical evaluation of 18 search algorithms. Artif. Intell. Rev. 2021, 54, 4771–4797. [Google Scholar] [CrossRef]
- Liang, Z.; Liu, N. Efficient Feature Scaling for Support Vector Machines with a Quadratic Kernel. Neural Process. Lett. 2014, 39, 235–246. [Google Scholar] [CrossRef]
- Roy, D.P.; Li, Z.; Zhang, H.K.; Huang, H. A Conterminous United States Analysis of the Impact of Landsat 5 Orbit Drift on the Temporal Consistency of Landsat 5 Thematic Mapper Data. Remote Sens. Environ. 2020, 240, 111701. [Google Scholar] [CrossRef]
- White, J.C.; Wulder, M.A.; Hobart, G.W.; Luther, J.E.; Hermosilla, T.; Griffiths, P.; Coops, N.C. Pixel-Based Image Compositing for Large-Area Dense Time Series Applications and the Normalization of Forest Change Products. Remote Sens. Environ. 2017, 194, 314–335. [Google Scholar] [CrossRef]
- Pflugmacher, D.; Cohen, W.B.; Kennedy, R.E. Using Landsat-Derived Disturbance and Recovery History and LiDAR to Map Forest Biomass Dynamics. Remote Sens. Environ. 2012, 122, 60–73. [Google Scholar] [CrossRef]
- Zhu, Z.; Woodcock, C.E. Object-Based Cloud and Cloud Shadow Detection in Landsat Imagery. Remote Sens. Environ. 2014, 152, 120–134. [Google Scholar] [CrossRef]
- Lopes, M.; Frison, P.; Crowson, M.; Warren-Thomas, E.; Hariyadi, B.; Kartika, W.D.; Agus, F.; Hamer, K.C.; Stringer, L.; Hill, J.K.; et al. Improving the Accuracy of Land Cover Classification in Cloud Persistent Areas Using Optical and Radar Satellite Image Time Series. Methods Ecol. Evol. 2020, 11, 532–541. [Google Scholar] [CrossRef]
- Man, C.D.; Nguyen, T.T.; Bui, H.Q.; Lasko, K.; Nguyen, T.N.T. Improvement of Land-Cover Classification over Frequently Cloud-Covered Areas Using Landsat 8 Time-Series Composites and an Ensemble of Supervised Classifiers. Int. J. Remote Sens. 2018, 39, 1243–1255. [Google Scholar] [CrossRef]
- Shrestha, D.P.; Saepuloh, A.; van der Meer, F. Land Cover Classification in the Tropics: Solving the Problem of Cloud-Covered Areas Using Topographic Parameters. Int. J. Appl. Earth Obs. Geoinf. 2019, 77, 84–93. [Google Scholar] [CrossRef]
- Promme, P.; Kuwornu, J.K.M.; Jourdain, D.; Shivakoti, G.P.; Soni, P. Factors Influencing Rubber Marketing by Smallholder Farmers in Thailand. Dev. Pract. 2017, 27, 865–879. [Google Scholar] [CrossRef]
- Fan, S.; Chan-Kang, C. Is Small Beautiful? Farm Size, Productivity, and Poverty in Asian Agriculture. Agric. Econ. 2005, 32, 135–146. [Google Scholar] [CrossRef]
- Kwanmuang, K. Succession Decisions and Inherited Land Size: An Evidence of Family Farms in Nakhon Si Thammarat Province, Thailand. Asian J. Appl. Econ. 2018, 25, 70–88. [Google Scholar]
- Kwanmuang, K.; Pongputhinan, T.; Jabri, A.; Chitchumnung, P. Small-Scale Farmers Under Thailand’s Smart Farming System. FFTC Agric. Policy Platf. (FFTC-AP) 2020, 636, 2647. [Google Scholar]
- Nguyen, C.T.; Chidthaisong, A.; Kieu Diem, P.; Huo, L.-Z. A Modified Bare Soil Index to Identify Bare Land Features during Agricultural Fallow-Period in Southeast Asia Using Landsat 8. Land. 2021, 10, 231. [Google Scholar] [CrossRef]
- Liu, Y.; Meng, Q.; Zhang, L.; Wu, C. NDBSI: A normalized difference bare soil index for remote sensing to improve bare soil mapping accuracy in urban and rural areas. CATENA 2022, 214, 106265. [Google Scholar] [CrossRef]
- García, O. Dynamical implications of the variability representation in site-index modelling. Eur. J. For. Res. 2011, 130, 671–675. [Google Scholar] [CrossRef]
- Skovsgaard, J.P.; Vanclay, J.K. Forest site productivity: A review of the evolution of dendrometric concepts for even-aged stands. Forestry 2008, 81, 13–31. [Google Scholar] [CrossRef]


| Cultivation Area | Plainland | Hillside | Total |
|---|---|---|---|
| Num. of POI | 9251 | 949 | 10,200 |
| Correct | 7837 (84.7%) | 782 (82.4%) | 8619 (84.5%) |
| Incorrect | 1058 (11.4%) | 118 (12.4%) | 1179 (11.5%) |
| Underestimate (“NA”) | 356 (3.8%) | 49 (5.2%) | 405 (4.0%) |
Disclaimer/Publisher’s Note: The statements, opinions and data contained in all publications are solely those of the individual author(s) and contributor(s) and not of MDPI and/or the editor(s). MDPI and/or the editor(s) disclaim responsibility for any injury to people or property resulting from any ideas, methods, instructions or products referred to in the content. |
© 2025 by the authors. Licensee MDPI, Basel, Switzerland. This article is an open access article distributed under the terms and conditions of the Creative Commons Attribution (CC BY) license (https://creativecommons.org/licenses/by/4.0/).
Share and Cite
Wongsai, S.; Sanpayao, M.; Jirakajohnkool, S.; Wongsai, N. Pixel-Based Mapping of Rubber Plantation Age at Annual Resolution Using Supervised Learning for Forest Inventory and Monitoring. Forests 2025, 16, 672. https://doi.org/10.3390/f16040672
Wongsai S, Sanpayao M, Jirakajohnkool S, Wongsai N. Pixel-Based Mapping of Rubber Plantation Age at Annual Resolution Using Supervised Learning for Forest Inventory and Monitoring. Forests. 2025; 16(4):672. https://doi.org/10.3390/f16040672
Chicago/Turabian StyleWongsai, Sangdao, Manatsawee Sanpayao, Supet Jirakajohnkool, and Noppachai Wongsai. 2025. "Pixel-Based Mapping of Rubber Plantation Age at Annual Resolution Using Supervised Learning for Forest Inventory and Monitoring" Forests 16, no. 4: 672. https://doi.org/10.3390/f16040672
APA StyleWongsai, S., Sanpayao, M., Jirakajohnkool, S., & Wongsai, N. (2025). Pixel-Based Mapping of Rubber Plantation Age at Annual Resolution Using Supervised Learning for Forest Inventory and Monitoring. Forests, 16(4), 672. https://doi.org/10.3390/f16040672


