Abstract
Oaks in the genus Quercus L. are keystone species in the forest ecosystem and are considered ideal models for the study of plant evolution. In this research, we applied population genetics, ecological niche analysis and phenotypic traits to explore patterns of species differentiation and demographic history of two Chinese montane oak species (Quercus baronii Skan and Quercus dolicholepis A. Camus) from Quercus section Ilex across species distribution ranges. Analyses of population genetics with ten nuclear microsatellite loci on 33 populations of the two oak species indicated great interspecific genetic variations with distinct genetic backgrounds for the two oaks. Simulations on species demography suggested a speciation-without-migration model as the best to explain species divergence, while an approximate Bayesian computation analysis indicated that the two studied oak species probably split at about 17.80–28.48 Ma. A comparison of two core bioclimatic factors and ecological niche tests revealed strong niche differentiation between the two oak species, and association analysis also found a significantly positive correlation between interspecific genetic variations and bioclimatic distances. Additionally, analyses of the leaf morphology of 117 specimens with five quantitative characteristics showed clear species discrepancy between Q. baronii and Q. dolicholepis. Based on this evidence from genetic, ecological and phenotypic analyses, our research indicated clear species differentiation between Q. baronii and Q. dolicholepis, possibly in relation to an early species divergence and varying adaptative features of the two oaks shaped by heterogeneous environments within Qinling-Daba Mountains and surroundings. This study provides an example for future investigation of species differentiation and evolution among related oak species with integrated analyses and highlights the importance of ecological conditions on adaptive evolution and genetic conservation of endemic tree species in montane regions.
1. Introduction
Dissecting the distribution of genetic diversity and genetic variation across landscapes is conducive to a better understanding of species differentiation and local adaptation under diverse environments [1,2,3]. For plants, especially the long-lived tree species with low evolutionary rates, the genetic background and evolutionary processes are significantly shaped by intrinsic evolutionary features of species as well as abiotic circumstances in habitats; for example, the geohistorical and climatic fluctuations in mountainous environments [4,5,6]. Given the complex and heterogeneous geographical and climatic elements assembled in montane areas, mountains are proposed as a key region for studying the potential mechanisms that drive morphological divergence, genetic differentiation and adaptive evolution of tree species [7,8,9].
Species of the genus Quercus L. (Fagaceae), commonly known as oaks, have offered numerous dominant tree resources to natural and urban forests throughout the Northern Hemisphere [10]. The oaks show a high level of global phylogenetic diversity and strong ecological tolerance in North America and Eurasia, contributing to the utilization of wood and horticulture, biodiversity conservation and development of cultural traditions [11]. Among the oak species, Quercus robur L. is considered a well-known representative for oak genomics, while decoding the genomic features of this oak species (12 chromosomes, 2n = 1.5 Gb) provides a facet that members of the genus Quercus might possess high genomic heterozygosity and spectacular ability for local adaptation in diverse environments, making the oak species an ideal tree model for the study of plant evolution and resource conservation [10,11,12]. However, despite the high heterozygosity found in the genome, oak species may show sensitivity to changed environments during the process of evolution, for the reason that the Quercus species possess relatively low evolutionary rates with long-term life span [13]. Furthermore, the possible incomplete lineage sorting and interspecific introgression among closely related species may have an impact on morphological and genetic decoupling and evolution of oak species (e.g., frequent introgression among white oaks in Quercus section Quercus) [14,15,16,17]. Given the widespread distribution ranges and ecological importance of Quercus species in montane environments, it is of particular significance to understand the patterns of species differentiation and evolutionary dynamics of oaks for plant conservation in forest ecosystems.
Quercus baronii Skan and Quercus dolicholepis A. Camus are two subalpine tree species endemic to China. For the two related oak species, Q. dolicholepis is an evergreen tree while Q. baronii is semi-evergreen. Recent phylogenetic reconstructions indicated that Q. baronii and Q. dolicholepis were clustered in Quercus section Ilex of the Old World oak clade with homogeneous evolutionary rates [18,19]. Moreover, divergent events of the two oaks and other Ilex oak species were dated to the middle-late Miocene during lineage diversification of the Chinese oak species [19,20]. According to our field investigation and model predictions on current species distribution, the main distributions of the two oaks are assembled in the Qinling-Daba Mountains and adjacent regions in central China (Figure S1). Q. baronii is most occurred on the northern slope of the Qinling-Daba Mountains, while populations of Q. dolicholepis are mainly distributed in the southern parts of the Qinling-Daba Mountains with few scattered populations found in southern and eastern China. The two related oak species barely coexist in the Qinling-Daba Mountains and surroundings, which provides a potential that Q. baronii and Q. dolicholepis might possess variant local adaptations under diverse habitats across species distribution ranges. However, due to limited genetic studies performed on the two montane oak species, little is known about the divergent patterns of Q. baronii and Q. dolicholepis at the population level. Namely, genetic background including genetic diversity and genetic variations, phenotypic and ecological differentiation between and within species. Additionally, the potential associations between species differentiation and extrinsic elements in the Qinling-Daba Mountains and adjacent regions have been poorly investigated.
In this study, we first estimated the genetic information (such as genetic diversity and population genetic structure) and species demography for the two Chinese endemic montane oak species Q. baronii and Q. dolicholepis with genetic data obtained from nuclear microsatellite loci, given that the co-dominant nuclear microsatellite markers have significant advantages of high versatility and polymorphism with low expense for population genetics in tree species [21]. The aims of this research were to: (1) investigate the genetic differentiation and demographic history of Q. baronii and Q. dolicholepis across species distribution ranges; (2) test the hypothesis that heterogeneous geographic and ecological conditions within the Qinling-Daba Mountains and surroundings influence species differentiation and evolution of the two studied oaks; and (3) evaluate differences in leaf morphology between Q. baronii and Q. dolicholepis.
2. Materials and Methods
2.1. Sample Information and Microsatellite Genotyping
A total of 565 individuals from 33 natural populations were collected for Q. baronii (20 populations, 362 individuals) and Q. dolicholepis (13 populations, 203 individuals) (Figure 1, Table 1). For each population, healthy leaves were sampled from adult trees spaced at least 100 m apart for laboratory storage at −80° and DNA extraction. Genomic DNA was extracted using the Plant Genomic DNA Kit from TIANGEN (TIANGEN, Beijing, China). Based on a preliminary screening of 17 nuclear microsatellite loci identified from oak species [21,22,23,24], ten of which showed 100% amplification rates in a subset of collected individuals from Q. baronii and Q. dolicholepis were retained for population genetics in this study (Table S1). Amplifications of all samples were obtained based on the ten microsatellite loci with a PCR protocol described by Chen et al. [25]. PCR amplifications were sequenced using an ABI 3730 analyzer (Applied Biosystems, Foster City, CA, USA) and genotyped in GeneMarker v2.20 [26] for genetic analysis.
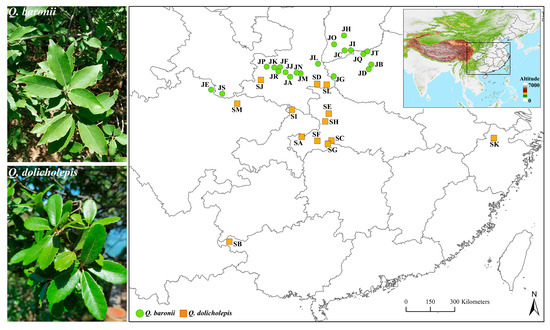
Figure 1.
Photographs and geographical locations of sampled populations for Quercus baronii and Quercus dolicholepis in this study.

Table 1.
Sample information and estimated genetic diversity for populations of Quercus baronii and Quercus dolicholepis.
2.2. Genetic Variation and Population Structure
For the two oak species, linkage disequilibrium (LD) and Hardy–Weinberg disequilibrium (HWD) were tested using Smouse’s multi-locus analyses in Popgene v.1.31 [27]. Analysis of loci under selection was performed with the F-statistics distance method and a hierarchical island model under 50,000 simulations in Arlequin v3.5 [28].
Genetic diversity indices including the number of alleles (Na), the number of effective and private alleles (Ne and Np), observed and expected heterozygosity (Ho and He), global and within-population gene diversity (HT and HS), Jost’s estimate of differentiation (Dest) and fixation index (F) were estimated for each population and species using GenAlEx v6.5 [29]. The allelic richness of each population was estimated in FSTAT v2.9.4 [30]. The pairwise FST genetic distances and relative gene flow rates (Nm) among populations within and between species were estimated with 10,000 permutations in Arlequin v3.5 [28]. An analysis of molecular variance (AMOVA) was performed to investigate genetic variations between species, as well as among and within populations for Q. baronii and Q. dolicholepis using 10,000 permutations with the sum of squared pairwise distance (R-statistics) in Arlequin v3.5 [28].
For analyses of genetic relationships, we adopted Quercus oxyphylla (Wils.) Hand.-Mazz. (three populations, 47 samples) as an outgroup species. Based on the linear FST genetic distance matrix, an individual-based principal coordinates analysis (PCoA) was conducted in GenAlEx v6.5 [29]. Phylogenetic relationships among populations were constructed with the neighbor-joining (NJ) method based on a corrected FST genetic distance and 1000 bootstrap replications in POPTREE2 [31]. Population structures were analyzed using the STRUCTURE v2.3.4 program with the admixture model and 10,000 burn-in steps followed by 1000,000 Markov chain Monte Carlo (MCMC) simulations [32]. For the three species group, including Q. baronii, Q. dolicholepis and outgroup Q. oxyphylla, five independent runs at K from 1 to 6 were performed. For Q. baronii and Q. dolicholepis, K from 1 to 8 were used for each species estimation. For the outgroup Q. oxyphylla, K from 1 to 5 were set. Summarized data of the population genetic structure results were analyzed to estimate the optimal genetic clusters using the Evanno method (ΔK criterion) and display the genetic structure results in Pophelper [33].
2.3. Demographic Models on Species Divergence
Species divergence models between Q. baronii and Q. dolicholepis were simulated using the coalescent algorithms of maximum likelihood analysis implemented in Migraine v 0.5 [34]. Three N-population demographic models, including speciation-with-arbitrary migration (N-pop migration model), speciation-without-migration (N-pop divergence model) and divergence-with-migration (isolation–migration model), were tested for the two related oaks based on genetic data. Each simulation was performed with a stepwise mutation model (SMM) and lower and upper bounds specified for demographic parameters sampling (Table S2). A total of 5000 parameter points and 20 replicates per point with five iterations (Over, Append, Append, Append, Append) were sampled to ensure the accuracy of the PAC-likelihood estimation. After the estimation of likelihood datasets for each demographic model, a subset of estimated points was resampled using the Kriging method with “fixed smoothness = 4” for prediction of the likelihood surface and cross-validation. The final model was determined using a likelihood ratio test, and mean values with 95% confidence intervals (95% CI) on point parameters were estimated for the best demographic model.
Given that the population genetic structure results suggested clear genetic differentiation with rare genetic admixture among Q. baronii, Q. dolicholepis and the outgroup Q. oxyphylla, an approximate Bayesian computation (ABC) methodology was applied to assess the demographic history among species in DIY-ABC 2.1.0 [35]. Four plausible demographic scenarios were compiled, including a contemporary divergence model of the three oak species split from a common ancestor at a ta time (Model-1) and three stepwise divergence models assuming sequential speciation occurred among species at ta and t1 nodes, respectively (Models-2, 3, and 4) (Figure 2). All individuals of the three oak species were used for the ABC simulations with uniform prior settings on demographic parameters listed in Table S3. Prior divergence ranges of the three oaks at ta and t1 were assumed as 10–30 Ma and 1–10 Ma; while for prior distribution on the mutation rate of the ten nuclear microsatellite loci, a uniform range between 1 × 10⁻⁶ and 1 × 10⁻⁵ with a mean value of 5 × 10⁻⁶ were used [19,25]. A total of 5 × 10⁶ simulated datasets was generated with all summary statistics included for the reference table. After model simulations, 1% of the simulated datasets closest to the observed data were selected to evaluate model accuracy as well as estimate the posterior distributions with 95% CI for the most likely model. Model accuracy was also assessed by a goodness-of-fit estimation with 10,000 simulated pseudo-observed datasets (PODs) from the simulated data using a principal component analysis (PCA). Type I and type II errors of confidence in scenario choice and the relative median of absolute errors (RMAE) were evaluated for the best-supported model with 1000 PODs sampled from simulated datasets.
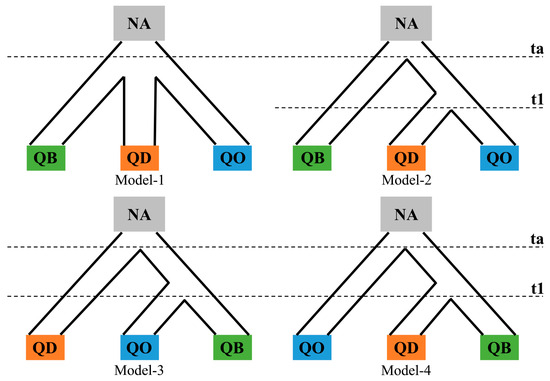
Figure 2.
Illustration of four simulated demographic scenarios on Quercus baronii (QB), Quercus dolicholepis (QD) and outgroup (Quercus oxyphylla, QO).
2.4. Ecological Differentiation Between Q. baronii and Q. dolicholepis
Current distributions of the two studied oaks were predicted based on occurrence data retrieved from the Chinese Virtual Herbarium (www.cvh.ac.cn) (accessed on 9 August 2023) and 19 bioclimatic factors obtained from the WorldClim v2 database (www.worldclim.org) (accessed on 13 December 2023) with a spatial resolution of 2.5 arc-mins. After removing duplicate records with ENMTools 1.4.3 [36], we retained 47 and 58 occurrences for Q. baronii and Q. dolicholepis to predict ecological niche models (ENMs), respectively. ENMs were initially conducted with the entire set of 19 bioclimatic factors in Maxent v3.3.3k [37]. For each species, the top bioclimatic variables showing cumulative contributions > 90% to the Maxent model were selected, and seven bioclimatic factors (BIO6, BIO9, BIO11, BIO12, BIO15, BIO18 and BIO19) shared by the two oak predictions were retained for final predictions and ecological niche tests. The final ENMs of the two oaks were reconstructed with 100 replicates and a maximum training sensitivity plus specificity threshold. A subset of 20% samples was reevaluated for cross-validation and values of area under a receiver-operating characteristic curve (AUC) were used to evaluate model accuracy. The niche identity test and Blob range-breaking test were used to estimate whether the significance of ecological differences exists between species distributions and along species biogeographic boundaries in ENMTools 1.4.3 [36]. Occurrence data were used in the two niche hypothesis tests, with 100 replicates created for estimating the D- and I-statistics [38].
Utilizations of core ecological niches in Q. baronii and Q. dolicholepis were described based on present bioclimatic variables using a two-dimensional kernel density estimation in Past v4.03 [39]. For the 19 bioclimatic data compiled from species occurrences, a Pearson correlation analysis was initially performed to remove bioclimatic factors showing significantly strong multicollinearity (r > 0.8). After estimation of Pearson correlation, eight bioclimatic factors (BIO2, BIO3, BIO4, BIO5, BIO6, BIO14, BIO15 and BIO18) were retained, and relative contributions of these variables on the ecological discrepancy between the two oak species were then estimated using a PCA with correlation distance matrix and 1000 bootstraps. Finally, BIO6 (min temperature of coldest month) and BIO14 (precipitation of driest month) showing the highest loading scores on the first principal component of the PCA were used as core ecological niches to illustrate potential adaptive differentiation between species.
The potential effects of ecological and geographic variations on genetic differentiation between the two oaks were assessed with a Mantel test in PASSaGE v2 [40]. The seven bioclimatic variables selected for ENMs were used to conduct an ecological distance matrix among 33 sampled populations of the two oaks using a scaled Euclidean method, while geographic distances among locations were estimated with a spherical measurement. Correlations of pairwise FST genetic distances with ecological and geographic variations among populations of the two oaks were evaluated using a two-tailed Mantel test with 999 permutations [40].
2.5. Morphological Analysis of Leaf Traits
During population sampling, a subset of herbarium specimens was collected for Q. baronii and Q. dolicholepis throughout species distribution ranges. A total of 63 adult leaf samples of Q. baronii and 54 of Q. dolicholepis were randomly selected and analyzed on five leaf traits to estimate morphological differences between species. Four quantitative characteristics of foliage including numbers of right-side lateral veins (LV), the ratio of leaf blade length to blade width (LWR), angle of the basal midvein (ANG) and leaf area (LA) were measured in Motic Image Plus 2.0 (MOTIC CHINA GROUP Co., Ltd., Xiamen, China). Leaf dry mass (LM) was measured using an electronic balance, and the specific leaf area (SLA) was calculated with LA/LM. The LM showed significant and strong Pearson correlations (r > 0.6) with LWR, LA and SLA, and was removed from the morphological analysis in this study. Variations of each leaf trait were estimated with the Wilcoxon rank-sum test between species pairs, while interspecific morphological differentiation was evaluated using the Multivariate analysis of variance (MANOVA) and Linear Discriminant analysis (LDA). All the statistical analyses on leaf traits were executed in Past v4.03 [39].
3. Results
3.1. Genetic Diversity and Genetic Differentiation
For the ten nuclear microsatellite loci used in this study, no significant deviation from neutrality (p > 0.05) was found (Table S1). Additionally, both the multi-locus LD and HWD were rejected in Q. baronii (LD: r2 = 0.5715, p < 0.001; HWD: r2 = 0.4733, p < 0.05) and Q. dolicholepis (LD: r2 = 0.4304, p < 0.05; HWD: r2 = 0.8804, p < 0.05).
The ten nuclear microsatellite markers showed high polymorphism with a mean of 99.09% polymorphic loci found throughout 33 populations of Q. baronii and Q. dolicholepis. Based on the ten loci, estimates of genetic diversity (Ne, Ho and He) suggested moderate to high genetic diversity for populations of Q. baronii and Q. dolicholepis. Populations having the highest genetic diversity of the two studied oaks were population JM (mean He = 0.7116) of Q. baronii and population SE (mean He = 0.8519) of Q. dolicholepis, which were located at core areas of the Qinling-Daba Mountains. In contrast, populations JA of Q. baronii and SI of Q. dolicholepis with limited samples showed the lowest genetic diversity. Estimations of allelic richness also found low numbers of alleles in populations with few samples, such as population JD (mean Ar = 2.5742) of Q. baronii and population SI (mean Ar = 2.6000) from Q. dolicholepis (Table 1).
The global genetic diversity of Q. dolicholepis (He = 0.9273, Dest = 0.5783, HT = 0.9231, HS = 0.7762, Np = 28.3000) was higher than that found in Q. baronii (He = 0.7888, Dest = 0.4066, HT = 0.7952, HS = 0.6377, Np = 4.4000) at the species level, while estimations of fixation index indicated possible inbreeding within populations for Q. baronii (F = 0.5527) and Q. dolicholepis (F = 0.8826) (Table 2).
Table 2.
Estimations on global genetic diversity of Quercus baronii and Quercus dolicholepis.
The AMOVA estimations indicated significant genetic variations among populations for Q. dolicholepis (RST = 0.8279, p < 0.0001), while most of the overall genetic variations were distributed within populations of Q. baronii (53.22%). For the species group, significantly high genetic differentiation (RST = 0.9880, p < 0.0001) was found between Q. baronii and Q. dolicholepis (Table 3).
Table 3.
Analysis of molecular variance (AMOVA) for Quercus baronii and Quercus dolicholepis in this study.
3.2. Population Structure and Species Relationships
Using Q. oxyphylla as an outgroup, phylogenetic relationships of the three oak species based on a NJ method indicated clear genetic differentiation among species at the population level; in the unrooted phylogenetic tree, all the three oak species were monophyletic with strong bootstrap supporting values > 80 (Figure 3a). Consistently, the individual-based PCoA also showed great genetic variations without sample overlaps among the three oak species (Figure 3b).
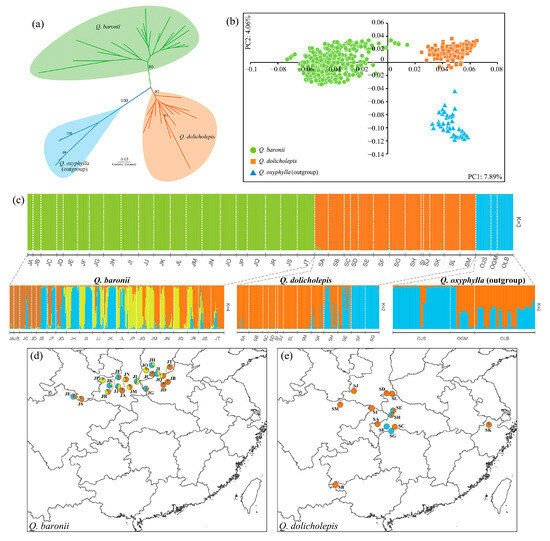
Figure 3.
Phylogenetic relationships of Quercus baronii, Quercus dolicholepis and outgroup (Quercus oxyphylla) based on (a) neighbor-joining tree and (b) principal coordinates analysis (PCoA). (c) Analyses of population genetic structures on species group and each oak species using Evanno’s ΔK method, and geographical distributions of population structures in (d) Q. baronii and (e) Q. dolicholepis. Colors in the pie correspond to the estimated genetic clusters in Q. baronii and Q. dolicholepis.
Analysis of population genetic structure on species group including Q. baronii, Q. dolicholepis and outgroup (Q. oxyphylla) revealed that the three oak species were clearly identified with distinct nuclear gene pools based on the ΔK criterion (K = 3) (Figure S2), and nearly no genetic admixture occurred among the three oaks (Figure 3c). Further analyses of the population structure of Q. baronii and Q. dolicholepis suggested hierarchical genetic structures for four genetic groups with complex genetic admixture of Q. baronii (K = 4) and two genetic clusters within Q. dolicholepis (K = 2) (Figure 3c–e).
3.3. Models of Species Divergence, Species Demographic History and Gene Flow
For the three species divergence models simulated on Q. baronii and Q. dolicholepis, model comparisons with likelihood ratio tests suggested the speciation-without-migration model (log-likelihood = −1939.2, p < 0.0001) as the most optimal scenario for the two Ilex oaks (Table 4). According to the divergence model, both the profile likelihood ratio of migration events and posterior point estimations indicated asymmetric but negligible migration rates between the two studied oaks (a mean of 0.802 migrants per generation from Q. baronii to Q. dolicholepis and 0.212 migrants per generation for the reverse direction) (Figure 4a, Table S2). For estimates of the ancestral population sizes (Na), the bounds of resampled points revealed a low population size of the most recent common ancestor (86.08 with 95% CI from 69.74 to 102.10) for Q. baronii and Q. dolicholepis (Table S2).
Table 4.
Likelihood ratio tests on species divergence models between Quercus baronii and Quercus dolicholepis.
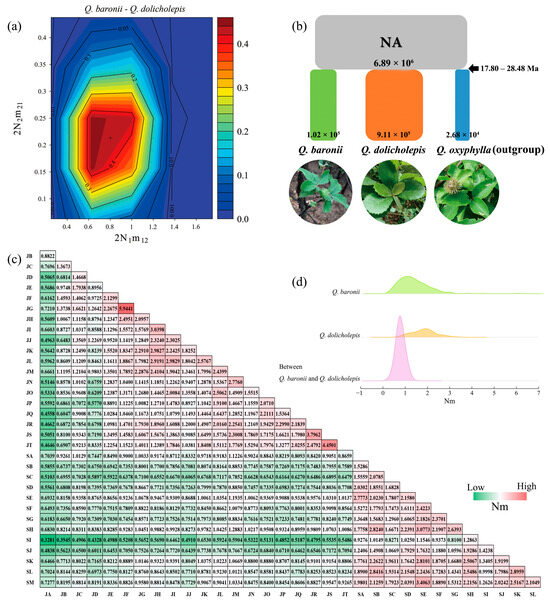
Figure 4.
(a) Profile of likelihood ratio on migration rates between Quercus baronii and Quercus dolicholepis under the most optimal species divergence model. (b) Posterior estimates of the best supported demographic model (Model-1) for Q. baronii, Q. dolicholepis and outgroup (Q. oxyphylla) in approximate Bayesian computation. (c) Heatmap matrix of estimated pairwise gene flow rates (Nm) among sampled populations and (d) ridgeline plot on distribution density of Nm within and between Q. baronii and Q. dolicholepis.
For ABC simulations, the model accuracy of the four plausible demographic scenarios was highly supported by the PCA evaluations using 1% simulated PODs from the posterior distribution (Figure S3a–d). A comparison of the four simulated models (Figure 2) showed that the first scenario (Model-1) provided the best-fit model to explain demographic history among Q. baronii, Q. dolicholepis and outgroup (Q. oxyphylla) under high values of direct (mean probability = 0.9505) and logistic (mean probability = 0.6798) estimations (Figure S3e,f). Further analysis of the confidence of scenario choice for the best-supported Model-1 showed significantly low values of mean type I (direct estimate: 0.006; logistic regression: 0.012) and type II (direct estimate: 0.032; logistic regression: 0.017) errors and the RMAE values for all parameters of Model-1 were low, indicating reliable estimates of posterior distributions for the ABC simulations (Table S3). According to the posterior estimations of ABC analysis, the mean divergence time (ta) of the three oak species could date back to 3.56 × 10⁵ generations ago (95% CI: 3.14 × 10⁵–3.74 × 10⁵). As a consequence, given an assumption of 50 to 80 years for the generation time of long-lived oak species [41], the Model-1 indicated that the three Chinese oaks probably split from a most recent common ancestor at about 17.80 to 28.48 Ma with varying effective population sizes. Among the three related oak species, Q. dolicholepis showed the highest mean effective population size (911,000) compared with Q. baronii (102,000) and the outgroup species Q. oxyphylla (26,800) (Figure 4b, Table S3).
Estimations of pairwise gene flow rates among populations (Nm) showed a rough trend that exchanges of migrants per generation among populations were higher within Q. baronii and Q. dolicholepis than that occurred between species (Figure 4c). Correspondently, the estimated pairwise FST genetic distances among populations of the two Ilex oak species revealed lower values of genetic differentiation within species than that found between the two oaks (Table S4). In addition, summary statistics of the pairwise gene flow rates (Nm) indicated that the mean migration rates per generation between the two studied oaks (Nm = 0.7931) were significantly lower than that estimated for Q. baronii (Nm = 1.4069, Wilcoxon rank-sum test: z = 11.673, p = 0.0001) and Q. dolicholepis (Nm = 1.8401, z = 12.908, p = 0.0001) (Figure 4d).
3.4. Ecological Differentiation and Association Analysis
The accuracy of ENMs on current species distributions was strongly supported by the high AUC values for Q. baronii (mean AUC = 0.991) and Q. dolicholepis (mean AUC = 0.979), which suggested reliable model predictions on species distributions in this study. Additionally, the simulated layouts corresponded with our sample locations, supporting that the Qinling-Daba Mountains and surroundings act as optimal and core habitats, preserving the two montane oak species (Figure S1). Based on the D- and I-statistics, both the niche identity test and range-breaking test indicated significant ecological differentiation between species distributions (D = 0.3653, t = 21.381, p < 0.0001; I = 0.6739, t = 13.126, p < 0.0001) as well as between species biogeographic boundaries (D = 0.3653, t = 14.961, p < 0.0001; I = 0.6739, t = 12.61, p < 0.0001) of Q. baronii and Q. dolicholepis (Figure 5a,b).
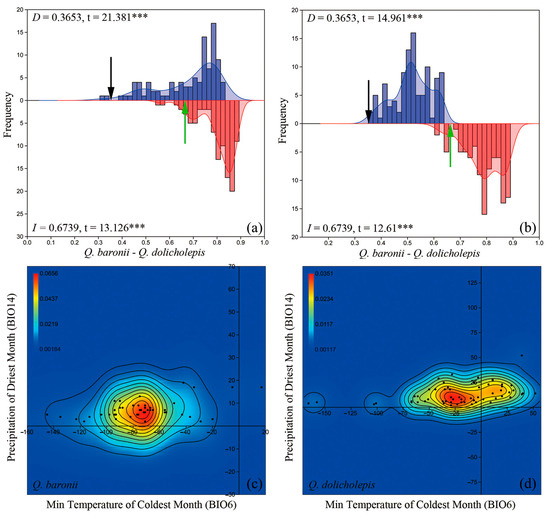
Figure 5.
Estimations of ecological differentiation with (a) niche identity test and (b) blob range-breaking test between Quercus baronii and Quercus dolicholepis. Histograms with shade of blue and shade of red represent null distributions of niche overlaps generated from pseudoreplicates for D- and I-statistics, while black and green arrows indicate estimated values of the D- and I-statistics between species. ***: p < 0.0001. (c,d) Distributions of two-dimensional kernel density on two core bioclimatic variables (BIO6 and BIO14) for Q. baronii and Q. dolicholepis.
Estimates of potentially adaptative differentiation and statistical analysis with Wilcoxon rank-sum test revealed variant distributions and significant differences of the two-dimensional kernel density on two core bioclimatic factors (BIO6: z = 6.4616, p = 0.0001 and BIO14: z = 3.5299, p = 0.0003) adopted by Q. baronii and Q. dolicholepis (Figure 5c,d). According to the density profiles, Q. baronii could tolerate a relatively low and restricted niche breadth on the minimum temperature of the coldest month (BIO6, mean ± standard error = −75.4255 ± 4.9140; variance = 1134.945) and precipitation of driest month (BIO14, mean ± standard error = 7.1489 ± 0.5850; variance = 16.0860), while Q. dolicholepis might adapt to a higher and wider niche ranges of BIO6 (mean ± standard error = −20.4310 ± 5.7357; variance = 1908.074) and BIO14 (mean ± standard error = 13.2931 ± 1.2709; variance = 93.6845).
The results of the Mantel tests indicated a significant and positive correlation between bioclimatic variations and genetic distances for the species pair (r = 0.3069, two-tailed p-value = 0.0006), while the association between geographical distance and genetic variations was nonsignificant (r = 0.0451, two-tailed p-value = 0.6990). For Q. baronii and Q. dolicholepis no correlations were found between climatic variations and genetic distances as well as between geographical and genetic distances (Table S5).
3.5. Variations of Leaf Morphology
Comparisons of five leaf traits showed higher values of leaf blade length-to-width ratio (LWR), angle of basal midvein (ANG) and specific leaf area (SLA) in Q. baronii than that found in Q. dolicholepis, while leaf area (LA) of Q. baronii was lower than Q. dolicholepis. Statistical analysis using the Wilcoxon rank-sum test indicated significant differences in LWR (z = 8.4882, p < 0.0001), ANG (z = 5.6670, p < 0.0001), LA (z = 6.2957, p < 0.0001) and SLA (z = 8.9802, p < 0.0001) between the two studied oak species. For the numbers of right-side lateral veins (LV), nonsignificant variations between the two oak species were found (z = 0.0556, p = 0.9574) (Figure 6a–e, Table S6).
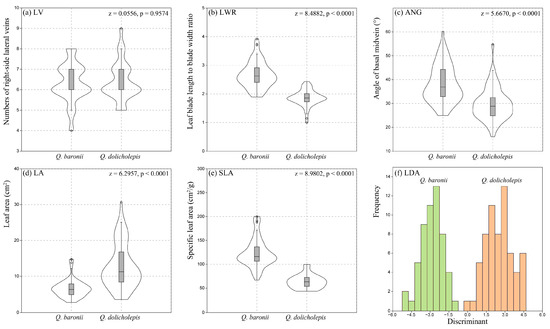
Figure 6.
Comparisons of five quantitative characteristics (a–f) linear discriminant analysis (LDA) on leaf morphology between Quercus baronii and Quercus dolicholepis. LV: numbers of right-side lateral veins; LWR: ratio of leaf blade length to blade width; ANG: angle of basal midvein; LA: leaf area; SLA: specific leaf area.
The result of LDA identified clear morphological groups between Q. baronii and Q. dolicholepis with 100% of correctly classified individuals for each oak species (Figure 6f). In addition, the MANOVA test revealed a significant global difference of five leaf traits between the two oak species (Wilks’ λ = 0.1167, F = 168, p < 0.0001), suggesting unambiguous capacity on species discrimination with the selected leaf traits in this study.
4. Discussion
4.1. Species Differentiation Between Q. baronii and Q. dolicholepis
Oaks in the genus Quercus are recognized as a conspicuous species group for challenging the classical biological species concept due to phenotypic similarity and plasticity shaped by strong adaptive capacity [14]. Furthermore, several genetic and phylogenetic research studies also suggest that potential introgression and/or hybridization among related oak species could cause conflicts between morphological and genetic differentiations [42,43,44]. The above aspects are commonly found in the red and white oak groups from the New World oak clade, and have significant influences on revealing species genetic variations, infrageneric phylogeny and evolution of genus Quercus [16,17,45].
Based on quantitative statistics of five leaf traits and population genetics with ten microsatellite loci, we explored the species differentiation patterns between Q. baronii and Q. dolicholepis from Quercus section Ilex in the Old World oak clade. The morphological analyses in our study indicate a great capacity of species discrimination in leaf shape (such as leaf blade length to blade width ratio, angle of basal midvein and leaf area) and physiological index (specific leaf area) between the two studied Ilex oak species (Figure 6, Table S6). Analyses of population genetics suggest remarkable genetic differentiations that Q. baronii and Q. dolicholepis potentially possess distinct gene pools with relatively low rates of interspecific gene flow (Figure 3 and Figure 4, Table 3). Additionally, using the coalescent algorithms of maximum likelihood analysis, the optimal model for species divergence also supports a scenario of speciation-without-migration between the two related Ilex oaks, possibly suggesting complete lineage sorting evolved in Q. baronii and Q. dolicholepis during speciation in the Old World oak clade (Table 4 and Table S2). The results of great genetic differentiation between Q. baronii and Q. dolicholepis herein differ from previous studies on sympatric alpine sclerophyllous oaks from Quercus section Ilex at Hengduan Mountains, while the latter showed obvious genetic admixtures among closely related alpine oak species as well as unclear interspecific genetic relationships [46,47,48]. For the genus Quercus, the pattern of speciation with gene flow has been commonly found among closely related oak species within section [41,43,44,49,50]; thus, the results of great species differentiation with negligible interspecific migrations found in this study possibly reflect that Q. baronii and Q. dolicholepis are distantly related oaks with plausible reproductive isolation in Quercus section Ilex. However, this inference requires further verification covering more related species from Quercus section Ilex with large-scale population samplings as well as genome-wide data.
Alternatively, given that our demographic simulations with the ABC method and ecological niche analysis suggested a late Oligocene to early Miocene divergence (about 17.80 to 28.48 Ma) (Figure 4b) and significant ecological differentiations between the two studied oak species (Figure 5), another plausible explanation on this aspect is that the relatively long-term evolutionary processes combined with varying utilization on ecological niches likely shape the species distribution, genetic differentiation and local adaptation of Q. baronii and Q. dolicholepis across species distribution boundary. Similar results were found in a phylogeographic study on two American live oaks (Quercus virginiana Mill. and Quercus oleoides Schltdi. & Cham.) in Quercus section Virentes, in which the researchers found great genetic break at species geographical boundary for the two relatives, while climatic changes were suggested as potential causes in circumscribing species distribution and interspecific genetic variation of the two oak species [51].
4.2. Evolutionary History and Potential Drivers on Species Divergence
Simulations on species demographic history suggest a synchronous speciation model for Q. baronii, Q. dolicholepis and the outgroup Q. oxyphylla that the plausible split event of the three oak species was proposed during the late Oligocene to early Miocene, a warming paleoclimatic period at about 17.80–28.48 Ma (Figure 4b, Table S3). The divergence time found in this study is highly consistent with previous phylogenetic reconstructions based on Chinese oaks as well as on species from Quercus section Ilex [19,20]. In addition, fossil evidence and recent phylogeographic research on Quercus section Ilex indicated that the ancestor of Quercus section Ilex possibly originated in East Asia/Himalayan regions at the Eocene epoch, followed by species establishment across Eurasia via lineage diversification during the Oligocene to Miocene; current species of Quercus section Ilex in East Asia might derive locally since the Miocene [20,52]. Accordingly, if speciation and evolution of Q. baronii and Q. dolicholepis occurred locally across their major distribution ranges, then the geographic and climatic disturbances within Qinling-Daba Mountains and surroundings could be potential abiotic drivers in triggering the adaptive evolution of the two endemic montane oak species [19,20]. The simulated time of species divergence (about 17.80–28.48 Ma) also corresponds with a geological period when the accelerated uplift of the Qinghai-Tibetan Plateau occurred during the Oligocene to Miocene, which highlights the importance of geohistorical and climatic changes in mountainous environments for the formation of phylogeographic and evolutionary patterns in plant species [9,53].
Based on our ecological niche analyses, the profiles of two-dimensional kernel density on two bioclimatic factors (BIO6 and BIO14) indicate that Q. baronii and Q. dolicholepis possibly adapt to distinct ecological elements related to temperature and precipitation within species distribution ranges (Figure 5c,d). Moreover, the ecological niche tests and association analysis suggest that changes in bioclimatic variables rather than geographical isolations likely explain the genetic differentiation and species distribution patterns of the two Ilex oaks (Figure 5a,b, Table S5). These results support a hypothesis that the Qinling-Daba Mountains and adjacent regions in central China possibly act as ecological barriers promoting species differentiation and local adaptation between Q. baronii and Q. dolicholepis. However, given the neutrality of nuclear microsatellite loci used in this study (Table S1), future research adopting genomic data and landscape association analysis may be helpful to identify selective signals in species genome and provide direct evidence of mechanisms of adaptive evolution in the two montane oak species.
4.3. Genetic Diversity and Implications on Species Conservation of the Two Endemic Oaks
Despite the large effective population sizes and wide distribution ranges, oaks are sensitive to habitat changes due to long generation times and relatively low evolutionary rates in the genome [13,47]. Furthermore, the high frequency and long-distance dispersal of wind-pollinated pollen flow in oak’s reproductive system help facilitate the outcrossing rates among populations within species, promoting the accumulation of genetic variation and complex population genetic structure [14,41]. In this study, both the two montane oaks show moderate to high genetic diversity (Q. baronii: Dest = 0.4066, HT = 0.7952, HS = 0.6377; Q. dolicholepis: Dest = 0.5783, HT = 0.9231, HS = 0.7762) throughout their major distribution ranges, which suggests high quality and relatively stable environments for species maintenance of Q. baronii and Q. dolicholepis in the Qinling-Daba Mountains and adjacent regions (Table 2). The relatively high values of genetic diversity in the two endemic Ilex oaks are comparable with that found in previous research on three widespread Chinese Cerris oaks (Quercus acutissima Carruth, Quercus variabilis Bl. and Quercus chenii Nakai) and two temperate deciduous oaks (Quercus wutaishanica Mayr and Quercus mongolica Fisch. ex Ledeb.) from Quercus section Quercus and is a little lower than that found for an evergreen sclerophyllous oak species group comprising seven recognized species in the Himalaya-Hengduan Mountains [25,41,47].
Across species distribution ranges the populations having few samples showed the lowest genetic diversity in the two Ilex oaks (e.g., populations SI, JA and JD in Table 1). The relatively low level of genetic diversity obtained in these populations is possibly referred to by the limited sample sizes and polymorphic differences of microsatellite markers used in this study. As a consequence, the estimation of species genetic variations in Q. baronii and Q. dolicholepis may be biased and should be treated with caution due to sampling disequilibrium among populations. Furthermore, potential evolutionary processes like bottleneck effect and marginal effect, as well as habitat changes, may have great impacts on population decline, leading to the loss of genetic diversity [13,41,54]. Moreover, the estimates of fixation index at the species level revealed positive and high values for Q. baronii (F = 0.5527) and Q. dolicholepis (F = 0.8826), possibly implying genetic decay within populations of the two endemic oak species in the face of frequent inbreeding (Table 2).
For Q. baronii, the results of population structure and AMOVA analysis revealed complex genetic clusters among populations (K = 4, Figure 3c) and considerable genetic variations within populations (Table 3 and Table S4), which reflect the diverse gene flow patterns among populations within species (Figure 4c) and support a proposition that the complex topographic structures and heterogeneous environments in the Qinling Mountains and adjacent regions have played an important role in preservation of genetic resources for plant species [53,54]. However, given the restricted niche breadth of two core bioclimatic factors found in Q. baronii (Figure 5c), rapid climate changes, as well as intraspecific genetic drift, may cause fast maladaptation and population decline of this oak species, leading to a loss of genetic diversity if inbreeding within populations continued [55,56,57]. Among the Chinese Ilex oaks, Q. dolicholepis is more likely a sclerophyllous species that mainly occurred in open and limestone habitats in the southern part of the Qinling-Daba Mountains and adjacent regions (Figure 1 and Figure S1). Although the high effective population size and genetic diversity found in Q. dolicholepis (Figure 4b, Table 1 and Table 2), current populations of this oak species are found severely scattered by anthropogenic activities according to our field investigation. Considering the relatively low genetic variations within populations based on AMOVA and high inbreeding value (F = 0.8826) in Q. dolicholepis (Table 2 and Table 3), a restoration of species habitats may be beneficial to the maintenance of genetic diversity and population size of this evergreen montane oak.
5. Conclusions
In this study, we explored the patterns of genetic variations, species differentiation and evolution for two Chinese endemic oak species, Q. baronii and Q. dolicholepis from Quercus section Ilex by combining population genetics, ecological niche and leaf morphology analyses. The two related montane oak species showed great interspecific genetic differentiation with distinct genetic backgrounds and rare admixture based on ten nuclear microsatellite data. Simulations on species demography revealed a deep-time divergence between Q. baronii and Q. dolicholepis at about 17.80–28.48 Ma during the late Oligocene to early Miocene. Analyses of ecological niches suggested significant ecological differences between species boundaries, and the two studied oaks might adapt to varying bioclimatic factors across their major distribution ranges within the Qinling-Daba Mountains and adjacent regions. Moreover, a comparison analysis of five leaf traits indicated a clear discrepancy in species morphology between Q. baronii and Q. dolicholepis. The overall findings in this study indicate strong species differentiation between the two Ilex oaks and support a potential scenario that heterogeneous abiotic environments within Qinling-Daba Mountains and surroundings likely shape the species differentiation and local adaptation of Q. baronii and Q. dolicholepis during species evolutionary processes. Additionally, the Qinling-Daba Mountains may act as effective shelters for the maintenance of genetic variation in the two montane oaks. Future research using large-scale population genomics combined with ecological association analysis may facilitate our understanding of the speciation and adaptive evolution of Q. baronii and Q. dolicholepis in mountainous environments.
Supplementary Materials
The following supporting information can be downloaded at: https://www.mdpi.com/article/10.3390/f16030549/s1, Figure S1: Predictions of current species distributions for (a) Quercus baronii and (b) Quercus dolicholepis with ecological niche modelling. Gradient colors from light green to green in (a) and from light orange to orange in (b) refer to the habitat suitability from moderate (probability > 0.6) to the highest suitability (probability > 0.8) for Q. baronii and Q. dolicholepis; Figure S2: Estimations of genetic clusters using the ΔK criterion for species group and each oak species including Quercus baronii, Quercus dolicholepis and outgroup Quercus oxyphylla in this study; Figure S3: Principal component analysis (PCA) and comparisons of direct and logistic posterior probabilities on four simulated demographic scenarios for model checking in approximate Bayesian computation; Table S1: Primers information and neutrality tests of ten nuclear microsatellite loci used in this study; Table S2: Parameter settings of three species divergence models between Quercus baronii and Quercus dolicholepis and point estimations of parameters on the most probable model; Table S3: Prior settings for demographic parameters of four simulated scenarios and posterior estimates on the best supported model (Model-1) in approximate Bayesian computation; Table S4: Estimated pairwise FST values among sampled populations of Quercus baronii and Quercus dolicholepis; Table S5: Results of Mantel tests among genetic, geographic and bioclimatic distances for Quercus baronii and Quercus dolicholepis; Table S6: Statistical results of five leaf traits for Quercus baronii and Quercus dolicholepis.
Author Contributions
Formal analysis and data curation, Z.-M.C., L.-L.Z., Y.-J.H. and J.Y.; resources and validation, X.-D.C. and J.Y.; writing—original draft preparation, J.Y. All authors have read and agreed to the published version of the manuscript.
Funding
This research was funded by the Projects of the National Natural Science Foundation of China (32471901, 31901077), and the Shaanxi Fundamental Science Research Project for Chemistry & Biology (22JHQ041).
Data Availability Statement
Original genetic data and measurements of leaf traits in this study are available in Supplementary Materials-Original data.
Conflicts of Interest
The authors declare no conflicts of interest.
References
- Nevado, B.; Wong, E.L.Y.; Osborne, O.G.; Filatov, D.A. Adaptive evolution is common in rapid evolutionary radiations. Curr. Biol. 2019, 29, 3081–3086. [Google Scholar] [CrossRef] [PubMed]
- Singhal, S.; Roddy, A.B.; DiVittorio, C.; Sanchez-Amaya, A.; Henriquez, C.L.; Brodersen, C.R.; Fehlberg, S.; Zapata, F. Diversification, disparification and hybridization in the desert shrubs Encelia. New Phytol. 2021, 230, 1228–1241. [Google Scholar] [CrossRef] [PubMed]
- Xia, X.M.; Yang, M.Q.; Li, C.L.; Huang, S.X.; Jin, W.T.; Shen, T.T.; Wang, F.; Li, X.H.; Yoichi, W.; Zhang, L.H.; et al. Spatiotemporal evolution of the global species diversity of Rhododendron. Mol. Biol. Evol. 2022, 39, msab314. [Google Scholar] [CrossRef] [PubMed]
- Du, F.K.; Hou, M.; Wang, W.T.; Mao, K.S.; Hampe, A. Phylogeography of Quercus aquifolioides provides novel insights into the Neogene history of a major global hotspot of plant diversity in south-west China. J. Biogeogr. 2017, 44, 294–307. [Google Scholar] [CrossRef]
- Smycka, J.; Roquet, C.; Boleda, M.; Alberti, A.; Boyer, F.; Douzet, R.; Perrier, C.; Rome, M.; Valay, J.-G.; Denoeud, F. Tempo and drivers of plant diversification in the European mountain system. Nat. Commun. 2022, 13, 2750. [Google Scholar] [CrossRef]
- Wang, X.Y.; Liang, D.; Wang, X.M.; Tang, M.K.; Liu, Y.; Liu, S.Y.; Zhang, P. Phylogenomics reveals the evolution, biogeography, and diversification history of voles in the Hengduan Mountains. Commun. Biol. 2022, 5, 1124. [Google Scholar] [CrossRef]
- Hughes, C.E.; Atchison, G.W. The ubiquity of alpine plant radiations: From the Andes to the Hengduan Mountains. New Phytol. 2015, 207, 275–282. [Google Scholar] [CrossRef]
- Bedoya, A.M.; Leache, A.D.; Olmstead, R.G. Andean uplift, drainage basin formation, and the evolution of plants living in fast-flowing aquatic ecosystems in northern South America. New Phytol. 2021, 232, 2175–2190. [Google Scholar] [CrossRef]
- Wu, S.D.; Wang, Y.; Wang, Z.F.; Shrestha, N.; Liu, J.Q. Species divergence with gene flow and hybrid speciation on the Qinghai-Tibet Plateau. New Phytol. 2022, 234, 392–404. [Google Scholar] [CrossRef]
- Kremer, A.; Hipp, A.L. Oaks: An evolutionary success story. New Phytol. 2020, 226, 987–1011. [Google Scholar] [CrossRef]
- Plomion, C.; Aury, J.M.; Amselem, J.; Alaeitabar, T.; Barbe, V.; Belser, C.; Berges, H.; Bodénès, C.; Boudet, N.; Boury, C.; et al. Decoding the oak genome: Public release of sequence data, assembly, annotation and publication strategies. Mol. Ecol. Resour. 2016, 16, 254–265. [Google Scholar] [CrossRef]
- Plomion, C.; Aury, J.M.; Amselem, J.; Leroy, T.; Murat, F.; Duplessis, S.; Faye, S.; Francillonne, N.; Labadie, K.; Le Provost, G.; et al. Oak genome reveals facets of long lifespan. Nat. Plants 2018, 4, 440–452. [Google Scholar] [CrossRef] [PubMed]
- Gugger, P.F.; Ikegami, M.; Sork, V.L. Influence of late Quaternary climate change on present patterns of genetic variation in valley oak, Quercus lobata Nee. Mol. Ecol. 2013, 22, 3598–3612. [Google Scholar] [CrossRef] [PubMed]
- Eaton, D.A.; Hipp, A.L.; Gonzalez-Rodriguez, A.; Cavender-Bares, J. Historical introgression among the American live oaks and the comparative nature of tests for introgression. Evolution 2015, 6, 2587–2601. [Google Scholar] [CrossRef] [PubMed]
- McVay, J.D.; Hipp, A.L.; Manos, P.S. A genetic legacy of introgression confounds phylogeny and biogeography in oaks. Proc. R. Soc. Lond. B. Biol. Sci. 2017, 284, 20170300. [Google Scholar] [CrossRef]
- Kim, B.Y.; Wei, X.; Fitz-Gibbon, S.; Lohmueller, K.E.; Ortego, J.; Gugger, P.F.; Sork, V.L. RADseq data reveal ancient, but not pervasive, introgression between Californian tree and scrub oak species (Quercus sect. Quercus: Fagaceae). Mol. Ecol. 2018, 27, 4556–4571. [Google Scholar] [CrossRef]
- Crowl, A.A.; Manos, P.S.; McVay, J.D.; Lemmon, A.R.; Lemmon, E.M.; Hipp, A.L. Uncovering the genomic signature of ancient introgression between white oak lineages (Quercus). New Phytol. 2020, 226, 1158–1170. [Google Scholar] [CrossRef]
- Hipp, A.L.; Manos, P.S.; Hahn, M.; Avishai, M.; Bodenes, C.; Cavender-Bares, J.; Crowl, A.A.; Deng, M.; Denk, T.; Fitz-Gibbon, S.; et al. Genomic landscape of the global oak phylogeny. New Phytol. 2020, 226, 1198–1212. [Google Scholar] [CrossRef]
- Yang, J.; Guo, Y.F.; Chen, X.D.; Zhang, X.; Ju, M.M.; Bai, G.Q.; Liu, Z.L.; Zhao, G.F. Framework phylogeny, evolution and complex diversification of Chinese oaks. Plants 2020, 9, 1024. [Google Scholar] [CrossRef]
- Jiang, X.L.; Hipp, A.L.; Deng, M.; Su, T.; Zhou, Z.K.; Yan, M.X. East Asian origins of European holly oaks (Quercus section Ilex Loudon) via the Tibet-Himalaya. J. Biogeogr. 2019, 46, 2203–2214. [Google Scholar] [CrossRef]
- Dow, B.D.; Ashley, M.V.; Howe, H.F. Characterization of highly variable (GA/CT)n microsatellites in the bur oak, Quercus macrocarpa. Theor. Appl. Genet. 1995, 91, 137–141. [Google Scholar] [CrossRef]
- Steinkellner, H.; Fluch, S.; Turetschek, E.; Lexer, C.; Streiff, R.; Kremer, A.; Burg, K.; Glossl, J. Identification and characterization of (GA/CT)n-microsatellite loci from Quercus petraea. Plant Mol. Biol. 1997, 33, 1093–1096. [Google Scholar] [CrossRef]
- Kampfer, S.; Lexer, C.; Glossl, J.; Steinkellner, H. Characterization of (GA)n microsatellite loci from Quercus robur. Hereditas 2004, 129, 183–186. [Google Scholar] [CrossRef]
- Sullivan, A.R.; Lind, J.F.; McCleary, T.S.; Romero-Severson, J.; Gailing, O. Development and characterization of genomic and gene-based microsatellite markers in north American red oak species. Plant Mol. Biol. Report. 2012, 31, 231–239. [Google Scholar] [CrossRef]
- Chen, X.D.; Zhang, X.; Zhang, H.; Zhou, T.; Zhao, Y.M.; Yang, J.; Zhao, G.F. Genetic differentiation and demographic history of three Cerris oak species in China based on nuclear microsatellite makers. Forests 2021, 12, 1164. [Google Scholar] [CrossRef]
- Holland, M.M.; Parson, W. GeneMarker HID: A reliable software tool for the analysis of forensic STR data. J. Forensic Sci. 2011, 56, 29–35. [Google Scholar] [CrossRef] [PubMed]
- Yeh, F.C.; Boyle, T.J.B. Population genetic analysis of co-dominant and dominant markers and quantitative traits. Belg. J. Bot. 1997, 129, 157. [Google Scholar]
- Excoffier, L.; Lischer, H.E. Arlequin suite ver 3.5: A new series of programs to perform population genetics analyses under Linux and Windows. Mol. Ecol. Resour. 2010, 10, 564–567. [Google Scholar] [CrossRef]
- Peakall, R.; Smouse, P.E. GenAlEx 6.5: Genetic analysis in Excel. Population genetic software for teaching and research-an update. Bioinformatics 2012, 28, 2537–2539. [Google Scholar] [CrossRef]
- Goudet, J. FSTAT (Version 1.2): A computer program to calculate F-statistics. J. Hered. 1995, 86, 485–486. [Google Scholar] [CrossRef]
- Takezaki, N.; Nei, M.; Tamura, K. POPTREE2: Software for constructing population trees from allele frequency data and computing other population statistics with Windows interface. Mol. Biol. Evol. 2010, 27, 747–752. [Google Scholar] [CrossRef] [PubMed]
- Pritchard, J.K.; Stephens, M.; Donnelly, P. Inference of population structure using multilocus genotype data. Genetics 2000, 155, 945–959. [Google Scholar] [CrossRef]
- Francis, R.M. POPHELPER: An R package and web app to analyse and visualize population structure. Mol. Ecol. Resour. 2017, 17, 27–32. [Google Scholar] [CrossRef] [PubMed]
- Rousset, F.; Beeravolu, C.R.; Leblois, R. Likelihood computation and inference of demographic and mutational parameters from population genetic data under coalescent approximations. J. Soc. Française Stat. 2018, 159, 142–166. [Google Scholar]
- Cornuet, J.M.; Pudlo, P.; Veyssier, J.; Dehne-Garcia, A.; Gautier, M.; Leblois, R.; Marin, J.M.; Estoup, A. DIYABC v2.0: A software to make approximate Bayesian computation inferences about population history using single nucleotide polymorphism, DNA sequence and microsatellite data. Bioinformatics 2014, 30, 1187–1189. [Google Scholar] [CrossRef] [PubMed]
- Warren, D.L.; Glor, R.E.; Turelli, M. ENMTools: A toolbox for comparative studies of environmental niche models. Ecography 2010, 33, 607–611. [Google Scholar] [CrossRef]
- Elith, J.; Phillips, S.J.; Hastie, T.; Dudík, M.; Chee, Y.E.; Yates, C.J. A statistical explanation of MaxEnt for ecologists. Divers. Distrib. 2011, 17, 43–57. [Google Scholar] [CrossRef]
- Warren, D.L.; Glor, R.E.; Turelli, M. Environmental niche equivalency versus conservatism: Quantitative approaches to niche evolution. Evolution 2008, 62, 2868–2883. [Google Scholar] [CrossRef]
- Hammer, O.; Harper, D.A.T.; Ryan, P.D. PAST: Paleontological statistics software package for education and data analysis. Palaeontol. Electron. 2001, 4, 1–9. [Google Scholar]
- Rosenberg, M.S.; Anderson, C.D. PASSaGE: Pattern analysis, spatial statistics and geographic exegesis. version 2. Methods Ecol. Evol. 2011, 2, 229–232. [Google Scholar] [CrossRef]
- Yang, J.; Di, X.Y.; Meng, X.; Feng, L.; Liu, Z.L.; Zhao, G.F. Phylogeography and evolution of two closely related oak species (Quercus) from north and northeast China. Tree Genet. Genomes 2016, 12, 89. [Google Scholar] [CrossRef]
- Garcia-Nogales, A.; Linares, J.C.; Laureano, R.G.; Seco, J.I.; Merino, J. Range-wide variation in life-history phenotypes: Spatiotemporal plasticity across the latitudinal gradient of the evergreen oak Quercus ilex. J. Biogeogr. 2016, 43, 2366–2379. [Google Scholar] [CrossRef]
- Leroy, T.; Louvet, J.M.; Lalanne, C.; Provost, G.L.; Labadie, K.; Aury, J.-M.; Delzon, S.; Plomion, C.; Kremer, A. Adaptive introgression as a driver of local adaptation to climate in European white oaks. New Phytol. 2020, 226, 1171–1182. [Google Scholar] [CrossRef] [PubMed]
- Fu, R.R.; Zhu, Y.X.; Liu, Y.; Feng, Y.; Lu, R.S.; Li, Y.; Li, P.; Kremer, A.; Lascoux, M.; Chen, J. Genome-wide analyses of introgression between two sympatric Asian oak species. Nat. Ecol. Evol. 2022, 6, 924–935. [Google Scholar] [CrossRef] [PubMed]
- Leroy, T.; Roux, C.; Villate, L.; Bodenes, C.; Romiguier, J.; Paiva, J.A.; Dossat, C.; Aury, J.M.; Plomion, C.; Kremer, A. Extensive recent secondary contacts between four European white oak species. New Phytol. 2017, 214, 865–878. [Google Scholar] [CrossRef]
- Feng, L.; Zheng, Q.J.; Qian, Z.Q.; Yang, J.; Zhang, Y.P.; Li, Z.H.; Zhao, G.F. Genetic structure and evolutionary history of three alpine sclerophyllous oaks in east Himalaya-Hengduan Mountains and adjacent regions. Front. Plant. Sci. 2016, 7, 1688. [Google Scholar] [CrossRef]
- Meng, H.H.; Su, T.; Gao, X.Y.; Li, J.; Jiang, X.L.; Sun, H.; Zhou, Z.K. Warm-cold colonization: Response of oaks to uplift of the Himalaya-Hengduan Mountains. Mol. Ecol. 2017, 26, 3276–3294. [Google Scholar] [CrossRef]
- Ju, M.M.; Yang, J.; Yue, M.; Zhao, G.F. Speciation patterns of related species under the hybrid zone: A case study of three sclerophyllous oaks in the east Himalaya-Hengduan Mountains. Mol. Ecol. 2023, 32, 4610–4626. [Google Scholar] [CrossRef]
- Zeng, Y.F.; Liao, W.J.; Petit, R.J.; Zhang, D.Y. Geographic variation in the structure of oak hybrid zones provides insights into the dynamics of speciation. Mol. Ecol. 2011, 20, 4995–5011. [Google Scholar] [CrossRef]
- An, M.; Deng, M.; Zheng, S.S.; Jiang, X.L.; Song, Y.G. Introgression threatens the genetic diversity of Quercus austrocochinchinensis (Fagaceae), an endangered oak: A case inferred by molecular markers. Front. Plant. Sci. 2017, 8, 229. [Google Scholar] [CrossRef]
- Cavender-Bares, J.; Gonzalez-Rodriguez, A.; Pahlich, A.; Koehler, K.; Deacon, N. Phylogeography and climatic niche evolution in live oaks (Quercus series Virentes) from the tropics to the temperate zone. J. Biogeogr. 2011, 38, 962–981. [Google Scholar] [CrossRef]
- Zhou, Z.K. Origin, phylogeny and dispersal of Quercus from China. Acta Bot. Yunnanica 1992, 14, 227–236. [Google Scholar]
- Liu, J.Q.; Sun, Y.S.; Ge, X.J.; Gao, L.M.; Qiu, Y.X. Phylogeographic studies of plants in China: Advances in the past and directions in the future. J. Syst. Evol. 2012, 50, 267–275. [Google Scholar] [CrossRef]
- Yuan, J.H.; Cheng, F.Y.; Zhou, S.L. Genetic structure of the Tree peony (Paeonia rockii) and the Qinling Mountains as a geographic barrier driving the fragmentation of a large population. PLoS ONE 2012, 7, e34955. [Google Scholar] [CrossRef] [PubMed]
- Ortego, J.; Gugger, P.F.; Sork, V.L. Impacts of human-induced environmental disturbances on hybridization between two ecologically differentiated Californian oak species. New Phytol. 2017, 213, 942–955. [Google Scholar] [CrossRef] [PubMed]
- Truffaut, L.; Chancerel, E.; Ducousso, A.; Dupouey, J.L.; Badeau, V.; Ehrenmann, F.; Kremer, A. Fine-scale species distribution changes in a mixed oak stand over two successive generations. New Phytol. 2017, 215, 126–139. [Google Scholar] [CrossRef]
- Saleh, D.; Chen, J.; Leple, J.C.; Leroy, T.; Truffaut, L.; Dencausse, B.; Lalanne, C.; Labadie, K.; Lesur, I.; Bert, D.; et al. Genome-wide evolutionary response of European oaks during the Anthropocene. Evol. Lett. 2022, 6, 4–20. [Google Scholar] [CrossRef]
Disclaimer/Publisher’s Note: The statements, opinions and data contained in all publications are solely those of the individual author(s) and contributor(s) and not of MDPI and/or the editor(s). MDPI and/or the editor(s) disclaim responsibility for any injury to people or property resulting from any ideas, methods, instructions or products referred to in the content. |
© 2025 by the authors. Licensee MDPI, Basel, Switzerland. This article is an open access article distributed under the terms and conditions of the Creative Commons Attribution (CC BY) license (https://creativecommons.org/licenses/by/4.0/).