Article

Adaptations of Pinus yunnanensis Seedlings to Simulated Light Patches: Growth Dynamics and C:N:P Stoichiometry

1
The Key Laboratory of Forest Resources Conservation and Utilization in the Southwest Mountains of China, Ministry of Education, Southwest Forestry University, Kunming 650224, China
2
Key Laboratory of National Forestry and Grassland Administration on Biodiversity Conservation in Southwest China, Southwest Forestry University, Kunming 650224, China
*
Author to whom correspondence should be addressed.
These authors contributed equally to this work.
Forests 2025, 16(3), 517; https://doi.org/10.3390/f16030517
Submission received: 8 January 2025 / Revised: 3 March 2025 / Accepted: 13 March 2025 / Published: 15 March 2025
(This article belongs to the Section Forest Ecology and Management)

Abstract

:
Many seedlings and a few young trees have recently been observed in Pinus yunnanensis forests, reducing the natural regeneration ability and succession. Shade treatments were applied to potted 1-year-old P. yunnanensis seedlings, and the shade net was opened at noon to simulate light patches. We used four treatments, i.e., 80% shade with 1 h light at noon (T80-1), 80% shade all the time (T80), 95% shade with 1 h light at noon (T95-1), and 95% shade all the time (T95), and a control (natural light). We analyzed the effects of light patches on the growth and C:N:P stoichiometry of P. yunnanensis seedlings. (1) Shading significantly inhibited seedling growth, with height increments reduced by 29.59% and 47.40% under T80 and T95, respectively, and basal diameter increments decreased by 10.97% and 14.41%. (2) Shading reduced biomass across organs, with total biomass under T95 being only 39.02% of CK, but midday light patches alleviated this inhibition (T80-1 total biomass increased by 137.90% compared to T80). (3) Under high shading (T95), seedlings prioritized photosynthetic product allocation to aboveground parts (needle biomass proportion reached 58.01%), while light patches (T80-1) enhanced coarse root biomass (137.90% higher than T80). (4) Shading significantly increased needle C:N and C:P ratios (T95 increased by 69.01% and 129.93% compared to CK, respectively), with N:P > 16 indicating phosphorus limitation; light patches (T80-1) reduced N:P to 14–16, mitigating co-limitation by N and P. The study demonstrates that P. yunnanensis seedlings adopt conservative strategies under shading by adjusting biomass allocation and stoichiometry to adapt to low-light conditions, while midday light patches enhance photosynthetic efficiency and nutrient utilization. We recommend forest thinning to increase understory light patches, thereby improving natural regeneration and promoting sustainable forest management of P. yunnanensis forests. These findings highlight the importance of light management in P. yunnanensis forests to enhance regeneration by regulating understory light patches.

1. Introduction

Light significantly influences plant growth, development, morphology, biomass, and physiological and biochemical processes [1]. It also affects the regeneration and succession of understory tree species. Understory light conditions affect seedlings’ morphological and physiological traits and their spatial distribution [2]. The light intensity influences plants’ morphology and growth plasticity and causes them to adapt to different light and resource conditions [3]. Most plants growing in the shade exhibit unique morphological and physiological traits [4]. The growth of belowground parts is more limited in low-light conditions, resulting in a greater reduction in root biomass, a smaller reduction in leaf biomass, and reductions in root–stem and root–crown ratios [5]. In addition, shading affects the plant’s requirements for other resources by regulating the photosynthetic efficiency of plant needles and leaves, influencing carbon allocation. Shading also further affects the carbon, nitrogen, and phosphorus contents by influencing enzyme activities related to carbon and nitrogen fixation [6].
Light patches, which are areas of light in canopy gaps that move during the day [7], are vital for understory plant growth. They can change the photon flux hitting needles, provide a significant amount of light energy for carbon fixation, and have a notable impact on plants’ photosynthetic efficiency, growth rate, and light-utilization ability [8].
Previous studies have explored the effects of shading on plants like Medicago sativa and Cercidiphyllum japonicum [9,10], revealing its influence on growth, nutrient uptake, and utilization efficiency.
Pinus yunnanensis is an evergreen species in the pine family. It is an important timber species in southwest China. It is light-loving, drought-resistant, and cold-resistant and is crucial to maintaining forest biodiversity and ecosystem stability. Studies on P. yunnanensis have focused on environmental stress on seedling morphology and growth [11], community structure [12], diseases and pests [13], seed adaptations [14], growth in shady environments [15], and response to climate change [16]. No research has been conducted on the C:N:P stoichiometry of different organs of P. yunnanensis seedlings growing in patchy light in the understory. Few studies have investigated the influence of light patches on the growth of understory plants domestically and internationally in recent years [17]. To address the gap in understanding how light patches influence nutrient allocation in P. yunnanensis, this study examines the C:N:P stoichiometry of seedlings under simulated light regimes, providing critical insights for improving forest regeneration strategies.

2. Material and Methods

2.1. Study Site and Soil Preparation

The experimental site was located in the Tree Farm of the Southwest Forestry University in Kunming (Kunming, Yunnan, 102°46′ E, 25°03′ N). The area has a low-latitude subtropical plateau-mountain monsoon climate, with an average annual temperature of 15 °C, average annual sunshine hours of 2200 h, average annual rainfall of 1450 mm, and a frost-free period of more than 240 d due to the influence of warm and humid airflow from the Indian Ocean. The experimental soil was prepared by mixing local red loam and humus in a 3:2 ratio. It had a water-holding capacity of 28.49% (measured by the ring knife method) and a density of 1.00 g/cm3. The soil contained total carbon, nitrogen, and phosphorus at levels of 3.26 g/kg, 5.98 g/kg, and 0.62 kg/kg, respectively, with a pH of 6.65. On 1 August 2021, P. yunnanensis seeds selected by the project team (seed number: Yun R-SS-PY-035-2020) were collected from the Malonghe Forestry Farm, Shuangbai County, and transported to the Tree Farm of Southwest Forestry University. The seeds were germinated, and the seedlings were cultivated for 8 months at Malonghe Forestry Farm and planted in April 2022. We selected 150 well-established, robust P. yunnanensis seedlings with a uniform height for transplanting into plastic pots (20.5 cm caliber, 18.5 cm height, and 14.5 cm in diameter). One well-established seedling was planted per pot. The pot was filled with sieved soil, and a tray was placed at the bottom. The transplanted seedlings were placed in the experimental plots, which were covered with mulch to prevent the effect of soil moisture on the potted plants. The relative soil moisture content was 80 ± 5% of the field capacity throughout the experiment, and the actual moisture content ranged from 36.77% to 41.67%. The soil moisture content was measured with a soil hydrometer and determined by weighing every day at 17:00. It was adjusted if necessary.

2.2. Experimental Design and Measurements

Beginning at the end of January 2021, the light intensity in the understory of the middle-aged P. yunnanensis forest was measured with an automatic illuminance meter (LI-250A, Li-Cor, Lincoln, NE, USA) on sunny days around 12:00 p.m. We approximated the shading conditions in the P. yunnanensis forest. One shade shed had a net light intensity at noon on a sunny day of 20% of the conditions in open areas (80% shade). The other shade shed had 5% net light intensity (95% shade). The light intensity of the experimental set-up was based on the results of a previous shade trial, which indicated that P. yunnanensis seedlings did not grow well in more than 70% shade [2]. Therefore, we used 4 treatments in this experiment: 80% shade all the time (T80), 80% shade with 1 h light at noon (T80-1), 95% shade all the time (T95), 95% shade with 1 h light at noon (T95-1). The control consisted of natural light. The light patches were simulated by leaving the west side of the shade shed open for 1 h each day around 1:00. Some seedlings received sunlight, whereas others remained in the shade all the time. The height and basal diameter of all surviving seedlings were measured, and the weights of different organs were recorded. The shade experiment started in June 2022 and ended in October 2022, lasting 120 days. During the shading period, the natural light intensity above the double-layered black shade net and the light intensity inside the shade net were measured with a hand-held light intensity meter. The ratio of the difference between the two measurements was the shading rate, and the average value was calculated to obtain the shading rate of the treatment.

2.3. Indicator Measurements

Twenty seedlings were used in each treatment and the control for a total of 100 seedlings. The growth indices were measured, and destructive sampling was performed at the end of the 120-day experiment. Five plants were measured in each treatment and the control (total of twenty-five plants). The plant height from the ground to the top of the seedlings was measured at the beginning and end of the experiment using a straightedge (accuracy of 0.1 cm). The basal diameter was measured using a caliper gauge (accuracy 0.01 mm). The samples were divided into four parts: needles, stems, coarse roots (diameter greater than 2 mm), and fine roots (diameter less than 2 mm). Coarse roots (>2 mm diameter) and fine roots (<2 mm) were classified based on standard morphological criteria [18] to reflect functional differences in nutrient uptake. They were placed in envelopes in a 105 °C oven for 30 min and dried at 80 °C to a constant weight. The biomass of the organs was recorded. The plant material was pulverized, sieved, and stored for the subsequent analysis of the carbon (C), nitrogen (N), and phosphorus (P) contents. Total carbon was determined by oxidation with potassium dichromate, total nitrogen was obtained using the Kjeldahl method, and total phosphorus was derived by the molybdenum-antimony colorimetric method [19].
We calculated the needle biomass ratio (needle weight/total plant weight), stem biomass ratio (stem weight/total plant weight), coarse root biomass ratio (coarse root weight/total plant weight), and fine root biomass ratio (fine root weight/total plant weight).
The plasticity index was calculated using P = (Xmax − Xmin)/Xmax, where Xmax and Xmin denote the maximum and minimum values of the indicator.

2.4. Data Analysis

Microsoft Office Excel 2022 was used to determine the descriptive statistics. SPSS 22.0 was used to calculate the mean and standard deviation. We performed a one-way analysis of variance (ANOVA) and used Duncan’s multiple comparisons test (significance level of 0.05) to determine the differences in the indicators for different treatments. A normality test and variance chi-square test were performed before the ANOVA. Origin 2021 was used for plotting, and Canoco 5 software was used for the redundancy analysis (RDA).
Data normality and homogeneity of variances were verified using Shapiro–Wilk and Levene’s tests. Each treatment included 20 seedlings, with five replicates for destructive sampling, randomized across the experimental plot to minimize microenvironmental bias.

3. Results and Analysis

3.1. Plant Height and Basal Diameter Increment of P. yunnanensis Seedlings in Different Treatments

The seedling height and basal diameter growth of the P. yunnanensis seedlings decreased with increasing shade levels (Figure 1). The plant height increment was 29.59% and 23.29% lower in the two treatments with 80% shade (T80 and T80-1) and 47.40% and 39.45% lower in the two treatments with 95% shade (T95 and T95-1) than in the CK. The basal diameter increment was 10.97% and 11.06% lower in the two treatments with 80% shade and 14.41% and 10.81% lower in the two treatments with 95% shade than in the CK. The height and basal diameter increment were significantly larger in the T80-1 treatment than in the T80 treatment (8.21% and 12.38%) and in the T95-1 treatment than in the T95 treatment (15.10% and 53.80%).

3.2. Effects of Treatments on P. yunnanensis Seedling Biomass

The light significantly (p < 0.05) affected stem biomass, coarse root biomass, and total biomass of the P. yunnanensis seedlings (Table 1). The biomass of all organs was significantly lower (p < 0.05) in the T80, T95, and T95-1 treatments than in the CK. The needle biomass decreased with increasing light intensity. It did not differ significantly (p > 0.05) between the 1-h light and shade treatments. Stem biomass was 45.63%, 45.37%, and 61.61% higher in the T80, T95, and T95-1 treatments, respectively, than in the CK, and 65.69% higher in the T80-1 treatment than in the T80 treatment. The coarse root biomass was 62.54%, 37.73%, and 66.02% lower (p < 0.05) in T80, T95, and T95-1, respectively, than in the CK. It was 137.90% higher (p < 0.05) in T80-1 than in T80 and 45.43% lower in T95-1 than in T95. The fine root biomass was significantly lower (43.18%, 46.41%, 62.36%, and 70.00% (p < 0.05)) in the four treatments than in the CK, with no significant differences (p < 0.05) between the light and shade treatments. Total biomass was 36.43, 19.28, 39.02, and 52.43% lower in the T80, T80-1, T95, and T95-1 treatments, respectively, than in the CK. It was 137.90% higher in T80-1 than in T80 and 26.99% lower in T95-1 than in T95.
The light treatment significantly affected the biomass proportions of the needles and the coarse roots (p < 0.05) (Table 2). The needle biomass proportion ratio was 20.07% and 24.22% (p < 0.05) higher in T80 and T95-1, respectively, than in the CK, 20.75% lower in T80 than in T80, and 11.55% higher in T95-1 than in T95. The stem biomass ratio was slightly higher in T80-1 than in the other treatments, but this result was not significant (p > 0.05). The coarse root biomass ratio was 10.49% and 2.16% higher in T80-1 and T95, respectively, lower in T80 and T95-1, and significantly higher (91.32%; p < 0.05) in T80-1 than in T80. It was 31.47% lower in T95-1 than in T95. The fine root biomass ratio was slightly lower in the shade and light treatments than in the control, and this effect was not significant. The root–crown ratio was slightly lower in the shade and light treatments than in the CK. There was no significant difference between treatments (p > 0.05). The root–crown ratio was slightly higher in T80-1 than in T80 and slightly lower in T95-1 than in T95.
The reduced root biomass under high shade (T95) aligns with the optimal allocation theory, where seedlings prioritize aboveground organs to capture scarce light resources [20].

3.3. Treatment Effects on C, N, and P Contents and Stoichiometry of P. yunnanensis Seedlings

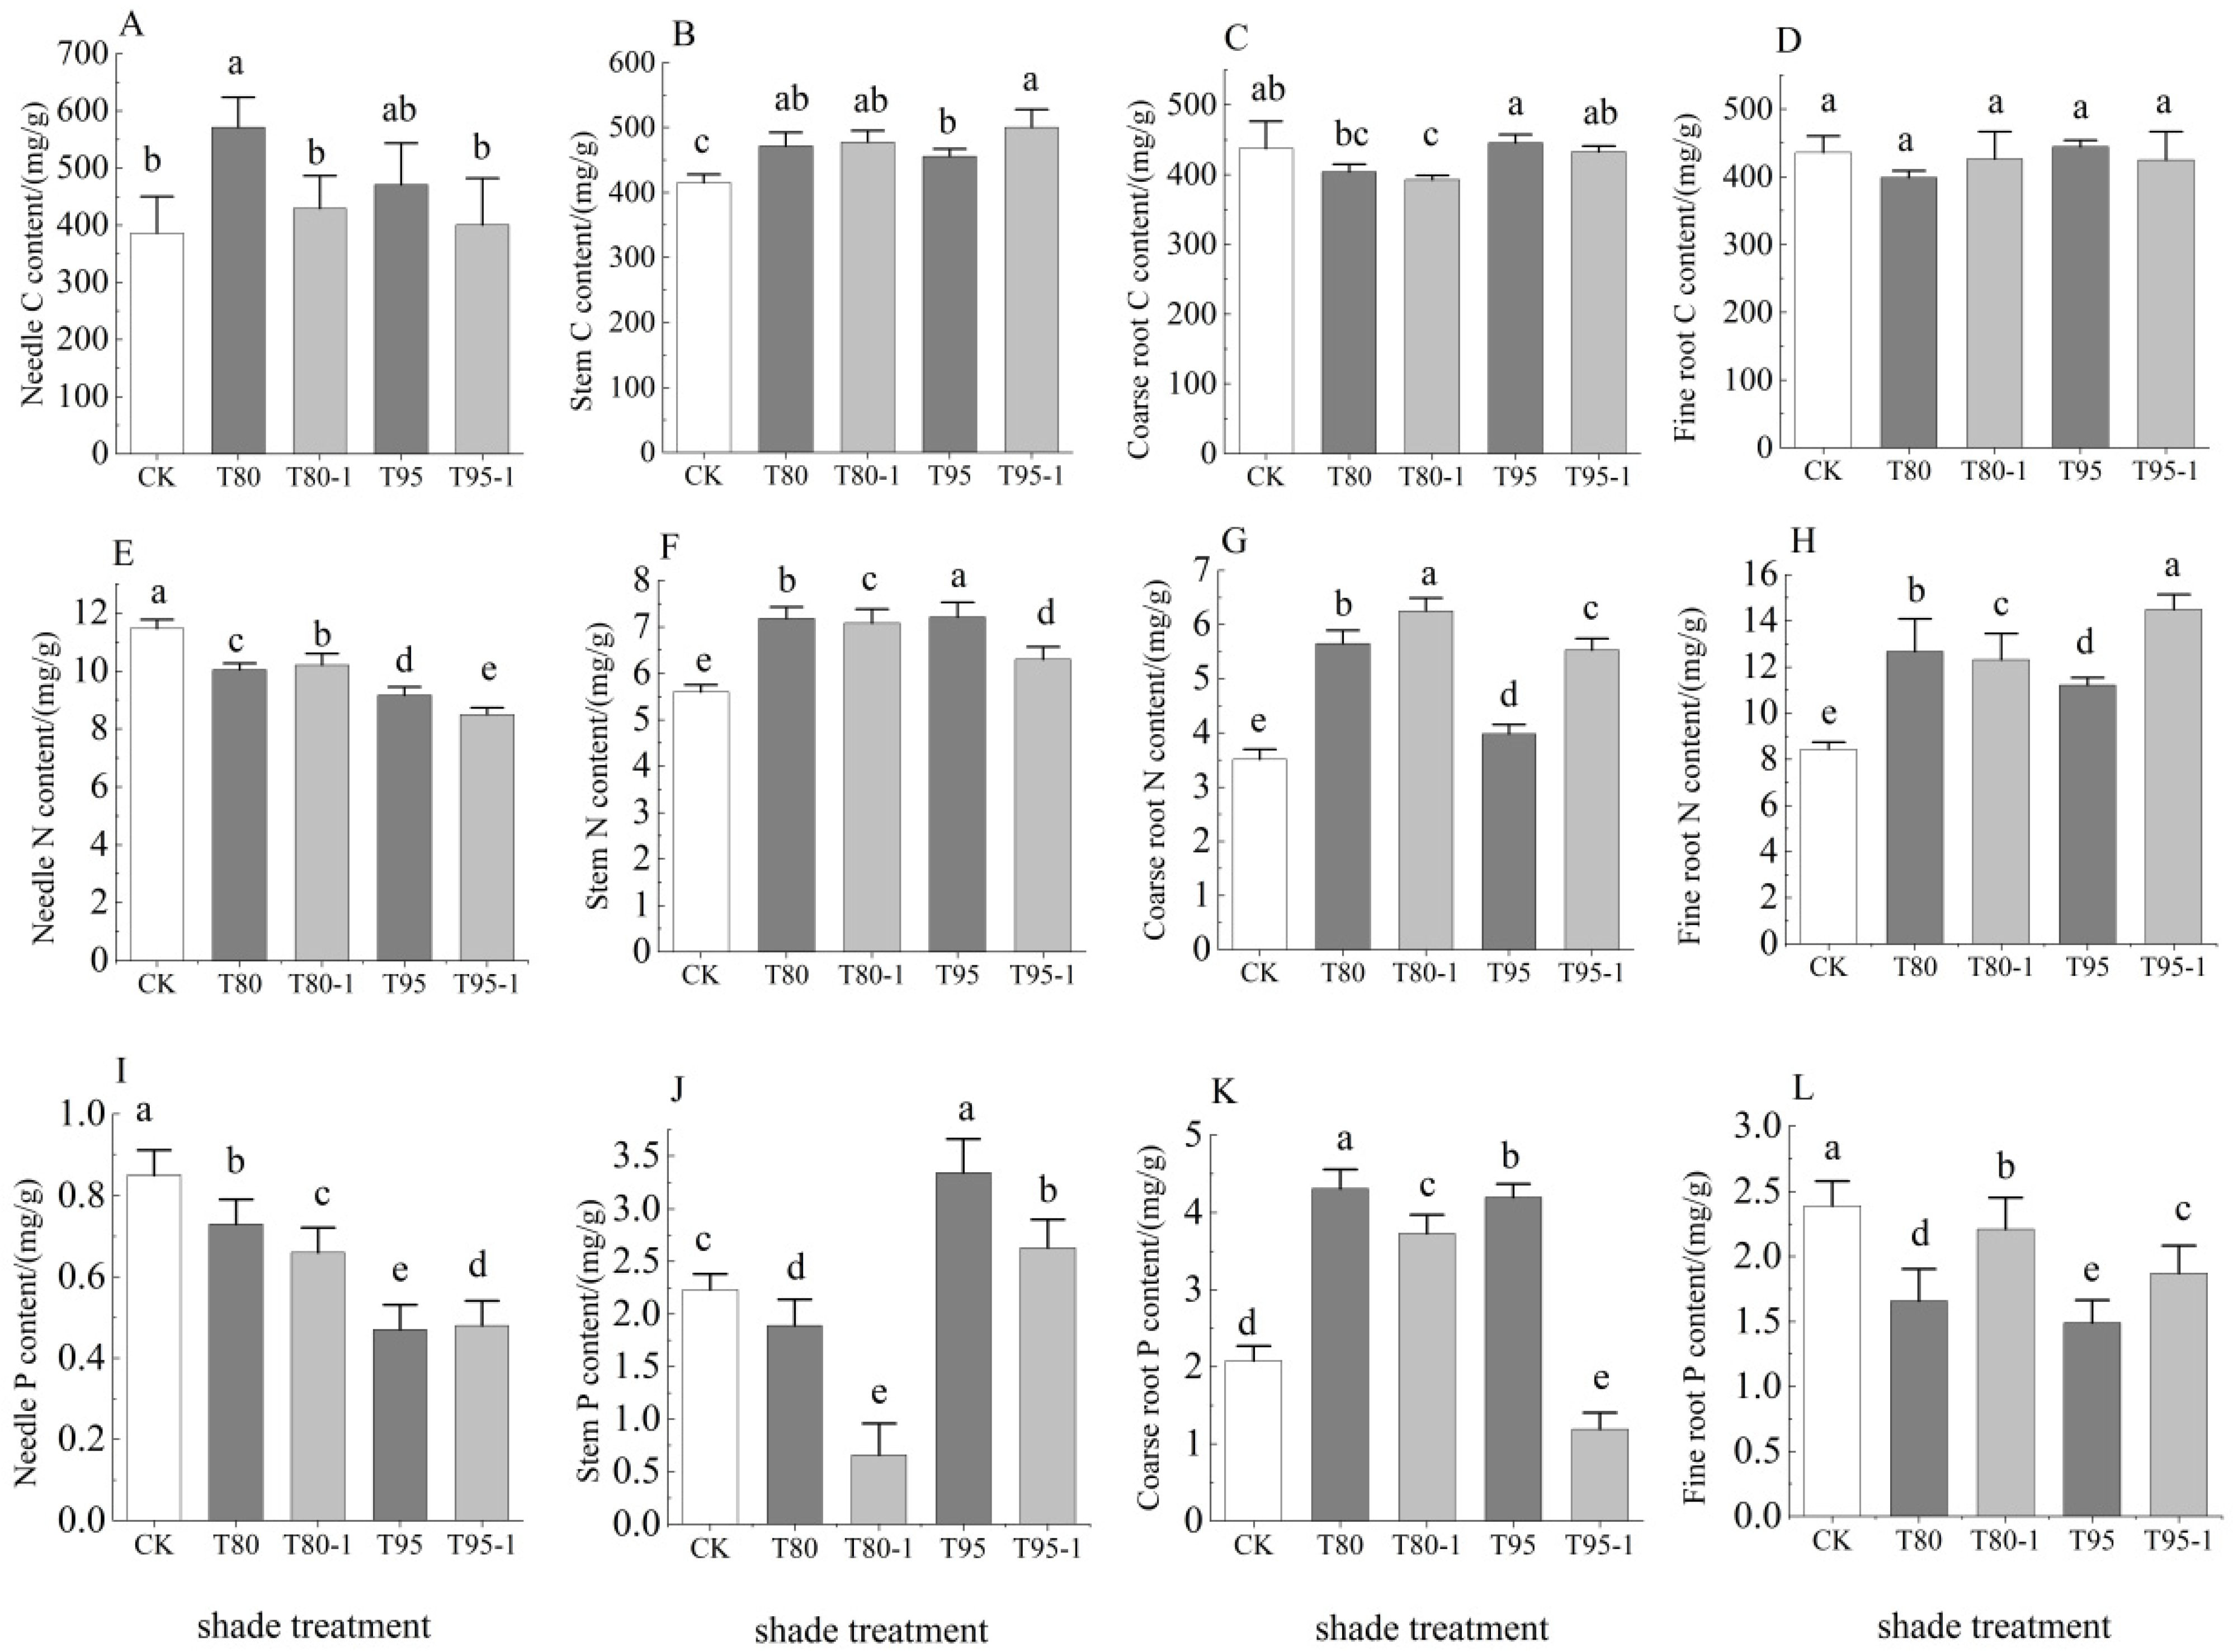
3.3.1. Treatment Effects on C, N, and P Contents of P. yunnanensis Seedlings

The treatments significantly affected the C, N, and P contents of all organs of P. yunnanensis seedlings (except the C contents of fine roots, needles, and coarse roots in the light treatment) (Figure 2). The contents differed significantly between the treatments and the control (p < 0.05). The needle and stem C contents were higher in all treatments than in the CK, whereas the needle C contents did not differ significantly between different light treatments. The coarse root C content was significantly higher in the T95 treatment and significantly lower in the T80 and T80-1 treatments than in the CK. The fine root C content did not differ significantly between treatments, and the needle C content was highest in the T80 treatment (571.11 mg/g). The N contents of the stem, coarse roots, and fine roots were significantly higher in the treatments than the CK, whereas the needle N contents were significantly lower in the treatments than the CK. The highest fine root N content (14.46 mg/g) occurred in the T95-1 treatment. The needle and fine root P contents were significantly lower in the treatments, whereas the coarse root P contents were significantly higher in T80, T80-1, and T95 and significantly lower in T95-1 than in the control. The highest value occurred in the T80 treatment (4.31 mg/g).
The needle and coarse root C contents were significantly higher in T80 than in T80-1, whereas the stem and fine root C contents did not differ significantly. The needle and coarse root C contents were significantly higher in T95 than in T95-1, while the stem C contents were significantly lower than in T95-1. The needle and coarse root N contents were significantly higher in T80-1 than in T80, whereas the stem and fine root N contents were significantly lower. The needle and stem N contents were significantly lower in T95-1 than in T95. The coarse and fine root N contents were significantly higher in T95-1 than in T95. The stem and coarse root P contents were significantly lower in T80-1 and T95-1 than in T80 and T95. The fine root P contents were significantly higher in T80-1 and T95-1 than in the T80 and T95. The needle P contents were significantly higher in T80 than in T80-1 and significantly lower in T95 than in T95-1.
Figure 2: C, N, and P contents varied significantly across organs. Needle C content peaked in T80 (571.11 mg/g), likely due to starch accumulation under moderate shade as photosynthesis declines but respiration remains active [5]. Stem N content decreased in shaded treatments (e.g., T95: 14.46 mg/g vs. CK: 30.28 mg/g), reflecting reduced nitrogen demand for photosynthetic enzymes under low light. Coarse root P content was highest in T80 (4.31 mg/g), suggesting preferential P allocation to roots to sustain metabolic activity despite carbon limitations.

3.3.2. C, N, and P Stoichiometry of P. yunnanensis Seedlings Under Different Treatments

The treatments significantly affected the C:N, C:P, and N:P ratios in all organs of P. yunnanensis seedlings (except for C:P in the stems in T95-1 and the fine roots in T80-1) (Figure 3) (p < 0.05). The needle C:N was significantly higher in the treatments than the CK. It was 69.01% higher in T80. The stem C:N was significantly lower in the T80, T80-1, and T95 treatments than the CK. It was 7.11% lower in the T95-1 treatment. The coarse and fine root C:N was significantly lower in the treatments than in the CK. The coarse root C:N was 49.56% lower in the T80-1 treatment and the fine root C:N was 43.34% lower in the T95-1 treatment. The needle C:P was significantly higher in the treatments than the CK. It was 129.93% higher in T95. The stem C:P was significantly higher in T80 and T80-1, significantly lower in T95-1, and 285.71% higher in T80-1 than in the CK. The coarse root C:P was significantly lower in T80, T80-1, and T95 and 73.82% higher in T95-1 than in CK. The fine root C:P was significantly higher in T80, T95, and T95-1 and 24.32% higher in T95. The needle and fine root N:P were significantly higher in the treatments than in CK. The needle N:P was 31.78% higher in T95, and the fine root N:P was 119.55% higher in T95-1. The stem N:P was significantly higher in the shade treatment and lower in the light treatment than in CK. It was 324. 30% higher in T80-1. The coarse root N:P was significantly higher in T80, T80-1, and T95, and significantly lower in T95-1 than in CK.
The needle and coarse root C:N were significantly higher in the shade treatment than in the light treatment, whereas the stem C:N was significantly higher in the light treatment than in the shade treatment. The fine root C:N was significantly lower in T80 than in T80-1 and significantly lower in T95-1 than in T95. The needle and fine root C:P were significantly higher in the shade treatment than in the light treatment, whereas the stem and coarse root C:P were significantly lower in the shade treatment. The needle, stem, and coarse root N:P were significantly higher in T80 than in T80-1, while the fine root N:P was significantly lower in the T80 treatment. The stem, coarse root, and fine root N:P were significantly lower in T95 than in T95-1, whereas the needle N:P was significantly higher in T95 than in T95-1.
Figure 3: The needle C:N ratio increased under shade (T80: 69.01% higher than CK), indicating slower nitrogen use efficiency. Conversely, fine root N:P ratios surged in T95-1 (119.55% higher than CK), signaling phosphorus limitation in extreme shade. The stem C:P ratio in T80-1 (285.71% higher than CK) reflects carbon accumulation from transient light pulses without proportional P uptake, highlighting light-driven carbon-phosphorus decoupling.

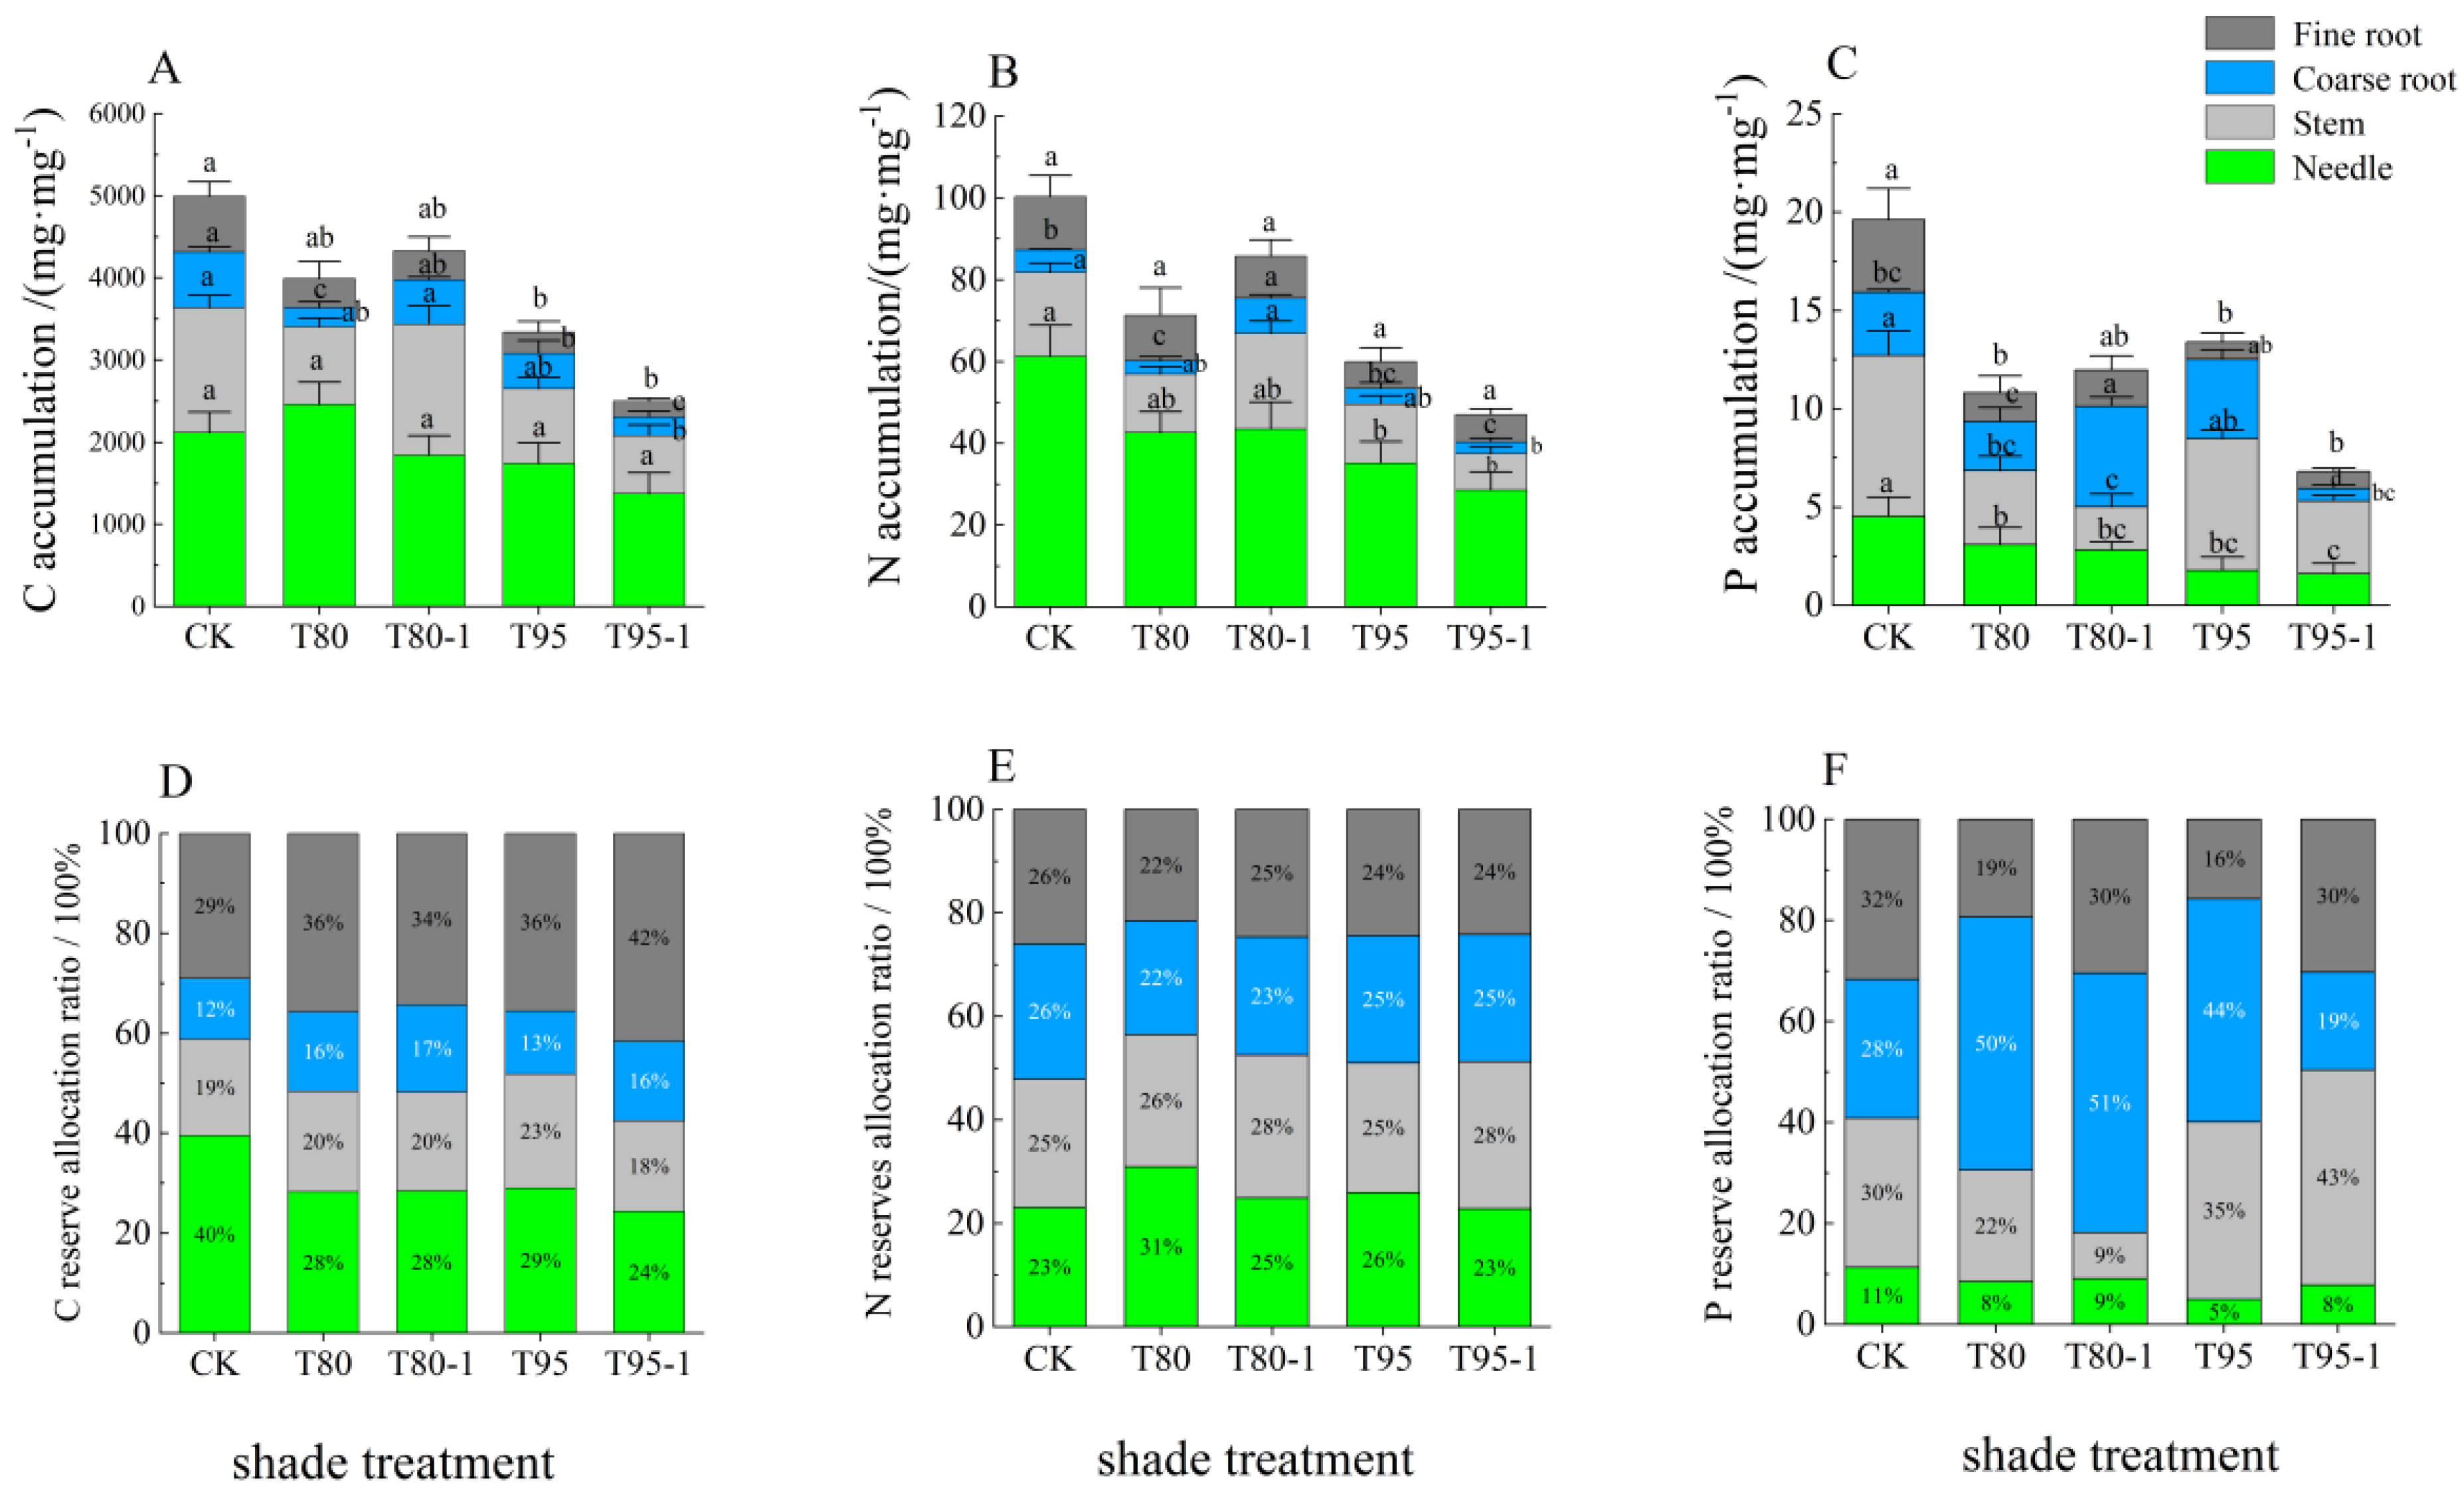
3.3.3. C, N, and P Allocation in the Organs of P. yunnanensis Seedlings Under Different Treatments

As shown in Figure 4, the shade and light treatments had a significant impact (p < 0.05) on the accumulation of C, N, and P in all organs of P. yunnanensis seedlings, except for the C content and fine root N content in the needles and the C and N contents in the stems in the T80-1 treatment. As the shading intensity increased, the C and N contents decreased in all organs, whereas the P content decreased and increased. The C and N contents reached the maximum in the T80-1 treatment, and the P content reached the maximum in the T95 treatment. The C, N, and P contents in all organs were higher in T80-1 than in T80 and lower in T95-1 than in T90.
The C, N, and P distribution in the organs differed for different treatments (Figure 4). As the shading intensity increased, the proportions of needle C, stem P, coarse root, and fine root N decreased and increased. The proportions of coarse root C, needle, and stem N, and the coarse root P content increased and decreased. The proportions of stem and fine root C increased, while the proportions of needle and fine root P decreased. The proportions of coarse root C, stem N, needle, and fine root P were higher in the light treatment than in the shade treatment. Conversely, the proportions of needle N and coarse root P were lower in the light treatment than in the shade treatment. The proportions of coarse and fine root N were higher in the T80-1 treatment than in the T80 treatment. Conversely, fine root C and stem P were lower in the T80-1 treatment than in the T80 treatment. The fine root C and stem P proportions were higher in T95-1 than in T95. The proportions of needle and stem C were lower in T95-1 than in T95.
Figure 4: C allocation shifted toward needles and stems in shaded treatments (e.g., T95 needle C: 58.01% vs. CK: 43.96%), while N allocation to roots decreased. This underscores a survival strategy where carbon is prioritized for light capture, while nitrogen is conserved for essential functions.

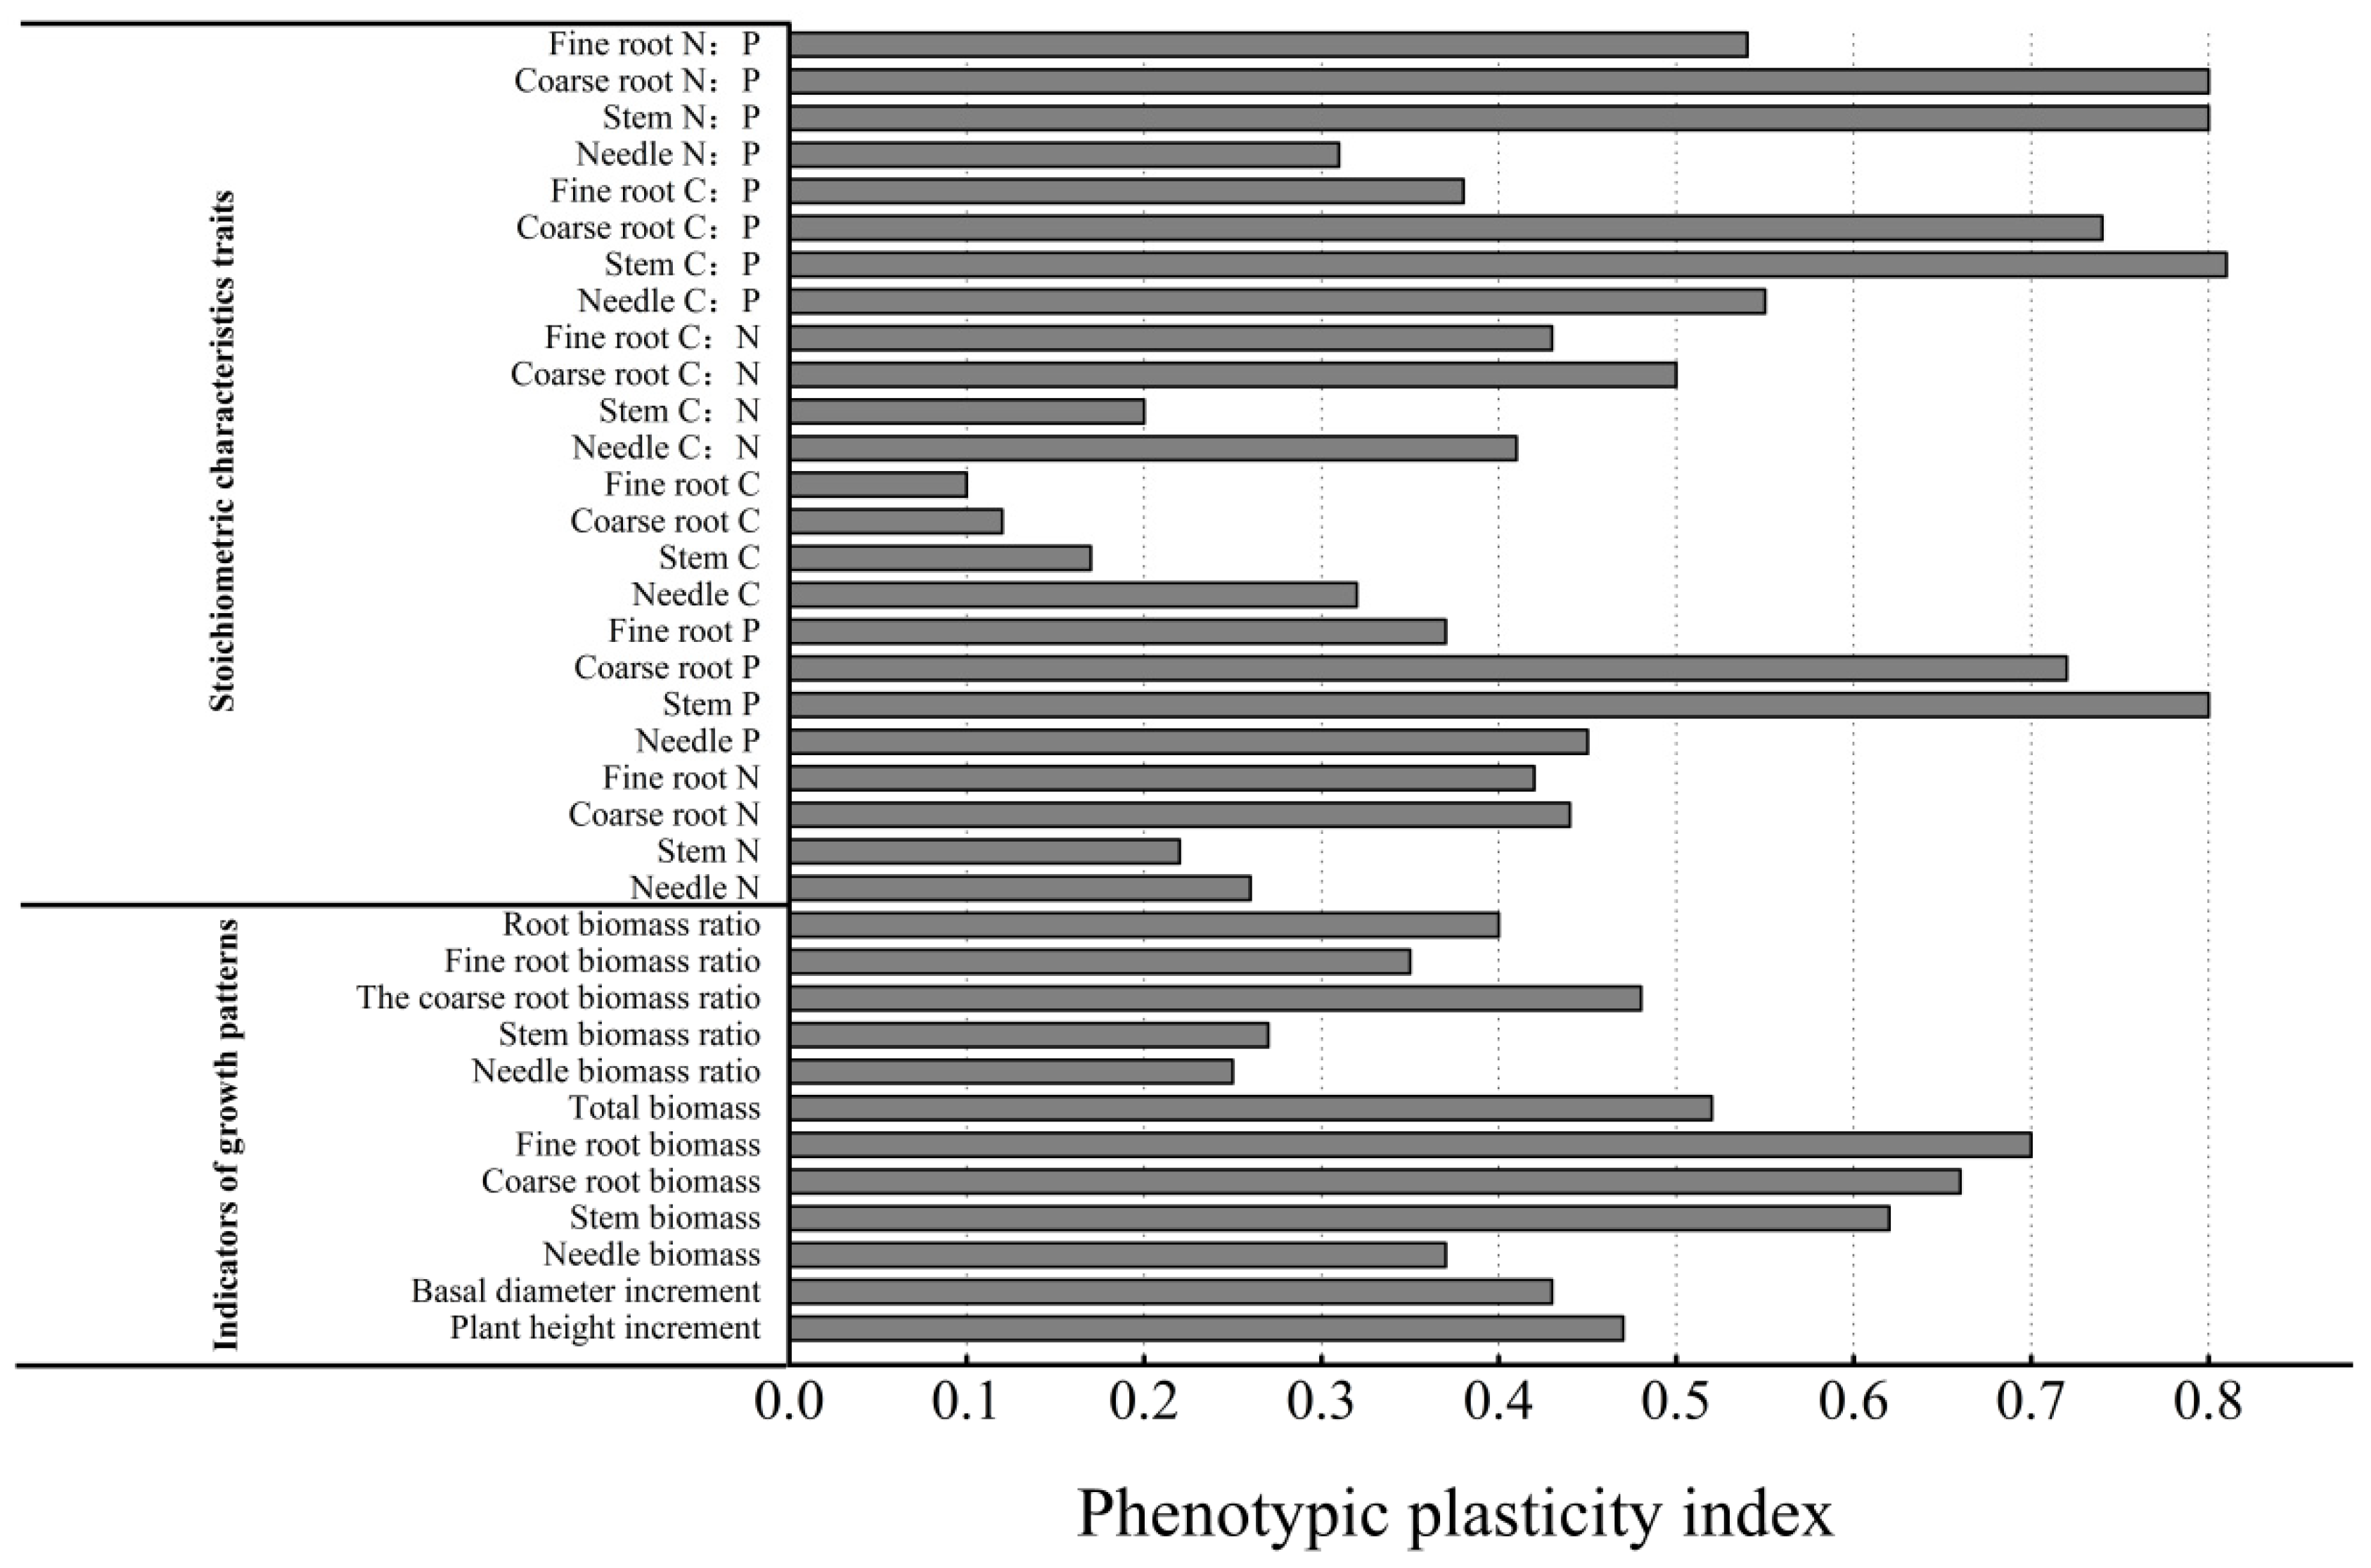
3.4. Phenotypic Plasticity of C, N, and P Stoichiometric Characteristics and Growth Patterns of P. yunnanensis Seedlings Under Different Light Conditions

As illustrated in Figure 5, the stem C:P, coarse root N:P, stem N:P, stem P content, and coarse root P content had the highest plasticity indices. None of the morphological characteristics (plant height and basal diameter increment), growth characteristics (biomass), and C, N, and P stoichiometric ratios had plasticity indices greater than 0.5. The growth characteristics and C, N, and P stoichiometric characteristics had higher plasticity, with the highest plasticity indices for fine and coarse root biomass for all organs. The stem C:P had the highest plasticity index (0.81), followed by coarse root N:P, stem N:P, and stem P content. This finding suggests that P. yunnanensis seedlings predominantly adapted to the light environment by altering fine and coarse root biomass and adjusting the stem C:P, coarse root N:P, stem N:P, and stem P content.

3.5. Relationship Between C, N, P Stoichiometric and Morphological Characteristics of P. yunnanensis Seedlings

RDA revealed that fine root N:P was the primary driver of morphological variation (40.3% explanatory rate, p < 0.01)(Table 3). Elevated fine root N:P (indicating phosphorus limitation) negatively correlated with growth metrics (e.g., total biomass, root-to-shoot ratio) (Figure 6), as observed in shaded treatments (e.g., 70% lower fine root biomass in T95-1 vs. CK), reflecting exacerbated carbon allocation trade-offs under P scarcity. Stem C:P (285.71% higher in T80-1 vs. CK) and coarse root N:P also influenced growth: excessive stem C:P indicated a mismatch between light-driven carbon surplus and P uptake, inhibiting lignin synthesis, while reduced coarse root N:P in T95-1 suggested improved nitrogen utilization under extreme shade, though insufficient to counteract overall growth suppression. These stoichiometric shifts highlight P. yunnanensis seedlings’ phenotypic plasticity: they balance survival and growth by modulating C:N:P ratios—prioritizing carbon allocation to aboveground tissues and enhancing P acquisition via root adjustments in low-light environments.

4. Discussion

4.1. Effect of Shade and Light Treatments on the Growth and Biomass Allocation of P. yunnanensis Seedlings

Light conditions substantially affect seedling growth and survival in natural ecosystems. Seedlings grown in the shade use adaptive strategies. Moderate shade facilitates natural regeneration, whereas excessive shade typically limits plant growth [2,21]. Seedlings of shade-intolerant plants had taller stems and a smaller basal diameter. The likely reason is that shade-intolerant plants prioritize the allocation of energy for vertical growth and reduce energy inputs for lateral growth. Consequently, seedlings grow rapidly to access more light energy [22,23]. Our findings demonstrated that the P. yunnanensis seedlings were shorter and had a smaller basal diameter in the shade treatments than in the light treatments. This finding indicates that the seedlings’ growth was inhibited by shade, particularly for those in treatments with 80% or more shade. This observation is in agreement with that reported by Pires et al. [24] in their study on Passiflora palmeri. However, the P. yunnanensis seedlings exhibited better growth and higher sensitivity to light changes in the light treatments, suggesting that this environment promoted seedling growth.
Adjustments in biomass accumulation and organ-to-organ partitioning by plants under different light intensities demonstrate efficient resource utilization and adaptations to the environment, enabling plants to compensate for resource shortages when light is scarce and enhancing their ability to acquire resources [19]. In addition, the biomass allocation of many woody plants reflects environmental conditions and competition with other species [25]. According to the optimal allocation theory, plants prioritize biomass allocation to organs with the greatest resource scarcity. They adapt to variable environments by adjusting the ratio of biomass allocated to different organs [26]. In this study, the biomass of all organs of P. yunnanensis seedlings was lower in the shade and light treatments than in the CK. The T80-1 treatment resulted in significantly higher stem biomass, coarse root biomass, and total biomass than the T80 treatment. Conversely, the T95-1 treatment led to significantly lower coarse root biomass and total biomass than the T95 treatment. Additionally, the proportion of needle biomass was higher, and the proportions of fine root biomass and total biomass were lower. The proportions of needle biomass and fine root biomass were significantly lower in T80-1 than in T80, whereas the proportions of stem biomass, coarse root biomass, and root–crown ratio were significantly higher in T80-1 than in T80. The proportion of the coarse root biomass and root–crown ratio was significantly lower in T95-1 than in T95 (Table 1). The results demonstrated that a high shade intensity substantially affected biomass accumulation and allocation to various organs in P. yunnanensis seedlings. In low-light conditions, the P. yunnanensis seedlings adopted a conservative strategy of gradual resource acquisition and consumption, resulting in a shift in biomass allocation to aboveground parts [27]. This strategy increased the ability to capture light energy by increasing the biomass allocation to needles, improving the growth rate, the ability to compete for light, and the survival rate [28]. However, in the T80-1 treatment, the P. yunnanensis seedlings mitigated the adverse effects of shading by increasing stem and coarse root biomass. This strategy increased the seedling stem’s ability to take up carbon and access ground nutrients and water in the shaded environment. The biomass allocation ratio in the T95-1 treatment indicated that the seedlings increased their aboveground biomass to improve the ability to uptake carbon and capture light energy. This response suggests that the biomass allocation depends on the light level. The biomass is allocated preferentially to organs that need it the most to adapt to adverse environments [26]. Furthermore, the P. yunnanensis seedlings in the shade treatment had a longer stem height and smaller basal diameter. The likely reason is that shade-intolerant plants allocate a greater proportion of their bioenergy toward vertical growth to reach the light [22].

4.2. Effects of the Shade and Light Treatments on C, N, and P Accumulation and the Allocation Ratio of Different Organs of P. yunnanensis Seedlings

C, N, and P are critical elements for physiological metabolism, growth regulation, and response to environmental changes. Nutrient uptake, distribution, and utilization by plants depend on understory light environments, reflecting the plant-environment relationship [29]. Numerous studies have demonstrated a close relationship between light and plant nutrients, with shading significantly impacting the physiological and ecological processes involved in C, N, and P uptake, transportation, distribution, and storage. These processes affect the element contents in different plant organs [30]. Our study showed that the C, N, and P contents and the accumulation and allocation strategies of different organs of P. yunnanensis seedlings differed under different shade and light treatments. As the shading intensity increased, the allocation ratios of C to needles, P to stems, and N to coarse and fine roots decreased and increased. The allocation ratios of C to coarse roots, N to needles and stems, and P to coarse roots increased and decreased. Additionally, the allocation ratios of C to stems and fine roots increased, whereas those of P to needles and fine roots decreased. However, the proportions of coarse root C, stem N, needle, and fine root P were higher, and the proportions of needle N and coarse root P were lower in the light treatment than in the shade treatment. Furthermore, the carbon allocation in plants and their photosynthetic capacity affects the growth rate of plant organs and depends on the strategies plants use to adapt to their environment [31]. We found that the C proportion and the C content of needles and stems decreased significantly with increasing shading intensity. This result is consistent with the findings of Sun Heng et al. [32], who analyzed Azadirachta indica seedlings under drought stress and shading. This phenomenon can be attributed to the lower photosynthetic rate of the seedlings in low light. The consumption of organic matter by the organs increased, reducing the amount of stored organic matter [20]. The proportion of carbon allocation to needles and stems increased with increasing shading intensity, indicating that seedlings preferentially allocated photosynthetic products to aboveground parts under low-light environments, focusing on survival rather than growth [27]. The carbon accumulation was higher in T80-1 than in T80, and the carbon content was lower in T95-1 than in T95. The carbon content differed for different organs, indicating that the light treatment enhanced Seedling photosynthetic efficiency. Conversely, the activity of photosynthesizing enzymes and the synthesis of pigments may be inhibited under low-light conditions [33]. Thus, the seedlings cannot compete in these conditions, resulting in fewer photosynthetic products. The photosynthetic rate is closely related to the N and P contents. Nitrogen and phosphorus are key elements for synthesizing proteins, pigments, chlorophylls, and enzymes essential for photosynthesis. Furthermore, energy generated by photosynthesis is required for nitrogen and phosphorus uptake and transport by plants [31]. In this study, the N content decreased, and the P content increased with increasing shade intensity, which may be attributed to the preferential utilization of the energy produced by photosynthesis for P absorption and transport under low-light conditions. This process ensures the activity of enzymes. However, the N and P accumulation was higher in T80-1 than in T80 and lower in T95-1 than in T95. These results indicate that the light treatment alleviated the limitation of N uptake of P. yunnanensis seedlings in shade conditions. However, excessive shading significantly inhibited the uptake of N and P.

4.3. Effects of the Shade and Light Treatments on C:N, C:P, and N:P of Different Organs of P. yunnanensis Seedlings

The C:N:P ratio in plants reflects their adaptability to changes in the growth environment [34]. The requirements for C, N, and P differ in different environmental conditions. Plants adapt to diverse growth environments by adjusting the element ratios. The C:N and C:P ratios indicate a plant’s capacity to absorb and assimilate nutrients, reflecting nutrient utilization efficiency. The ratios of C:N and C:P of the P. yunnanensis seedlings were higher in the 95% shade treatment than in the 80% shade treatment. However, the C:N ratio was lower, and the C:P ratio was higher in the light treatment than in the shade treatment. This finding suggests that P. yunnanensis seedlings exhibited a synergistic response to shading. Nevertheless, the C:N and the C:P ratios changed in the opposite direction after the light treatment. This phenomenon may be attributed to the light treatment, which increased the seedlings’ photosynthetic rate and carbon sequestration capacity. Greater light exposure increases metabolic activities related to photosynthesis, resulting in a lower C:N ratio and a higher C:P ratio. Research has shown that light treatments optimize the nutrient–element ratio of P. yunnanensis seedlings, improving their adaptability and growth potential in low-light environments. The N:P ratio of plants reflects their biological characteristics and indicates which elements limit plant productivity [35]. Donovan et al. [36] demonstrated that fluctuations in light intensity increased photosynthetic efficiency when nutrients were sufficient. However, these conditions reduce the growth rate of aboveground plant parts, increasing the N:P ratio. Our study corroborates these findings, i.e., the N:P ratio of the needles of P. yunnanensis seedlings increased with increasing shade intensity. This observation is consistent with other studies. In addition, N and P are key elements that limit the growth and development of terrestrial plants. The N:P ratio indicates the limiting effects of these elements [37]. It is an indicator of the nutrient supply for plant growth [38]. Klausmeier et al. [39] found that plant growth was limited by N when the leaf N:P ratio was below 14, by P when the N:P ratio was higher than 14, and by N and P when the N:P ratio was 14–16. We observed that the N:P ratio of the needles increased with the shade intensity. It was lower than 14 in the T80 treatment, higher than 16 in the T95 treatment, higher in T80-1 than T80, ranging from 14 to 16, and lower in T95-1 than in T95. These results indicate that the P. yunnanensis seedlings were primarily limited by N and P in the shade treatment, and the light treatment alleviated these effects.

4.4. Effect of C, N, and P Stoichiometry of Various Organs of P. yunnanensis on Morphological Traits

Plants adapt to their environment by evolutionary adaption. They use numerous adaptive strategies, encompassing intrinsic physiological and extrinsic morphological characteristics [40]. The C, N, and P stoichiometric traits are critical in the physiological and metabolic, affecting plant growth, development, and environmental adaptation. Phenotypic plasticity enables plants to adjust their resource acquisition and consumption to ensure growth and metabolism in different environmental conditions [2]. We found that the plasticity indices of fine and coarse root biomass, stem C:P, coarse root N:P, stem N:P, and stem P content were large (Figure 5). The RDA indicated that the primary factor influencing the growth indices of the Yunnan pine seedlings was fine root N:P, with an explanatory rate of 40.3%. A significant negative correlation existed between the fine root N:P ratio and the growth indices, except for the needle biomass ratio (Figure 6). This study demonstrated that P. yunnanensis seedlings could compensate for nutrient deficiencies due to a low photosynthetic rate by regulating the nutrient ratios of the coarse and fine root biomass and stems. The seedlings could cope with N and P limitations by changing the fine root N:P ratio to ensure growth and competitiveness. An increase in the P content compensated for an insufficient N supply. N and P could be replaced in a specific range.

5. Conclusions

The shade treatment significantly reduced the height (down 29.59%), basal diameter (down 47.40%), the biomass of all organs, and the proportions of fine root biomass and root–crown ratio of P. yunnanensis seedlings. The C, N, and P contents were lower in the shade than the light treatment, and the N:P ratio was lower than 16. The results suggested that P. yunnanensis seedlings adopted conservative strategies under low-light conditions. They slowly acquired and consumed resources and allocated biomass and photosynthetic products primarily to aboveground parts, focusing on survival rather than growth. They were limited by N and P. The light treatment significantly alleviated the inhibitory effects of shade (height and basal diameter increment decreased by only 23.29% 39.45%) and low N and P contents on the growth of P. yunnanensis seedlings. The phenotypic plasticity index analysis and RDA indicated that the seedlings adapted to environmental conditions by adjusting fine and coarse root biomass, stem C:P (0.81), coarse root N:P (explanation rate of 40.30%), stem N:P, and the stem P content. Additionally, they responded to low N and P conditions by altering the fine root N:P ratio.
When cultivating P. yunnanensis forests, it is recommended that branches within the canopy of large trees can be pruned to increase forest light penetration (it is recommended that pruning the understory light penetration between 70% and 80% increases the regeneration capacity of P. yunnanensis seedlings), and to increase the light quantum density in the understory, which can help to improve the regeneration capacity of P. yunnanensis forests. Our study was limited only to the results of simulated sun flecks from potting experiments, and further field observations of understory localization are a worthwhile next step.

Author Contributions

J.W.: Conceptualization, Data curation, Funding acquisition, Project administration, Writing—original draft, Writing—review & editing. Y.L. and C.L.: Conceptualization, Data curation, Investigation, Methodology, Software, Writing—original draft. W.Z.: Conceptualization, Data curation, Formal analysis, Investigation, Methodology, Software, Writing—original draft. All authors have read and agreed to the published version of the manuscript.

Funding

This work was co-supported by the National Natural Science Foundation of China (31960306).

Data Availability Statement

The datasets used during the current study are available from the corresponding author upon reasonable request.

Acknowledgments

The authors would like to express their gratitude to Southwest Forestry University for providing the necessary facilities to conduct this research.

Conflicts of Interest

The authors declare that they have no conflict of interest.

References

  1. Rozendaal, D.M.A.; Hurtado, V.H.; Poorter, L. Plasticity in leaf traits of 38 tropical trees in response to light:relationships with light demand and adult stature. Funct. Ecol. 2006, 20, 207–216. [Google Scholar] [CrossRef]
  2. Liu, Y.X.; Wu, J.W.; Jing, H.Q. Non-structural carbohydrate (NSC) content and C:N:P stoichiometry of Pinus yunnanensis seedling needles in response to shade treatment. Ind. Crops Prod. 2024, 210, 118138. [Google Scholar] [CrossRef]
  3. Lee, G.B.; Lee, J.E.; Je, B.I.; Lee, Y.J.; Park, Y.H.; Choi, Y.W.; Son, B.G.; Kang, N.J.; Kang, J.S. Effect of low-light intensity on growth, yield and quality of strawberries. J. Environ. Sci. Int. 2020, 29, 167–175. [Google Scholar] [CrossRef]
  4. Zhou, Y.; Huang, L.; Wei, X.; Zhou, H.; Chen, X. Physiological, morphological, and anatomical changes in Rhododendron agastum in response to shading. Plant Growth Regul. 2017, 81, 23–30. [Google Scholar] [CrossRef]
  5. Mokany, K.; Raison, R.J.; Prokushkin, A.S. Critical analysis of root: Shoot ratios in terrestrial biomes. Glob. Change Biol. 2006, 12, 84–96. [Google Scholar] [CrossRef]
  6. Ali, A.A.; Xu, C.; Rogers, A.; McDowell, N.G.; Medlyn, B.E.; Fisher, R.A.; Wullschleger, S.D.; Reich, P.B.; Vrugt, J.A.; Bauerle, W.L.; et al. Global-scale environmental control of plant photosynthetic capacity. Ecol. Appl. 2015, 25, 2349–2365. [Google Scholar] [CrossRef] [PubMed]
  7. Li, W.; Chen, G.; Fang, Y.; Wang, T.; Wu, Y.; Wu, Y.; Liu, X.; Jiang, B. Hydrogen peroxide as a systemic messenger in the photosynthetic induction of mulberry leaves. J. For. Res. 2021, 32, 945–952. [Google Scholar] [CrossRef]
  8. Fan, D.Y.; Xie, Z.Q.; Wang, Q.; Zhang, Q.D. Photosynthetic response of a shrub (Pachysandra terminalis) in a subtropical evergreen broad-leaved forest (English). Chin. J. Plant Ecol. 2002, 4, 447–453. [Google Scholar]
  9. Ma, Z.L.; Yang, W.Q.; Wu, F.Z.; Gao, S. Effects of shading on the aboveground biomass and stiochiometry characteristics of Medicago sativa. Chin. J. Appl. Ecol. 2014, 25, 3139–3144. [Google Scholar]
  10. Han, Y.H.; Zhao, Q.L.; Zhang, J.; Sha, H. Effects of Shading on Seedling Growth and C, N, P Stoichiometry Characteristics of Cercidiphyllum japonicum. For. Eng. 2024, 40, 36–46. [Google Scholar]
  11. Liu, Y.; Xiao, J.; Sun, J.; Zhao, Z.; Deng, X.; Wu, J.; Zhang, D.; Bao, Y. Seasonal variation in C:N:P stoichiometry, nonstructural carbohydrates, and carbon isotopes of two coniferous pioneer tree species in subtropical China. Front. Plant Sci. 2023, 27, 1225436. [Google Scholar] [CrossRef] [PubMed]
  12. Shen, J.; Li, Z.; Gao, C.; Li, S.; Huang, X.; Lang, X.; Su, J. Radial growth response of Pinus yunnanensis to rising temperature and drought stress on the Yunnan Plateau, southwestern China. Forest Ecol. Manag. 2020, 474, 118357. [Google Scholar] [CrossRef]
  13. Su, W.; Yu, J.; Zhang, G.; Shi, Z.; Wang, L.; Zhao, G.; Zhou, R. Comparison of the canopy and soil seed banks of Pinus yunnanensis in central Yunnan, China. Forest Ecol. Manag. 2019, 437, 41–48. [Google Scholar] [CrossRef]
  14. Xu, Y.; Woeste, K.; Cai, N.; Kang, X.; Li, G.; Chen, S.; Duan, A. Variation in needle and cone traits in natural populations of Pinus yunnanensis. J. For. Res. 2016, 27, 41–49. [Google Scholar] [CrossRef]
  15. Wang, X.Z.; Wang, L.F.; Wang, Y.; Huang, Y.; Ding, Z.; Zhou, J.; Gou, D. Identification and genetic analysis of the pinewood nematode Bursaphelenchus xylophilus from Pinus yunnanensis. Forest Pathol. 2015, 45, 388–399. [Google Scholar] [CrossRef]
  16. Yang, Y.; Luo, Y. Carbon: Nitrogen stoichiometry in forest ecosystems during stand development. Glob. Ecol. Biogeogr. 2011, 20, 354–361. [Google Scholar]
  17. Frey, B.R.; Ashton, M.S. Growth, survival and sunfleck response of underplanted red oaks (Quercus spp., section Erythrobalanus) along a topographic gradient in southern New England. For. Ecol. Manag. 2018, 419–420, 179–186. [Google Scholar] [CrossRef]
  18. Li, K.; Li, Z.J. Soil Agrochemical Analysis Method; China Agricultural Science and Technology Press: Beijing, China, 2019. [Google Scholar]
  19. Poorter, H.; Nagel, O. The role of biomass allocation in the growth response of plants to different levels of light, CO2, nutrients and water: A quantitative review. Aust. J. Plant Physiol. 2000, 27, 595–607. [Google Scholar]
  20. Yin, D.; Shen, H.; Wei, X. Effects of Shading on Physocarpus amurensis Seedlings Photosynthetic Ability and Carbohydrate Accumulation. Bull. Bot. Res. 2017, 37, 841–847. [Google Scholar]
  21. Katahata, S.; Naramoto, M.; Kakubari, Y.; Mukai, Y. Photosynthetic capacity and nitrogen partitioning in foliage of the evergreen shrub Daphniphyllum humile along a natural light gradient. Tree Physiol. 2007, 27, 199–208. [Google Scholar] [CrossRef]
  22. Liu, B.; Liu, Q.; Daryanto, S.; Guo, S.; Huang, Z.; Wang, Z.; Wang, L.; Ma, X. Responses of Chinese fir and Schima superba seedlings to light gradients: Implications for the restoration of mixed broadleaf-conifer forests from Chinese fir monocultures. For. Ecol. Manag. 2018, 419–420, 51–57. [Google Scholar] [CrossRef]
  23. Niinemets, Ü. A review of light interception in plant stands from leaf to canopy in different plant functional types and in species with varying shade tolerance. Ecol. Res. 2010, 25, 693–714. [Google Scholar] [CrossRef]
  24. Pires, M.V.; Almeida, A.A.F.; Figueiredo, A.L.; Gomes, F.P.; Souza, M.M. Photosynthetic characteristics of ornamental passion flowers grown under different light intensities. Photosynthetica 2011, 49, 593–602. [Google Scholar] [CrossRef]
  25. Poorter, L.; Hayashida-Oliver, Y. Effects of seasonal drought on gap and understorey seedlings in Bolivian moistforest. J. Trop. Ecol. 2000, 16, 481–498. [Google Scholar] [CrossRef]
  26. Mediavilla, S.; Escudero, A. Differences in biomass allo-cation patterns between saplings of two co-occurring Mediterranean oaks as reflecting different strategies in the use of light and water. Eur. J. For. Res. 2010, 129, 697–706. [Google Scholar] [CrossRef]
  27. Portsmuth, A.; Niinemets, Ü. Structural and physiological plasticity in response to light and nutrients in five temperate deciduous woody species of contrasting shade tolerance. Funct. Ecol. 2007, 21, 61–77. [Google Scholar] [CrossRef]
  28. McConnaughay, K.D.M.; Coleman, J.S. Biomass allocation in plants: Ontogeny or optimality? A test along three resource gradients. Ecology 1999, 80, 2581–2593. [Google Scholar] [CrossRef]
  29. Lin, J.; Zhang, R.; Hu, Y.; Song, Y.; Hänninen, H.; Wu, J. Interactive effects of drought and shading on Torreya grandis seedlings: Physiological and growth responses. Trees 2019, 33, 951–961. [Google Scholar] [CrossRef]
  30. Dickman, E.M.; Newell, J.M.; González, M.J.; Vanni, M.J. Light, nutrients, and food chain length constrain planktonic energy transfer efficiency across multiple trophic levels. Proc. Natl. Acad. Sci. USA 2008, 105, 18408–18412. [Google Scholar] [CrossRef]
  31. Liu, Q.; Huang, Z.; Ma, X.; Wang, Z.; Xing, X.; Liu, B. Changes of seedling growth and C, N, P stoichiometric characteristics in Chinese fir under shading. J. Nanjing For. Univ. (Nat. Sci. Ed.) 2022, 46, 74–82. [Google Scholar]
  32. Sun, H.; Zhang, Y.P.; Wu, J.C.; Peng, X.; Zheng, Y. Effect of Drought Stress and Shading on Growth and Carbon-nitrogen Metabolism of Azadirachta indica Seedlings. Acta Bot. Boreali-Occident. Sin. 2020, 40, 463–470. [Google Scholar]
  33. Gong, J.; Zhang, Z.; Zhang, C.; Zhang, J.; Ran, A. Ecophysiological responses of three tree species to a high altitude environment in the southeastern Tibetan plateau. Forests 2018, 9, 48. [Google Scholar] [CrossRef]
  34. Sardans, J.; Grau, O.; Chen, H.Y.; Janssens, I.A.; Ciais, P.; Piao, S.; Peñuelas, J. Changes in nutrient concentrations of leaves and roots in response to global change factors. Glob. Change Biol. 2017, 23, 3849–3856. [Google Scholar] [CrossRef] [PubMed]
  35. Yuan, Z.; Chen, H.Y.; Reich, P.B. Global-scale latitudinal patterns of plant fine-root nitrogen and phosphorus. Nat. Commun. 2011, 2, 344. [Google Scholar] [CrossRef] [PubMed]
  36. Donovan, L.A.; Maherali, H.; Caruso, C.M.; Huber, H.; de Kroon, H. The evolution of the worldwide leaf economics spectrum. Trends Ecol. Evol. 2011, 26, 88–95. [Google Scholar] [CrossRef]
  37. Ågren, G.I. The C: N: P stoichiometry of autotrophs theory and observations. Ecol. Lett. 2004, 7, 185–191. [Google Scholar] [CrossRef]
  38. Güsewell, S.; Koerselman, W.; Verhoeven, J.T. BiomassN: P ratios as indicators of nutrient limitation for plant populations in wetlands. Ecol. Appl. 2003, 13, 372–384. [Google Scholar] [CrossRef]
  39. Klausmeier, C.A.; Litchman, E.; Daufresne, T.; Levin, S.A. Optimal nitrogen-to-phosphorus stoichiometry of phytoplankton. Nature 2004, 429, 171–174. [Google Scholar] [CrossRef]
  40. Bradshaw, A.D. Unravelling phenotypic plasticity why should we bother. New Phytol. 2006, 170, 644–648. [Google Scholar] [CrossRef]
Figure 1. Height and basal diameter increment of P. yunnanensis seedlings for different shade treatments. Note: Different lowercase letters indicate significant differences between different treatments (p < 0.05). CK: a control (natural light); T80: 80% shade all the time; T80-1:80% shade with 1 h light at noon; T95: 95% shade all the time; T95-1: 95% shade with 1 h light at noon.
Forests 16 00517 g001
Figure 2. C, N, and P contents of different organs of P. yunnanensis seedlings under different treatments. Needle C content (A), Stem C content (B), Thick root C content (C), Fine root C content (D), Needle N content (E), Stem N content (F), Thick root N content (G), Fine root N content (H), Needle P content (I), Stem P content (J), Thick root P content (K), Fine root P content (L). The error bars indicate the standard deviation of the mean (n = 5). Different letters indicate significant differences (p < 0.05) with Duncun multiple range test. CK: a control (natural light); T80: 80% shade all the time; T80-1:80% shade with 1 h light at noon; T95: 95% shade all the time; T95-1: 95% shade with 1 h light at noon.
Forests 16 00517 g002
Figure 3. C, N, and P stoichiometric ratios of the organs of P. yunnanensis seedlings under different treatments. Needle C:N (A), Stem C:N (B), Coarse root C:N (C), Fine root C:N (D), Needle C:N (E), Stem C:N (F), Coarse root C:N (G), Fine root C:N (H), Needle C:N (I), Stem C:N (J), Coarse root C:N (K), Fine root C:N (L). The error bars indicate the standard deviation of the mean (n = 5). Different letters indicate significant differences (p < 0.05) with Duncun multiple range test. CK: a control (natural light); T80: 80% shade all the time; T80-1:80% shade with 1 h light at noon; T95: 95% shade all the time; T95-1: 95% shade with 1 h light at noon.
Forests 16 00517 g003
Figure 4. C, N, and P allocation (content and proportion) in the organs of P. yunnanensis seedlings under different treatments.C accumulation (A), N accumulation (B), P accumulation (C), C reserve allocation ratio (D), N reserves allocation ratio (E), P reserve allocation ratio (F). The error bars indicate the standard deviation of the mean (n = 5). Different letters indicate significant differences (p < 0.05) with Duncun multiple range test. CK: a control (natural light); T80: 80% shade all the time; T80-1:80% shade with 1 h light at noon; T95: 95% shade all the time; T95-1: 95% shade with 1 h light at noon.
Forests 16 00517 g004
Figure 5. Phenotypic plasticity index of stoichiometric traits and growth patterns of P. yunnanensis seedlings in different organs.
Forests 16 00517 g005
Figure 6. Redundancy analysis results of stoichiometry(red arrows) and morphological characteristics (blue arrows) of P. yunnanensis seedlings in different treatments. Where the per centages of the two RDA axes refer to the amount of explanation of stoichiometry indexes and growth characteristics indexes.
Forests 16 00517 g006
Table 1. Biomass content and allocation of P. yunnanensis seedlings under different shade treatments.
TreatmentBiomass/g
NeedlesStemsCoarse RootsFine RootsTotal Biomass
CK5.34 ± 0.182 a3.67 ± 0.199 a1.55 ± 0.023 a1.55 ± 0.021 a12.10 ± 1.554 a
T804.24 ± 0.123 a1.99 ± 0.115 bc0.58 ± 0.019 c0.88 ± 0.011 b7.69 ± 2.082 bc
T80-14.26 ± 0.231 a3.31 ± 0.221 ab1.38 ± 0.014 a0.83 ± 0.013 b9.77 ± 1.477 ab
T953.83 ± 0.221 a2.00 ± 0.098 bc0.96 ± 0.02 b0.58 ± 0.012 c7.38 ± 2.418 bc
T95-13.36 ± 0.213 a1.41 ± 0.068 c0.53 ± 0.032 c0.46 ± 0.011 c5.76 ± 1.717 c
Note: Different lowercase letters indicate significant differences between treatments in the same column (p < 0.05). The numbers denote the mean value ± the standard error (the same below).
Table 2. Biomass proportion of P. yunnanensis seedlings under different shade treatments.
TreatmentBiomass Proportion (%)
NeedlesStemsCoarse RootsFine RootsRoots Crown Ratio
CK43.9630.2812.9712.7935.12
T8055.0026.367.4911.1523.14
T80-143.5933.4614.338.6130.36
T9551.3126.9213.258.5228.05
T95-158.0124.599.088.3221.08
Table 3. Importance ranking and significance of stoichiometric variables.
Stoichiometric CharacteristicsOrder of ImportanceExplanatory Rate/%Fp
Fine root N:P140.38.80.002
Needle N:P210.02.40.018
Coarse root C38.82.30.042
Stem C:P48.42.60.044
Note: Only significant stoichiometric traits are listed (p < 0.05).
Disclaimer/Publisher’s Note: The statements, opinions and data contained in all publications are solely those of the individual author(s) and contributor(s) and not of MDPI and/or the editor(s). MDPI and/or the editor(s) disclaim responsibility for any injury to people or property resulting from any ideas, methods, instructions or products referred to in the content.

