Article

A Study on the Water Consumption Characteristics of Fraxinus pennsylvanica Marshall During the Growing and Non-Growing Seasons and Their Response to Microclimate Variables

1
School of Environmental Science and Safety Engineering, Tianjin University of Technology, Tianjin 300384, China
2
School of Soil and Water Conservation, Beijing Forestry University, Beijing 100083, China
*
Author to whom correspondence should be addressed.
Forests 2025, 16(3), 401; https://doi.org/10.3390/f16030401
Submission received: 20 January 2025 / Revised: 15 February 2025 / Accepted: 19 February 2025 / Published: 24 February 2025
(This article belongs to the Section Forest Hydrology)

Abstract

:
Plant water use can have a profound impact on the regional water cycle and water balance. A great deal of research has been conducted in this area in recent years. However, plant nighttime sap flow and non-growing season water use have rarely been addressed. These two components should not be neglected in accurately predicting the water use of urban landscape trees and large-scale plantation forests. In this study, the thermal diffusion probe (TDP) method was used to observe the water use of Fraxinus pennsylvanica Marshall, a common tree species in northern China. Continuous observations of sap flow were made from November 2020 to September 2021, while meteorological conditions in the region were recorded. We analyzed the sap flow changes in different months and their responses to environmental factors at the daily scale. The results showed a clear circadian rhythm phenomenon of sap flow during the growing season, with strong correlations between nighttime sap flow and daytime sap flow, as well as environmental factors. Transpiration and refilling stem water storage were also observed at night. In the non-growing season, the average whole day sap flow rate is less than 0.5 cm/h. The difference in average sap flow rate between daytime and nighttime is less than 0.3 cm/h. At the daily scale, temperature (Ta), relative humidity (RH), and vapor pressure deficit (VPD) were the main influences on nighttime sap flow. Solar radiation had a significant effect on the overall water use strategy of the trees.

1. Introduction

The global land evaporation flux is mainly composed of plant transpiration [1,2]. Transpiration of plants refers to the process by which water is lost from the surface of vegetation in the form of vapor to the atmosphere, while nutrients and their assimilates flow from the soil into the topmost part of the plant along with the water. It plays an indispensable role in maintaining plant physiological activities and is an essential physiological metabolic process [3,4].
The main influencing factors of sap flow changes can be classified into three categories [5]: physiological factors (such as tree height, breast height diameter, and crown width), soil moisture conditions, and meteorological factors. Trees are open systems, and sap flow responds to variations in their surroundings. Most current research on tree transpiration characteristics in relation to environmental factors concentrate on the growing season. Previous studies on Populus davidiana [6], Albi-zia-julibrissin Durazz [7], and Salix psammophila [8] have consistently identified solar radiation as the primary environmental factor regulating sap flow. Sap flow demonstrates a positive correlation with solar radiation. Zhang et al. [9] conducted an analysis on the loess plateau in China, finding that the dominant factors vary at different time scales. As the time scale expands, the controlling effect of environmental factors on sap flow velocity gradually increases.
The phenomenon of nighttime sap flow has received increasing attention in recent years. Its proportion in the daily sap flow is generally 5%~20% [10]. VPD is its main driving factor [11,12]. In the non-growing season, the transpiration velocity of evergreen and deciduous tree species is 35% to 52% and 9.2% of the growing season, respectively [13]. Evergreen species can maintain stable transpiration [14] and maintain water balance and leaf function [15]. The sap flow velocity of deciduous tree species is low but stable [16].
Due to the global warming trend and the impact of urban heat islands, the sap flow of trees in urban areas has increased, which has created new contradictions with overall water resources [17,18]. However, existing ecological hydrological models rarely consider nighttime sap flow [10], and there is also little research on non-growing season sap flow. The water consumption capacity of trees is often underestimated, leading to a decrease in their growth status and lifespan [19,20]. Fraxinus pennsylvanica Marshall is one of the main urban greening tree species in North China. This study conducts long-term monitoring of its sap flow and analyzes the correlation between sap flow and meteorological factors. We analyze the sap flow patterns of F. pennsylvanica during different stages of its growth cycle, especially its flow patterns at night and during non-growing seasons. This provides a theoretical basis for evaluating the water demand of urban tree species.

2. Material and Methods

2.1. Sites and Species

Tianjin University of Technology (38°51′–39°51′ N and 116°51′–117°20′ W) was the experimental site, situated in the southwest of Tianjin City and northeast of the North China Plain. The terrain is predominantly flat, with an elevation of approximately 5 m. The region has a moderate, temperate, semi-humid continental monsoon climate, characterized by four seasons, with winter being the longest and spring and fall being the shortest [21]. The average yearly temperature is 11.6 °C, with a total annual precipitation is 586.1 mm, of which 443.2 mm occurs in summer (June to August). The region receives an average of 2810.4 annual sunlight hours, with a relative humidity of 63% and an annual evaporation of 1709.7 mm.
F. pennsylvanica was selected for the experiment as one of the primary trees for greening in North China. This deciduous tree of the Fraxinus L. genus in the Oleaceae family can grow up to 10 m in height and flourish from April to November. F. pennsylvanica is a tolerant tree species that is resistant to cold, low humidity, salt alkali, slight drought, grows rapidly, has fewer diseases and pests, and has strong stress resistance. Therefore, it is an excellent tree species for urban greening [22]. Four trees were selected as samples based on their smooth and straight trunks, favorable growth conditions, and absence of pests and diseases. The basic information on the sample trees is presented in Table 1.

2.2. Sap Flow Measurement

In this experiment, continuous observations of sap flow were made from November 2020 to September 2021 on sample trees using thermal diffusion probes (TDPs). The equipment was produced by Rainroot Scientific Limited in China. The coarse old bark was removed from each sample tree at breast height (1.3 m) and the TDP was inserted into the sapwood. The two probes were positioned one above the other, and the distance between the two probes was about 10 cm. The probe was installed on the north side of the tree to avoid errors caused by azimuth angle [23]. Tape was used to cover the position of the probe with foam to avoid interference from direct sunlight or rain [24]. According to Granier’s principle of thermal diffusion, the upper probe contains a heating element and a thermocouple for continuous heating, while the lower probe has only a thermocouple. The temperature difference between the two probes at the sap flow is measured to calculate the corresponding sap flow velocity. The probes are connected to a data collector that automatically records the data at a frequency of 10 s each time, and the average value is recorded every 1 h. The sap flow rate was calculated according to Equations (1) and (2) [25].
K i = T M T i T i
J s = 119 × 10 4 K i 1.231 × 3600
K i is a parameter; T M is the maximum temperature difference between two probes within 24 h (°C); Δ T i is the instantaneous temperature difference value at a certain moment (°C); J s is the sap flow velocity of the tree trunk (cm·h−1).
Tree water consumption was calculated based on sap flow velocity and trunk sapwood area data. The formula for calculating the whole-day water consumption of each tree is given in Equation (3):
F s = A S × i = 1 24 J s i × 10 3
Fs is the whole-day water consumption of a single sample tree (kg); As is the area of sapwood on the tree trunk (cm2).
The contribution of daytime and nighttime water consumption is calculated by the ratio of the cumulative water consumption in the daytime and nighttime time periods to the water consumption of the whole day. The time period when solar radiation is greater than 0 W·m−2 is daytime, and the time period when solar radiation is equal to 0 W·m−2 is nighttime. The calculation formula is Equation (4):
C r = i = 1 t F s i F s × 100 %
Cr is the contribution rate of daytime or nighttime sap flow volume.

2.3. Determination of Environmental Factors

Detection of environmental factors using SPECTRUM Watch Dog 2000 series weather stations from the United States of America. The measured indicators include air temperature (Ta, °C), air relative humidity (RH, %), solar radiation intensity (Rs, W·m−2), atmospheric pressure (P, kPa), and dew point temperature (Td, °C). An average value is recorded every hour. The calculation of the atmospheric vapor pressure deficit (VPD, kPa) is determined by the atmospheric temperature and relative humidity, as shown in Equation (5).
V P D = 1 R H 0.611 × e 17.502 T a T a + 240.97
Ta is the atmospheric temperature; RH is the relative humidity of the air.

2.4. Data Analysis and Processing

This study performed continuous monitoring between November 2020 and September 2021. The leaves completely wither at the end of October and fully recover in early April of the following year. Therefore, November 2020 to March 2021 is designated as the non-growing season, and April to September 2021 is designated as the growing season. Nighttime sap flow was defined as the sap flow during periods of zero solar radiation. Correlation analysis was conducted on daytime and nighttime sap flow velocity, as well as sap flow velocity and environmental factors, using linear regression analysis to investigate the impact of daytime sap flow on nighttime sap flow.

3. Results

3.1. Characteristics of Sap Flow

We analyzed the characteristics of sap flow changes on a daily scale based on monthly data. Then, the average sap flow velocity of daytime, nighttime, and the whole day were calculated in different months, respectively. The results are shown in Figure 1.
The daily variation of sap flow velocity in different months of the growing season showed a single-peak curve, with an obvious circadian rhythm, and the daytime sap flow velocity was significantly higher than the nighttime velocity (Figure 1A). The trend of sap flow velocity changes is consistent throughout the whole day and during the daytime. The lowest value appears in April and then continues to rise until reaching the highest value in July. Nighttime sap flow velocity showed an increasing trend throughout the growing season, with the highest nighttime average sap flow velocity occurring in August.
During the non-growing season when the leaves completely wither, sap flow exhibits a significantly fluctuating low-speed pattern (Figure 1C). The difference in sap flow velocity between daytime and nighttime is significantly reduced, and the nighttime average sap flow velocity is always slightly higher. The average sap flow velocity at different scales shows an upward trend. In January, the average sap flow velocity reaches its lowest value during the daytime and its highest value at nighttime (Figure 1D).

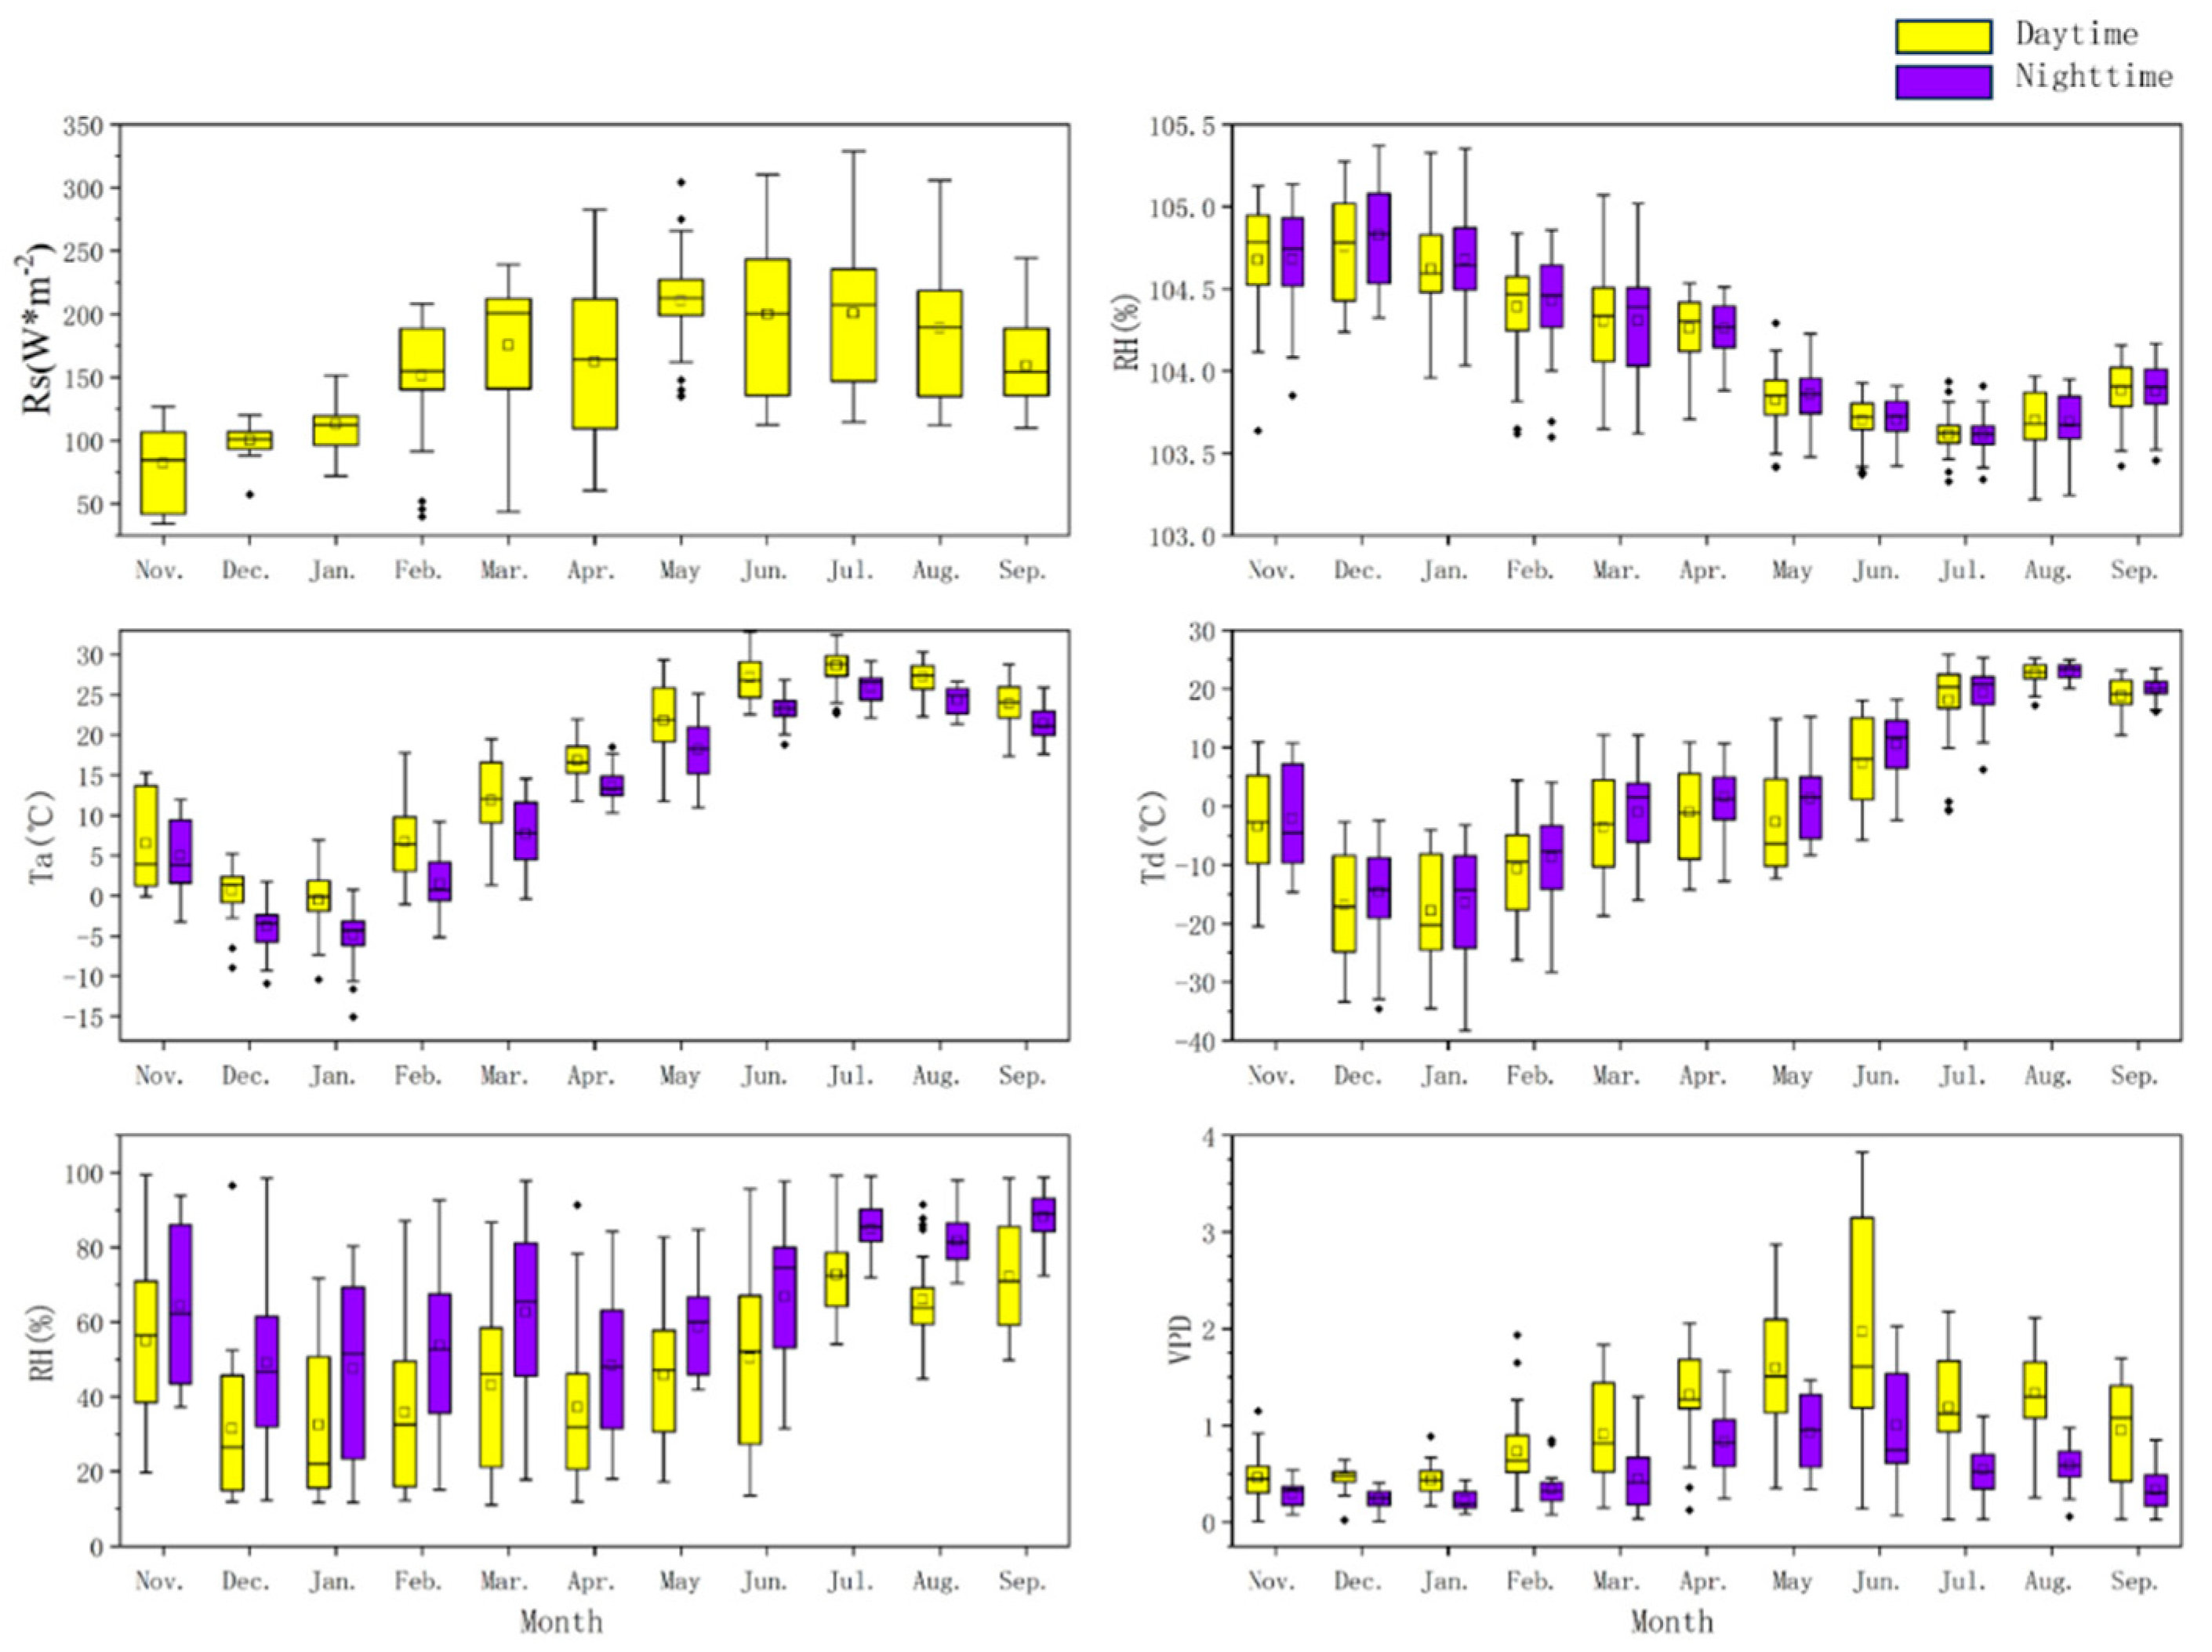
3.2. Meteorological Factor Characteristics

The distribution of meteorological factors is shown in Figure 2. RH was higher at nighttime than during the daytime, and Ta and VPD were higher during the daytime. Rs was significantly higher in the growing season than in the non-growing season, and the difference between daytime and nighttime of P and Td was very small and varied only among different months.
During the growing season, Rs, Ta, Td, and RH varied significantly from month to month, and all of them reached their highest levels in July. Due to high temperatures and humidity in July and August, the distribution of Ta and Td is more concentrated. At the same time, VPD reached its lowest value in July. During the non-growing season, there was little overall change in VPD and P. Ta, Td, and RH all showed a decrease followed by an increase, with January being the driest and coldest month.

3.3. The Relationship Between Sap Flow and Meteorological Factors

The correlation analysis results between sap flow and meteorological factors are shown in Table 2.
During the growing season, Ta, Rs, RH, and VPD all had highly significant correlations with sap flow velocity (p < 0.01), of which Ta, Rs, and VPD had a positive promotion effect on sap flow velocity, and RH showed a highly significant negative correlation with sap flow velocity. The meteorological factor that has the greatest impact on sap flow velocity during the daytime is Ta, while at night, it is VPD, and the main drivers of sap flow velocity in F. pennsylvanica at nighttime were Ta, VPD, and Td at the scale of the whole growing season, and Rs, Ta, VPD, RH, and Td during the daytime, with Ta always having the most important influence.
In the non-growing season, the correlation between sap flow velocity and environmental factors was even lower. In different months, Ta, VPD, and RH were able to show significant or stronger correlations for most of the period, and RH showed a negative correlation on both daytime and nighttime sap flow velocity, whereas the effects of Ta and VPD on sap flow velocity underwent a change from negative to positive. On the scale of the entire non-growing season, Ta and RH showed a highly significant negative correlation, VPD showed a highly significant positive correlation with nighttime sap flow velocity only, and Td showed a highly significant positive correlation with daytime sap flow.

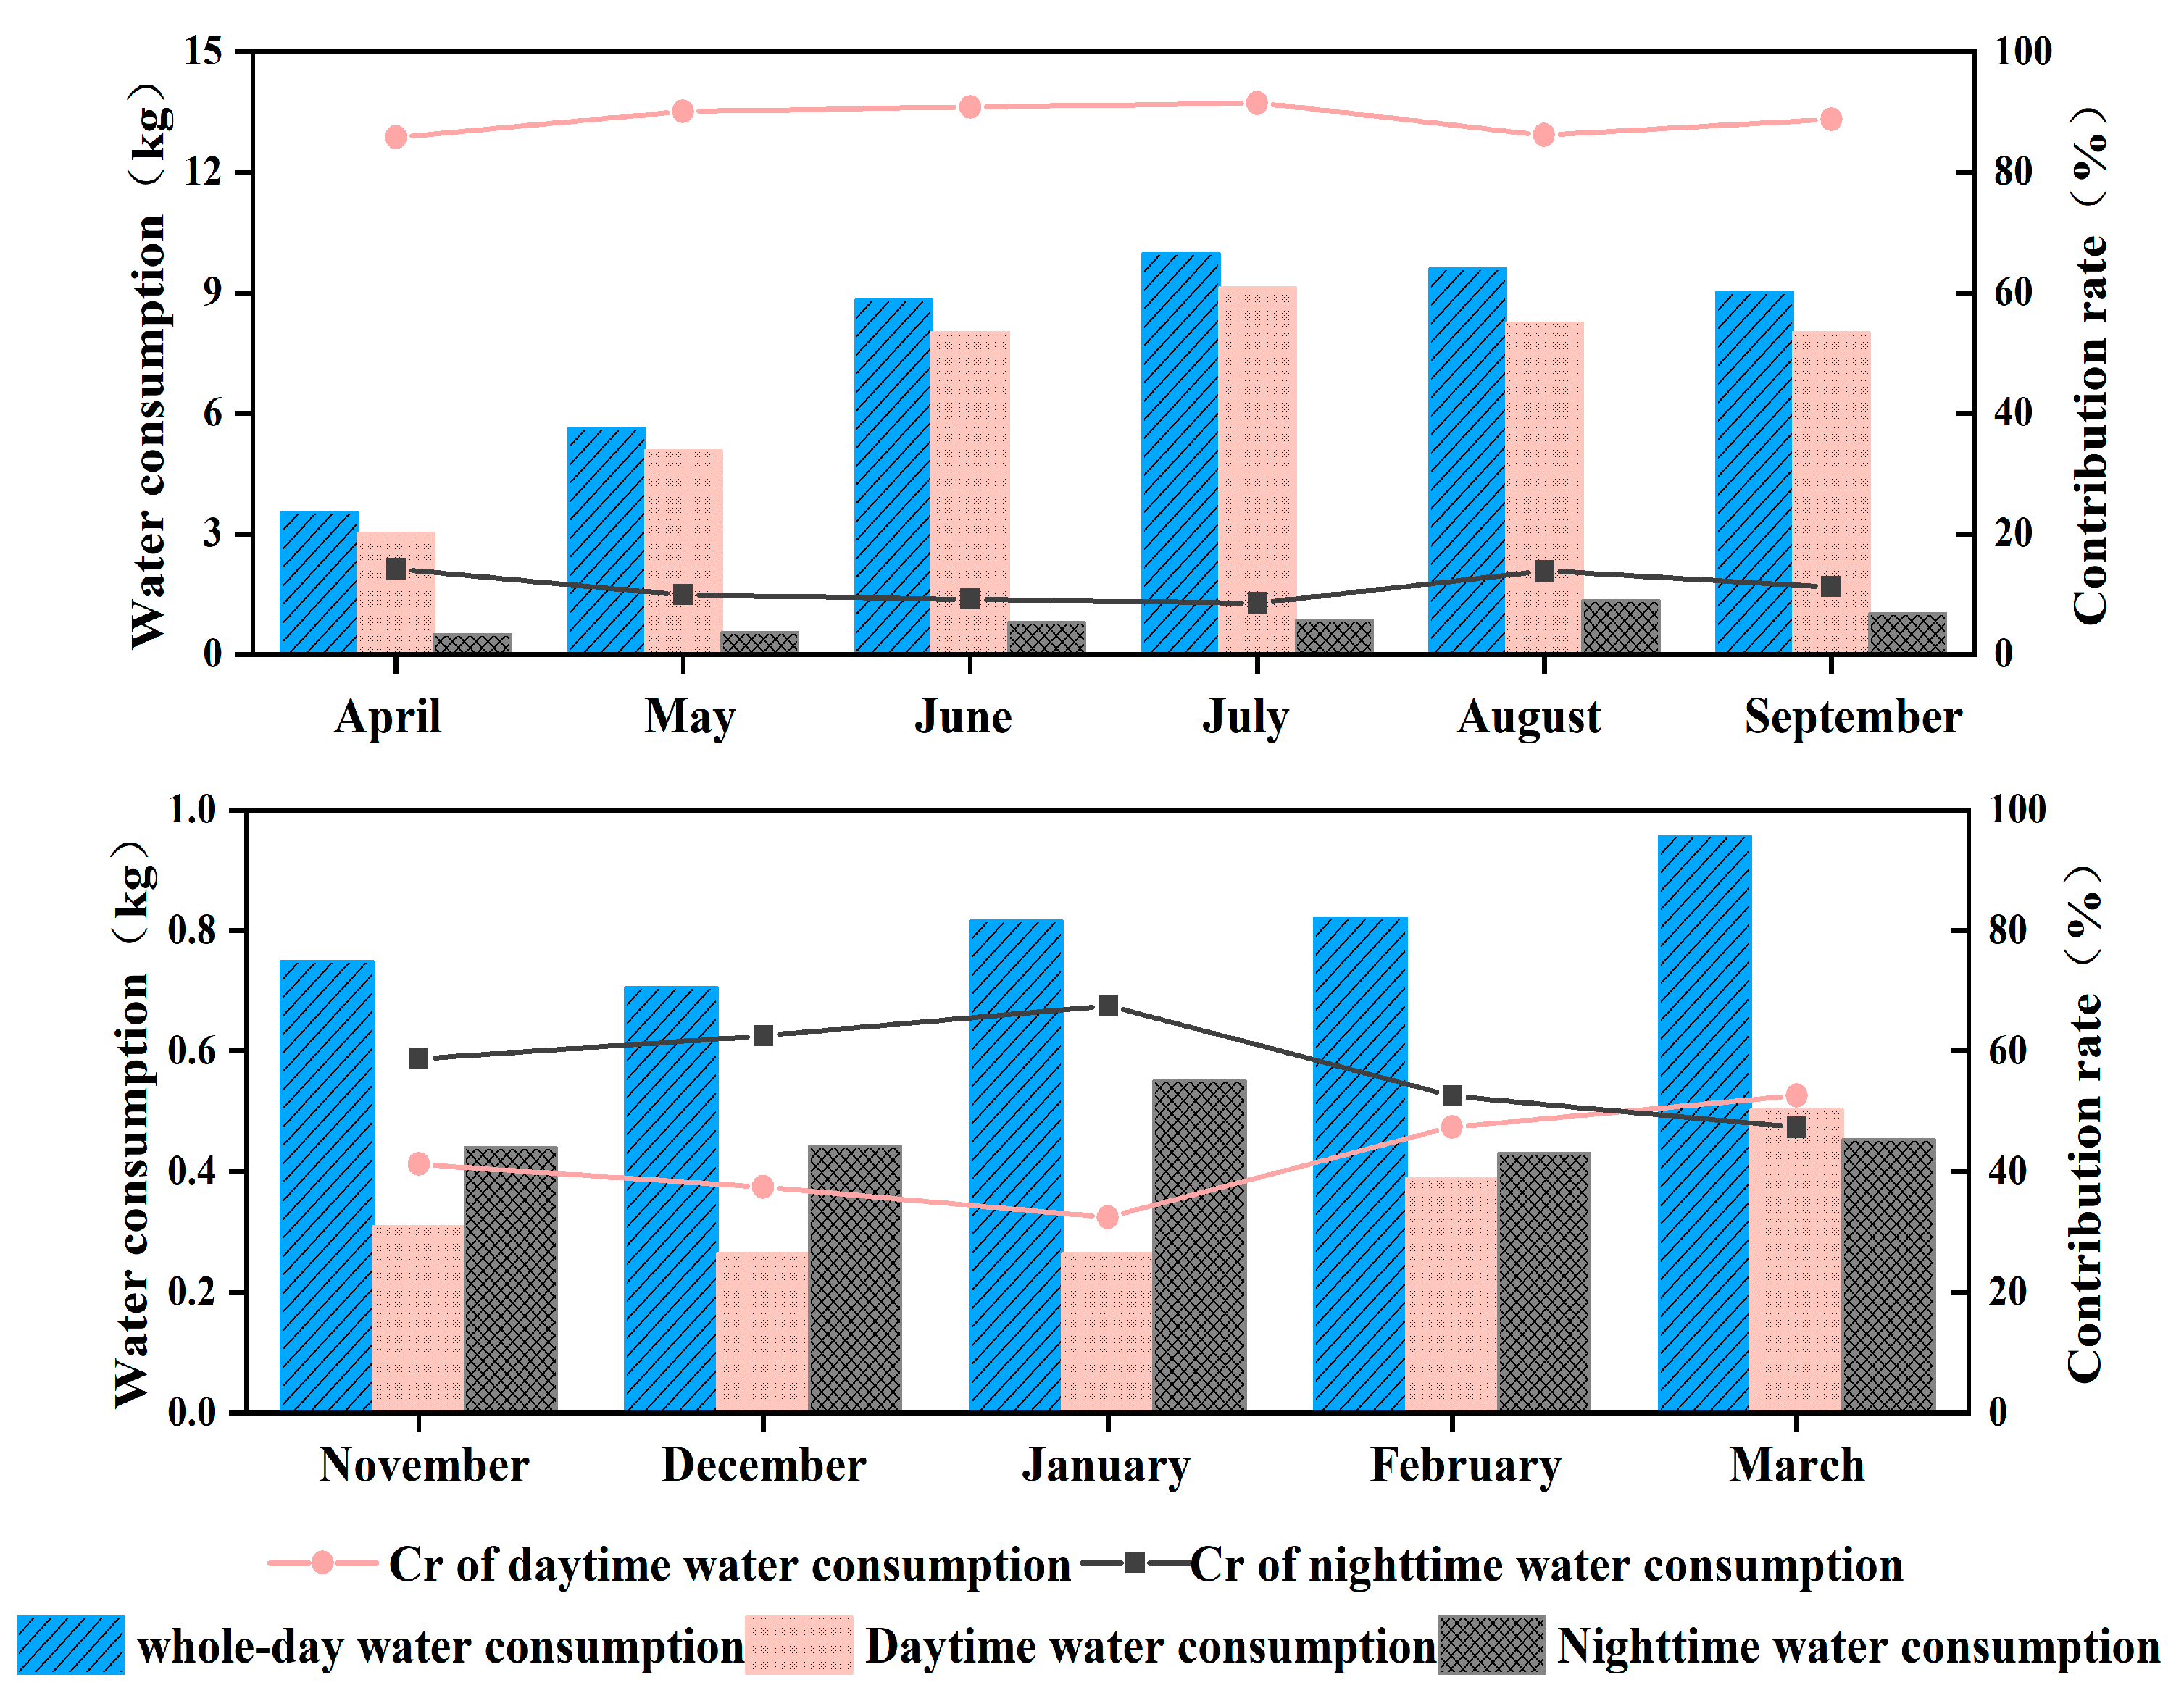
3.4. Daytime and Nighttime Water Consumption Characteristics

As shown in Figure 3. During the growing season, the water consumption showed an increasing and then decreasing trend. The average whole-day and daytime water consumption both reached their maximum in July, at 9.98 kg and 9.21 kg, respectively, while the highest nighttime water consumption occurred in August, at 1.33 kg. The contribution of daytime water consumption was at a high level in all months, accounting for more than 85% of the water consumption. The highest percentage was 91.48% in July. The highest percentage of nighttime water consumption occurred in April, with a contribution of 14.20%.
In the non-growing season, the nighttime water consumption contributions were all at higher levels, with the highest being 67.56% in January. In January and before, the nighttime water consumption contribution was higher than the daytime. After that, the daytime water consumption contribution increased, with the highest contribution of 52.58% in March. The changes in the proportion of daytime water consumption and the proportion of sunshine time show similarities (the proportion of sunshine time from November to March is 42.1%, 39.6%, 40.8%, 44.6%, and 50.0%, respectively).

3.5. Daytime and Nighttime Water Consumption Correlation Analysis

To analyze whether there is a certain degree of correlation between the daytime and nighttime water consumption, a correlation analysis was conducted between the daytime and nighttime cumulative sap flow in different months. The result is shown in Table 3.
As shown in Table 3. The correlation between the two in the non-growing season was more complex. Daytime and nighttime water consumption had different degrees of relationship in different months. In November and March, the relationship showed a highly significant positive correlation (p < 0.01), in December and February, it was weakened (p < 0.05), and in January, daytime and nighttime water consumption did not show any correlation. Analyzing the whole non-growing season scale, the daytime and nighttime water consumptions were able to show a highly significant positive correlation. However, the linear regression results showed that the degree of explanation of the variation in nighttime water consumption by daytime water consumption was not high at both the month scale and the whole non-growing season scale.

4. Discussion

During the growing season, F. pennsylvanica sap flow exhibits a distinct circadian rhythm (Figure 1). The average sap flow velocity during the day is 3.07 cm/h~8.30 cm/h. The daytime sap flow velocity is highly significantly correlated with Ta, Rs, RH, and VPD (p < 0.01), with RH showing a negative correlation and others showing a positive correlation, which is consistent with the results of related studies [26,27,28]. The average sap flow velocity during the whole day and daytime is highest in July, at 5.39 cm/h and 8.30 cm/h respectively. This phenomenon is consistent with previous research on Pinus sylvestris var. mongolica [29], and it is speculated that the increase in precipitation in June and July provides plants with more sufficient soil moisture conditions. Both gradually decreased after July, consistent with the changing trends of Ta, Rs, and VPD.
During the growing season, the average sap flow velocity at night is 0.68 cm/h~1.73 cm/h. Nighttime sap flow is highly correlated with Ta, VPD, and Td (p < 0.01), with VPD being the most strongly correlated meteorological factor in most cases. Meanwhile, daytime sap flow can explain 30% to 50% of nighttime fluid flow. It has been proven that nighttime sap flow includes two parts: transpiration and water storage refilling. In this study, the proportion of nighttime sap flow in daily sap flow was 8.52% to 14.20%. Related studies have shown that during the growing season, nighttime sap flow can reach 5% to 25% of daytime sap flow, and in extreme cases, it may be even higher [30,31].
During the non-growing season, the sap flow velocity decreases significantly (Figure 1C). The average sap flow velocity throughout the day is 0.41 cm/h~0.52 cm/h. The maximum and minimum values of sap flow occur during the daytime. Compared to that, the sap flow at night is more stable. After complete leaf shedding, the sap flow velocity significantly decreases with Ta and VPD and is more closely related to RH. This suggests that water may be lost through the plant epidermis. The explanatory power of daytime sap flow on nighttime sap flow has significantly decreased. The ratio of day and night water consumption is consistent with the ratio of day and night duration. During the period of complete leaf shedding, the flow patterns of day and night are very similar. When predicting plant water demand, there is no need to separately analyze the day and night components.

5. Conclusions

F. pennsylvanica sap flow velocity had a significant diurnal rhythm during the growing season. In the absence of soil moisture stress, daytime sap flow velocity was highly significantly correlated with Ta, Rs, RH, and VPD during the growing season (p < 0.01). Nighttime sap flow was simultaneously affected by both daytime sap flow and meteorological factors, indicating that nighttime sap flow would be used to supplement stem water deficit and transpiration simultaneously. The proportion of nighttime water usage throughout the whole day is 8.52%~14.20%. During the non-growing season, the sap flow was maintained at a generally stable low velocity. The sap flow velocity still showed a correlation with VPD and RH, and water loss could still occur in the absence of leaves. The average sap flow velocity during daytime and nighttime is similar. When predicting water consumption, there is no need to separately consider daytime and nighttime.

Author Contributions

Y.S. wrote the first draft, analyzed the data, and prepared the figures. Y.H. organized the data and revised the first draft. F.L. verified the experimental method and supervised the experimental process. Y.Z. has applied for financial support for the research. H.W. designed experimental methods, managed and coordinated research processes, and reviewed initial drafts. All authors have read and agreed to the published version of the manuscript.

Funding

This work has received funding support from the National Natural Science Foundation, China (41907047).

Data Availability Statement

The data are available in a publicly accessible repository.

Acknowledgments

We thank Yu Su, Wei-Zhan Deng, and Zhi-Rong Wang for their assistance during the experimental observation.

Conflicts of Interest

The authors declare no conflict of interest.

Appendix A

Table A1. Detailed data in Figure 1B,D.
PeriodAverage Sap Flow Velocity at Different Scales (cm/h)
Whole DayDaytimeNighttime
April2.634.590.68
May3.476.120.77
June5.037.621.41
July5.398.301.32
August5.357.961.68
September5.178.081.73
November0.410.370.44
December0.380.310.44
January0.440.310.55
February0.460.420.49
March0.490.450.52
Table A2. Number of cases analyzing the correlation between sap flow and meteorological factors in different periods.
PeriodNumber of Individual CasesPeriodNumber of Individual Cases
April20November19
May18December25
June17January14
July23February11
August21March20
September15
Growing season114Non-growing
season
89

References

  1. Ghimire, C.P.; van Meerveld, H.J.; Zwartendijk, B.W.; Bruijnzeel, L.A.; Ravelona, M.; Lahitiana, J.; Lubczynski, M.W. Vapour pressure deficit and solar radiation are the major drivers of transpiration in montane tropical secondary forests in eastern Madagascar. Agric. For. Meteorol. 2022, 326, 109159. [Google Scholar] [CrossRef]
  2. Jasechko, S.; Sharp, Z.D.; Gibson, J.J.; Birks, S.J.; Yi, Y.; Fawcett, P.J. Terrestrial water fluxes dominated by transpiration. Nature 2013, 496, 347–350. [Google Scholar] [CrossRef] [PubMed]
  3. Fan, C.; Jiao, L.; Lu, N.; Li, M.; Li, Z.; Keyimu, M.; Zhang, L.; Wang, H. Disentangling the independent and interacting impacts of biophysical factors on the transpiration of a black locust (Robinia pseudoacacia) plantation in the semiarid Loess Plateau, China. Land Degrad. Dev. 2022, 34, 1767–1777. [Google Scholar] [CrossRef]
  4. Maurel, C.; Verdoucq, L.; Rodrigues, O. Aquaporins and plant transpiration. Plant Cell Environ. 2016, 39, 2580–2587. [Google Scholar] [CrossRef] [PubMed]
  5. Yu, S.; Guo, J.; Liu, Z.; Wang, Y.; Xu, L.; Yu, P.; He, L. Impacts of environmental and canopy conditions on the nighttime sap flow of larch plantations in the Liupan Mountains, China. J. For. Res. 2023, 34, 1927–1940. [Google Scholar] [CrossRef]
  6. Tie, Q.; Hu, H.; Tian, F.; Guan, H.; Lin, H. Environmental and physiological controls on sap flow in a subhumid mountainous catchment in North China. Agric. For. Meteorol. 2017, 240–241, 46–57. [Google Scholar] [CrossRef]
  7. Wang, X.; Liu, J.; Sun, Y.; Li, K.; Zhang, C. Sap flow characteristics of three afforestation species during the wet and dry seasons in a dry-hot valley in Southwest China. J. For. Res. 2017, 28, 51–62. [Google Scholar] [CrossRef]
  8. Huang, J.; Zhou, Y.; Yin, L.; Wenninger, J.; Zhang, J.; Hou, G.; Zhang, E.; Uhlenbrook, S. Climatic controls on sap flow dynamics and used water sources of Salix psammophila in a semi-arid environment in northwest China. Environ. Earth Sci. 2014, 73, 289–301. [Google Scholar] [CrossRef]
  9. Zhang, J.; Guan, J.; Shi, W.; Yamanaka, N.; Du, S. Interannual variation in stand transpiration estimated by sap flow measurement in a semi-arid black locust plantation, Loess Plateau, China. Ecohydrology 2014, 8, 137–147. [Google Scholar] [CrossRef]
  10. Fang, W.; Lv, N.; Fu, B. Research advances in nighttime sap flow density, its physiological implications, and influencing factors in plants. Acta Ecol. Sin. 2018, 38, 7521–7529. [Google Scholar]
  11. Fu, Z.Q.; Hu, X.; Tian, Q.R.; Ge, Y.L.; Zhou, H.J.; Wu, X.Y.; Chen, L.X. Nocturnal sap flow characteristics of two typical forest tree species and responses to environmental factors in the loess region of West Shanxi, China. Chin. J. Plant Ecol. 2024, 48, 1128–1142. [Google Scholar]
  12. Yi, L.; Huang, J.; Wang, X.; Dong, L.; Ma, H.; Zhang, J. Characteristics of night time sap flow of Salix matsudana and Populus simonii in Yulin, Shaanxi. J. Northwest A F Univ. (Nat. Sci. Ed.) 2013, 41, 85–90. [Google Scholar]
  13. Zhu, H.; Li, H.; Wang, X.; Jiang, T.; Sun, L.; Luo, Y. Water use characteristics of the artificial forests black locust (Robinia pseudoacacia) and Chinese pine (Pinus tabulaeformis) on the Loess Plateau of China. Ecohydrology 2023, 16, e2526. [Google Scholar] [CrossRef]
  14. Chan, A.M.; Bowling, D.R. Assessing the thermal dissipation sap flux density method for monitoring cold season water transport in seasonally snow-covered forests. Tree Physiol. 2017, 37, 984–995. [Google Scholar] [CrossRef] [PubMed]
  15. Taneda, H.; Tateno, M. Hydraulic conductivity, photosynthesis and leaf water balance in six evergreen woody species from fall to winter. Tree Physiol. 2005, 25, 299–306. [Google Scholar] [CrossRef] [PubMed]
  16. Fan, B.; Liu, Z.; Xiong, K.; Li, Y.; Li, K.; Yu, X. Influence of Environmental Factors on the Sap Flow Activity of the Golden Pear in the Growth Period of Karst Area in Southern China. Water 2022, 14, 1707. [Google Scholar] [CrossRef]
  17. Wu, J.; Liu, H.; Zhu, J.; Gong, L.; Xu, L.; Jin, G.; Li, J.; Hauer, R.; Xu, C. Nocturnal sap flow is mainly caused by stem refilling rather than nocturnal transpiration for Acer truncatum in urban environment. Urban For. Urban Green. 2020, 56, 126800. [Google Scholar] [CrossRef]
  18. Choat, B.; Brodribb, T.J.; Brodersen, C.R.; Duursma, R.A.; López, R.; Medlyn, B.E. Triggers of tree mortality under drought. Nature 2018, 558, 531–539. [Google Scholar] [CrossRef] [PubMed]
  19. Buras, A.; Schunk, C.; Zeiträg, C.; Herrmann, C.; Kaiser, L.; Lemme, H.; Straub, C.; Taeger, S.; Gößwein, S.; Klemmt, H.J.; et al. Are Scots pine forest edges particularly prone to drought-induced mortality? Environ. Res. Lett. 2018, 13, 025001. [Google Scholar] [CrossRef]
  20. Dang, H.; Han, H.; Chen, S.; Li, M. A fragile soil moisture environment exacerbates the climate change-related impacts on the water use by Mongolian Scots pine (Pinus sylvestris var. mongolica) in northern China: Long-term observations. Agric. Water Manag. 2021, 251, 106857. [Google Scholar] [CrossRef]
  21. He, C. Characteristics of Agrometeorological Conditions in Xiqing District of Tianjin in Recent 30 Years. J. Agric. Catastrophology 2019, 9, 23–24. [Google Scholar]
  22. Feng, R.; Zhao, J.; Zhang, F.; Wang, J.; Wei, J.; Liu, J. Transcriptomic changes in response of Fraxinus velutina Torr phloem to Agrilus planipennis Fairmaire hazards. For. Res. 2021, 34, 47–55. [Google Scholar]
  23. Moon, M.; Kim, T.; Park, J.; Cho, S.; Ryu, D.; Kim, H.S. Variation in sap flux density and its effect on stand transpiration estimates of Korean pine stands. J. For. Res. 2015, 20, 85–93. [Google Scholar] [CrossRef]
  24. Berry, Z.C.; Gotsch, S.G.; Holwerda, F.; Muñoz-Villers, L.E.; Asbjornsen, H. Slope position influences vegetation-atmosphere interactions in a tropical montane cloud forest. Agric. For. Meteorol. 2016, 221, 207–218. [Google Scholar] [CrossRef]
  25. Granier, A. Evaluation of transpiration in a Douglas-fir stand by means of sap flow measurements. Tree Physiol. 1987, 3, 309–320. [Google Scholar] [CrossRef]
  26. Deng, Y.; Wu, S.; Ke, J.; Zhu, A. Effects of meteorological factors and groundwater depths on plant sap flow velocities in karst critical zone. Sci. Total Environ. 2021, 781, 146764. [Google Scholar] [CrossRef]
  27. Zhao, X.; Zhao, P.; Zhu, L.; Wang, Q.; Hu, Y.; Cranston, B.M.; Kaplick, J.; Lei, O.; Chen, X.; Ni, G.; et al. Exploring the Influence of Biological Traits and Environmental Drivers on Water Use Variations across Contrasting Forests. Forests 2021, 12, 161. [Google Scholar] [CrossRef]
  28. Lyu, J.; He, Q.-Y.; Yang, J.; Chen, Q.-W.; Cheng, R.-R.; Yan, M.-J.; Yamanaka, N.; Du, S. Sap flow characteristics in growing and non-growing seasons in three tree species in the semiarid Loess Plateau region of China. Trees 2020, 34, 943–955. [Google Scholar] [CrossRef]
  29. Lu, Z.; Wei, Y.; Li, Z.; Guo, X.; Zhou, Y. Characteristics of sap flow and its influencing factors of Pinus sylvestris var. Characteristics of sap flow and its influencing factors of Pinus sylvestris var. mongolica in sandy land of Northwest Liaoning. Chin. J. Ecol. 2017, 36, 3182–3189. [Google Scholar]
  30. Di, N.; Yang, S.; Liu, Y.; Fan, Y.; Duan, J.; Nadezhdina, N.; Li, X.; Xi, B. Soil-Moisture-Dependent Nocturnal Water Use Strategy and its Responses to Meteorological Factors in a Seasonal-Arid Poplar Plantation. SSRN Electron. J. 2022, 274, 107984. [Google Scholar]
  31. Novick, K.A.; Oren, R.; Stoy, P.C.; Siqueira, M.B.S.; Katul, G.G. Nocturnal evapotranspiration in eddy-covariance records from three co-located ecosystems in the Southeastern U.S.: Implications for annual fluxes. Agric. For. Meteorol. 2009, 149, 1491–1504. [Google Scholar] [CrossRef]
Figure 1. Sap flow velocity at different scales. (A,C) are the changes in daily sap flow velocity during the growing season and non-growing season, respectively. (B,D) are the average sap flow velocity during the whole day, daytime, and nighttime in different months, respectively. Please refer to Table A1 in the Appendix A for specific data.
Forests 16 00401 g001
Figure 2. Variation in meteorological factors by month. Rs: solar radiation; P: atmospheric pressure. Ta: temperature; Td: temperature dew point difference. RH: relative humidity; VPD: vapor pressure deficit.
Forests 16 00401 g002
Figure 3. Daytime and nighttime water consumption. The bars indicate the water consumption corresponding to the left axis. The folded part shows the proportion of different periods corresponding to the right axis.
Forests 16 00401 g003
Table 1. Characteristics of measured trees.
Tree NumberAgeHeight(m)Stem Diameter (cm)Crown Diameter (m)Sapwood Area (cm2)
1159.3015.606.17160.86
286.9010.204.6876.40
33010.4027.208.73517.19
4178.1016.707.35177.42
Table 2. Correlation analysis between sap flow velocity and meteorological factors in each month of the growing season.
Period TaRHVPDpTdRs
AprilDaytime0.633 **−0.371 **0.544 **−0.068−0.456 *0.277 **
Nighttime0.273 **−0.237 **0.354 **−0.201 **−0.169 **
MayDaytime0.399 **−0.441 **0.439 **−0.020−0.121 *0.459 **
Nighttime0.468 **−0.491 **0.637 **−0.142−0.152 *
JuneDaytime0.597 **−0.558 **0.517 **−0.200 *−0.0820.432 **
Nighttime0.616 **−0.586 **0.653 **−0.054−0.305 *
JulyDaytime0.851 **−0.731 **0.752 **−0.055−0.0240.508 **
Nighttime0.567 **−0.325 **0.381 **−0.081−0.107
AugustDaytime0.781 **−0.751 **0.747 **−0.113−0.390 *0.476 **
Nighttime0.408 **−0.508 **0.562 **−0.108−0.308 **
SeptemberDaytime0.751 **−0.745 **0.701 **−0.024−0.382 *0.504 **
Nighttime0.746 **−0.924 **0.707 **−0.689 *−0.593 **
Growing seasonDaytime0.78 **−0.25 **0.55 **0.090.20 **0.38 **
Nighttime0.58 **−0.030.31 **0.020.21 **
NovemberDaytime−0.269 **−0.008−0.0730.306 *−0.245−0.366 **
Nighttime−0.242 **−0.329 **−0.307 *0.320 *−0.340 *
DecemberDaytime−0.220−0.243 *−0.300 *0.299 *−0.104−0.145
Nighttime−0.293 **−0.264 *−0.224 *0.311 *−0.182 *
JanuaryDaytime0.034−0.237 *0.253 *0.201−0.177−0.068
Nighttime−0.069−0.249 *0.301 *−0.027−0.193 *
FebruaryDaytime0.266 **−0.318 **0.412 **−0.137−0.2600.127
Nighttime0.306 **−0.351 **0.401 **−0.040−0.099
MarchDaytime0.594 **−0.520 **0.501 **−0.306 *−0.351 *0.359 *
Nighttime0.314 **−0.407 **0.420 **−0.011 *−0.322 **
Non-growing seasonDaytime−0.31 **−0.35 **0.130.10−0.30 **0.01
Nighttime−0.49 **−0.46 **0.43 **0.16−0.14
** p < 0.01, * p < 0.05. The correlation at the scale of the entire growing season or non-growing season has been highlighted in bold. The corresponding number of cases in different periods is detailed in Table A2 of the Appendix A.
Table 3. Relationship between daytime and nighttime water consumption during different periods.
PeriodCorrelationRegression Equation
April0.584 ** F N = 0.099 F D ,   R 2 = 0.340
May0.536 ** F N = 0.118 F D ,   R 2 = 0.287
June0.722 ** F N = 0.262 F D ,   R 2 = 0.521
July0.707 ** F N = 0.127 F D ,   R 2 = 0.500
August0.699 ** F N = 0.293 F D ,   R 2 = 0.489
September0.568 ** F N = 0.501 F D ,   R 2 = 0.323
Growing season0.663 ** F N = 0.237 F D , R 2 = 0.440
November0.407 ** F N = 1.468 F D ,   R 2 = 0.166
December0.577 * F N = 1.871 F D ,   R 2 = 0.332
January0.471
February0.741 * F N = 1.632 F D ,   R 2 = 0.548
March0.463 ** F N = 0.846 F D ,   R 2 = 0.214
Non-growing season0.364 ** F N = 3.313 F D , R 2 = 0.133
** p < 0.01, * p < 0.05. The correlation at the scale of the entire growing season or non-growing season has been highlighted in bold. There were significant positive correlations (p < 0.01) during the growing season, with the highest degree of correlation in June. The linear regression results indicate that the daytime sap flow in June has the highest explanatory power for nighttime sap flow, with an R 2 of 0.521. At the scale of the entire growing season, the correlation coefficient of R 2 is 0.44.
Disclaimer/Publisher’s Note: The statements, opinions and data contained in all publications are solely those of the individual author(s) and contributor(s) and not of MDPI and/or the editor(s). MDPI and/or the editor(s) disclaim responsibility for any injury to people or property resulting from any ideas, methods, instructions or products referred to in the content.

