
Distributional Responses of Five Betula (Betulaceae) Species to Future Climate Change in China

 ,
,  ,
,
Abstract
1. Introduction
2. Material and Methods
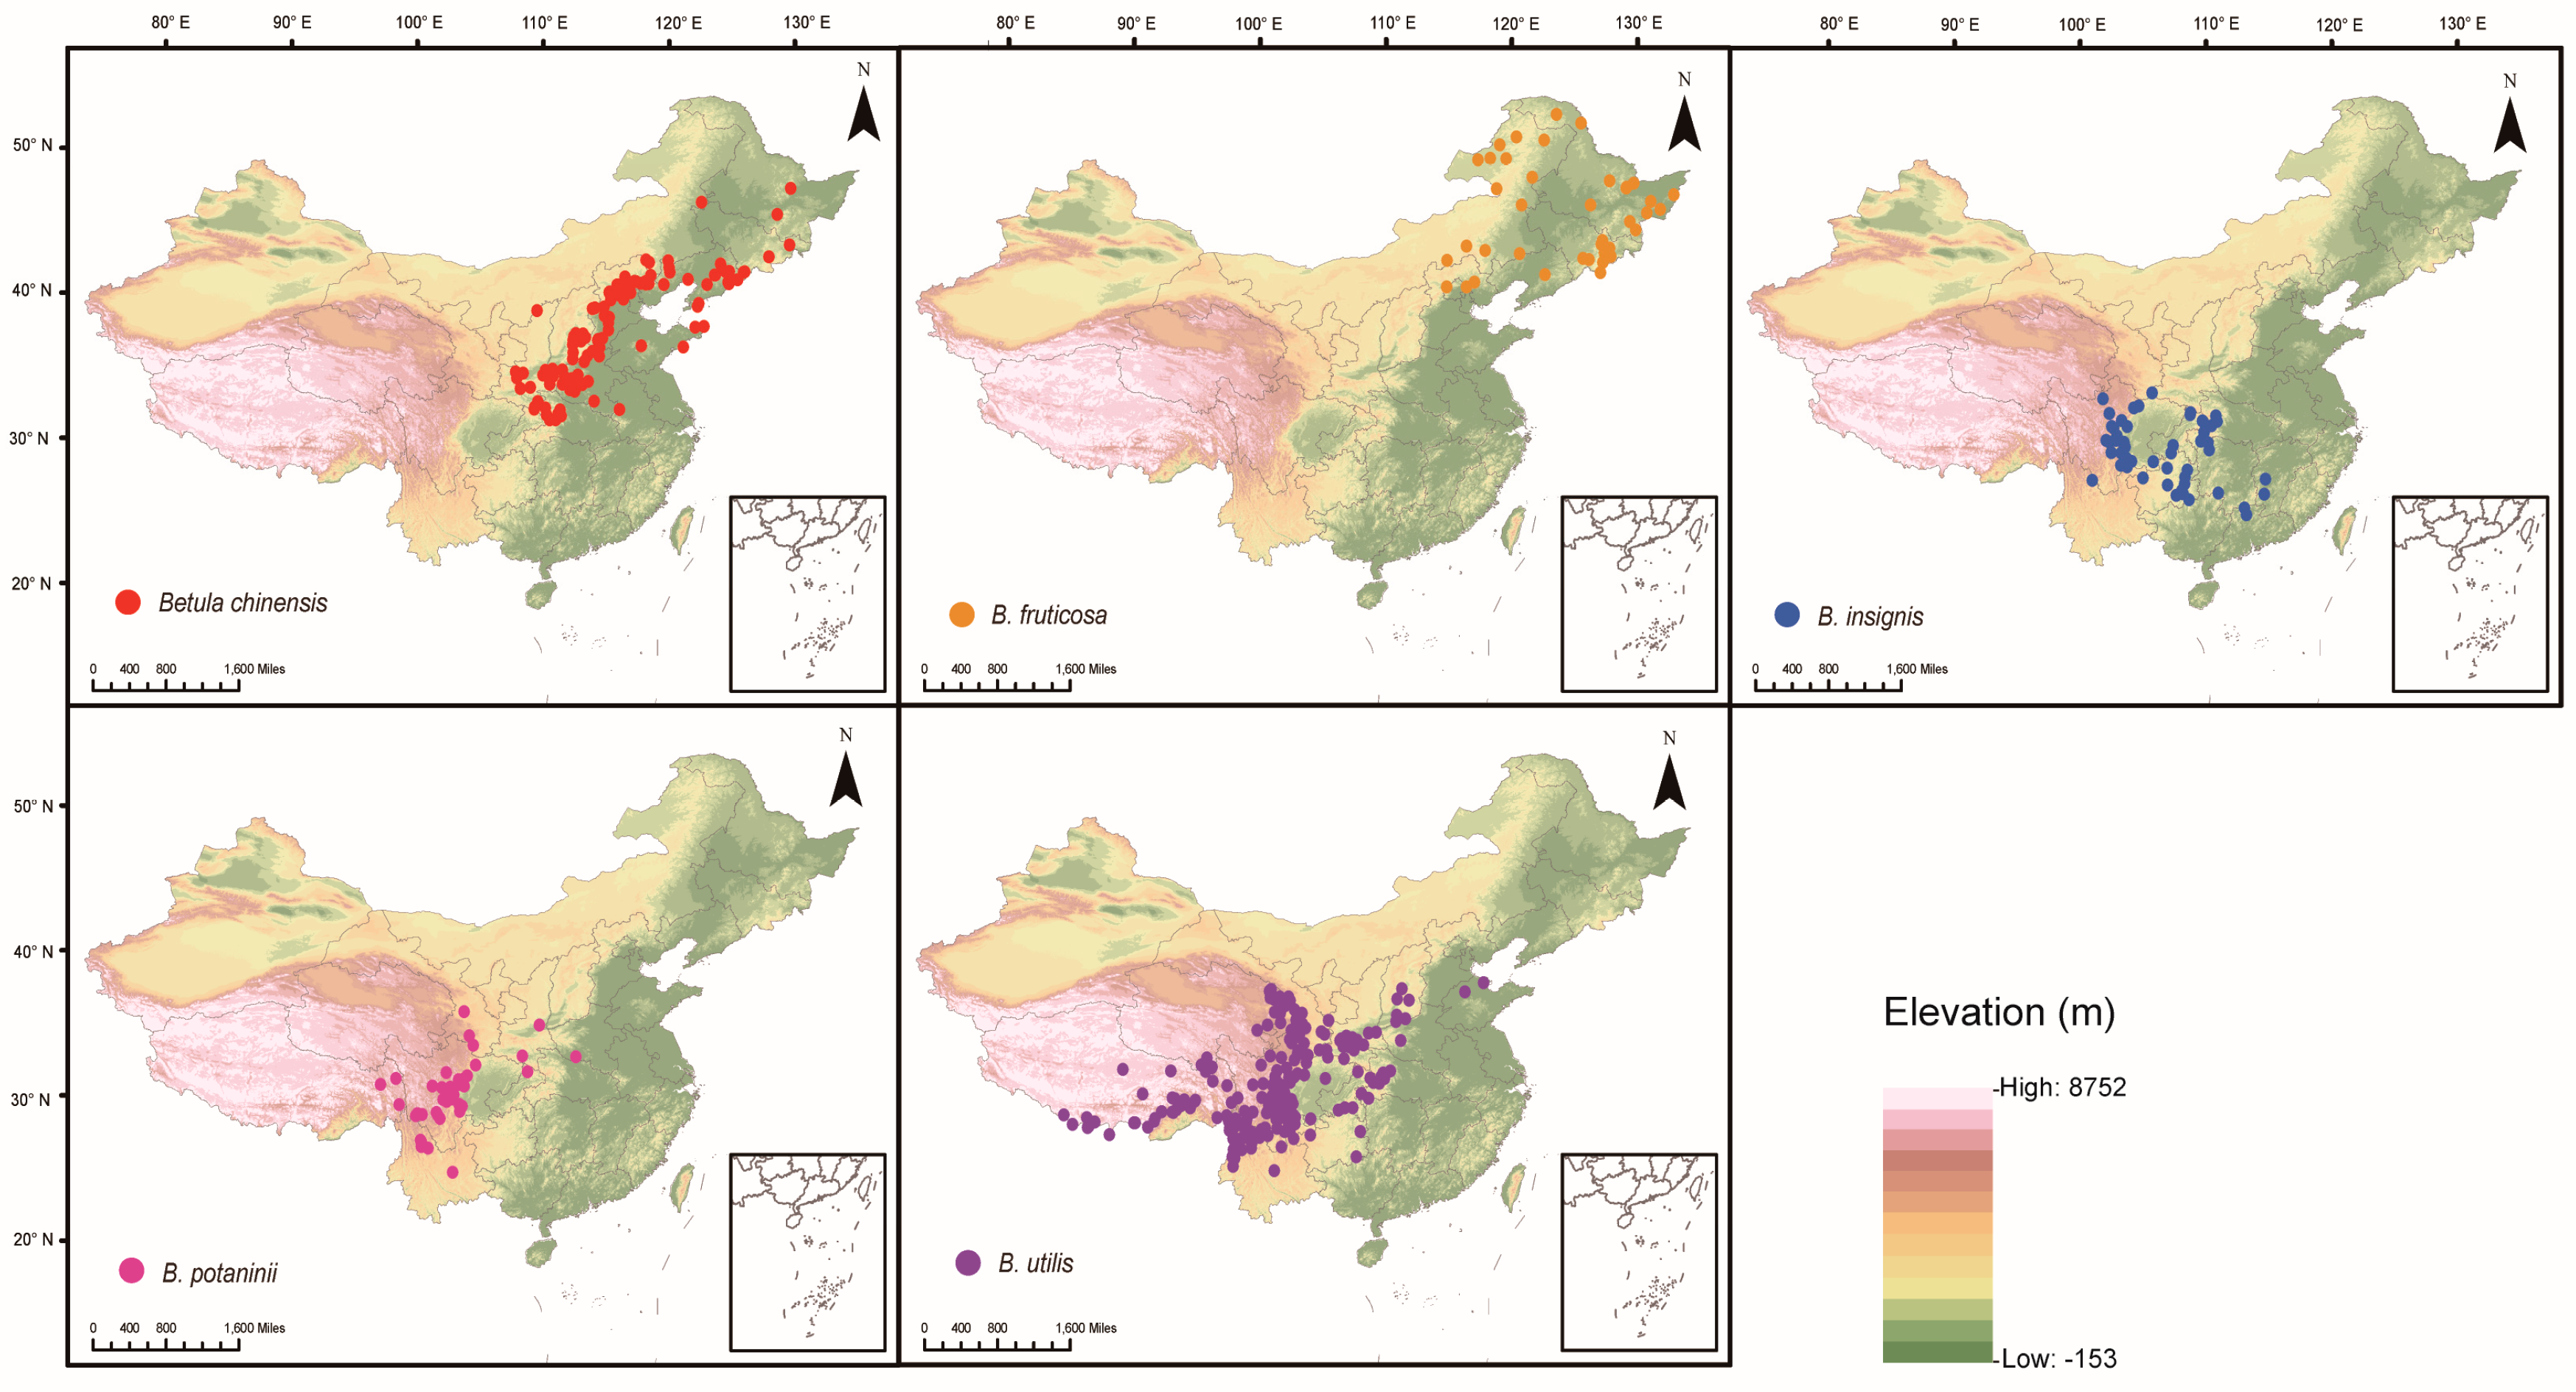
2.1. Species Distribution Data
2.2. Environmental Variable
2.3. Key Environmental Variable Selection
2.4. Model Parameter Optimization
2.5. Model Construction of MaxEnt
2.6. Model Accuracy Evaluation
2.7. Model Output and Data Analysis
3. Results
3.1. Model Accuracy and Key Environmental Variables
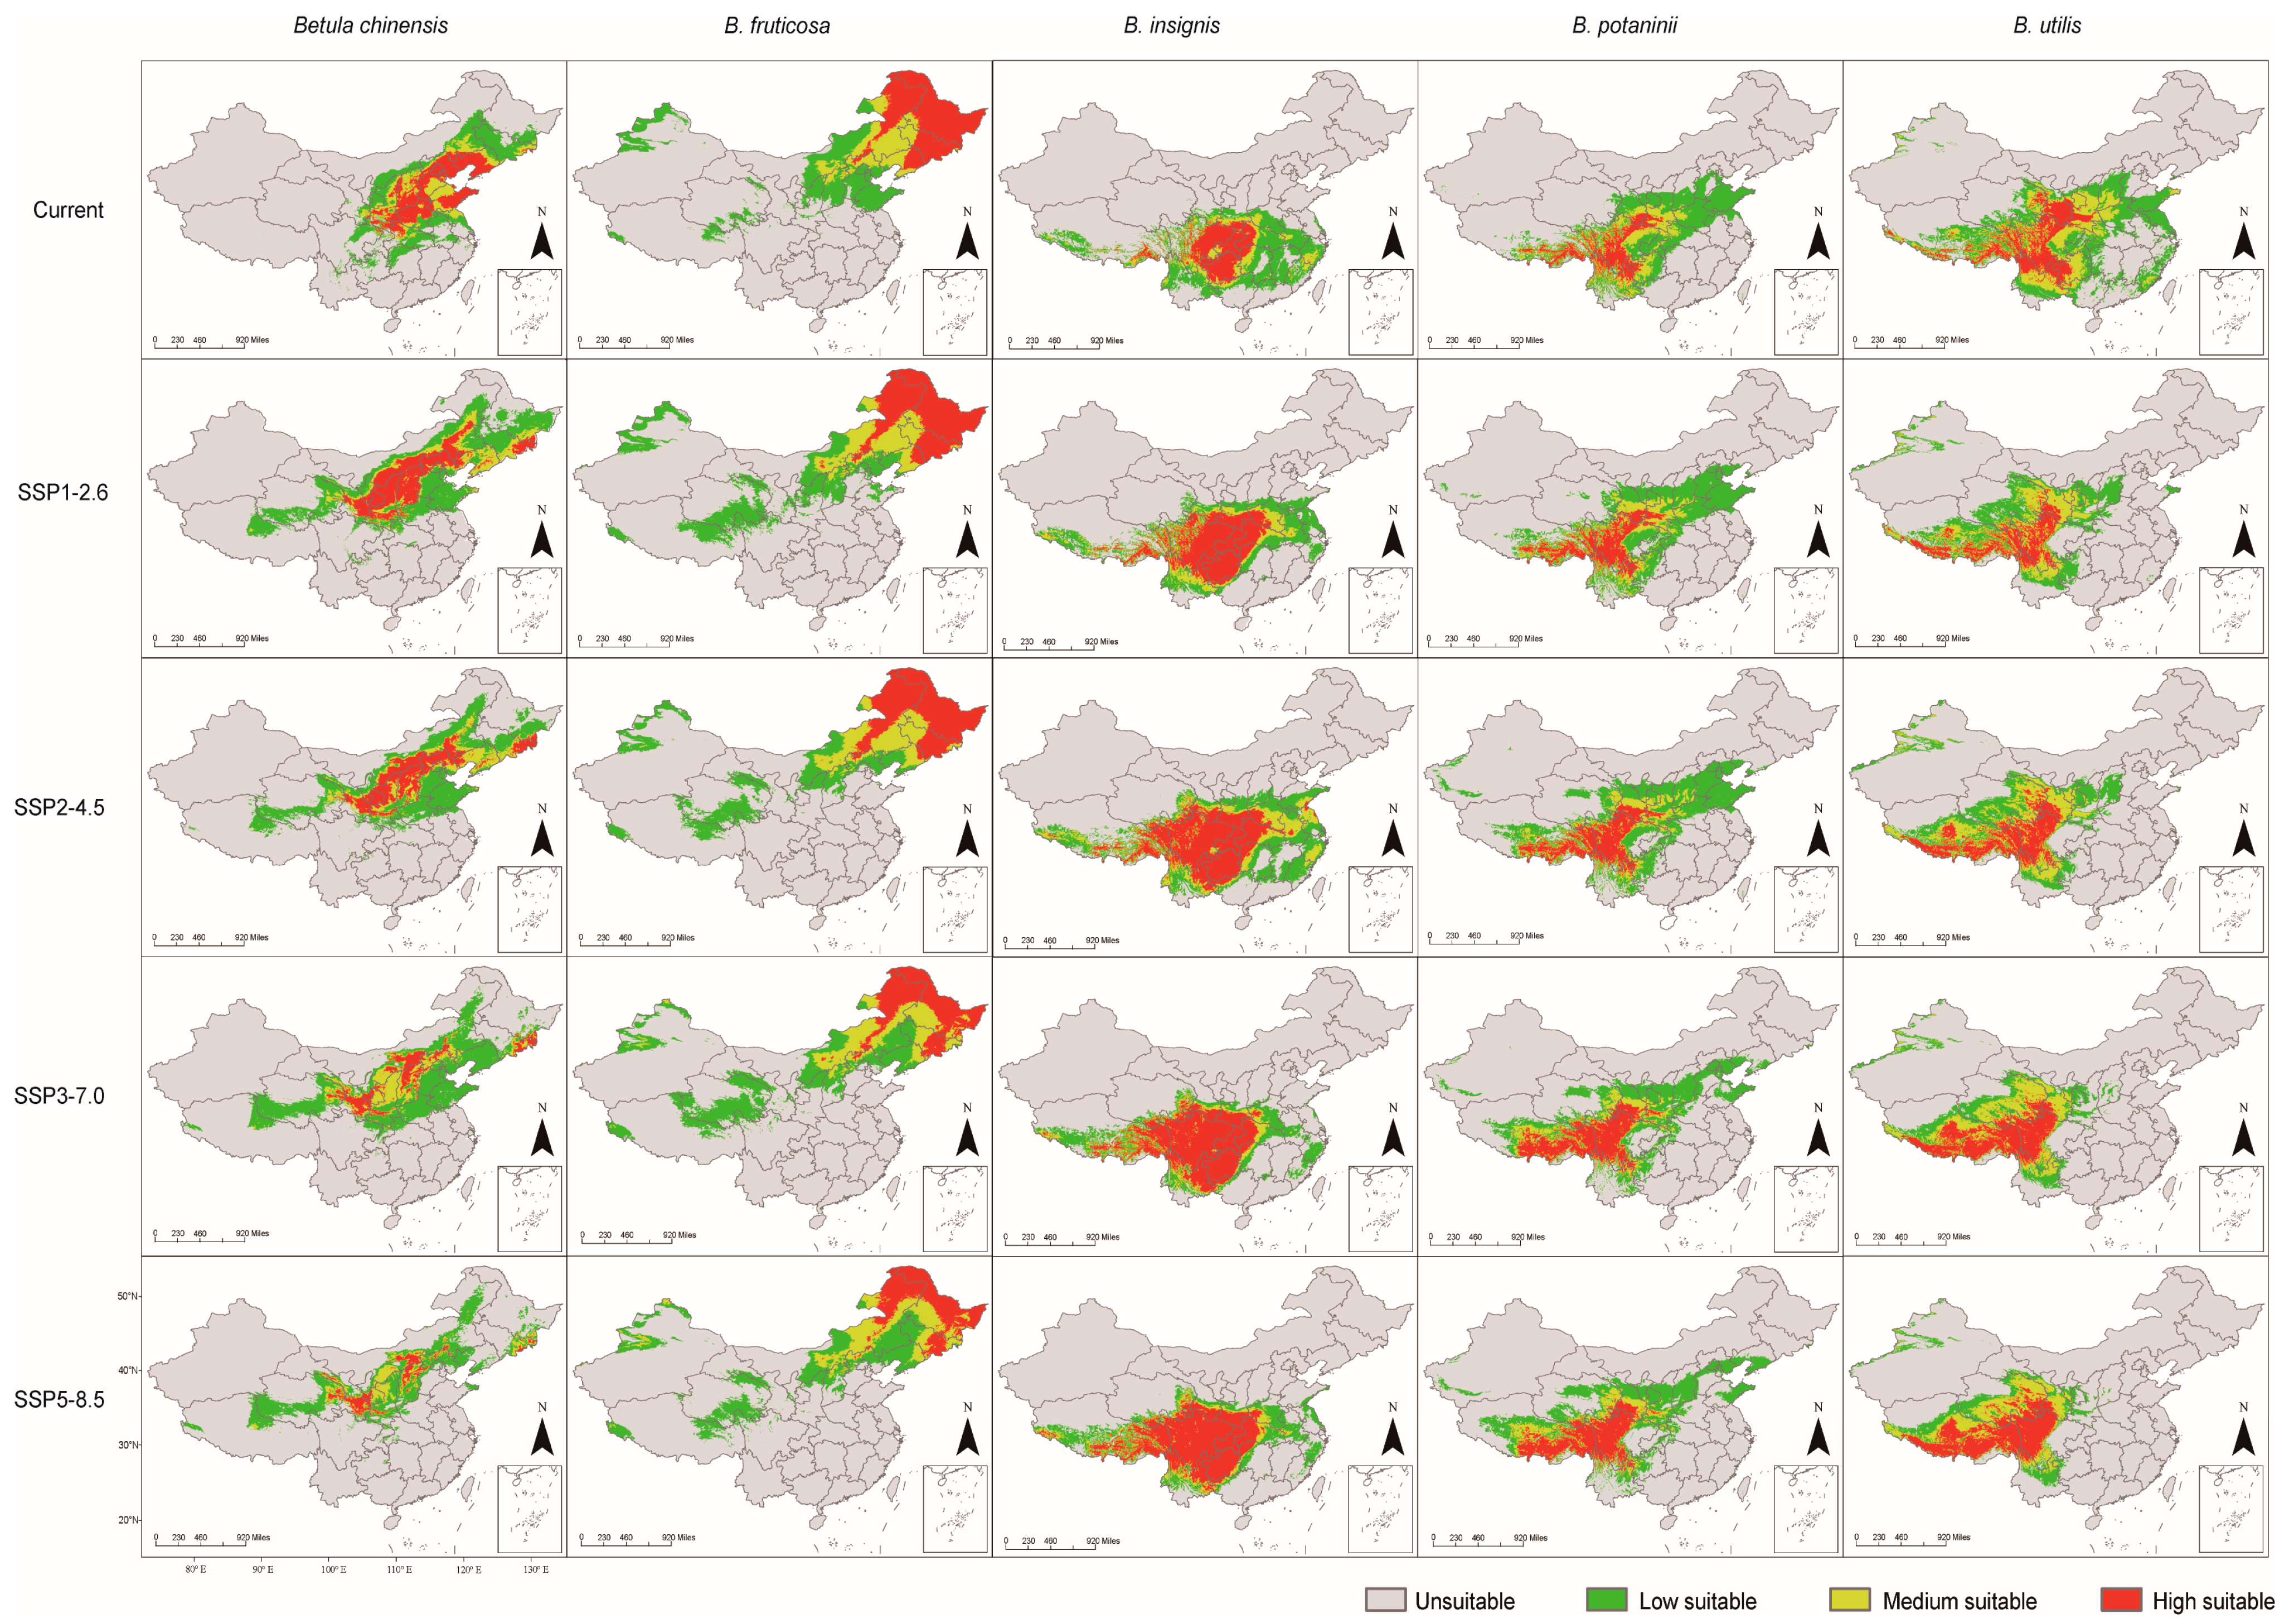
3.2. Predicted Potential Suitable Distribution of the Betula Species
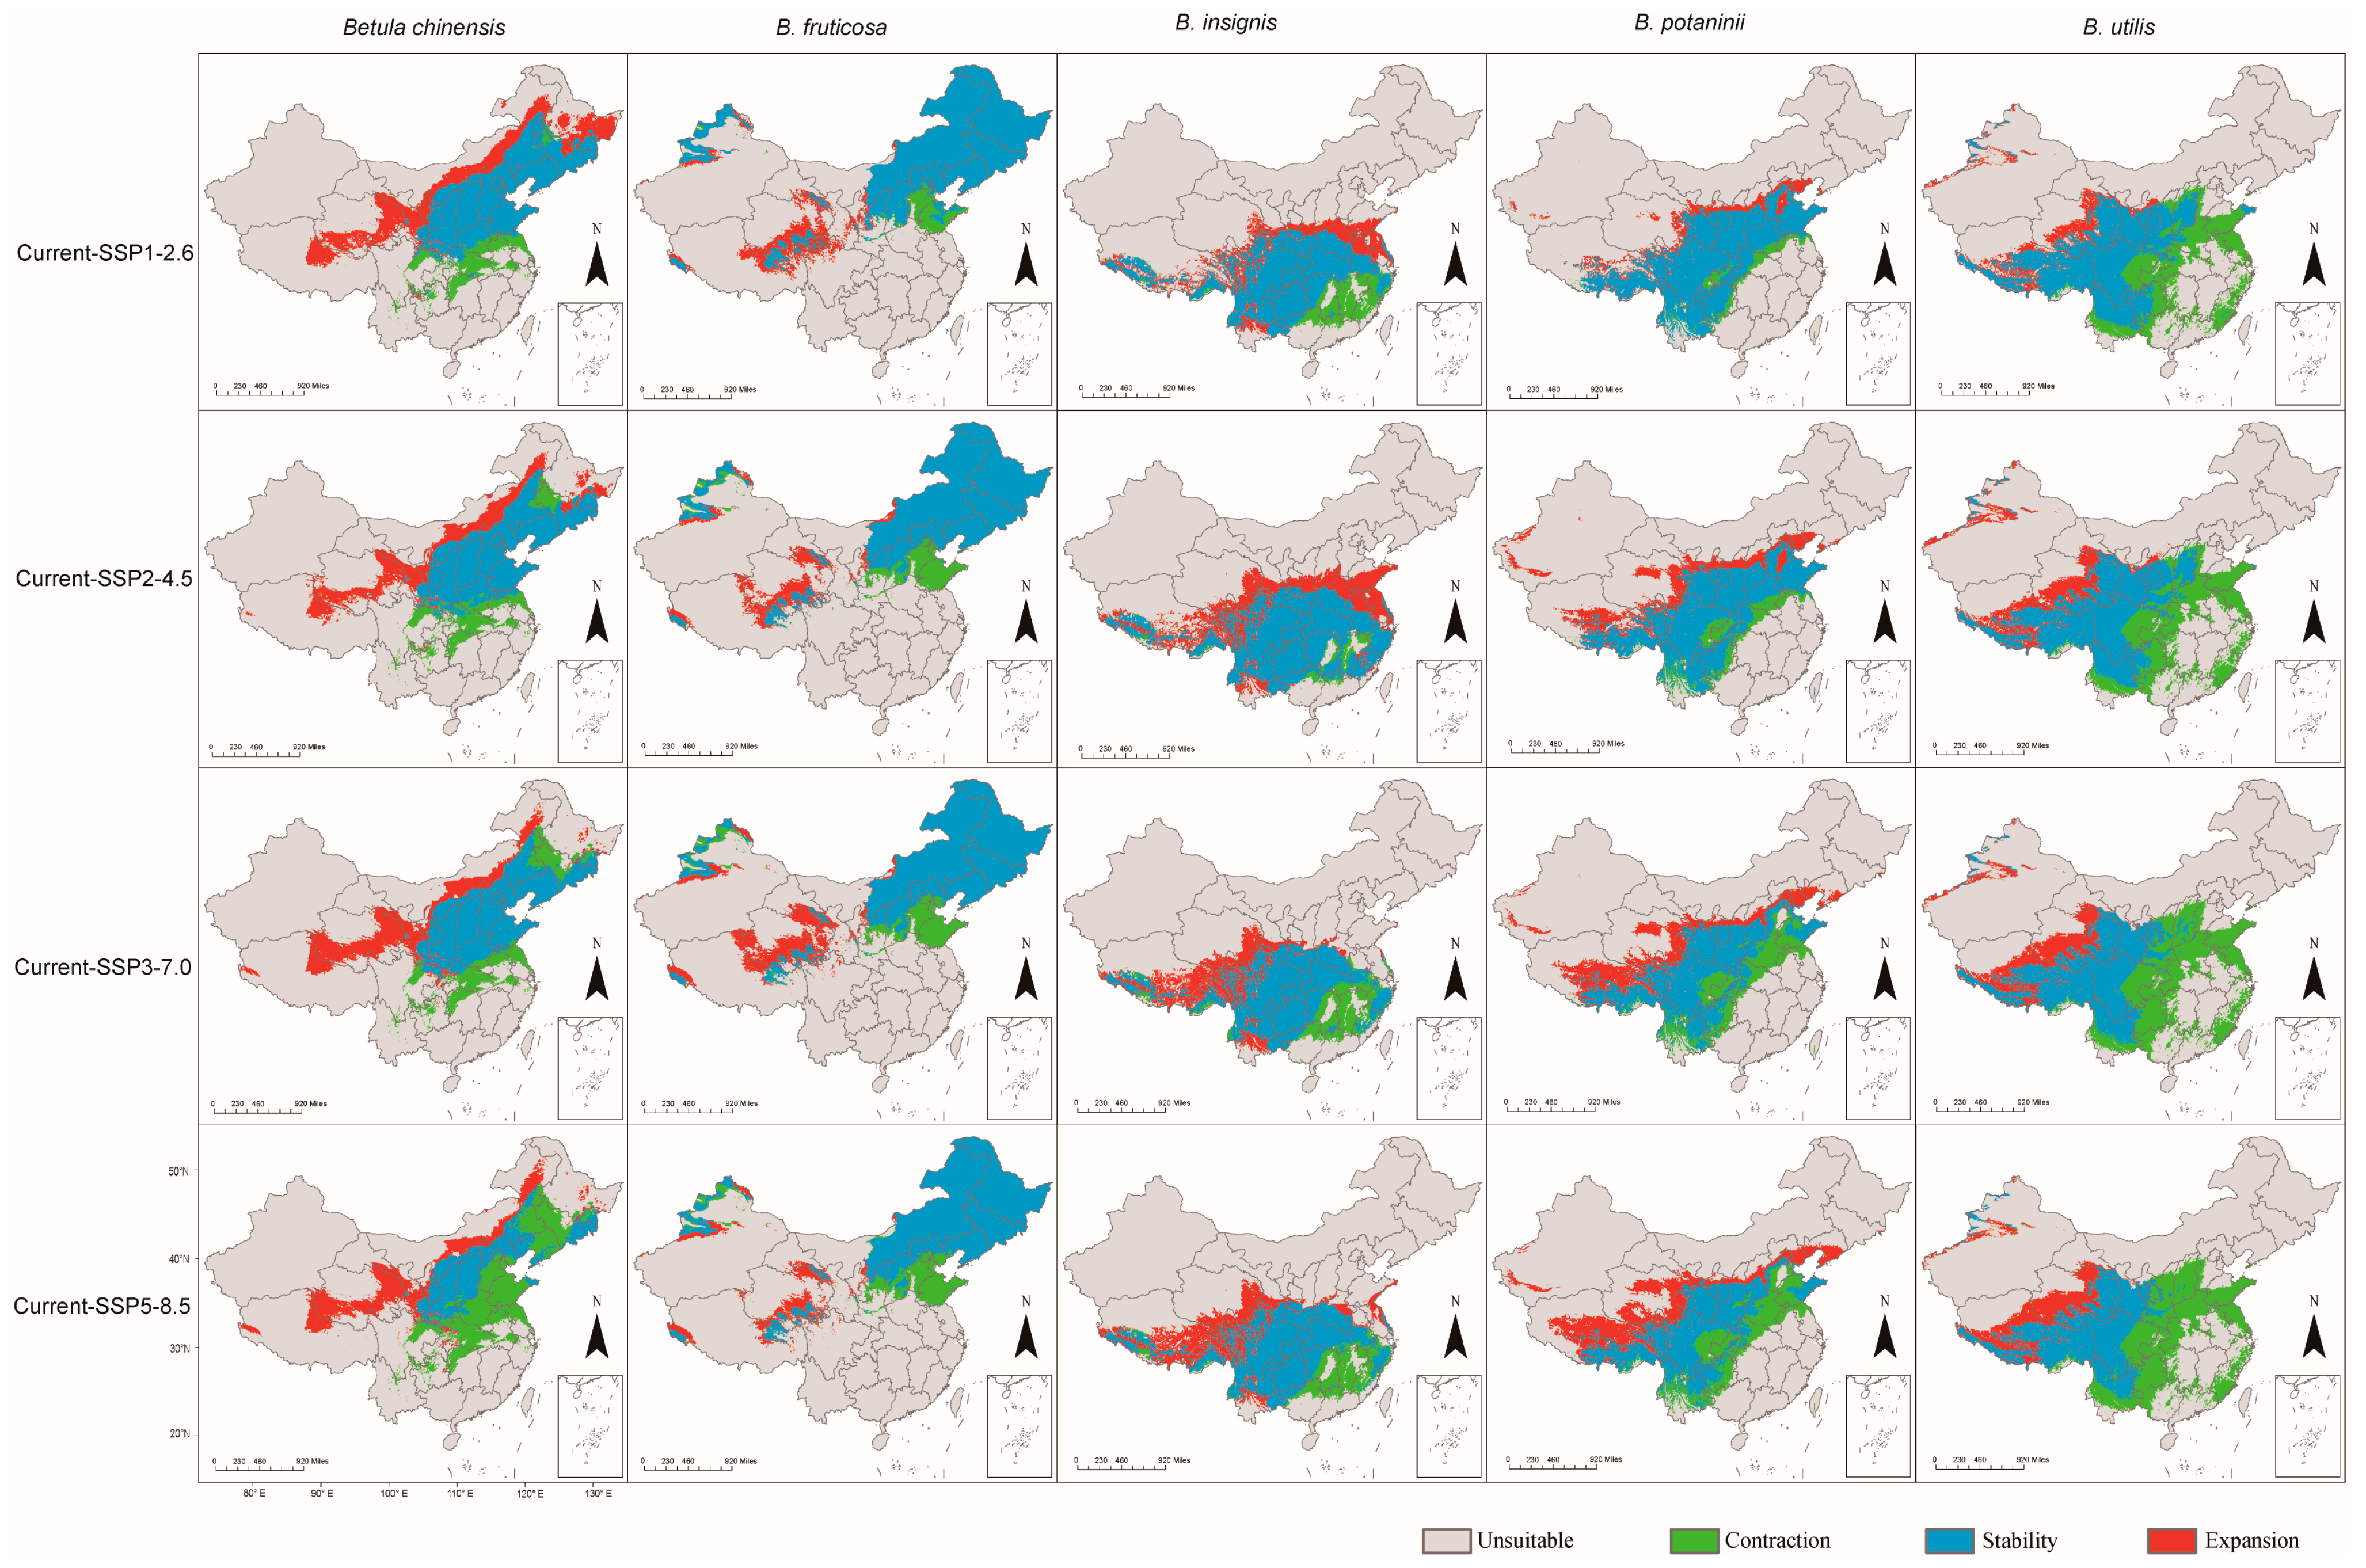
3.3. The Expansion and Contraction of the Distribution Area of Betula Species
4. Discussion
4.1. Assessment of MaxEnt Model
4.2. Key Environmental Variables Influencing the Potential Distribution of Betula Species
4.3. Current and Future Potential Distribution Range of the Betula Species
4.4. The Future Prospects for Betula Species
4.5. Limitations of This Study
5. Conclusions
Supplementary Materials
Author Contributions
Funding
Data Availability Statement
Conflicts of Interest
References
- Mori, A.S.; Dee, L.E.; Gonzalez, A.; Ohashi, H.; Cowles, J.; Wright, A.J.; Loreau, M.; Hautier, Y.; Newbold, T.; Reich, P.B. Biodiversity–productivity relationships are key to nature-based climate solutions. Nat. Clim. Change 2021, 11, 543–550. [Google Scholar] [CrossRef]
- Folland, C.K.; Karl, T.R.; Christy, J.R.; Clarke, R.A.; Gruza, G.V.; Jouzel, J.; Mann, M.E.; Oerlemans, J.; Salinger, M.J.; Wang, S. Observed climate variability and change. In Climate Change 2001: The Scientific Basis; Houghton, J.T., Ding, Y., Griggs, D.J., Noguer, M., Dai, X., Maskell, K., Johnson, C.A., Eds.; Cambridge University Press: Cambridge, UK, 2001; p. 881. [Google Scholar]
- Stocker, T.F.; Qin, D.; Plattner, G.K.; Tignor, M.; Allen, S.K.; Boschung, J.; Nauels, A.; Xia, Y.; Bex, V.; Midgley, P.M. (Eds.) Climate Change 2013: The Physical Science Basis; Cambridge University Press: Cambridge, UK, 2014. [Google Scholar]
- Wiens, J.J.; Zelinka, J. How many species will earth lose to climate change? Glob. Change Biol. 2024, 30, e17125. [Google Scholar] [CrossRef]
- Butt, N.; Chauvenet, A.L.M.; Adams, V.M.; Beger, M.; Gallagher, R.V.; Shanahan, D.F.; Ward, M.; Watson, J.E.; Possingham, H.P. Importance of species translocations under rapid climate change. Conserv. Biol. 2021, 35, 775–783. [Google Scholar] [CrossRef]
- Randin, C.F.; Ashcroft, M.B.; Bolliger, J.; Cavender-Bares, J.; Coops, N.C.; Dullinger, S.; Dirnböck, T.; Eckert, S.; Ellis, E.; Fernández, N. Monitoring biodiversity in the Anthropocene using remote sensing in species distribution models. Remote Sens. Environ. 2020, 239, 111626. [Google Scholar] [CrossRef]
- Vitasse, Y.; Ursenbacher, S.; Klein, G.; Bohnenstengel, T.; Chittaro, Y.; Delestrade, A.; Monnerat, C.; Rebetez, M.; Rixen, C.; Strebel, N. Phenological and elevational shifts of plants, animals and fungi under climate change in the European Alps. Biol. Rev. 2021, 96, 1816–1835. [Google Scholar] [CrossRef] [PubMed]
- Ching, C.; Hill, J.K.; Ohlemüller, R.; Roy, D.B.; Thomas, C.D. Rapid range shifts of species associated with high levels of climate warming. Science 2011, 333, 1024–1026. [Google Scholar]
- He, X.; Burgess, K.S.; Gao, L.M.; Li, D. Distributional responses to climate change for alpine species of Cyananthus and Primula endemic to the Himalaya-Hengduan Mountains. Plant. Divers. 2019, 41, 26–32. [Google Scholar] [CrossRef] [PubMed]
- Khan, A.M.; Li, Q.; Saqib, Z.; Khan, N.; Habib, T.; Khalid, N.; Majeed, M.; Tariq, A. MaxEnt modelling and impact of climate change on habitat suitability variations of economically important Chilgoza Pine (Pinus gerardiana Wall.) in South Asia. Forests 2022, 13, 715. [Google Scholar] [CrossRef]
- Zhao, Z.; Yang, L.; Chen, X. Globally suitable areas for Lycorma delicatula based on an optimized Maxent model. Ecol. Evol. 2024, 14, e70252. [Google Scholar] [CrossRef] [PubMed]
- Park, I.K.; Borzée, A.; Park, J.; Min, S.H.; Zhang, Y.P.; Li, S.R.; Park, D. Past, present, and future predictions on the suitable habitat of the Slender racer (Orientocoluber spinalis) using species distribution models. Ecol. Evol. 2022, 12, e9169. [Google Scholar] [CrossRef]
- Wang, X.; Wang, X.; Li, Y.; Wu, C.; Zhao, B.; Peng, M.; Chen, W.; Wang, C. Response of extremely small populations to climate change—A case of Trachycarpus nanus in Yunnan, China. Biology 2024, 13, 240. [Google Scholar] [CrossRef] [PubMed]
- Merow, C.; Silander, J.A., Jr. A comparison of Maxlike and Maxent for modelling species distributions. Methods Ecol. Evol. 2014, 5, 215–225. [Google Scholar] [CrossRef]
- Wang, R.; Li, Q.; He, S.; Liu, Y.; Wang, M.; Jiang, G. Modeling and mapping the current and future distribution of Pseudomonas syringae pv. actinidiae under climate change in China. PLoS ONE 2018, 13, e0192153. [Google Scholar]
- Rathore, M.K.; Sharma, L.K. Efficacy of species distribution models (SDMs) for ecological realms to ascertain biological conservation and practices. Biodivers. Conserv. 2023, 32, 3053–3087. [Google Scholar] [CrossRef]
- Di Febbraro, M.; Martinoli, A.; Russo, D.; Preatoni, D.; Bertolino, S. Modelling the effects of climate change on the risk of invasion by alien squirrels. Hystrix 2016, 27, 1–8. [Google Scholar]
- Sinclair, S.J.; White, M.D.; Newell, G.R. How useful are species distribution models for managing biodiversity under future climates? Ecol. Soc. 2010, 15, 8. [Google Scholar] [CrossRef]
- Ito, H.; Hayakawa, K.; Ooba, M.; Fujii, T. Analysis of habitat area for endangered species using maxent by urbanization in Chiba, Japan. Geomate J. 2020, 18, 94–100. [Google Scholar] [CrossRef]
- Park, J.U.; Lee, T.; Kim, D.G.; Shin, S. Prediction of potential habitats and distribution of the marine invasive sea squirt, Herdmania momus. Korean J. Environ. Biol. 2020, 38, 179–188. [Google Scholar] [CrossRef]
- Wang, A.; Melton, A.E.; Soltis, D.E.; Soltis, P.S. Potential distributional shifts in North America of allelopathic invasive plant species under climate change models. Plant Divers. 2022, 44, 11–19. [Google Scholar] [CrossRef] [PubMed]
- Merow, C.; Smith, M.J.; Silander, J.A., Jr. A practical guide to MaxEnt for modeling species’ distributions, what it does, and why inputs and settings matter. Ecography 2013, 36, 1058–1069. [Google Scholar] [CrossRef]
- Nair, R.R.; Peterson, A.T. Mapping the global distribution of invasive pest Drosophila suzukii and parasitoid Leptopilina japonica, implications for biological control. PeerJ 2023, 11, e15222. [Google Scholar] [CrossRef]
- Zhou, Y.; Tao, J.; Yang, J.; Zong, S.; Ge, X. Niche shifts and range expansions after invasions of two major pests, the Asian longhorned beetle and the citrus longhorned beetle. Pest. Manag. Sci. 2023, 79, 3149–3158. [Google Scholar] [CrossRef] [PubMed]
- Phillips, S.J.; Anderson, R.P.; Schapire, R.E. Maximum entropy modeling of species geographic distributions. Ecol. Model. 2006, 190, 231–259. [Google Scholar] [CrossRef]
- Campos, J.C.; Garcia, N.; Alírio, J.; Arenas-Castro, S.; Teodoro, A.C.; Sillero, N. Ecological niche models using MaxEnt in Google Earth Engine: Evaluation, guidelines and recommendations. Ecol. Inf. 2023, 76, 102147. [Google Scholar] [CrossRef]
- Feng, X.; Park, D.S.; Liang, Y.; Pandey, R.; Papeş, M. Collinearity in ecological niche modeling: Confusions and challenges. Ecol. Evol. 2019, 9, 10365–10376. [Google Scholar] [CrossRef] [PubMed]
- Elith, J.; Graham, C.H.; Anderson, R.P.; Dudík, M.; Ferrier, S.; Guisan, A.; Williams, S. Novel methods improve prediction of species’ distributions from occurrence data. Ecography 2006, 29, 129–151. [Google Scholar] [CrossRef]
- Scarnati, L.; Attorre, F.; Farcomeni, A.; Francesconi, F.; De Sanctis, M. Modelling the spatial distribution of tree species with fragmented populations from abundance data. Commun. Ecol. 2009, 10, 215–224. [Google Scholar] [CrossRef]
- Ma, C.S.; Zhang, W.; Peng, Y.; Zhao, F.; Chang, X.; Xing, K.; Zhu, L.; Ma, G.; Yang, H.; Rudolf, V.H. Climate warming promotes pesticide resistance through expanding overwintering range of a global pest. Nat. Commun. 2021, 12, 5351. [Google Scholar] [CrossRef]
- Zhiduan, C. Phylogeny and phytogeography of the Betulaceae (Cont.). J. Syst. Evol. 1994, 32, 101–153. [Google Scholar]
- Ashburner, K.; McAllister, H. The genus Betula: A taxonomic revision of birches. In Botanical Magazine Monograph; Royal Botanic Gardens: Melbourne, Australia, 2013. [Google Scholar]
- Du, X.; Dong, X.; Zheng, Y.; Dong, L.; Chen, B.W. Several important Betula Linn. biomes climatic ecological niches and potential distribution areas. J. Arid. Land. Resour. Environ. China 2019, 33, 177–185. [Google Scholar]
- Wenbin, G. Vegetation ecology on communities dominated by Betula platyphylla in northeast of China-Distribution of Communities dominated by Betula platyphylla. J. Beijing For. Univ. 1998, 20, 104–109. [Google Scholar]
- Xing, W.; Gai, X.; Xue, L.; Li, S.; Zhang, X.; Ju, F.; Chen, G. Enriched rhizospheric functional microbiome may enhance adaptability of Artemisia lavandulaefolia and Betula luminifera in antimony mining areas. Front. Microbiol. 2024, 15, 1348054. [Google Scholar] [CrossRef] [PubMed]
- Praciak, A.; Pasiecznik, N.; Sheil, D.; Van Heist, M.; Sassen, M.; Correia, C.S.; Dixon, C.; Fyson, G.; Rushford, K.; Teeling, C. The CABI Encyclopedia of Forest Trees; CABI: Wallingford, UK, 2013; ISBN 978178064236. [Google Scholar]
- Mukhtar, H.M.; Ansari, S.H.; Ali, M.; Naved, T. New oleanene and fernane-type triterpenes from the stem bark of Betula pendula roth. Die Pharm. 2003, 58, 671–673. [Google Scholar] [CrossRef]
- Shaw, K.; Stritch, L.; Rivers, M.; Roy, S.; Wilson, B.; Govaerts, R. Betulaceae; Botanic Gardens Conservation International: Richmond, UK, 2014. [Google Scholar]
- LI, Y.; GONG, T.; CHEN, J.; Chen, T.; Yang, J.; Zhu, P. Research progress on triterpenoids of Betula plants. Acta Pharm. Sin. 2023, 1211–1220. [Google Scholar]
- Niinemets, Ü.; Portsmuth, A.; Truus, L. Leaf structural and photosynthetic characteristics, and biomass allocation to foliage in relation to foliar nitrogen content and tree size in three Betula species. Ann. Bot. 2002, 89, 191–204. [Google Scholar] [CrossRef] [PubMed]
- Yang, Q.; Xiang, Y.; Li, S.; Zhao, L.; Liu, Y.; Luo, Y.; Long, Y.; Yang, S.; Luo, X. Modeling the impacts of climate change on potential distribution of Betula luminifera H. Winkler in China using MaxEnt. Forests 2024, 15, 1624. [Google Scholar] [CrossRef]
- Xu, Y.; Zheng, Z.W.; Meng, Y.C.; Pan, Y.; Guo, Z.; Zhang, Y. Spatio-temporal variation in net primary productivity of different vegetation types and its influencing factors exploration in Southwest China. Huan Jing Ke Xue 2024, 45, 262–274. [Google Scholar]
- Dai, E.; Wang, Y. Identifying driving factors of ecosystem service trade-offs in mountainous region of southwestern China across geomorphic and climatic types. Ecol. Indic. 2024, 158, 111520. [Google Scholar] [CrossRef]
- Jiang, Y.; Cao, Y.; Zhang, J.; Li, Z.; Shi, G.; Han, S.; Coombs, C.E.; Liu, C.; Wang, X.; Wang, J. A 168-year temperature recording based on tree rings and latitude differences in temperature changes in northeast China. Int. J. Biometeor 2021, 65, 1859–1870. [Google Scholar] [CrossRef] [PubMed]
- Stockwell, D.R.; Peterson, A.T. Effects of sample size on accuracy of species distribution models. Ecol. Model. 2002, 148, 1–13. [Google Scholar] [CrossRef]
- Aiello-Lammens, M.E.; Boria, R.A.; Radosavljevic, A.; Vilela, B.; Anderson, R.P. spThin, an R package for spatial thinning of species occurrence records for use in ecological niche models. Ecography 2015, 38, 541–545. [Google Scholar] [CrossRef]
- Fick, S.E.; Hijmans, R.J. WorldClim 2, new 1-km spatial resolution climate surfaces for global land areas. Int. J. Clim. 2017, 37, 4302–4315. [Google Scholar] [CrossRef]
- Graham, M.H. Confronting multicollinearity in ecological multiple regression. Ecology 2003, 84, 2809–2815. [Google Scholar] [CrossRef]
- Radosavljevic, A.; Anderson, R.P. Making better Maxent models of species distributions, complexity, overfitting and evaluation. J. Biogeogr. 2014, 41, 629–643. [Google Scholar] [CrossRef]
- Muscarella, R.; Galante, P.J.; Soley-Guardia, M.; Boria, R.A.; Kass, J.M.; Uriarte, M.; Anderson, R.P. ENMeval, An R package for conducting spatially independent evaluations and estimating optimal model complexity for Maxent ecological niche models. Methods Ecol. Evol. 2014, 5, 1198–1205. [Google Scholar] [CrossRef]
- Yang, J.; Huang, Y.; Jiang, X.; Chen, H.; Liu, M.; Wang, R. Potential geographical distribution of the edangred plant Isoetes under human activities using MaxEnt and GARP. Glob. Ecol. Conserv. 2022, 38, e02186. [Google Scholar] [CrossRef]
- Zhao, Y.; Deng, X.; Xiang, W.; Chen, L.; Ouyang, S. Predicting potential suitable habitats of Chinese fir under current and future climatic scenarios based on Maxent model. Ecol. Inform. 2021, 64, 101393. [Google Scholar] [CrossRef]
- Elith, J.; Phillips, S.J.; Hastie, T.; Dudík, M.; Chee, Y.E.; Yates, C.J. A statistical explanation of MaxEnt for ecologists. Divers. Distrib. 2011, 17, 43–57. [Google Scholar] [CrossRef]
- Phillips, S.J.; Dudík, M. Modeling of species distributions with Maxent, new extensions and a comprehensive evaluation. Ecography 2008, 31, 161–175. [Google Scholar] [CrossRef]
- Liang, Q.; Xu, X.; Mao, K.; Wang, M.; Wang, K.; Xi, Z.; Liu, J. Shifts in plant distributions in response to climate warming in a biodiversity hotspot, the Hengduan Mountains. J. Biogeogr. 2018, 45, 1334–1344. [Google Scholar] [CrossRef]
- Hosni, E.M.; Nasser, M.G.; Al-Ashaal, S.A.; Rady, M.H.; Kenawy, M.A. Modeling current and future global distribution of Chrysomya bezziana under changing climate. Sci. Rep. 2020, 10, 4947. [Google Scholar] [CrossRef]
- Kong, F.; Tang, L.; He, H.; Yang, F.; Tao, J.; Wang, W. Assessing the impact of climate change on the distribution of Osmanthus fragrans using Maxent. Environ. Sci. Pollut. 2021, 28, 34655–34663. [Google Scholar] [CrossRef]
- Liu, L.; Guan, L.; Zhao, H.; Huang, Y.; Mou, Q.; Liu, K.; Chen, T.; Wang, X.; Zhang, Y.; Wei, B. Modeling habitat suitability of Houttuynia cordata Thunb (Ceercao) using MaxEnt under climate change in China. Ecol. Inf. 2021, 63, 101324. [Google Scholar] [CrossRef]
- Sun, J.; Feng, L.; Wang, T.; Tian, X.; He, X.; Xia, H.; Wang, W. Predicting the potential habitat of three endangered species of Carpinus genus under climate change and human activity. Forests 2021, 12, 1216. [Google Scholar] [CrossRef]
- Du, Z.; He, Y.; Wang, H.; Wang, C.; Duan, Y. Potential geographical distribution and habitat shift of the genus Ammopiptanthus in China under current and future climate change based on the MaxEnt model. J. Arid. Environ. 2021, 184, 104328. [Google Scholar] [CrossRef]
- Geng, W.; Li, Y.; Sun, D.; Li, B.; Zhang, P.; Chang, H.; Rong, T.; Liu, Y.; Shao, J.; Liu, Z. Prediction of the potential geographical distribution of Betula platyphylla Suk. in China under climate change scenarios. PLoS ONE 2022, 17, e0262540. [Google Scholar] [CrossRef] [PubMed]
- Gao, X.; Liu, J.; Huang, Z. The impact of climate change on the distribution of rare and endangered tree Firmiana kwangsiensis using the Maxent modeling. Ecol. Evol. 2022, 12, e9165. [Google Scholar] [CrossRef] [PubMed]
- Xu, C.; Zhang, L.; Zhang, K.; Tao, J. MaxEnt modeling and the impact of climate change on Pistacia chinensis Bunge habitat suitability variations in China. Forests 2023, 14, 1579. [Google Scholar] [CrossRef]
- Beaumont, L.J.; Hughes, L.; Poulsen, M. Predicting species distributions, use of climatic parameters in bioclim and its impact on predictions of species’ current and future distributions. Ecol. Model. 2005, 186, 251–270. [Google Scholar] [CrossRef]
- Zhang, L.; Yang, H.; Wang, Y.; Zhuang, H.; Chen, W.; Lin, Z.; Xu, J.; Wang, Y. Blue footprint, distribution and use of indigo-yielding plant species Strobilanthes cusia (Nees) Kuntze. Glob. Ecol. Conserv. 2021, 30, e01795. [Google Scholar] [CrossRef]
- Layola, M.R.R.; Semwal, M.; Rana, T.S.; Nair, N.K. Predicting potential suitable habitat for Ensete glaucum (Roxb.) Cheesman using MaxEnt modelling. Flora 2022, 287, 152007. [Google Scholar] [CrossRef]
- Punyasena, S.W.; Eshel, G.; McElwain, J.C. The influence of climate on the spatial patterning of Neotropical plant families. J. Biogeog 2008, 35, 117–130. [Google Scholar] [CrossRef]
- Costa, M.C.D.; Artur, M.A.S.; Maia, J.; Jonkheer, E.; Derks, M.F.; Nijveen, H.; Williams, B.; Mundree, S.G.; Jiménez-Gómez, J.M.; Hesselink, T. A footprint of desiccation tolerance in the genome of Xerophyta viscosa. Nat. Plants 2017, 3, 17038. [Google Scholar] [CrossRef] [PubMed]
- Radermacher, A.L.; Toit, S.F.; Farrant, J.M. Desiccation-driven senescence in the resurrection plant Xerophyta schlechteri (Baker) NL Menezes: Comparison of anatomical, ultrastructural, and metabolic responses between senescent and non-senescent tissues. Front. Plant Sci. 2019, 10, 1396. [Google Scholar] [CrossRef]
- Feng, L.; Sun, J.; El-Kassaby, Y.A.; Yang, X.; Tian, X.; Wang, T. Predicting potential habitat of a plant species with small populations under climate change, Ostrya rehderiana. Forests 2022, 13, 129. [Google Scholar] [CrossRef]
- Duan, X.; Li, J.; Wu, S. MaxEnt modeling to estimate the impact of climate factors on distribution of Pinus densiflora. Forests 2022, 13, 402. [Google Scholar] [CrossRef]
- Yang, J.; Huang, Y.; Su, M.; Liu, M.; Yang, J.; Wu, Q. Spatial distribution patterns of the key afforestation species Cupressus funebris, Insights from an ensemble model under climate change scenarios. Forests 2024, 15, 1280. [Google Scholar] [CrossRef]
- Poudel, R.C.; Möller, M.; Liu, J.; Gao, L.M.; Baral, S.R.; Li, D.Z. Low genetic diversity and high inbreeding of the endangered yews in Central Himalaya, implications for conservation of their highly fragmented populations. Divers. Distrib. 2014, 20, 1270–1284. [Google Scholar] [CrossRef]
- He, S.L.; Wang, Y.S.; Li, D.Z.; Yi, T. Environmental and historical determinants of patterns of genetic differentiation in wild soybean (Glycine soja Sieb. et Zucc). Sci. Rep. 2016, 6, 22795. [Google Scholar] [CrossRef] [PubMed]
- Elsen, P.R.; Tingley, M.W. Global mountain topography and the fate of montane species under climate change. Nat. Clim. Change 2015, 5, 772–776. [Google Scholar] [CrossRef]
- You, J.; Qin, X.; Ranjitkar, S.; Lougheed, S.C.; Wang, M.; Zhou, W.; Ouyang, D.; Zhou, Y.; Xu, J.; Zhang, W. Response to climate change of montane herbaceous plants in the genus Rhodiola predicted by ecological niche modelling. Sci. Rep. 2018, 8, 5879. [Google Scholar] [CrossRef] [PubMed]

| Species | Distribution Points | Parameter | AUC (SD) | TSS (SD) | |
|---|---|---|---|---|---|
| FC | RM | ||||
| B. chinensis | 120 | LQHPT | 2 | 0.936 (0.011) | 0.912 (0.036) |
| B. fruticosa | 40 | LQHPT | 2 | 0.930 (0.011) | 0.930 (0.011) |
| B. insignis | 55 | LQ | 1 | 0.948 (0.015) | 0.924 (0.046) |
| B. potaninii | 41 | LQ | 2 | 0.948 (0.017) | 0.943 (0.035) |
| B. utilis | 216 | LQHPT | 3 | 0.916 (0.011) | 0.903 (0.025) |
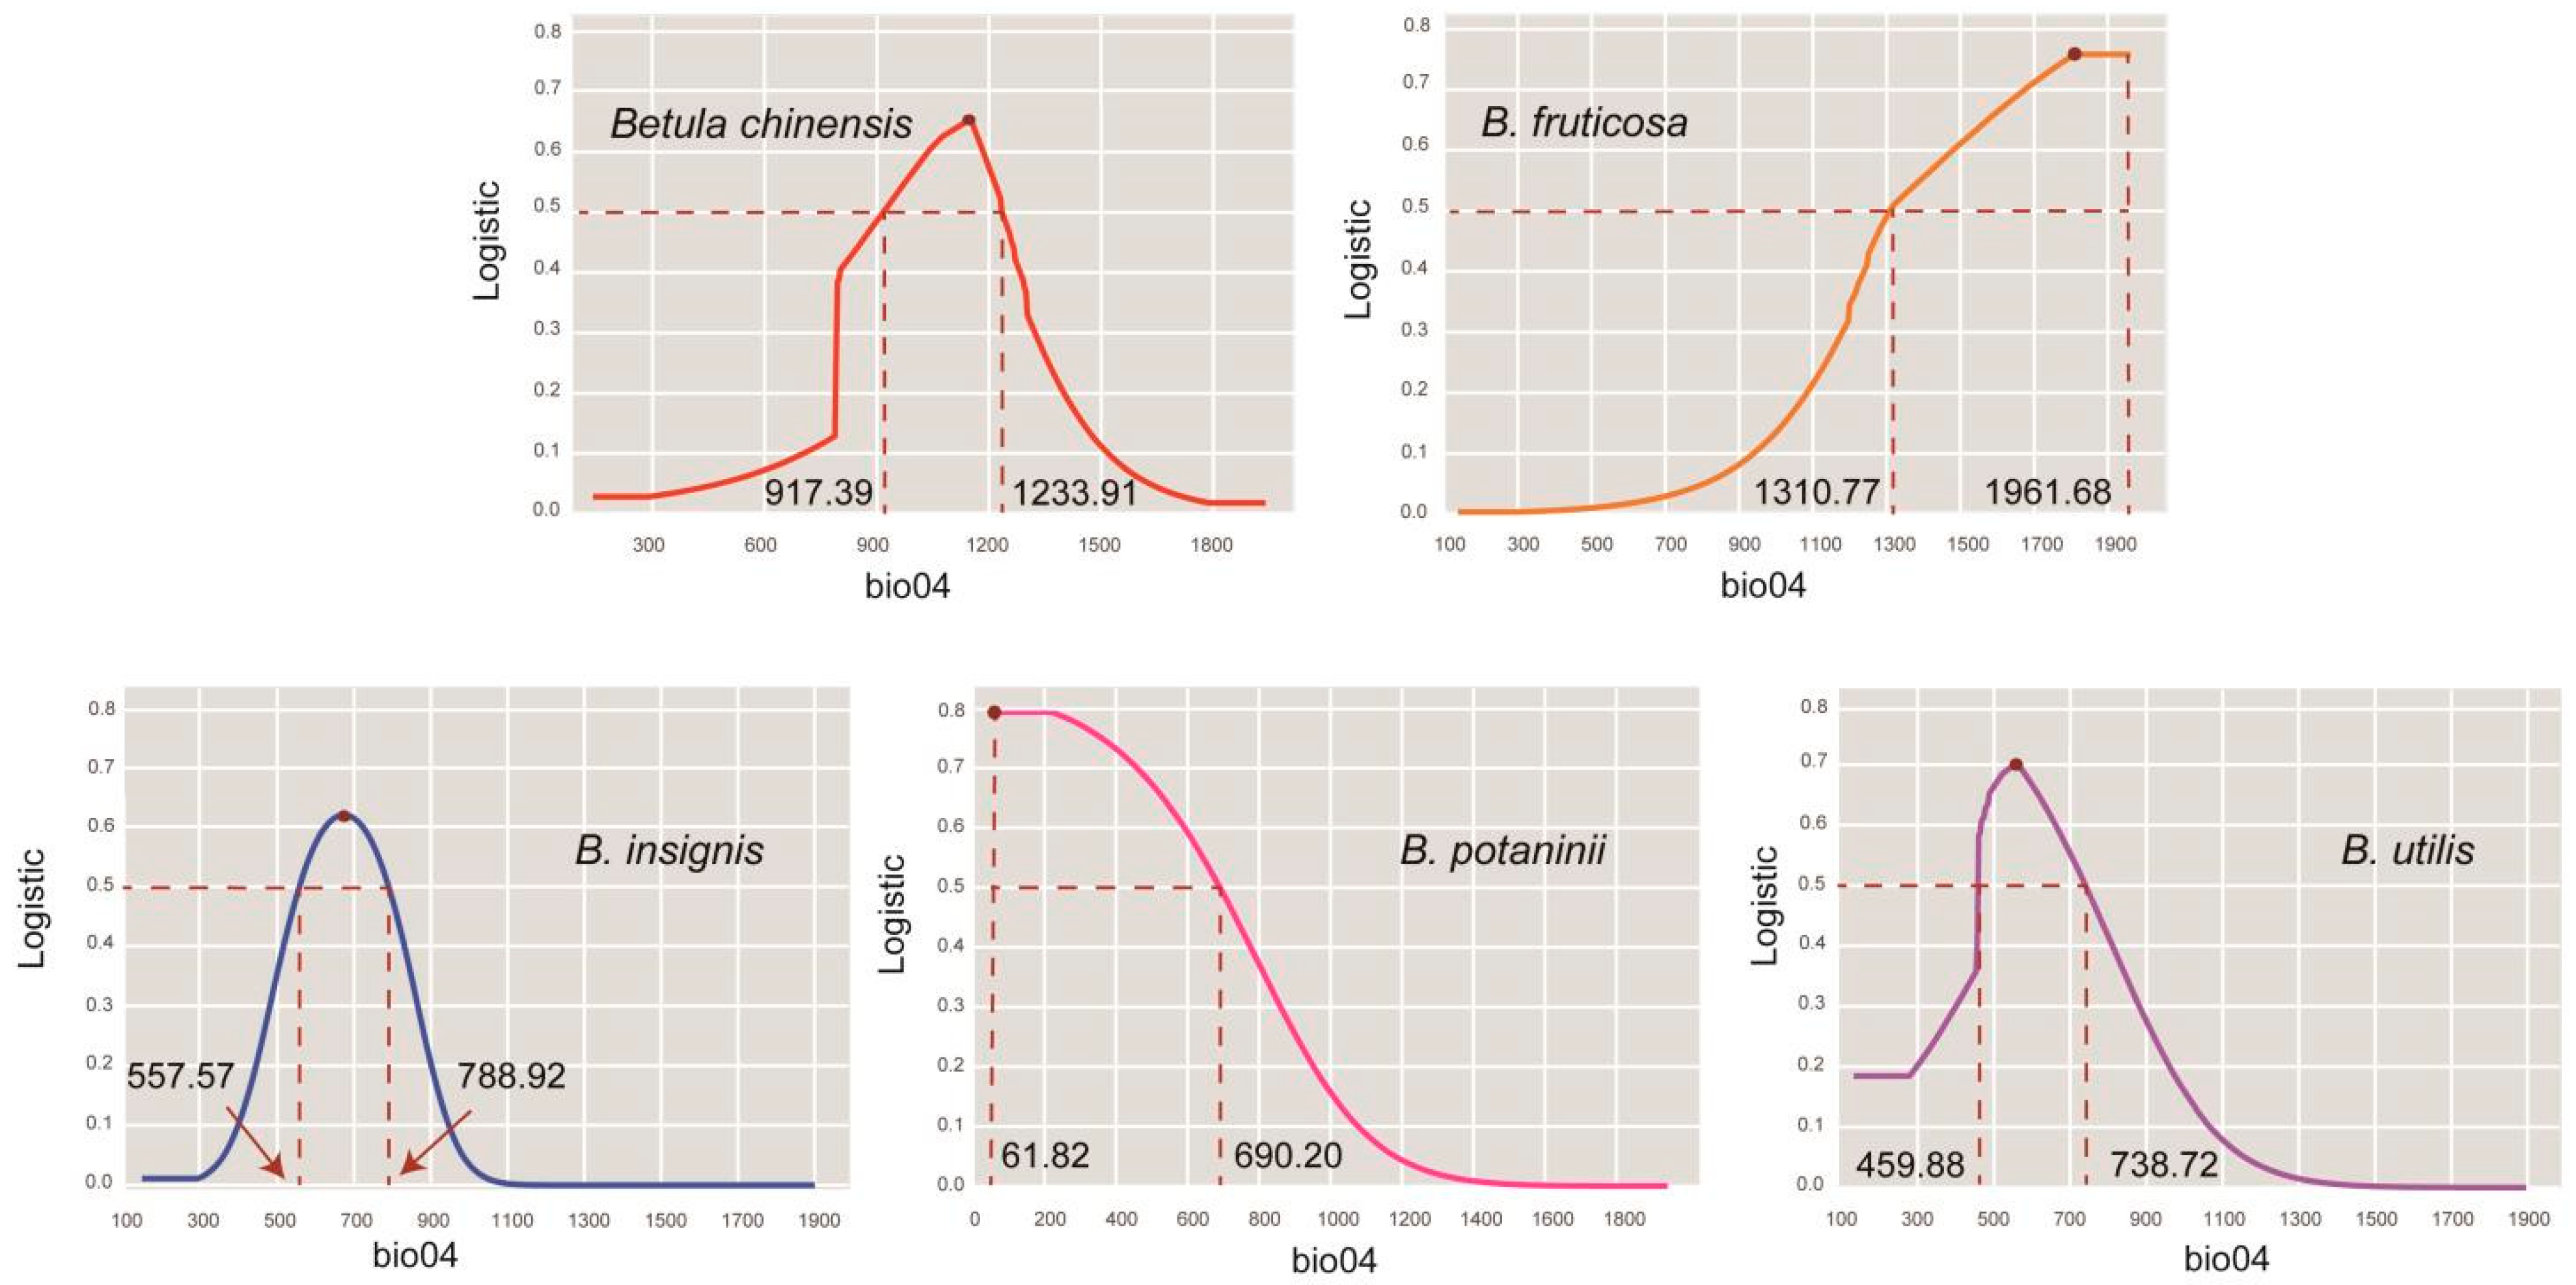
| Species | Variable | Percent Contribution | Logistic > 0.5 | Logistic Max | VIF |
|---|---|---|---|---|---|
| B. chinensis | bio13 | 32.3 | 121.16–198.73 | 152.67 | 1.89 |
| bio04 | 31.2 | 917.39–1233.91 | 1147.59 | 2.62 | |
| bio03 | 12.6 | 27.80–31.63 | 28.82 | 1.80 | |
| bio19 | 12 | 7.71–50.81 | 29.78 | 3.11 | |
| bio08 | 11.9 | 21.08–25.57 | 23.18 | 1.09 | |
| B. fruticosa | bio04 | 57.8 | 1310.77–1961.68 | 1812.17 | 3.12 |
| bio18 | 33.9 | 261.78–430.86 | 314 | 2.12 | |
| bio01 | 4.7 | −2.10–5.92 | 2.61 | 2.85 | |
| bio17 | 3.7 | 8.86–34.60 | 18.82 | 1.76 | |
| B. insignis | bio07 | 50.4 | 23.55–30.68 | 27.06 | 3.93 |
| bio09 | 27.5 | 1.70–9.29 | 5.49 | 3.88 | |
| bio04 | 10 | 557.57–788.92 | 673.24 | 3.32 | |
| bio12 | 7.5 | 891.48–1530.56 | 1211.02 | 3.78 | |
| bio19 | 4.6 | 39.18–169.88 | 104.09 | 3.34 | |
| B. potaninii | bio04 | 48.3 | 61.82–690.20 | 61.82 | 1.02 |
| bio11 | 40.7 | −3.87–6.27 | 1.20 | 2.21 | |
| bio19 | 10.4 | 0–76.17 | 36.16 | 2.78 | |
| bio12 | 0.5 | 592.58–1538.10 | 1060.36 | 2.80 | |
| B. utilis | bio04 | 45.5 | 459.88–738.72 | 558.71 | 1.83 |
| bio12 | 26.2 | 544.41–1162.35 | 664.85 | 2.31 | |
| bio10 | 24.7 | 8.17–18.92 | 11.13 | 2.21 | |
| bio15 | 3.7 | 60.29–96.99 | 91.81 | 1.17 |
| Species | Period | High | Medium | Low | Total |
|---|---|---|---|---|---|
| B. chinensis | current | 6.99% | 4.47% | 10.35% | 21.82% |
| SSP1-2.6 | 7.82% | 4.50% | 15.71% | 28.03% | |
| SSP2-4.5 | 6.21% | 4.31% | 14.31% | 24.84% | |
| SSP3-7.0 | 3.43% | 4.83% | 16.40% | 24.65% | |
| SSP5-8.5 | 2.00% | 3.51% | 12.05% | 17.57% | |
| B. fruticosa | current | 11.03% | 6.00% | 12.06% | 29.09% |
| SSP1-2.6 | 11.10% | 6.40% | 14.40% | 31.89% | |
| SSP2-4.5 | 11.01% | 6.33% | 11.95% | 29.29% | |
| SSP3-7.0 | 8.29% | 7.12% | 15.41% | 30.82% | |
| SSP5-8.5 | 7.30% | 6.93% | 13.75% | 27.97% | |
| B. insignis | current | 5.88% | 4.21% | 12.13% | 22.23% |
| SSP1-2.6 | 10.48% | 4.50% | 9.59% | 24.57% | |
| SSP2-4.5 | 13.41% | 6.42% | 11.49% | 31.32% | |
| SSP3-7.0 | 13.61% | 3.46% | 7.78% | 24.85% | |
| SSP5-8.5 | 14.04% | 3.71% | 8.20% | 25.95% | |
| B. potaninii | current | 4.36% | 5.50% | 13.30% | 23.16% |
| SSP1-2.6 | 5.21% | 5.08% | 14.22% | 24.51% | |
| SSP2-4.5 | 6.03% | 4.61% | 15.65% | 26.29% | |
| SSP3-7.0 | 6.99% | 4.05% | 13.16% | 24.21% | |
| SSP5-8.5 | 6.91% | 4.13% | 13.54% | 24.59% | |
| B. utilis | current | 7.11% | 9.21% | 16.19% | 32.51% |
| SSP1-2.6 | 5.39% | 7.10% | 11.89% | 24.38% | |
| SSP2-4.5 | 6.99% | 7.60% | 10.66% | 25.26% | |
| SSP3-7.0 | 8.01% | 7.09% | 7.98% | 23.08% | |
| SSP5-8.5 | 8.81% | 6.60% | 6.73% | 22.14% |
| Species | Period | Contraction | Expansion |
|---|---|---|---|
| B. chinensis | Current-SSP1-2.6 | 20.90% | 49.43% |
| Current-SSP2-4.5 | 25.04% | 38.94% | |
| Current-SSP3-7.0 | 28.20% | 41.26% | |
| Current-SSP5-8.5 | 58.64% | 39.16% | |
| B. fruticosa | Current-SSP1-2.6 | 8.03% | 17.66% |
| Current-SSP2-4.5 | 14.41% | 15.11% | |
| Current-SSP3-7.0 | 15.71% | 21.66% | |
| Current-SSP5-8.5 | 16.97% | 13.09% | |
| B. insignis | Current-SSP1-2.6 | 19.17% | 29.76% |
| Current-SSP2-4.5 | 6.71% | 47.66% | |
| Current-SSP3-7.0 | 22.35% | 34.19% | |
| Current-SSP5-8.5 | 21.73% | 38.49% | |
| B. potaninii | Current-SSP1-2.6 | 9.91% | 15.70% |
| Current-SSP2-4.5 | 16.42% | 16.42% | |
| Current-SSP3-7.0 | 30.62% | 35.06% | |
| Current-SSP5-8.5 | 35.63% | 41.74% | |
| B. utilis | Current-SSP1-2.6 | 38.06% | 13.03% |
| Current-SSP2-4.5 | 41.12% | 18.81% | |
| Current-SSP3-7.0 | 48.59% | 19.57% | |
| Current-SSP5-8.5 | 52.21% | 20.30% |
Disclaimer/Publisher’s Note: The statements, opinions and data contained in all publications are solely those of the individual author(s) and contributor(s) and not of MDPI and/or the editor(s). MDPI and/or the editor(s) disclaim responsibility for any injury to people or property resulting from any ideas, methods, instructions or products referred to in the content. |
© 2025 by the authors. Licensee MDPI, Basel, Switzerland. This article is an open access article distributed under the terms and conditions of the Creative Commons Attribution (CC BY) license (https://creativecommons.org/licenses/by/4.0/).
Share and Cite
Huang, Z.; Fu, C.; Li, C.; Yang, X.; Shuai, B.; Li, M.; Wang, Z.; Yang, X. Distributional Responses of Five Betula (Betulaceae) Species to Future Climate Change in China. Forests 2025, 16, 400. https://doi.org/10.3390/f16030400
Huang Z, Fu C, Li C, Yang X, Shuai B, Li M, Wang Z, Yang X. Distributional Responses of Five Betula (Betulaceae) Species to Future Climate Change in China. Forests. 2025; 16(3):400. https://doi.org/10.3390/f16030400
Chicago/Turabian StyleHuang, Zhilong, Chenlong Fu, Chenyang Li, Xinle Yang, Binyu Shuai, Meng Li, Zefu Wang, and Xiaoyue Yang. 2025. "Distributional Responses of Five Betula (Betulaceae) Species to Future Climate Change in China" Forests 16, no. 3: 400. https://doi.org/10.3390/f16030400
APA StyleHuang, Z., Fu, C., Li, C., Yang, X., Shuai, B., Li, M., Wang, Z., & Yang, X. (2025). Distributional Responses of Five Betula (Betulaceae) Species to Future Climate Change in China. Forests, 16(3), 400. https://doi.org/10.3390/f16030400