Article

Harnessing Backpack Lidar Technology: A Novel Approach to Monitoring Moso Bamboo Shoot Growth

1
Key Laboratory of Carbon Sequestration and Emission Reduction in Agriculture and Forestry of Zhejiang Province, Zhejiang A&F University, Hangzhou 311300, China
2
School of Environmental and Resources Science, Zhejiang A&F University, Hangzhou 311300, China
3
Faculty of Forestry, University of British Columbia, 2424 Main Mall, Vancouver, BC V6T 1Z4, Canada
*
Author to whom correspondence should be addressed.
Forests 2025, 16(2), 371; https://doi.org/10.3390/f16020371
Submission received: 5 January 2025 / Revised: 3 February 2025 / Accepted: 6 February 2025 / Published: 19 February 2025

Abstract

:
Bamboo, characterized by its high growth speed and short maturation period, occupies 0.875% of the global forest area and significantly contributes to terrestrial carbon cycling. The state of shoot growth can essentially indicate a bamboo forests’ health and productivity. This study explored the potential of backpack laser scanning (BLS) for monitoring the growth of Moso bamboo shoots (Phyllostachys edulis), a key economic species in subtropical China. Initially, the accuracy of BLS in extracting attributes of bamboo and shoots (including diameter at breast height (DBH), height, and real-world coordinates) was validated. An optimized method was developed to address the lower precision of BLS in extracting the DBH for thinner species. Subsequently, this research analyzed the impact of spatial structure and other indicators on shoot emergence stage and growth rate using a random forest model. The results indicate that BLS can accurately extract Moso bamboo and shoot height (RMSE = 0.748 m) even in dense bamboo forests. After optimization, the error in DBH extraction significantly decreased (RMSE = 0.835 cm), with the average planar and elevation errors for Moso bamboo being 0.227 m and 0.132 m, respectively. The main indicators affecting the coordinate error of Moso bamboo were the distance to the start (DS) and the distance to the trajectory (DT). The emergence time of shoots was mainly influenced by the surrounding Moso bamboo quantity, with the leaf area index (LAI) and competition index (CI) positively related to the growth rate of shoots. The importance ranking of spatial structure for the carbon storage of shoots was similar to that of the growth rate of shoots, with both identifying LAI as the most significant indicator. This study has validated the value of BLS in monitoring the growth of shoots, providing a theoretical support for the sustainable management and conservation of bamboo forests.

1. Introduction

Forests, the largest carbon pools in terrestrial ecosystems, obviously affect the climate through extensive CO2 exchange with the atmosphere [1]. Larger forest areas can effectively alleviate the adverse effects of extreme climate change on biodiversity [2,3]. Due to deforestation and natural disasters, an estimated 0.9–2.3 Gt C is lost annually [4]. Various countries have issued numerous environmental agreements in response to these challenges, and extensive research on global forest carbon stock has been conducted. An overall analysis of the existing distribution of forest carbon stock reveals the current potential distribution of global forest carbon stock [5]. For instance, improving current forest management methods could provide approximately 146.26 Pg C for tropical forest ecosystems [6]. Among all types of forests, bamboo, as a unique forest type, occupies a large portion of global carbon stock due to its wide distribution and rapid stem growth rate [7,8,9]. In particular, the annual carbon stock of Moso bamboo (Phyllostachys edulis) can reach up to 5.10 Mg C ha−1, far exceeding the average estimated value for global forests, making it an efficient and effective carbon sink [10].
Moso bamboo is a kind of fastest-growing species globally, capable of growing 7.5–100 cm per day from emergence, meaning it requires only 2–3 months to reach maturity [11]. During the peak growth period of shoots, they can grow more than one meter daily, making monitoring their height dynamics challenging. The growth of shoots is a highly complex process, influenced by external environments, maternal bamboo characteristics, and cultivation methods [12]. Former research on the rapid growth of bamboo shoots has primarily concentrated on intrinsic growth mechanisms, such as leaf sheath senescence genes [13], cellular pathways [14], and nutrient content [15,16], aiming to elucidate the underlying mechanisms and patterns of this rapid growth phase. Furthermore, Yen (2016) measured the height of 30 bamboo shoots periodically and concluded that the Richards function accurately fits bamboo height changes (R2 = 0.982, RMSE = 0.278 m) [17]. Shen et al. (2020), based on the growth monitoring data of 80 shoots, found that the logistic function fits the growth curve with the highest accuracy (r = 0.969) [18]. However, these studies did not consider the influence of the spatial relationship between shoots and surrounding bamboo stems on shoot growth rate [19,20]. At the same time, the limited number of shoot samples monitored does not provide robust data, and more samples are needed to achieve more general statistical significance. This study aims to utilize a more efficient method for monitoring bamboo shoot growth to acquire high-frequency data on the height and location of individual shoots, thereby enabling an in-depth analysis of the dynamic growth process and its influencing factors.
Light detection and ranging (LiDAR) technology, offering detailed three-dimensional structural information of objects, can penetrate partial canopies, thereby acquiring additional data on understory vegetation and detecting subtle height and surface variations [21]. Current LiDAR data acquisition platforms include airborne, unmanned aerial vehicle, vehicle-based, terrestrial laser scanning (TLS), backpack laser scanning (BLS), and handheld systems [22]. Airborne LiDAR provides high accuracy and wide area coverage but is expensive and weather-dependent [23]. Unmanned aerial vehicle LiDAR offers a cost-effective alternative, but its limited flight time and susceptibility to dense canopies restrict data acquisition to only a limited number of points on bamboo stems and the ground [24]. While TLS LiDAR offers high measurement accuracy (up to 1 mm) and is frequently employed for estimating bamboo forest canopy structure [25] and biomass [26], its requirement for multiple measuring stations and target registrations to achieve complete mapping considerably limits its time efficiency [27]. Vehicle-based LiDAR is efficient for linear features but is limited by roads and unsuitable for the complex terrain of bamboo forests [28]. Handheld LiDAR is convenient for small-scale, detailed measurements but suffers from low efficiency and limited range [29]. Unlike TLS, BLS offers high maneuverability and improved temporal resolution, establishing it as a promising alternative [30]. This approach allows for faster acquisition of 3D forest point cloud data while simultaneously mitigating the challenges posed by tree occlusion [31], thus improving the accuracy of aboveground biomass and carbon stock estimations [32]. The integration of simultaneous localization and mapping (SLAM) technology, coupled with a Global Positioning System module and camera, provides accurate georeferencing and true color point cloud data, significantly enhancing the data’s utility. However, BLS data collection is continuously influenced by indicators such as terrain, BLS status, and the object being scanned, which may result in potential discrepancies in scale, plane, and elevation in the calculated point cloud [33]. Presently, there is a shortage of research explaining the sources of BLS errors [34]. Moreover, research combining BLS with individual tree attributes predominantly concentrates on large-diameter tree species like Scots pine (Pinus sylvestris) [35] and Mongolian Scots pine (mongolica Litv) [36], which generally have a diameter at breast height (DBH) greater than 15 cm, and excellent DBH fitting results can be achieved using algebraic fitting of circles [37,38]. This study innovatively applies BLS to extract attribute information throughout the bamboo shoot-to-culm growth process, analyzing the influence of bamboo forest spatial structure parameters on shoot growth rate.
Based on BLS, this study collected point cloud data from 184 samples in Moso bamboo forest plots to explore three issues during the growth process of shoots: (1) the performance of BLS in extracting attributes of bamboo and shoots (such as DBH, height, etc.); (2) the precision of BLS in extracting the positioning accuracy of bamboo and the influencing indicators; (3) the effect of spatial structure parameters on average growth rate and carbon storage of shoots. This study proposes an optimized method for calculating bamboo DBH based on BLS, verifying the effectiveness of BLS in accurately monitoring shoot growth. Furthermore, it establishes a relationship between bamboo forest spatial structure and shoot growth rate. This research provides a reference to further enhance the accuracy of BLS data and optimizing bamboo forest management.

2. Materials and Methods

2.1. Study Area

This study was located within an intensively managed pure Moso bamboo forest in Lin’an District, Hangzhou City, Zhejiang Province, China (119°47′24″ E, 30°13′43″ N) (Figure 1). This bamboo forest is even-aged and in on-year (productive year), sprouting large quantities of shoots in the spring. Concurrently, the bamboo forest undergoes reclamation and is treated with 450 kg ha−1 of urea and 750 kg ha−1 of special bamboo fertilizer in June, and the average density of Moso bamboo is 4206 ha−1. The region feature a subtropical monsoon climate, with an average annual temperature of 15.8 °C and an annual precipitation of 1628.6 mm, primarily distributed in the summer, and a frost-free period of 236 days. The topography of the bamboo forest is low hill and hilly, with an altitude range of 70–130 m, and the soil is a type of red soil developed from tuff and siltstone. Eight 20 m × 20 m plots were established within the study area to represent typical conditions of pure Moso bamboo stands under intensive management in Zhejiang Province. The plots were similar in terms of external environment and treatment (e.g., all south-facing slopes with gradients between 21° and 24°). The height of understory vegetation was less than 1 m.

2.2. Field Data Acquisition

2.2.1. Sample Plots’ Data
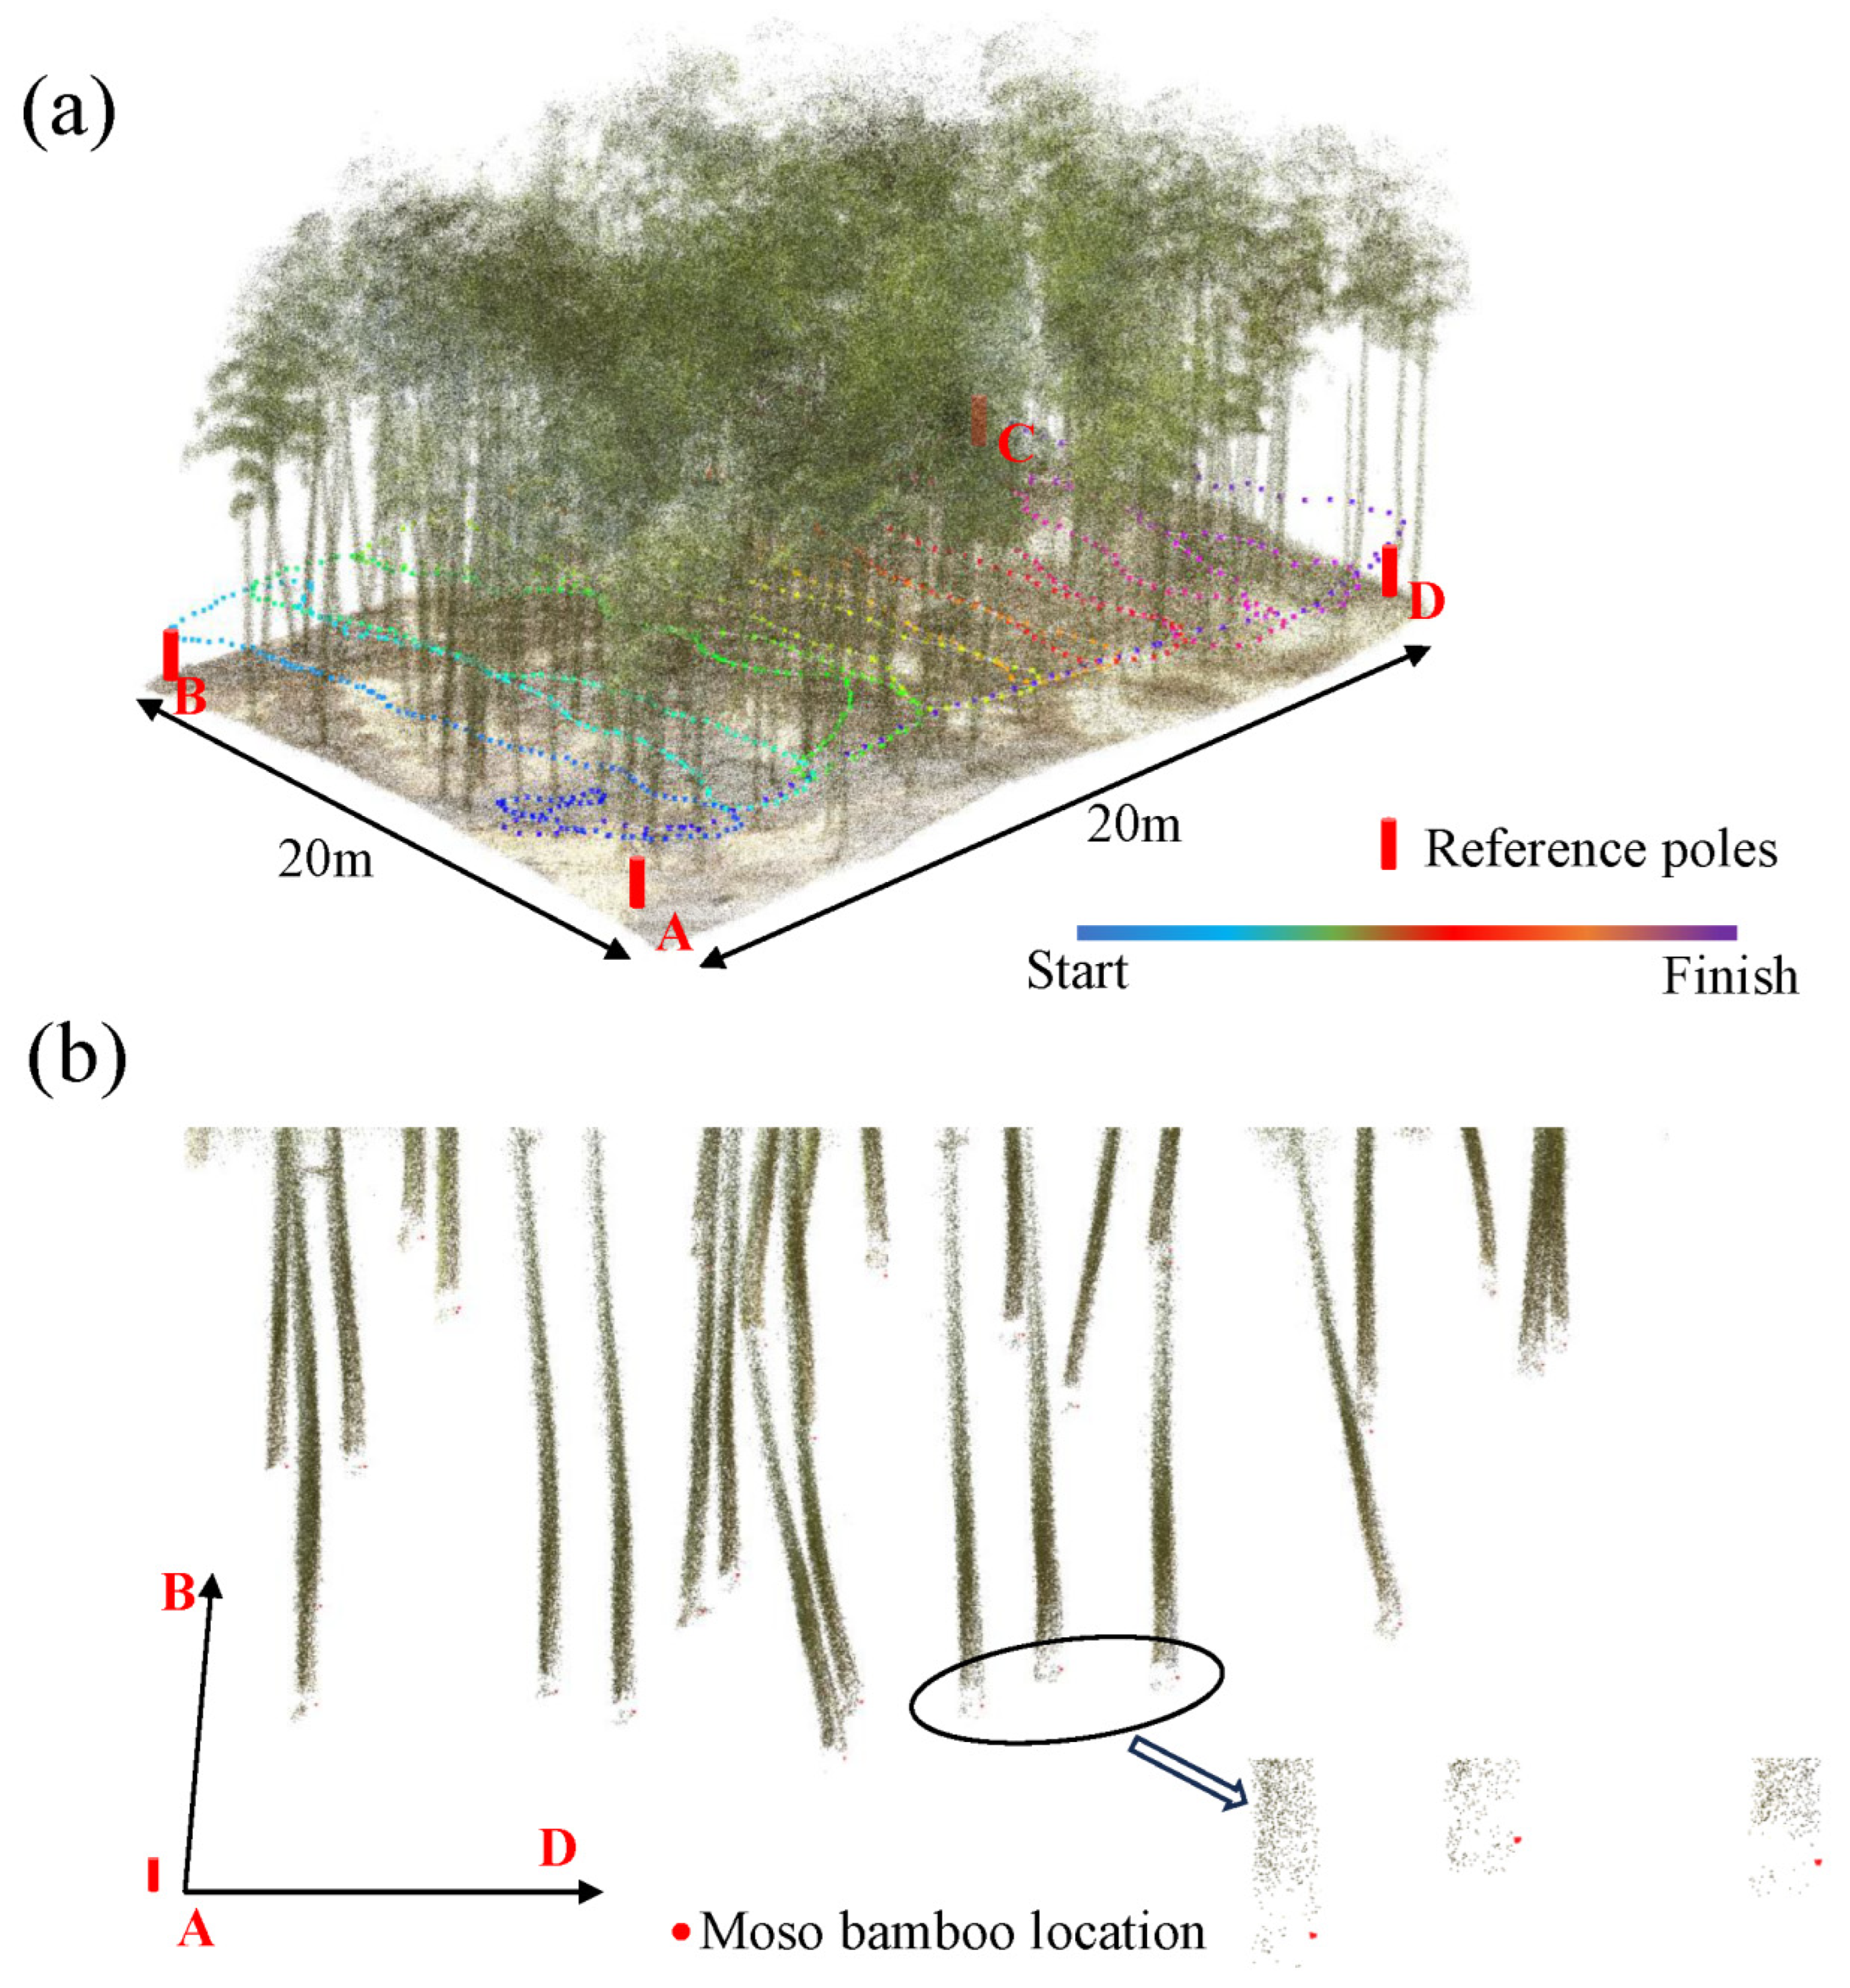
The boundary of each permanent sample plot was determined by an NTS-341R10A total station (South Group, Guangzhou, China), with an error within 10 cm for the side length of 20 m (Figure 1c). Simultaneously, a reference pole with length of 50 cm and diameter of 4 cm was vertically inserted 10 cm into the soil at each plot vertex. The outer wall of the pole was painted red. Huace Smart RTK (CHCNAV, Shanghai, China) measured the coordinates from the uphill position of the reference pole (from reference pole A to reference pole D direction) three times, and the mean value was taken as the coordinate of the reference pole (Figure 2b) for subsequent point cloud clipping and coordinate registration, with a positioning error within 1 cm. At the same time, the real-world coordinates of each bamboo in plots S1, S4, and S8 were obtained using the same measurement method. The basic information on Moso bamboo in the plots is shown in Table 1. Concurrently, the DBH of the bamboo and shoots was measured with a diameter tape; the height of shoots below 3 m was measured with a meter ruler, and for those exceeding 3 m, point cloud data were first obtained based on a Leica ScanStation C05 Laser Scanner (Leica Geosystems HDS, San Ramon, CA, USA), followed by manual segmentation of individual bamboo and shoots to acquire the true height [39]. Furthermore, only TLS data from plot S1 were collected in this study.

2.2.2. BLS Data

In this study, LiBackpack DGC50 equipment (Green Valley, Beijing, China) was used to gather point cloud data from eight plots. The equipment adopts two Velodyne Puck VLP-16 (Velodyne Lidar, Inc., San Jose, CA, USA) with 903 nm wavelength, which can upload the measured values of the surroundings and reflectivity in real time and has a measuring distance of 100 m. The horizontal field of view is 360°, and the vertical field of view is 180° (−90–90°). The scanning mode is horizontal 16-line repetitive scanning and vertical 32-line repetitive scanning, and the single echo scanning frequency is 640,000 points per second. The positioning module can receive Global Positioning System, GLObal Navigation Satellite System, and BeiDou Navigation Satellite System signals. The camera resolution is 3840 × 1920, the field of view is 360°, the frame rate is 30, and the pixel is 1800 W (Table 2). The data were collected over a total of 22 days during the shoot growth period (from 12 April 2023 to 10 June 2023). The data were gathered every other day from the time the shoots emerged until the imminent rapid growth stage (12–27 April), daily during the rapid growth stage of the shoots (from 28 April to 2 May), and every three days during the stage of declining growth rate of the shoots (3 May to 10 June). Before collecting data with the BLS, it was allowed to initialize for one minute in an open area, which included locking the solution state and the number of satellites. Subsequently, the accuracy of the positioning and sensors was validated by walking two closed loops in a figure-eight pattern. Finally, the collection of data from the bamboo forest was completed by following an “N”-shaped walking trajectory. A complete collection trajectory is shown in Figure 2a.

2.3. BLS Data Preprocessing

The original BLS point cloud files and trajectory files were input into LiFuser BP software V1.2 (Green Valley, Beijing, China) to obtain point cloud data with relative coordinates and optimized trajectory data. The plot point cloud data were then trimmed based on the coordinates of the four reference poles, and incomplete bamboo and shoot data at the boundaries were removed. The plot point cloud data were processed as follows: Firstly, the point cloud was denoised using the statistical outlier removal algorithm [40]. Subsequently, the cloth simulation filter algorithm was used to separate ground points from non-ground points [41]. Following this, blank ground points were interpolated based on the inverse distance weighted principle [42], generating a digital elevation model (DEM) with a resolution of 0.3 m. Concurrently, the bamboo point cloud was normalized for elevation based on the DEM, facilitating comparison and registration with other point cloud data.

2.4. Moso Bamboo Parameter Extraction and Accuracy Verification

2.4.1. Extraction of Height and Location of Moso Bamboo

The BLS data were subjected to individual bamboo separation using layer-wise distance discrimination [27]. This process began by trimming the normalized point cloud with heights between 1 and 3 m. Given that the geometric features of the bamboo stem and the leaf point cloud differ significantly [43], the leaf point cloud could be removed by calculating the geometric features of the 1–3 m point cloud. The remaining point cloud was then clustered to separate individual bamboo stems, with the center point at 1.3 m on each stem set as the seed point. Next, the bamboo stem point cloud was horizontally sliced to generate layers of a certain thickness and continuity. The distances between the decision-making point cloud in the previous layer and the seed point were calculated using the layer containing the seed point as the base layer. Point clouds with distances exceeding the threshold were assigned the same category code as the seed point. A convex hull was constructed for the new point cloud data, and the centroid was calculated. If the distance in the centroid of the aggregated point cloud and the cluster center on the horizontal plane was less than 0.15 m, the center point of these two values was used as the new seed point. Otherwise, the center point of the aggregation was used as the new seed point. Based on the new seed point, this process was repeated upwards until the top was reached, with the point cloud below the initial seed point being processed similarly. The maximum Z-axis value of the separated individual bamboo was taken as the height extracted by the BLS. The coordinates of the upslope side of the base of each bamboo culm were used as its location coordinates (as shown in Figure 2b).

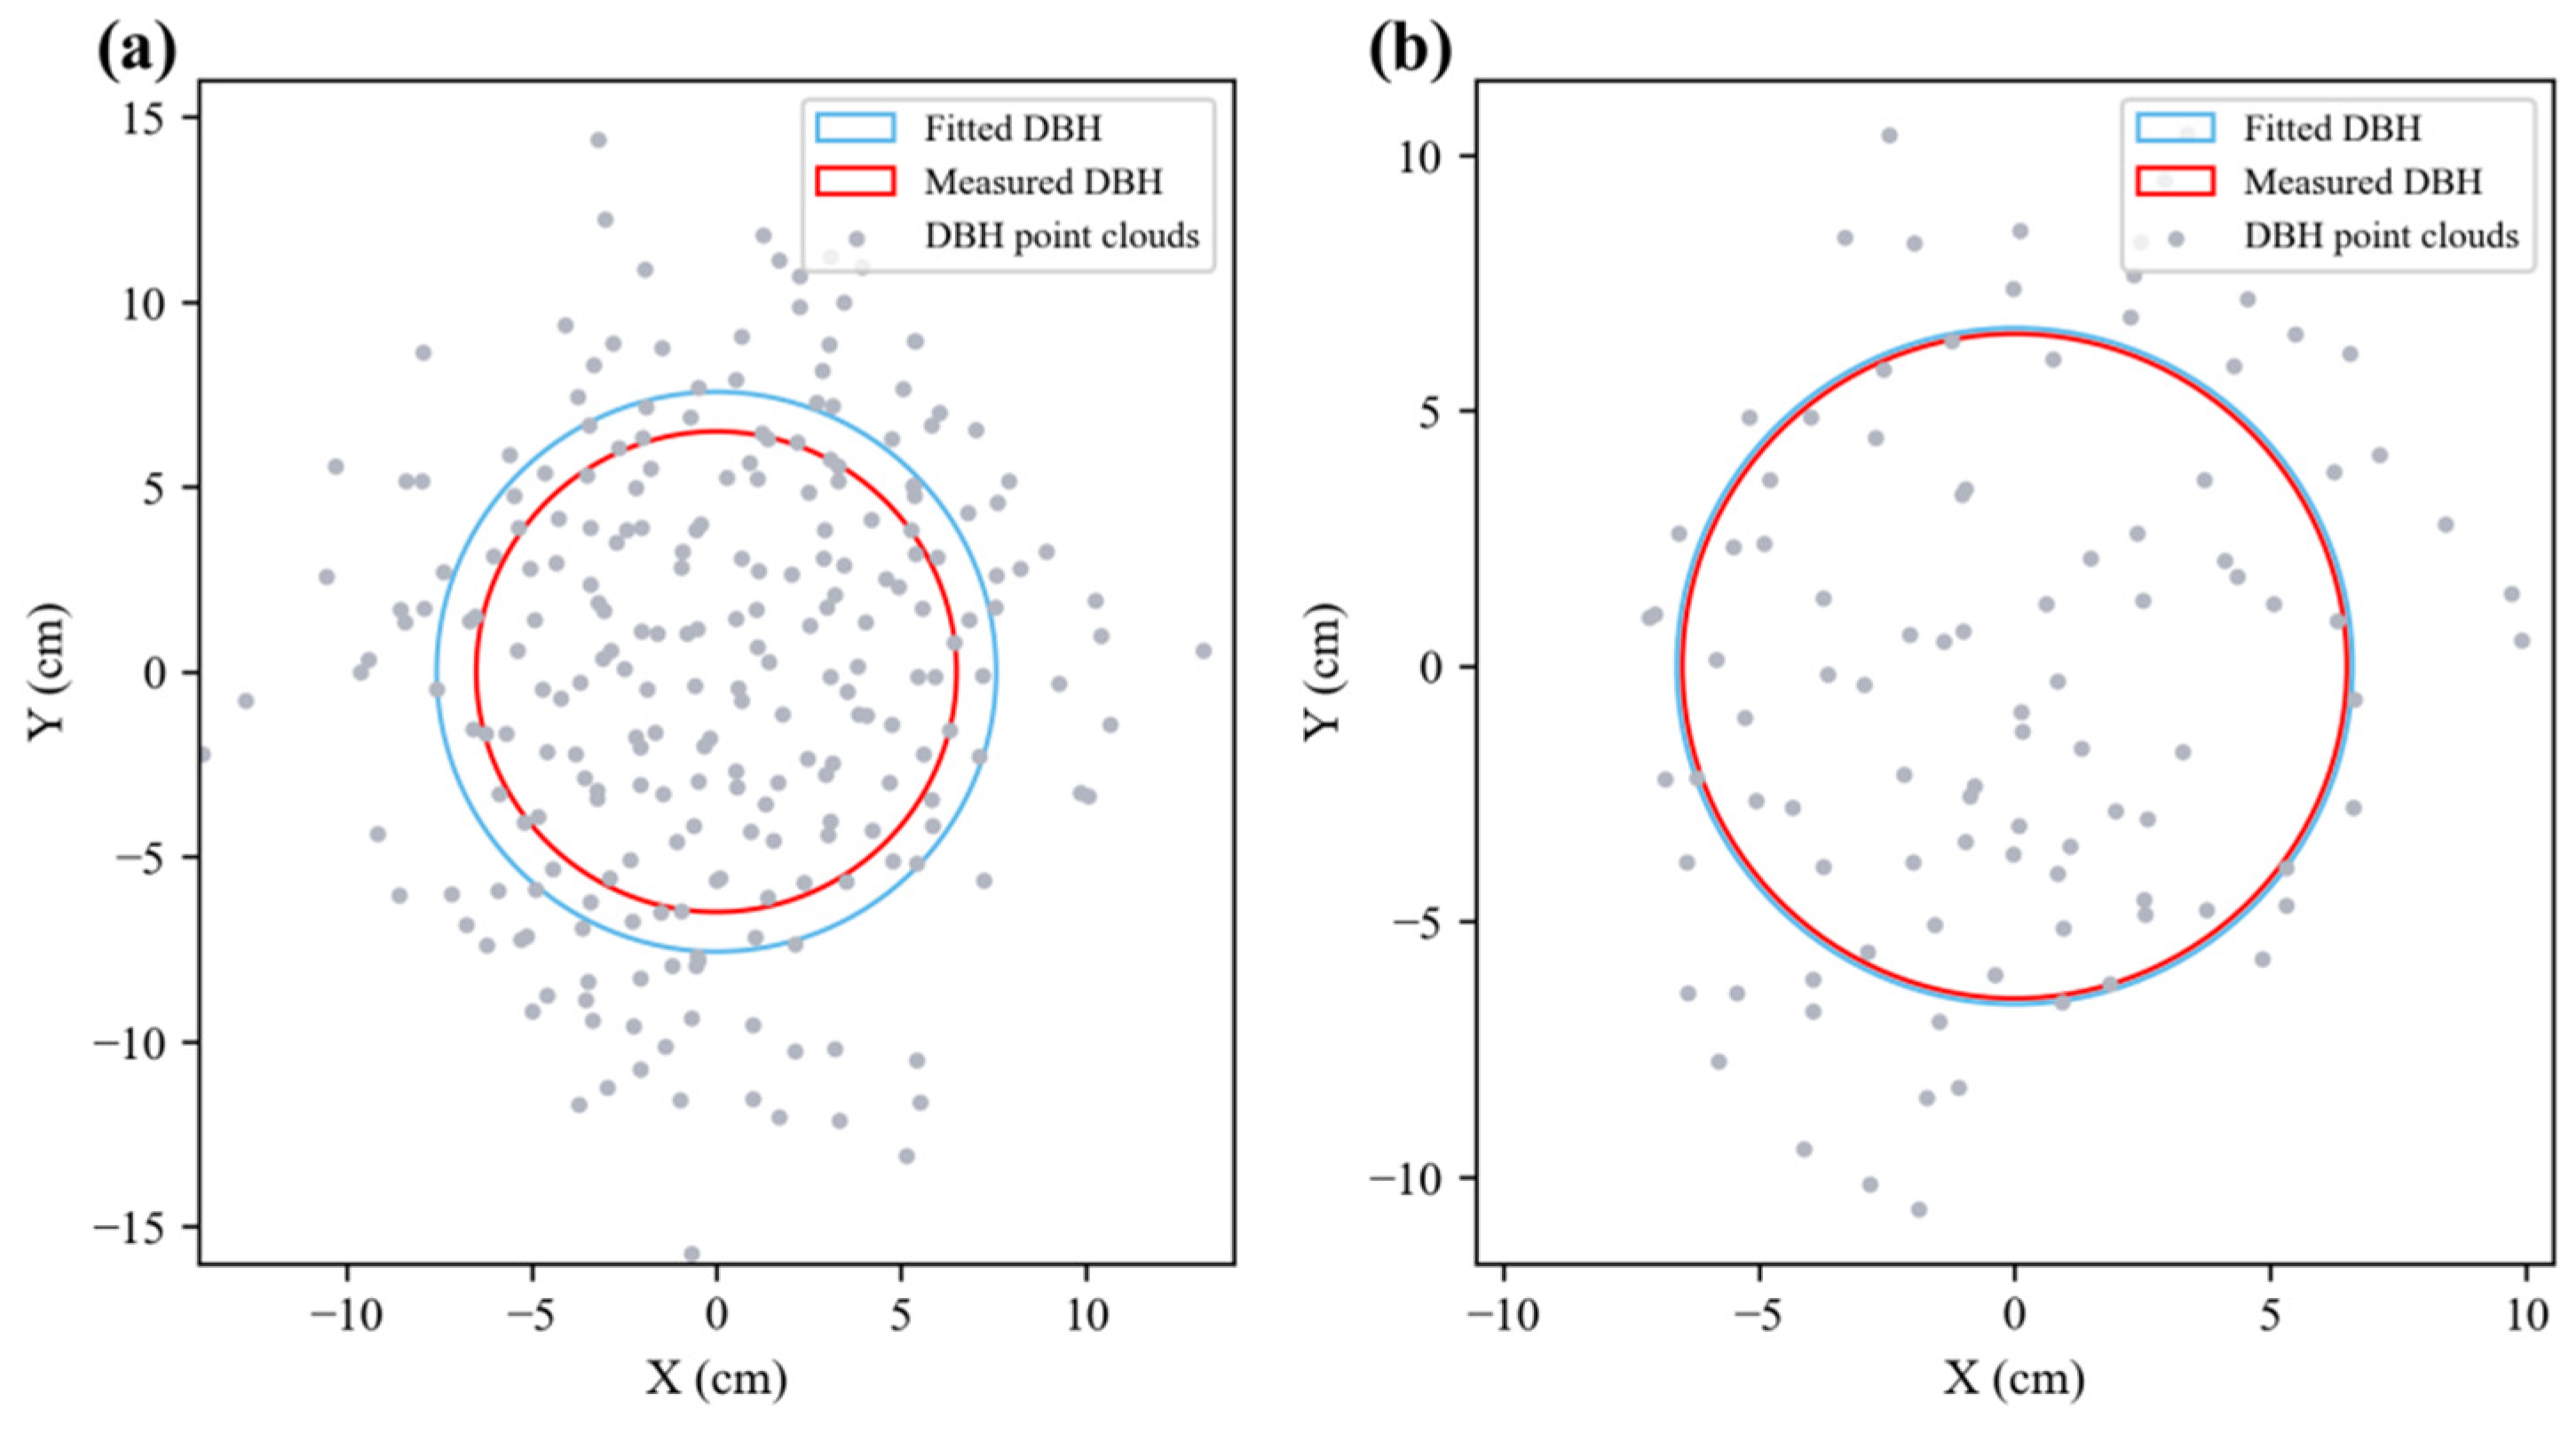
2.4.2. Extracting DBH from Moso Bamboo and Shoots

Density-based spatial clustering of applications with a noise algorithm is typically used to obtain the bamboo stem point cloud at a height of 1.2–1.4 m from the ground, and the DBH is derived using a cylindrical fitting method [44] or calculated using the least-squares fitting of circles (LSFC) algorithm method [45]. These two methods are applicable to point clouds with a normal stem shape [46]. However, in this study, massive point clouds were distributed inside the bamboo stem, leading to lower accuracy in fitting the bamboo DBH. Therefore, this study proposes an optimized method based on the LSFC algorithm (OLSFC), which screens the point cloud used for fitting the DBH through the echo intensity information and spatial distribution information of the point cloud at a height of 1.28–1.32 m from the bamboo stem. Firstly, the vertex coordinates of the oriented bounding box of each bamboo point cloud were found [47], and the point cloud at a height of 1.28–1.32 m from the oriented bounding box bottom surface was trimmed. Then, the point cloud with echo intensity below a certain threshold was removed, and the remaining point cloud was projected onto its oriented bounding box bottom surface. The standard deviation score of each point after projection was calculated [48], and the DBH of points falling below a certain standard deviation threshold was calculated using the LSFC method. The echo intensity threshold and standard deviation threshold used in the above calculations were determined by the actual measured DBH values of the bamboo and shoots. A higher fitting accuracy was achieved when these two thresholds were set to 50 and 1.5, respectively.

2.4.3. Accuracy Verification

In this study, the accuracy of the bamboo attributes extracted from the BLS data was evaluated using the measured height and DBH of the shoots, as well as the bamboo height obtained from TLS. Evaluation metrics included the coefficient of determination (R2), root mean square error (RMSE), and mean absolute error (MAE). The formulas are as follows ((1)–(3)):
R 2 = 1 i = 1 n y i y i ^ 2 i = 1 n y i y ¯ 2
RMSE = 1 n i = 1 n y i y i ^ 2
MAE = 1 n i = 1 n y i ^ y i
where y i is the measured value of the height or DBH of the i th bamboo and shoot within the plot; y i ^ is the corresponding height or DBH of the bamboo and shoot extracted from the BLS data; y ¯ is the mean value of y i ; and n is the number of samples participating in the evaluation of BLS data quality.

2.5. Indicators Influencing Location and Growth Rate

To assess the reliability of the influence of various indicators on bamboo shoot growth rate and the uncertainty of the prediction results, this study conducted a Monte Carlo simulation and sensitivity analysis [49]. Specifically, the probability distributions of the influencing factors were determined based on the location and DBH information of each bamboo shoot. A Monte Carlo simulation was then used to sample and repeatedly simulate the model input parameters. Furthermore, the sensitivity index was calculated to quantify the influence of each indicator on bamboo shoot growth rate.

2.5.1. Indicators Influencing Location

The accuracy of extracting bamboo coordinates from BLS data is directly determined by point cloud quality (such as intensity, point cloud quantity, and density within the 50 cm height range at the base of the bamboo culm), bamboo attributes (the diameter class (with a class interval of 2 cm in this study) and the distance to the nearest bamboo) [50]. In addition to these indicators, the data collection trajectory and terrain features of the plot also have a significant influence on positioning accuracy [51]. Therefore, this study calculated the distance from each bamboo to the start (DS), the shortest distance to the trajectory (DT), and the cumulative distance, as well as the surface roughness, slope of aspect of DEM, and the slope to reflect the conditions of the plots. These specific influencing indicators are shown in Table 3. The horizontal positioning errors ΔE and ΔN (east and north directions, respectively), elevation error ΔH, and overall positioning error ΔP are obtained based on the differences between the coordinates extracted from BLS and the measurements. The calculation formulas are as follows ((4)–(7)):
Δ E = E lidar E field
Δ N = N lidar N field
Δ H = H lidar H field
Δ P = Δ E 2 + Δ N 2 + Δ H 2

2.5.2. Spatial Structure Indicators Influencing Growth Rate

The canopy is an essential medium for material exchange and energy conversion between the bamboo forest and the environment [52]. Canopy variables are crucial parameters in establishing models for bamboo biomass, volume, and other forestry models, directly reflecting the growth status and competitiveness of bamboo [18]. Abundant offshoots sprout in the bamboo forest in March–April in the on-year, and three months later, the height of the shoots stabilizes, and they branch and leaf out [53]. During this period, the DBH of the shoots changed by less than 2%, approximately 17.65 days after it emerged in this study. At this time, the average height was 2.75 m, which was not yet in the rapid growth stage. Therefore, it can be assumed that the DBH of the shoots and the forest canopy remained unchanged at this stage. In this study, the shoots and bamboo within a certain distance from the target shoot were considered competitors (the distance is the average diameter of the bamboo canopy within the plots). To avoid edge effects, the range of competition for shoots near the plot boundary line was expanded by 2 m outward. The bamboo and shoots in the expanded area were only considered competitors for calculation purposes.
This study employed six spatial structure parameters, including the aggregation index (R) [54] to analyze the spatial distribution mode of bamboo; the DBH size ratio (U) to reflect the size ratio of bamboo DBH; the Hegyi competition index (CI) [55] to describe the competitive situation of bamboo; the gap fraction (GF) [56] to reflect the proportion of canopy gaps; the canopy cover (CC) [57] to describe the size of the canopy projection area; and the leaf area index (LAI) [58] to reflect the soil moisture near the ground surface. The calculation formulas and parameter meanings of each index are as follows ((8)–(13)):
R i = r i / 1 2 F N
where R i is the aggregation index of the i th shoot, r i is the distance from the i th shoot to its nearest bamboo or shoots, N is the number of bamboo and shoots within the range and F is the area. The value of R ranges from 0 to 2.1491. When R is greater than 1, the bamboo within the range is uniformly distributed; when R is less than 1, there is a tendency for bamboo to be aggregated; when R equals 1, the distribution of bamboo is random.
U i = 1 n j =   1 n V ij
where U i is the size ratio of the i th target shoot, n is the number of surrounding bamboo and shoots within the range of the i th target shoot, and V ij is a piecewise function regarding the size ratio of the DBH. When the DBH of adjacent bamboo and shoots is greater than that of the target shoot, the value of V ij is 1; otherwise, it is 0. The value of U ranges from 0 to 1. When U equals 0, it indicates that the target shoot is in a dominant state; the larger the value of U , the more disadvantaged the target shoot is.
I CI = j = 1 n d j d i · L i j
where I CI is the competition index of the target shoot i , L ij is the distance between the target shoot i and the competing bamboo and shoots j , d i is the DBH of the target shoot i , d j is the DBH of the competing bamboo and shoots j , and n is the number of competing bamboo and shoots.
GF = n ground n
where GF is the gap fraction, n ground is the number of ground points with a height below the threshold, and n is the total number of points. In this study, the height threshold was set to 2 m, that is, points in the normalized point cloud below 2 m were considered as ground points.
CC = n veg n
where CC is the canopy closure, n veg is the number of vegetation points, and n is the total number of points. The height threshold was the same as in the GF formula, where points above 2 m were considered as vegetation points. The larger the canopy closure, the weaker the light inside the forest, the lower the temperature, and the smaller the evaporation, which affects the efficiency of photosynthesis in forest plants [59].
LAI = cos ang · ln GF k
where ang is the average scanning angle, GF is the gap fraction, and k is the extinction coefficient. The value of k is related to the leaf inclination angle of the forest canopy. In this study, it was a constant value of 0.5 [56].

2.6. Calculation Formula for Carbon Storage

The carbon storage of shoots is determined by their ground diameter, height, and growth duration [60]. The calculation formula and parameter meanings are as follows (14). This study employed the random forest algorithm [61] to quantify the relative influence of six spatial structure indicators on shoots’ carbon storage.
M = 0.002 D 1.538 e 0.021 t H 1.190 e 0.019 t
where D is the ground diameter, H is the height of the shoots, and t is the time difference from the initial measurement, which was 60 in this study, representing the final carbon storage of the shoots.

3. Result

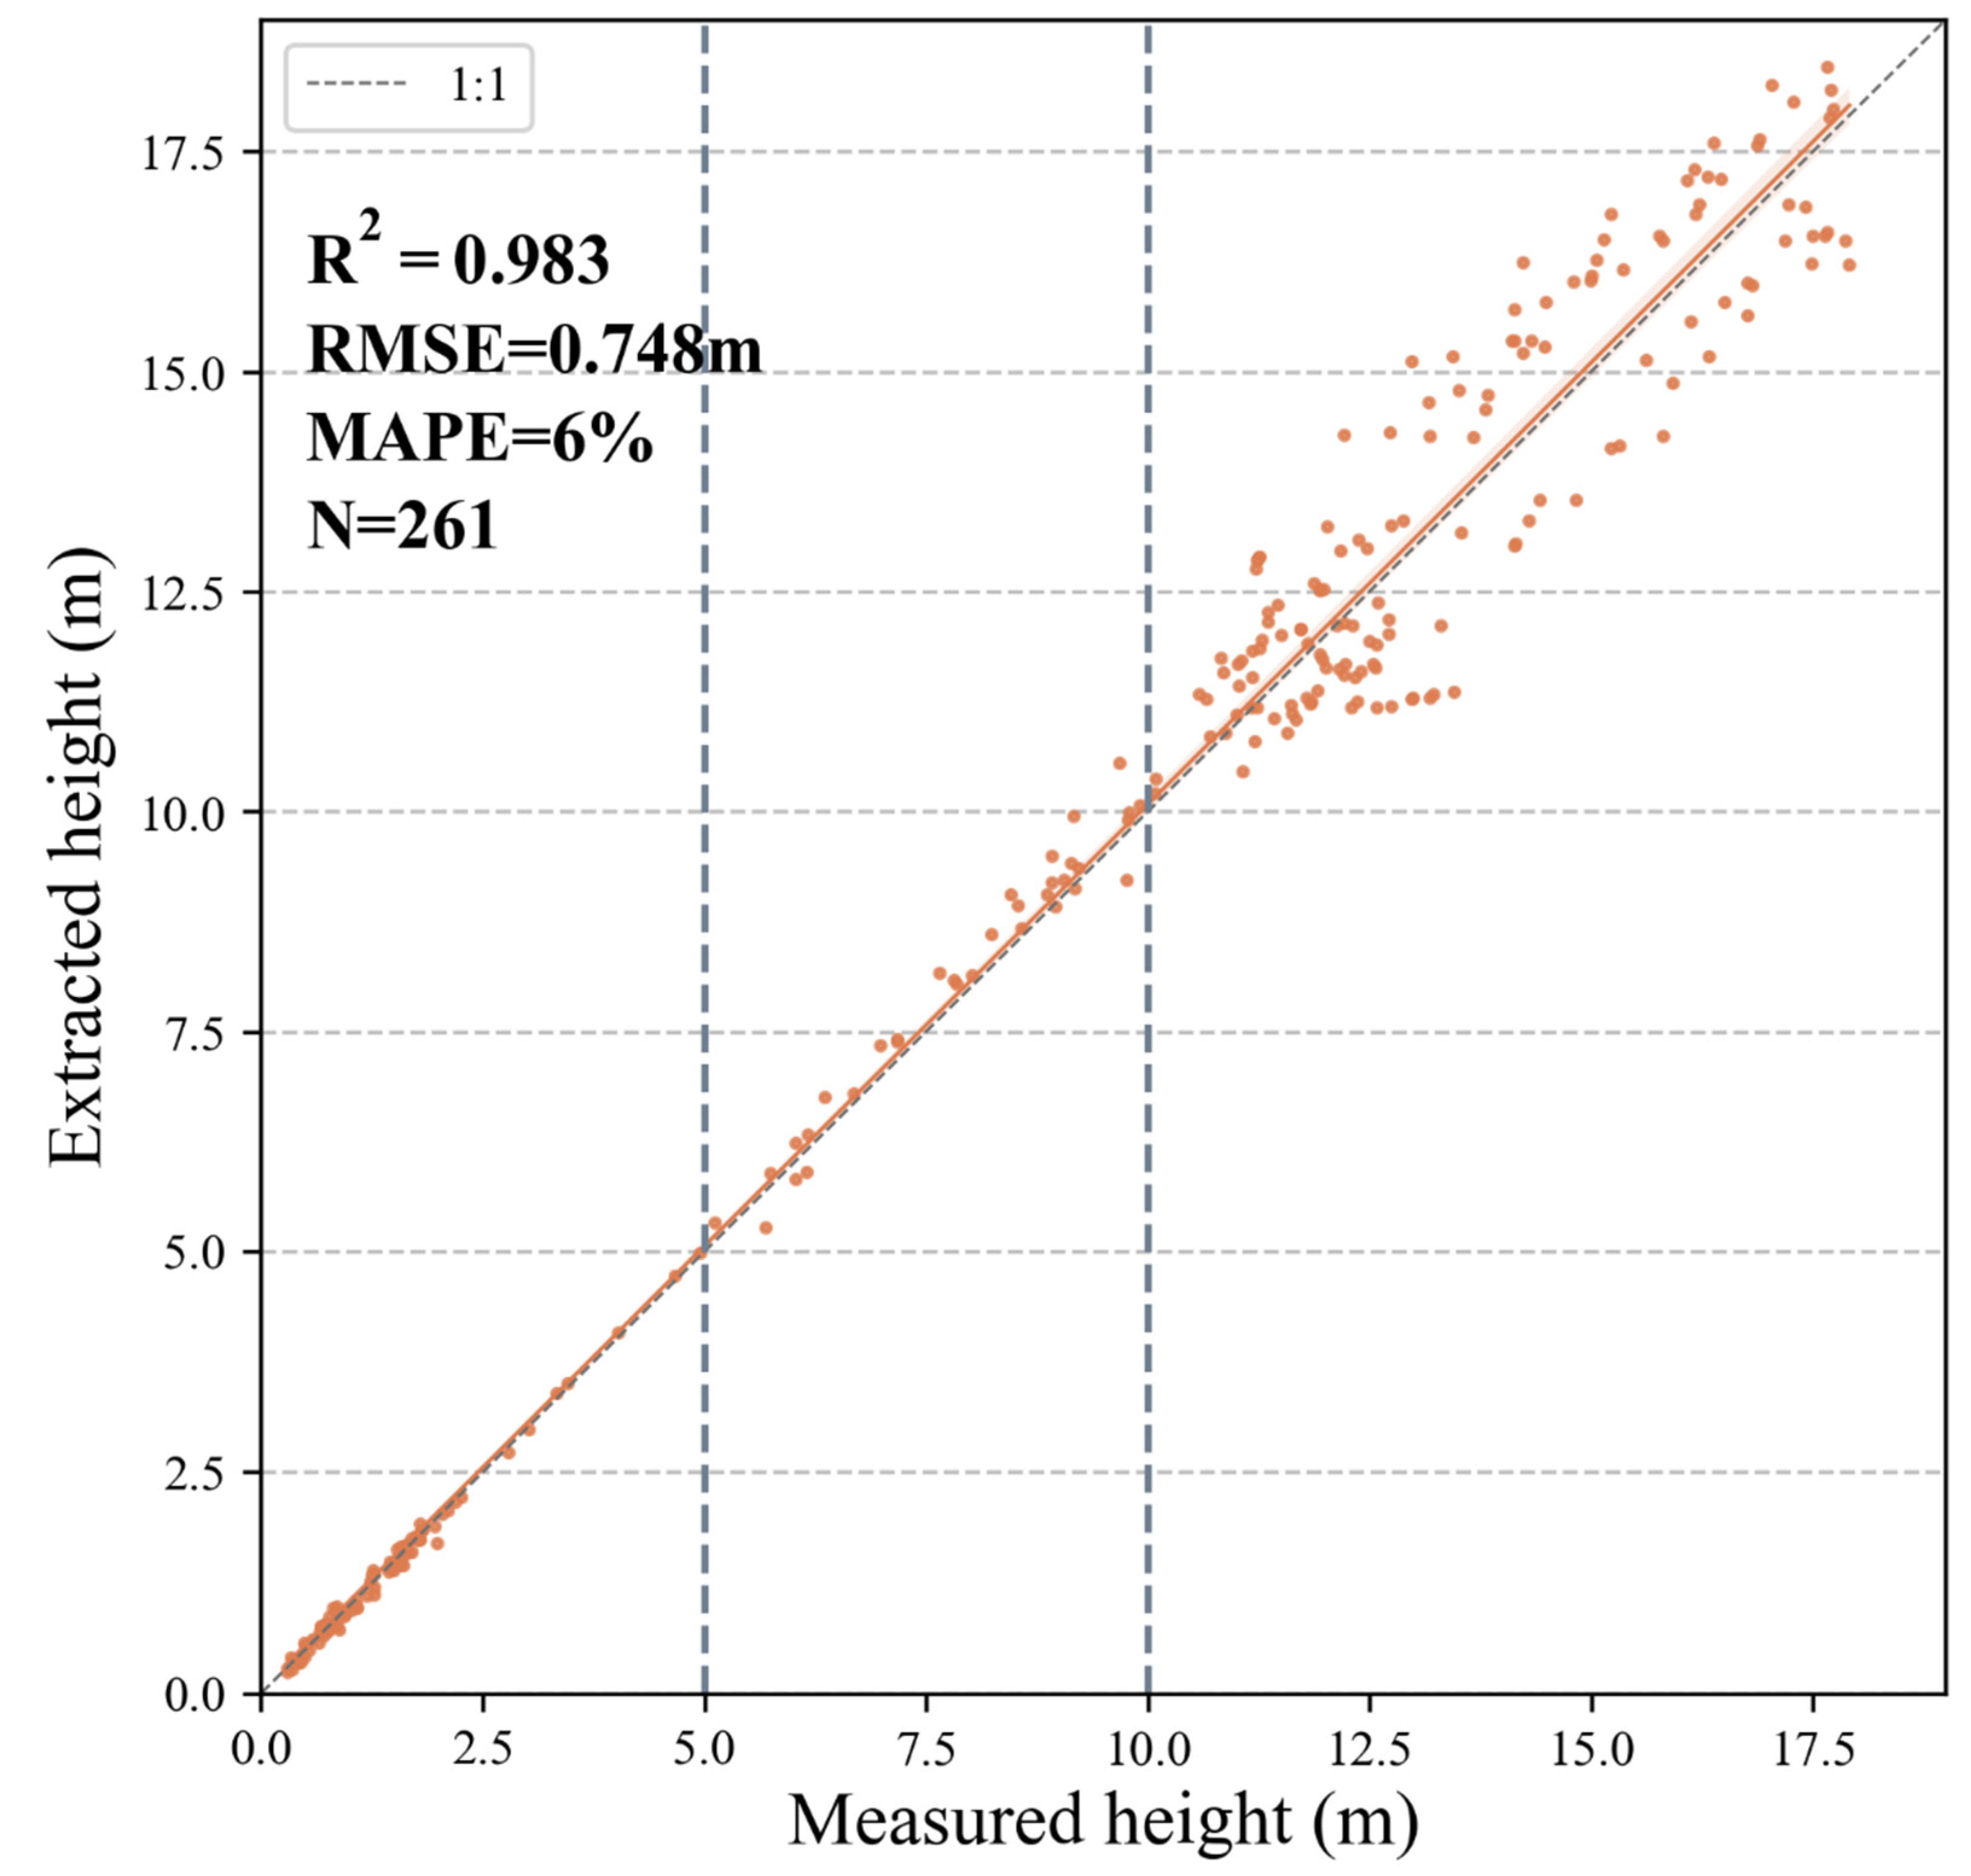
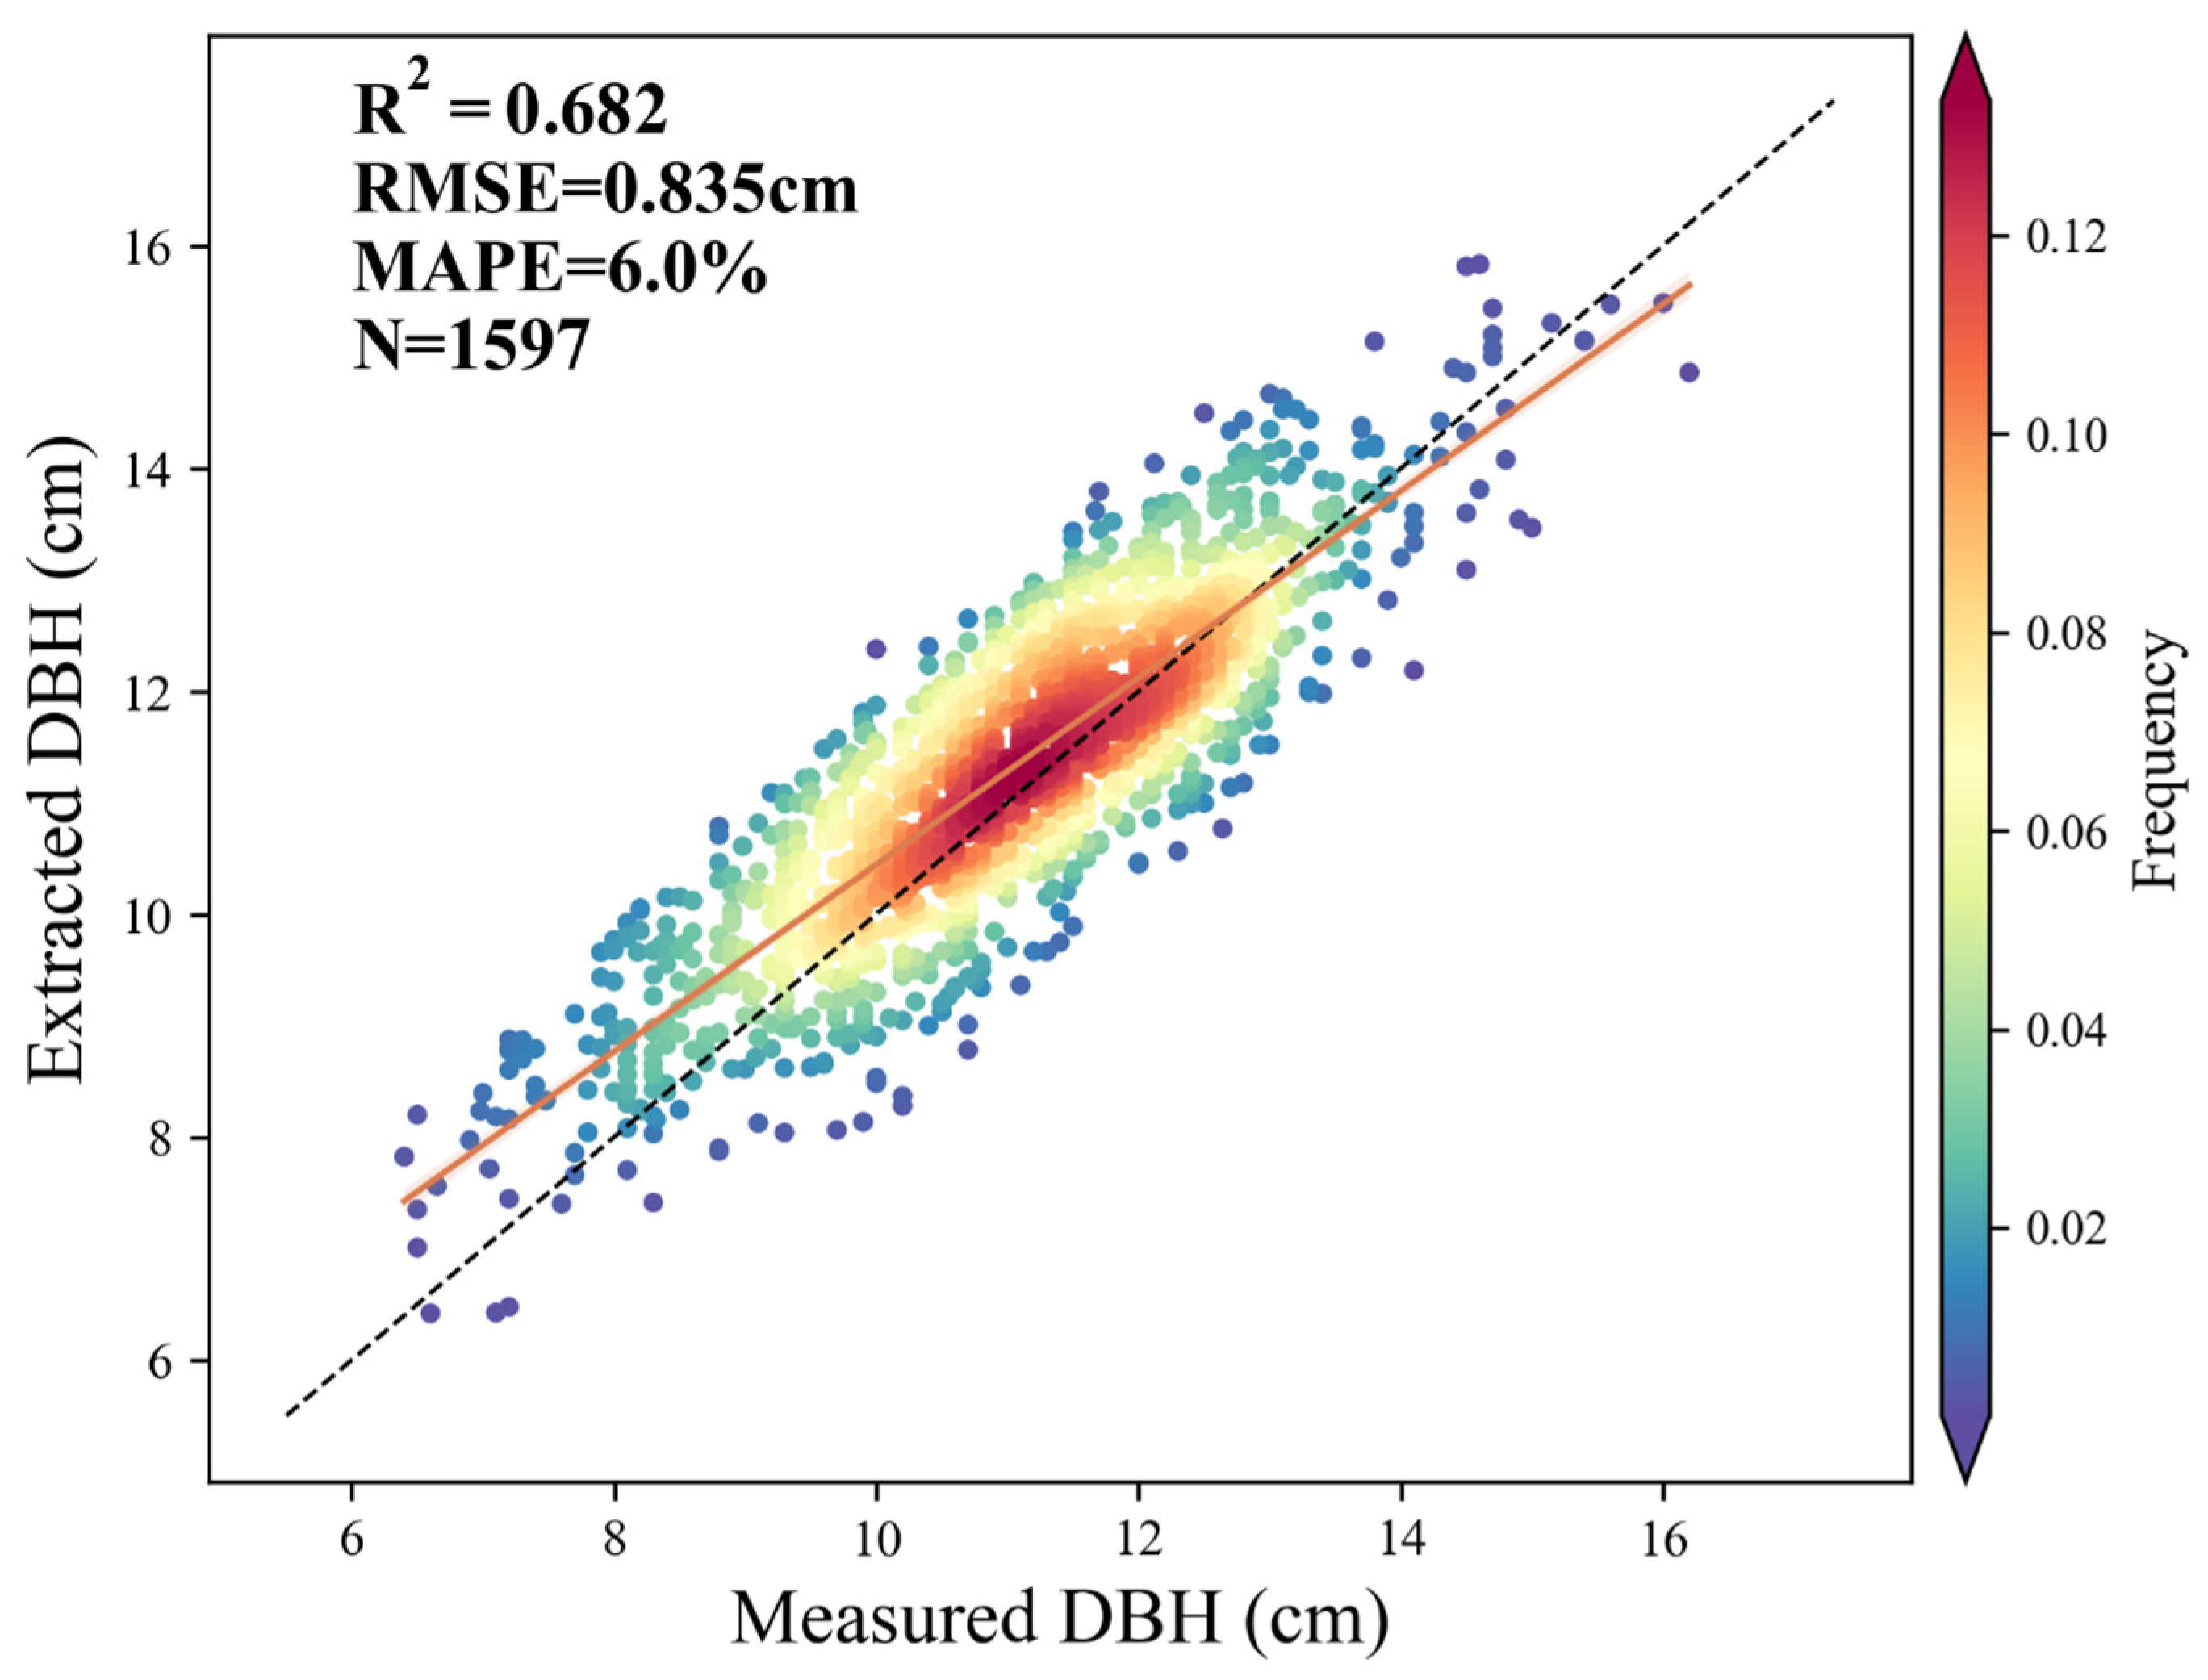
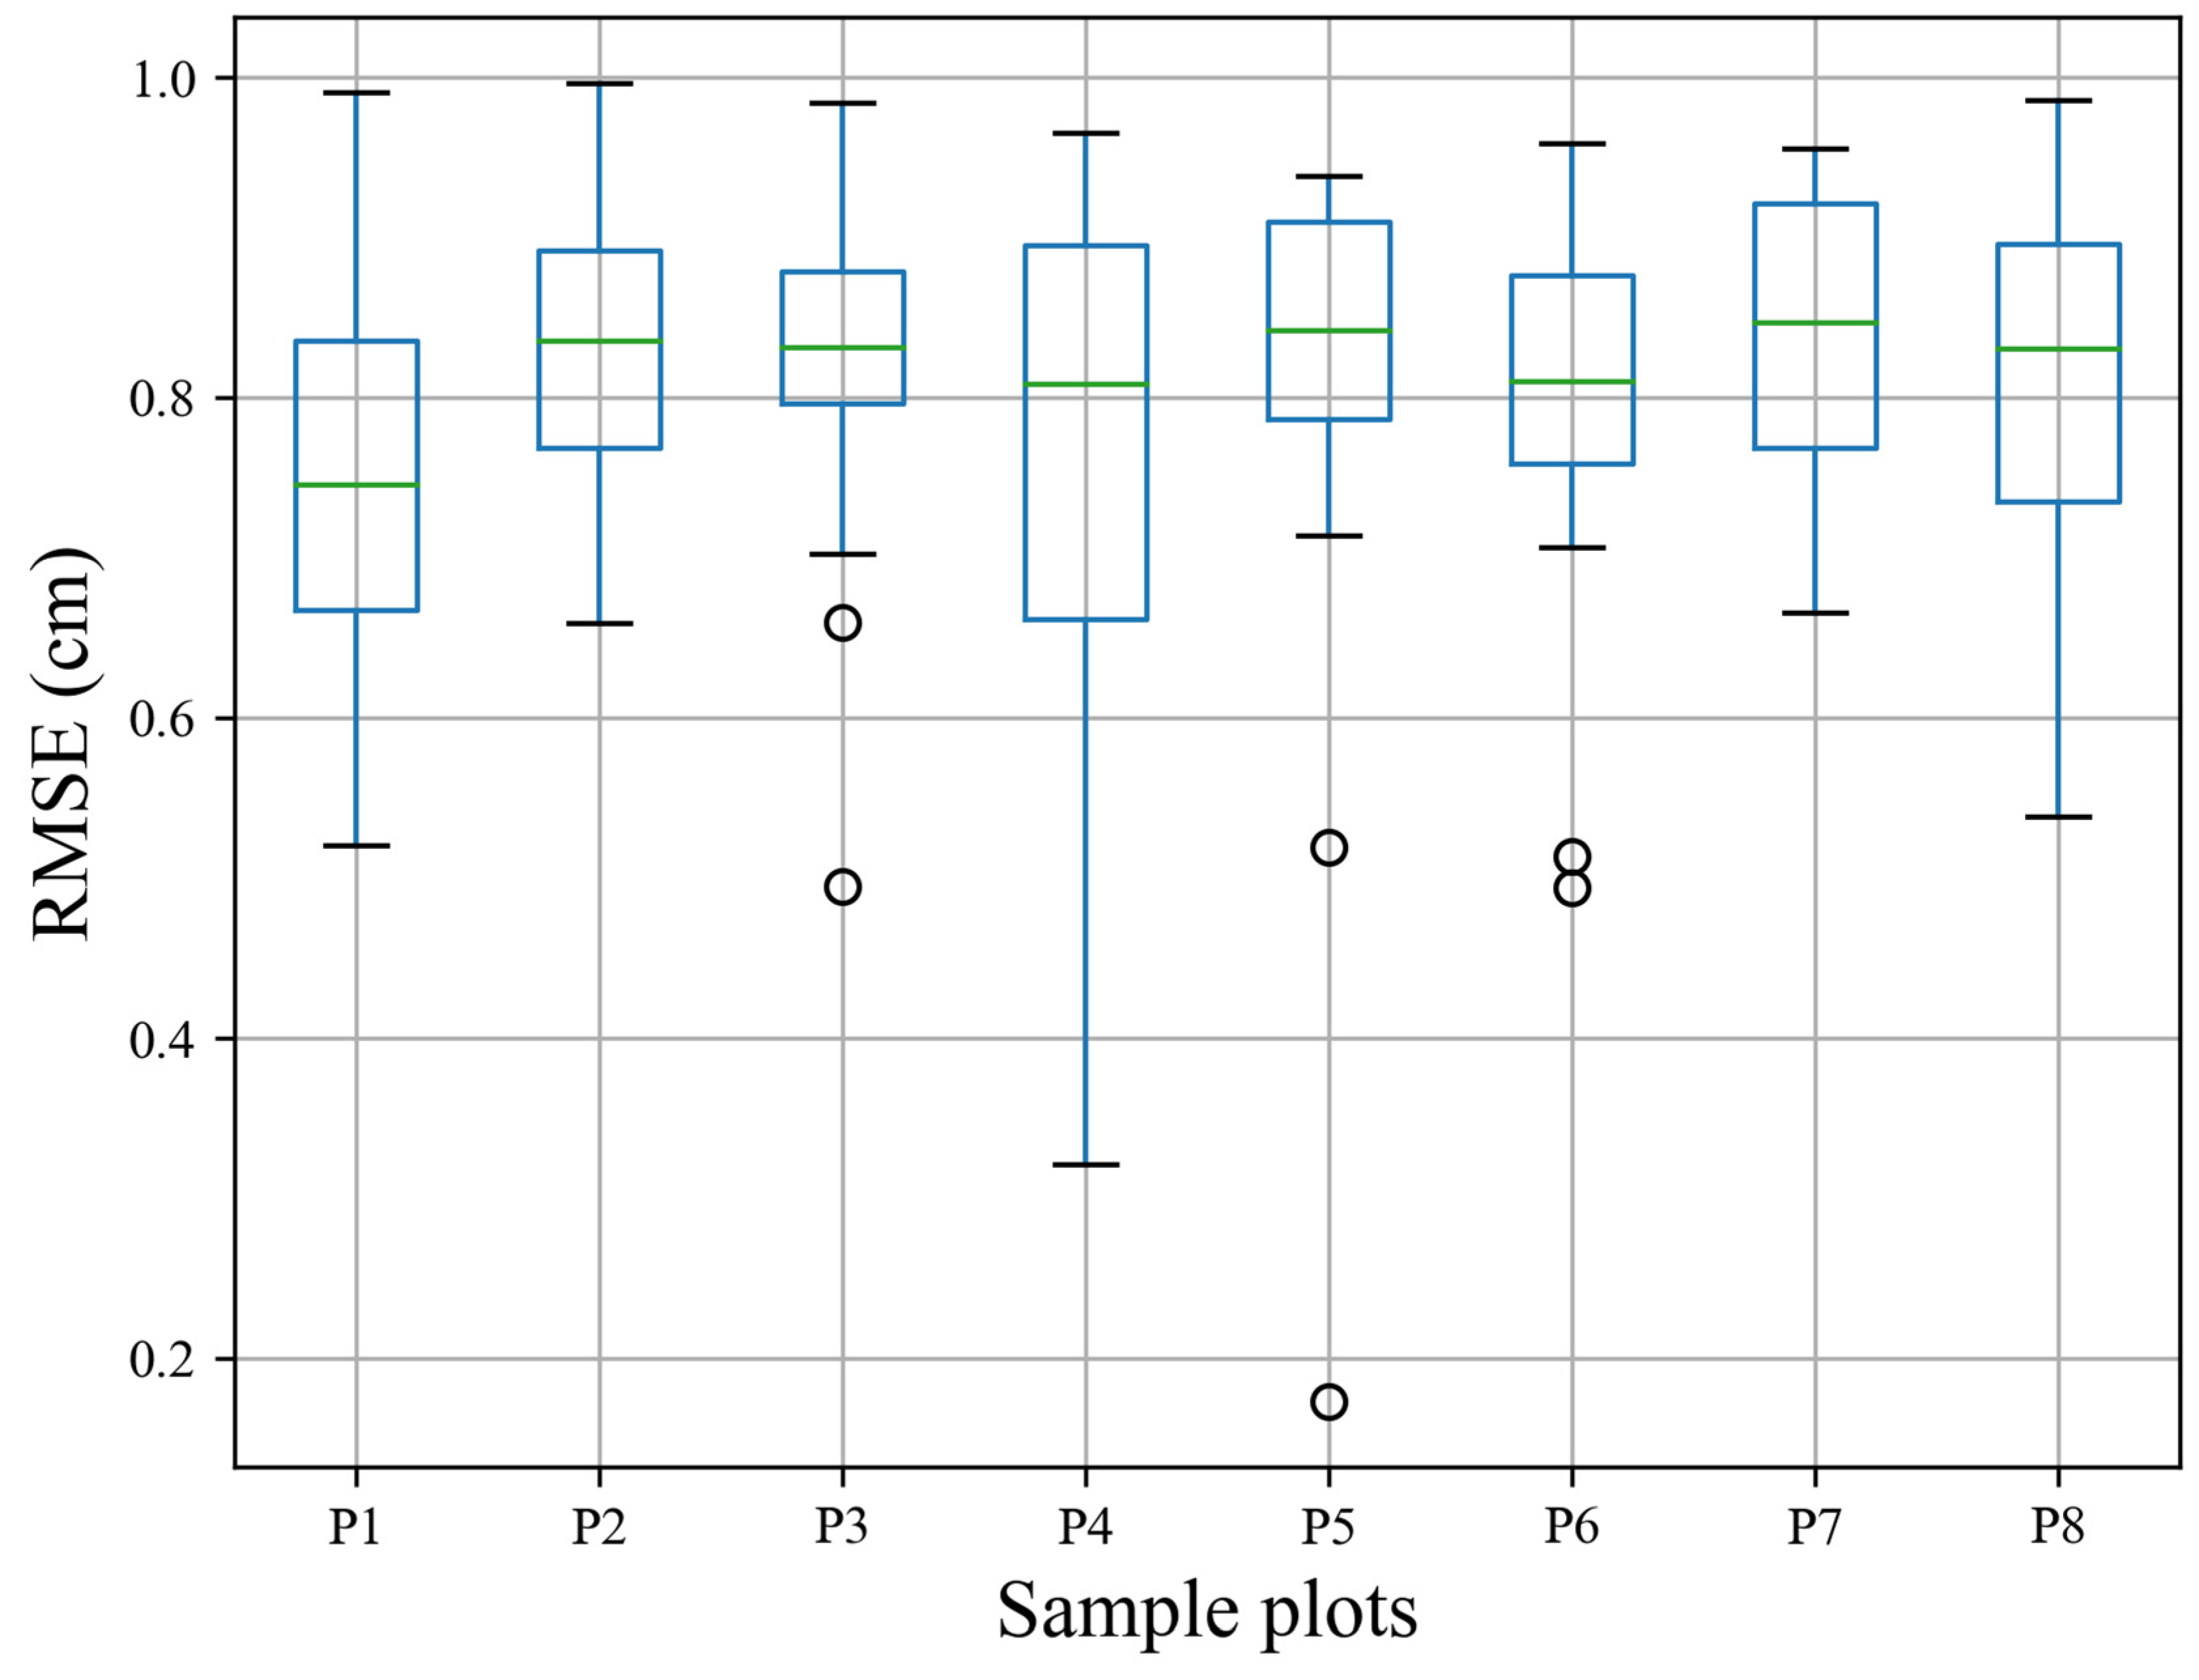
3.1. The Accuracy of Extracting Height and DBH

The correlation between the height extracted from BLS data and the measured height (including meter ruler measurement data and height data extracted from TLS) is shown in Figure 3. Overall, the accuracy of the bamboo and shoots height value obtained from BLS data was quite high (R2 = 0.983, RMSE = 0.748 m). When the height of shoots was less than 10 m, the height extracted from BLS data was very close to the measurement (RMSE = 0.203 m). Specifically, when the height of shoots was less than 5 m, the fitted line almost coincided with the 1:1 line; when the height of shoots was between 5 and 10 m, the height extracted from BLS data was higher than the measurement. When the height of shoots exceeded 10 m, there was a significant deviation between the height extracted from BLS data and the measurement (RMSE = 0.984 m), with both relatively evenly distributed on both sides of the 1:1 line (55% of the extracted heights are higher than the actual measurements). The minimum and maximum differences were 0.012 m and 2.142 m, respectively, and the RMSE was 0.858 m. The experiment had a total of 261 actual height measurements, of which 100 were the height data of bamboo in plot S1, 76 were measured with a meter ruler from eight plots (shoots below 3 m in height), and 85 were manually segmented from the TLS data of single shoots in plot S1 (when the height of shoots exceeds 3 m).
In this study, the OLSFC algorithm was applied to filter the breast-height point cloud, with the results shown in Figure 4. Figure 4a displays the distribution of these data projected onto the oriented bounding box base surface from a height of 1.28–1.32 m above the ground after denoising for the bamboo and shoot. It can be observed that there was still a significant amount of noise inside and outside the bamboo wall, and the directly fitted result was significantly larger than the measured one (directly extracted DBH: 15.144 cm, measured DBH: 13 cm). Figure 4b exhibits the distribution of that after filtering, and a remarkable improvement in DBH accuracy was achieved upon recalculating with the optimized point cloud (optimized DBH value: 13.225 cm), and the overall estimation error of DBH decreased by 73.41 ± 11.52%. This confirms that the method presented in this study could extract the DBH from BLS data with a high degree of accuracy. Simultaneously, the distribution trend of the breast-height point cloud with and without optimization was consistent, proving that the OLSFC algorithm could retain the morphological characteristics of the bamboo.
In the growth process of shoots, a total of 1597 DBH measurements were collected, including 373 bamboo DBH and 1224 shoot DBH. The association in the optimized extracted DBH and the measured DBH is shown in Figure 5. Overall, the results of the BLS-obtained DBH were satisfactory, with an R2 of 0.682 and RMSE of 0.835 cm. As can be seen from Figure 5, the DBH of shoots in the eight plots mainly ranged from 9.2 to 13 cm, with the highest proportion (61.23%) falling within the 10–12 cm range. When the DBH was within 6–12 cm, most of the optimized DBH was greater than the measured DBH, and the difference between the two gradually decreased as DBH increased. When DBH exceeded 12 cm, the optimized DBH was less than the measured DBH, and the difference between the two gradually increased as DBH increased. As previously stated, when the measured DBH was between 11 and 13.5 cm, the DBH extracted based on the OLSFC algorithm had the smallest error.

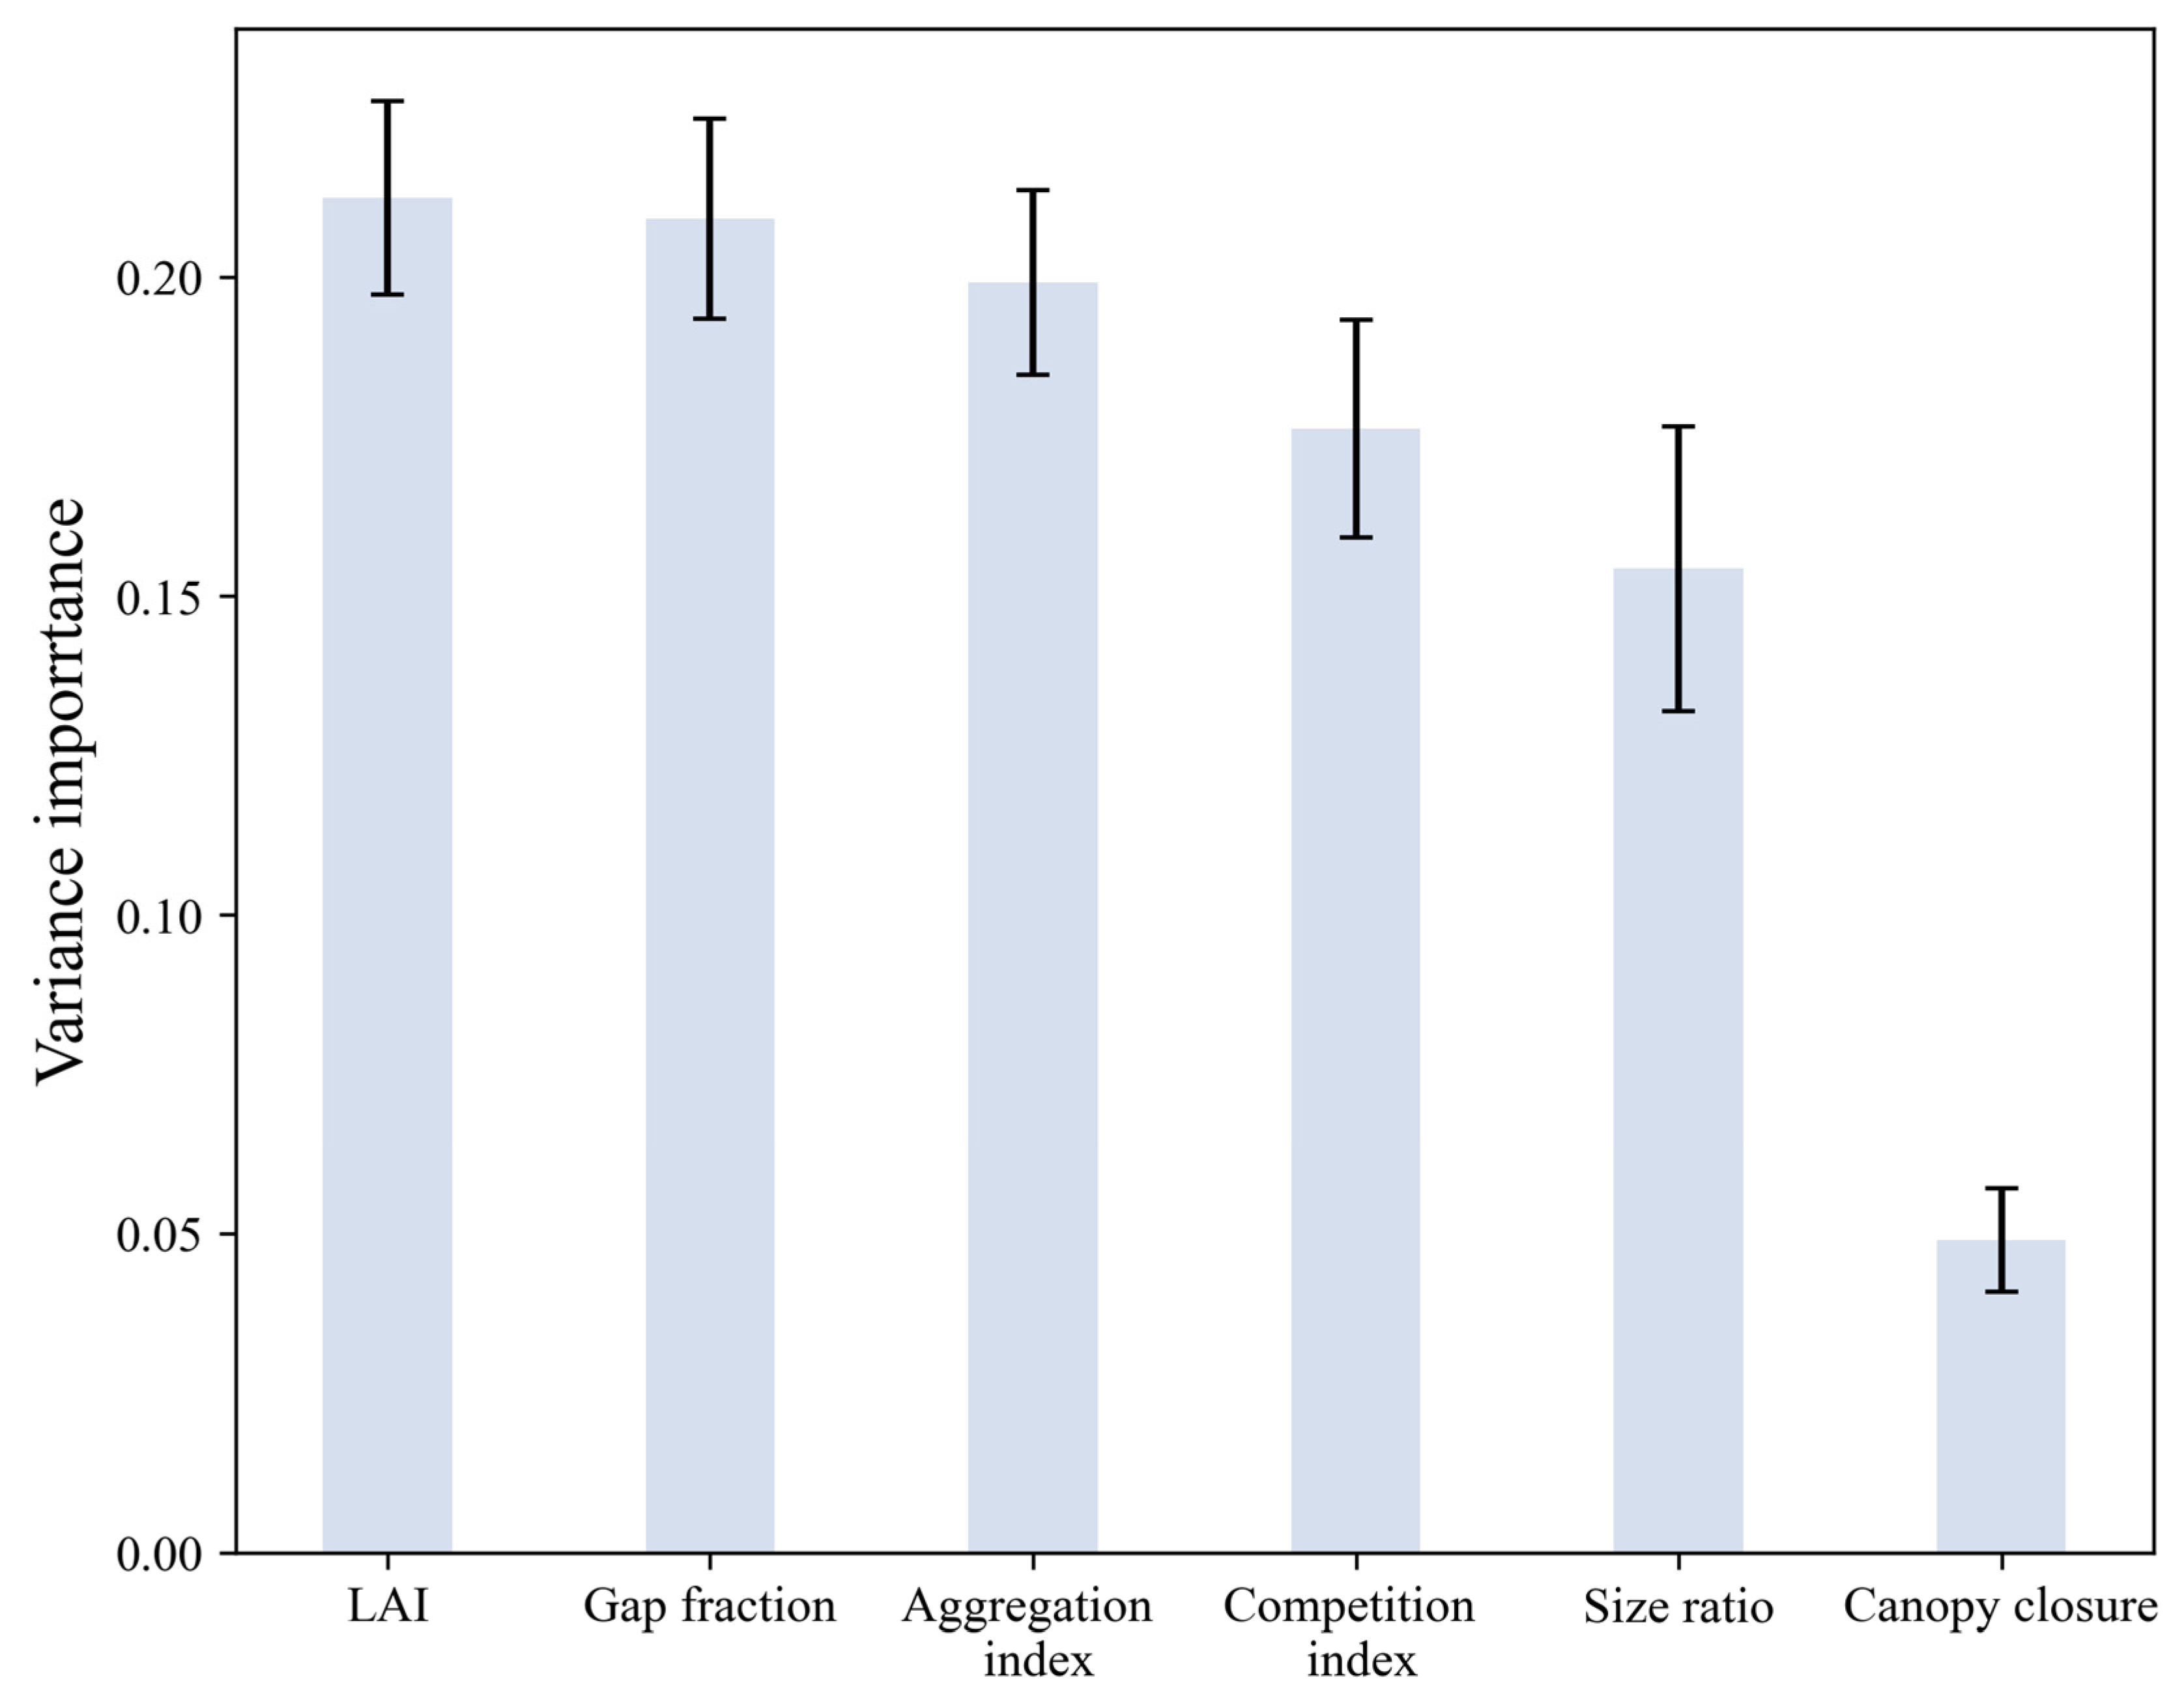
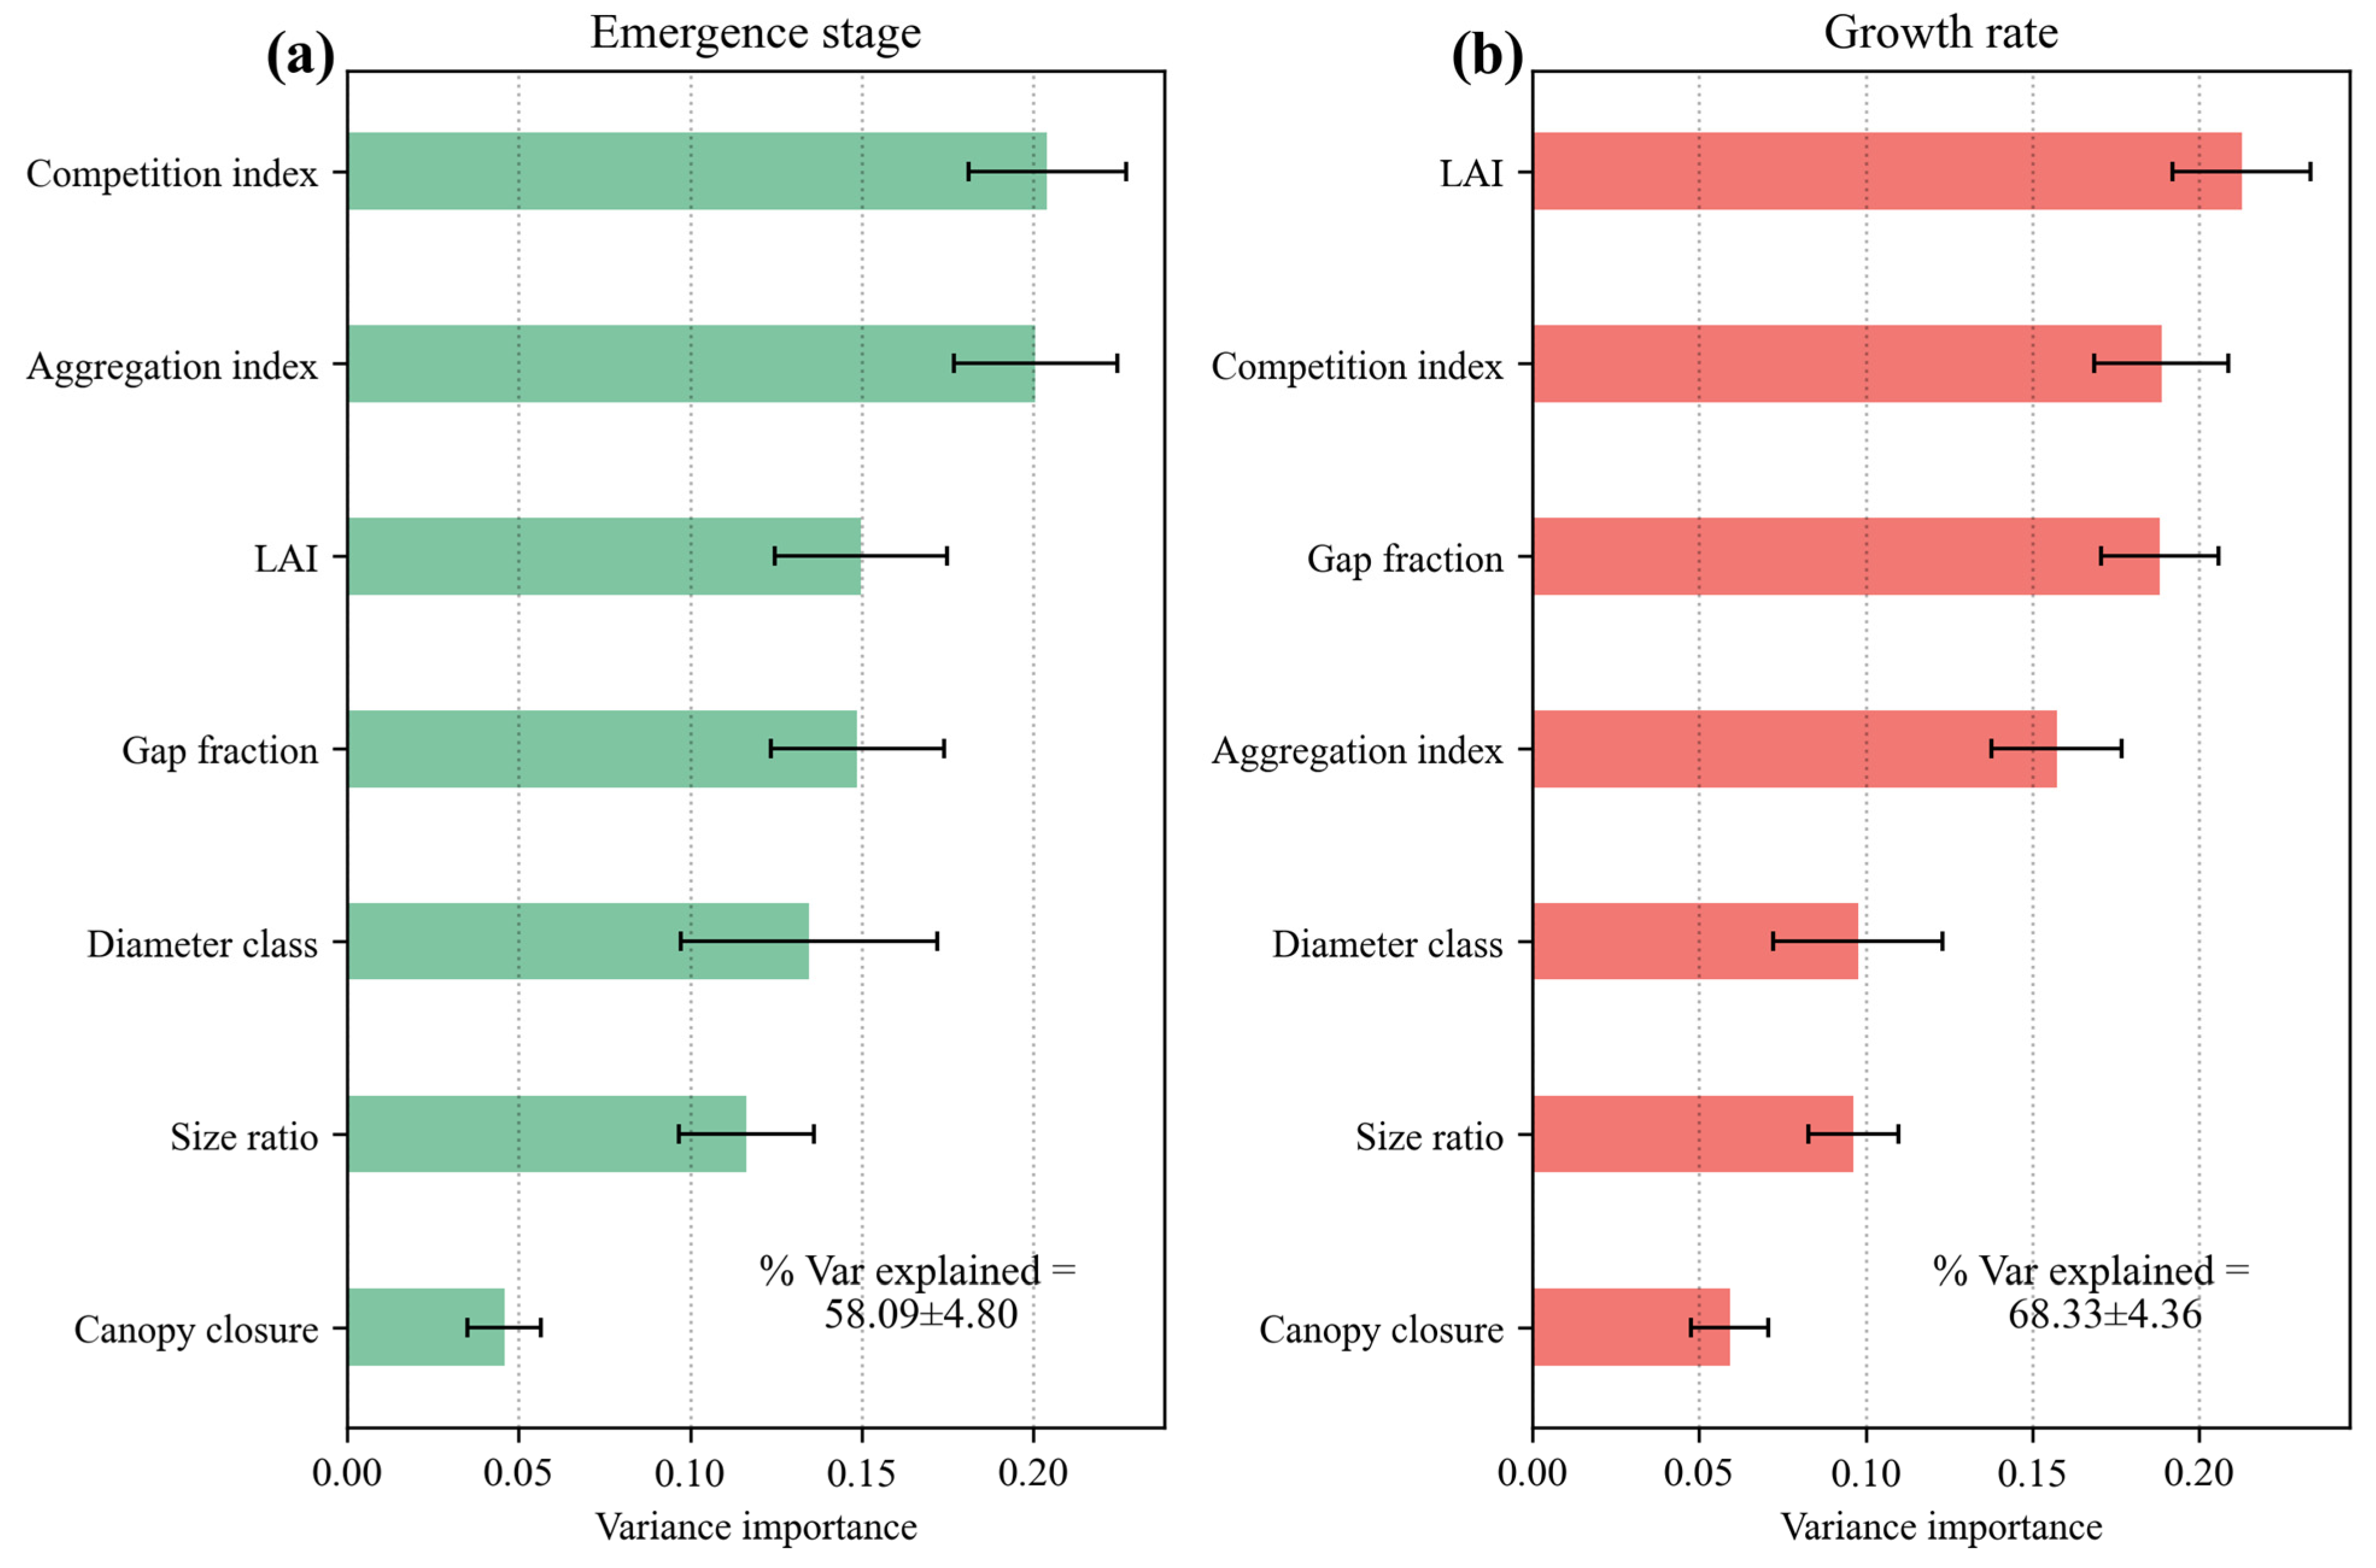
3.2. Results of Indicators Affecting Moso Bamboo Growth Rate

As shown in Figure 6, the Monte Carlo simulation, given the parameter distributions and model assumptions, estimated the mean bamboo shoot growth rate at 0.276 m day−1. The 95% confidence interval was [0.255, 0.302], relatively narrow, suggesting high precision. However, the interval still reflects inherent uncertainty in the model’s prediction.
The sensitivity analysis was employed to rank the relative importance of seven input indicators influencing bamboo shoot growth rate (Table 4). LAI (mu_star = 0.92) exhibited the strongest influence, indicating its important contribution to growth rate variation. This is supported by the narrow confidence interval [0.80, 1.04], suggesting high confidence in this ranking. CI (mu_star = 0.65) also showed a substantial influence, although in the opposite direction. GF (mu_star = 0.68) and R (mu_star = 0.55) demonstrated moderate influence. Other indicators had minimal impact on bamboo shoot growth rate.

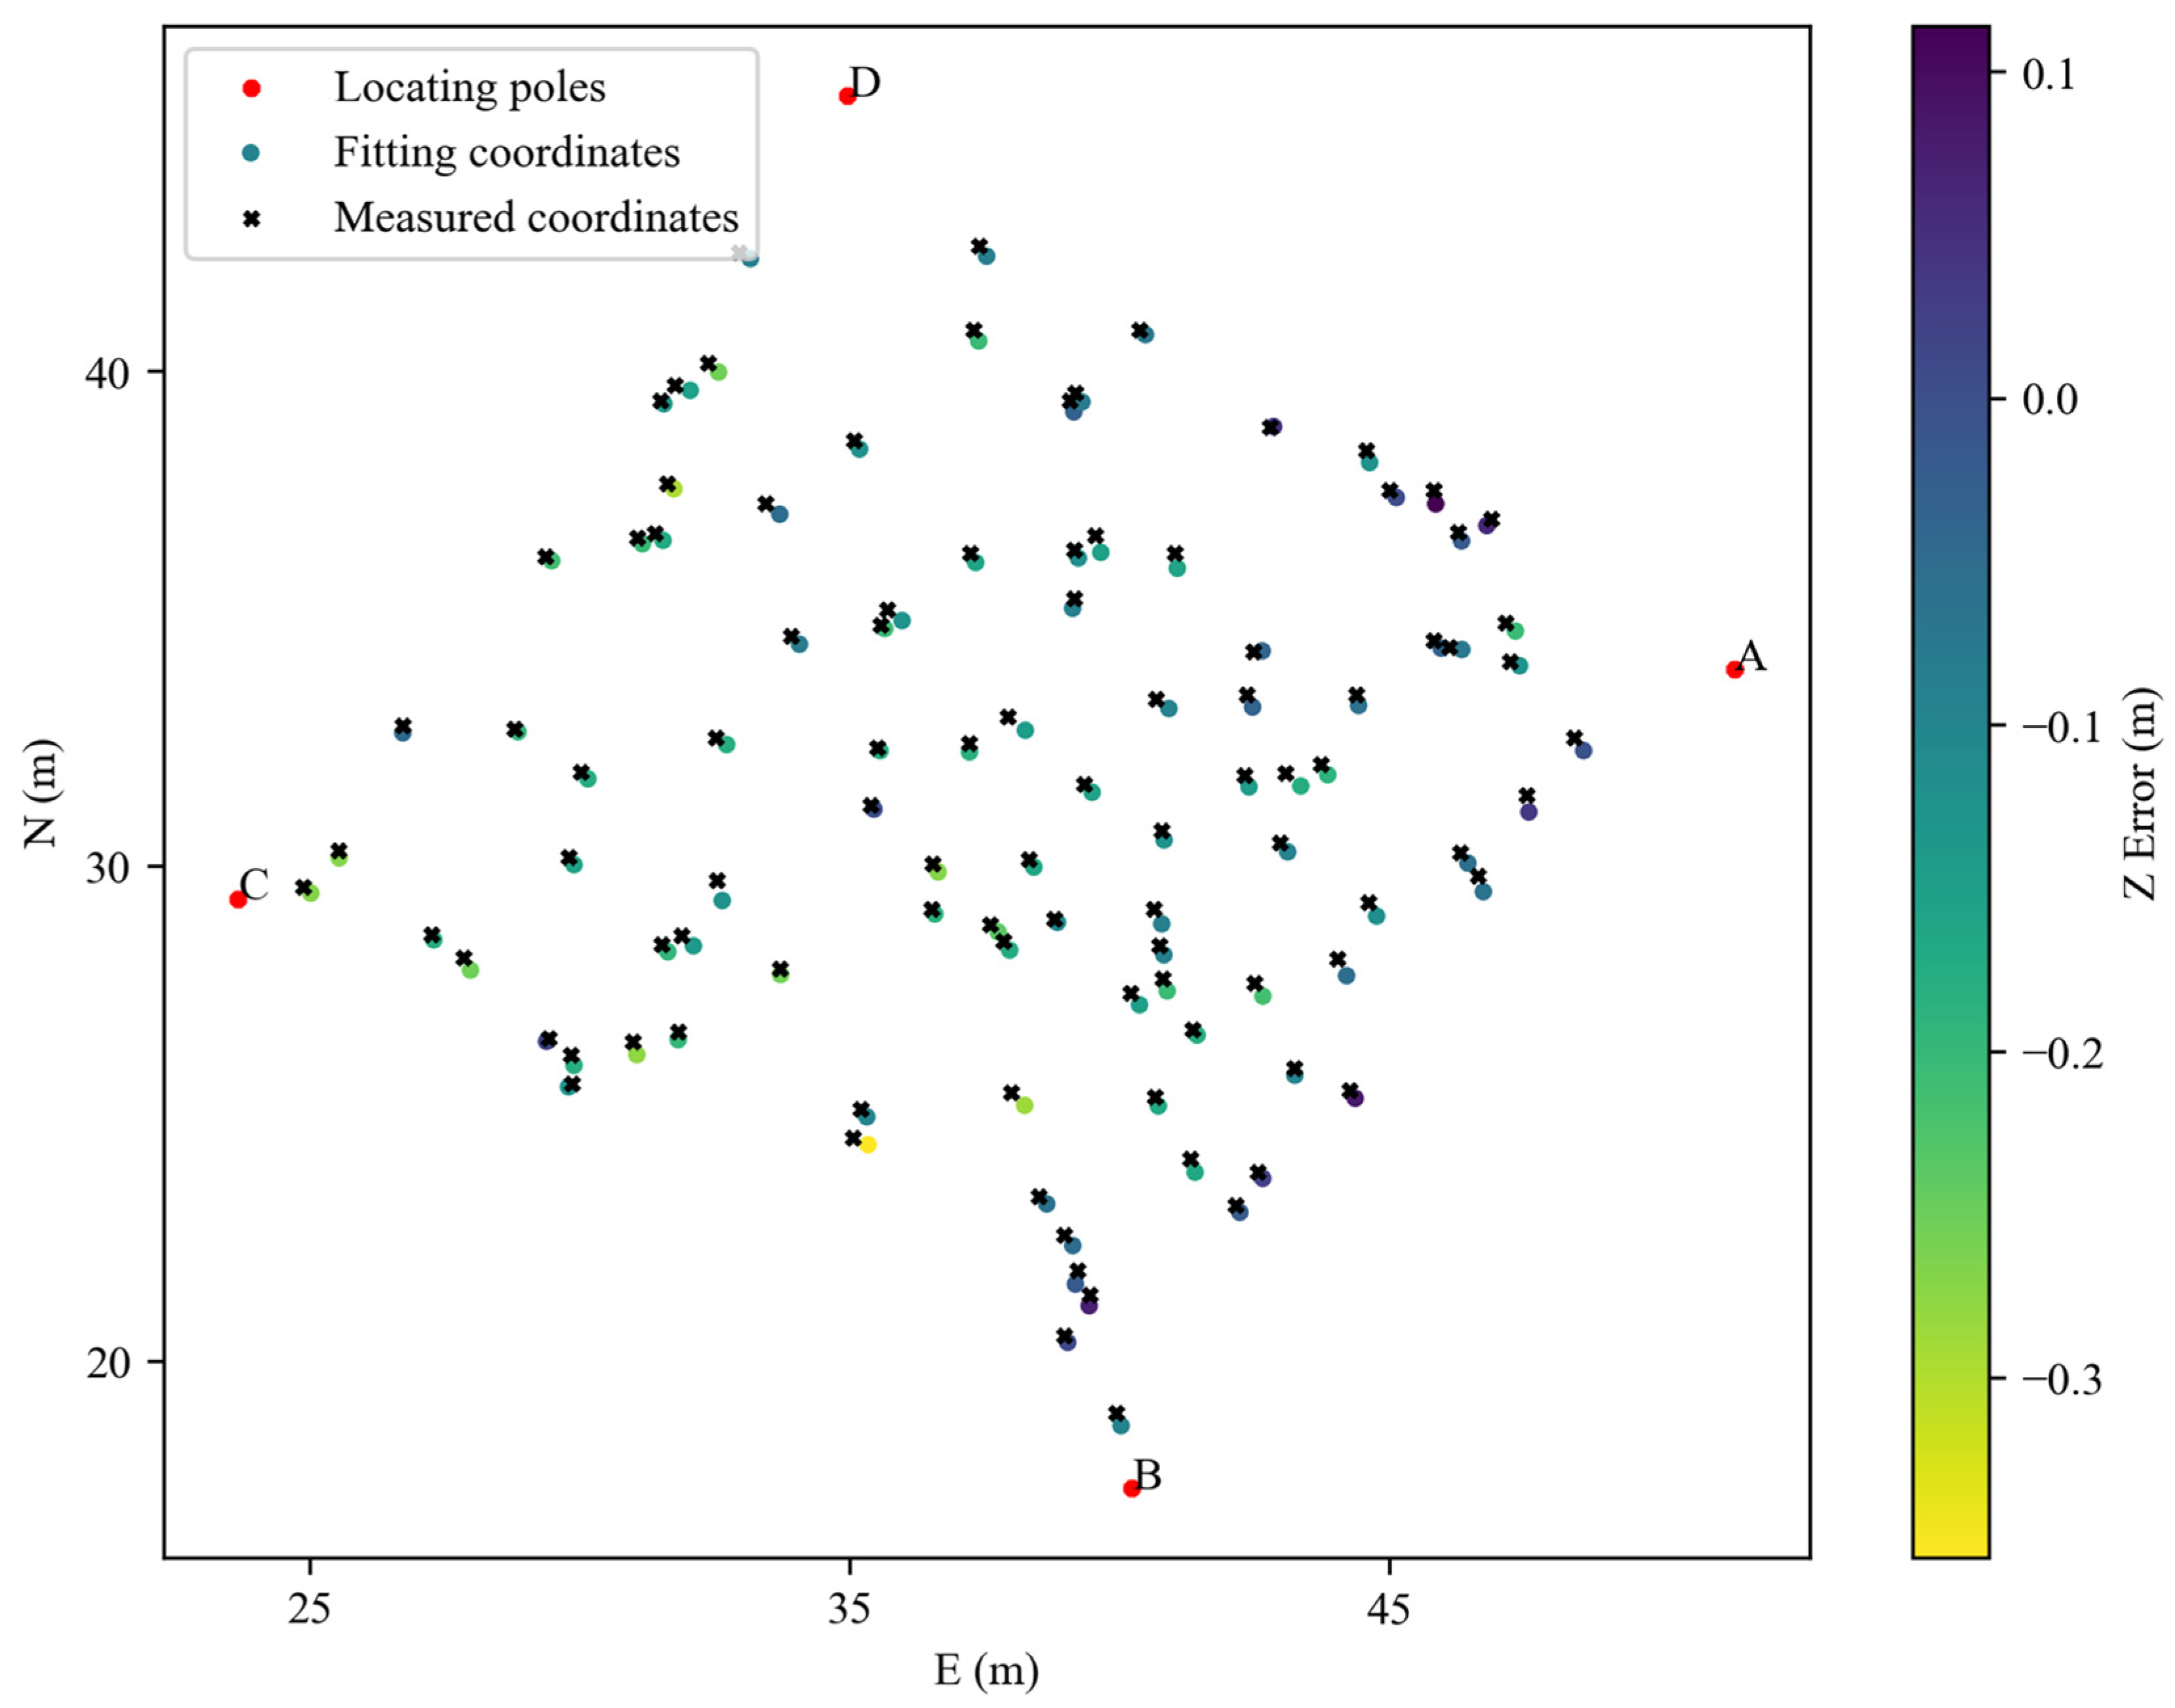
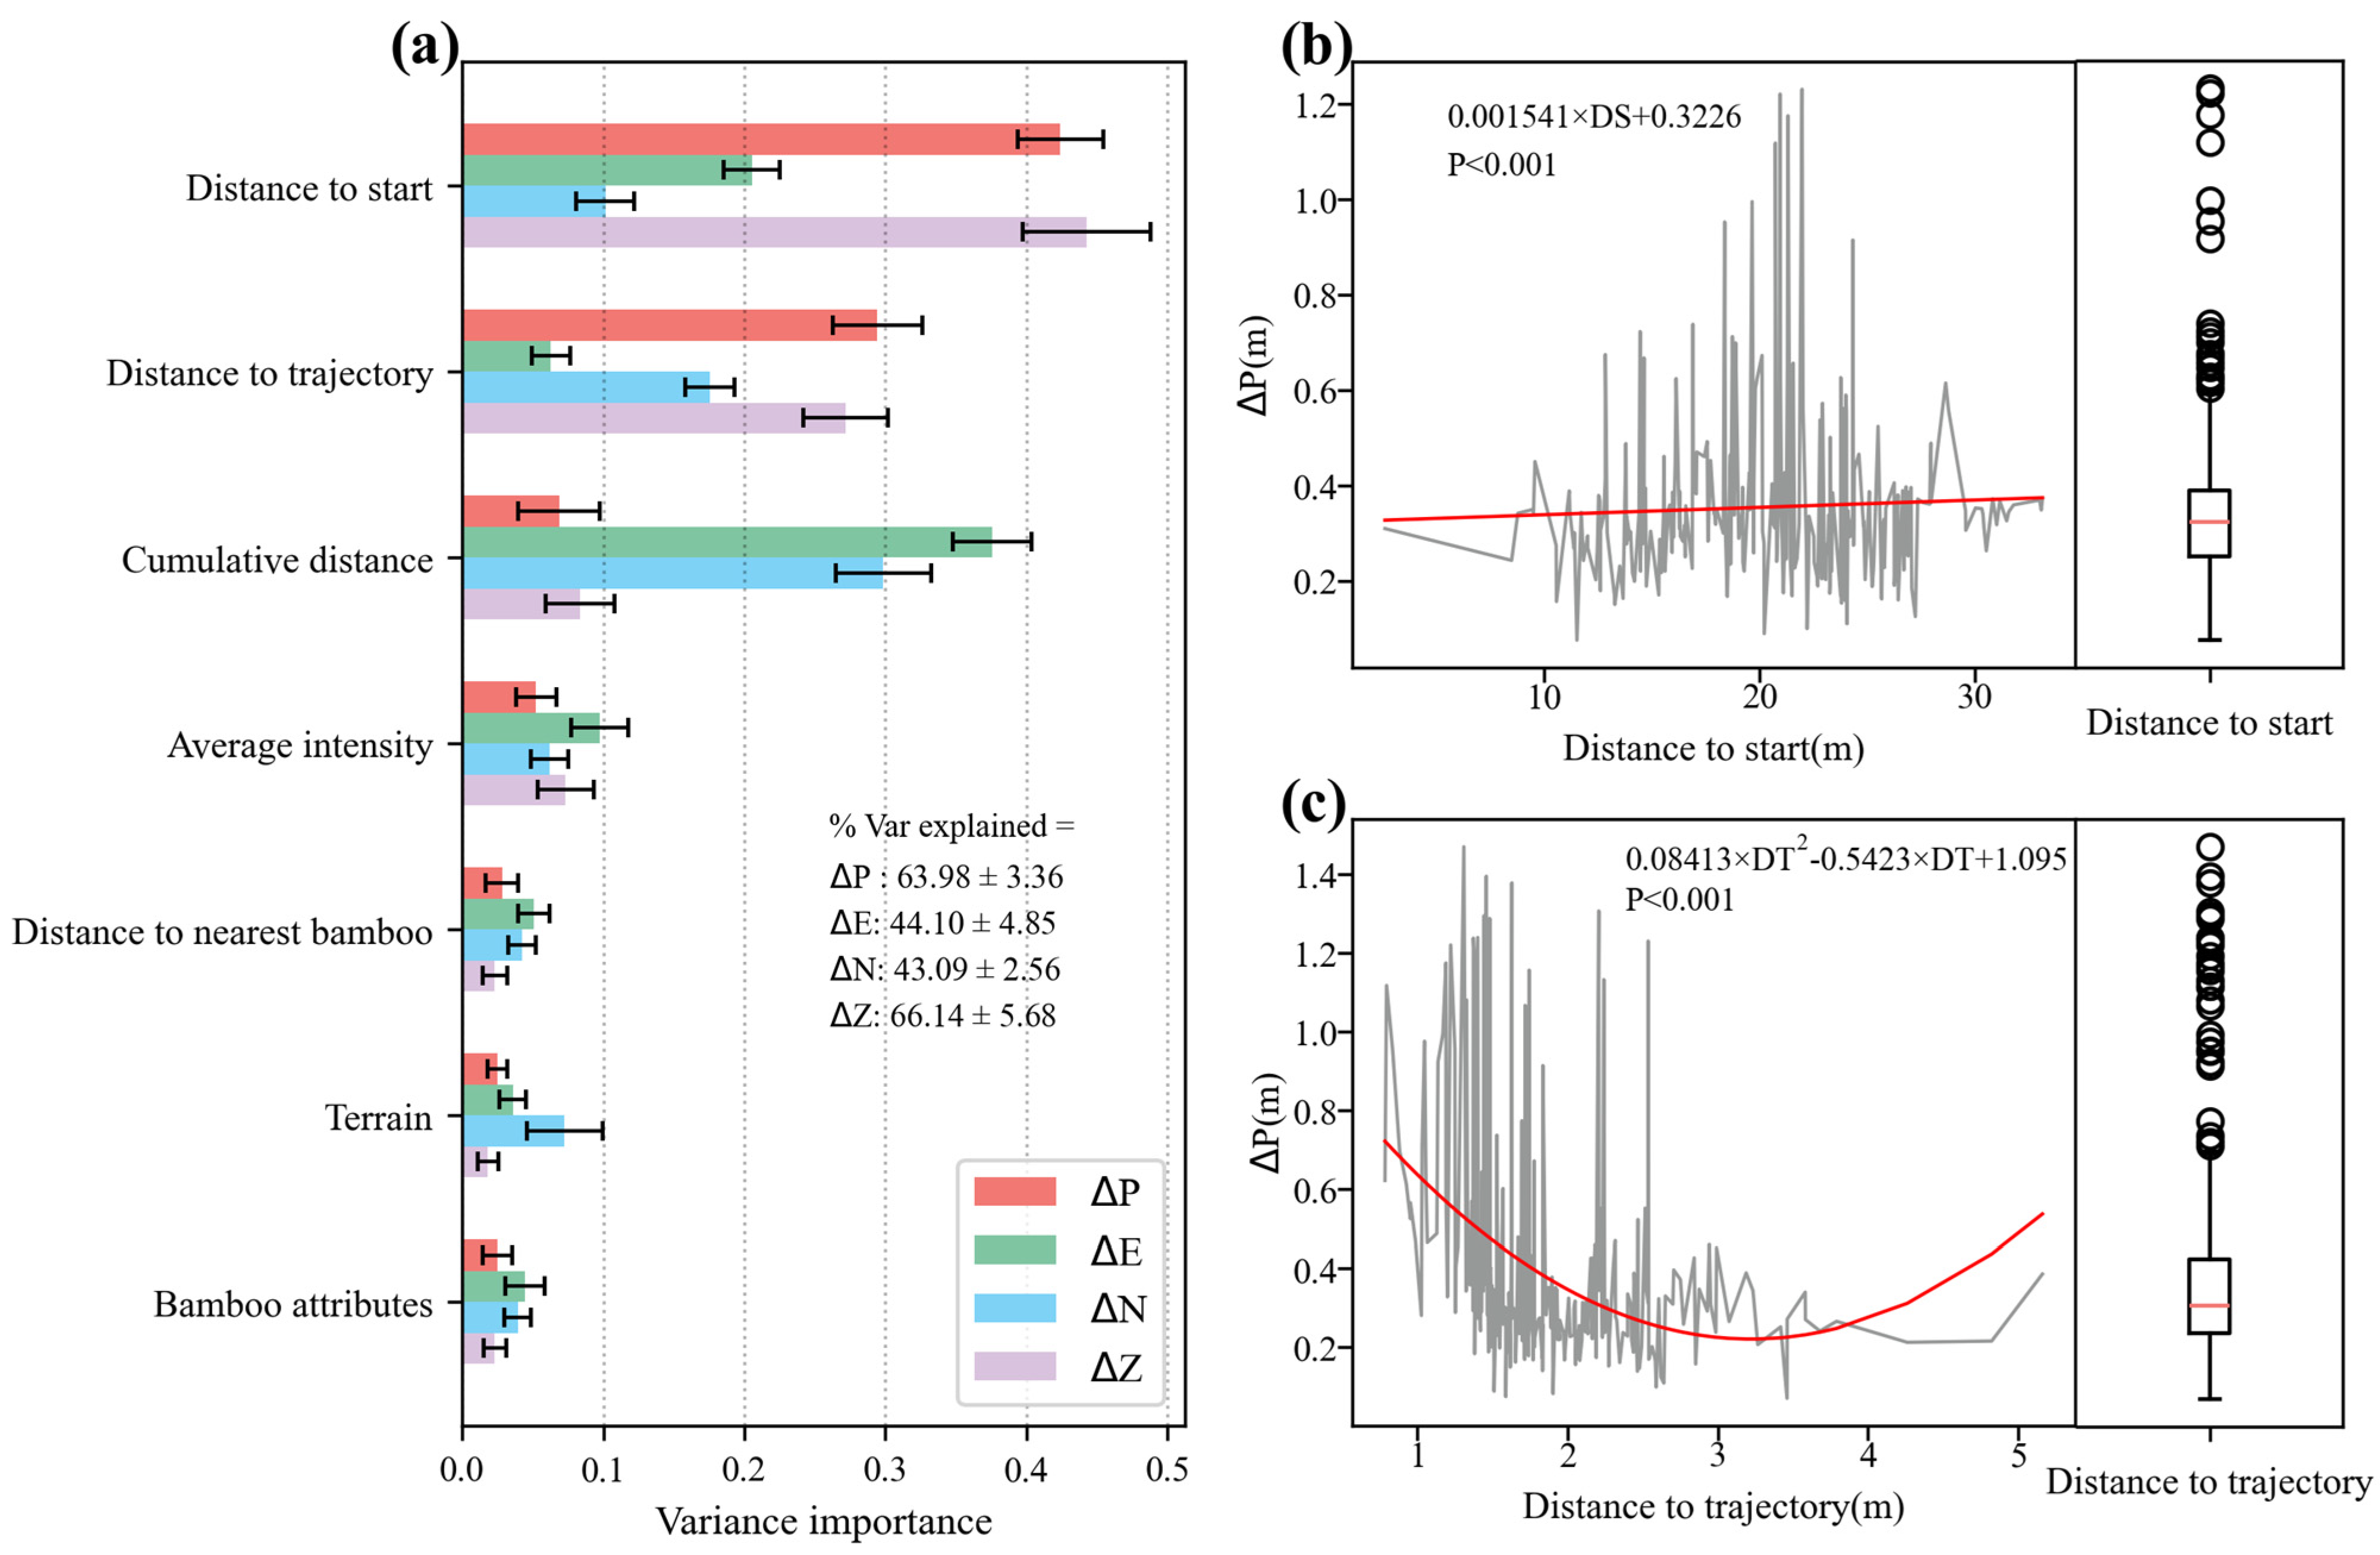
3.3. Positioning Error Derived from BLS Extraction

In the course of the study, BLS used SLAM technology to process the original point cloud data and high-precision inertial measurement unit data. Due to the lack of satellite positioning signals in the forest area, the point cloud coordinates were not real-world coordinates. In this study, based on real-world coordinates of the reference poles in each plot, the point cloud of the plot was transformed, and the results of the transformation are shown in Figure 7. Generally speaking, the north coordinate (N) of the bamboo extracted from BLS data was less than the measured N, and most of the east coordinates (E) were greater than the measured E. The average error of the plane coordinates was 0.227 m, the minimum was 0.067 m, and the maximum was 0.437 m. The average error of the elevation coordinates was 0.132 m, the minimum was 0.004 m, and the maximum was 0.355 m. According to the bamboo positioning error map, the planar coordinate error of the bamboo near the reference poles was small, which was basically consistent with the measured coordinates. The elevation coordinate error was within ±0.1 m. The bamboo located in the middle of the plot had the largest planar error, especially when the distance between multiple bamboos was small, and the planar error of these bamboos could reach 0.4 m. Larger elevation errors occurred at the BC and AD boundary lines.

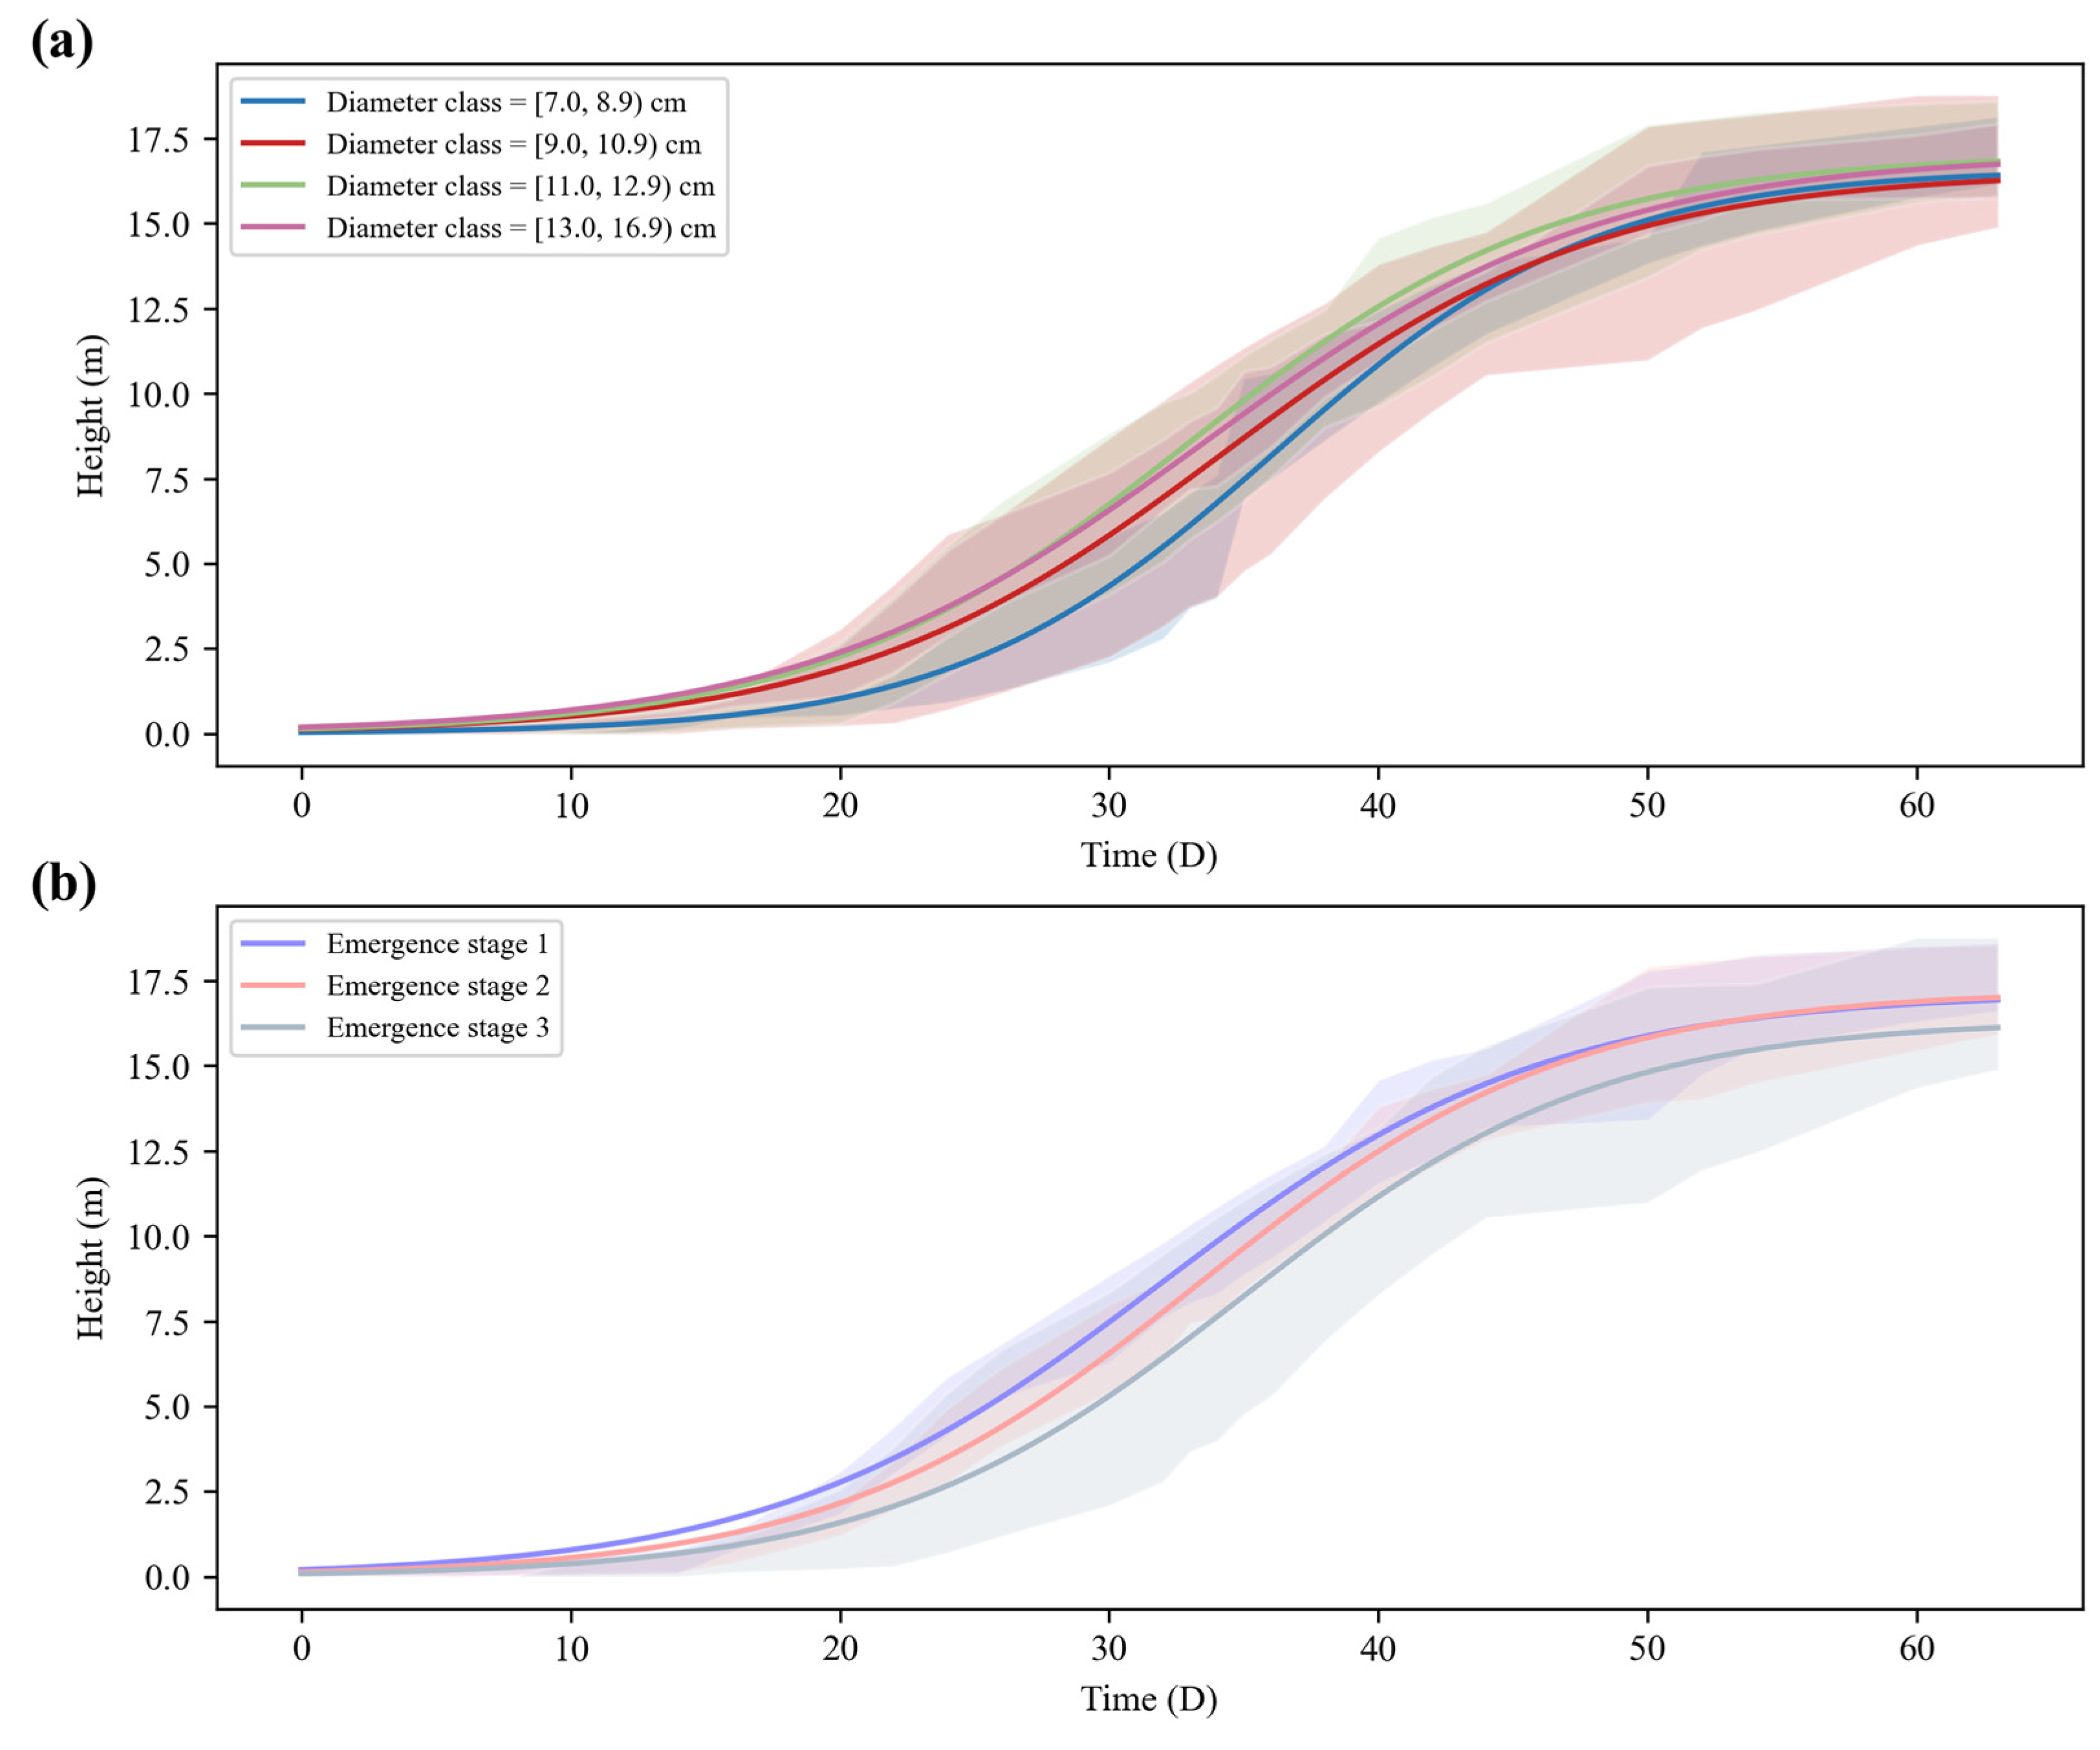
3.4. Height Growth Curves of Shoots with Different Diameter Class

Figure 8 illustrates the height variations of shoots throughout their growth stage, displaying a characteristic S-shaped growth pattern. Within the first 40 days after emergence, the growth rate of the shoots gradually increased, decreasing progressively until it ceased around day 60, at which point no significant changes in height were observed. Figure 8a shows the growth curves of shoots across four different diameter classes as a function of time since emergence, whereas Figure 8b charts these variations for shoots across three different emergence stages, specifically from 22 to 29 March, from 30 March to 5 April, and from 6 to 12 April, for the first, second, and third phases, respectively.
Distinct differences in the heights of shoots from various diameter classes were already evident in the early stages of emergence. Specifically, shoots in the 12 and 14 diameter classes were significantly taller than those in the 10 and 8 diameter classes, with the 10 diameter class shoots notably taller than those in the 8 diameter class. This disparity persisted for the first 42 days after it emerged. From day 42 until the height stabilization phase, the differences in height among the four diameter classes gradually diminished, yet shoots from the 12 and 14 diameter classes remained the tallest. Contrarily, the final heights of the shoots in the 8 diameter class eventually surpassed those in the 10 diameter class. Throughout the growth period, the maximum growth rate for each diameter class was observed between 30 and 40 days after emergence, with later peak growth rates correlating with increasing diameter class. Moreover, shoots that emerged earlier demonstrated higher growth rates and ultimate heights. Shoots from stage 1 emergence maintained greater heights throughout the growth period compared to those from other stages, with their final heights being similar to those of stage 2, whereas those from stage 3 were the shortest, albeit reaching their peak heights in the shortest duration, possibly due to differential nutrient allocation from the parent bamboo. The peak growth rates for shoots from all three emergence stages occurred consistently between 20 and 35 days after they emerged.

3.5. Result of Spatial Structure of Moso Bamboo Forest on Carbon Storage of Shoots

The effects of the six spatial structure factors on the carbon storage of shoots are shown in Figure 9. The LAI and GF of Moso bamboo forests have obvious influence on the carbon storage of shoots because these parameters directly affect the amount of light and photosynthetically active radiation that reaches the forest floor. A higher LAI and lower GF can result in more shading and reduced light availability, limiting the growth and photosynthetic efficiency of shoots, thus reducing their carbon storage. On the other hand, CC has a relatively smaller impact on the carbon storage of shoots because it is a more general measure of forest structure and does not directly relate to the light environment. CC only indicates the proportion of the sky that is blocked by the forest canopy, but it does not provide information on the distribution and intensity of light within the canopy. Therefore, while CC can influence the overall light environment of a forest, it is not as directly related to the growth and carbon storage of shoots as LAI and GF are.

4. Discussion

4.1. The Application of BLS in Extracting Bamboo Height and DBH

The accuracy of height extraction in this study (RMSE = 0.748 m) surpasses that of previous studies [32,46] using BLS for extracting the height of other tree species (RMSE = 1.38–3.12 m). This can be attributed to the fact that the canopy structure of an arbor forest is more complex than that of a Moso bamboo forest [62]. The tree forest canopy is typically composed of more branches and treetops, presenting more levels and variations in space, whereas the canopy of a Moso bamboo forest tends to be upright and regularly arranged. As previously mentioned, the height of Moso bamboo extracted in this study was the vertical height (maximum elevation minus the minimum), and some information about the top of such bamboo is missing in the BLS data, resulting in extracted heights being less than the actual height. Notably, there were also instances where the extracted height was greater than the actual height. The key reason for this was that the top branches of the bamboo stem were taken as the maximum height of the bamboo. Future research will separate the point cloud of the Moso bamboo to minimize their impact on the true height of the Moso bamboo.
During different growth stages of shoots, there were no significant differences in the accuracy of DBH extraction from BLS data (as shown in Figure 10). This confirms that the OLSFC algorithm can be applied to Moso bamboo in various diameter classes. In plot 4, longitudinal extraction of DBH point clouds revealed irregular boundaries in shoots exhibiting curvature in the breast height region. This resulted in large discrepancies between OLSFC-estimated and measured DBH, increasing with DBH [50]. This situation was rare or absent in other plots. In contrast, tree species with larger volumes can obtain DBH directly based on the LSFC [63]. The possible reason for this could be the influence of the relative precision of BLS data processing. When BLS collects data on tree species with larger DBH, the calculated DBH point cloud is only distributed near the trunk cross-sectional curve, ensuring that the cross-sectional curve at the tree DBH is consistent with the actual situation. From Figure 10, it was found that the RMSE of DBH fluctuated around 0.8 cm during the growth process of shoots, with a small standard deviation. The primary reason was that the Moso bamboo stem is close to a cylinder and fits a circle to the point cloud at the breast height of Moso bamboo, which yielded good results. Additionally, multiple closed loops were in the collection trajectory, ensuring the completeness of the calculated Moso bamboo point cloud stem. This suggests that a complete breast-height point cloud and the optimal fitting method are key factors for accurately extracting DBH [50,63].

4.2. Influence of Moso Bamboo Size and Collection Trajectory on Location

Based on the random forest algorithm, an explanatory variable model was established for the parameters in Table 3 and the positioning error of Moso bamboo, as shown in Figure 11. The random forest model explained 63.98 ± 3.36% of the variation in ΔP. Moreover, the result of cross-validation revealed that the first two variables had the highest importance for ΔP. The DS had the highest importance for ΔP (42.41 ± 3.06%), followed by the DT (29.44 ± 3.19%).
DS and DT had a significant influence on ΔP. As the DS increased, ΔP also significantly increased (p < 0.001, as shown in Figure 11b). The number of satellites locked at the initialization of BLS was the highest during the collection process, and ΔP was the smallest. This can explain why the Moso bamboo closer to the start of the trajectory had higher positioning accuracy. However, the positioning accuracy of Moso bamboo 30 m from the beginning of the trajectory was similar. This was because after BLS collection finishes, it still needs to walk in a figure-eight pattern and stand still for one minute to complete data transmission. At this time, BLS is still in the data collection state, so the farthest distance from the start can still achieve relatively high positioning accuracy. In this study, the sample plot area was small, and the maximum positioning error was 1.25 m. When using BLS to extract tree positions in a larger area, the maximum positioning error is 7.5 m [51], which is much larger than the crown diameter of a single tree, seriously affecting subsequent studies of forest patterns, inter-specific association, and density effects. In summary, when the plot area is larger, one should investigate in advance whether there are open areas around the plot (such as roads, squares, etc.). This is beneficial for determining the location and number of the starting points of the collection trajectory based on the number and area of open areas, maximizing the number and strength of Global Navigation Satellite System signals, and reducing the impact of position offset caused by trees in the plot being too far from the starting point. At the same time, placing reference objects with high reflectivity on the surface in open areas within the plot and recording their coordinates can further reduce tree coordinate errors by incorporating their coordinates into the computation of the rotation matrix between the BLS coordinate system and the real-world coordinate system.
DT, by directly influencing the quality of the point cloud, emerged as the second most significant indicator affecting ΔP (as shown in Figure 11a). As DT gradually increased, ΔP first decreased and then increased. This was because when the Moso bamboo was too close to the trajectory, the angle resolution of the BLS sensor was limited, leading to a loss or overlap of the point cloud details at the base of the bamboo. Conversely, when the bamboo was further away, the strength of the Moso bamboo echo signal received by the BLS diminished. At this point, the observation angle was smaller, making it challenging to decipher changes in the target bamboo’s position during data collection. The highest location accuracy was achieved with bamboo culms at 2.8–3.3 m from the collection trajectory, reaching 0.23 m. Therefore, before using the BLS for data collection, it is advisable to determine an appropriate collection trajectory based on the distribution of the trees to enhance the accuracy of tree positioning.
ΔP and ΔZ were primarily influenced by the size of DS, while the planar error was mainly affected by the cumulative distance, with DS having a lesser impact on the planar error of Moso bamboo. The primary source of planar error stemmed from the matching of adjacent frames in the SLAM algorithm. When subsequent frames match similar feature points with the previous frame, if any frame undergoes a shift, this error gradually magnifies in subsequent frames and accumulates in the final frame image [64]. This can be optimized by constructing loops and intersecting trajectories in the SLAM calculation process to minimize cumulative error [65]. Simultaneously, when DS is large, or due to the obstruction by other low-lying objects on the ground, it limits the angle and distance resolution of the BLS, leading to a sparser point cloud at the base of the Moso bamboo, making it challenging to determine the correct ground point coordinates. Furthermore, the ground point cloud obtained from ground filtering contains some point cloud at the base of the Moso bamboo, which significantly affects the elevation value of the bamboo positioning point. Therefore, it is necessary to improve the ground filtering methods in future research to enhance the elevation accuracy of Moso bamboo further.

4.3. Effect of Spatial Structure of Moso Bamboo Forest on Growth of Shoots

The community spatial structure is the result of interactions between plants and their environment, and it also exerts certain influences on plant growth [66]. This study selected six spatial structure parameters and diameter class as input features for the random forest model, with the average growth rate of shoots and the emergence stage as the target features. After 100 random samplings, the importance of each input feature is shown in Figure 12. The CI and R are the main indicators affecting the emergence stage of shoots. The CI represents the degree of competition between the target shoot and the surrounding Moso bamboo and shoots. When competition is intense, shoots may require a longer time to emerge. R reflects the distribution of the target shoot and the surrounding bamboo and shoots. A higher R may be related to the earlier emergence of shoots. Furthermore, regardless of the values of R and the CI in this study, stages 1–3 all occurred, with stage 2 having the highest proportion (55%–63%). The reason could be that the growth of shoots is more significantly influenced by environmental conditions (such as light, temperature, soil, etc.) and genes [67]. LAI has the greatest impact on the growth rate of shoots, as the size of the LAI can represent the moisture content of the soil near the ground surface. The larger the LAI, the higher the average growth rate. The CI is positively related to the average growth rate of shoots, possibly due to increased pressure from surrounding shoots, causing the shoots to exhibit faster growth rates to obtain more resources. In the emergence stage and growth rate, the importance of CC and the diameter class is minimal, indicating that the growth process of shoots is mainly affected by external environmental factors, with less influence from the shoots themselves. It is worth noting that when two shoots grow on the same maternal bamboo, their emergence times are close. When the height of the shoots is less than 3 m, the heights of the two shoots are similar. When exceeding 3 m, the shoot closer to the maternal bamboo grows faster. Ultimately, the two shoots have similar heights, but the shoot closer to the maternal bamboo has a slightly larger DBH, possibly because the maternal bamboo prioritizes supplying nutrients to the shoot at the closer.
This study demonstrates that shoot growth potential increases with increasing DBH [17,68]. In addition to the significant influence of the number of surrounding bamboo culms on emergence time, the distance to a water source is also a crucial indicator, with shoots emerging earlier when closer to a water source [69]. In the rapid growth period, the shoot growth rate is primarily affected by competition from surrounding bamboo and other shoots, with more intense competition resulting in a slower growth rate. Notably, soil moisture content at the surface significantly promotes shoot growth rate, likely due to the fact that adequate water supply can stimulate cell division and growth in shoots [70]. Future research should further investigate the impact of these indicators on different growth stages of shoots and explore methods to enhance shoot yield.

5. Conclusions

BLS can quickly obtain spatial and non-spatial structural information of plots, effectively saving field data collection time. However, there is a significant offset in the point cloud at the breast height of Moso bamboo, and the direct-fitting DBH accuracy is low. Therefore, this study proposes an optimization method based on point cloud echo intensity and spatial distribution. The final fitting RMSE was between 0.51 and 0.96 cm, significantly improving the extraction accuracy of the DBH. The positioning error of Moso bamboo had a strong correlation with DS and DT and a weaker correlation with terrain indicators and the properties of Moso bamboo itself. The above analysis shows that setting multiple collection trajectory starts and optimizing the collection trajectory can reduce the positioning error of BLS data. Although the CI and R significantly influence the emergence stage of shoots, they are more greatly influenced by environmental conditions. The LAI, which represents the moisture content of the soil near the ground surface, was positively correlated with the growth rate of shoots. Meanwhile, when the CI increased, the growth rate of shoots also increased. The similarity in the ranking of importance of the six spatial structures for both the growth rate and carbon storage of shoots can be attributed to the close relationship between these processes and the availability of light and photosynthetically active radiation in the forest, as they directly affect the amount of light reaching the forest floor and the shoots. In conclusion, this study validates the feasibility of using BLS to monitor shoot growth, reveals the influence of bamboo forest spatial structure on shoot growth, and enhances the accuracy of bamboo DBH extraction. These findings are beneficial for future expansion of BLS monitoring applications and optimization of bamboo DBH calculation methods.

Author Contributions

C.L. (Chen Li), writing—original draft, data curation, methodology, software, validation, visualization; C.L. (Chong Li), writing—editing, formal analysis; C.P. and Y.Y., writing—review and editing; G.Z., writing—review and editing, conceptualization, funding acquisition, supervision, project administration; Y.Z., data curation; J.S., data curation. All authors have read and agreed to the published version of the manuscript.

Funding

The present research obtained support from the “Pioneer” and “Leading Goose” R&D Program of Zhejiang (2022C03039), the National Natural Science Foundation of China (grant number: 32401573).

Data Availability Statement

The data supporting this study’s findings are available from the corresponding author.

Conflicts of Interest

The authors declare no conflict of interest.

References

  1. Fernández-Martínez, M.; Vicca, S.; Janssens, I.A.; Sardans, J.; Luyssaert, S.; Campioli, M.; Chapin Iii, F.S.; Ciais, P.; Malhi, Y.; Obersteiner, M.; et al. Nutrient availability as the key regulator of global forest carbon balance. Nat. Clim. Change 2014, 4, 471–476. [Google Scholar] [CrossRef]
  2. Pecl, G.T.; Araújo, M.B.; Bell, J.D.; Blanchard, J.; Bonebrake, T.C.; Chen, I.C.; Clark, T.D.; Colwell, R.K.; Danielsen, F.; Evengård, B.; et al. Biodiversity redistribution under climate change: Impacts on ecosystems and human well-being. Science 2017, 355, eaai9214. [Google Scholar] [CrossRef]
  3. Lee, H.; Calvin, K.; Dasgupta, D.; Krinner, G.; Mukherji, A.; Thorne, P.; Trisos, C.; Romero, J.; Aldunce, P.; Barret, K. IPCC, 2023: Climate Change 2023: Synthesis Report, Summary for Policymakers. Contribution of Working Groups I, II and III to the Sixth Assessment Report of the Intergovernmental Panel on Climate Change; Core Writing Team, Lee, H., Romero, J., Eds.; IPCC: Geneva, Switzerland, 2023. [Google Scholar] [CrossRef]
  4. Bennedsen, M.; Hillebrand, E.; Koopman, S.J. A statistical model of the global carbon budget. Creat. Res. Pap. 2020, 22, 18986. [Google Scholar] [CrossRef]
  5. Mo, L.; Zohner, C.M.; Reich, P.B.; Liang, J.; Miguel, S.; Nabuurs, G.-J.; Renner, S.S.; van den Hoogen, J.; Araza, A.; Herold, M.; et al. Integrated global assessment of the natural forest carbon potential. Nature 2023, 624, 92–101. [Google Scholar] [CrossRef]
  6. Xiaoqing, Z.; Yijuan, W.; Liwei, L.; Yongcheng, X. On China’s Discourse Power and Corresponding Promotion Strategies in the Global Carbon Sequestration Market. J. Poyang Lake 2015, 5, 48–59. [Google Scholar] [CrossRef]
  7. Song, X.; Zhou, G.; Jiang, H.; Yu, S.; Fu, J.; Li, W.-Z.; Wang, W.; Ma, Z.; Peng, C. Carbon sequestration by Chinese bamboo forests and their ecological benefits: Assessment of potential, problems, and future challenges. Environ. Rev. 2011, 19, 418–428. [Google Scholar] [CrossRef]
  8. Düking, R.; Gielis, J.; Liese, W. Carbon Flux and Carbon Stock in a Bamboo Stand and their Relevance for Mitigating Climate Change. J. Am. Bamboo Soc. 2011, 24, 1–7. [Google Scholar]
  9. Pan, C.; Zhou, G.; Shrestha, A.K.; Chen, J.; Kozak, R.; Li, N.; Li, J.; He, Y.; Sheng, C.; Wang, G. Bamboo as a Nature-Based So-lution (NbS) for Climate Change Mitigation: Biomass, Products, and Carbon Credits. Climate 2023, 11, 175. [Google Scholar] [CrossRef]
  10. Yuen, J.Q.; Fung, T.; Ziegler, A.D. Carbon stocks in bamboo ecosystems worldwide: Estimates and uncertainties. For. Ecol. Manag. 2017, 393, 113–138. [Google Scholar] [CrossRef]
  11. Fu, J. Chinese Moso Bamboo: Its importance. Bamboo 2000, 22, 5–7. [Google Scholar]
  12. Zell, J. Climate Sensitive Tree Growth Functions and the Role of Transformations. Forests. 2018, 9, 382. [Google Scholar] [CrossRef]
  13. Ming, C.; Ye, J.; Zishan, A.; Zengfang, Y.; Yulong, D.; Feng, Q.; Jijun, Y.; Jinfang, C.; Qiang, W. Multi-analysis of sheath senes-cence provides new insights into bamboo shoot development at the fast growth stage. Tree Physiol. 2021, 41, 491–507. [Google Scholar] [CrossRef]
  14. Tao, G.-Y.; Ramakrishnan, M.; Vinod, K.K.; Yrjl, K.; Fu, Y. Multi-omics analysis of cellular pathways involved in different rapid growth stages of moso bamboo. Tree Physiol. 2020, 40, 1487–1508. [Google Scholar] [CrossRef]
  15. Zhou, X.; Guan, F.; Zhang, X.; Li, C.; Zhou, Y. Response of Moso Bamboo Growth and Soil Nutrient Content to Strip Cutting. Forests 2022, 13, 1293. [Google Scholar] [CrossRef]
  16. Sun, H.; Li, Q.; Lei, Z.; Zhang, J.; Song, X.; Song, X. Ecological stoichiometry of nitrogen and phosphorus in Moso bamboo (Phyllostachys edulis) during the explosive growth period of new emergent shoots. J. Plant Res. 2019, 132, 107–115. [Google Scholar] [CrossRef]
  17. Yen, T.-M. Culm height development, biomass accumulation and carbon storage in an initial growth stage for a fast-growing moso bamboo (Phyllostachy pubescens). Bot. Stud. 2016, 57, 10. [Google Scholar] [CrossRef]
  18. Shen, C.; Feng, Z.; Chen, P.; Chen, S.; Ullah, T. Research and evaluation of growth rate model for native chinese moso bam-boo. Appl. Ecol. Env. Res. 2020, 18, 1459–1470. [Google Scholar] [CrossRef]
  19. Zhang, T.; Yan, Q.; Wang, J.; Zhu, J. Restoring temperate secondary forests by promoting sprout regeneration: Effects of gap size and within-gap position on the photosynthesis and growth of stump sprouts with contrasting shade tolerance. For. Ecol. Manag. 2018, 429, 267–277. [Google Scholar] [CrossRef]
  20. Downey, M.; Valkonen, S.; Heikkinen, J. Natural tree regeneration and vegetation dynamics across harvest gaps in Norway spruce dominated forests in southern Finland. Can. J. For. Res. 2018, 48, 524–534. [Google Scholar] [CrossRef]
  21. Galvão, L.S.; Breunig, F.M.; Santos, J.R.D.; Moura, Y.M.D. View-illumination effects on hyperspectral vegetation indices in the Amazonian tropical forest. Int. J. Appl. Earth Obs. Geoinf. 2013, 21, 291–300. [Google Scholar] [CrossRef]
  22. Jin, S.; Sun, X.; Wu, F.; Su, Y.; Li, Y.; Song, S.; Xu, K.; Ma, Q.; Baret, F.; Jiang, D.; et al. Lidar sheds new light on plant phenomics for plant breeding and management: Recent advances and future prospects. ISPRS J. Photogramm. Remote Sens. 2021, 171, 202–223. [Google Scholar] [CrossRef]
  23. Li, A.; Glenn, N.F.; Olsoy, P.J.; Mitchell, J.J.; Shrestha, R. Aboveground biomass estimates of sagebrush using terrestrial and airborne LiDAR data in a dryland ecosystem. Agr. For. Meteorol. 2015, 213, 138–147. [Google Scholar] [CrossRef]
  24. Korpela, I.; Hovi, A.; Morsdorf, F. Understory trees in airborne LiDAR data—Selective mapping due to transmission losses and echo-triggering mechanisms. Remote Sens. Environ. 2012, 119, 92–104. [Google Scholar] [CrossRef]
  25. Cao, L.; Coops, N.C.; Sun, Y.; Ruan, H.; She, G. Estimating canopy structure and biomass in bamboo forests using airborne LiDAR data. ISPRS J. Photogramm. Remote Sens. 2019, 148, 114–129. [Google Scholar] [CrossRef]
  26. Li, W.; Niu, Z.; Liang, X.; Li, Z.; Huang, N.; Gao, S.; Wang, C.; Muhammad, S. Geostatistical modeling using LiDAR-derived prior knowledge with SPOT-6 data to estimate temperate forest canopy cover and above-ground biomass via stratified ran-dom sampling. Int. J. Appl. Earth Obs. Geoinf. 2015, 41, 88–98. [Google Scholar] [CrossRef]
  27. Jiang, R.; Lin, J.; Li, T. Refined Aboveground Biomass Estimation of Moso Bamboo Forest Using Culm Lengths Extracted from TLS Point Cloud. Remote Sens. 2022, 14, 5537. [Google Scholar] [CrossRef]
  28. Liang, D.; Zhang, C.; Zhang, P.; Liu, S.; Li, H.; Niu, S.; Rao, R.Z.; Zhao, L.; Chen, X.; Li, H.; et al. Evolution of laser technology for automotive LiDAR, an industrial viewpoint. Nat. Commun. 2024, 15, 7660. [Google Scholar] [CrossRef]
  29. Ma, X.; Zhu, K.; Guan, H.; Feng, J.; Yu, S.; Liu, G. Calculation Method for Phenotypic Traits Based on the 3D Reconstruction of Maize Canopies. Sensors 2019, 19, 1201. [Google Scholar] [CrossRef]
  30. Polewski, P.; Yao, W.; Cao, L.; Gao, S. Marker-free co-registration of UAV and backpack LiDAR point clouds in forested areas. ISPRS J. Photogramm. Remote Sens. 2019, 147, 307–318. [Google Scholar] [CrossRef]
  31. Ko, C.; Lee, S.; Yim, J.S.; Kang, J. Comparison of Forest Inventory Methods at Plot-Level between a Backpack Personal Laser Scanning (BPLS) and Conventional Equipment in Jeju Island, South Korea. Forests 2021, 12, 308. [Google Scholar] [CrossRef]
  32. Lu, J.; Wang, H.; Qin, S.; Cao, L.; Pu, R.; Li, G.; Sun, J. Estimation of aboveground biomass of Robinia pseudoacacia forest in the Yellow River Delta based on UAV and Backpack LiDAR point clouds. Int. J. Appl. Earth Obs. Geoinf. 2020, 86, 102014. [Google Scholar] [CrossRef]
  33. Polewski, P.; Erickson, A.; Yao, W.; Coops, N.; Krzystek, P.; Stilla, U. Object-based coregistration of terrestrial photogrammet-ric and ALS point clouds in forested areas. ISPRS Ann. Photogramm. Remote Sens. Spat. Inf. Sci. 2016, III-3, 347–354. [Google Scholar] [CrossRef]
  34. Xie, Y.; Yang, T.; Wang, X.; Chen, X.; Pang, S.; Hu, J.; Wang, A.; Chen, L.; Shen, Z. Applying a Portable Backpack Lidar to Measure and Locate Trees in a Nature Forest Plot: Accuracy and Error Analyses. Remote Sens. 2022, 14, 1806. [Google Scholar] [CrossRef]
  35. Hyyppä, E.; Kukko, A.; Kaijaluoto, R.; White, J.C.; Wulder, M.A.; Pyörälä, J.; Liang, X.; Yu, X.; Wang, Y.; Kaartinen, H.; et al. Accurate derivation of stem curve and volume using backpack mobile laser scanning. ISPRS J. Photogramm. Remote Sens. 2020, 161, 246–262. [Google Scholar] [CrossRef]
  36. Guan, H.; Su, Y.; Hu, T.; Wang, R.; Guo, Q. A Novel Framework to Automatically Fuse Multiplatform LiDAR Data in Forest Environments Based on Tree Locations. IEEE Trans. Geosci. Remote Sens. 2020, 58, 2165–2177. [Google Scholar] [CrossRef]
  37. Ali, A.-S.; Nikolai, C. Error analysis for circle fitting algorithms. Electron. J. Stat. 2009, 3, 886–911. [Google Scholar] [CrossRef]
  38. Raumonen, P.; Kaasalainen, M.; Åkerblom, M.; Kaasalainen, S.; Kaartinen, H.; Vastaranta, M.; Holopainen, M.; Disney, M.; Lewis, P. Fast Automatic Precision Tree Models from Terrestrial Laser Scanner Data. Remote Sens. 2013, 5, 491–520. [Google Scholar] [CrossRef]
  39. Wang, Y.; Lehtomäki, M.; Liang, X.; Pyörälä, J.; Kukko, A.; Jaakkola, A.; Liu, J.; Feng, Z.; Chen, R.; Hyyppä, J. Is field-measured tree height as reliable as believed—A comparison study of tree height estimates from field measurement, airborne laser scanning and terrestrial laser scanning in a boreal forest. ISPRS J. Photogramm. Remote Sens. 2019, 147, 132–145. [Google Scholar] [CrossRef]
  40. Rusu, R.B.; Cousins, S. 3D is here: Point Cloud Library (PCL). In Proceedings of the IEEE International Conference on Robotics and Automation, Shanghai, China, 9–13 May 2011. [Google Scholar] [CrossRef]
  41. Tao, S.; Wu, F.; Guo, Q.; Wang, Y.; Li, W.; Xue, B.; Hu, X.; Li, P.; Tian, D.; Li, C.; et al. Segmenting tree crowns from terrestrial and mobile LiDAR data by exploring ecological theories. ISPRS J. Photogramm. Remote Sens. 2015, 110, 66–76. [Google Scholar] [CrossRef]
  42. Chen, C.; Zhao, N.; Yue, T.; Guo, J. A generalization of inverse distance weighting method via kernel regression and its ap-plication to surface modeling. Arab. J. Geosci. 2015, 8, 6623–6633. [Google Scholar] [CrossRef]
  43. Zhang, R.; Zhou, X.; Ouyang, Z.; Avitabile, V.; Qi, J.; Chen, J.; Giannico, V. Estimating aboveground biomass in subtropical forests of China by integrating multisource remote sensing and ground data. Remote Sens. Environ. 2019, 232, 111341. [Google Scholar] [CrossRef]
  44. Ester, M.; Kriegel, H.-P.; Sander, J.; Xu, X. A Density-Based Algorithm for Discovering Clusters in Large Spatial Databases with Noise. In Proceedings of the Knowledge Discovery and Data Mining, Portland, OR, USA, 2–4 August 1996. [Google Scholar] [CrossRef]
  45. Swayze, N.C.; Tinkham, W.T.; Vogeler, J.C.; Hudak, A.T. Influence of flight parameters on UAS-based monitoring of tree height, diameter, and density. Remote Sens. Environ. 2021, 263, 112540. [Google Scholar] [CrossRef]
  46. Ruhan, A.; Du, W.; Ying, H.; Wei, B.; Shan, Y.; Dai, H. Estimation of Aboveground Biomass of Individual Trees by Backpack LiDAR Based on Parameter-Optimized Quantitative Structural Models (AdQSM). Forests 2023, 14, 475. [Google Scholar] [CrossRef]
  47. O’Rourke, J. Finding minimal enclosing boxes. Int. J. Comput. Inf. Sci. 1985, 14, 183–199. [Google Scholar] [CrossRef]
  48. Shalabi, L.A.A.; Shaaban, Z.; Kasasbeh, B. Data Mining: A Preprocessing Engine. J. Comput. Sci. 2006, 2, 735–739. [Google Scholar] [CrossRef]
  49. Dong, L.; Bettinger, P.; Liu, Z.; Qin, H. A comparison of a neighborhood search technique for forest spatial harvest scheduling problems: A case study of the simulated annealing algorithm. For. Ecol. Manag. 2015, 356, 124–135. [Google Scholar] [CrossRef]
  50. Xie, Y.; Zhang, J.; Chen, X.; Pang, S.; Zeng, H.; Shen, Z. Accuracy assessment and error analysis for diameter at breast height measurement of trees obtained using a novel backpack LiDAR system. For. Ecosyst. 2020, 7, 33. [Google Scholar] [CrossRef]
  51. Qian, C.; Liu, H.; Tang, J.; Chen, Y.; Kaartinen, H.; Kukko, A.; Zhu, L.; Liang, X.; Chen, L.; Hyyppä, J. An Integrated GNSS/INS/LiDAR-SLAM Positioning Method for Highly Accurate Forest Stem Mapping. Remote Sens. 2017, 9, 3. [Google Scholar] [CrossRef]
  52. Pan, L.; Mei, G.; Wang, Y.; Saeed, S.; Chen, L.; Cao, Y.; Sun, Y. Generalized Nonlinear Mixed-Effect Model of Individual TREE Height to Crown Base for Larix Olgensis Henry in Northeast China. J. Sustain. For. 2020, 39, 827–840. [Google Scholar] [CrossRef]
  53. Chen, S.; Jiang, H.; Cai, Z.; Zhou, X.; Peng, C. The response of the net primary production of Moso bamboo forest to the On and Off-year management: A case study in Anji County, Zhejiang, China. For. Ecol. Manag. 2018, 409, 1–7. [Google Scholar] [CrossRef]
  54. Clark, P.J.; Evans, F.C. Distance to Nearest Neighbor as a Measure of Spatial Relationships in Populations. Ecology 1954, 35, 445–453. [Google Scholar] [CrossRef]
  55. Bristow, M.; Vanclay, J.K.; Brooks, L.O.; Hunt, M.A. Growth and Species Interactions of Eucalyptus pellita in a Mixed and Monoculture Plantation in the H. For. Ecol. Manag. 2006, 233, 285–294. [Google Scholar] [CrossRef]
  56. Richardson, J.J.; Moskal, L.M.; Kim, S.H. Modeling approaches to estimate effective leaf area index from aerial discrete-return LIDAR. Agr. For. Meteorol. 2009, 149, 1152–1160. [Google Scholar] [CrossRef]
  57. Ma, Q.; Su, Y.; Guo, Q. Comparison of Canopy Cover Estimations From Airborne LiDAR, Aerial Imagery, and Satellite Imagery. IEEE J.-Stars 2017, 10, 4225–4236. [Google Scholar] [CrossRef]
  58. Li, W.; Migliavacca, M.; Forkel, M.; Denissen, J.M.C.; Reichstein, M.; Yang, H.; Duveiller, G.; Weber, U.; Orth, R. Widespread increasing vegetation sensitivity to soil moisture. Nat. Commun. 2022, 13, 3959. [Google Scholar] [CrossRef]
  59. Ziter, C.D.; Pedersen, E.J.; Kucharik, C.J.; Turner, M.G. Scale-dependent interactions between tree canopy cover and imper-vious surfaces reduce daytime urban heat during summer. Proc. Natl. Acad. Sci. USA 2019, 116, 7575–7580. [Google Scholar] [CrossRef]
  60. Zhou, G. Carbon Storage, Fixation and Distribution in Mao Bamboo (Phyllostachys pubescens) Stands Ecosystem. Ph.D. Thesis, Zhejiang University, Hangzhou, China, 2006. [Google Scholar]
  61. Breiman, L. Random Forests. Mach. Learn. 2001, 45, 5–32. [Google Scholar] [CrossRef]
  62. Gonzalez-Ollauri, A.; Stokes, A.; Mickovski, S.B. A novel framework to study the effect of tree architectural traits on stemflow yield and its consequences for soil-water dynamics. J. Hydrol. 2020, 582, 124448. [Google Scholar] [CrossRef]
  63. Su, Y.J.; Guo, Q.H.; Jin, S.C.; Guan, H.C.; Sun, X.L.; Ma, Q.; Hu, T.Y.; Wang, R.; Li, Y.M. The Development and Evaluation of a Backpack LiDAR System for Accurate and Efficient Forest Inventory. IEEE Geosci. Remote Sens. Lett. 2021, 18, 1660–1664. [Google Scholar] [CrossRef]
  64. Mur-Artal, R.; Tardós, J.D. Visual-Inertial Monocular SLAM with Map Reuse. IEEE Robot. Autom. Let. 2017, 2, 796–803. [Google Scholar] [CrossRef]
  65. Endres, F.; Hess, J.; Sturm, J.; Cremers, D.; Burgard, W. 3-D Mapping with an RGB-D Camera. IEEE Trans. Robot. 2014, 30, 177–187. [Google Scholar] [CrossRef]
  66. Omelko, A.; Ukhvatkina, O.; Zhmerenetsky, A.; Sibirina, L.; Petrenko, T.; Bobrovsky, M. From young to adult trees: How spatial patterns of plants with different life strategies change during age development in an old-growth Korean pine-broadleaved forest. For. Ecol. Manag. 2018, 411, 46–66. [Google Scholar] [CrossRef]
  67. Kumar, A.; Verulkar, S.; Dixit, S.; Chauhan, B.; Bernier, J.; Venuprasad, R.; Zhao, D.; Shrivastava, M.N. Yield and yield-attributing traits of rice (Oryza sativa L.) under lowland drought and suitability of early vigor as a selection criterion. Field Crop Res. 2009, 114, 99–107. [Google Scholar] [CrossRef]
  68. Wang, Q.; Zhang, L.; Gan, X. Adaptability of the structure and biomass of Arundinaria spanostachya clonal populations graz-ing by wild giant pandas. Environ. Sci. Pollut. Res. 2020, 27, 2909–2918. [Google Scholar] [CrossRef]
  69. Xie, J.; Hong, M. Effects of ecological factors on growth of Arundinaria spanostachya shoots in Liziping National Nature Re-serve, China. Glob. Ecol. Conserv. 2020, 23, e01121. [Google Scholar] [CrossRef]
  70. Zhang, L.; Gan, X.; Hou, Z.; Yang, Z.; Zhang, Z. Grazing by wild giant pandas does not affect the regeneration of Arundinaria spanostachya. J. For. Res. 2019, 30, 1513–1520. [Google Scholar] [CrossRef]
Figure 1. Overview of the study area: (a) Zhejiang Province; (b) Lin’an District; (c) location of eight sample plots (the black line indicates the plots range.); (d) sample plots’ situation; and (e) sample plot point cloud data (displayed by height).
Forests 16 00371 g001
Figure 2. Trajectory of collecting BLS data and schematic diagram of Moso bamboo location. (a) The color gradient line indicates the collecting trajectory. (b) Demonstrating the results of Moso bamboo location and measuring coordinates from the uphill position (the red point cloud indicated by the arrow represents the localization point).
Forests 16 00371 g002
Figure 3. Correlation between the height of bamboo and shoots extracted from BLS and the actual height (the orange line is the regression line fitted to the scatter data).
Forests 16 00371 g003
Figure 4. The error between DBH extracted by BLS and measured DBH. (a) The difference between the extracted DBH and the measured DBH before optimization. (b) The difference between the extracted DBH and that after optimization.
Forests 16 00371 g004
Figure 5. Correlation between extracted DBH and measured DBH during the growth process of shoots (the orange line represents the linear regression fit to the scatter data; the dashed line represents the 1:1 goodness-fit-line).
Forests 16 00371 g005
Figure 6. Histogram of growth rates simulated using the Monte Carlo method.
Forests 16 00371 g006
Figure 7. Distribution map of coordinates of Moso bamboo extracted by BLS and measured coordinates.
Forests 16 00371 g007
Figure 8. Fitting curve of shoot growth: (a) the growth curves of shoots with different diameter class; (b) the growth curve of shoots at different emergence stages.
Forests 16 00371 g008
Figure 9. The result of the ranking of the importance of six spatial structures on the carbon storage of shoots where the error bars represent the standard deviation of the output from the random forest model.
Forests 16 00371 g009
Figure 10. The distribution of RMSE for the DBH during the growth period of shoots in sample plots (the circles in the figure represent outliers in the data).
Forests 16 00371 g010
Figure 11. Results of the random forest model for ΔE, ΔN, ΔH, and ΔP. (a) Relative importance of variables, where the error bars represent the standard deviation of the output from the random forest model constructed by randomly drawing 80% of the samples 100 times. (b) The relationship between DS and ΔP, with the red line representing the fitted curve and the box plot indicating the distribution of ΔP. (c) The relationship between DT and ΔP, with the red line representing the fitted curve and the box plot indicating the distribution of ΔP.
Forests 16 00371 g011
Figure 12. Results of the random forest model for the emergence stage and average growth rate of shoots. (a) The relative importance of variables for the emergence stage of shoots, where the error bars represent the standard deviation of the output from the random forest model constructed by randomly drawing 80% of the samples 100 times. (b) The relative importance of variables for the average growth rate of shoots, where the error bars represent the standard deviation of the output from the random forest model constructed by randomly drawing 80% of the samples 100 times.
Forests 16 00371 g012
Table 1. Summary of DBH within the sample plots.
Sample PlotNumber of Moso BambooDBH (cm)
MeanMinMaxSD
P110012.317.0016.201.53
P29012.157.7015.601.71
P310612.015.5015.201.69
P410811.637.2015.401.73
P511511.417.0015.711.90
P68111.708.1014.401.40
P711211.086.5015.601.65
P88011.947.2015.001.55
Note: SD: standard deviation.
Table 2. Various parameters of the BLS.
ParametersLiBackpack DGC50
Laser sensorVelodyne Puck VLP-16 × 2
Precision±3 cm
Accuracy±5 cm
Range capability100 m
Point frequency600,000 (pts/s)
Scan modeColor
Scanning modeHorizontal 16-line repetitive scanning
Vertical 32-line repetitive scanning
Wavelength903 nm
Viewing angle rangeHorizontal 360°
Vertical 180°
Table 3. Indicators influencing location.
Bamboo AttributesAcquisition TrajectoryPoint Cloud QualityTerrain
Diameter ClassDSIntensitySurface Roughness
Distance to the Nearest BambooDTQuantitySlope of Aspect of DEM
Cumulative DistanceDensitySlope
Table 4. Sensitivity analysis of indicators affecting shoot growth rate.
IndicatorsMuMu_starSigmaMu_star_conf (95%)
LAI0.850.920.21[0.80, 1.04]
R0.500.550.15[0.45, 0.65]
Diameter Class0.020.030.01[0.01, 0.05]
CI−0.600.650.30[0.55, 0.75]
GF0.620.680.25[0.58, 0.78]
U0.100.120.05[0.08, 0.16]
CC−0.050.060.02[0.03, 0.09]
Note: mu: elementary effects mean; mu_star: mean of the absolute values of elementary effects; sigma: SD of elementary effects; mu_star_conf (95%): confidence interval for mu_star.
Disclaimer/Publisher’s Note: The statements, opinions and data contained in all publications are solely those of the individual author(s) and contributor(s) and not of MDPI and/or the editor(s). MDPI and/or the editor(s) disclaim responsibility for any injury to people or property resulting from any ideas, methods, instructions or products referred to in the content.

