Article

New Landscape-Perspective Exploration of the Effects of Moso Bamboo On-Year and Off-Year Phenomena on Soil Moisture

1
School of Geographic Information and Tourism, Chuzhou University, 1 Huifeng West Road, Chuzhou 239000, China
2
Anhui Province Key Laboratory of Physical Geographic Environment, Chuzhou University, 1 Huifeng West Road, Chuzhou 239000, China
3
Anhui Engineering Research Center of Remote Sensing and Geoinformatics, 1 Huifeng West Road, Chuzhou 239000, China
4
Anhui Center for Collaborative Innovation in Geographical Information Integration and Application, 1 Huifeng West Road, Chuzhou 239000, China
5
School of Resources and Environmental Engineering, Anhui University, 111 Jiulong Road, Hefei 230601, China
*
Author to whom correspondence should be addressed.
Forests 2025, 16(2), 333; https://doi.org/10.3390/f16020333
Submission received: 16 December 2024 / Revised: 31 January 2025 / Accepted: 11 February 2025 / Published: 13 February 2025
(This article belongs to the Special Issue Ecological Research in Bamboo Forests: 2nd Edition)

Abstract

:
On-year and off-year phenomena are common in Moso bamboo forests and significantly affect economic value and ecological functions. However, observational evidence regarding the impact of these cycles on surface soil moisture (SSM) remains scarce, and little is known about the implications of their landscape patterns for regional water conservation. Here, we first quantified the spatial distribution and temperature vegetation drought index (TVDI) of on-year and off-year Moso bamboo forests based on remote sensing images and landscape metrics. We then analyzed the role of on-year and off-year phenomena and their landscape patterns on SSM. Results showed that: (1) the proposed index derived from remote sensing imagery extracted on-year and off-year Moso bamboo forests with satisfactory accuracy, and the areas were 161.4 km2 and 173.5 km2, respectively; (2) a significant disparity was observed in the TVDI between on-year and off-year Moso bamboo forests, and mismatched growth stages and phenological characteristics were identified as primary influencing factors; and the (3) landscape metrics of the perimeter–area ratio (PAR), proximity index (PROX), perimeter–area fractal dimension index (PAFRAC), connectance index (CONNECT), and aggregation index (AI) exhibited negative correlations with the TDVI, indicating that the high spatial connectivity of Moso bamboo forests enhances soil water conservation. Our findings suggested that on-year and off-year phenomena and their spatial distribution intensified the heterogeneity in SSM. Therefore, considerations regarding the connectivity and edge complexity within Moso bamboo forests should be prioritized in future management strategies to achieve a balance between economic benefits and ecological functions in water-deficient mountainous areas.

1. Introduction

Moso bamboo (Phyllostachys pubescens) is the most widely distributed bamboo type in tropical and subtropical regions, comprising approximately 70% of the total bamboo forest area and accounting for 0.8% of the world’s forested land [1,2,3]. Due to its short growth cycle, high yield, and diverse applications, Moso bamboo holds significant economic value for regional development and makes substantial contributions to the prosperity of economies in mountainous areas [4,5]. Nevertheless, the rapid growth and expansion of Moso bamboo forests also give rise to various environmental and ecological problems, including soil erosion, poor water quality, biodiversity loss, and forest structural damage [6,7].
The current extraction methods for Moso bamboo have been developed utilizing remote sensing image data, owing to their extensive observational scope and wide spectral ranges [8,9,10]. Red, near-infrared (NIR), and shortwave infrared (SWIR) bands have been demonstrated to distinguish Moso bamboo forests effectively [11,12]. It is worth noting that Moso bamboo may exhibit similar spectral characteristics to other evergreen forests during the same period, which complicates the identification process. Compared to other forest types, Moso bamboo displays distinct phenomena of on-year and off-year growth [3,13]. During spring, on-year Moso bamboo forests produce a profusion of new bamboo shoots, whereas off-year Moso bamboo forests produce almost no bamboo shoots, and these two types of forests often coexist simultaneously [14,15]. Taking advantage of this characteristic, several studies have proposed the establishment of a monthly change bamboo index or an annual change bamboo index. These indices are derived from spectral bands collected across different years or seasons, with the aim of enhancing identification accuracy and effectively distinguishing between on-year and off-year Moso bamboo [3,16,17].
Meanwhile, it is important to highlight that the symbiosis of the on-year and off-year Moso bamboo exacerbates the spatial heterogeneity of vegetation biomass and soil physicochemical properties, resulting in variations in both vertical and horizontal water flux exchanges between the atmosphere, surface, and soil [18,19]. Furthermore, the spatial distribution and combination of different landscape types can significantly influence the horizontal exchange of soil moisture by altering hydrological parameters such as soil hydraulic conductivity and soil water potential, thereby affecting regional water balance [20,21]. Therefore, it is essential to examine the water balance within Moso bamboo forests, particularly focusing on the differences in soil moisture between on-year and off-year Moso bamboo [22]. However, existing studies primarily focus on soil nutrient characteristics [23], water vapor flux changes [24], and soil physicochemical properties [25,26]. In addition, most studies are conducted at a point scale without considering the spatial distribution patterns of on-year and off-year Moso bamboo forests. Consequently, the understanding of the impacts of on-year and off-year phenomena on Moso bamboo forests soil moisture is still lacking, which is crucial for maintaining soil and water conservation functions in water-deficient mountainous regions.
In recent years, the triangular feature space composed of vegetation index and surface temperature has been successfully applied to estimate soil moisture at the regional scale [27,28,29]. Additionally, various landscape indices have been developed to quantify the spatial distribution patterns of different landscapes [30], which can be easily obtained through the interpretation of remote sensing images at a regional scale. These approaches provide methodological support for directly addressing the relationship between the spatial distribution patterns of on-year and off-year Moso bamboo forests and soil moisture. Therefore, in this study, we aimed to investigate the landscape patterns of on/off-year Moso bamboo and analyze their effects on soil moisture. The specific objectives were to (1) extract the on/off-year Moso bamboo and estimate the corresponding soil moisture, (2) clarify the heterogeneity of soil moisture in on/off-year Moso bamboo and the underlying influencing factors, and (3) evaluate the effects of distribution characteristics of on/off-year Moso bamboo forests on soil moisture by establishing the relationships between landscape metrics and soil drought index. The research findings provide a novel perspective for understanding how the on/off-year phenomena influence regional water resources, thereby guiding the rational management of Moso bamboo forests.

2. Materials and Methods
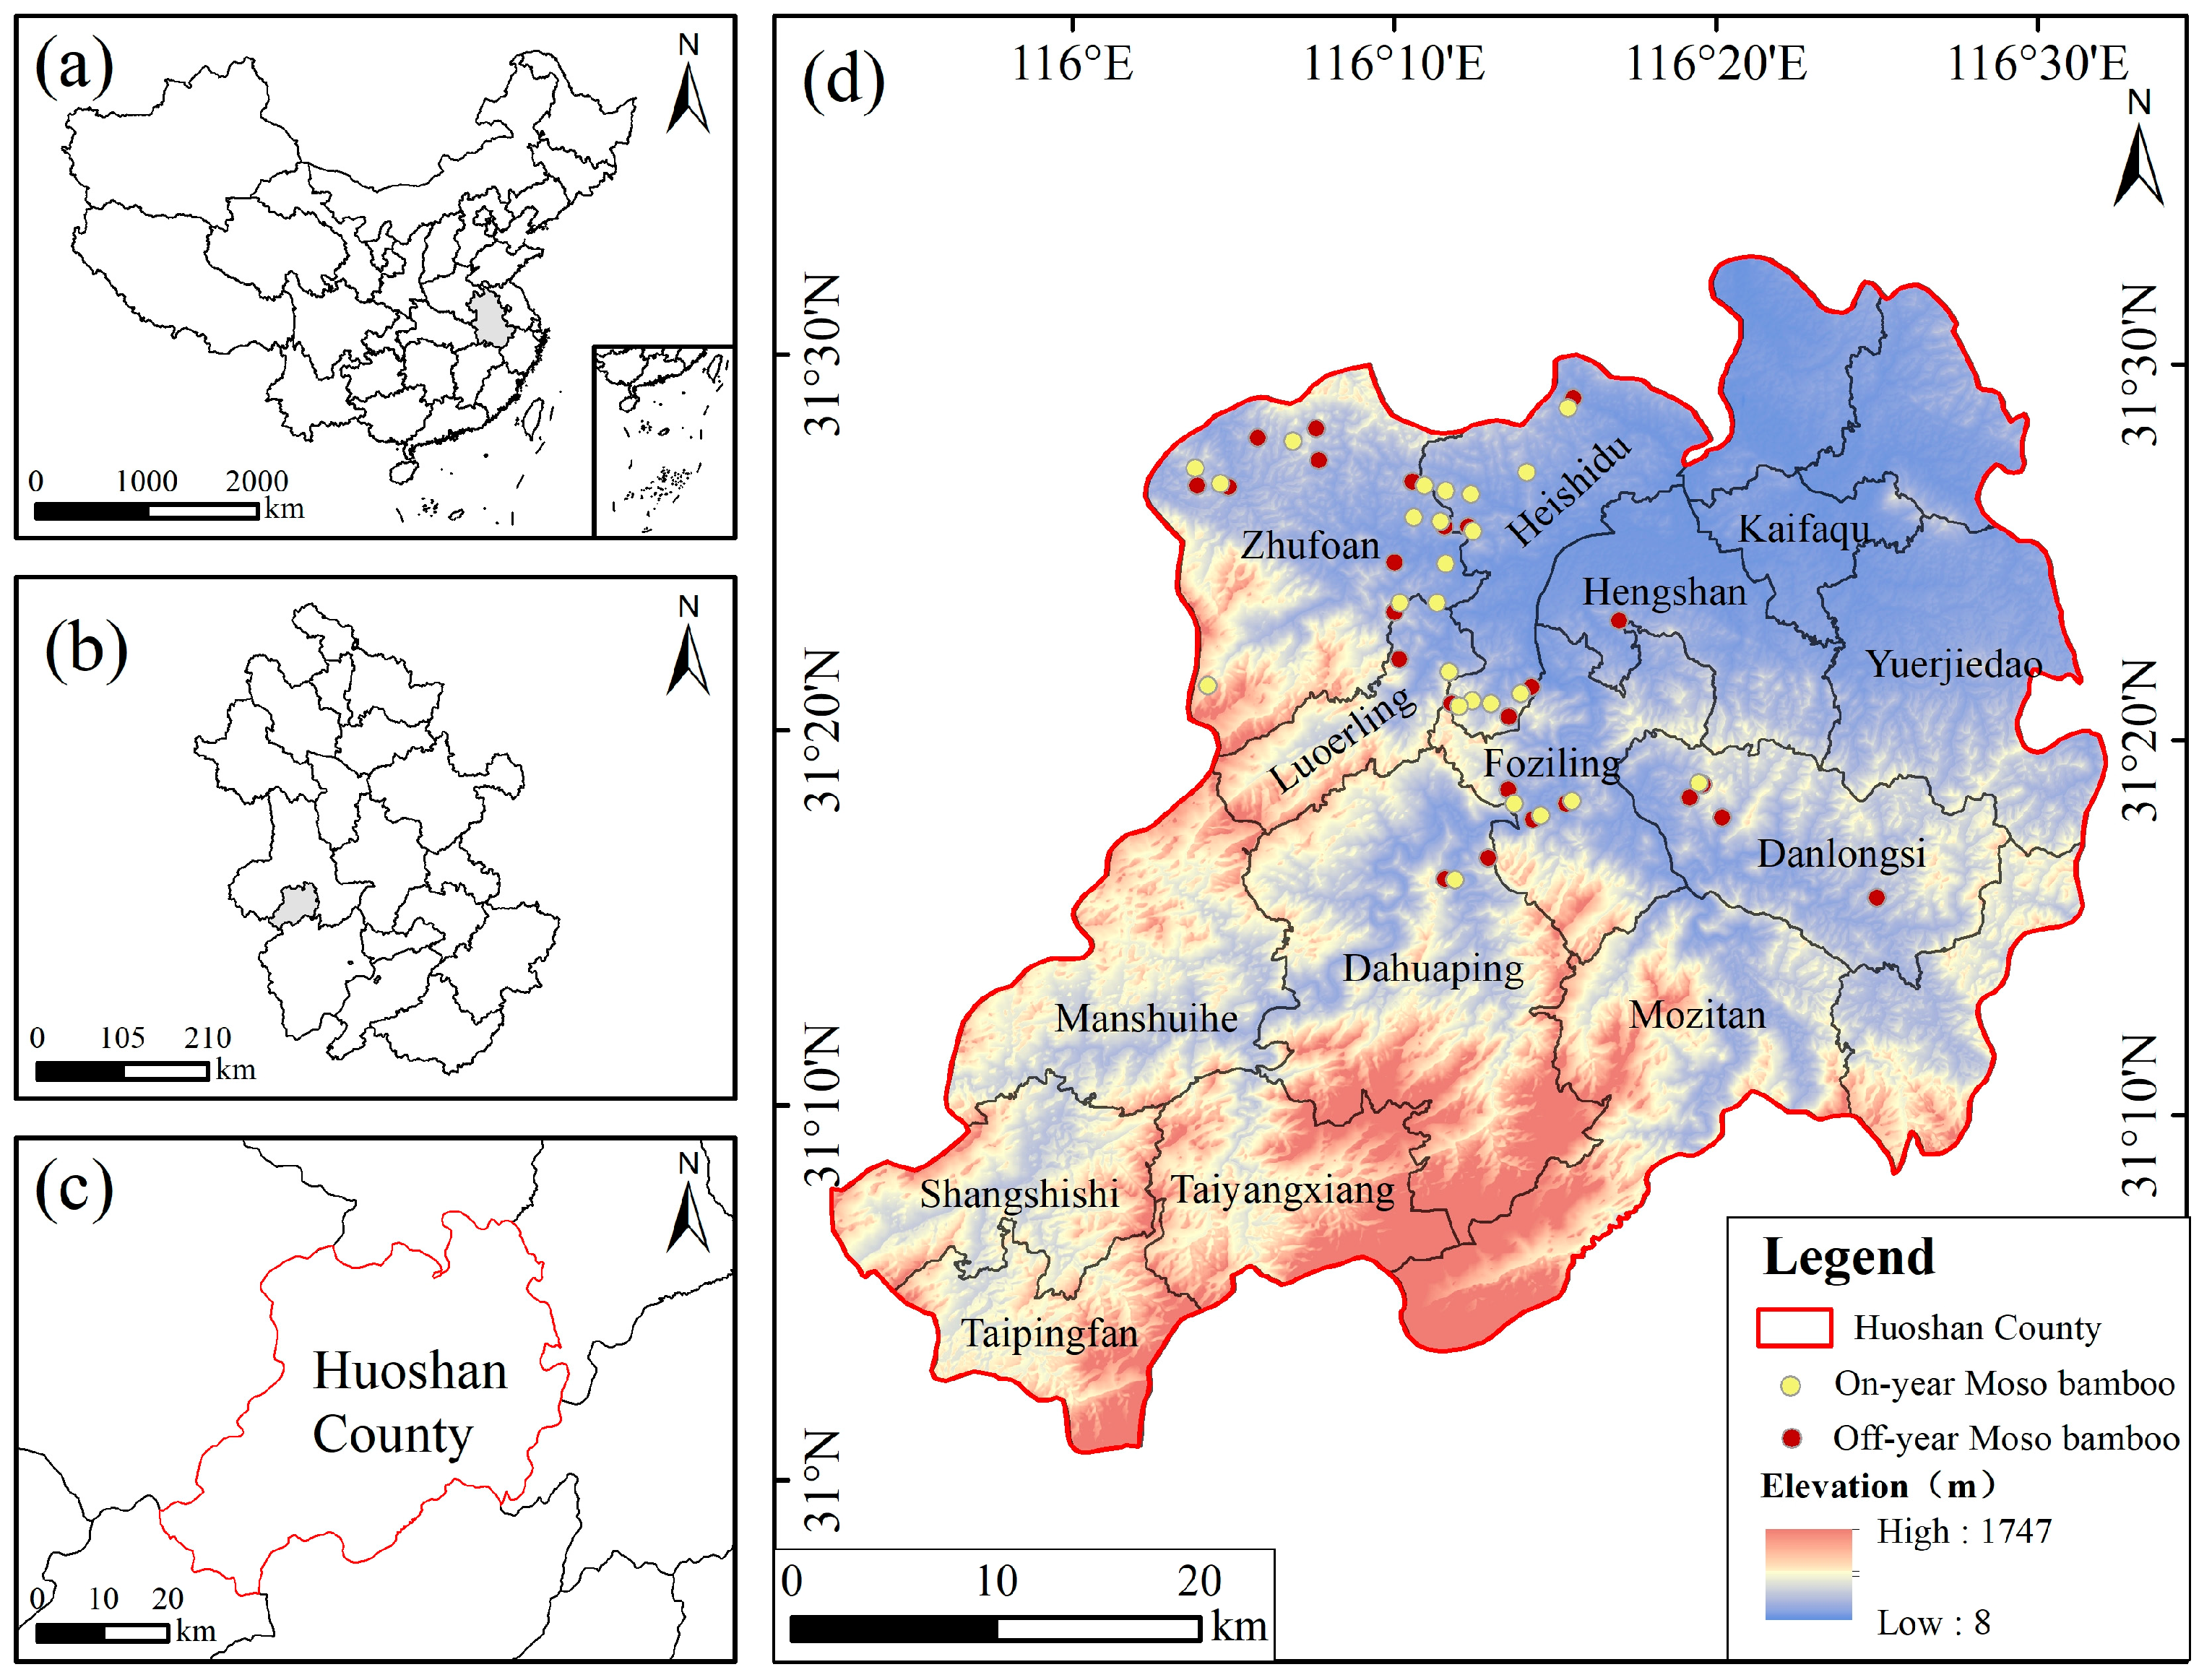
2.1. Study Area

The study area is located in the northern foothills of the Dabie Mountain in Anhui Province, China (31°03′ N~31°33′ N, 115°52′ E~116°32′ E), covering an approximate area of 2043 km2 (Figure 1). The average elevation is 700 m above sea level, with terrain sloping towards the southeast. The area belongs to the northern subtropical monsoon humid climate with the mean annual precipitation of 1300 mm, and the mean annual air temperature is about 15.3 °C [31,32]. The topography and hydrothermal conditions are highly conducive to the growth of Moso bamboo. There are approximately 82 million standing Moso bamboo trees within this area, covering around 298 km2, which constitutes about 15% of the total land area of the County [33]. In this context, the bamboo industry has emerged as a pillar sector and primary economic source for Huoshan County.

2.2. Data Collection and Processing

To develop a multi-temporal index for extracting the spatial distributions of on/off-year Moso bamboo and to analyze the variability and change patterns of SSM over a full-year cycle, remote sensing data during the period of 2021–2022 were collected. In total, 15 standard Level-1 products of Sentinel-2B, Landsat 7 ETM+, and Landsat 8 OLI images were obtained from the Copernicus Open Access Hub (https://dataspace.copernicus.eu/, accessed on 11 July 2022) and United States Geological Survey website (https://earthexplorer.usgs.gov/, accessed on 10 Jun 2022) (Table 1).
Given that the Sentinel-2B data were geometrically and radiometrically corrected upper atmospheric apparent reflectance products, the Sen2Cor plugin of the Sentinel Application Platform (SNAP) was employed to perform atmospheric correction in the study area [3]. Subsequently, the atmospherically corrected 10 m resolution band images served as the primary data source, while remaining resolution images were resampled to 10 m using SNAP software (v9.0.0) [3]. Additionally, Landsat 7 ETM+ and Landsat 8 OLI images had undergone geometric correction; thus, only radiometric calibration and atmospheric correction were necessary for these datasets. In this study, ENVI 5.3 software (Exelis Visual Information Solutions Inc., Boulder, CO, USA), along with the FLAASH model, was utilized to conduct radiometric calibration and atmospheric correction to obtain the real reflectance data [34].

2.3. Construction of the Yearly Change Bamboo Index

In general, the normalized difference vegetation index (NDVI) can effectively distinguish vegetation from other land surface types [16,17]. Furthermore, Moso bamboo forests exhibit distinct phenological stages compared to other forest types. The reflectance values in the red edge and near-infrared bands show significant fluctuations between this year and previous years. Therefore, the reflectance values of Moso bamboo in these bands at different years were used to construct the yearly change bamboo index (YCBI) (Equation (1)), which proved effective for identifying the on-year and off-year Moso bamboo forests [3,16]. Pixels with a YCBI value less than 0.8 were classified as on-year Moso bamboo forests, while those with a YCBI greater than 1.1 were categorized as off-year Moso bamboo forests. Pixels with values falling within the range of 0.8 to 1.1 were classified as other evergreen vegetation [17].
YCBI ( y i y i + 1 ) = NIR 835 y i + 1 + Red   edge 865 y i + 1 + Red   edge 783 y i + 1 NIR 835 y i + Red   edge 865 y i + Red   edge 783 y i
where NIR835 is the near-infrared band, Red edge865 and Red edge783 are the red edge bands with wavelengths of 865 nm and 783 nm, respectively, and yi and yi+1 represent two consecutive years.

2.4. Calculation of Landscape Metrics

Binary images of on/off-year Moso bamboo generated by ENVI 5.3 were then analyzed by FRAGSTATS 4.2 software (Oregon State University, Corvallis, OR, USA) to compute landscape metrics. While FRAGSTATS 4.2 could calculate numerous landscape metrics, many of these metrics exhibited high correlations with one another. Therefore, we chose ten commonly used class-level metrics to quantitatively describe the spatial distribution patterns of the on/off-year Moso bamboo. These landscape metrics generally reflected four primary aspects of the landscape: patch number, size, shape, and structure (Table 2).

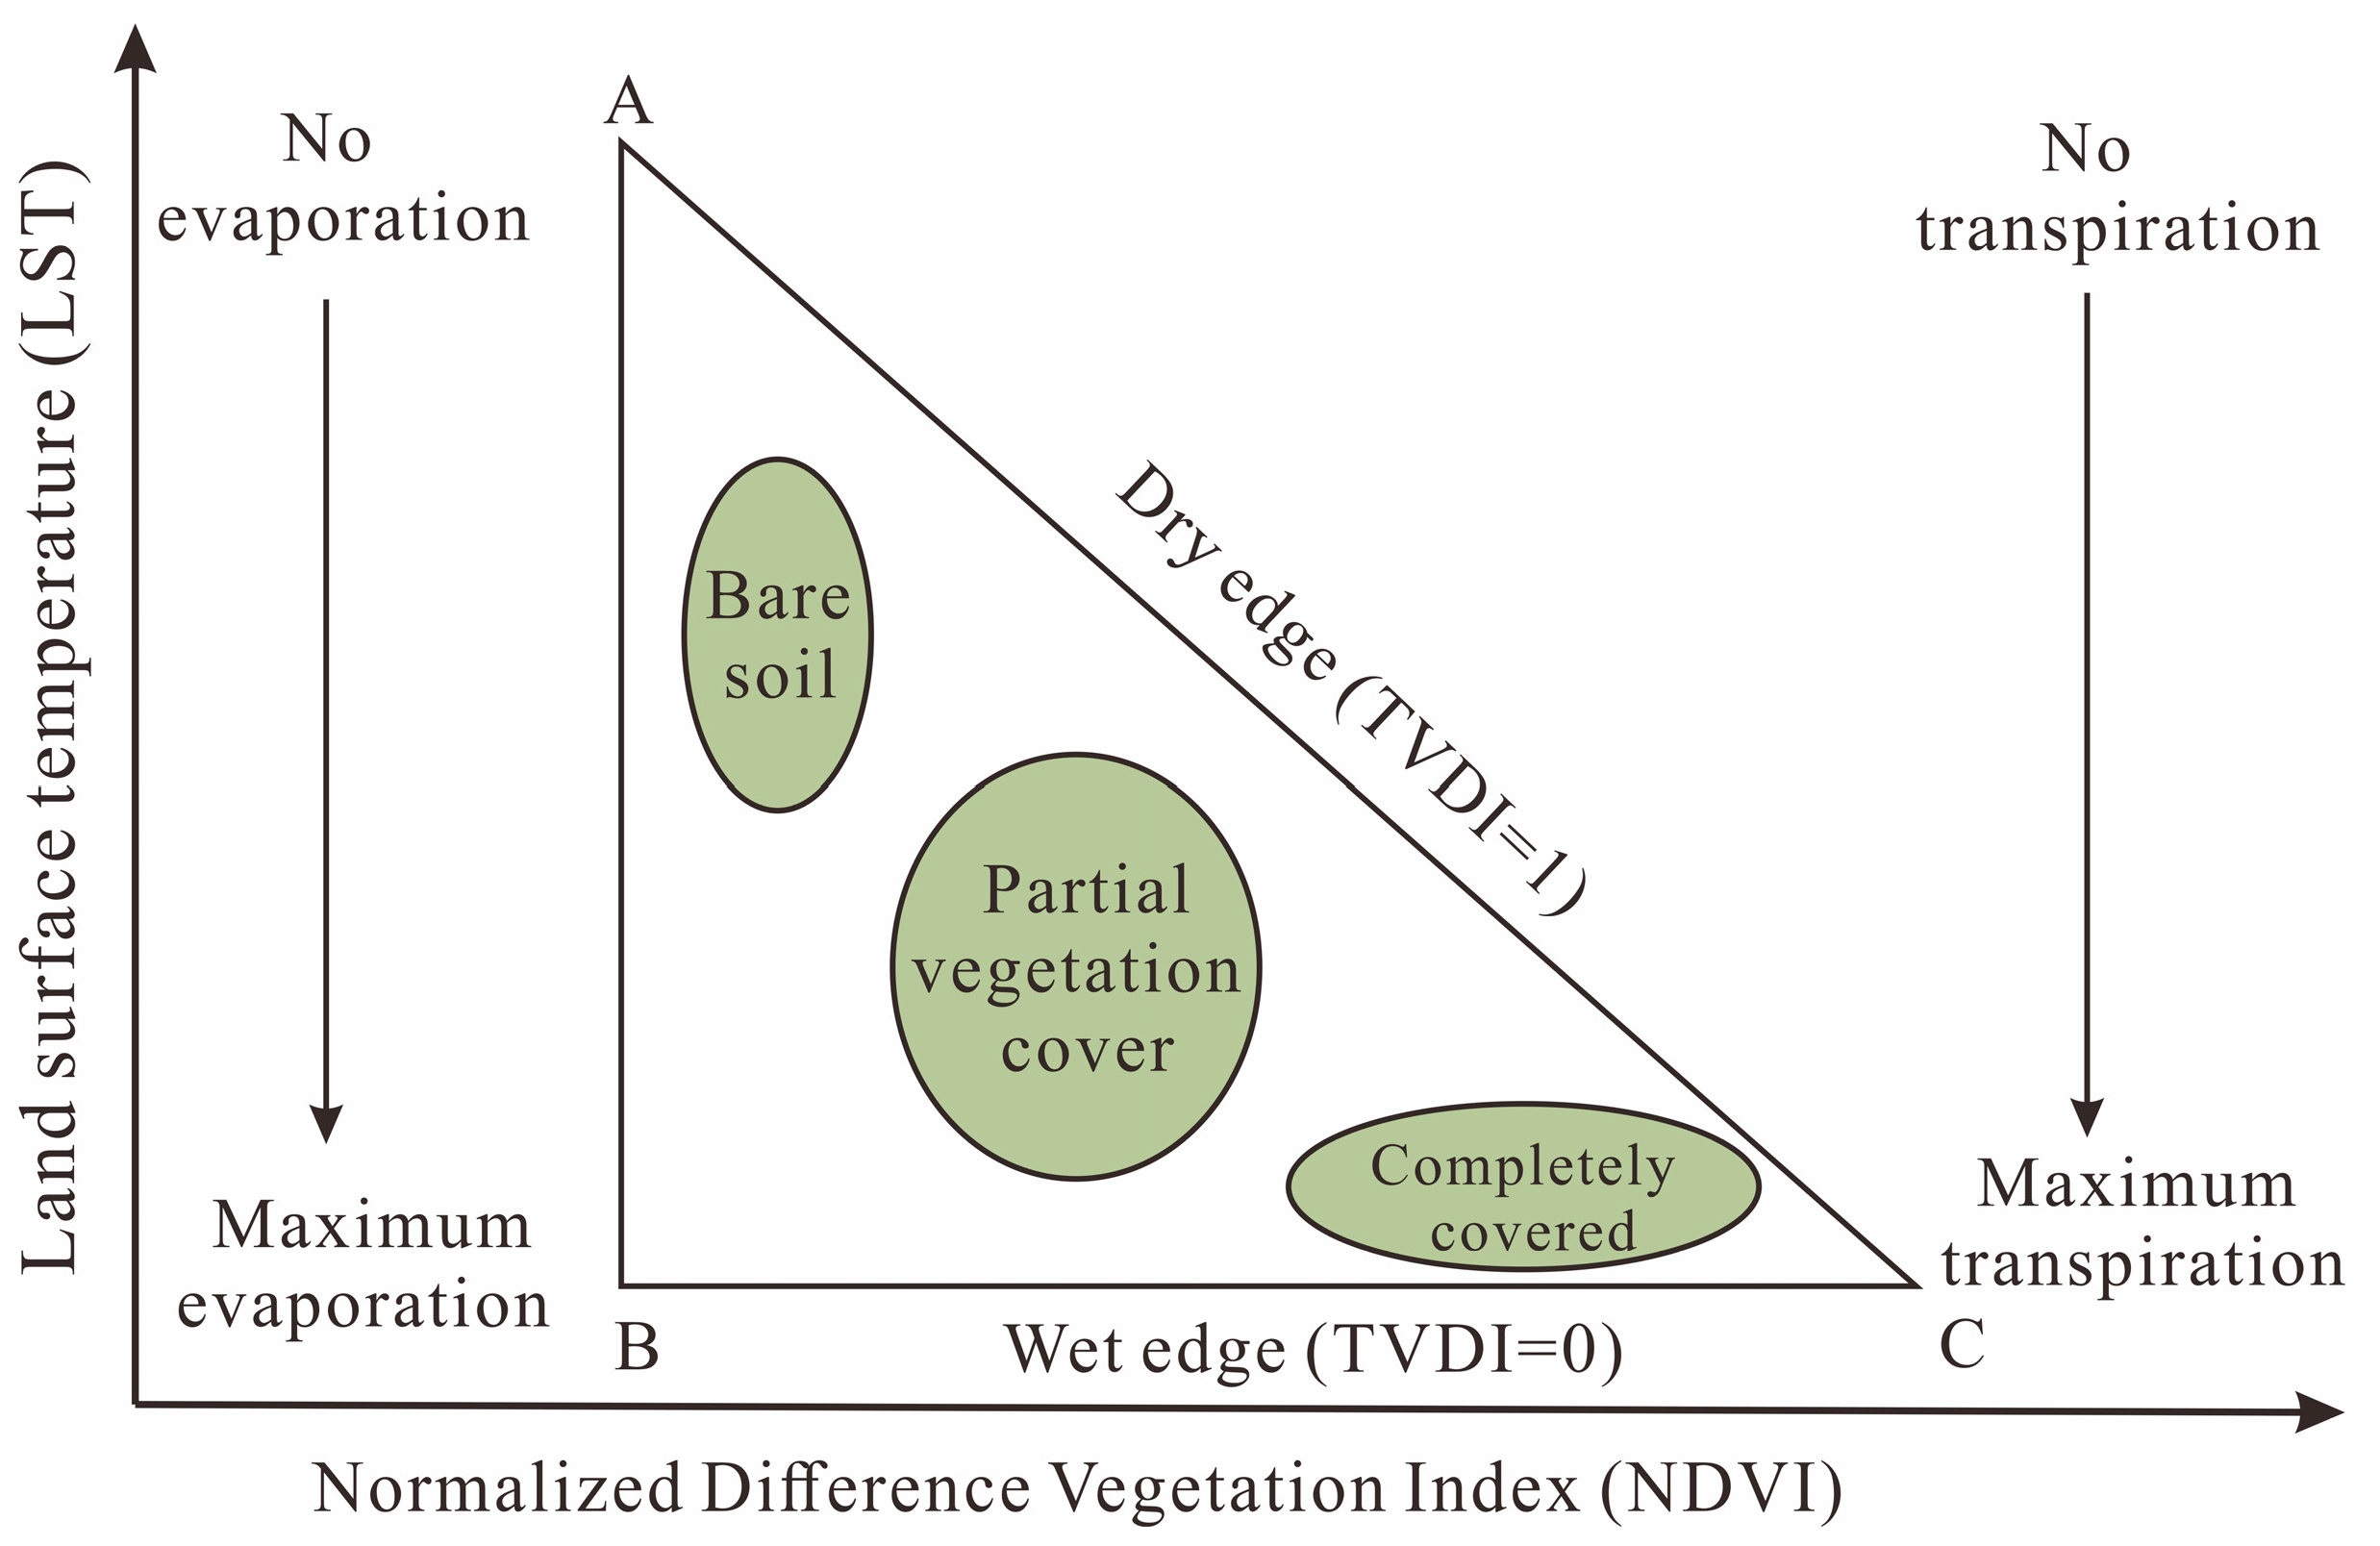
2.5. Estimation of SSM

SSM exhibited strong correlations with vegetation indices and land surface temperature (LST). The underlying physical relationship typically conformed to a triangular variant of trapezoidal space. (Figure 2) [35,36]. Therefore, previous research had estimated soil moisture status based on the effects of water evaporation and vegetation transpiration on reducing surface temperature [37]. The temperature vegetation drought index (TVDI) obtained from the LST-NDVI triangular feature space was usually used to characterize SSM (Equations (2)–(4)) [38,39]. The TVDI was inversely correlated with soil moisture, and higher TVDI values correspond to lower soil moisture levels [40].
In this study, LST and the NDVI interpreted from remote sensing data were used to construct triangular feature spaces. The maximum and minimum LST values corresponding to all NDVI pixels were linearly fitted to derive the regression equations for the dry edge and wet edge. It is important to note that pixels exhibiting an NDVI value below 0 typically correspond to water bodies or mixed pixels containing clouds, snow, and urban areas; thus, their soil moisture content could be considered as 100% [41]. Consequently, pixels with an NDVI less than 0 were excluded from the fitting process of the dry edge and wet edge equations [42].
TVDI = LST LST min LST max LST min
LST max = a 1   + b 1   ×   NDVI
LST min   = a 2   + b 2   ×   NDVI
where LSTmax and LSTmin represent the dry edge and wet edge, respectively. a1, a2, b1, and b2 are the coefficients of the fitting equations, respectively.

2.6. Accuracy Verification and Statistical Analysis

In this study, 35 polygons were served as training samples, comprising 18 polygons (460 pixels) for off-year Moso bamboo and 17 polygons (530 pixels) for on-year Moso bamboo. Based on the high-resolution remote sensing images and ground truth classification statistical data, a total of 300 verification points were randomly selected across the entire study area. The confusion matrix was used to estimate the accuracy of the extraction results for Moso bamboo forests. Specifically, overall accuracy was used to evaluate the general classification performance, while producer’s accuracy and user’s accuracy were applied to assess the classification accuracy of on-year and off-year bamboo forests, respectively [3]. The coefficient of determination (R2) was used to evaluate the performance of linear regressions between NDVI and LST values concerning dry and wet edges [43]. Additionally, the Pearson correlation coefficient was calculated to examine the relationships between soil moisture and various landscape metrics and then to clarify the effects of on-year and off-year phenomena on soil moisture [20].

3. Results

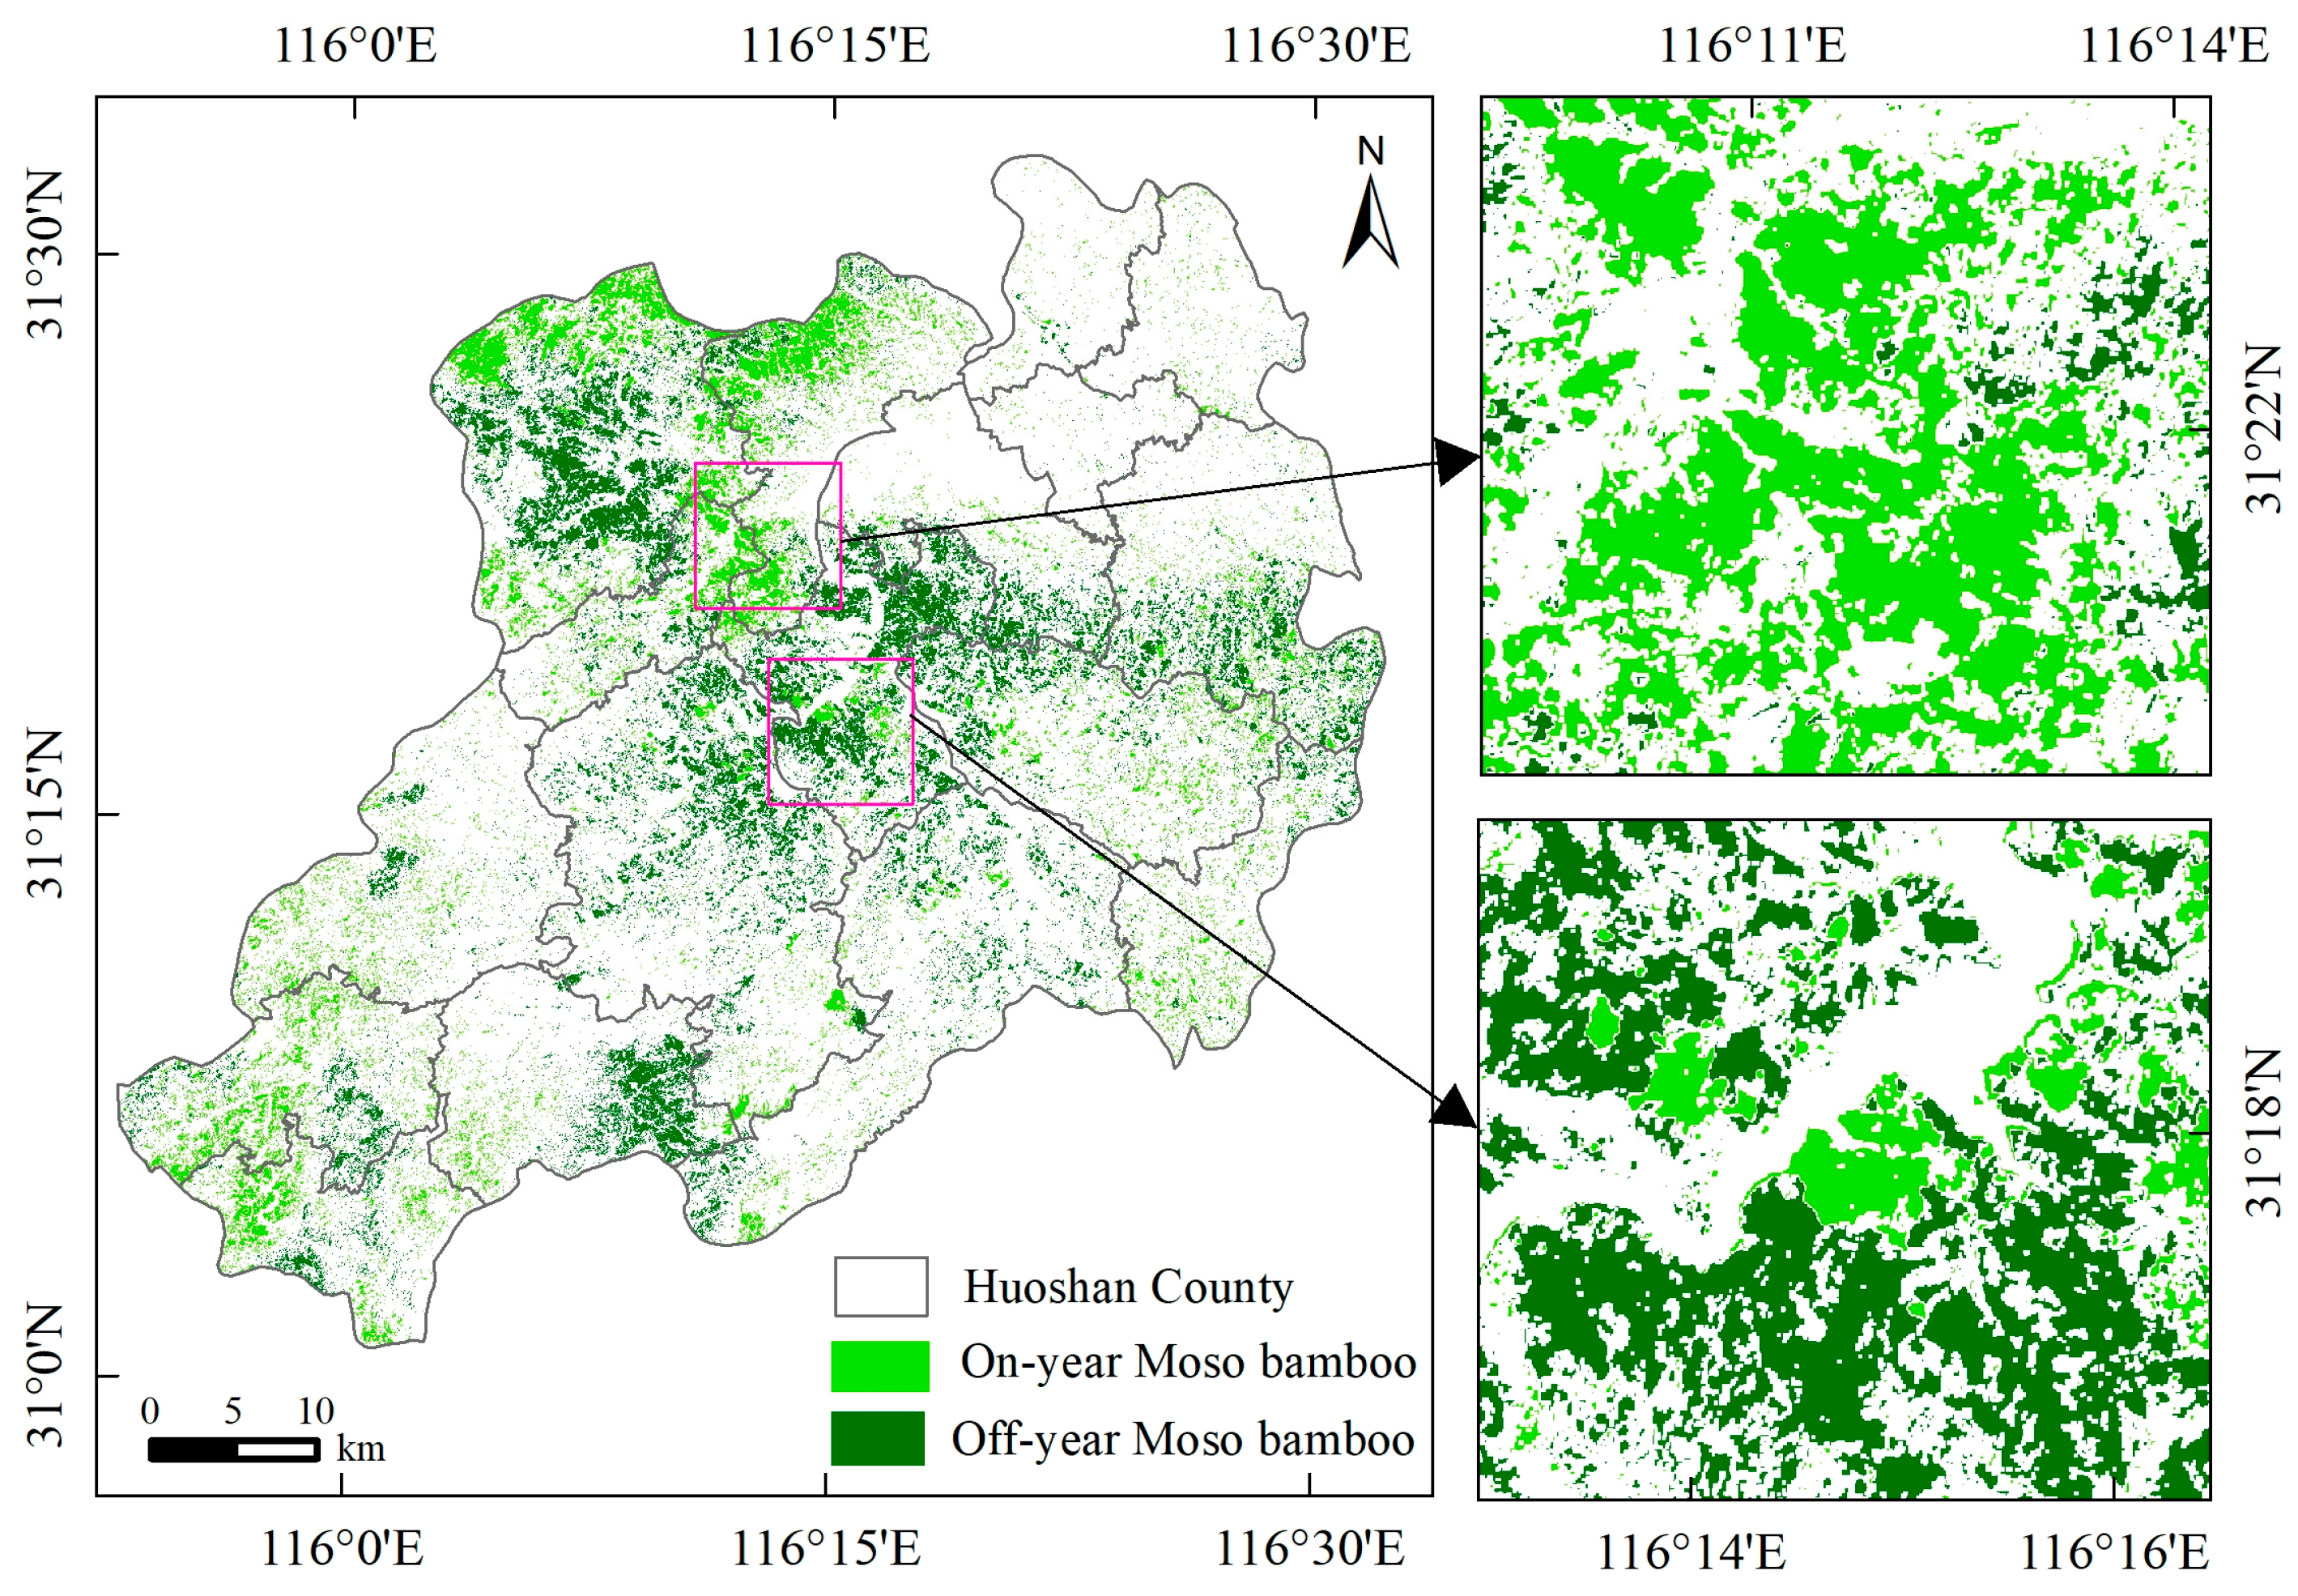
3.1. Classification and Spatial Distribution of On/Off-Year Moso Bamboo Forests

The accuracy of the extraction results for Moso bamboo forests was evaluated using the confusion matrix method. The results of the accuracy analysis indicated that the overall classification accuracy of Moso bamboo forests reached 88%, with both producer’s accuracy and user’s accuracy exceeding 85%. Additionally, the Kappa coefficient surpassed 0.81 (Table 3). The YCBI developed in this study could effectively distinguish Moso bamboo forests from other land cover types and accurately classified the on-year and off-year Moso bamboo forests, thereby providing valuable spatial distribution information.
The interpretation results revealed that the total area of Moso bamboo forests was 334.9 km2, representing approximately 16.4% of the overall study area, thereby establishing it as the largest ecological and economic forest in Huoshan County. Specifically, in May, the area designated for the on-year Moso bamboo forests measured 161.4 km2, while the off-year Moso bamboo forests covered an area of 173.5 km2. From a spatial distribution perspective, the on-year Moso bamboo were predominantly located in the northwest and southeast regions (including Heishidu, Luoerling, and Shangshishi towns). In contrast, the off-year Moso bamboo were mainly found in the northwest, southwest, and central regions (including Zhufoan, Foziling, and Dahuaping towns) (Figure 3).

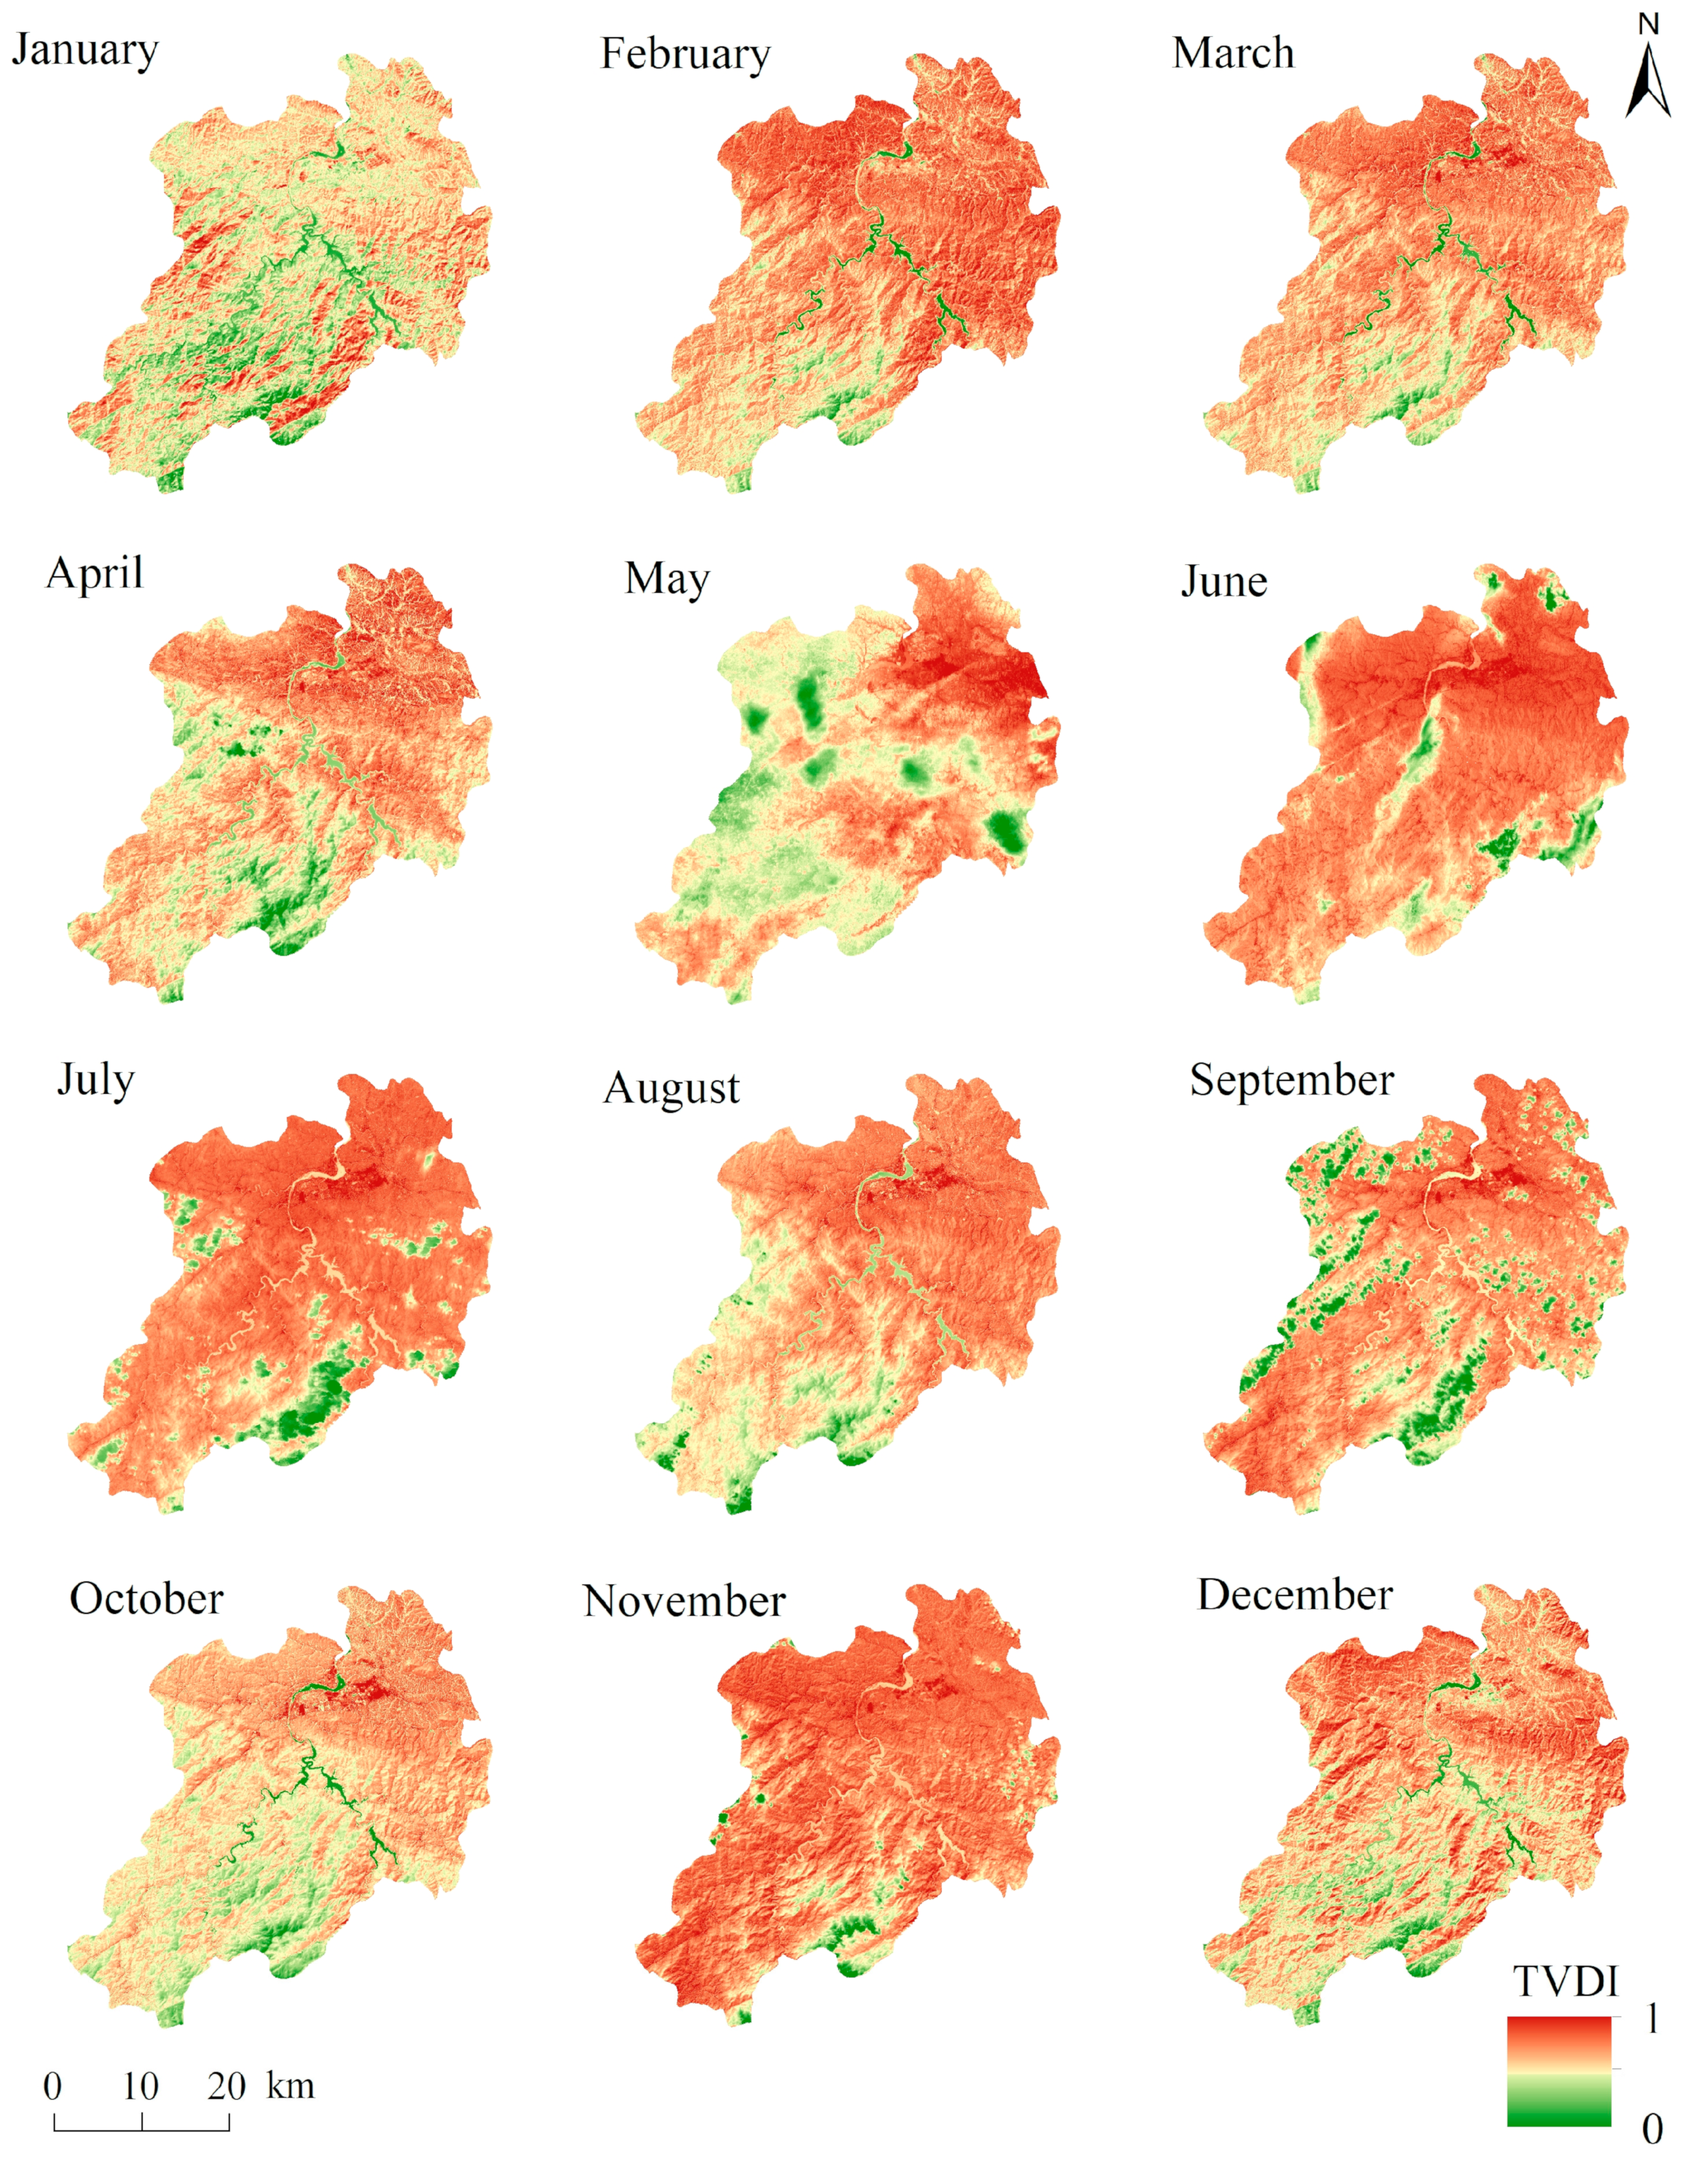
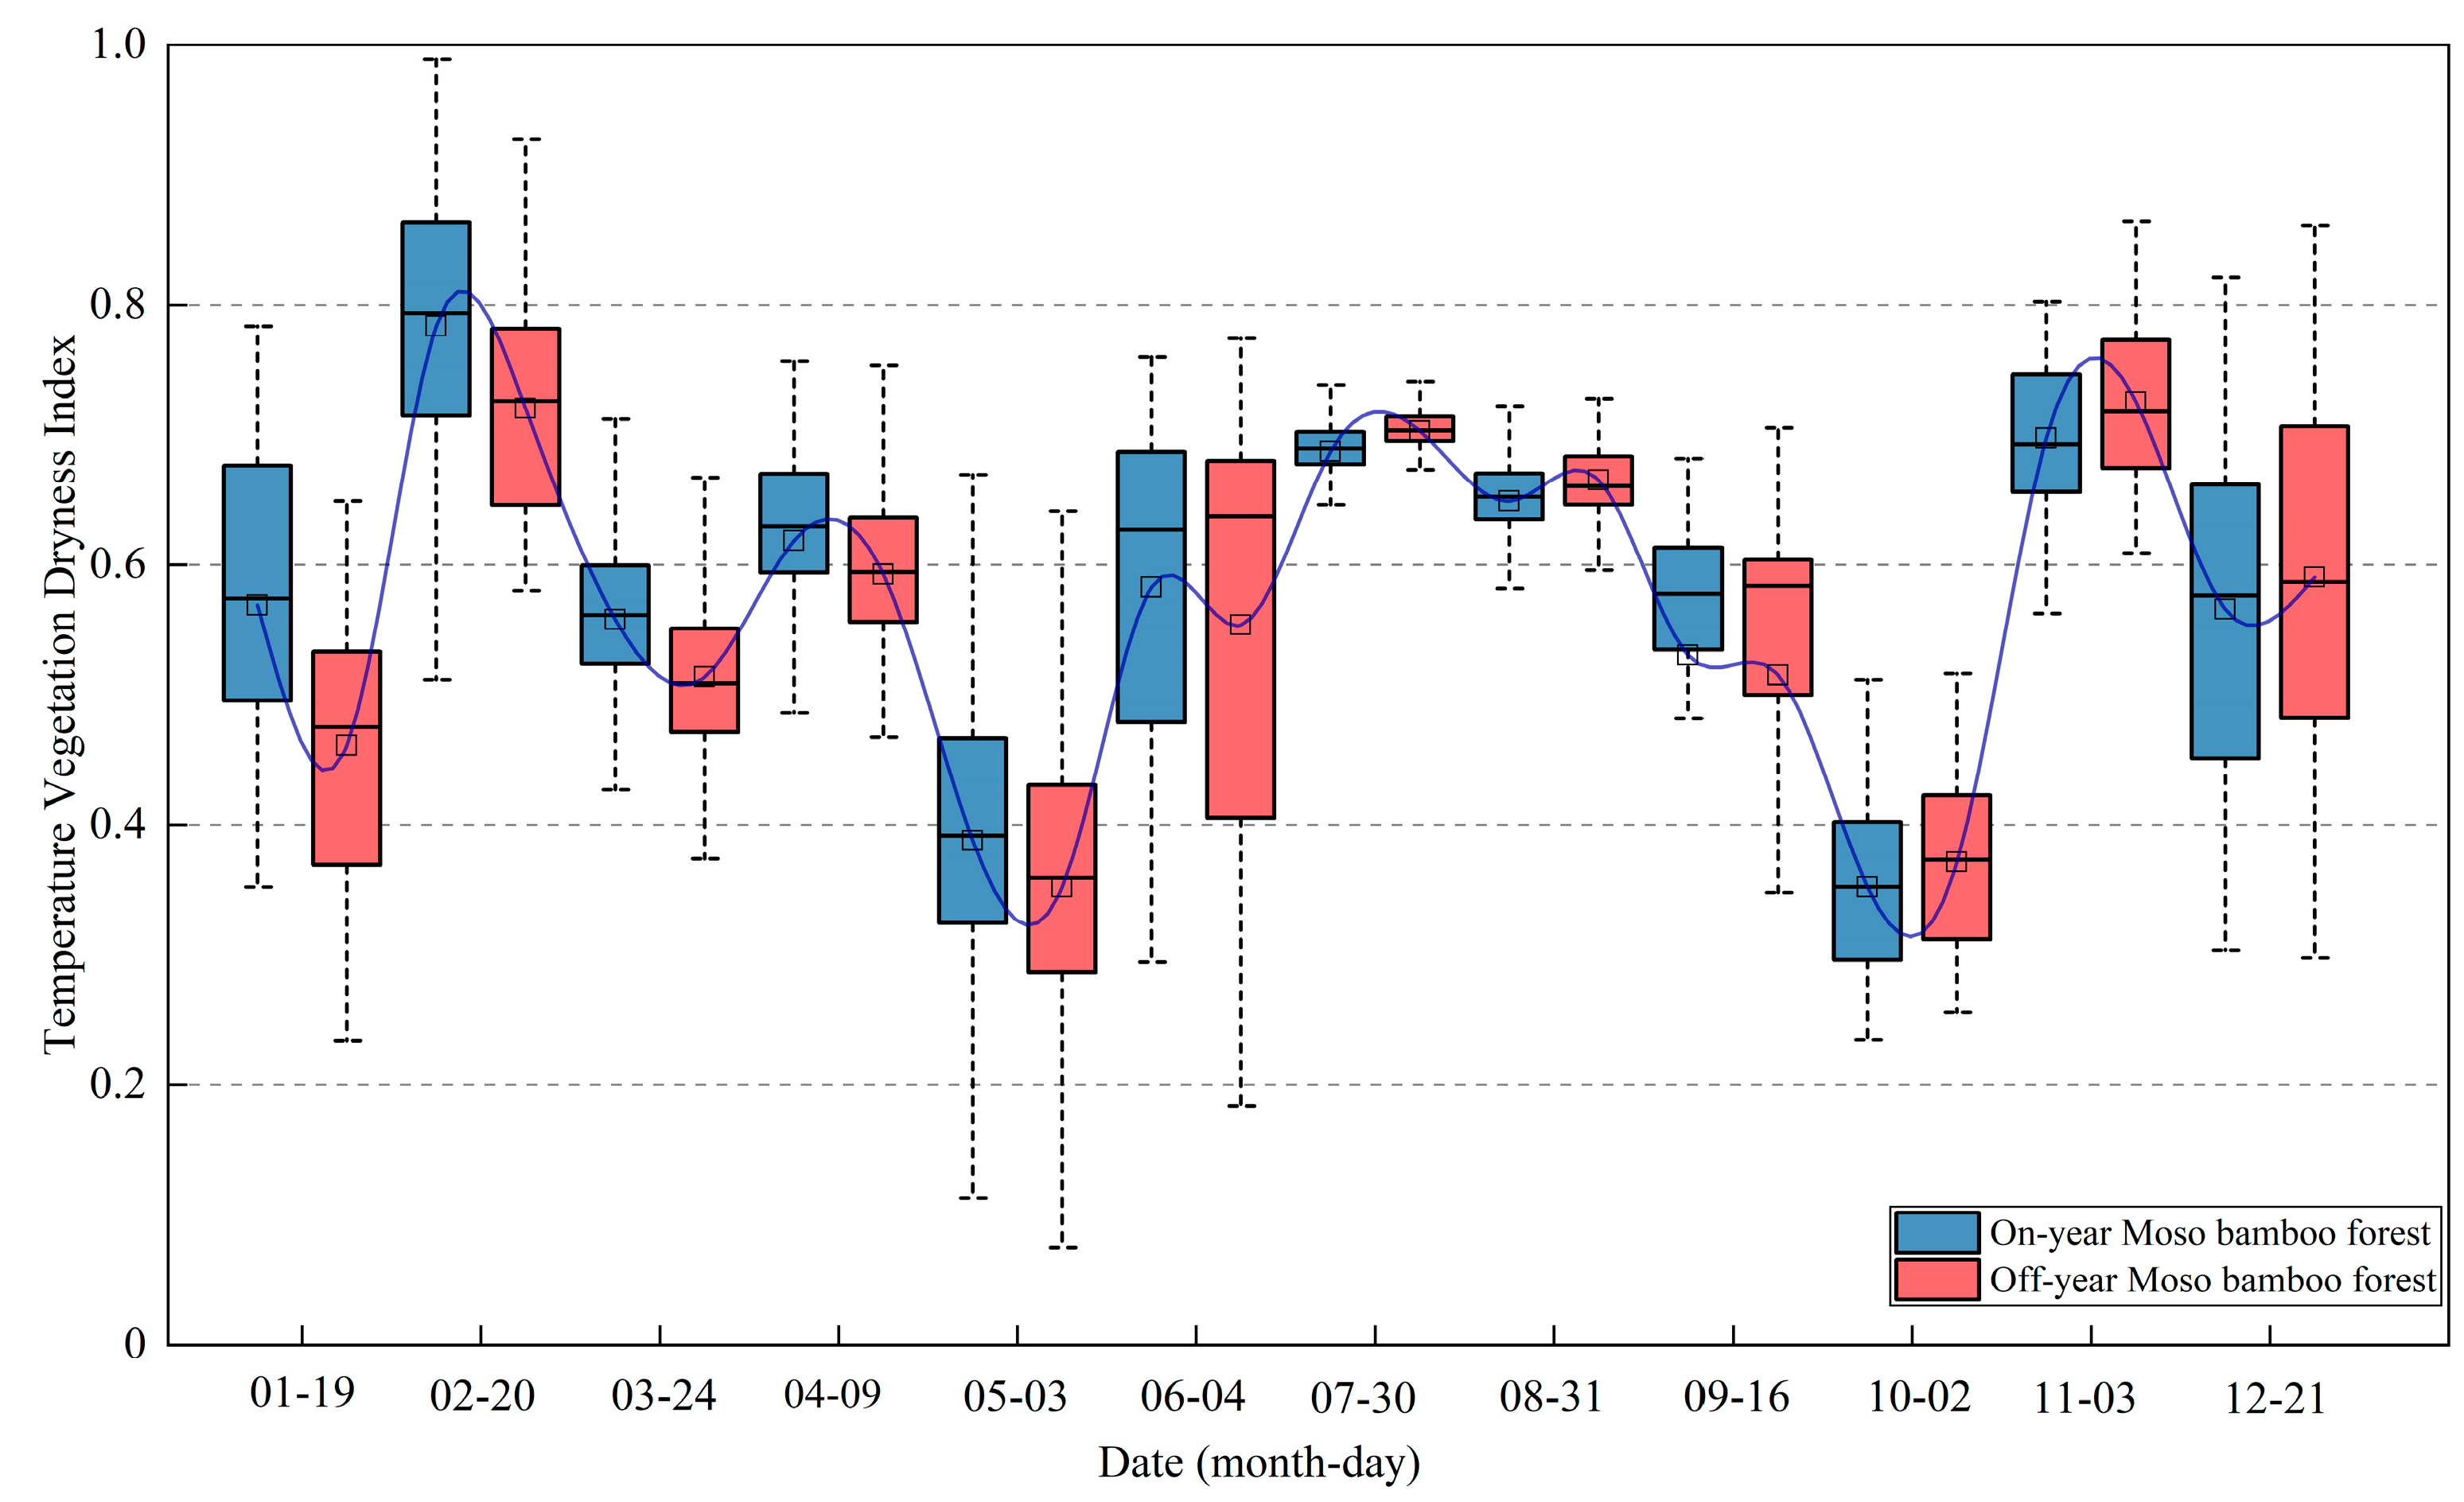
3.2. Spatial Distribution and Variation in the TVDI

The linear regression equations for both dry and wet edges were validated, with p-values less than 0.05. The R2 values for the wet edges reached 0.6 or higher, which was significantly greater than the average R2 (0.56) observed for dry edges (Table 4). Based on these findings, the soil moisture status for each month across the entire study area was assessed over a one-year period. The findings revealed that the soil moisture distribution in Huoshan County showed obvious spatial differentiation characteristics, with TVDI values decreasing from south to north. This trend suggested that the northern region was relatively arid, while the southern region experienced higher humidity (Figure 4). In the northeastern section of Huoshan County, the predominant land use type consisted of impermeable surfaces, which contributed to a pronounced heat island effect. Conversely, the southern region was characterized by mountainous terrain with elevated altitudes and extensive vegetation coverage. This natural environment could effectively reduce soil moisture caused by evapotranspiration, resulting in relatively humid surface soil conditions. On the inter-monthly scale, soil water content status exhibited a pattern of decline followed by recovery throughout the year. The periods of severe soil drought were primarily concentrated in February–March, June–August, and November, mainly influenced by temperature and precipitation factors (Figure 4).

3.3. Analysis of TVDI Differences in On/Off-Year Moso Bamboo Forests

Fifty representative plots were randomly selected to analyze the heterogeneity of the TVDI in both on-year and off-year Moso bamboo forests (Figure 1). The monthly variation in soil moisture in Moso bamboo forests could be divided into three distinct stages (Figure 5). Throughout the year, soil moisture in Moso bamboo forests exhibited significant fluctuations. Inter-monthly analysis revealed that soil moisture gradually increased from February to May, maintained stable consumption from May to July, rebounded again from August to October, and ultimately reached a minor peak in water consumption between November and January of the following year (Figure 5). The corresponding four peak periods for soil moisture consumption occurred in February, April, July, and November. Furthermore, notable differences were observed in the annual changes in soil moisture between the two types of Moso bamboo. From January to May, the TVDI values for on-year Moso bamboo forests surpassed those of the off-year Moso bamboo forests, indicating lower soil moisture during this period. Conversely, from October to December, TVDI values of the off-year Moso bamboo forests were higher (Figure 5).
It has been demonstrated that the spatial differentiation between on-year and off-year Moso bamboo was most pronounced in May. Consequently, by utilizing the TDVI data of the six towns where Moso bamboo were widely distributed during this period, the differences in soil moisture between these two types of Moso bamboo were analyzed. The results showed that the soil moisture of on-year and off-year Moso bamboo forests showed certain differences, and the degree of variation varied among different townships (Figure 6). Zhufoan Town exhibited the greatest disparity, with a difference ratio reaching 6.6%, while Luorling Town recorded the smallest difference ratio at 2.6%. The difference ratios for other townships fell within these two extremes (Figure 6).

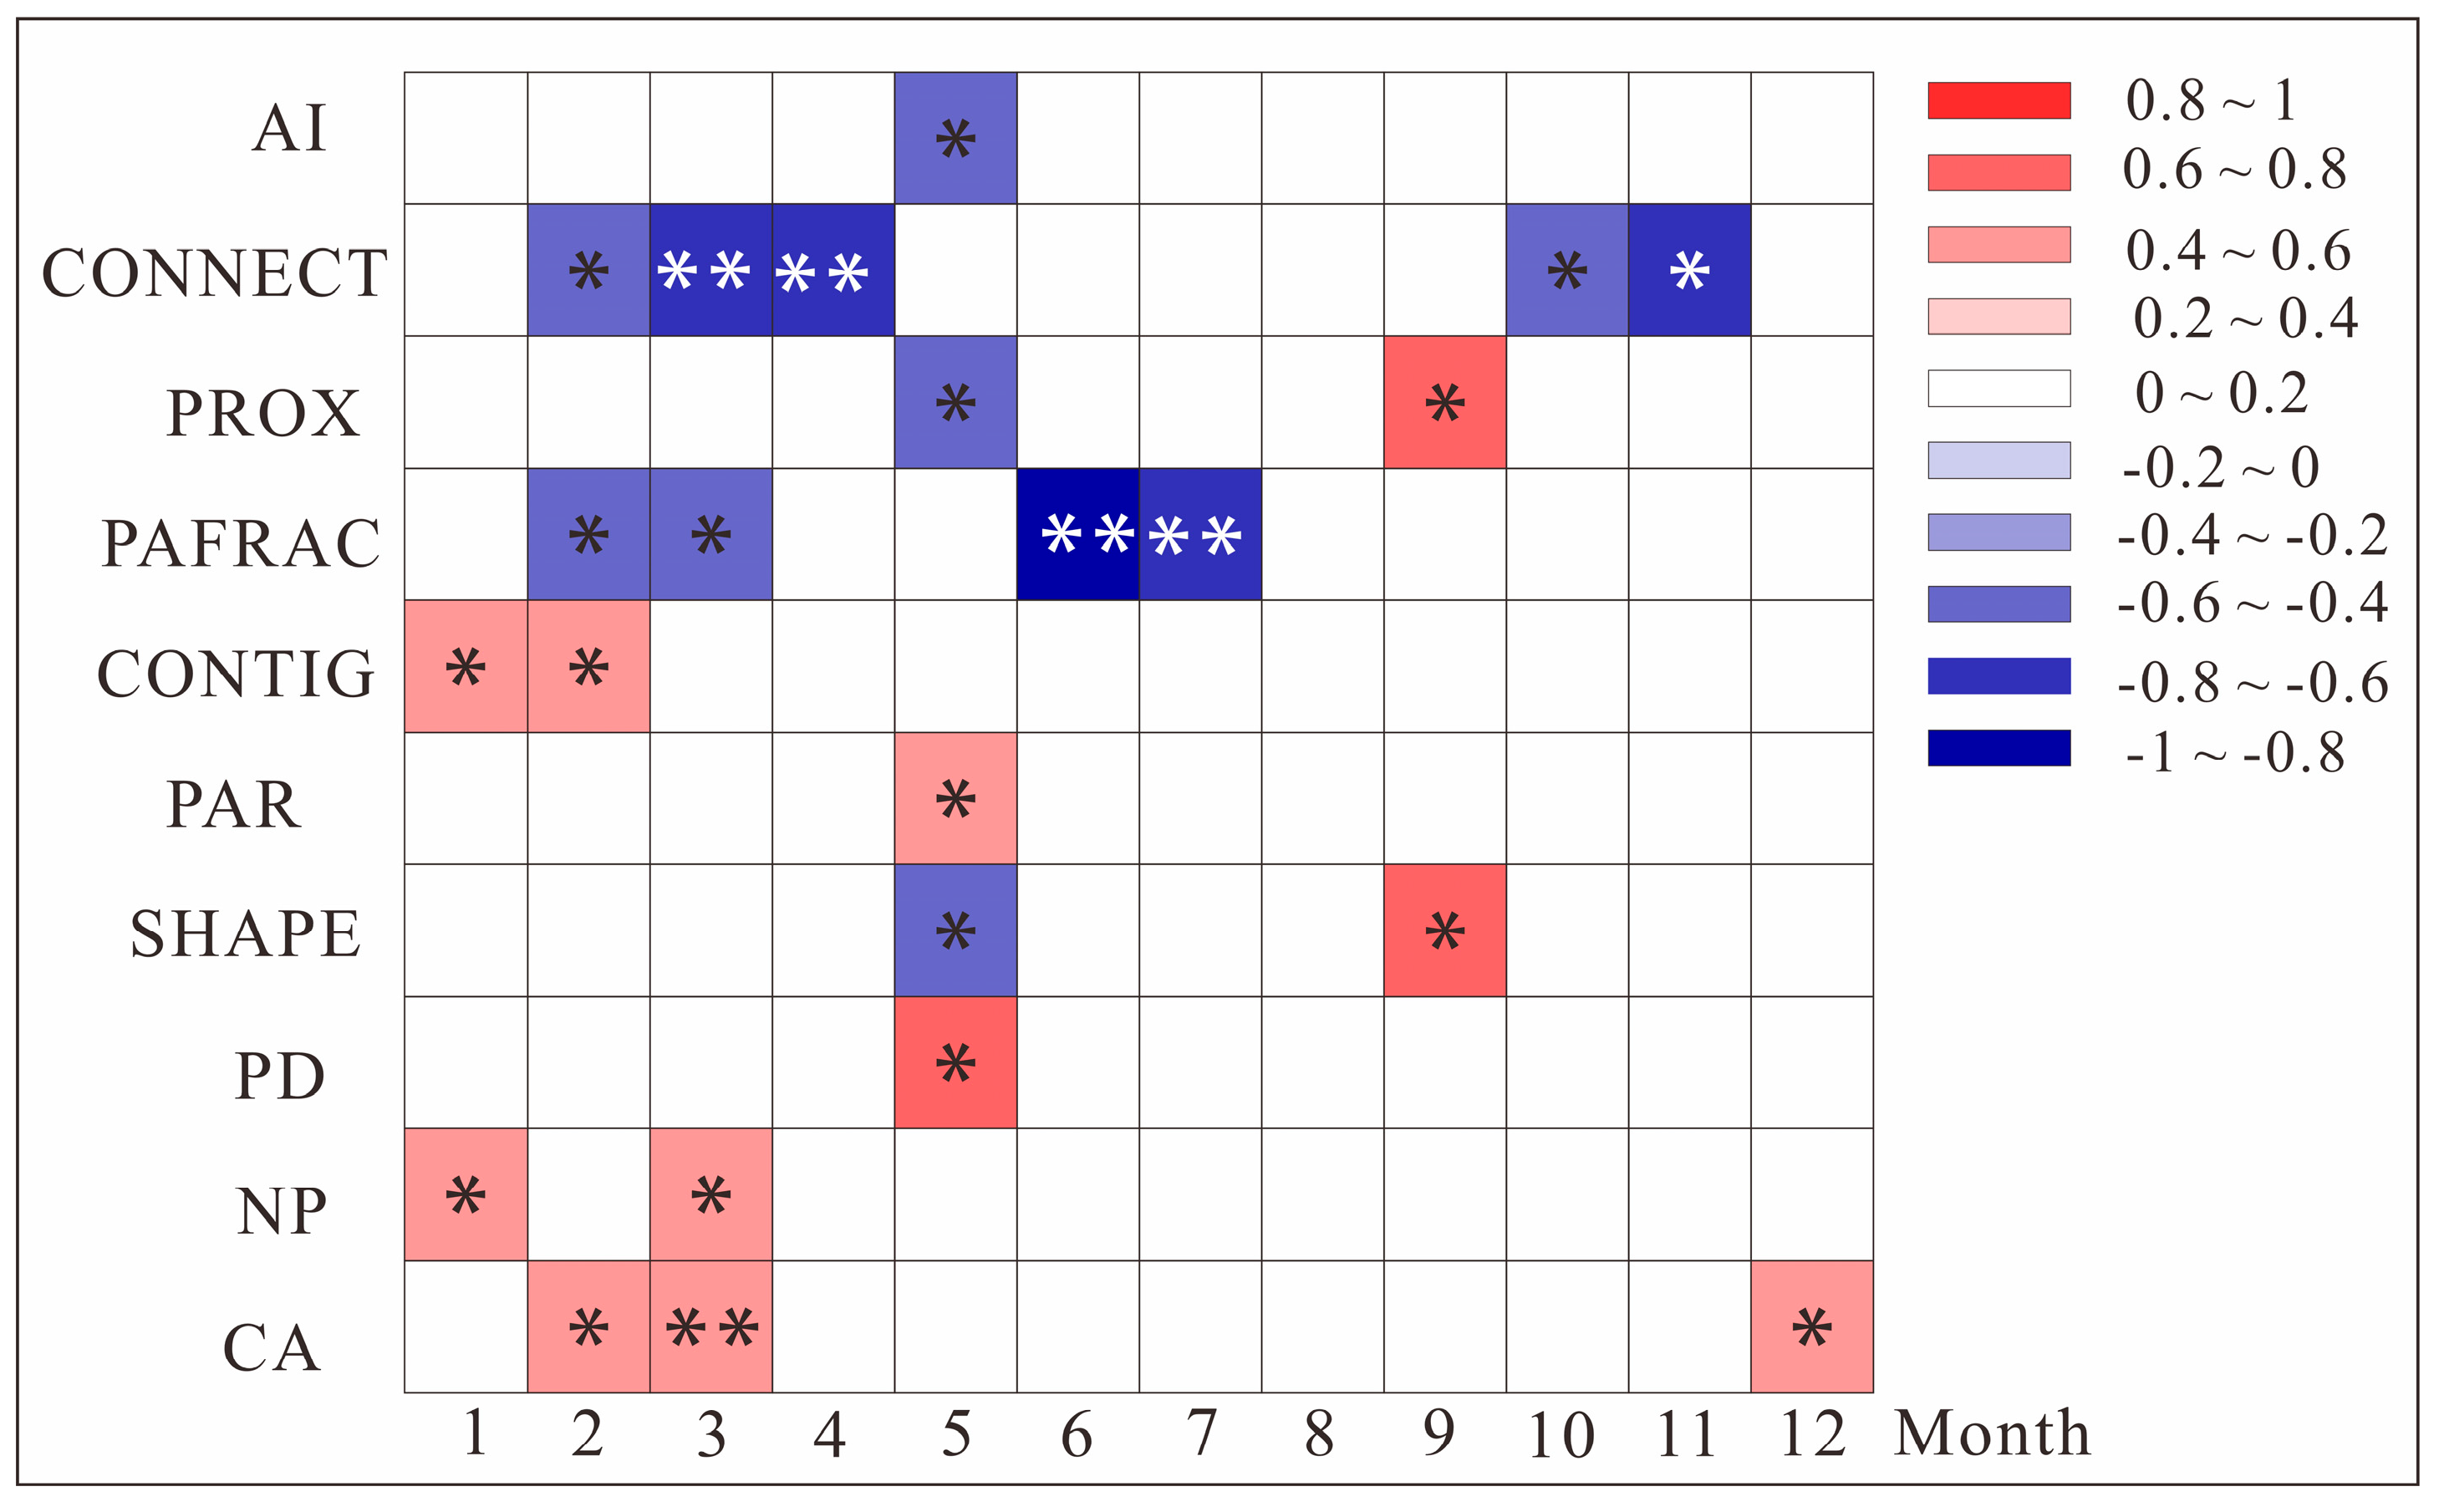
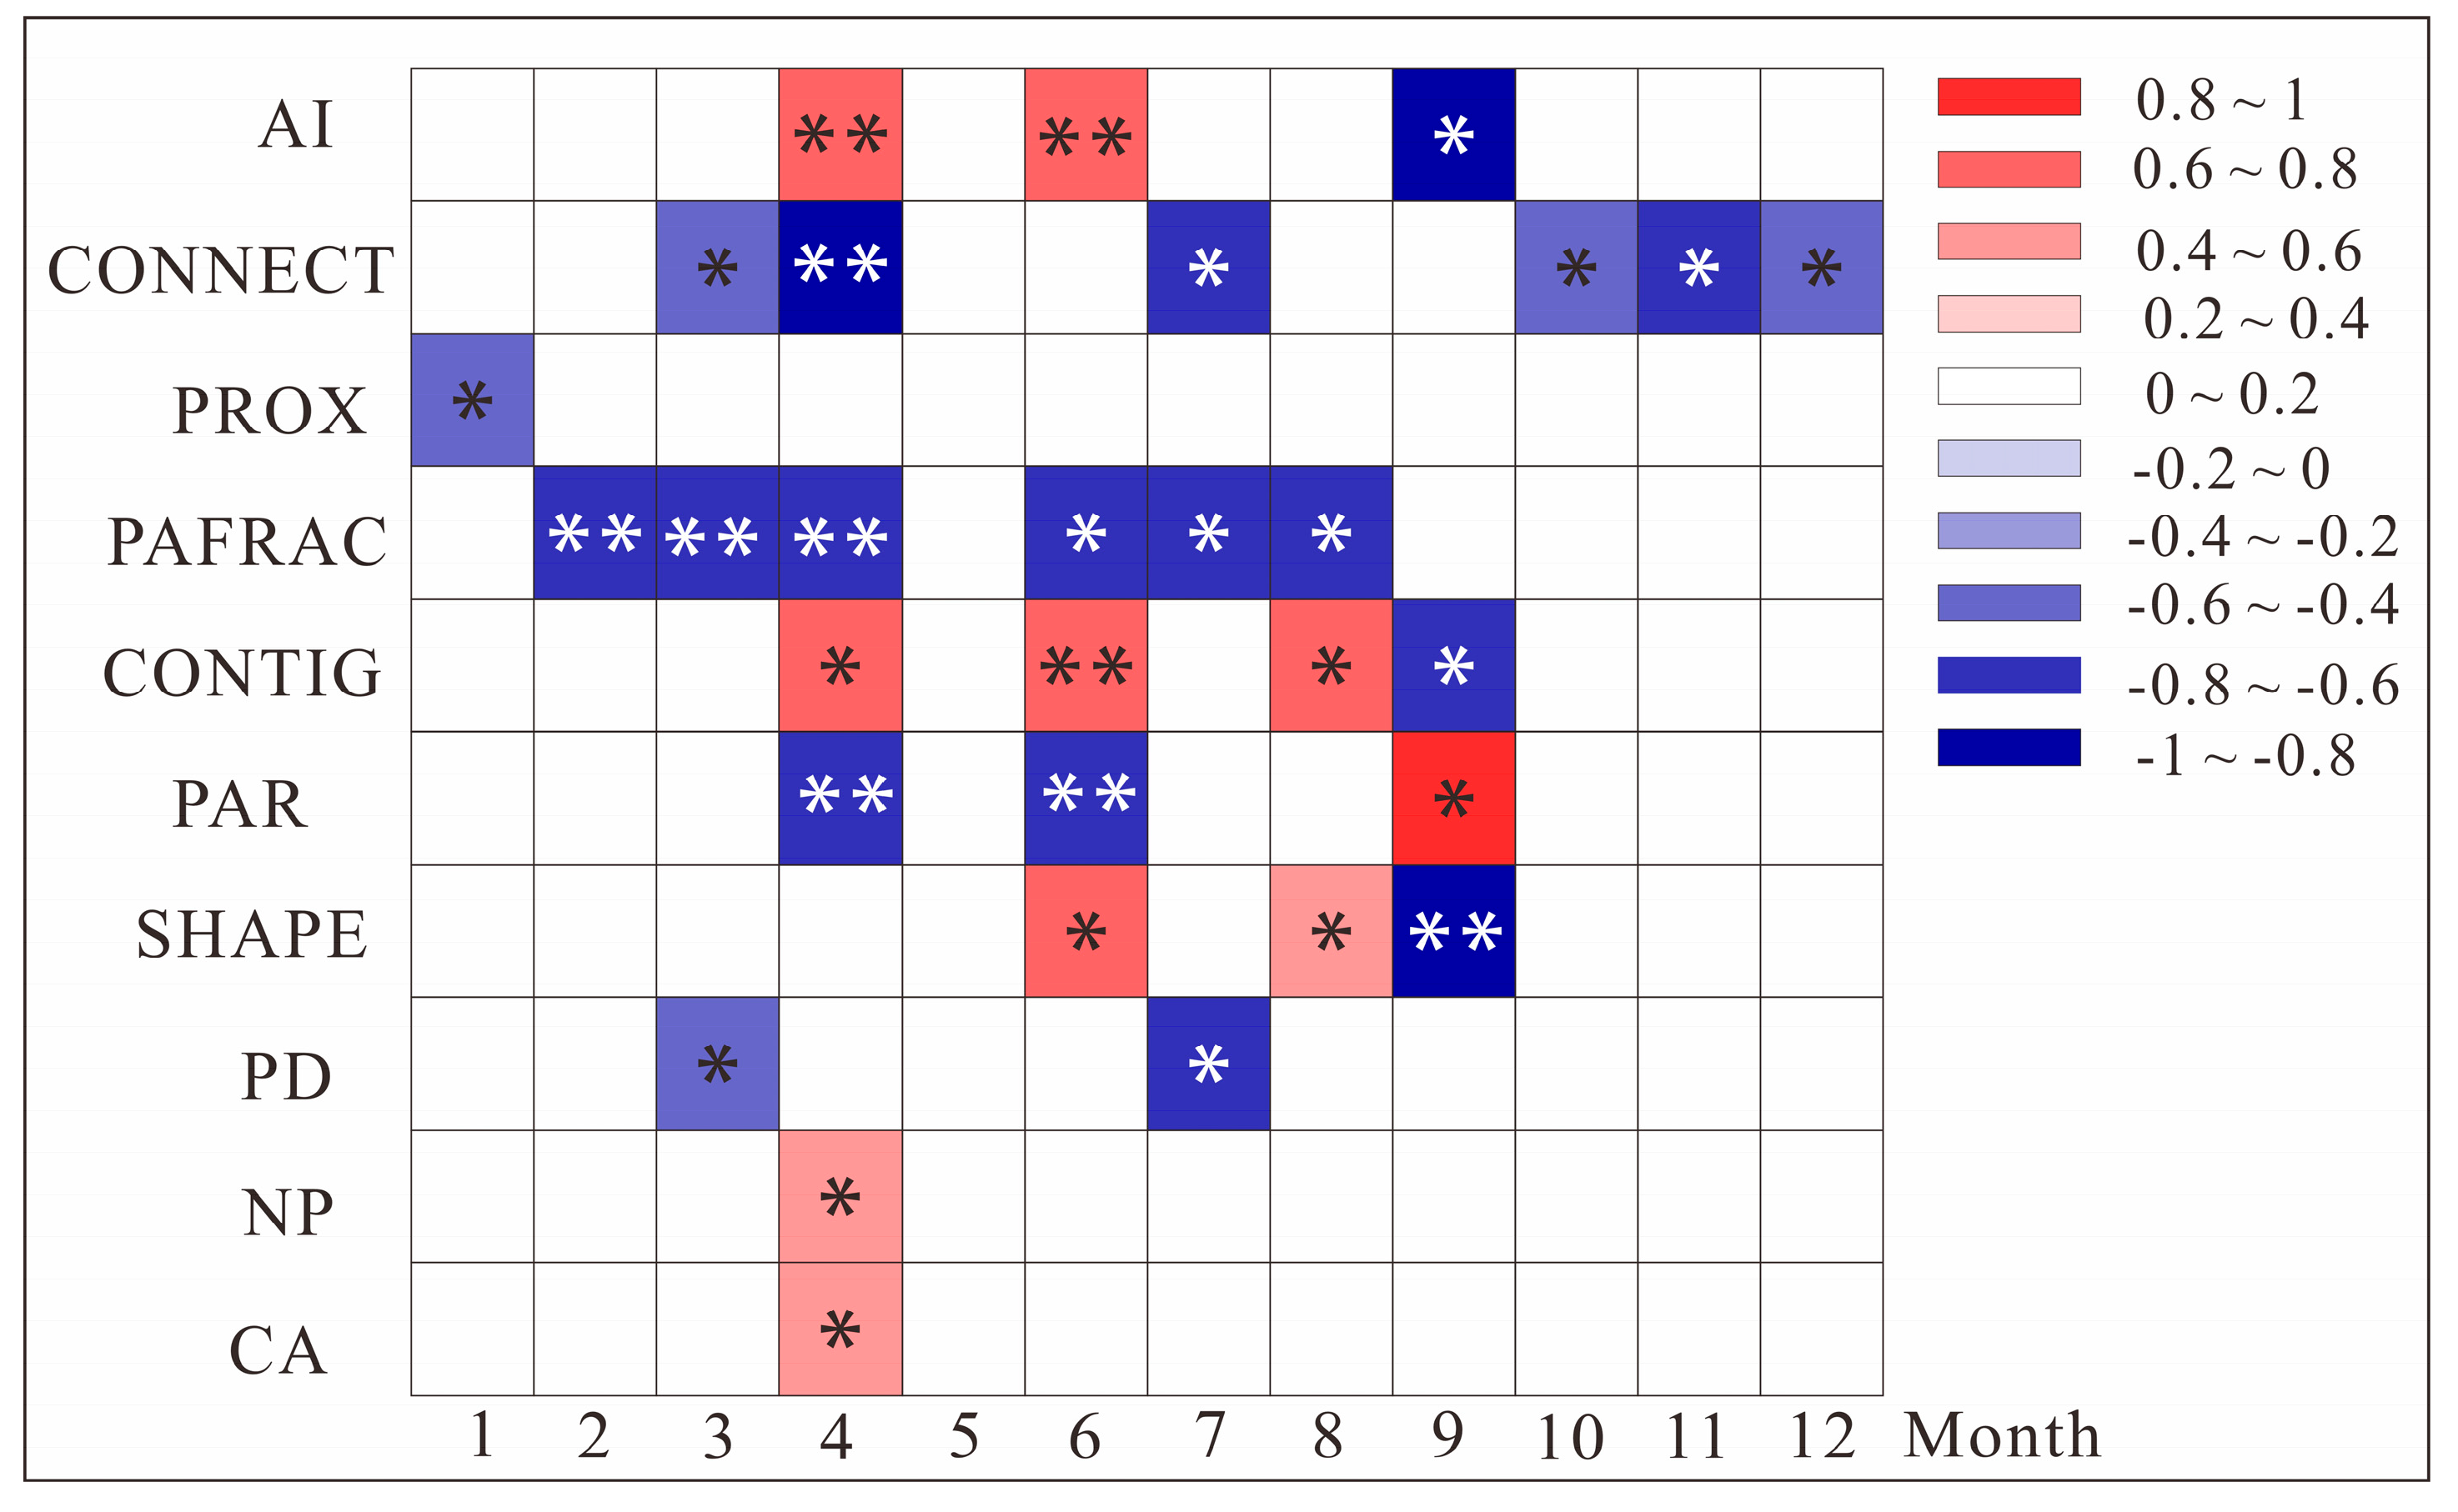
3.4. Correlations Between the Landscape Metrics of On-Year and Off-Year Moso Bamboo Forests and TVDI Values

The spatial distributions of the on-year Moso bamboo forests had a remarkable impact on soil moisture throughout the entire year. The landscape metrics, including CA, NP, PD, PAR, and CONTIG, showed significant positive correlations with the TDVI (p < 0.05) (Figure 7). In contrast, the landscape metrics of PROX, PAFRAC, CONNECT, and AI were negatively correlated with the TDVI (p < 0.05). Additionally, the SHAPE and PROX indicators exhibited inverse correlations with the TVDI in May and September (Figure 7). It is worth noting that among various metrics, those reflecting landscape scale and spatial connectivity had a more pronounced effect on soil moisture. They had significant correlations with the TVDI for nearly half a year, including CA, PAFRAC, and CONNECT (Figure 7).
To distinguish and evaluate the effects of the off-year Moso bamboo forests on SSM, a correlation analysis was conducted between the landscape metrics of off-year Moso bamboo forests and the TVDI values. The results showed that the spatial distribution of the off-year Moso bamboo forests significantly influenced soil moisture (Figure 8). However, there were obvious differences in the time period and landscape metrics. Specifically, the indices of CONNECT, PROX, PAFRAC, and PAR exhibited significant negative correlations with the TDVI, while CA, NP, CONTIG, SHAPE, and AI demonstrated positive correlations with the TDVI across most time periods (p < 0.05) (Figure 8).

4. Discussion

4.1. Heterogeneity of SSM in On/Off-Year Moso Bamboo Forests

Table 4 indicates that in the process of estimating the TDVI, although the wet edge fitting equations of individual months are validated (p < 0.05), the coefficients of determination remain relatively low (Table 4). Typically, the wet edge of the triangular feature space approximates a horizontal line parallel to the X-axis (Figure 2). Previous studies directly simplify the wet edge to a horizontal straight line when estimating soil moisture [44]. Nevertheless, some research has indicated that the wet edge is more akin to an inclined straight line. Hence, performing a linear fit for the wet edge is rational [45]. However, due to the near-horizontal characteristic of the wet edge, the coefficient of determination for its linear fitting is relatively low, usually around 0.5 [46]. Therefore, it is believed that the low coefficients of determination of individual wet edges will not significantly affect the final estimation accuracy of the TVDI and SSM.
The phenomena of on/off-year Moso bamboo intensify the heterogeneity of soil moisture at the patch scale (Figure 5 and Figure 6). In on-year Moso bamboo forests, underground bamboo shoots start their growth from March to May each year, with bamboo leaves beginning to sprout by the end of May [14]. Subsequently, above-ground branches and leaves spread out extensively in June, and the vigorous growth period is from July to September [47]. During this phase, the water requirement for on-year Moso bamboo is significantly greater than that for off-year Moso bamboo due to the growth of underground bamboo shoots and new bamboo foliage (Figure 5). By late September and early October, the growth of bamboo shoots and leaves in the on-year Moso bamboo forests comes to an end. Conversely, the growth of rhizomes in the off-year Moso bamboo forests reaches its peak. During this stage, substantial amounts of water and nutrients are required to provide a foundation for the next year’s bamboo shoots growth [48,49,50]. Therefore, SSM in the off-year Moso bamboo forests is lower than that observed in the on-year Moso bamboo forests (Figure 5).
The on-year and off-year phenomena of Moso bamboo forests can also lead to heterogeneity in soil physical properties [19]. There exists a mismatch between the growth stages of on-year and off-year Moso bamboo, resulting in the emergence of a large number of new roots during their respective lifetimes [51]. A high proportion of root channels contributes to increased soil porosity and enhances the infiltration capacity for soil moisture [52,53], which accounts for the differences in SSM between the two types of Moso bamboo. Furthermore, evapotranspiration plays a crucial role in soil moisture consumption [54]. For instance, during the growth stage of on-year Moso bamboo, off-year Moso bamboo accumulates more soil water by reducing evapotranspiration with less leaf area, leading to a high TDVI (Figure 5).

4.2. Effects of Spatial Distribution Patterns of On/Off-Year Moso Bamboo Forests on SSM

Landscape spatial patterns play a crucial role in influencing energy and material flows, thereby determining ecological and hydrological processes [55]. Our findings demonstrate that the landscape patterns in Moso bamboo forests, as described by landscape metrics, have an obvious impact on soil moisture retention at the regional scale. This is particularly evident for indices such as PAR, CONTIG, PAFRAC, and CONNECT (Figure 7 and Figure 8). With the large patch area, high number and patch density, and significant overlap, the spatial distribution of the on-year Moso bamboo forests play a significant negative role in soil moisture retention during the period of January to September (i.e., the growing season of on-year Moso bamboo) (Figure 7). High patch density and larger patch areas are associated with greater leaf area and extensive underground root systems. On one hand, the growth of underground bamboo shoots requires water; on the other hand, aboveground leaves consume water through evapotranspiration.
Interestingly, our research results reveal that enhancing the edge complexity and spatial connectivity of on-year Moso bamboo patches can effectively reduce soil moisture consumption (Figure 7). Previous studies have demonstrated that larger patches are essential for maintaining ecosystem stability due to their more intricate structures and functions, such as nutrient and energy cycling [56,57,58]. In our study, the high connectivity of on-year Moso bamboo also facilitates the formation of dominant patches with greater areas, thereby accelerating material and energy flux circulation, improving soil moisture utilization efficiency, and ultimately decreasing overall water consumption. Similarly, in off-year Moso bamboo forests during their sprouting and leaf growth stages, the PAFRAC, PROX, and CONNECT indices exhibit positive correlations with SSM (Figure 8).

4.3. Implications for the Rational Management of Moso Bamboo Forests

With the rapid development of the Moso bamboo industry, extensive artificial Moso bamboo forests have emerged in Huoshan County [33]. Despite Moso bamboo becoming the major ecological and economic forest species in the region, few studies consider the impact of Moso bamboo forests on water utilization and consumption in water-deficient mountain areas [59]. Our study clearly reveals that the on-year and off-year phenomena of Moso bamboo forests have a significant impact on soil moisture status, which serves as a critical limiting factor for regional soil and water conservation. In comparison to off-year Moso bamboo, on-year Moso bamboo forests yield greater quantities of bamboo shoots and branches during their growth period, thereby generating higher economic value; however, they concurrently consume more soil moisture.
In this context, blindly expanding the on-year Moso bamboo forests through artificial management may not be conducive to regional soil and water conservation. Notably, our results suggest that when fixed-area on-year Moso bamboo forests are distributed in a more contiguous and complex spatial configuration, soil moisture consumption can be effectively reduced (Figure 7). Therefore, we propose that while maintaining the overall management area of on-year Moso bamboo forests, more attention should be paid to enhance their connectivity and edge complexity, to achieve a win–win situation in both the economic benefits and ecological functions of Moso bamboo forests.

5. Conclusions

To analyze the effects of the on-year and off-year phenomena on soil moisture, we extracted the spatial distribution of the on-year and off-year Moso bamboo and corresponding drought index (TDVI) based on remote sensing images by employing the YCBI, NDVI-LST triangular feature space, and landscape metrics. Although the coefficients of determination of individual wet edges are relatively low, considering the inherent characteristics of the triangular feature space, it still meets the evaluation accuracy of the TDVI. This study provides a new perspective for understanding how the on/off-year phenomena influence regional water resources. Our results indicated that the growth stages and phenological features of Moso bamboo forests intensify the heterogeneity of soil moisture at the patch scale. Water requirements for the emergence of underground bamboo shoots and the evapotranspiration of leaves and branches are two critical factors. Moreover, the spatial distribution patterns of on-year and off-year Moso bamboo forests play an important role in maintaining soil water. Fragmented and discretely distributed patches of Moso bamboo forests are not conducive to soil and water conservation in mountainous regions with limited water resources. Therefore, our results emphasized the positive impact of spatial connectivity among Moso bamboo forests on maintaining soil moisture. The spatial connectivity and edge complexity should be taken into consideration in their future management to achieve a win–win situation in terms of economic benefits and ecological functions.

Author Contributions

Conceptualization, W.Z. and J.Z.; methodology, W.Z. and L.L.; validation, N.L. and L.J.; formal analysis, W.Z. and J.Z.; investigation, W.Z. and T.S.; resources, L.J. and T.S.; data curation, L.L. and N.L.; writing—original draft preparation, W.Z.; writing—review and editing, J.Z.; visualization, T.S. and L.J.; supervision, J.Z.; project administration, W.Z.; funding acquisition, W.Z. and J.Z. All authors have read and agreed to the published version of the manuscript.

Funding

This research was funded by the University Natural Science Research Project of Anhui Province (2022AH051111 and 2023AH051617), the Chuzhou University Research and Development Fund for the Talent Startup Project (2022qd005 and 2023qd01), and the National Natural Science Foundation of China (42301146).

Data Availability Statement

The original contributions presented in this study are included in the article. Further inquiries can be directed to the corresponding authors.

Conflicts of Interest

The authors declare no conflicts of interest.

Appendix A

Table A1. Description of the landscape metrics.
Landscape MetricsDescription
CAthe area (ha) of each landscape class
NPthe total number of patches for each landscape class
PDthe number of patches of the corresponding landscape class divided by 100 ha.
SHAPE0.25 times the sum of the entire landscape boundary and all edge segments within the landscape boundary involving the corresponding patch type, divided by the square root of the total landscape area
PARthe ratio of the patch perimeter (m) to the area (m2)
CONTIGaverage contiguity value for the cells in a patch (i.e., sum of the cell values divided by the total number of pixels in the patch) minus 1, divided by the sum of the template values minus 1.
PAFRAC2 times the logarithm of patch perimeter (m) divided by the logarithm of patch area (m2)
PROXthe sum of patch area (m2) divided by the nearest edge-to-edge distance squared (m2) between the patch and the focal patch of all patches of thecorresponding patch type whose edges are within a specified distance (m) of the focal patch
CONNECTthe number of functional joinings between all patches of the corresponding patch, divided by the total number of possible joinings between all patches of the corresponding patch type, multiplied by 100 to convert to a percentage
AIthe number of like adjacencies involving the corresponding class, divided by the maximum possible number of like adjacencies involving the corresponding class, which is achieved when the class is maximally clumped into a single, compact patch; this is multiplied by 100 (to convert to a percentage)

References

  1. Xu, X.; Du, H.; Zhou, G.; Ge, H.; Shi, Y.; Zhou, Y.; Fan, W.L.; Fan, W.Y. Estimation of aboveground carbon stock of Moso bamboo (Phyllostachys heterocycla var. pubescens) forest with a Landsat Thematic Mapper image. Int. J. Remote Sens. 2011, 32, 1431–1448. [Google Scholar] [CrossRef]
  2. Li, P.; Zhou, G.; Du, H.; Lu, D.; Mo, L.; Xu, X.; Shi, Y.; Zhou, Y. Current and potential carbon stocks in Moso bamboo forests in China. J. Environ. Manag. 2015, 156, 89–96. [Google Scholar] [CrossRef]
  3. Li, L.; Li, N.; Lu, D.; Chen, Y. Mapping Moso bamboo forest and its on-year and off-year distribution in a subtropical region using time-series Sentinel-2 and Landsat 8 data. Remote Sens. Environ. 2019, 231, 111265. [Google Scholar] [CrossRef]
  4. Hou, Y.; Gan, J.; Fan, Z.; Sun, L.; Garg, V.; Wang, Y.; Li, S.; Bao, P.; Cao, B.; Varshney, R.; et al. Haplotype-based pangenomes reveal genetic variations and climate adaptations in moso bamboo populations. Nat. Commun. 2024, 15, 8085. [Google Scholar] [CrossRef] [PubMed]
  5. Zheng, S.; Wei, S.; Li, J.; Wang, J.; Deng, Z.; Gu, R.; Fan, S.; Liu, G. The phenotypic variation in Moso bamboo and the selection of key traits. Plants 2024, 13, 1625. [Google Scholar] [CrossRef]
  6. Ouyang, M.; Yang, P.; Chen, X.; Yang, G.; Shi, J.; Fang, X. Effects of the expansion of Phyllostachys edulis on species composition, structure and diversity of the secondary evergreen broad-leaved forests. Biodivers. Sci. 2016, 24, 649–657. [Google Scholar] [CrossRef]
  7. Chen, Y.; Lai, Y.; Li, W.; Yang, C.; Chen, C.; Liu, Z.; Zhang, Z. Effects of forest density on water conservation capacity of Phyllostachys pubescens in Chongyang. Hubei For. Sci. Technol. 2017, 46, 7–13. [Google Scholar]
  8. Mertens, B.; Hua, L.; Belcher, B.; Ruiz-Pérez, M.; Fu, M.; Yang, X. Spatial patterns and processes of bamboo expansion in Southern China. Appl. Geogr. 2008, 28, 16–31. [Google Scholar] [CrossRef]
  9. Han, N.; Du, H.; Zhou, G.; Xu, X.; Cui, R.; Gu, C. Spatiotemporal heterogeneity of Moso bamboo aboveground carbon storage with Landsat Thematic Mapper images: A case study from Anji County, China. Int. J. Remote Sens. 2013, 34, 4917–4932. [Google Scholar] [CrossRef]
  10. Zhao, Y.; Feng, D.; Jayaraman, D.; Belay, D.; Sebrala, H.; Ngugi, J.; Maina, E.; Akombo, R.; Otuoma, J.; Mutyaba, J.; et al. Bamboo mapping of Ethiopia, Kenya and Uganda for the year 2016 using multi-temporal Landsat imagery. Int. J. Appl. Earth Obs. Geoinf. 2018, 66, 116–125. [Google Scholar] [CrossRef]
  11. Goswami, J.; Tajo, L.; Sarma, K. Bamboo resources mapping using satellite technology. Curr. Sci. 2010, 99, 650–653. [Google Scholar]
  12. Li, M.; Li, C.; Jiang, H.; Fang, C.; Yang, J.; Zhu, Z.; Shi, L.; Liu, S.; Gong, P. Tracking bamboo dynamics in Zhejiang, China, using time-series of Landsat data from 1990 to 2014. Int. J. Remote Sens. 2016, 37, 1714–1729. [Google Scholar] [CrossRef]
  13. Zhou, Y.; Zhou, G.; Du, H.; Shi, Y.; Mao, F.; Liu, Y.; Xu, L.; Li, X.; Xu, X. Biotic and abiotic influences on monthly variation in carbon fluxes in on-year and off-year Moso bamboo forest. Trees-Struct. Funct. 2019, 33, 153–169. [Google Scholar] [CrossRef]
  14. Gratani, L.; Crescente, M.F.; Varone, L.; Fabrini, G.; Digiulio, E. Growth pattern and photosynthetic activity of different bamboo species growing in the botanical garden of Rome. Flora 2008, 203, 77–84. [Google Scholar] [CrossRef]
  15. Zhou, B.; Li, Z.; Wang, X.; Cao, Y.; An, Y.; Deng, Z.; Letu, G.; Wang, G.; Gu, L. Impact of the 2008 ice storm on moso bamboo plantations in southeast China. J. Geophys. Res. Bio-Geosci. 2011, 116, G00H06. [Google Scholar] [CrossRef]
  16. Li, L.; Wu, T.; Zhu, H.; Zhang, W.; Gong, Y.; Yang, C.; Li, N. Characterizing the spatial patterns of on- and off-year Moso bamboo forests with multisource data in Southeast China. Remote Sens. Appl. 2022, 27, 100781. [Google Scholar] [CrossRef]
  17. Li, L.; Zhu, H.; Wu, T.; Wei, L.; Li, N. New landscape-perspective exploration of Moso bamboo forests under on/off-year phenomena and human activities. Front. For. Glob. Change 2023, 6, 1204329. [Google Scholar] [CrossRef]
  18. Umemura, M.; Takenaka, C. Retranslocation and localization of nutrient elements in various organs of moso bamboo (Phyllostachys pubescens). Sci. Total Environ. 2014, 493, 845–853. [Google Scholar] [CrossRef]
  19. Leng, L.; Zhou, Y.; Dong, W.; Wu, Z.; Zhang, X.; Zhang, J.; Wan, Z. Effect of on-year and off-year management models on soil organic carbon componen contents in Moso bamboo forest. World Bamboo Ratt. 2024, 22, 29–34. [Google Scholar]
  20. Zhang, W.; Yi, S.; Qin, Y.; Sun, Y.; Shangguan, D.; Meng, B.; Li, M.; Zhang, J. Effects of patchiness on surface soil moisture of alpine meadow on the northeastern Qinghai-Tibetan Plateau: Implications for grassland restoration. Remote Sens. 2020, 12, 4121. [Google Scholar] [CrossRef]
  21. Zhang, W.; Yi, S.; Qin, Y.; Zhang, J. Effects of Patchiness on soil properties and degradation of alpine meadow on the Qinghai-Tibetan Plateau. Land 2024, 13, 1556. [Google Scholar] [CrossRef]
  22. Sun, H.; Jiang, H.; Gomg, S.; Chen, X. Variation characteristics of water vapor flux over Anji Phyllostachys edulis forest ecosystem in on-and-off years. J. For. Res. 2017, 45, 22–27. [Google Scholar]
  23. Xia, E.; Nong, J.; Wei, S.; Liu, X.; Liu, G. Changes in soil nutrient characteristics in Moso bamboo forest expanding into broadleaved forest. Energy Environ. Sci. 2022, 31, 1110–1117. [Google Scholar]
  24. Liu, Y.; Jiang, H.; Zhou, G.; Chen, Y.; Sun, C.; Yang, S. Water vapor flux variation characteristic and the relationship with its environment factors in Phyllostachys edulis forest in Anji. Acta Ecol. Sin. 2014, 34, 4900–4909. [Google Scholar]
  25. Zhang, Y.; Fan, L.; Huang, X.; Xiong, T.; Rong, J.; Li, S.; Zheng, Y. Effects of eclamation and fertilization on growth and soil nutrient content after strip clear cutting in Phyllostachys edulis forests. Chin. J. Trop. Crops 2021, 42, 1047–1054. [Google Scholar]
  26. Wang, S.; Fan, S.; Guan, F.; Xiao, X.; Zhang, M. Short-term influence of strip cutting on soil physical and chemical properties and dominant flora in Phyllostachys edulis stands. J. For. Res. 2022, 50, 46–51. [Google Scholar]
  27. Goward, S.; Cruickshanks, G.; Hope, A. Observed relation between thermal emission and reflected spectral radiance of a complex vegetated landscape. Remote Sens. Environ. 1985, 18, 137–146. [Google Scholar] [CrossRef]
  28. Carlson, T.; Gillies, R.; Schmugge, T. An interpretation of methodologies for indirect measurement of soil water content. Agric. For. Meteorol. 1995, 77, 191–205. [Google Scholar] [CrossRef]
  29. Hassan, Q.; Bourque, C.; Meng, F.; Cox, R. A wetness index using terrain-corrected surface temperature and normalized difference vegetation index derived from standard MODIS products: An evaluation of its use in a humid forest dominated region of eastern Canada. Sensors 2007, 7, 2028–2048. [Google Scholar] [CrossRef] [PubMed]
  30. Šímová, P.; Gdulová, K. Landscape indices behavior: A review of scale effects. Appl. Geogr. 2012, 34, 385–394. [Google Scholar] [CrossRef]
  31. Zhao, Y.; Han, B.; Peng, H.; Wang, X.; Chu, S.; Dai, J.; Peng, D. Identification of “Huoshan shihu” Fengdou: Comparative authentication of the Daodi herb Dendrobium huoshanense and its related species by macroscopic and microscopic features. Microsc. Res. Techniq. 2017, 80, 712–721. [Google Scholar] [CrossRef] [PubMed]
  32. Li, Z.; Hu, B.; Wang, Z.; Guo, X. Analysis of influencing factors and sources of heavy metals in surface soil of Huoshan County. Ground Water 2024, 46, 134–138. [Google Scholar]
  33. Gao, M. Problems of bamboo industry development in Huoshan county and its countermeasures. Mod. Adv. Agric. Sci. Technol. 2023, 837, 206–209. [Google Scholar]
  34. Adler-Golden, S.; Matthew, M.; Bernstein, L.; Levine, R.; Berk, A.; Richtsmeier, S.; Acharya, P.; Anderson, G.; Felde, G.; Gardner, J.; et al. Atmospheric correction for short-wave spectral imagery based on MODTRAN4. Proc. SPIE-Int. Soc. Opt. Eng. 1999, 3753, 61–69. [Google Scholar]
  35. Carlson, T. An overview of the “triangle method’’ for estimating surface evapotranspiration and soil moisture from satellite imagery. Sensors 2007, 7, 1612–1629. [Google Scholar] [CrossRef]
  36. Stisen, S.; Sandholt, I.; Norgaard, A.; Fensholt, R.; Jensen, K. Combining the method with thermal inertia to estimate regional evapotranspiration-applied to MSG-SEVIRI data in the Senegal River basin. Remote Sens. Environ. 2008, 112, 1242–1255. [Google Scholar] [CrossRef]
  37. Sandholt, I.; Rasmussen, K.; Andersen, J. A simple interpretation of the surface temperature vegetation index space for assessment of surface moisture status. Remote Sens. Environ. 2002, 79, 213–224. [Google Scholar] [CrossRef]
  38. Holidi; Armanto, M.; Damiri, N.; Putranto, D. Characteristics of selected peatland uses and soil moisture based on TVDI. J. Ecol. Eng. 2019, 20, 194–200. [Google Scholar] [CrossRef]
  39. Yuan, L.; Li, L.; Zhang, T.; Chen, L.; Zhao, J.; Hu, S.; Cheng, L.; Liu, W. Soil moisture estimation for the Chinese Loess Plateau using MODIS-derived ATI and TVDI. Remote Sens. 2020, 12, 3040. [Google Scholar] [CrossRef]
  40. Du, L.; Song, N.; Liu, K.; Hou, J.; Hu, Y.; Zhu, Y.; Wang, X.; Wang, L.; Guo, Y. Comparison of two simulation methods of the temperature vegetation dryness index (TVDI) for drought monitoring in semi-arid regions of China. Remote Sens. 2017, 9, 177. [Google Scholar] [CrossRef]
  41. Yang, L.; Hou, C.; Zhao, M.; Bai, Y.; Su, Z. Study on soil moisture content inversion in an arid area based on Landsat-8 imagery. Chin. J. Soil Sci. 2021, 52, 47–54. [Google Scholar]
  42. Qin, Y.; Zhang, T.; Yi, G.; Wei, P.; Yang, D. Remote sensing monitoring and analysis of influencing factors of drought in lnner Mongolia growing season since 2000. J. Nat. Resour. 2021, 36, 459–475. [Google Scholar]
  43. Patel, N.; Anapashsha, R.; Kumar, S.; Saha, S.; Dadhwal, V. Assessing potential of Modis derived temperature/vegetation condition index (TVDI) to infer soil moisture status. Int. J. Remote Sens. 2009, 30, 23–39. [Google Scholar] [CrossRef]
  44. Tang, R.; Li, Z.; Tang, B. An application of the Ts–VI triangle method with enhanced edges determination for evapotranspiration estimation from MODIS data in arid and semi-arid regions: Implementation and validation. Remote Sens. Environ. 2010, 114, 540–551. [Google Scholar] [CrossRef]
  45. Wu, M.; Ding, J.; Wang, G. Regional soil moisture inversion based on surface temperature and vegetation index characteristic spaces. J. Desert Res. 2012, 32, 148–154. [Google Scholar]
  46. Yang, X.; Wu, J.; Yan, F.; Zhang, J. Assessment of regional soil moisture status based on characteristics of surface temperature/vegetation index space. Acta Ecol. Sin. 2009, 29, 1205–1216. [Google Scholar]
  47. Huang, Z.; Li, Q.; Gai, X.; Zhang, X.; Zhong, Z.; Bian, F.; Yang, C. Effects of on- and off-year management practices on the soil organic C fractions and microbial community in a Moso bamboo (Phyllostachys edulis) forest in subtropical China. Front. Plant Sci. 2022, 13, 1020344. [Google Scholar] [CrossRef]
  48. Wu, J.; Zhou, G.; Xu, Q.; Yang, F. Spatial distribution of nutrition element and its relationship with soil nutrients in different years of Phyllostachys pubescens. Sci. Silvae Sin. 2005, 41, 171–173. [Google Scholar]
  49. Ito, R.; Miyafuji, H.; Kasuya, N. Characterization of the rhizome of moso bamboo. Zairyo 2014, 63, 865–870. [Google Scholar] [CrossRef]
  50. Huang, Z.; Zhong, Z.; Zhang, X.; Bian, F.; Gai, X.; Li, Q. Formation mechanism and regulation measures of on-year and off-year of Moso bamboo forest: A review. World For. Res. 2021, 34, 20–25. [Google Scholar]
  51. Song, X.; Gu, H.; Wang, M.; Zhou, G.; Li, Q. Management practices regulate the response of moso bamboo foliar stoichiometry to nitrogen deposition. Sci. Rep. 2016, 6, 24107. [Google Scholar] [CrossRef] [PubMed]
  52. Gill, R.; Burke, I.; Milchunas, D.; Lauenroth, W. Relationship between root biomass and soil organic matter pools in the shortgrass steppe of eastern Colorado. Ecosystems 1999, 2, 226–236. [Google Scholar]
  53. Van Schaik, N. Spatial variability of infiltration patterns related to site characteristics in a semi-arid watershed. Catena 2009, 78, 36–47. [Google Scholar] [CrossRef]
  54. Rivas, R.; Caselles, V. A simplified equation to estimate spatial reference evaporation from remote sensing-based surface temperature and local meteorological data. Remote Sens. Environ. 2004, 93, 68–76. [Google Scholar] [CrossRef]
  55. Wu, J.; Hobbs, R. Key issues and research priorities in landscape ecology: An idiosyncratic synthesis. Landsc. Ecol. 2002, 17, 355–365. [Google Scholar] [CrossRef]
  56. Maestre, F.; Cortina, J. Insights into ecosystem composition and function in a sequence of degraded semiarid steppes. Restor. Ecol. 2004, 12, 494–502. [Google Scholar] [CrossRef]
  57. Heras, M.; Saco, P.; Willgoose, G.; Tongway, D. Assessing landscape structure and pattern fragmentation in semiarid ecosystems using patch-size distributions. Ecol. Appl. 2011, 21, 2793–2805. [Google Scholar] [CrossRef] [PubMed]
  58. Ge, X.; Dong, K.; Luloff, A.; Wang, L.; Xiao, J.; Wang, S.; Wang, Q. Correlation between landscape fragmentation and sandy desertification: A case study in Horqin Sandy Land, China. Environ. Monit. Assess. 2016, 188, 62. [Google Scholar] [CrossRef] [PubMed]
  59. Jiang, W.; Hu, Y.; Wang, J.; Sun, P.; Zhang, Q.; Huang, N.; Zhang, X.; Wang, W. Natural rainfall affects soil erosion of typical vegetation in Dabie Mountains, Anhui Province. J. Beijing Norm. Univ. Nat. Sci. 2021, 57, 265–273. [Google Scholar]
Figure 1. Study area (c) and its location in Anhui Province (b) and China (a). (d) sampling sites of on-year (yellow dots) and off-year (red dots) Moso bamboo forests, respectively.
Forests 16 00333 g001
Figure 2. Schematic diagram of the triangular variant of trapezoidal space.
Forests 16 00333 g002
Figure 3. Spatial distribution of the on-year and off-year Moso bamboo forests.
Forests 16 00333 g003
Figure 4. Monthly variation in the spatial distributions of the TVDI.
Forests 16 00333 g004
Figure 5. Monthly variation characteristics of the TVDI in the on-year and off-year Moso bamboo forests. The middle bold lines within the box represent median values, hollow squares represent mean values, and the short lines at the end of the vertical line represent the 5%~95% interval.
Forests 16 00333 g005
Figure 6. Differences in the TDVI between the on-year and off-year Moso bamboo forests among the six Moso bamboo widely distributed towns.
Forests 16 00333 g006
Figure 7. Correlation analysis between TDVI values and landscape metrics of the on-year Moso bamboo forests. CA: class area; NP: number of patches; PD: patch density; SHAPE: shape index; PAR: perimeter-area ratio; CONTIG: contig index; PAFRAC: perimeter area fractal dimension index; PROX: proximity index; CONNECT: connect index; AI: aggregation index. (** indicates p < 0.01, * indicates p < 0.05, no marks indicate the correlation is not significant).
Forests 16 00333 g007
Figure 8. Correlation analysis between TDVI values and landscape metrics of the off-year Moso bamboo forests. CA: class area; NP: number of patches; PD: patch density; SHAPE: shape index; PAR: perimeter-area ratio; CONTIG: contig index; PAFRAC: perimeter area fractal dimension index; PROX: proximity index; CONNECT: connect index; AI: aggregation index. (** indicates p < 0.01, * indicates p < 0.05, no marks indicate the correlation is not significant).
Forests 16 00333 g008
Table 1. Remote sensing dataset used in the study.
DatasetAcquisition DateStrip NumberCloud Volume
Sentinel-2B18/02/2021, 09/05/2021, 04/05/202232/50RLV, 50RMV<5%
Landsat-703/05/2021, 04/06/2021122/38<15%
Landsat-819/01/2021, 20/02/2021, 24/03/2021, 09/04/2021, 30/07/2021, 31/08/2021, 16/09/2021, 02/10/2021, 21/11/2021, 21/12/2021122/38<15%
Table 2. List of landscape metrics used in this study.
Landscape MetricsUnitAbbreviation
Class areahaCA
Number of patchesnumberNP
patch densitynumber/100 haPD
Shape indexnoneSHAPE
Perimeter-area rationonePAR
Contiguity indexnoneCONTIG
Perimeter area fractal dimension indexnonePAFRAC
Proximity indexnonePROX
Connectance indexpercentCONNECT
Aggregation indexpercentAI
Notes: see Table A1 for detailed descriptions of the landscape metrics.
Table 3. Evaluation of the classification accuracy of Moso bamboo forests.
Types of
Moso Bamboo Forests
Producer’s
Accuracy (%)
User’s
Accuracy (%)
Overall
Accuracy (%)
Kappa
Coefficient
On-year Moso
bamboo forests
9189880.81
Off-year Moso
bamboo forests
8992
Table 4. Linear regression equations for dry and wet edges in triangular feature spaces.
DateDry EdgesWet Edges
Regression
Equations
Coefficient of
Determination (R2)
Regression
Equations
Coefficient of
Determination (R2)
19/01/2021Dy = 20.6 − 5.33x0.62Wy = 4.57 − 1.92x0.34
20/02/2021Dy = 32.1 − 11.4x0.64Wy = 13.3 − 5.86x0.42
24/03/2021Dy = 41.3 − 13.7x0.66Wy = 19.9 − 5.06x0.43
09/04/2021Dy = 34.5 − 13.1x0.77Wy = 5.91 + 6.84x0.55
03/05/2021Dy = 35.3 − 11.2x0.53Wy = −65.9 + 96.8x0.86
04/06/2021Dy = 49.6 − 16.5x0.61Wy = −24.9 + 30.1x0.21
30/07/2021Dy = 53.7 − 19.3x0.74Wy = −0.9 + 16.9x0.76
31/08/2021Dy = 59.9 − 20.1x0.63Wy = 13.2 + 7.5x0.57
16/09/2021Dy = 46.4 − 14.6x0.64Wy = 11.0 + 3.86x0.68
02/10/2021Dy = 47.4 − 12.8x0.64Wy = 26.1 − 5.65x0.58
03/11/2021Dy = 30.4 − 10.3x0.87Wy = 2.13 + 7.31x0.72
21/12/2021Dy = 22.6 − 5.56x0.60Wy = 8.73 − 5.07x0.63
Disclaimer/Publisher’s Note: The statements, opinions and data contained in all publications are solely those of the individual author(s) and contributor(s) and not of MDPI and/or the editor(s). MDPI and/or the editor(s) disclaim responsibility for any injury to people or property resulting from any ideas, methods, instructions or products referred to in the content.

