Article

Landslide Traces Inventory and Spatial Distribution Analysis Along the Hubei Section of the Jinsha River–Hubei Ultra-High-Voltage Transmission Line, China

1
National Institute of Natural Hazards, Ministry of Emergency Management of China, Beijing 100085, China
2
Key Laboratory of Compound and Chained Natural Hazards Dynamics, Ministry of Emergency Management of China, Beijing 100085, China
3
School of Geology and Mining Engineering, Xinjiang University, Urumqi 830047, China
4
School of Emergency Management Science and Engineering, University of Chinese Academy of Sciences, Beijing 100049, China
5
Institute of Geology and Geophysics, Chinese Academy of Sciences, Beijing 100029, China
6
Power China Beijing Engineering Corporation Limited, Beijing 100024, China
*
Author to whom correspondence should be addressed.
Forests 2025, 16(11), 1686; https://doi.org/10.3390/f16111686
Submission received: 30 September 2025 / Revised: 25 October 2025 / Accepted: 3 November 2025 / Published: 5 November 2025
(This article belongs to the Section Natural Hazards and Risk Management)

Abstract

Transmission lines often traverse mountainous regions prone to frequent geological hazards, making it of great practical significance to analyze the spatial distribution patterns of landslide traces along the transmission line corridors. This study focuses on the Hubei section of the ±800 kV ultra-high-voltage (UHV) transmission line from the upper reaches of the Jinsha River to Hubei. Based on high-resolution remote sensing imagery provided by Google Earth, a landslide traces inventory was constructed through visual interpretation. In addition, 13 factors, such as elevation, slope, aspect, relief, soil type and land cover, were selected to analyze the spatial distribution of landslides. The results indicate the following: (1) There are at least 18,598 landslides in the study area, with a total area of approximately 2671.82 km2. The spatial distribution is uneven, exhibiting a general pattern of “dense in the west, sparse in the east”. The maximum landslide number density (LND) reaches 4.16 km−2, and the maximum landslide area percentage (LAP) is 0.83%. (2) Landslides are predominantly distributed in areas with elevations of 278–1059 m, slope gradients of 20–30°, northwest and southeast aspects, surface roughness values of 400–600, Triassic and Jurassic strata, evergreen coniferous forest and sparse forest, as well as lixisols and ferrallitic soil. This study established a landslide traces database for the region, preliminarily revealing the distribution characteristics of landslides and their dominant controlling factors. It provides a scientific basis for geological hazard risk assessment and prevention for UHV transmission lines.

1. Introduction

As a critical component of the national energy strategy [1], ultra-high-voltage (UHV) transmission projects serve as key infrastructure for building a new-type power system and optimizing energy resource allocation. These linearly distributed projects traverse multiple mountainous regions with complex geological environments, posing significant challenges to their safe and stable operation [2]. Landslides, one of the most common geological hazards in mountainous areas [3,4,5], directly threaten transmission tower foundations and corridor safety. They can lead to tower collapse, line breakage, and other major accidents, resulting in substantial economic losses and adverse social impacts [6]. Therefore, the systematic identification and spatial distribution analysis of landslides along transmission corridors are of great practical importance for ensuring the safety of power grids, early identification of geological disasters, and risk prevention and control.
In recent years, numerous studies have been conducted globally on landslide inventory compilation and spatial distribution analysis. Based on optical remote sensing, laser radar, InSAR and other techniques, researchers have identified and cataloged landslides at different scales. For example, the British Geological Survey developed a national landslide database containing 17,000 records by integrating literature, maps, and field investigations. This inventory includes various types of landslides, such as modern river valley landslides and shallow landslides in weathered bedrock (regolith), with detailed attributes including triggering factors, scale, and geographical locations [7]. Hader et al. constructed a rainfall-induced landslide inventory for coastal Brazil using multi-source data [8]. Othman and Gloaguen built a database of 3190 landslides in northeastern Iraq through automated extraction [9]. Delgado et al. systematically compiled a large-scale landslide inventory for the central–western Andes based on high-resolution remote sensing imagery and topographic analysis, further investigating their distribution patterns and controlling factors [10]. In the Himalayan region, the 2015 Gorkha earthquake in Nepal (Mw 7.8) triggered widespread slope failures, causing severe damage to roads, settlements, and power infrastructure. Based on multi-source remote sensing imagery, Gnyawali and Adhikari established an inventory of earthquake-induced landslides in central Nepal and conducted spatial analysis [11]. Xu et al. focused on the 2008 Wenchuan Mw 7.9 earthquake and compiled a nearly complete inventory of co-seismic landslides through visual interpretation and field verification [12]. Similarly, Lan et al. applied GIS technology to catalog and analyze landslides in the Xiaojiang River Basin of Yunnan province, China [13]. More recently, Shao et al. cataloged paleo-landslides in the Wudongde (Kunming City, Yunnan Province, China) Reservoir area based on visual interpretation combined with morphological recognition [14]. Despite these achievements, most existing studies have focused on seismic zones, reservoir areas, or specific administrative units. In contrast, systematic identification and distribution analysis of landslides along major linear infrastructure projects—such as UHV transmission lines, which traverse diverse and complex terrains and are highly sensitive to geological hazards—remain relatively limited.
Based on the aforementioned research gaps, this study focuses on the Hubei section of the Jinsha River–Hubei ±800 kV ultra-high voltage (UHV) transmission line, with a 100 km buffer extending on both sides. The objectives are (1) to establish a detailed and reliable landslide database for the study area based on high-resolution Google Earth imagery, using visual interpretation combined with multi-source data validation, and (2) to analyze the spatial distribution of landslides by integrating 13 factors—DEM, slope, aspect, relief amplitude, Topographic Wetness Index (TWI), lithology, distance to faults, Fractional Vegetation Cover (FVC), soil type, land cover, distance to rivers, Peak Ground Acceleration (PGA), and mean annual precipitation—with GIS-based spatial analysis methods. The findings aim to provide a scientific basis and data support for the safety assessment and operational maintenance of the Jinsha River–Hubei UHV transmission line.
At the corridor scale, this study constructed a landslide inventory for the Hubei section of Jinsha River–Hubei UHV transmission line. and systematically analyzed its spatial distribution characteristics. This work not only provides essential references for the long-term operation and maintenance of transmission lines but also contributes to improving the safety of UHV transmission projects. At the same time, it also establishes a solid data foundation for subsequent disaster risk assessment, early warning, and disaster prevention and mitigation.

2. Study Area

The Jinsha River–Hubei UHV transmission project is one of the important transmission corridors planned and constructed by the State Grid Corporation of China, spanning 1901 km from the Kamai converter station in Changdu (a city), Tibet (a province), to the Daye converter station in Huangshi (a city), Hubei (a province). The Hubei section passes through the complex geomorphic units, including the western Hubei mountains and the Jianghan Basin, where active tectonics, abundant rainfall, and frequent landslides pose significant geological challenges [15].
Based on the aforementioned geographical background and the practical needs of disaster prevention, transmission line maintenance, and potential route selection, this study focuses on the Hubei section of the Jinsha River–Hubei UHV transmission line (Figure 1). The study area extends 100 km on both sides of the transmission line axis, covering a total area of approximately 157,081.56 km2 between 107–116° E and 28–32° N. Located in central China, within the middle reaches of the Yangtze River, the region lies in the transitional zone between the second and third geomorphic steps of China. The terrain is generally characterized by a high west and low east, with significant topographic relief. The terrain in the study area is complex, and the landform types are diverse. According to the geomorphological characteristics, the study area can be roughly divided into three parts. The western region consists of the Wuling and Daba Mountains, characterized by medium-to-low mountain terrain with elevations ranging mostly from 800 m to 2300 m and local relief exceeding 1500 m in some peaks. The central region is the Jianghan Plain, a typical alluvial plain with flat terrain, dense river networks, and elevations generally below 50 m. The eastern region is dominated by hilly landforms, with elevations mainly between 100 m and 600 m and relatively gentle undulations. This complex and diverse landform pattern, which is high in the west and low in the east, provides favorable topographic conditions for the development of landslides and other geological hazards.
The region belongs to a subtropical monsoon climate with synchronized heat and rainfall, a mean annual temperature of 16.7 °C, and a mean annual precipitation of 1200.7 mm. In terms of spatial distribution, rainfall is strongly influenced by topography. The western and eastern mountainous regions (such as the Wuling and Daba Mountains) experience higher annual precipitation, generally ranging from 1600 to 1800 mm, while the central Jianghan Plain receives comparatively less rainfall, typically around 1000 to 1200 mm. Precipitation is mainly concentrated between May and September, with intense and prolonged rainfall during the plum rain season (June–July), which often triggers geological hazards such as landslides and rockfalls.
The geological conditions in the region are complex, characterized by well-developed fault structures. These include the roughly southwest–northeast trending Taiyangshan Fault and Lishui Fault, the northwest–southeast trending Beijinggang Fault and Nanzhang Fault, as well as the approximately east–west trending Shishou–Jianli Fault and Tianmenhe Fault. Stratigraphically, the exposed strata in the area are relatively comprehensive, dominated by the Triassic, Jurassic, Quaternary, and Silurian systems. The corresponding lithologic information for each stratum within the study area is detailed in Table 1. Specifically, the Triassic lithology is primarily composed of limestone, shale, and sandstone; the Jurassic system consists mainly of sandstone and shale; the Quaternary deposits are predominantly unconsolidated sediments such as mud and sand; and the Silurian system is characterized mainly by sandstone, shale, and argillaceous limestone. These strata are predominantly composed of limestone, marl, and sandstone, where karst development and abundant fractures are common, facilitating the formation of potential sliding surfaces and providing favorable conditions for landslide initiation. Furthermore, frequent human engineering activities and intensive infrastructure construction related to transportation, water conservancy, and energy in the area, particularly linear projects such as power transmission lines and major transportation arteries, further exacerbate landslide risks.

3. Data and Method

3.1. Remote Sensing Interpretation

Landslide inventory is a spatial representation of landslides within a specific area, which is used to illustrate the location of landslides and record their occurrence time, type, volume, activity state and other related properties when conditions permit [16,17]. A systematic and detailed landslide inventory is the basis for landslide mechanism research, risk assessment, prediction and disaster management [18,19,20,21,22].
Currently, methods for compiling landslide inventories can be broadly categorized into three types: field investigation, automatic extraction, and visual interpretation. Field investigation is the most direct and accurate approach for obtaining landslide information [23]. It can record the detailed documentation of landslide morphology, location, and type. However, this method is constrained by factors such as topography, time, and financial cost [24,25], making it difficult to implement effectively across large, topographically complex regions. The automatic extraction method relies on the spectral characteristics of remote sensing imagery and machine learning models, which can quickly extract landslide information over extensive areas [26,27,28]. However, this method is prone to misclassification and omission errors in regions with rugged terrain or dense vegetation cover, and its performance largely depends on the quality and robustness of the underlying models [29]. In comparison, visual interpretation achieves a better balance between accuracy and feasibility. Researchers can identify landslides using high-resolution satellite imagery in combination with topographic features and existing geological data, thereby improving efficiency while effectively reducing misjudgments. This method is not constrained by regional topography or climatic conditions [30], and is well-suited for constructing landslide inventories in large areas with complex geological settings.
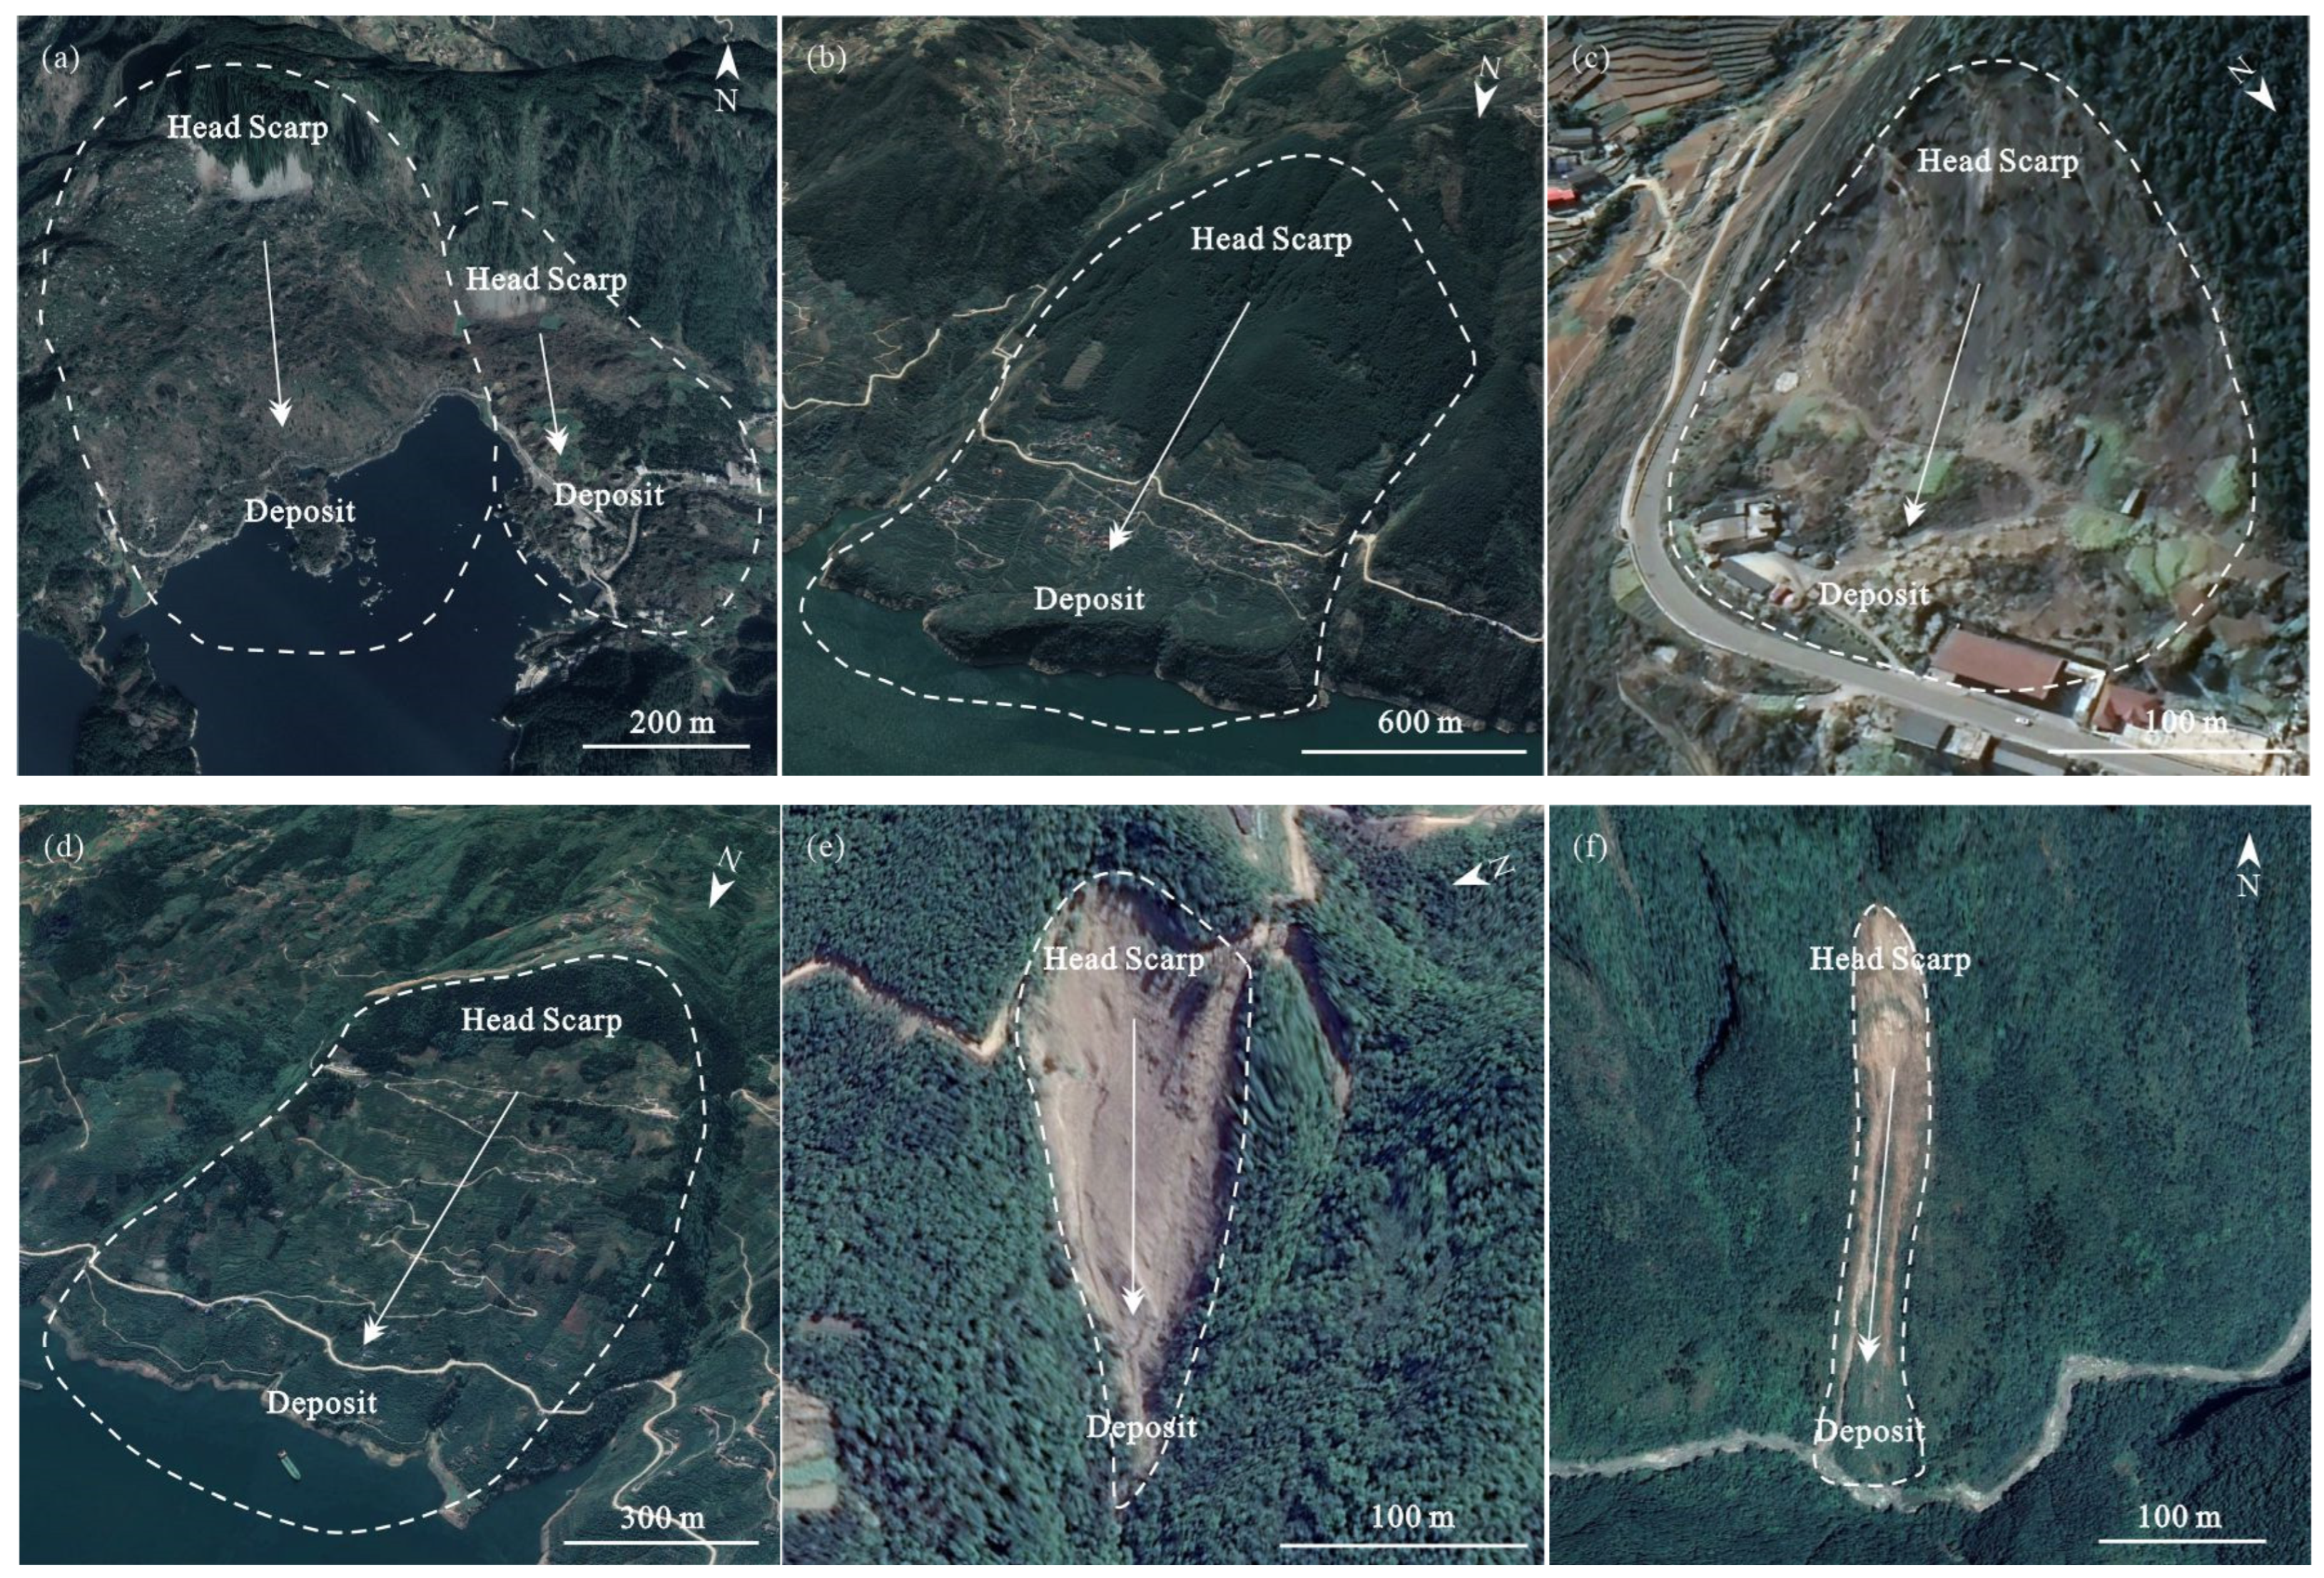
Landslide traces refer to areas where landslides have occurred or are currently active. Although most of these areas have stabilized, they may deform again under external forces such as earthquakes or heavy rainfall [19,31]. Considering the large area, complex geological conditions, and frequent engineering activities within the study area, this study employs a human–machine interactive interpretation method to catalog the landslide traces. The interpretation results are cross-validated through various approaches, including historical disaster records, multi-temporal image comparisons, and literature reviews. Referring to established principles of landslide visual interpretation, landslide boundaries were delineated based on morphological characteristics and the actual topographic and geomorphological conditions of the study area (Figure 2). The visual interpretation of landslides from satellite imagery adhered to the following principles [16,32,33,34]:
(1)
Head scarp: Typically characterized by a steep scarp, generally exhibiting a chair-shaped or arcuate morphology, with downslope striations visible; tensile cracks nearly parallel to the slope surface are often observed on the back wall.
(2)
Lateral margins: Commonly developed along gullies or steep scarps, often showing the phenomenon of “two ditch troughs with the same origin”. Vegetation growth differs on both sides, with trees on the inner side sometimes showing tilting. Surface water infiltration or seepage may occur along the margins, and there are obvious differences in the occurrence and lithology of rock and soil on both sides.
(3)
Toe: Frequently presents as scarp-like, drum-shaped, or tongue-shaped. The shear outlet is often located at the lower edge of a terrace, and the rock and soil mass is squeezed or extruded.
(4)
In the process of interpretation, multiple geographic elements (e.g., rivers, roads, etc.) were superimposed in Google Earth for preliminary delineation. Typical landslides within the region were further validated using multi-source data (e.g., news reports, the literature), thereby improving accuracy and reducing misinterpretation.

3.2. Impact Factors

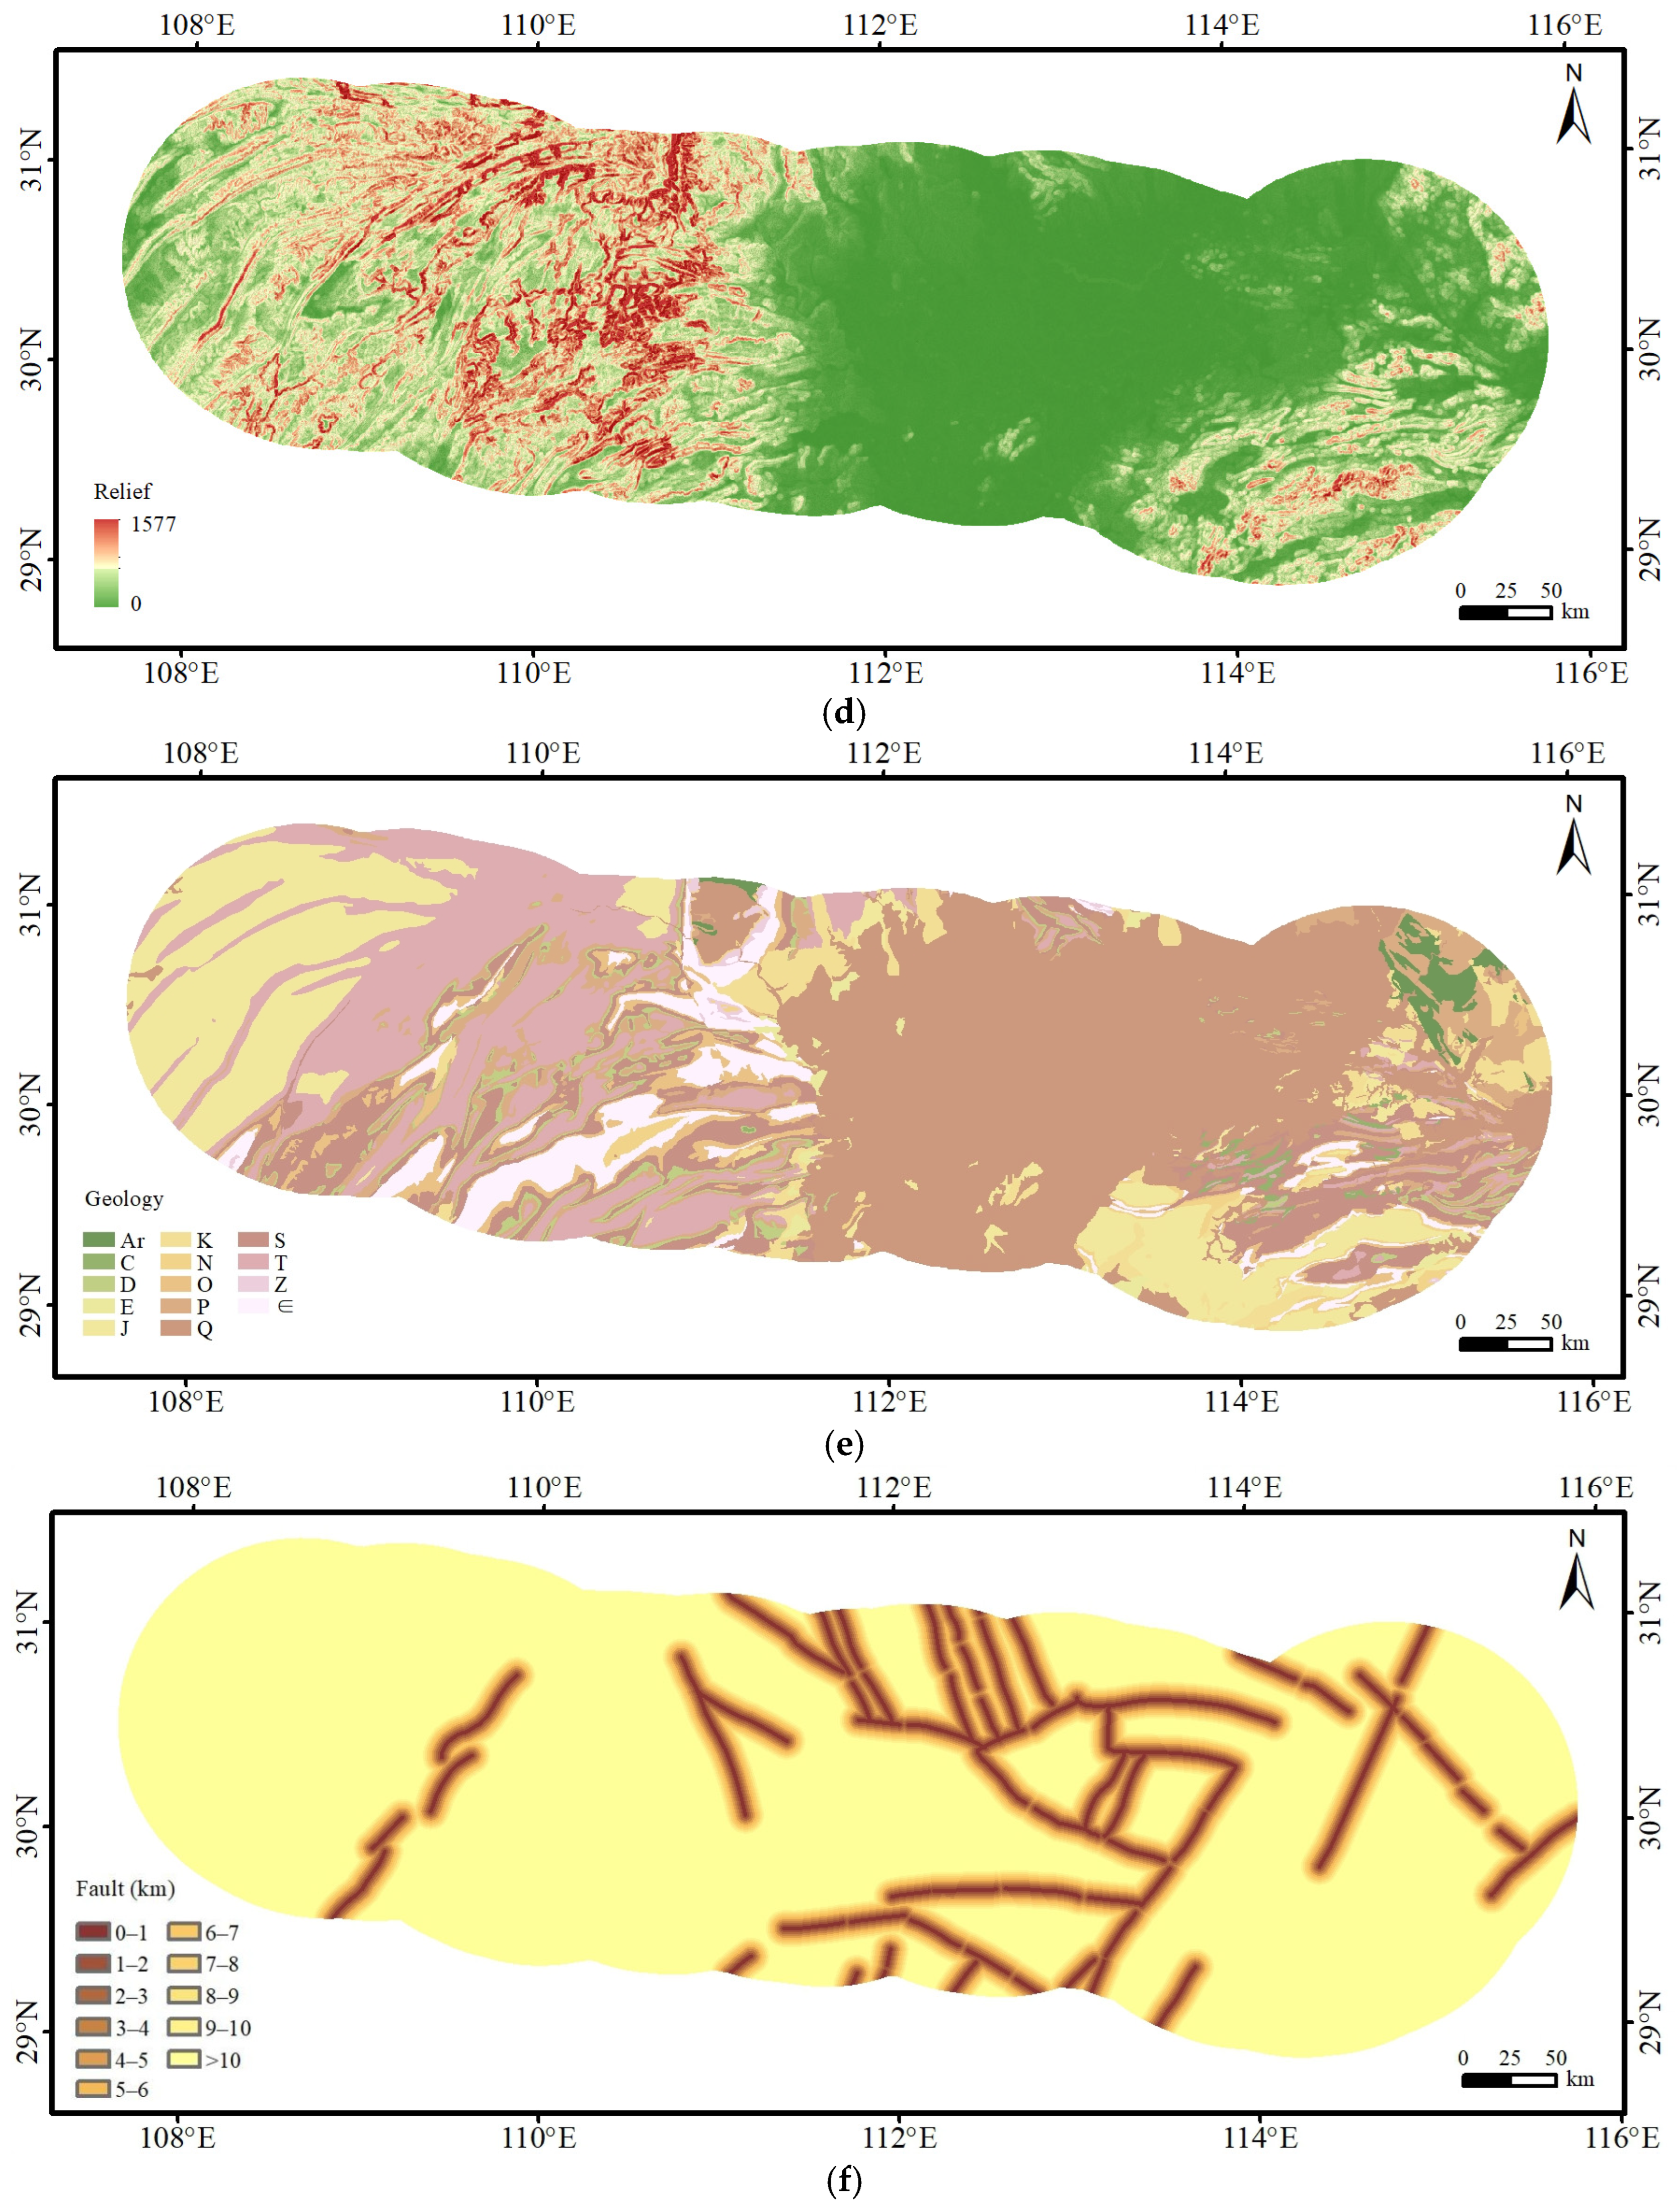
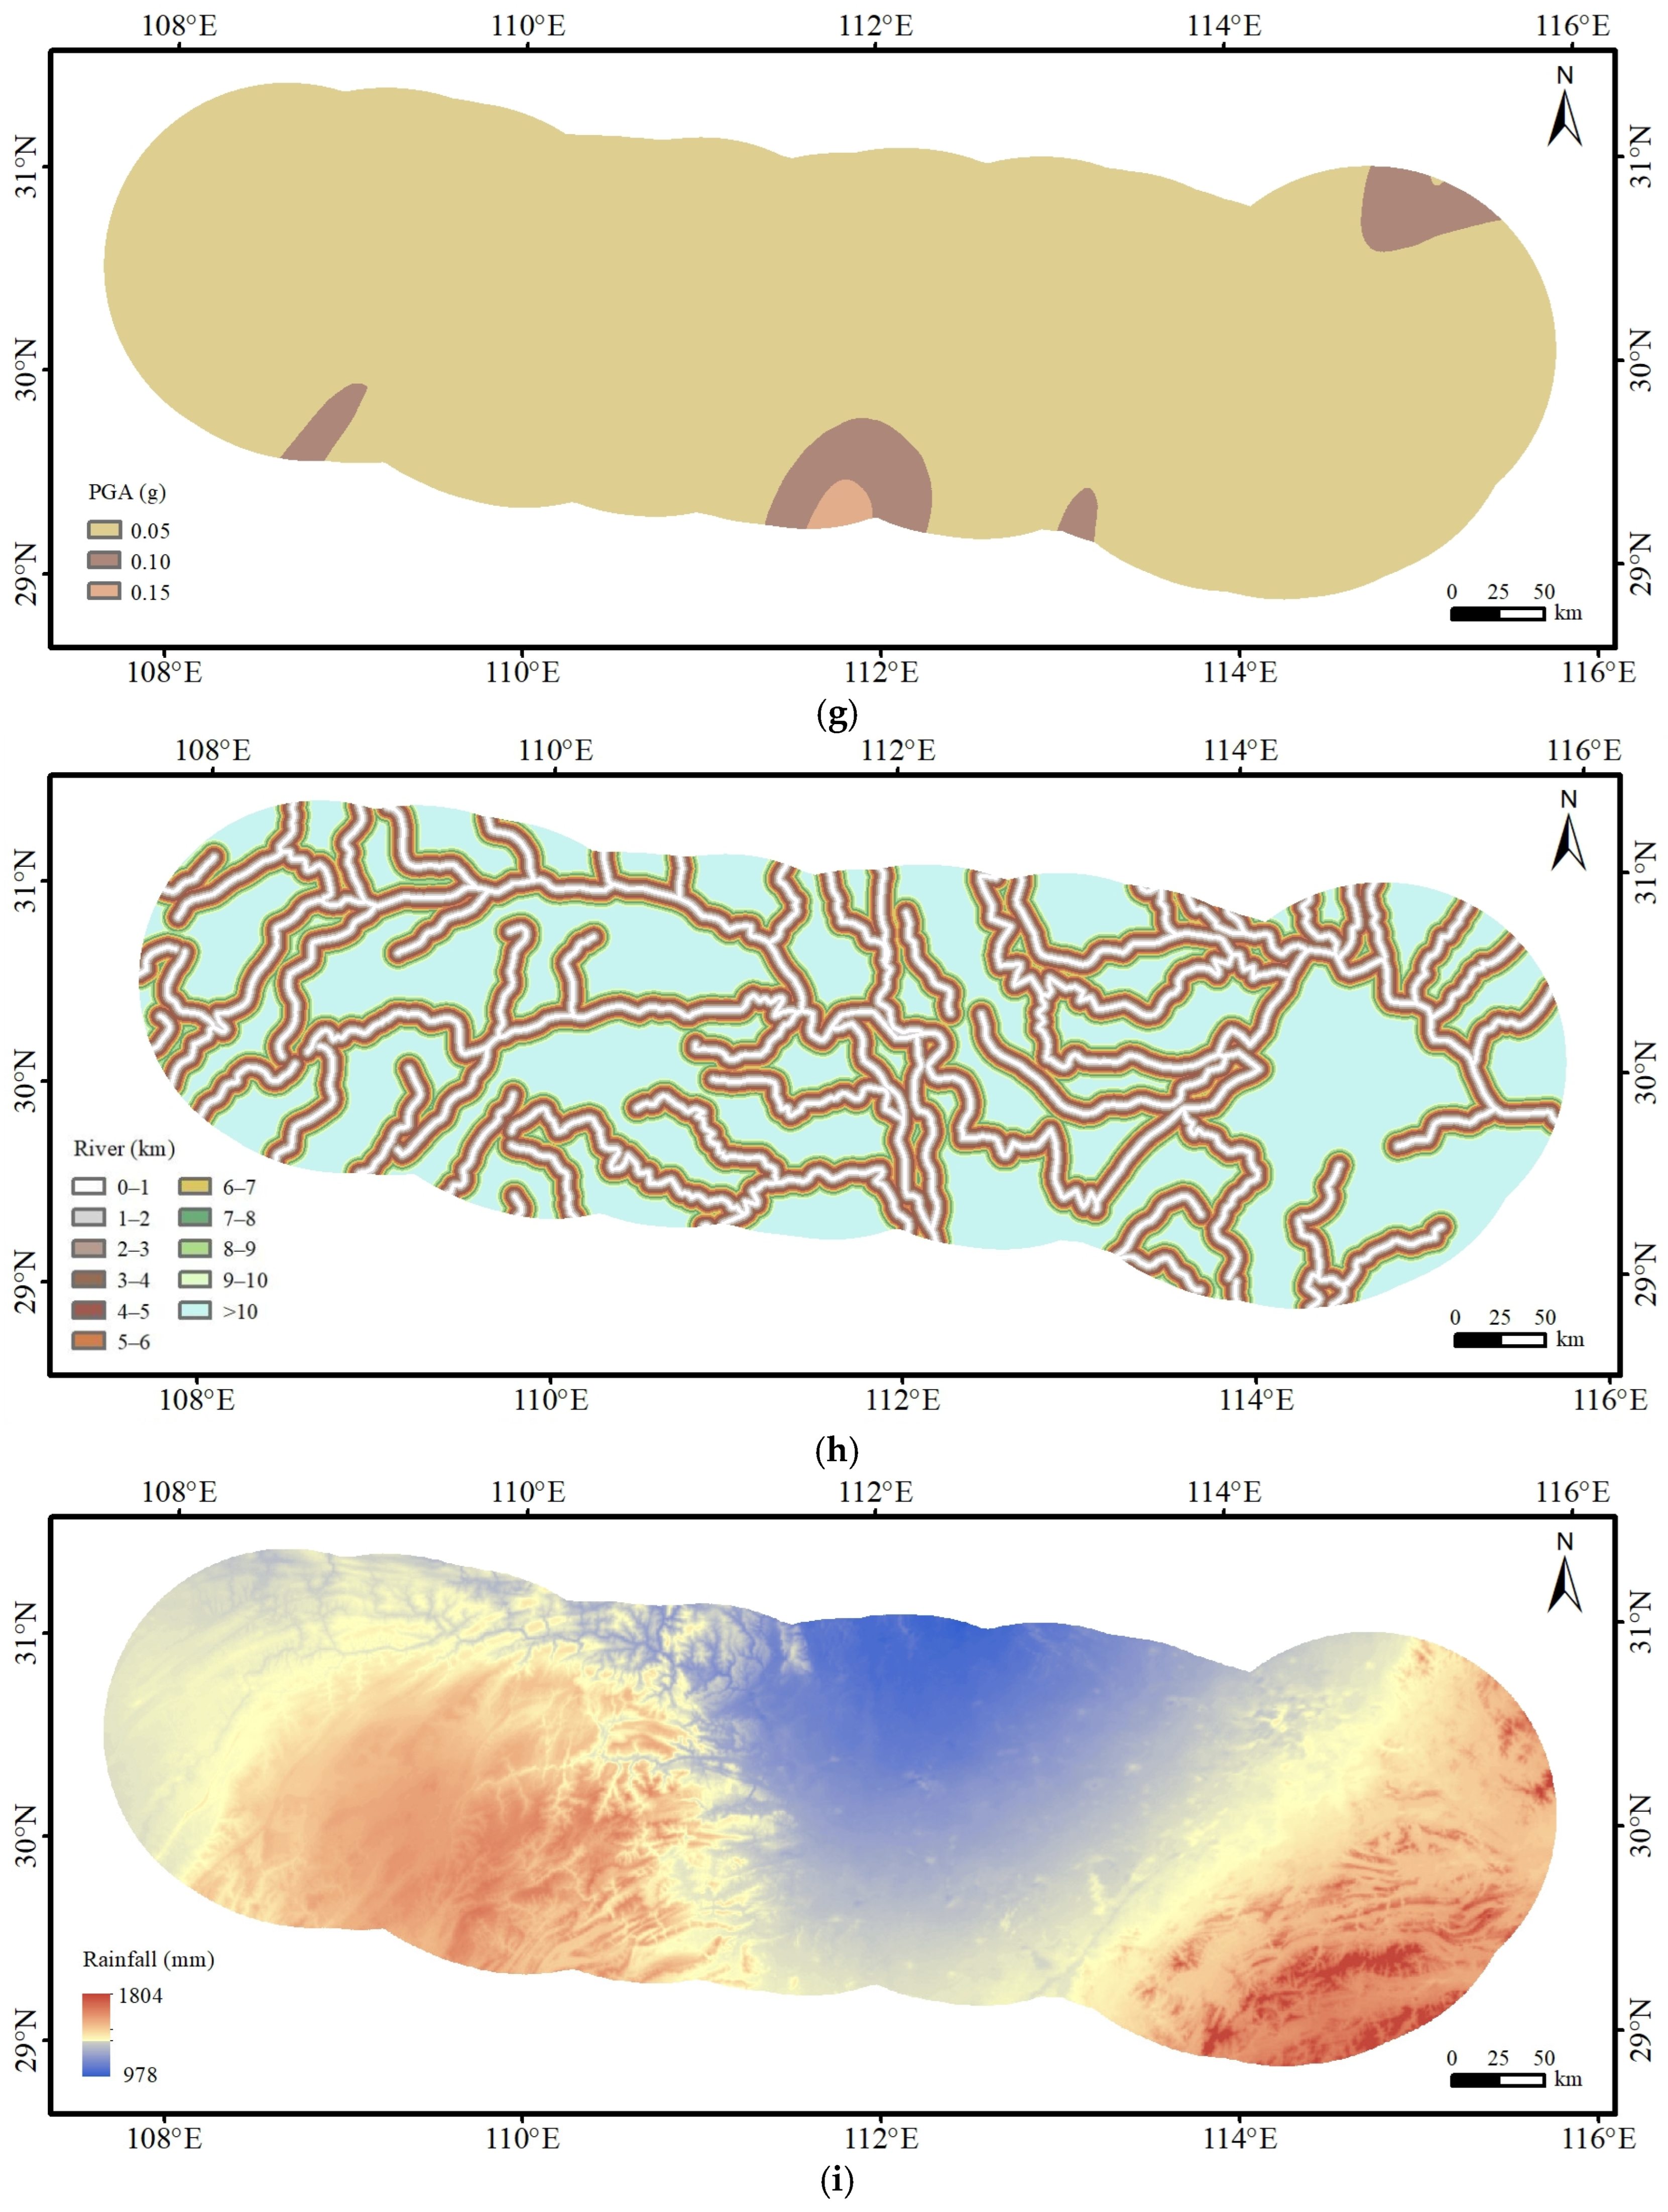
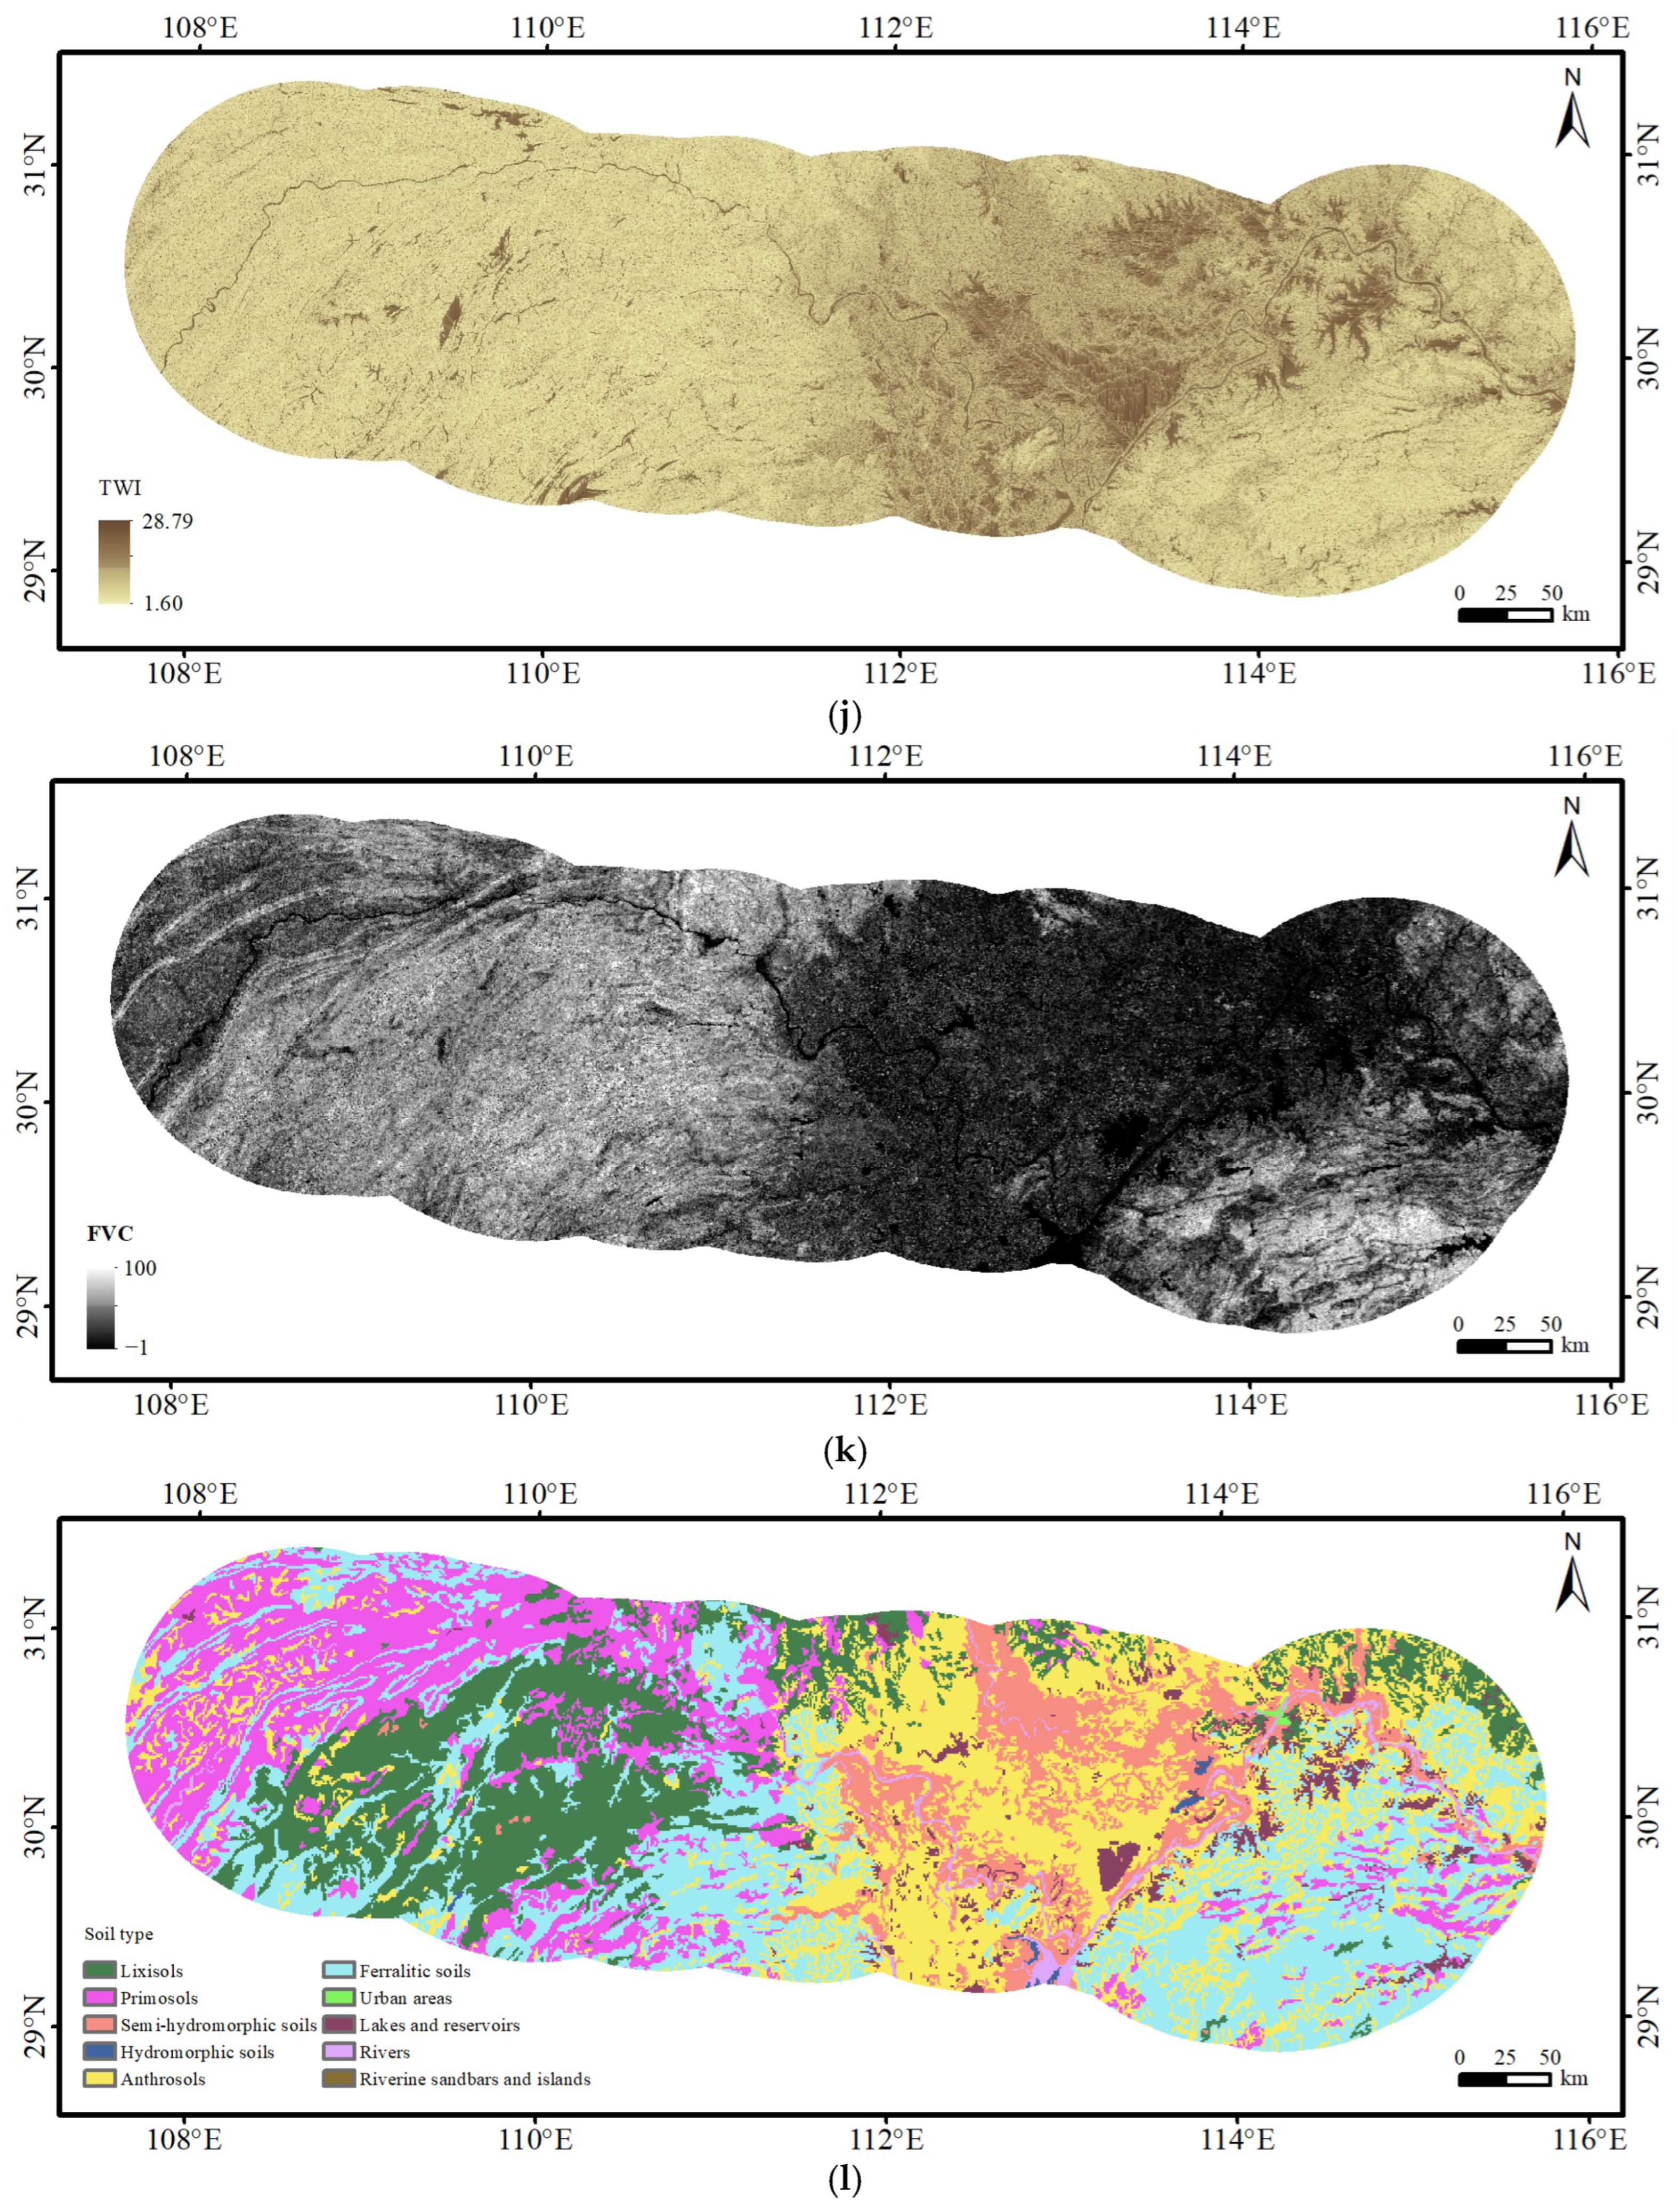
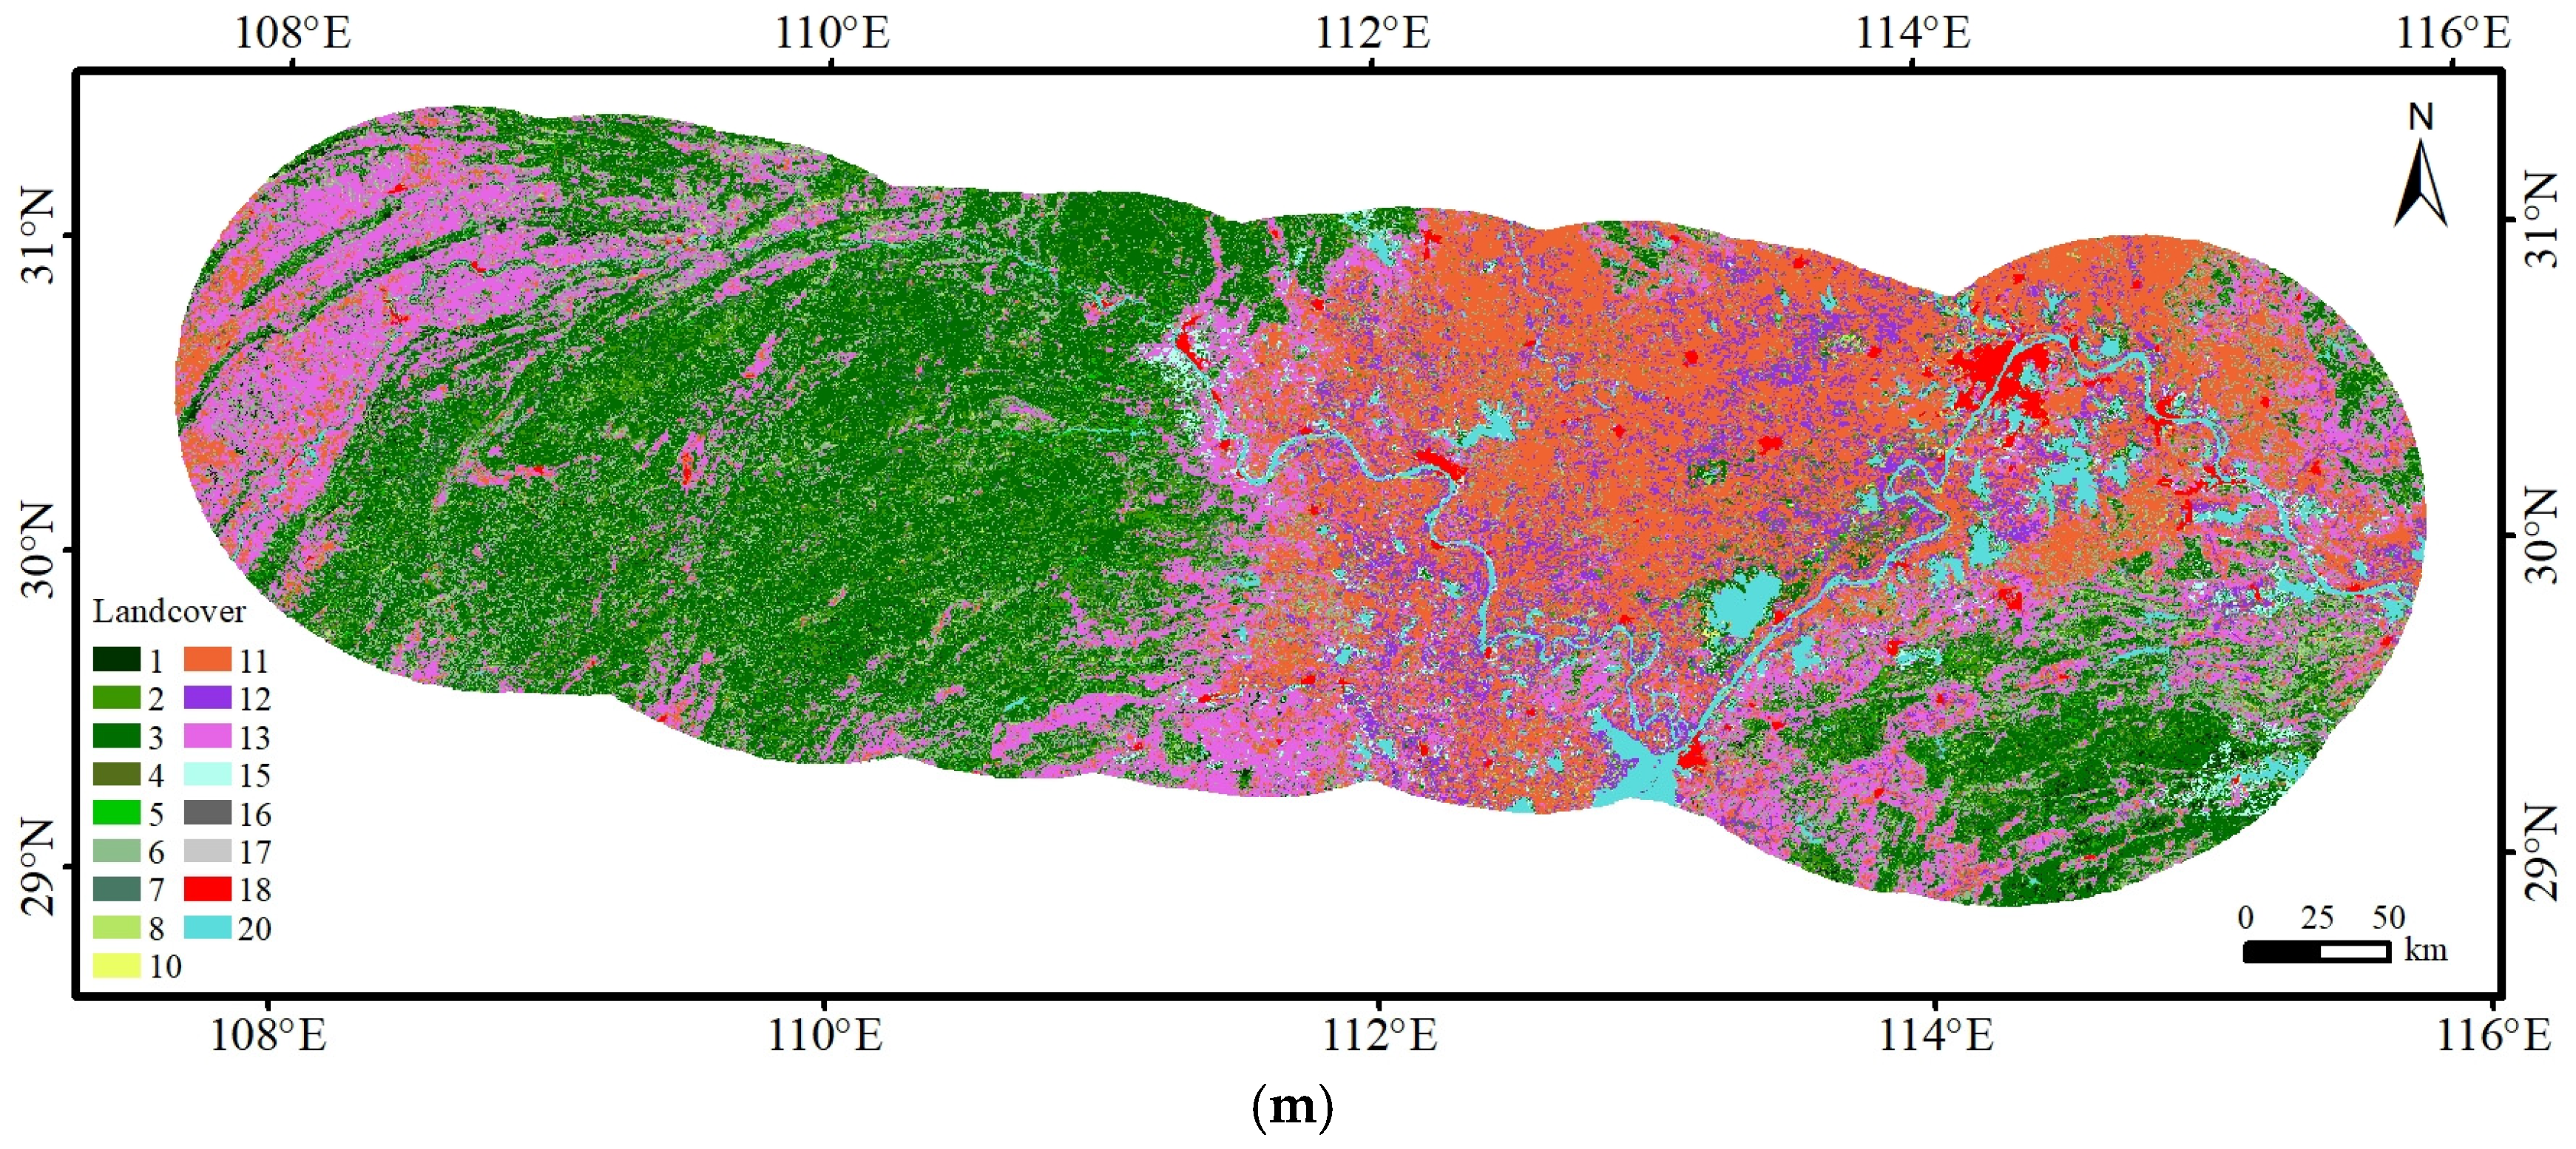
This study selected 13 factors for analysis, including elevation, slope, aspect, relief, TWI, geology, distance to faults, FVC, soil type, land cover, distance to rivers, PGA, and mean annual precipitation (Figure 3). The sources of these datasets are summarized in Table 2.
DEM data were obtained from the ALOS 30 m elevation dataset. Based on GIS platform, slope, aspect, relief, and TWI were derived. Lithological data were sourced from the 1:2.5 million geological map of China (China Geological Survey) and partial geological maps of Asian countries (U.S. Geological Survey), and classified into 12 categories according to geological age. Fault data utilized the national active fault database and were divided into 11 categories [35,36]. FVC and land cover were derived from the GLCNMO land cover dataset [37]. Soil data were obtained from the 1:1 million Soil Map of the People’s Republic of China published by the National Soil Survey Office. River data were sourced from the 1:250,000 hydrological map released by the National Geomatics Center of China. PGA data were provided by the U.S. Geological Survey and represent co-seismic PGA distributions obtained through a combination of station measurements and numerical simulations [38]. Mean annual precipitation data were obtained from global climate datasets.
To analyze the relationships between each factor and landslide distribution, this study selected landslide number density (LND) and landslide area percentage (LAP) as key indicators to quantify the development intensity and spatial distribution patterns of landslides within different factor classes, thereby revealing their controlling effects and influence on landslide occurrence. LND describes the concentration of landslides, expressed as the number of landslides per square kilometer, while LAP reflects the scale of landslides [39].
The formulas for LND and LAP are as follows:
LND   =   Landslide   number Area   of   factor   class   ( CA )
LAP = Landslide   area Area   of   factor   class   ( CA )

4. Results and Analysis

4.1. Landslide Traces Inventory

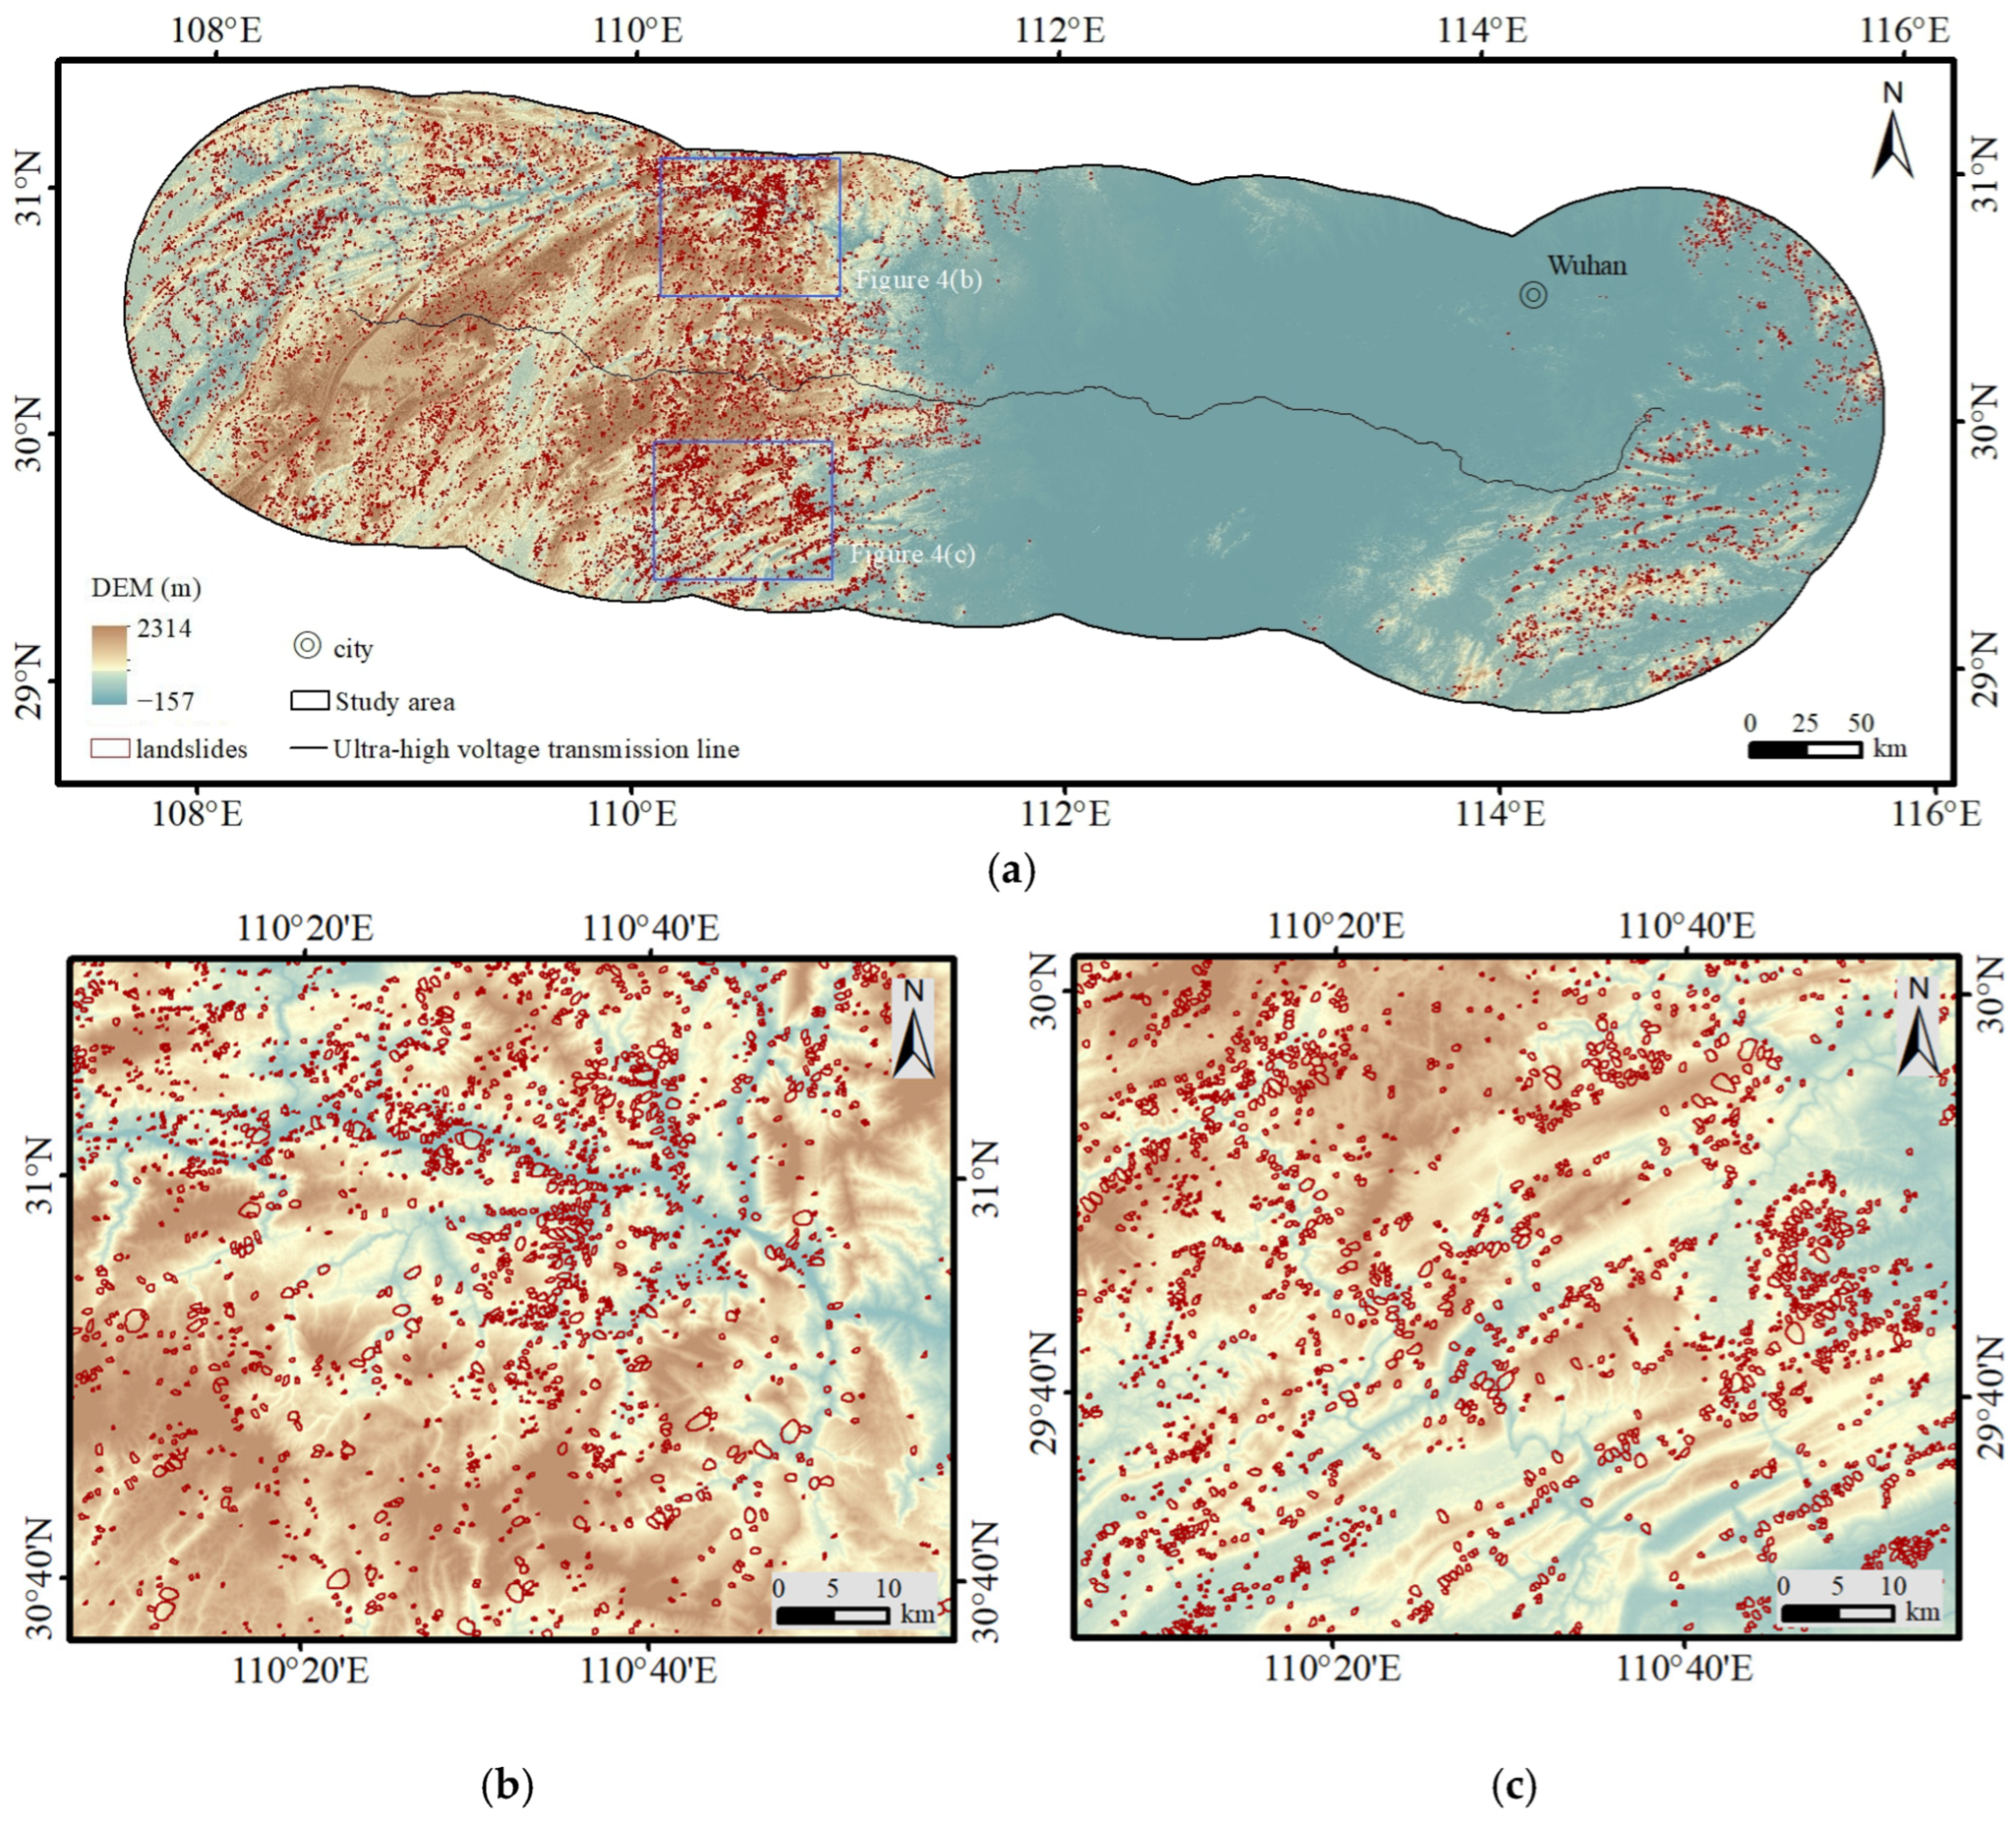
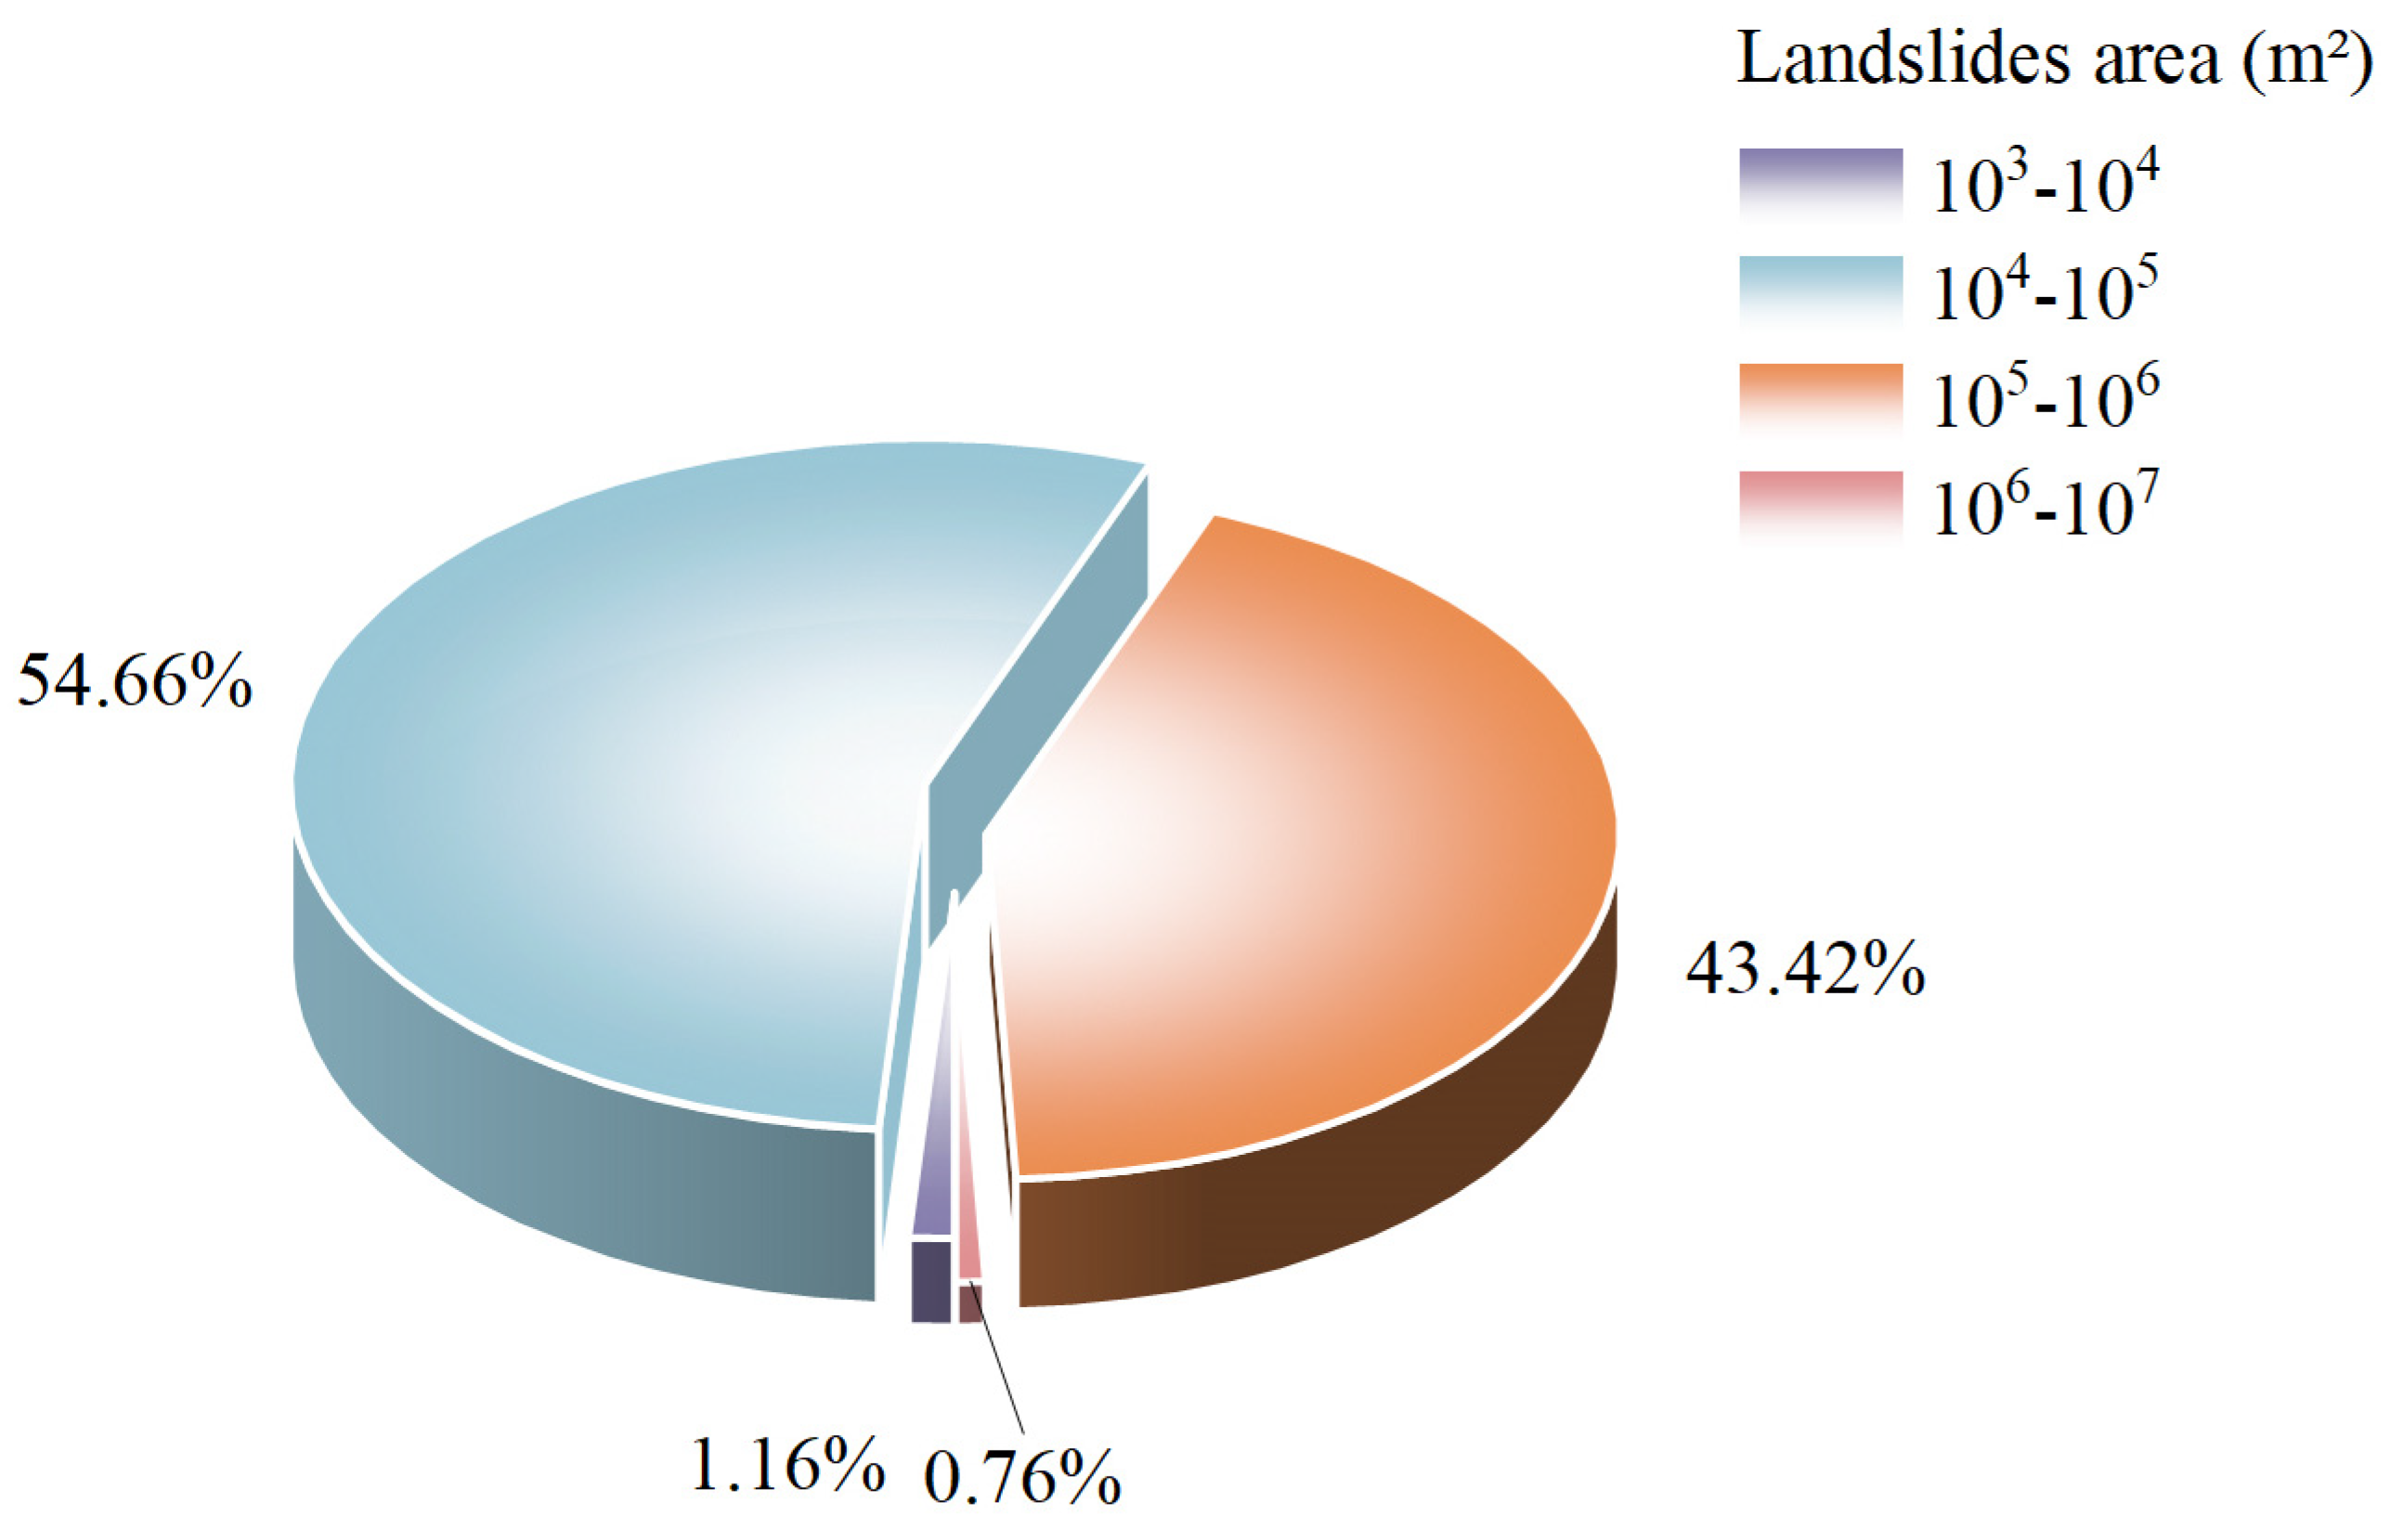
Based on the methodology described above, a landslide traces inventory was compiled for the Hubei section of the Jinsha River–Hubei UHV transmission line (Figure 4). Within the total study area of 157,081.56 km2, 18,598 landslides were identified, covering an aggregate area of 2671.82 km2. Individual landslide areas ranged from 1346.66 m2 to 4.76 km2. In terms of number and area, landslides with an area of 104–105 m2 are the most frequent, totaling 10,165 occurrences and accounting for 54.66% of all landslides. Landslides with an area between 105 and 106 m2 total 8075, constituting 43.42%. There are only 216 landslides with an area of 103–104 m2, accounting for 1.16%. There are 142 landslides with an area of more than 106 m2, comprising 0.76% of the total (Figure 5). In terms of spatial distribution, landslides are predominantly concentrated in the western part of the study area, particularly in regions with higher elevation and greater topographic relief. A few landslides occur in the eastern hilly areas, while the central plains exhibit no landslide occurrences.
In summary, landslides in the study area are predominantly medium to large in size, with uneven spatial distribution and significant differences between east and west. They are mainly concentrated in the medium–high mountain regions along the western section of the transmission line. In some areas, display clustered patterns. These high-risk zones should be given particular attention in the subsequent maintenance of the line and in disaster prevention and mitigation efforts.

4.2. Spatial Distribution

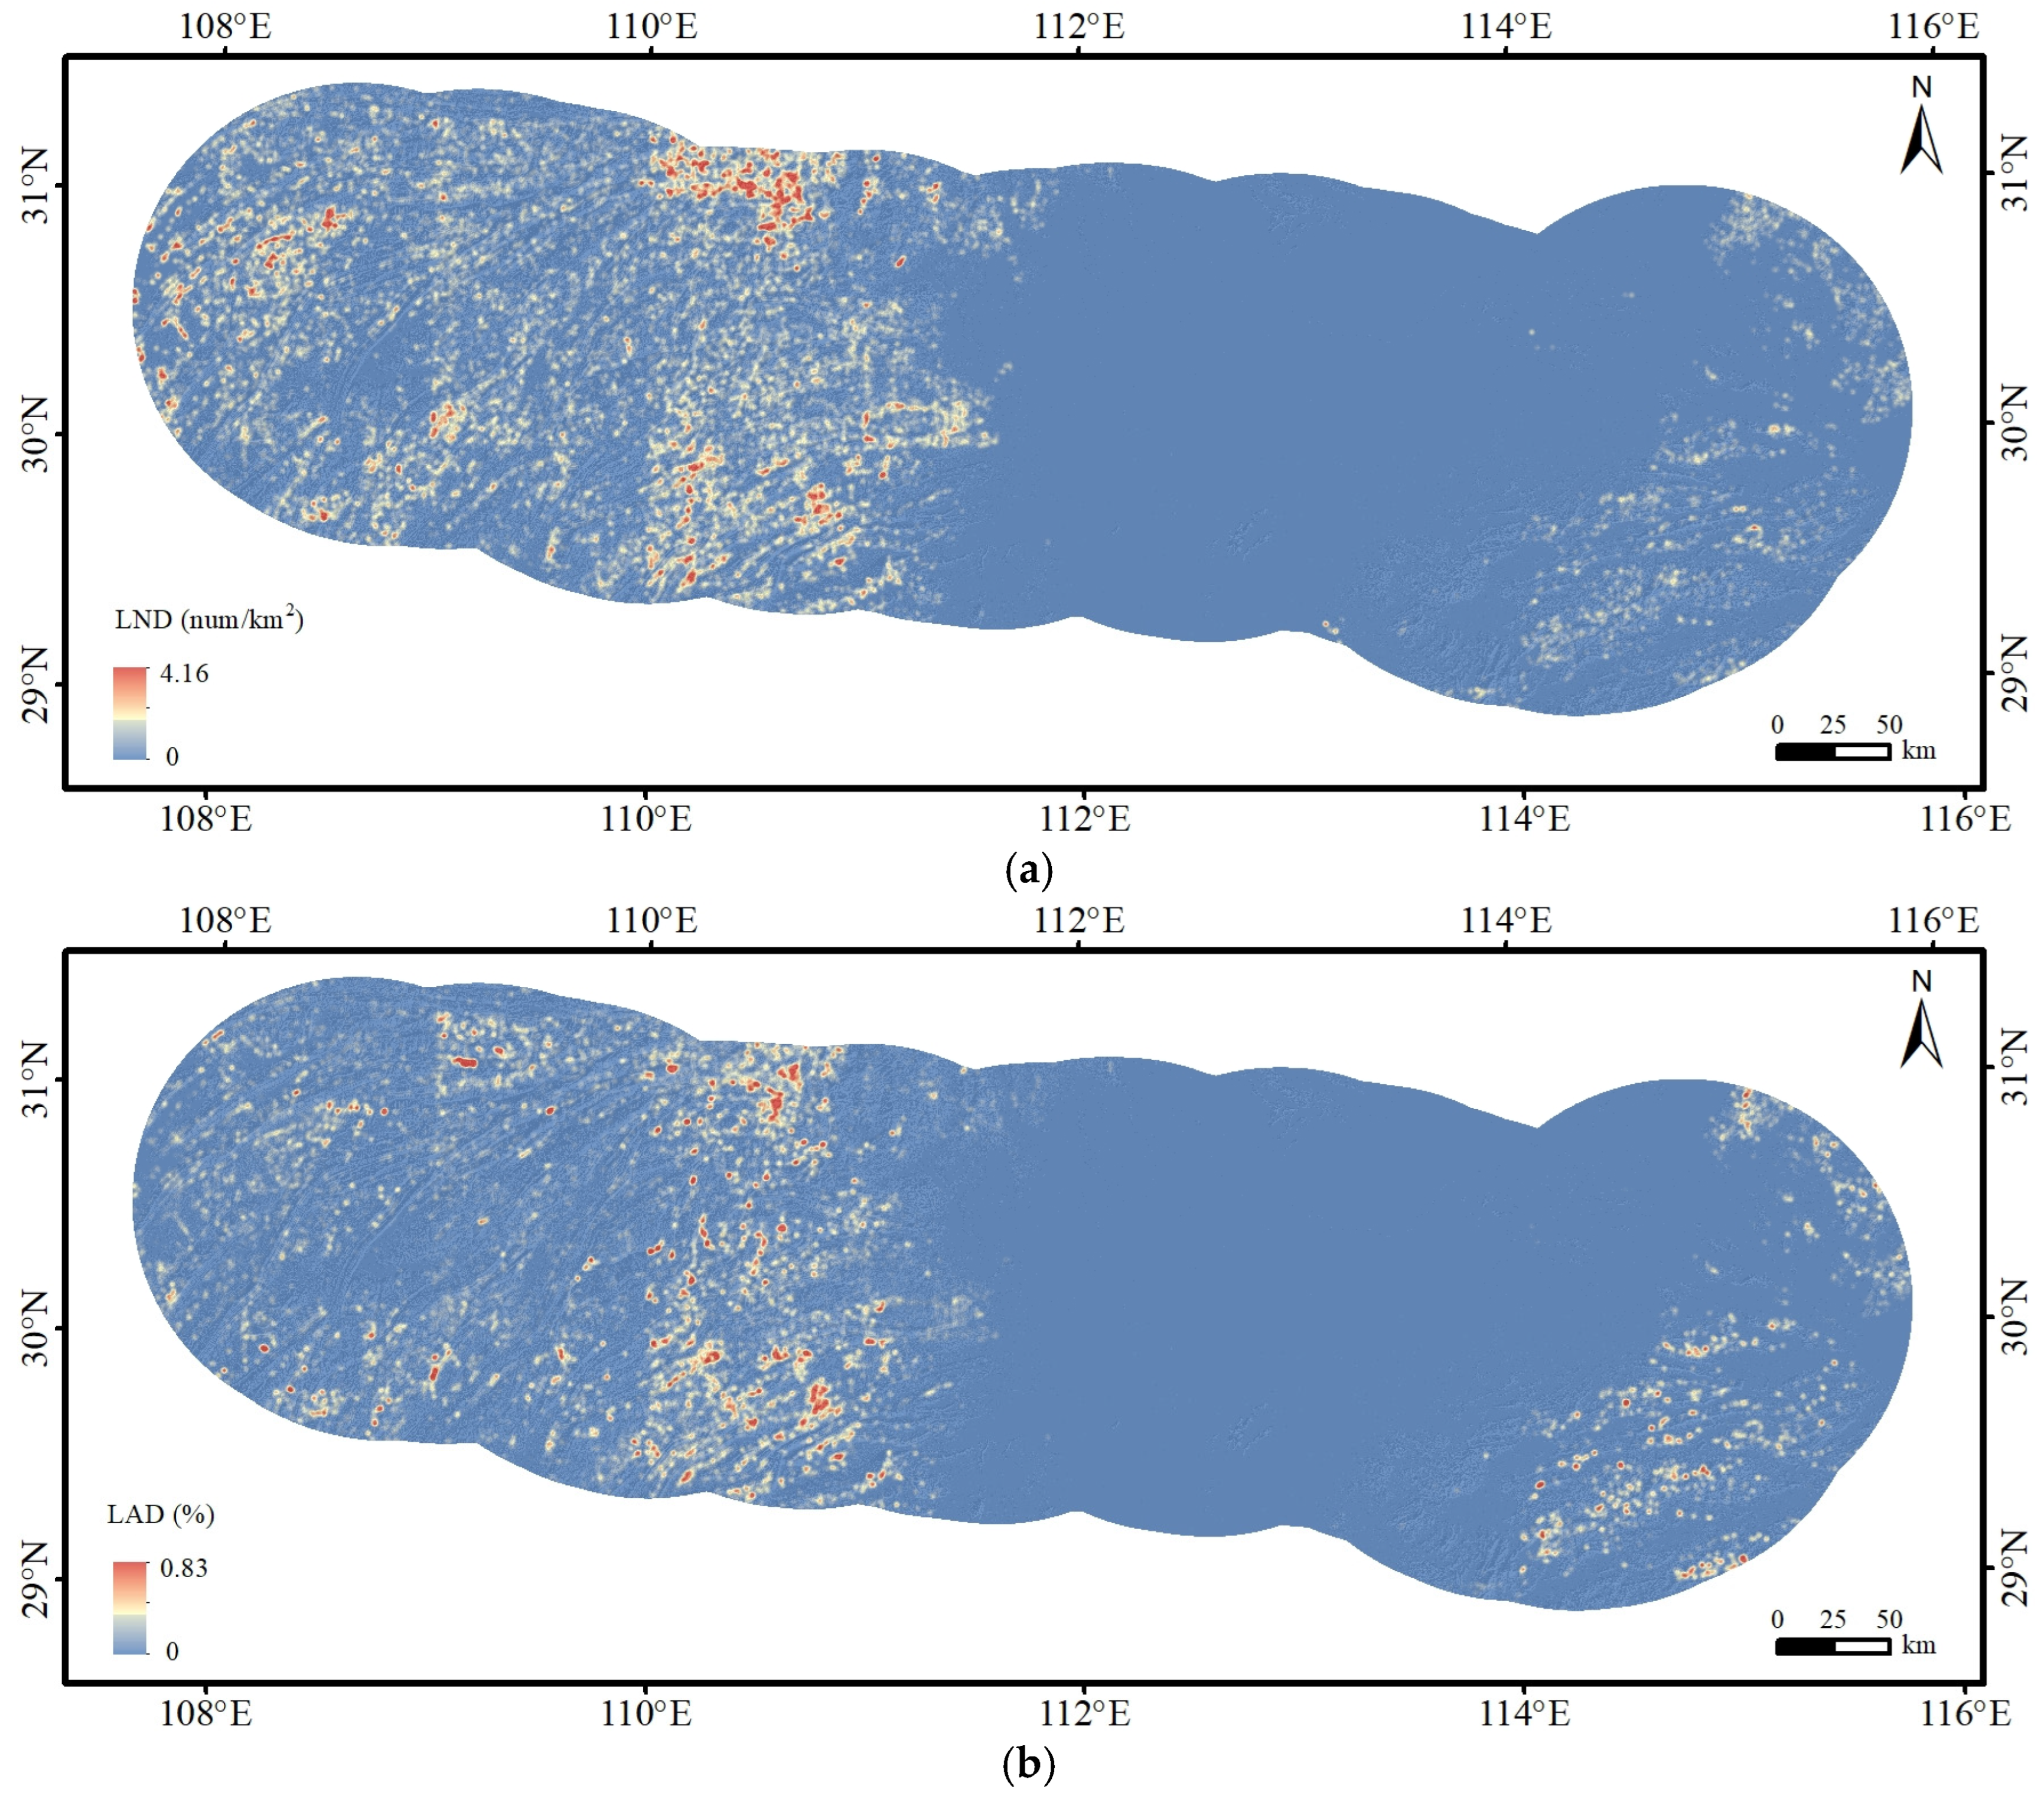
To investigate the spatial distribution patterns of landslides, this study employed two indicators for analysis: LND and LAP. Based on the interpreted landslide inventory and GIS platform, kernel density analysis with a search radius of 2 km was performed to generate the LND and LAP maps of the study area (Figure 6). The results indicate that landslides exhibit significant spatial clustering, with high-value areas of LND and LAP largely coinciding. In the western part of the study area, including Zigui County, Badong County, Hefeng County, and Shimen County, both LND and LAP are relatively high, indicating that these regions not only experience frequent landslides but also feature larger-scale or densely clustered landslides. However, there are also some regional differences. For example, in Wanxian City and Liangping County on the western edge of the study area, LND is more prominent than LAP, suggesting a high number of small-scale landslides. Conversely, in the eastern part of the study area, including Zunyi, Wuning, and Xiushui, LAP is more prominent, suggesting that landslides in these regions tend to be larger in scale.

4.3. Analysis of Influencing Factors

4.3.1. Topography and Geomorphological Factors

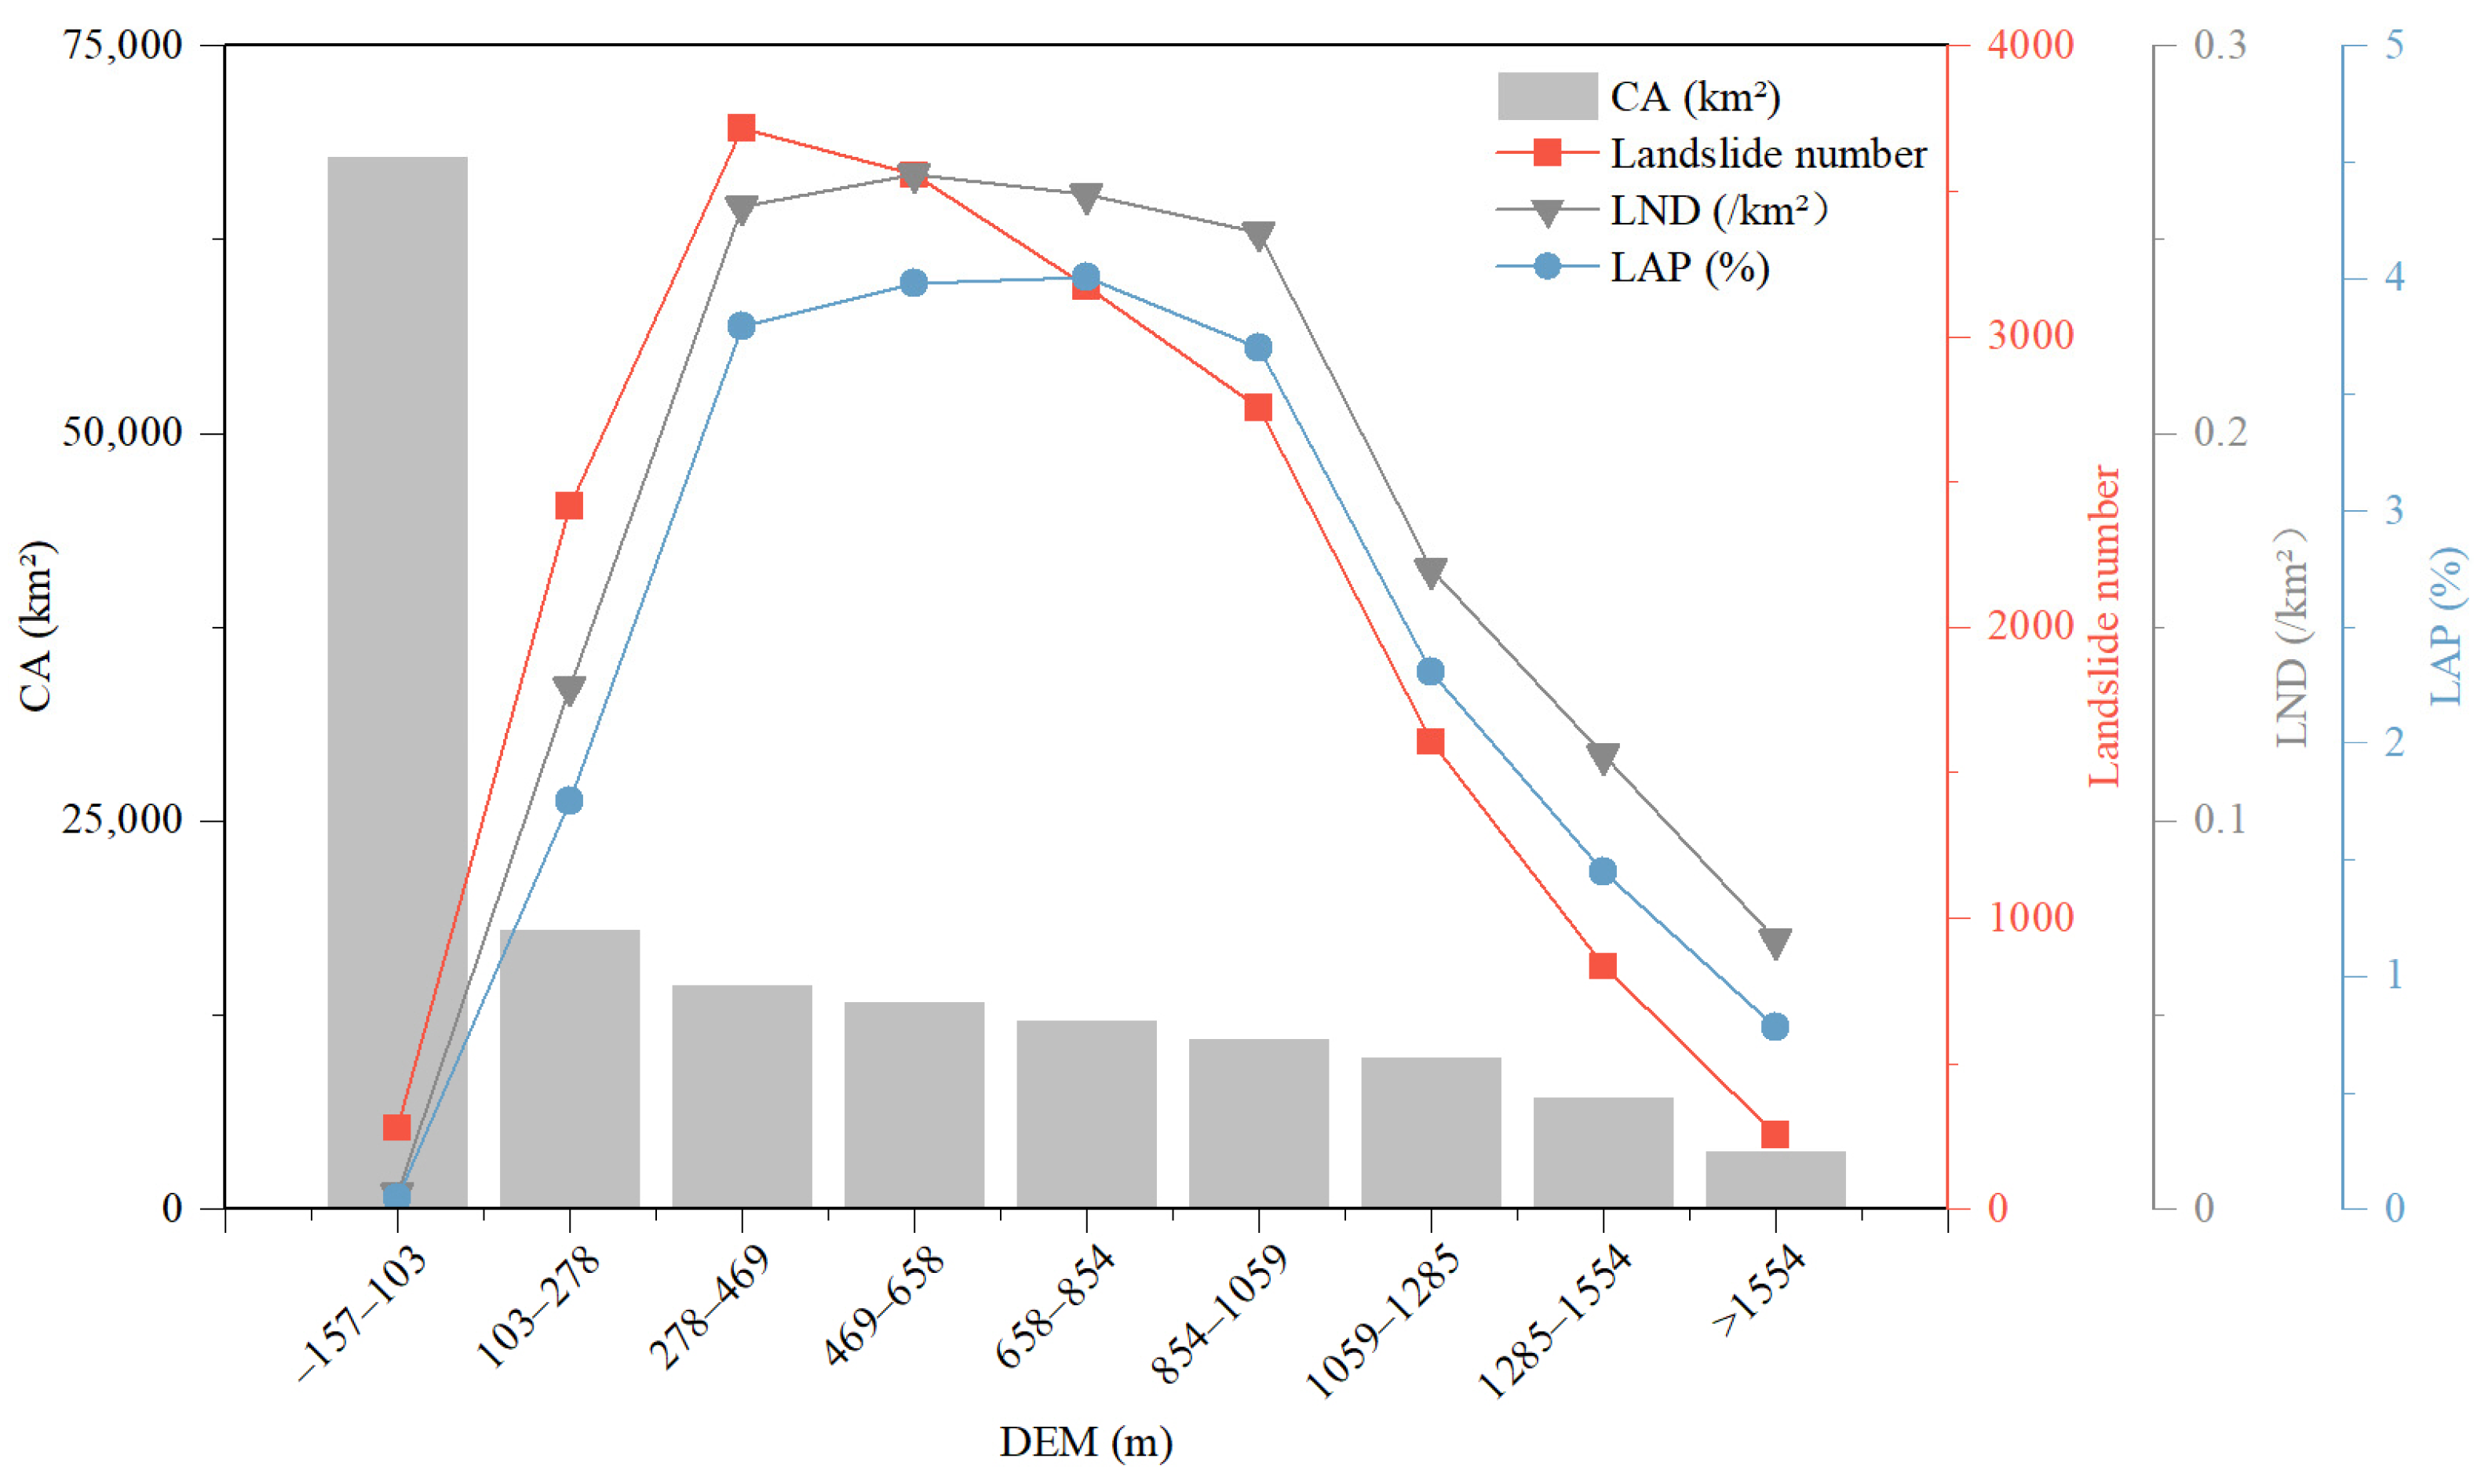
Figure 7 illustrates the relationship between elevation and landslides in the study area. As shown in Figure 3a, the elevation range of the study area spans from −157 m to 2314 m, with higher elevations in the west and lower elevations in the east. The western mountainous region has an elevation range between 800 m and 2300 m, while the central plain predominantly has an elevation of less than 50 m. The eastern hilly area has an elevation range of 100 m to 600 m. Using the natural breaks classification method, the DEM (Digital Elevation Model) was divided into nine categories, with landslides mainly concentrated in the elevation range of 278–1059 m. Landslides are primarily concentrated within the 278–1059 m range. The number of landslides initially increases and then decreases with elevation, reaching a peak of 3718 landslides in the 469–658 m interval. Correspondingly, both LND and LAP exhibit similar trends, with their peak values occurring in the 469–658 m and 658–854 m intervals, respectively, indicating that both of them are relatively high in the range of 469–854 m, which is prone to landslides. In areas below 103 m, the number and density of landslides are low despite the large area. In the alpine areas above 1285 m, landslide activity is also significantly reduced.
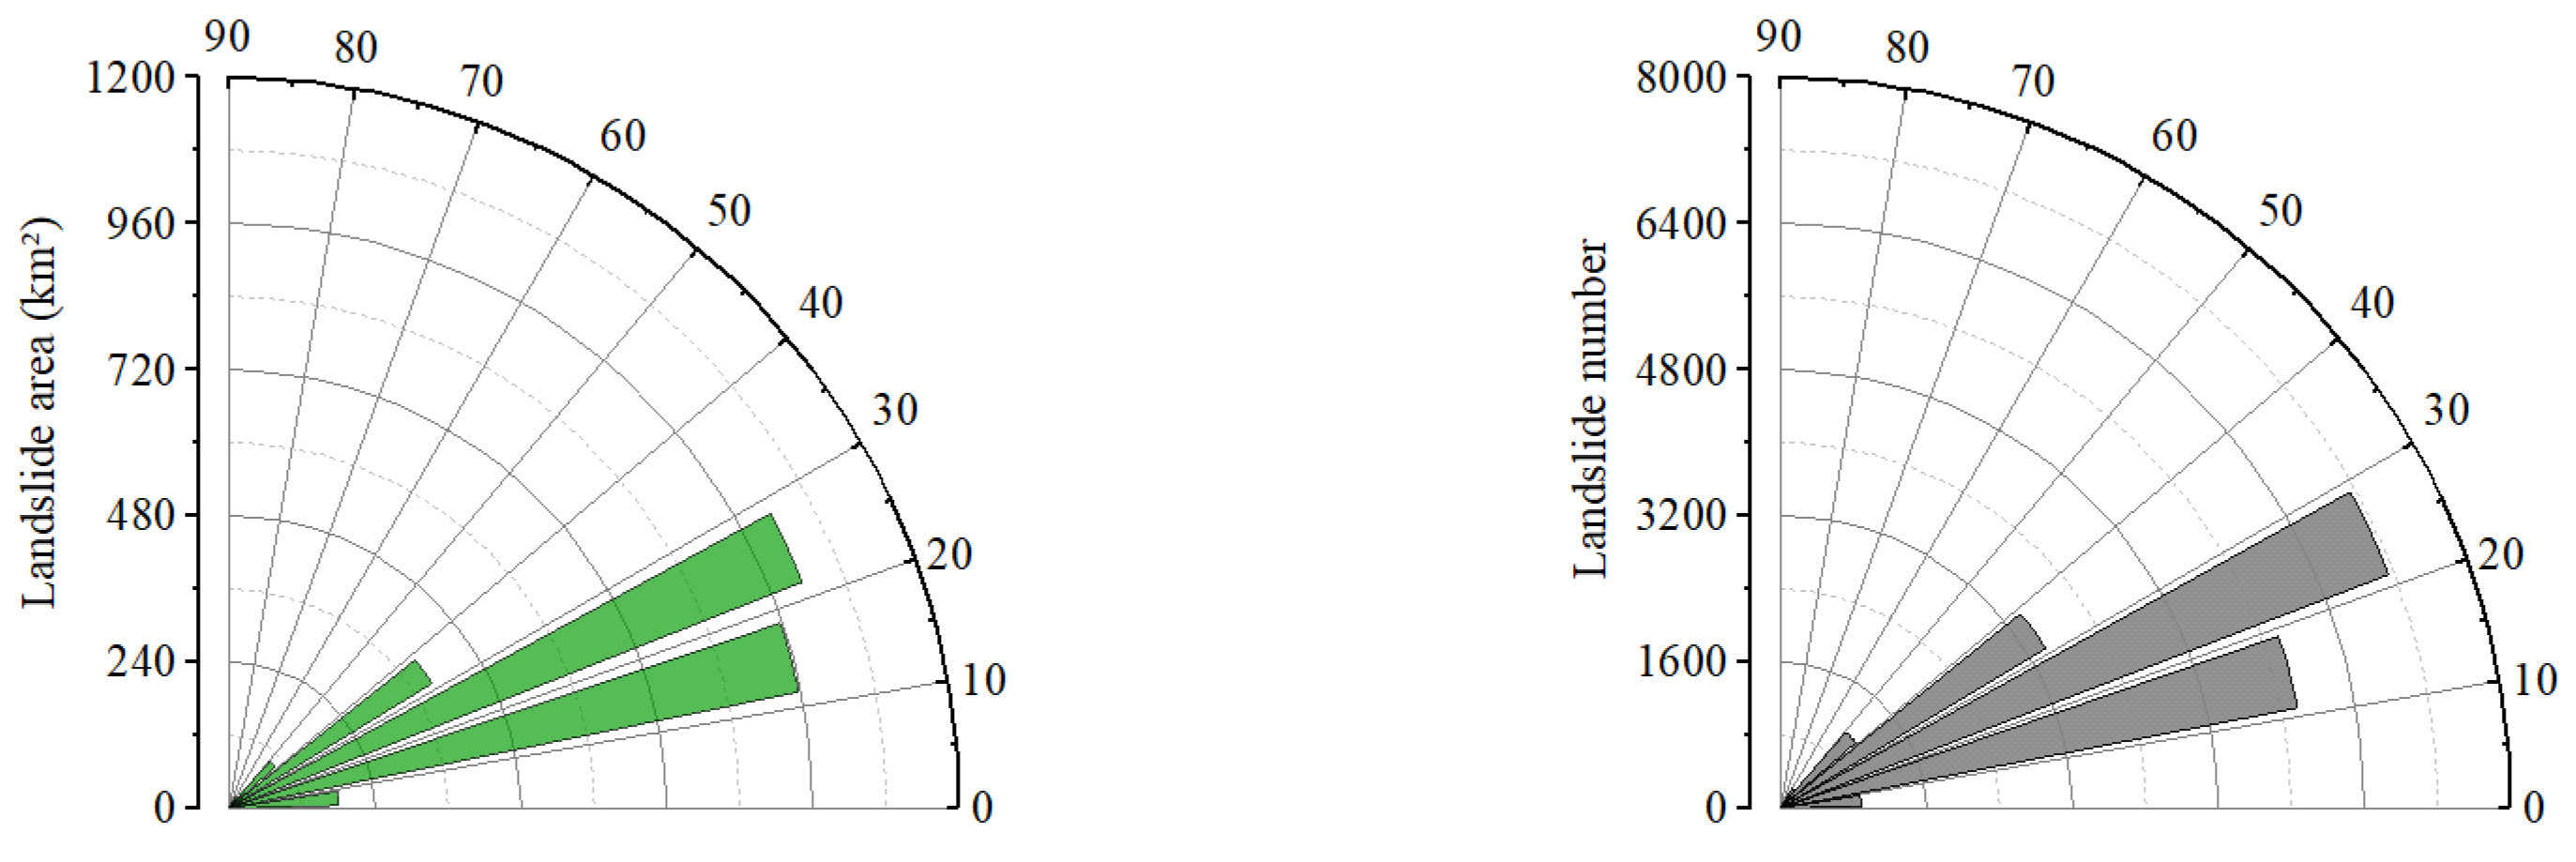
Figure 8 shows the relationship between slope and landslides in the study area. As depicted in Figure 3b, the slope in the study area ranges from 0° to 81.7°. The western and eastern mountainous regions have steep terrain with relatively high slopes, while the central plain and river valley areas are flat, with very low slopes. Slope was classified at 10° intervals, with slopes of 10–30° accounting for 88.65% of the study area, indicating that the region is dominated by low to moderate slopes. The number of landslides peaks in the 20–30° interval with 7143 occurrences and then gradually decreases as the slope increases further. Notably, in the 70–80° slope interval, although the area is only 10.43 km2 and only five landslides occur, both LND and LAP reach their maximum values of 0.48 km−2 and 6.32%, respectively, indicating that large-scale landslides may still occur on local steep slopes. In areas with gentle slopes below 10° and extremely steep slopes above 80°, both the number and density of landslides are significantly low.
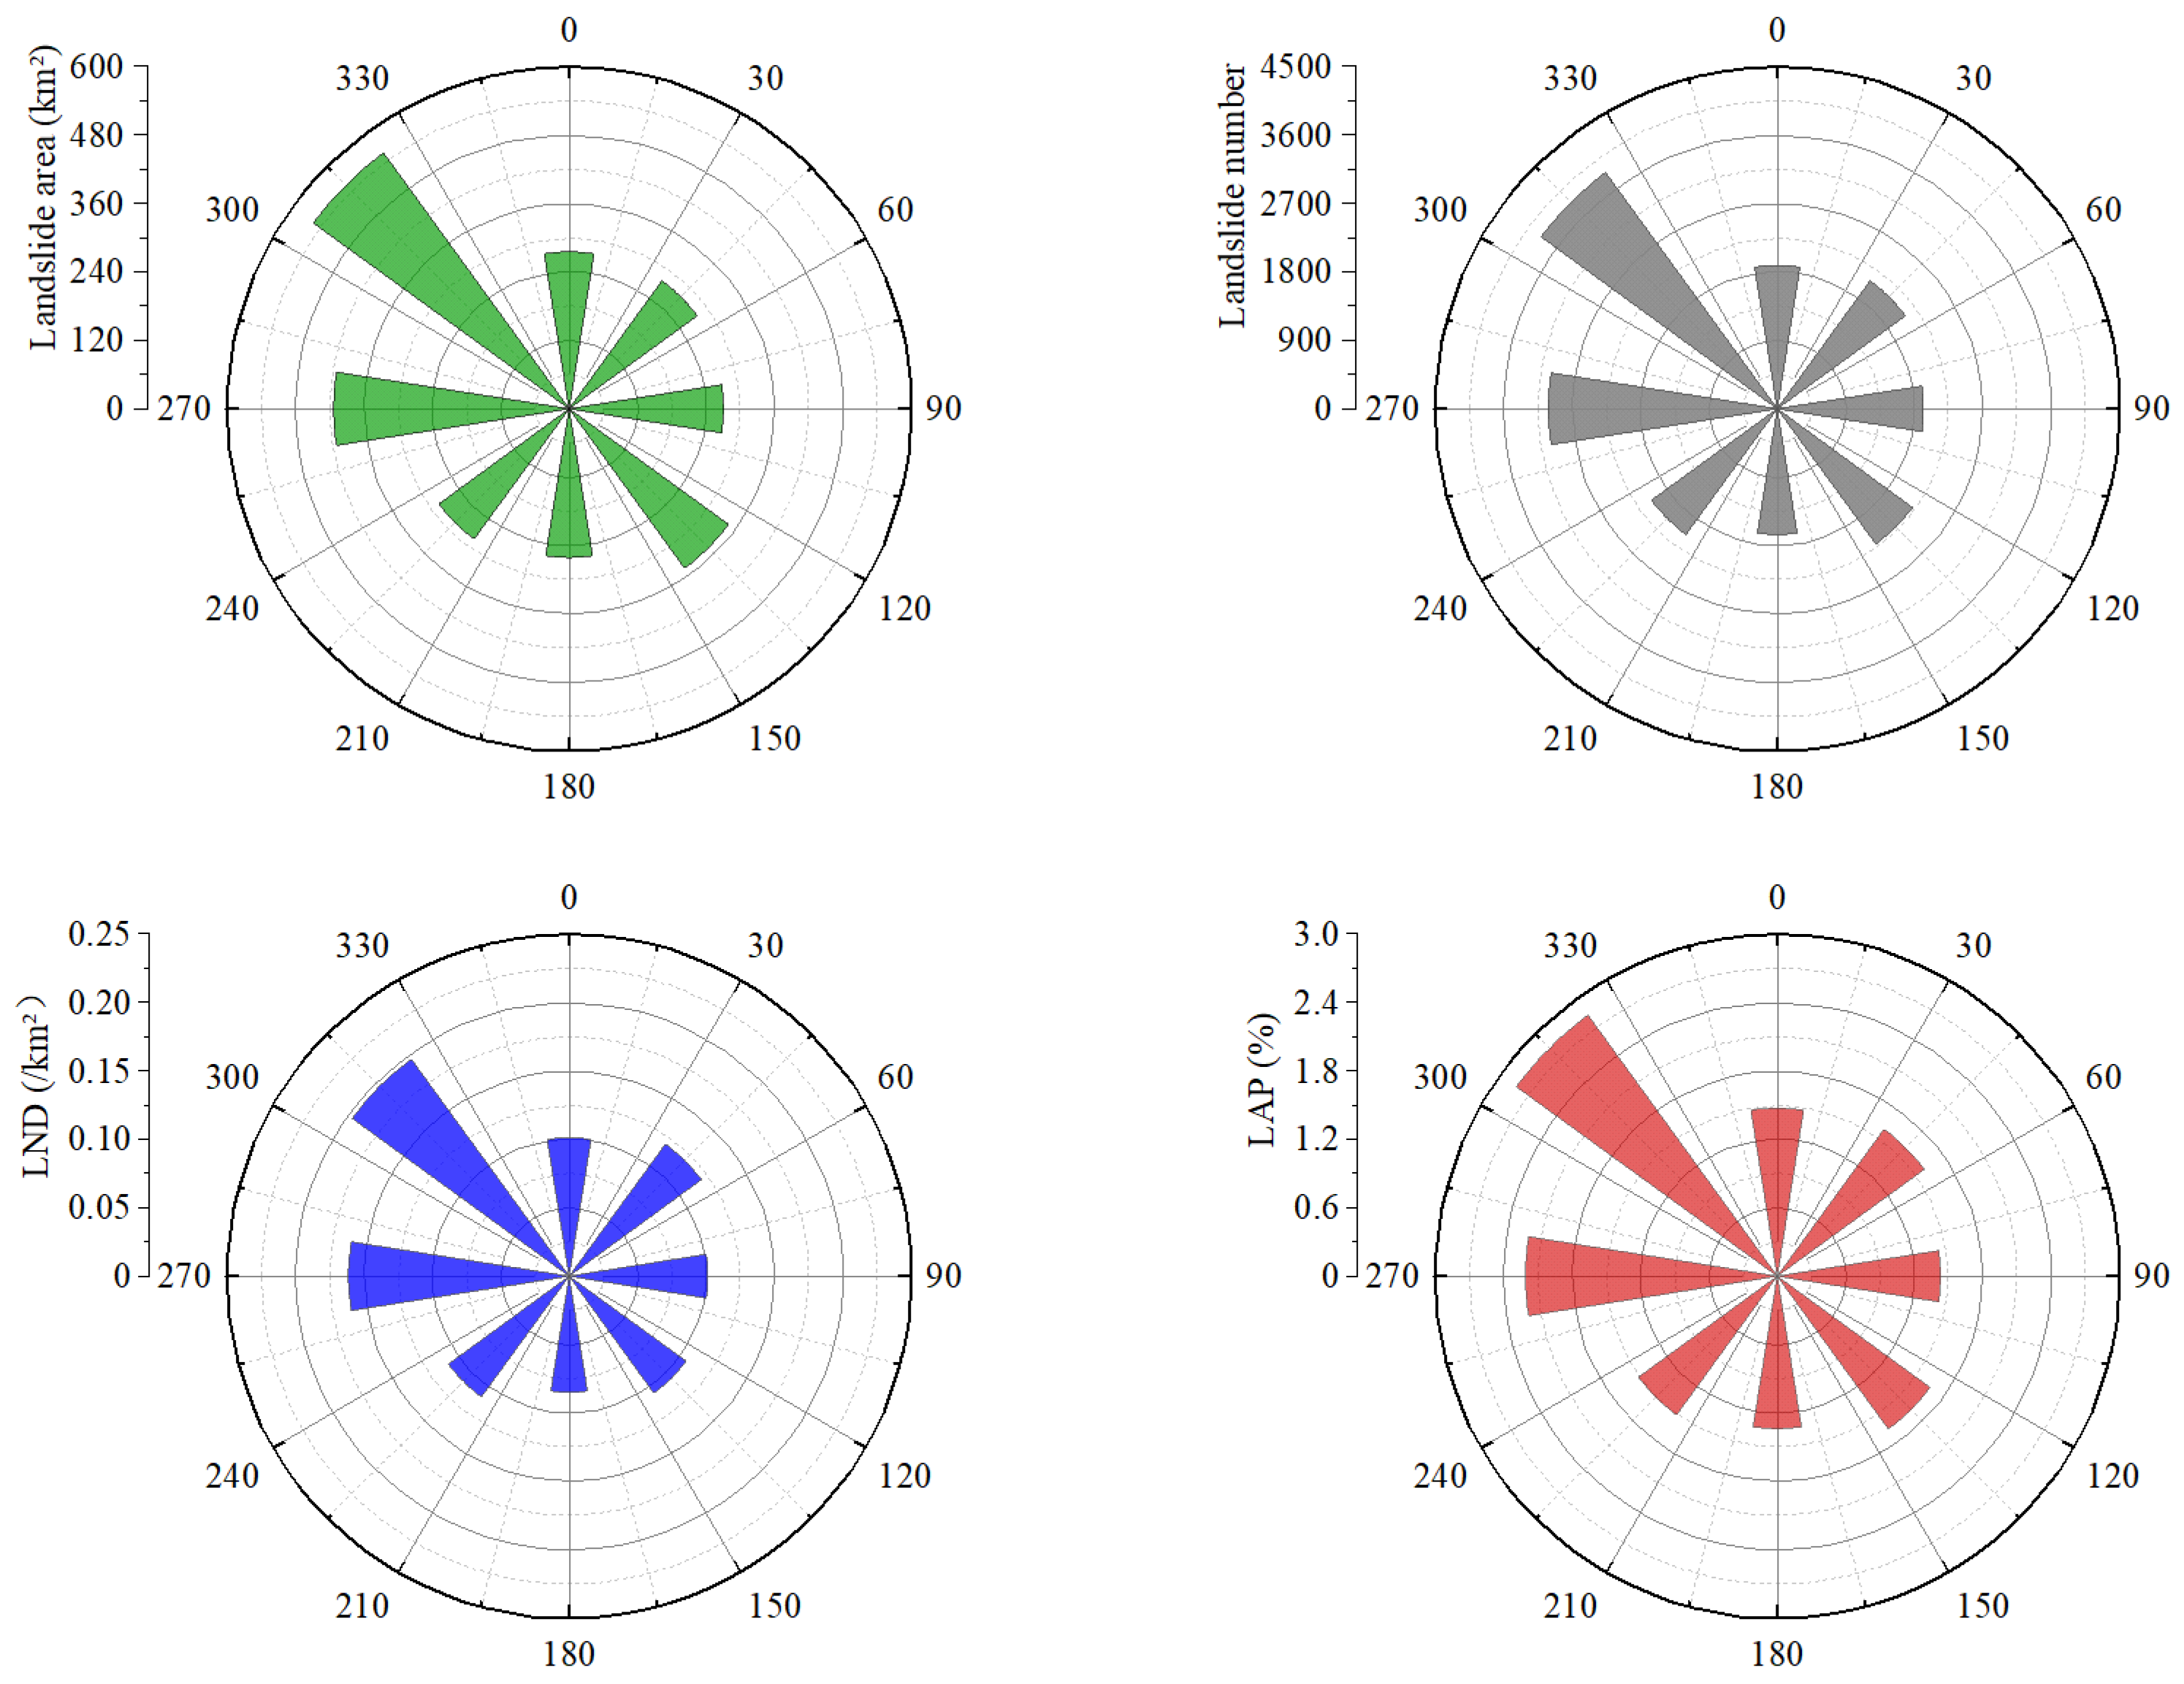
Figure 9 illustrates the relationship between aspects and landslides in the study area. Overall, the trends of landslide number, LND, and LAP are generally consistent, all reaching their highest values on the northwest slope direction, with 3832 landslides, 0.20 km−2, and 2.82%, respectively, followed by the west, southeast, and northeast slope directions. In contrast, landslide activity on the south slope direction is relatively rare, with both LND and LAP at their lowest levels. In general, landslides are more concentrated on the northwest, southeast, and west slope directions, while the south slope direction exhibits a relatively low occurrence frequency. This characteristic may be related to the climatic and geomorphological conditions of the study area, as the northwest and southeast slopes are more influenced by prevailing winds and monsoon circulation.
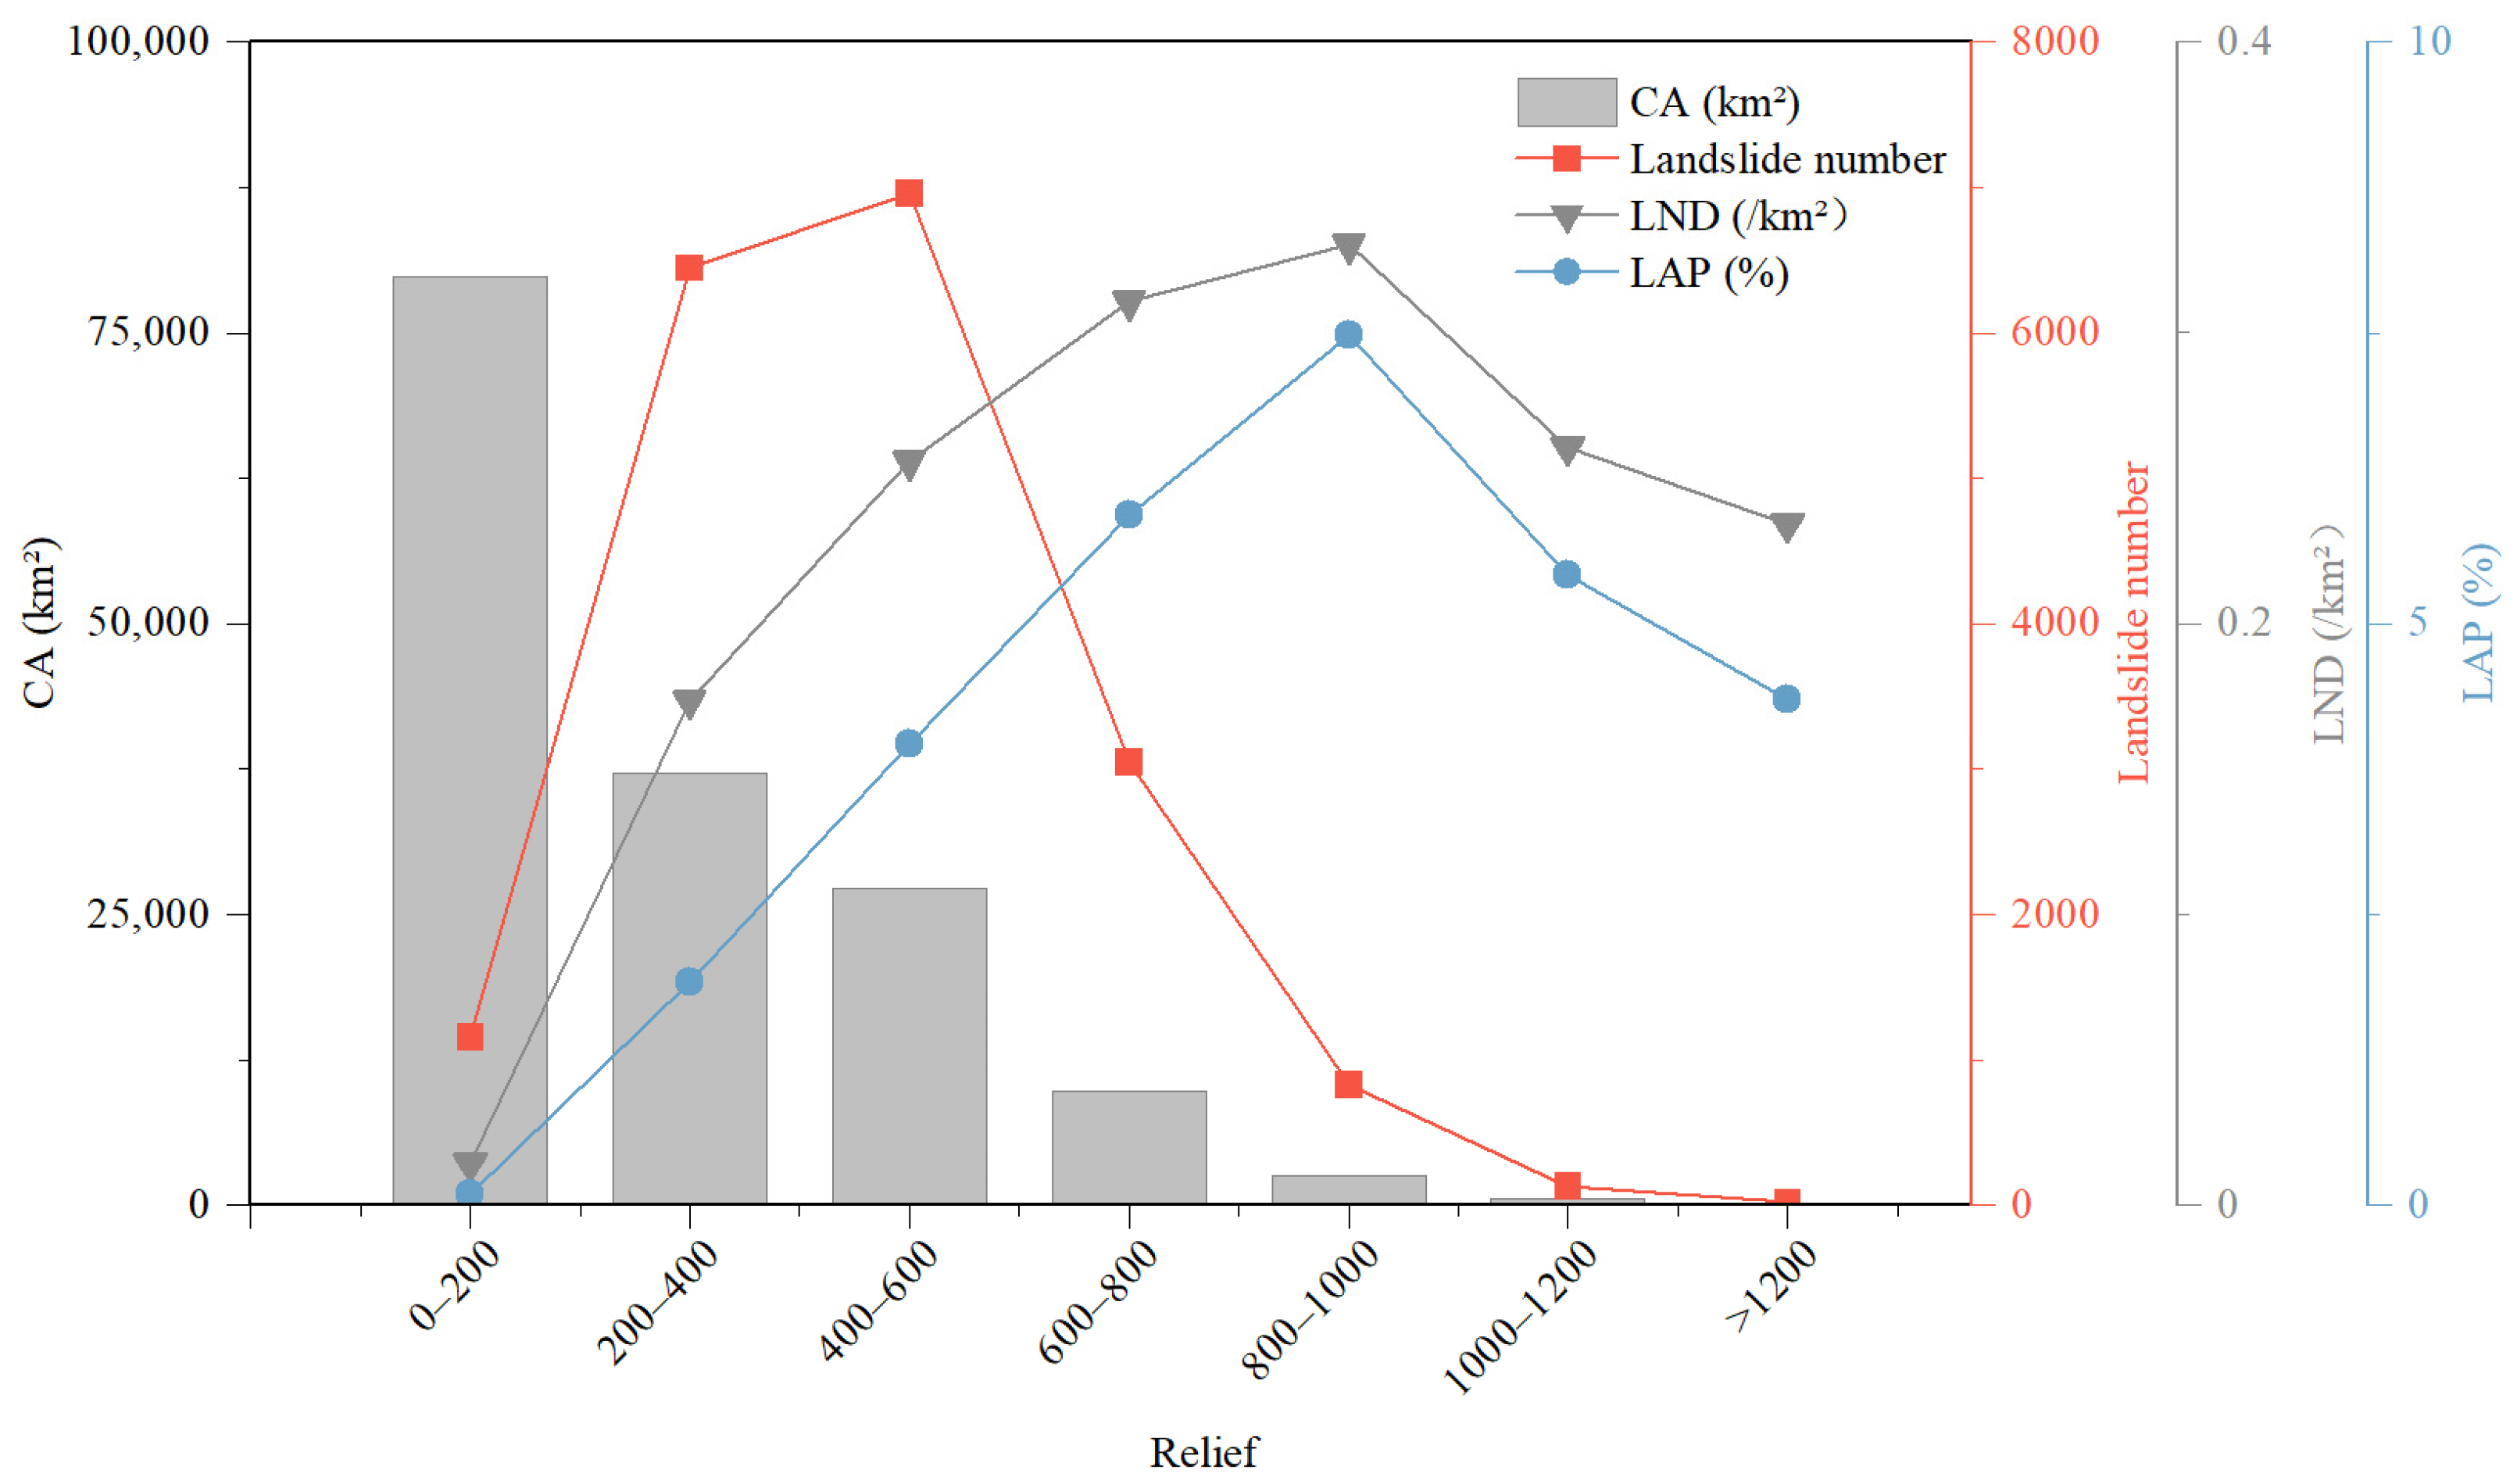
Figure 10 illustrates the relationship between relief and landslides in the study area. As depicted in Figure 3d, the topographic relief in the region spans from 0 to 1577. The western and southern mountainous areas show high relief, whereas the central area is characterized by relatively gentle undulations. At intervals of 200, the terrain undulation of the study area is divided into 8 intervals. Overall, landslide number, LND, and LAP show an initial increase followed by a decrease with increasing relief. Landslides are primarily concentrated within the 200–600 interval, totaling 13,406 occurrences and accounting for 72.08% of all landslides, with the number peaking in the 400–600 interval. Both LND and LAP reach their maximum values in the 800–1000 interval, indicating that landslides are more likely to occur in areas with high relief. As terrain relief further increases, both the number and density of landslides gradually decrease.

4.3.2. Geological Tectonic Factors

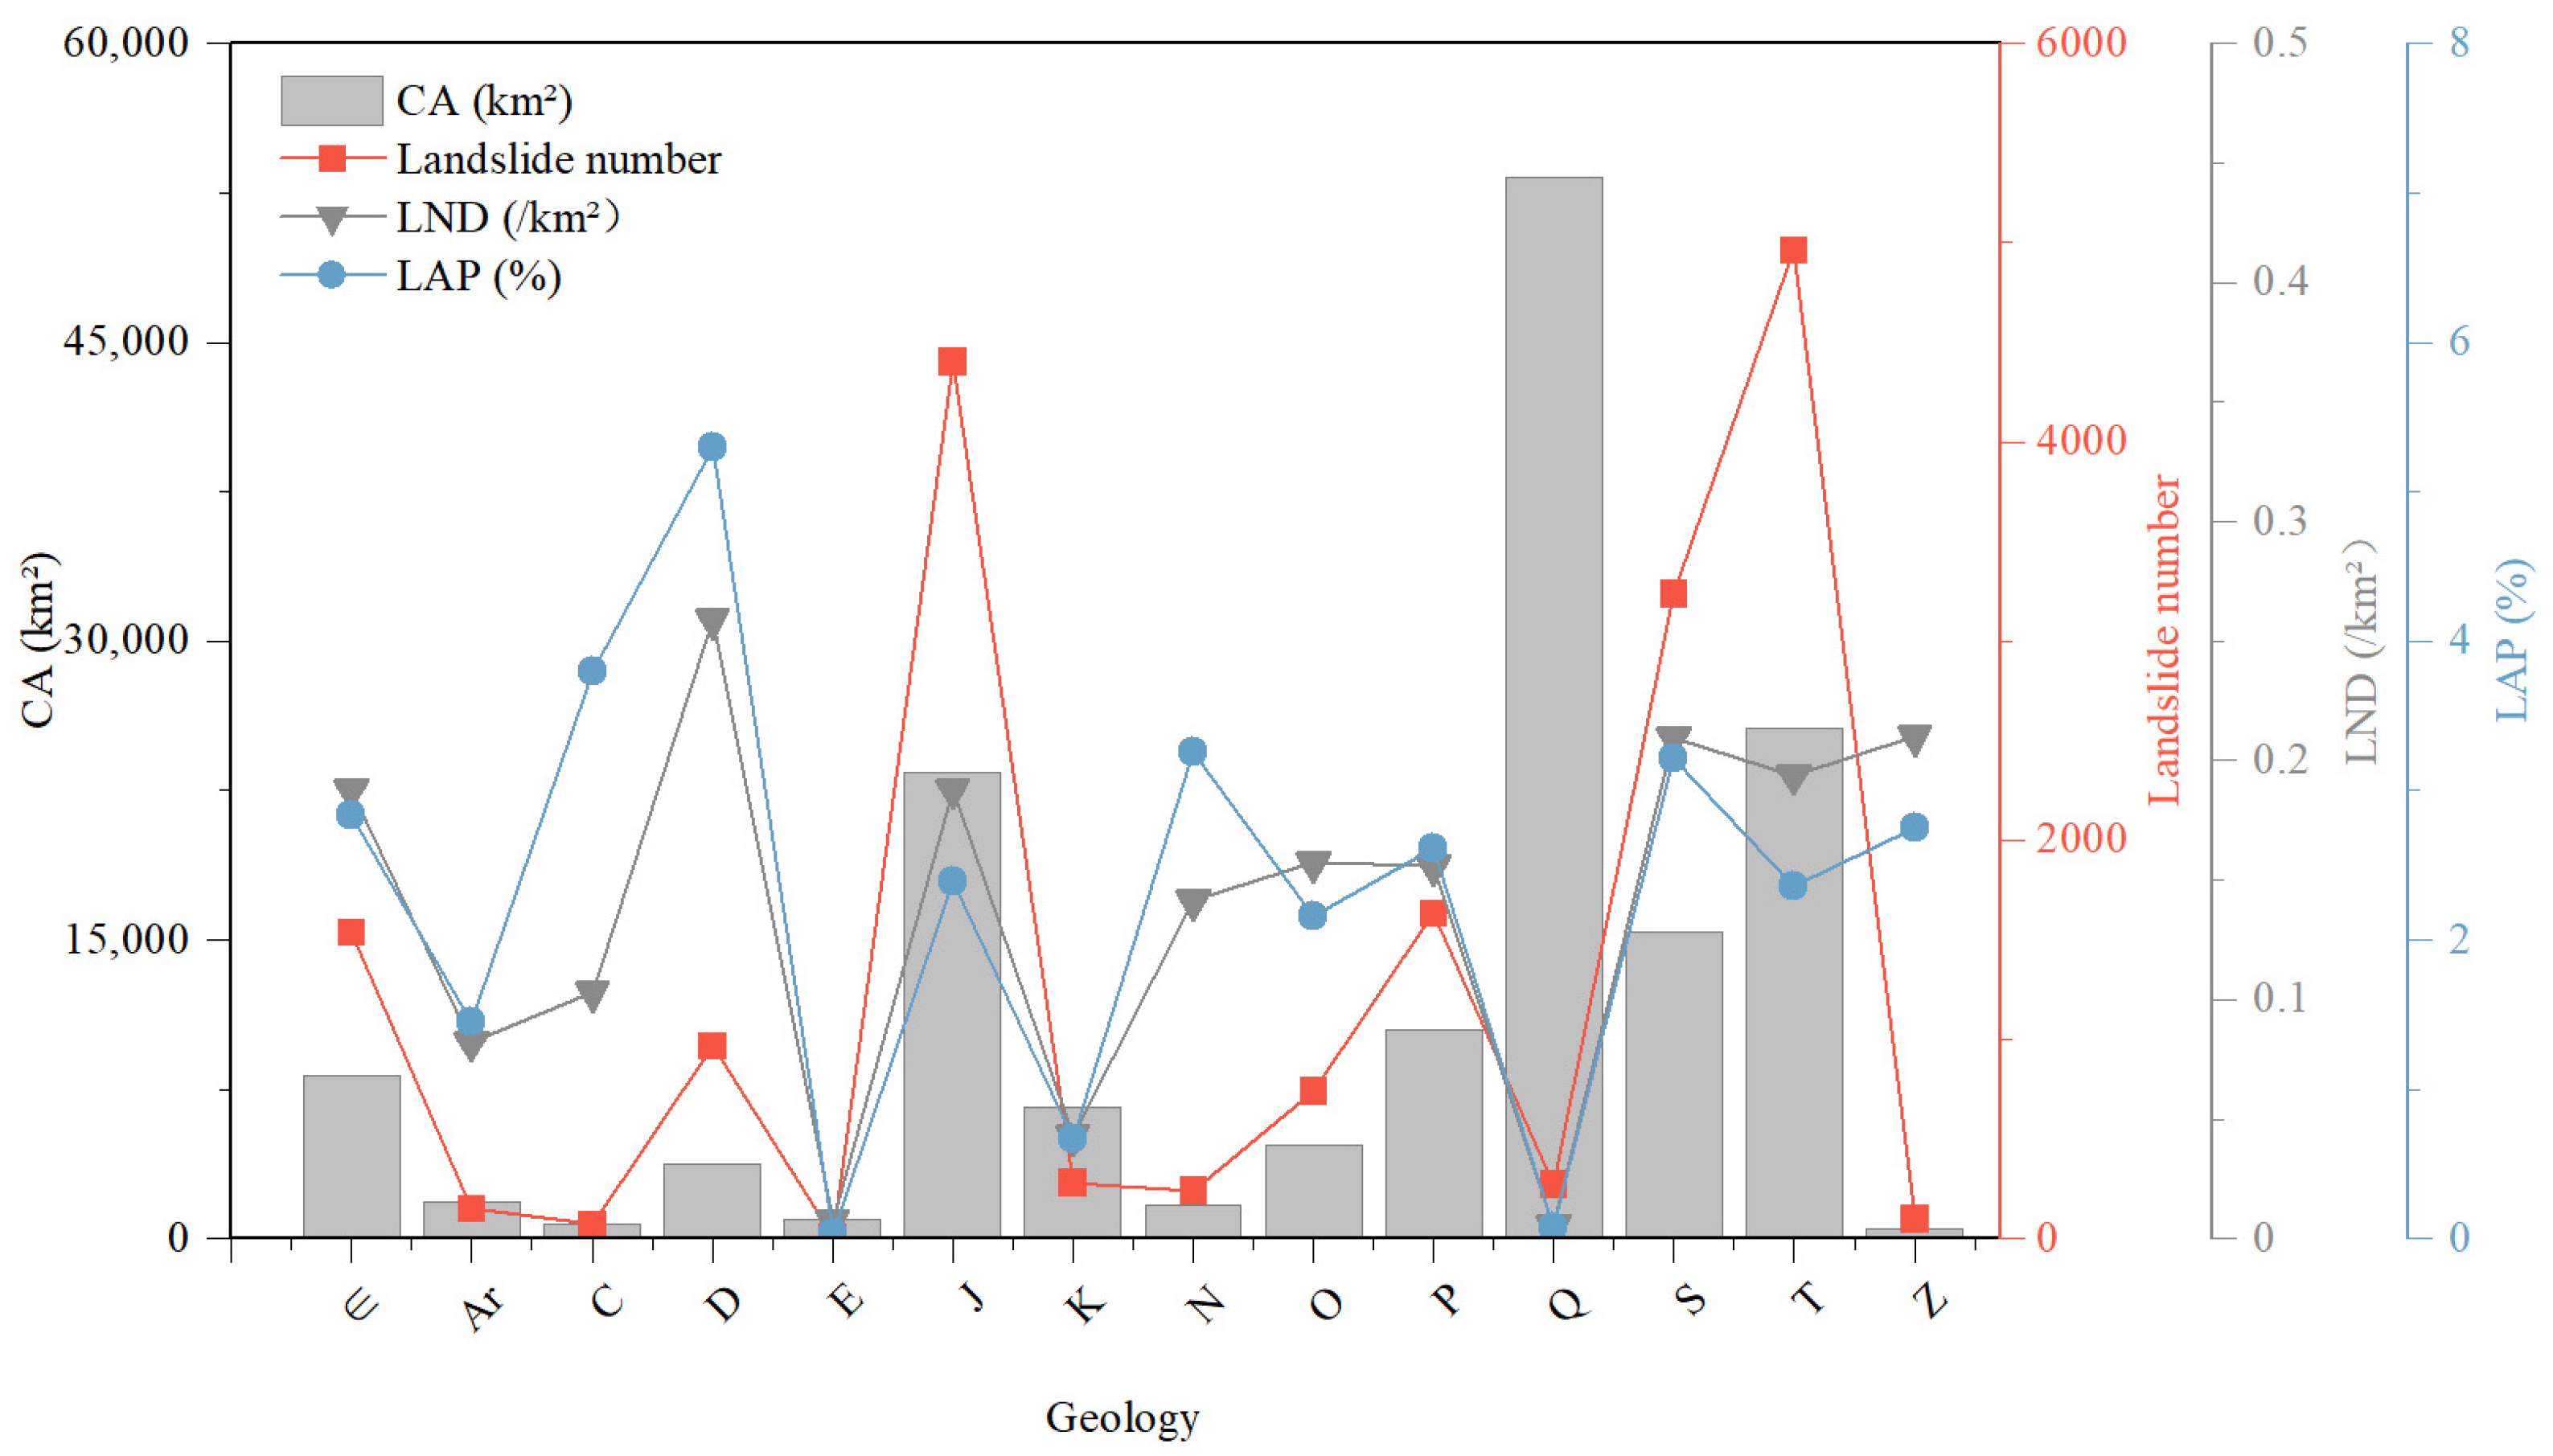
Figure 11 illustrates the relationship between strata and landslides in the study area. As shown in Figure 3e, the lithological units include Archean (Ar), Carboniferous (C), Devonian (D), Paleogene (E), Jurassic (J), Cretaceous (K), Neogene (N), Ordovician (O), Permian (P), Quaternary (Q), Silurian (S), Triassic (T), Sinian (Z), and Cambrian (∈). Among these, the Triassic, Jurassic, and Cambrian strata primarily outcrop in the western mountainous areas and the eastern hills, while the central plain is extensively covered by Quaternary sediments. Most landslides are distributed within the Triassic and Jurassic strata, accounting for approximately 50.34% of the total, because the Triassic and Jurassic are dominated by weak rocks such as sandstone, shale, and mudstone, which are characterized by well-developed joints and fractures, high degrees of weathering, and relatively low overall shear strength [40]. Under continuous rainfall or external disturbances, they are prone to shear failure and overall instability. LND and LAP both reach their peak values in the Devonian strata, at 0.26 km−2 and 5.30%, respectively, indicating a high landslide density and large scale, making these areas prone to clustered landslide occurrences. In contrast, the Quaternary and Paleogene strata exhibit higher shear strength and stability, with very few landslides, and both LND and LAP remain at relatively low levels.
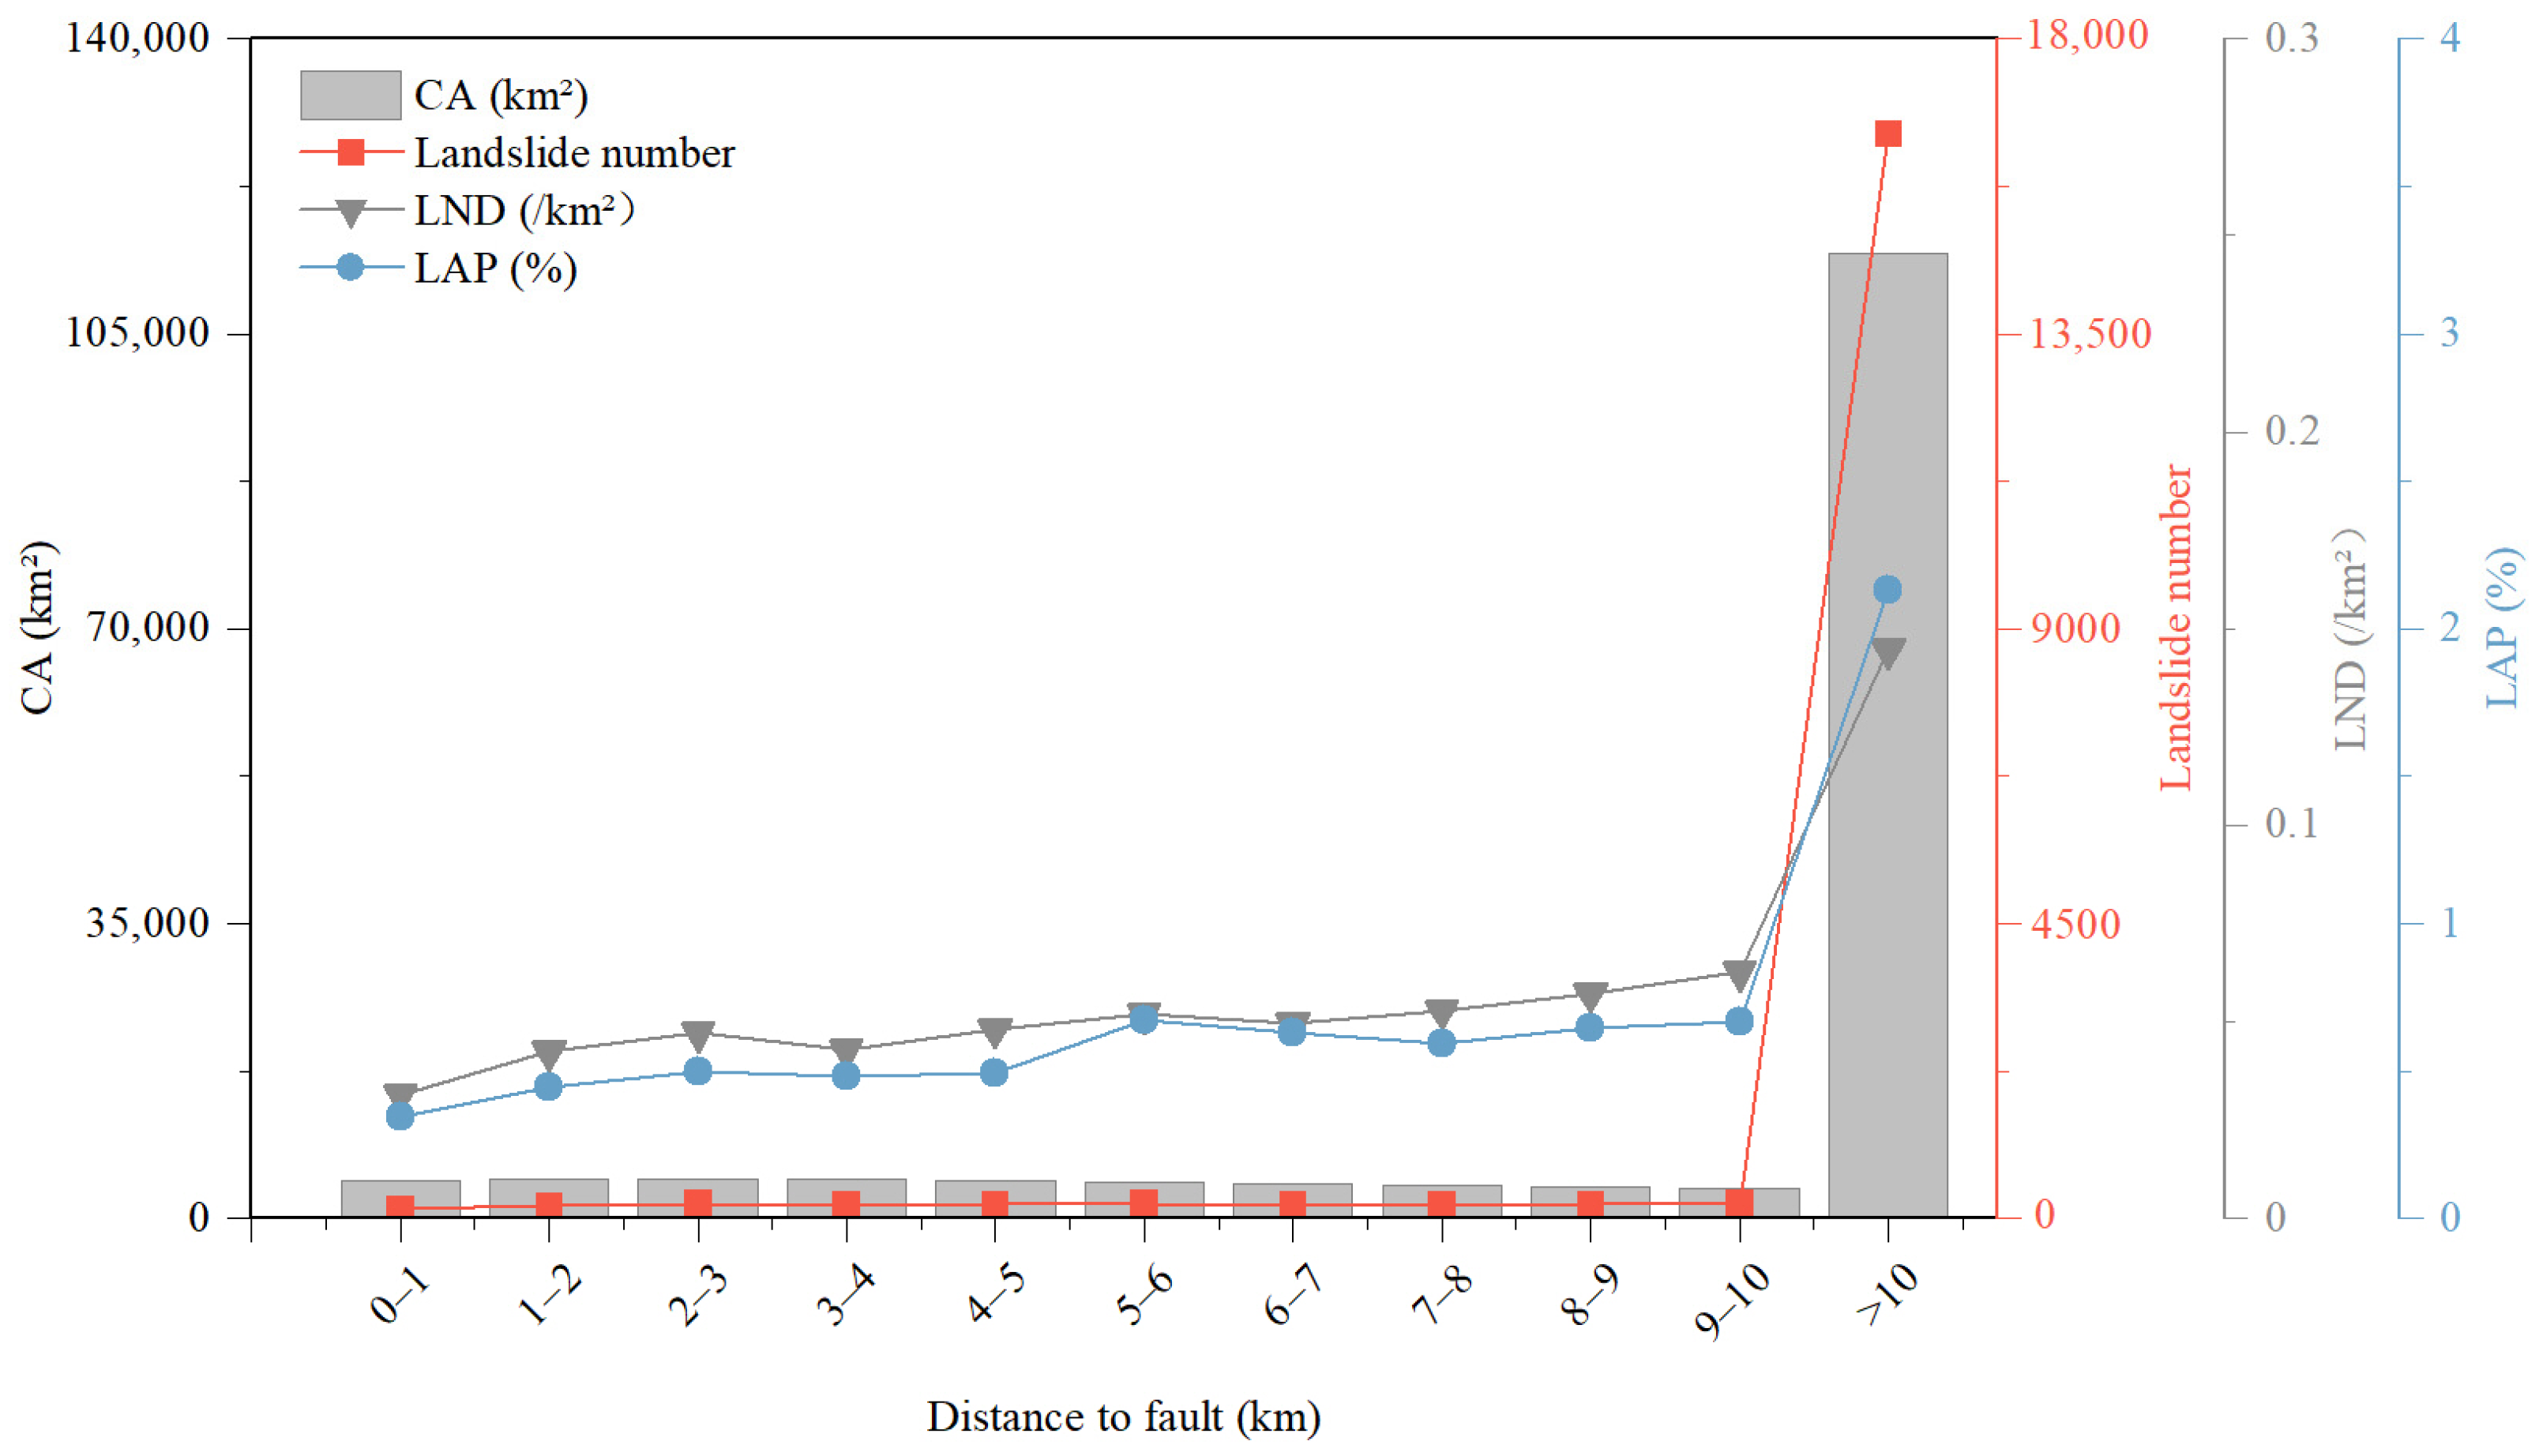
Figure 12 illustrates the relationship between faults and landslides in the study area. As shown in Figure 3f, faults are primarily concentrated in the central plain of the study area, with relatively sparse distribution in the western and eastern mountainous regions. Distances were classified at 1 km intervals into 11 categories. Overall, the distribution of landslide number, LND, and LAP does not show a significant concentration near faults. Instead, the highest values occur in the >10 km interval, with 16,548 landslides, 0.14 km−2, and 2.13%, respectively. This indicates that the distribution of faults in the region has little correlation with landslide occurrence.
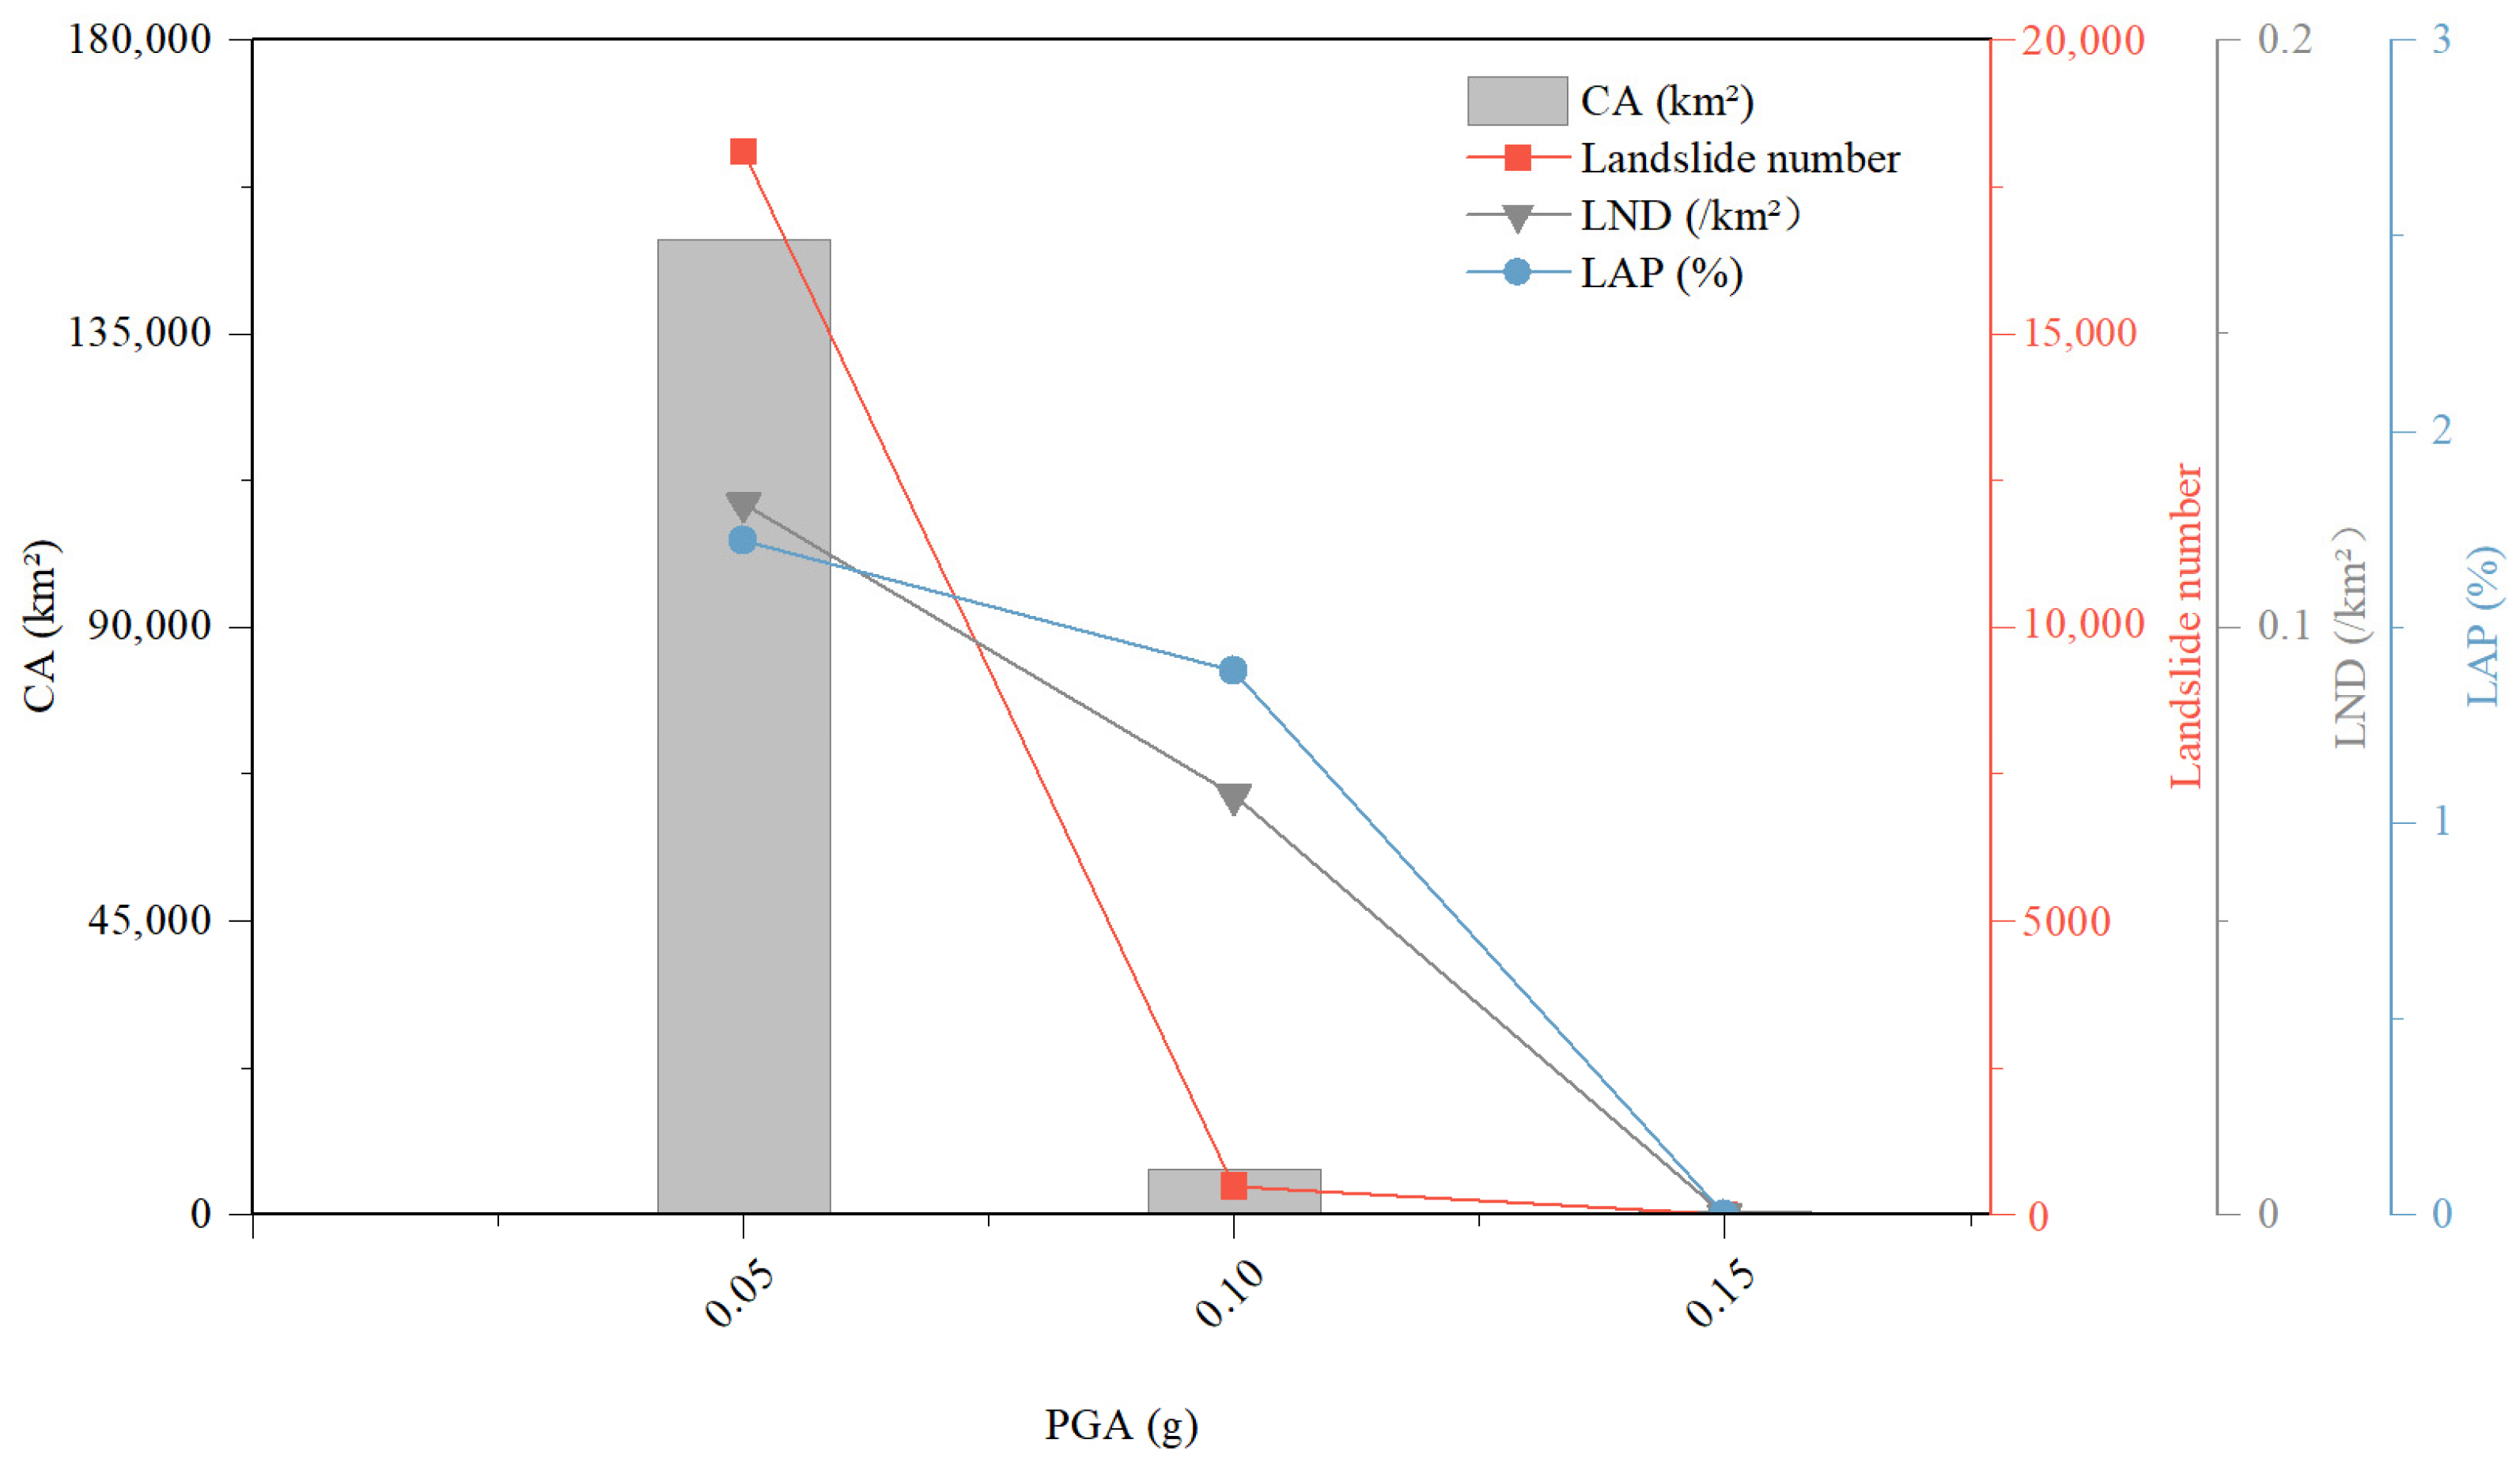
Figure 13 illustrates the relationship between PGA and landslides in the study area. Overall, landslides are predominantly concentrated in the PGA = 0.05 g, with 18,103 occurrences, accounting for approximately 97.34% of the total. Both LND and LAP are relatively high in this interval, at 0.12 km−2 and 1.72%, respectively. As PGA increases, the number of landslides, LND, and LAP all show a marked decreasing trend. At PGA = 0.10 g, only a few landslides occur, and no landslides are observed in areas with PGA = 0.15 g. Combined with Figure 3a,g, it can be seen that regions with high PGA values are mostly located in the central plains, indicating that strong earthquakes have a limited effect on landslide distribution. Therefore, landslide occurrence in the study area is largely controlled by factors such as topography and lithology, while the overall influence of earthquakes is relatively minor.

4.3.3. Hydrometeorological Factors

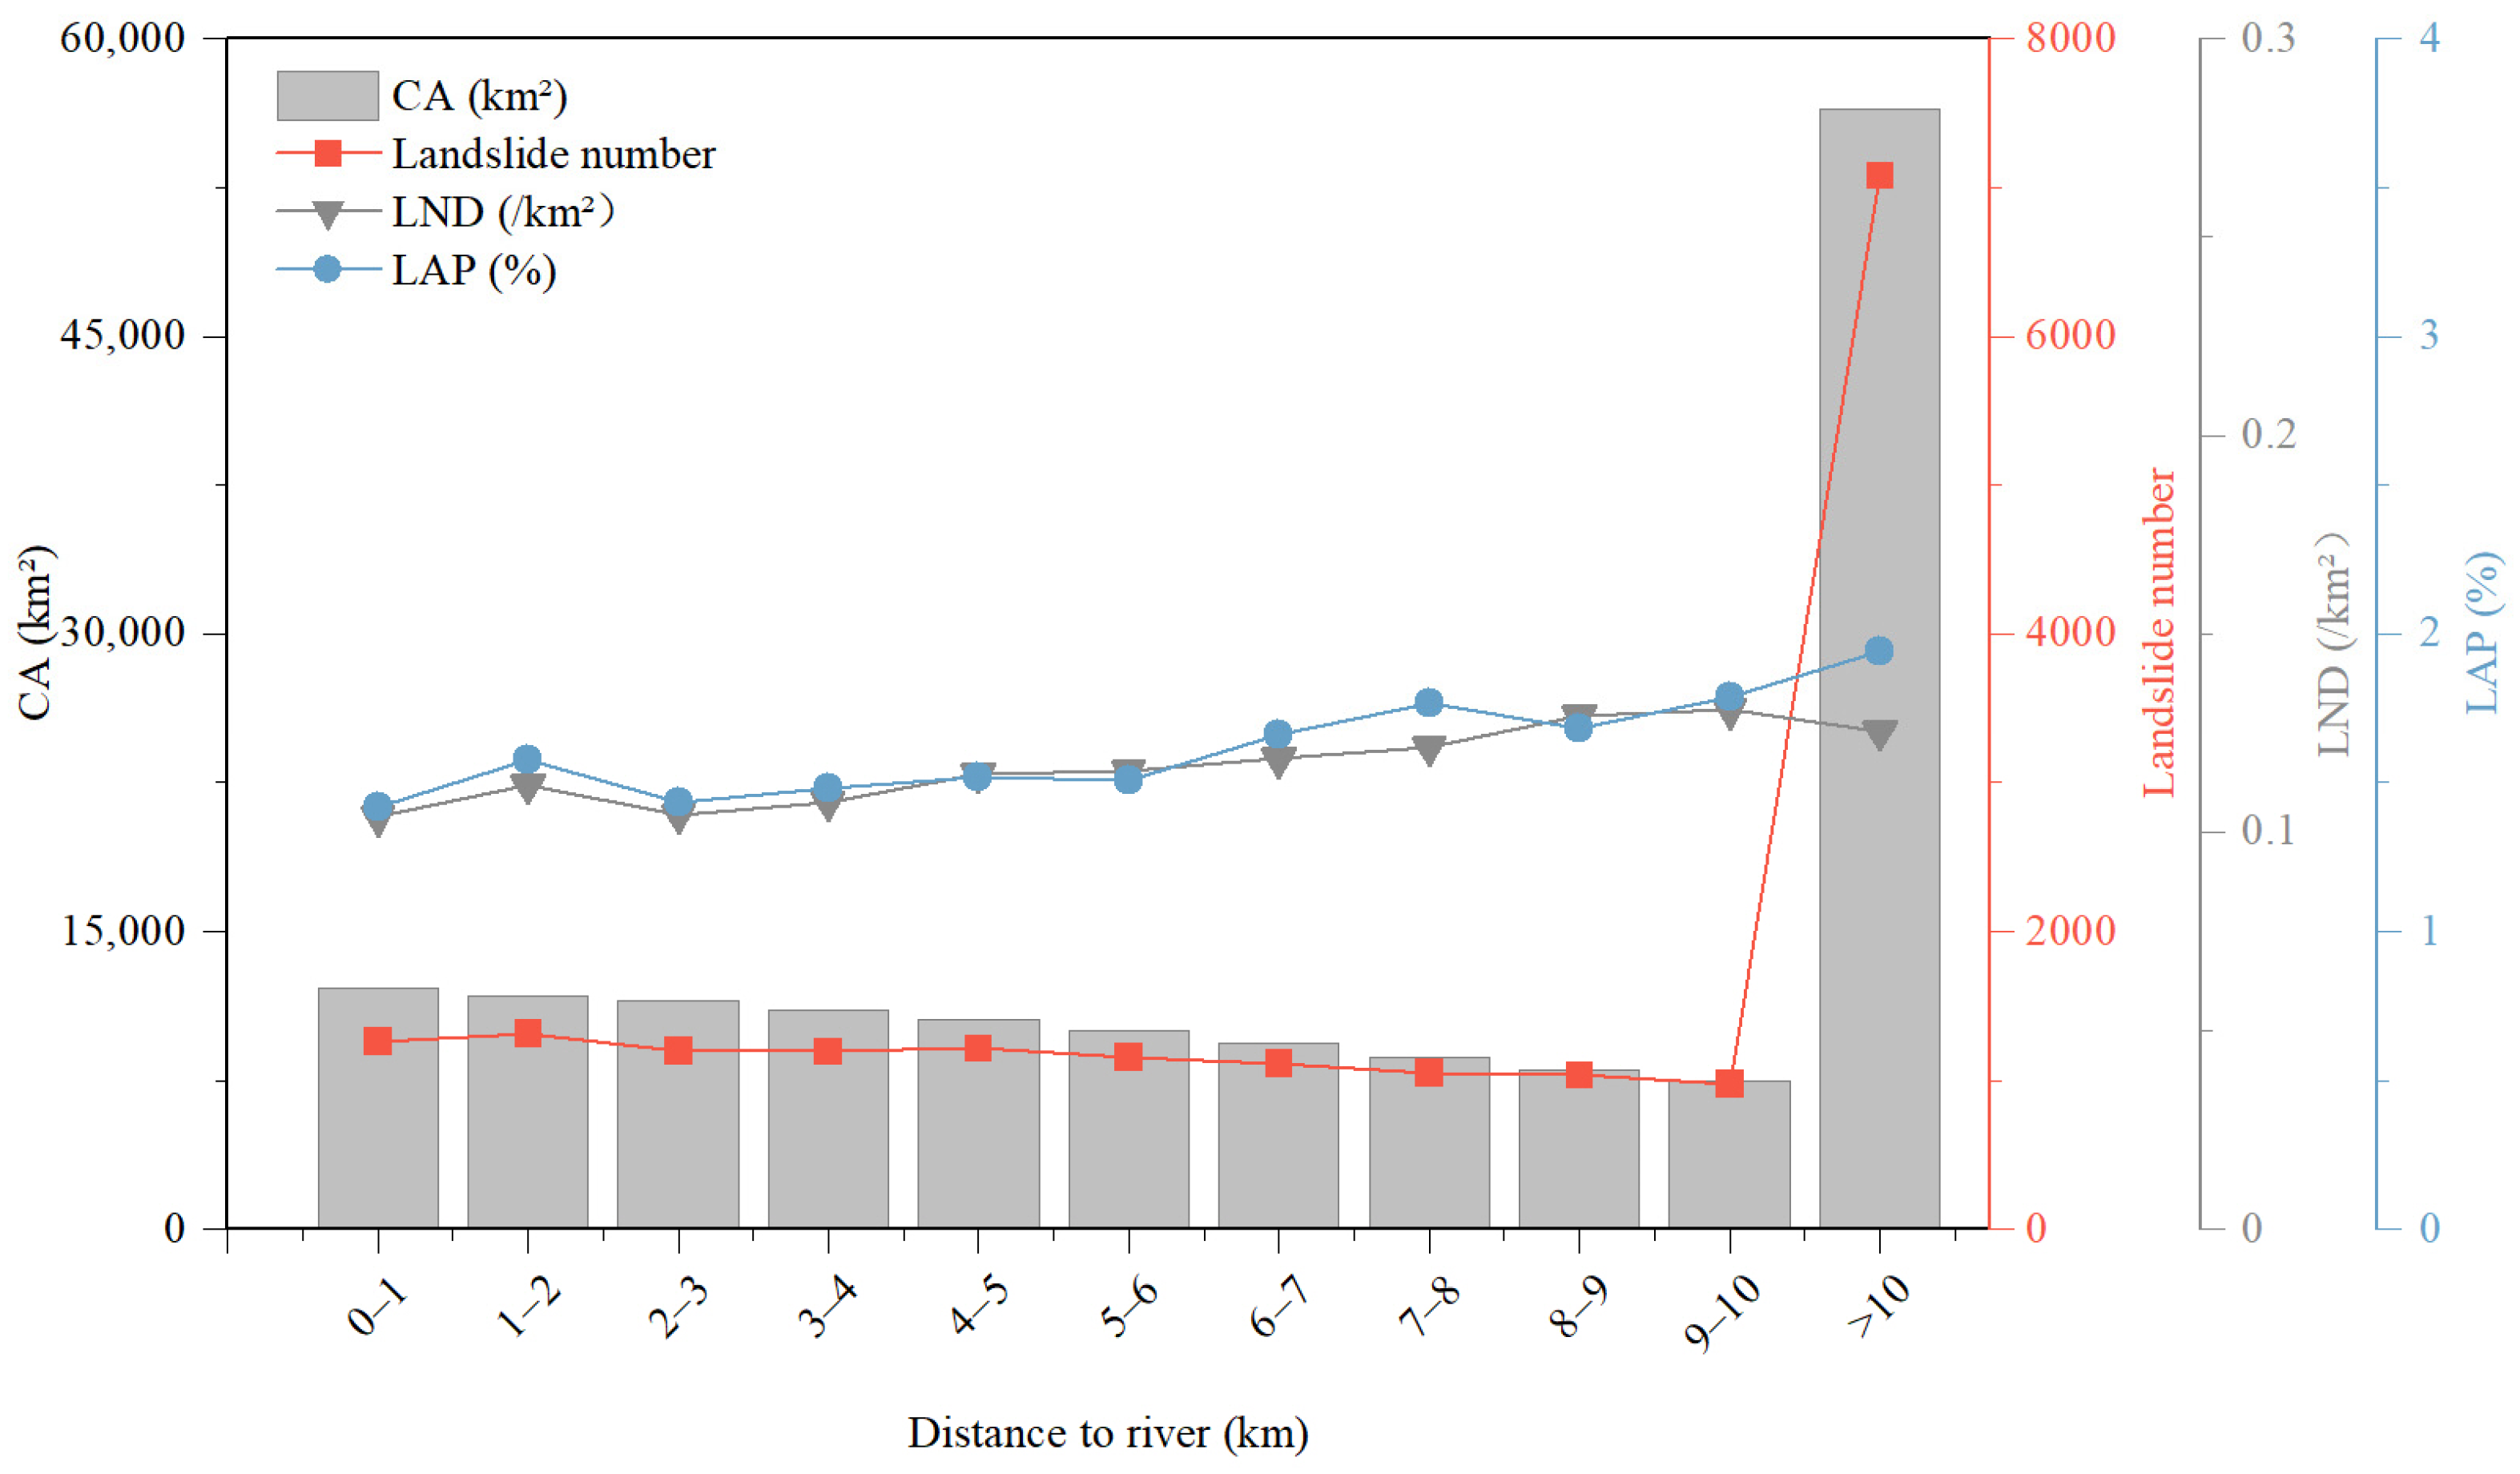
Figure 14 illustrates the relationship between rivers and landslides in the study area. As shown in Figure 3h, the spatial distribution of rivers is uneven across the study area; the central plain is characterized by a dense river network, while the eastern and western regions have relatively sparse river distributions. Distances were classified at 1 km intervals into 11 categories. Within 10 km of rivers, landslide numbers are relatively low and gradually decrease with increasing distance. However, in the >10 km interval, landslide numbers sharply increase, reaching 7079 occurrences, accounting for 38.06% of the total. LAP also reaches its maximum in this interval, while the peak of LND occurs in the 9–10 km distance range. This pattern may be related to river distribution, as areas farther from rivers tend to have more rugged terrain, fractured lithology, and frequent human engineering activities. Therefore, landslide development in the study area is largely influenced by a combination of topography and human activities, while the direct controlling effect of rivers on landslide distribution is relatively limited.
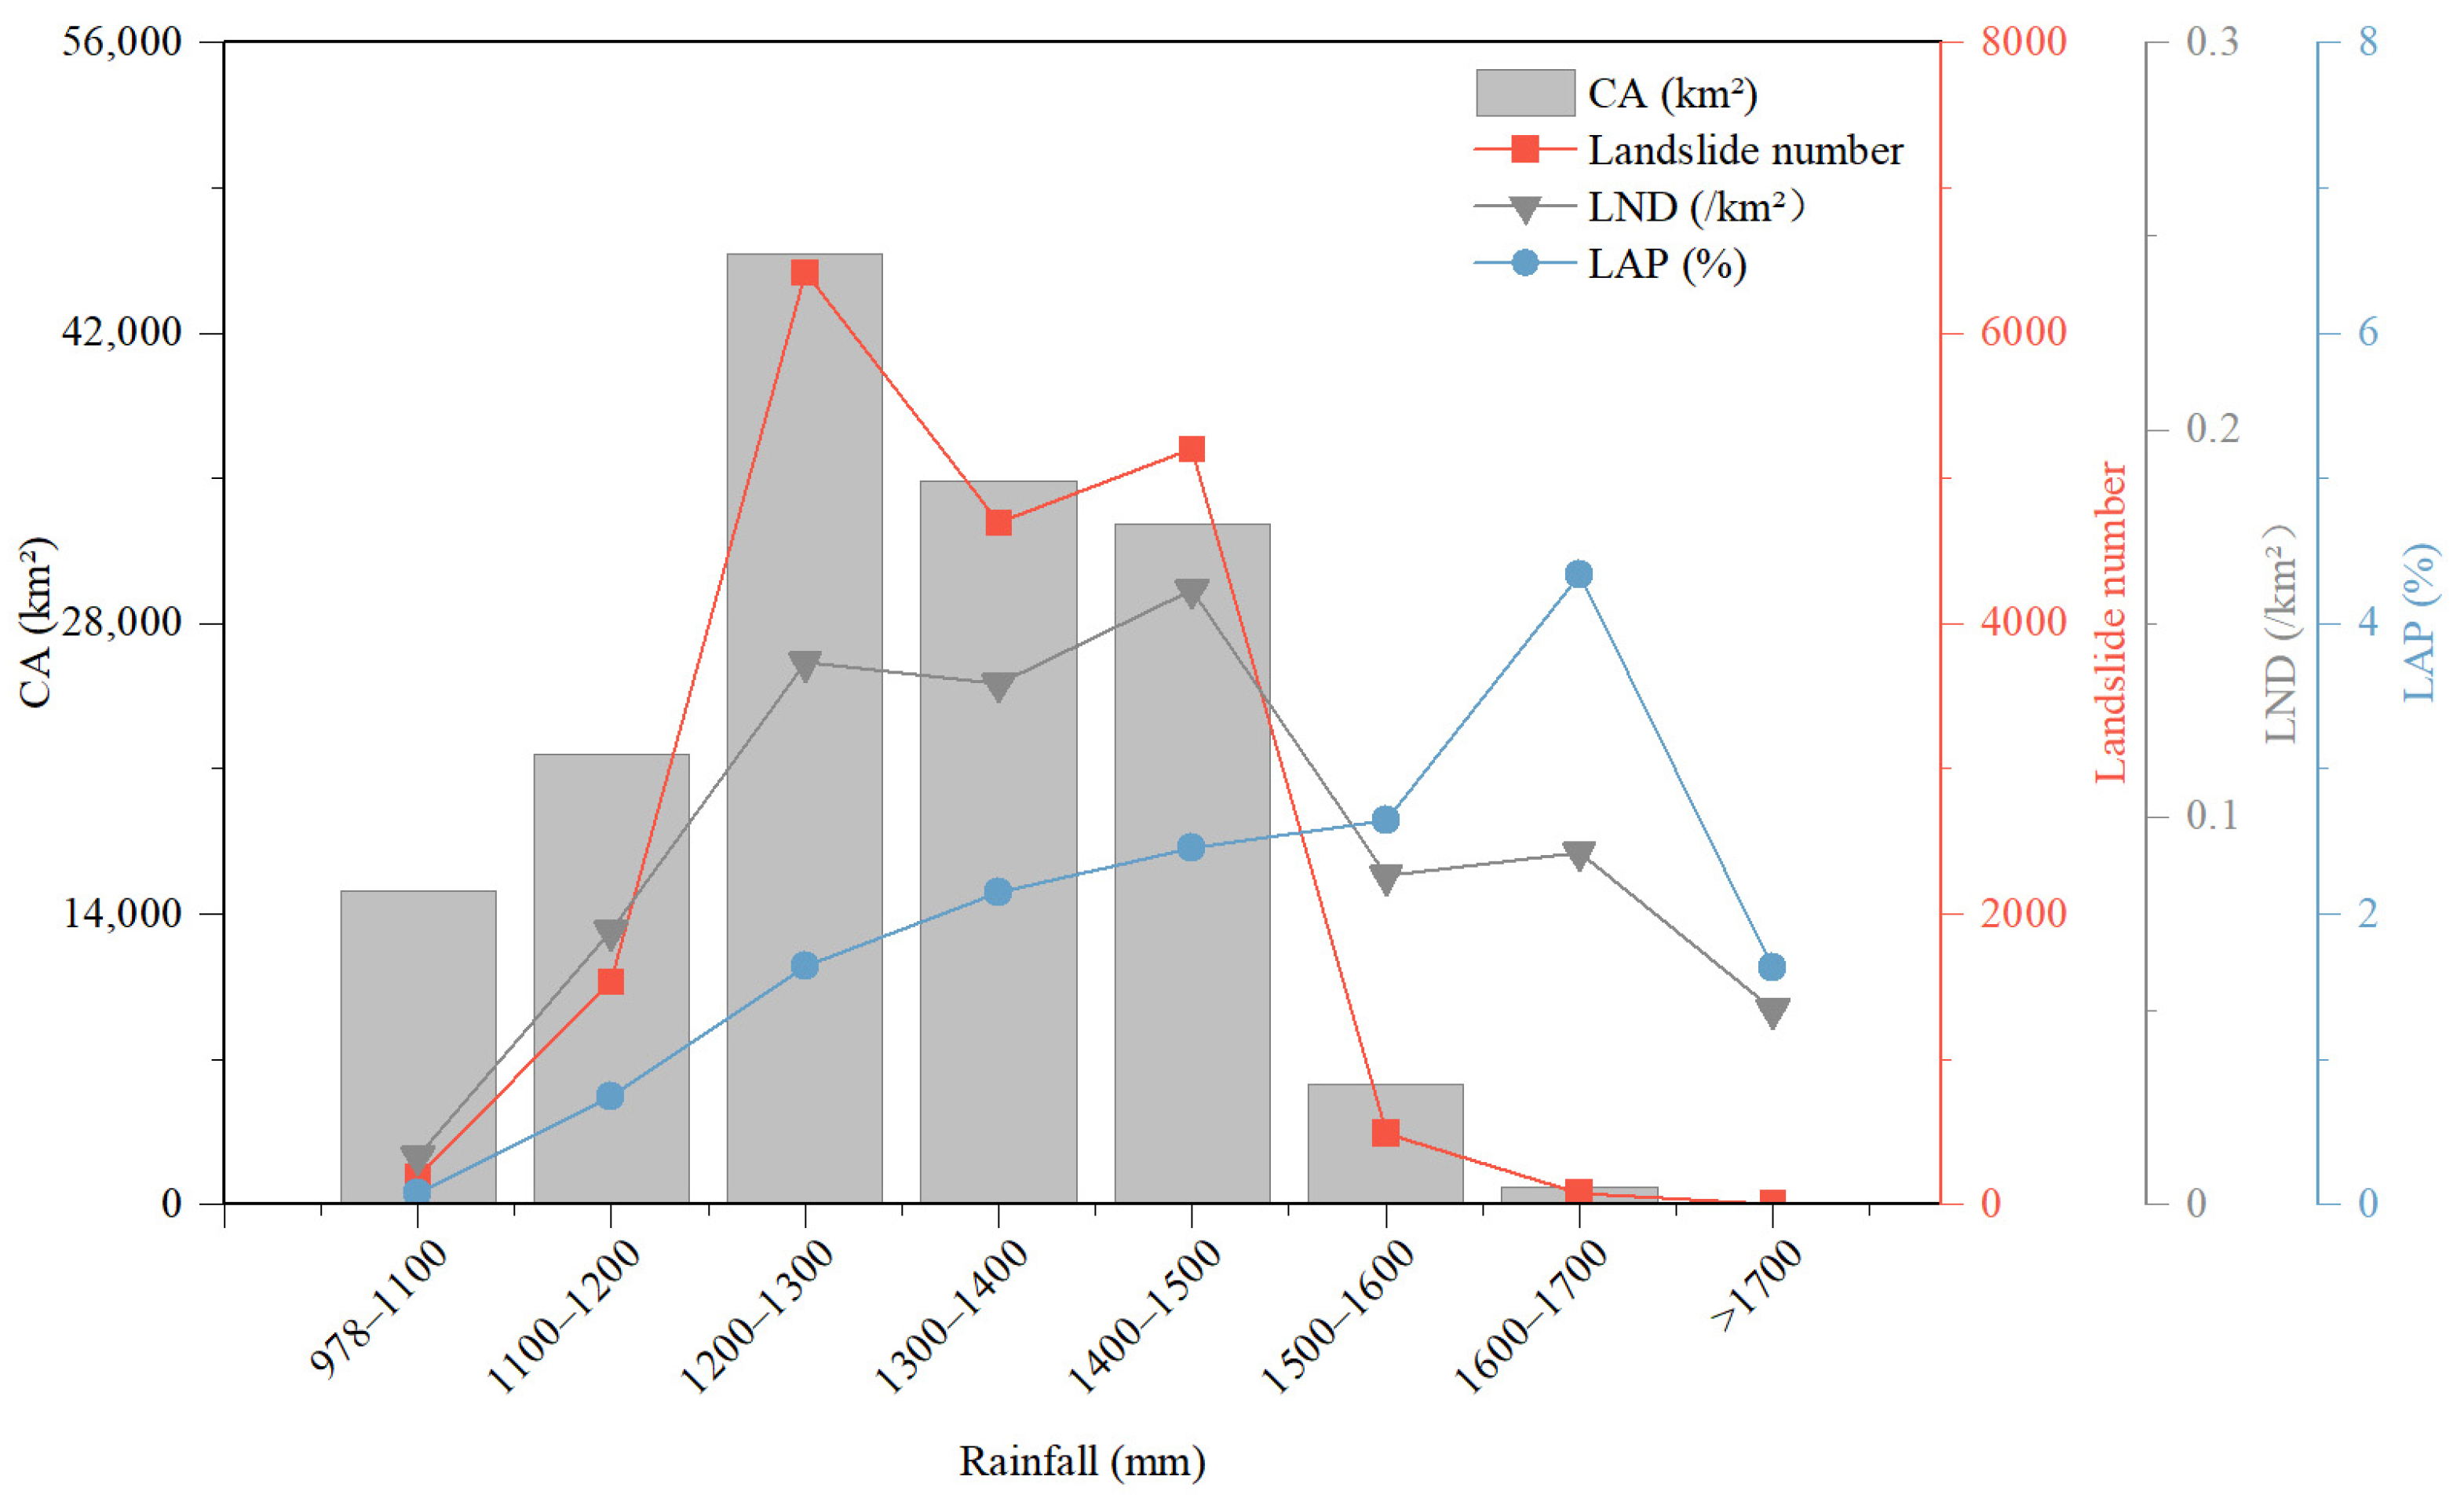
Figure 15 illustrates the relationship between mean annual rainfall and landslides in the study area. Figure 3i shows the distribution of annual mean rainfall, which exhibits significant spatial variation. The annual mean rainfall in the western and eastern parts is notably higher than in the central part. The central plain area has lower annual mean rainfall, typically below 1300 mm, whereas the western and eastern mountainous regions generally receive higher rainfall, ranging from 1300 mm to 1804 mm. Overall, landslides are concentrated in the 1200–1500 mm rainfall interval, with 16,304 occurrences, accounting for 87.67% of the total. LND also reaches its peak within this range, indicating a relatively dense distribution of landslides. This is because when rainfall reaches 1200–1500 mm, infiltration increases the weight of the soil and gradually raises pore water pressure, reducing the shear strength of the soil and rock mass and making sliding more likely [41]. LAP generally increases with increasing rainfall and reaches its maximum in the 1600–1700 mm interval before decreasing, as areas with >1700 mm rainfall are relatively small, resulting in lower landslide numbers and densities. Nevertheless, the landslide risk associated with heavy rainfall should not be ignored.
Figure 16 illustrates the relationship between the TWI and landslides in the study area. Figure 3j shows the distribution of TWI in the study area, with values ranging from 1.6 to 28.79. High TWI values are predominantly distributed in the low-lying central plain, while the western and eastern mountainous regions have relatively smaller TWI values. With 3 as the interval, the TWI of the study area is divided into 8 intervals. The overall trends of landslide number, LND, and LAP are consistent, initially increasing and then decreasing with increasing TWI. Landslides are mainly concentrated in the TWI range of 3–9, with the number of landslides and LND peaking in the 3–6 interval at 9625 occurrences and 0.16 km−2, respectively. LAP reaches both its peak and secondary peak within the 3–9 interval. This indicates that terrain within the 3–9 TWI range has strong water-converging capability, leading to increased soil moisture and a high susceptibility to slope instability under heavy rainfall. When TWI exceeds 9, the number of landslides, LND, and LAP all decrease significantly, particularly in areas with TWI > 12, where landslide occurrences are sparse and both density and area proportion remain low. Overall, a TWI of 3–9 is more conducive to landslide occurrence, whereas values that are too low or too high are unfavorable for landslide development.

4.3.4. Surface Cover Factors

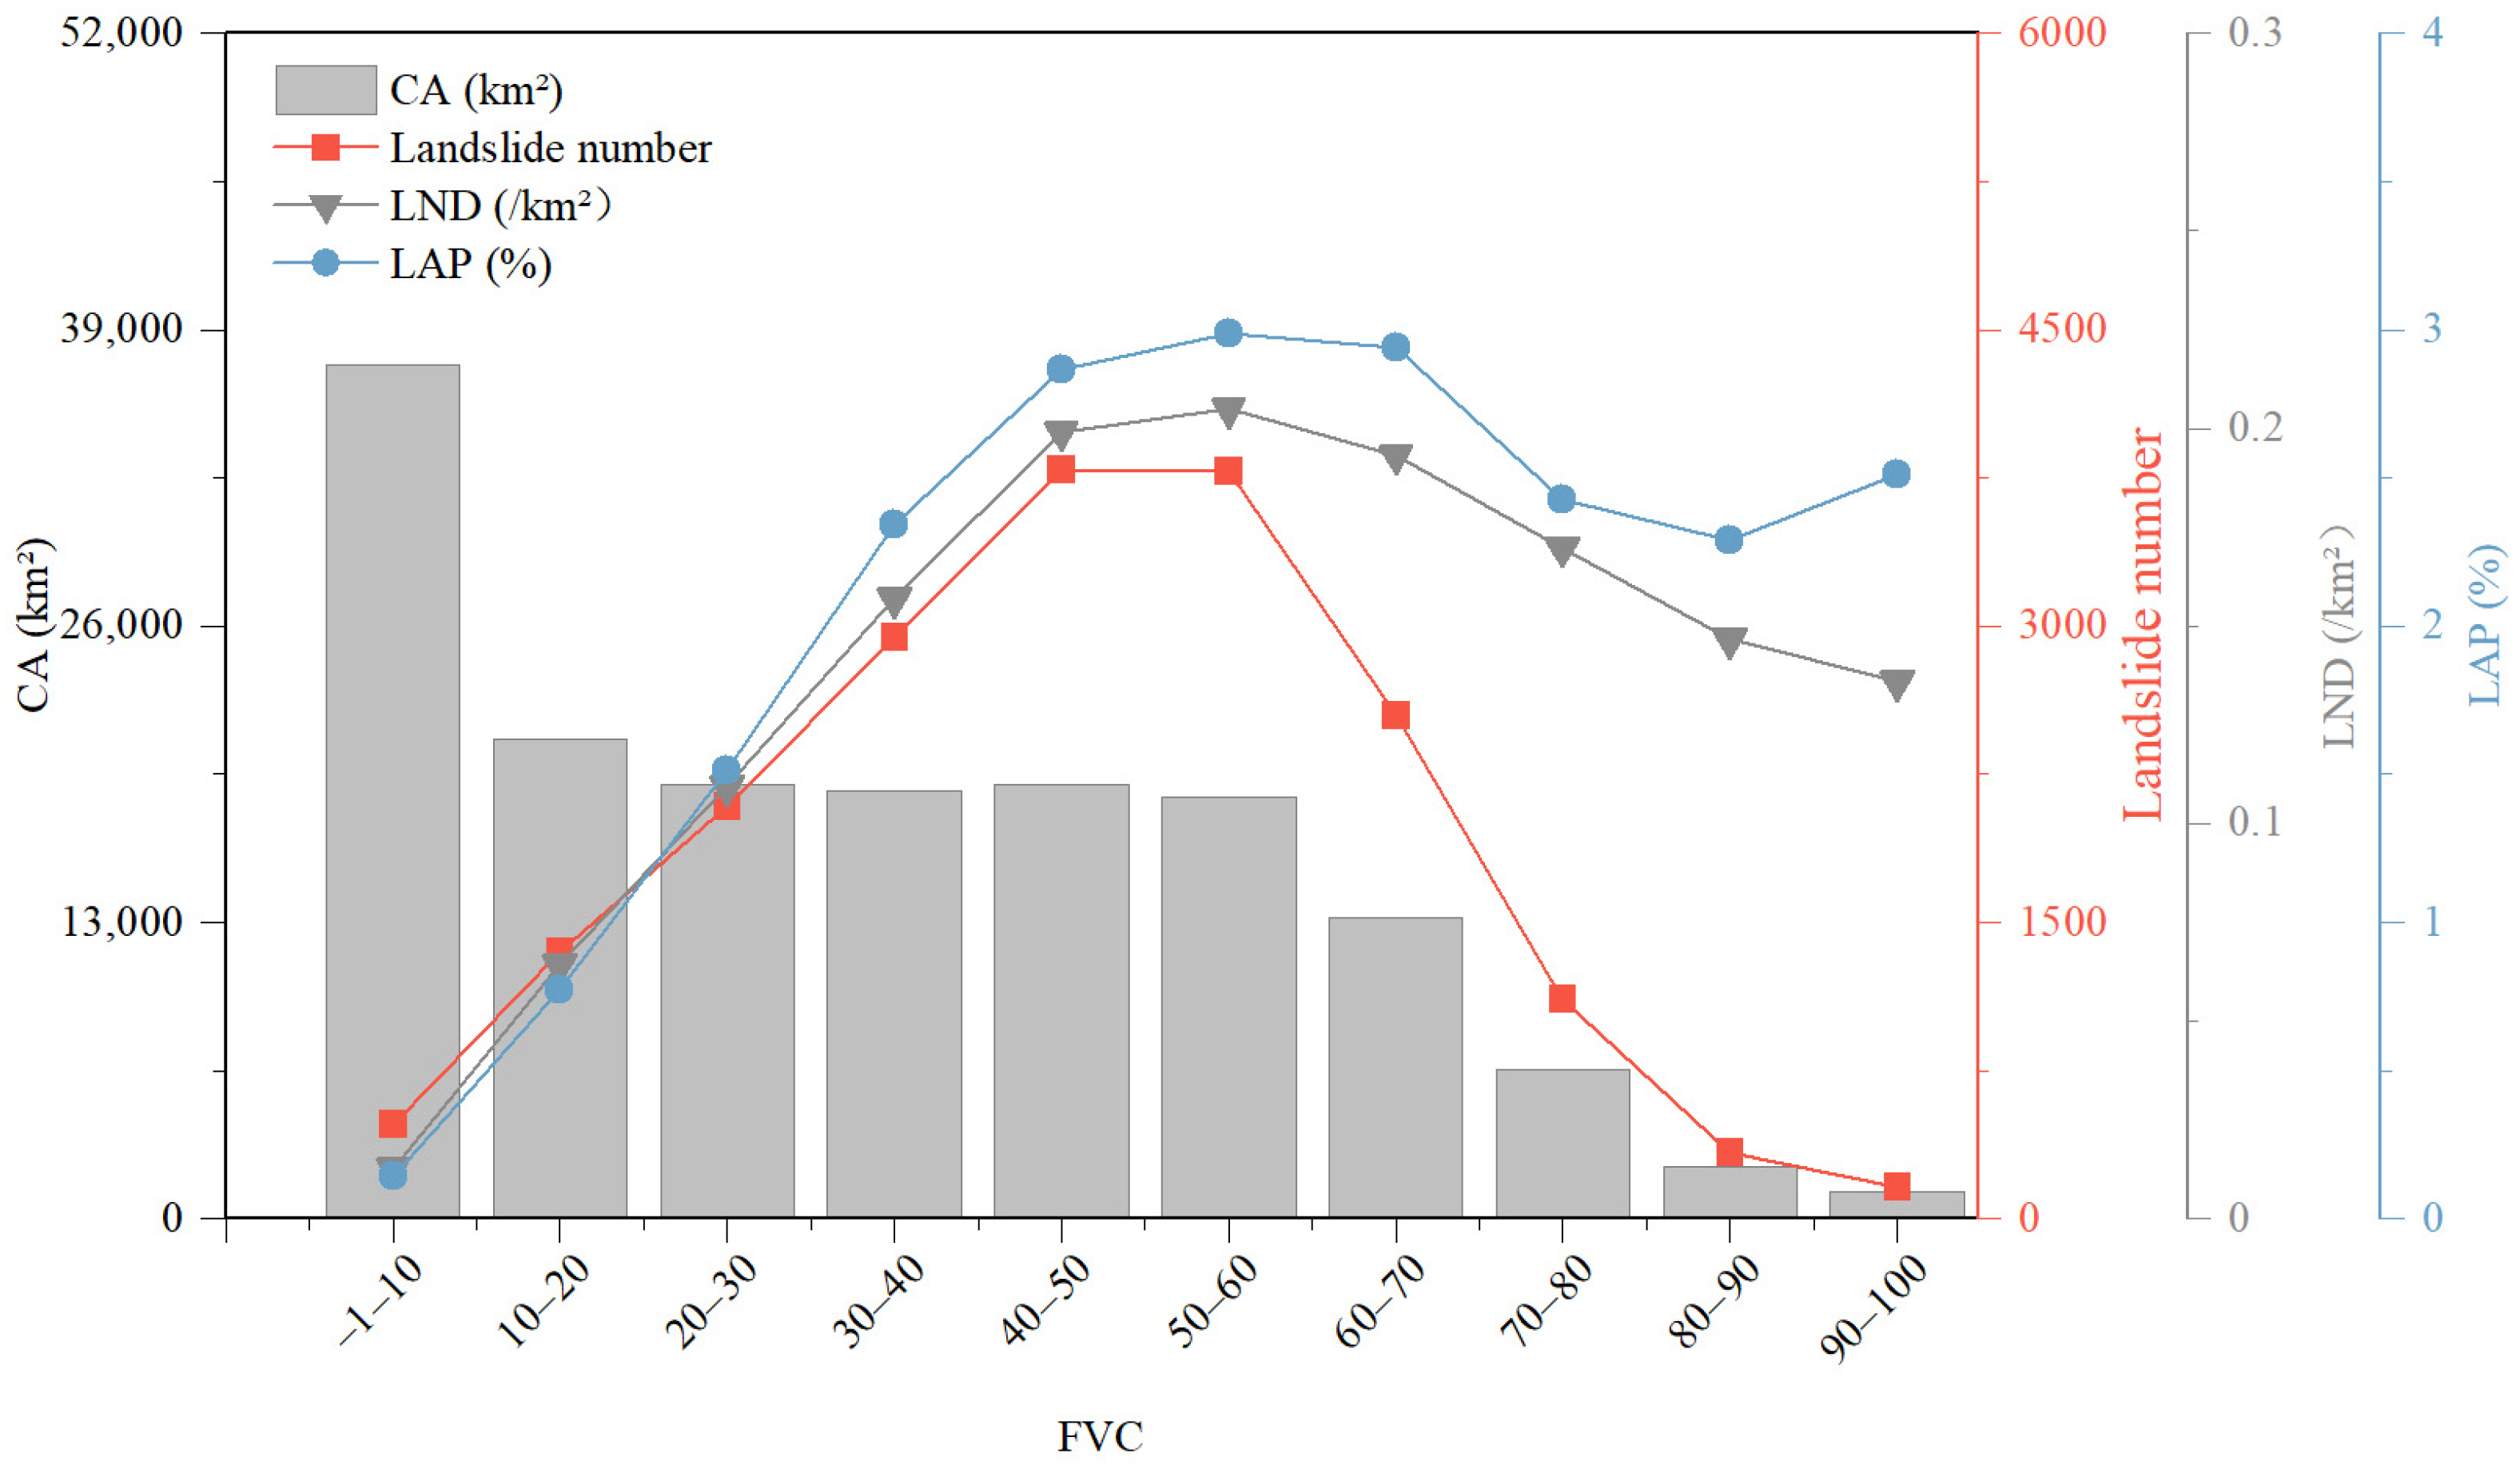
Figure 17 illustrates the relationship between FVC and landslides in the study area. As shown in Figure 3k, areas with high vegetation cover are primarily distributed in the western and eastern mountainous regions, whereas the central plain exhibits relatively low levels of vegetation cover. In areas with FVC < 90, the trends of landslide number, LND, and LAP are generally consistent, initially increasing and then decreasing with increasing vegetation coverage. The landslide count reaches its peak and secondary peak within the 40–60 FVC interval, with 7574 occurrences, accounting for 40.72% of the total. LND and LAP reached the peak in 50–60, indicating a high susceptibility to landslides within this range. As shown in Figure 3, areas with low vegetation or sparse forest cover are mostly located in the central plain region, where landslide risk is extremely low. Conversely, areas with high vegetation coverage have dense forest vegetation and well-developed root systems that stabilize the soil. Consequently, landslides occur less frequently in these regions.
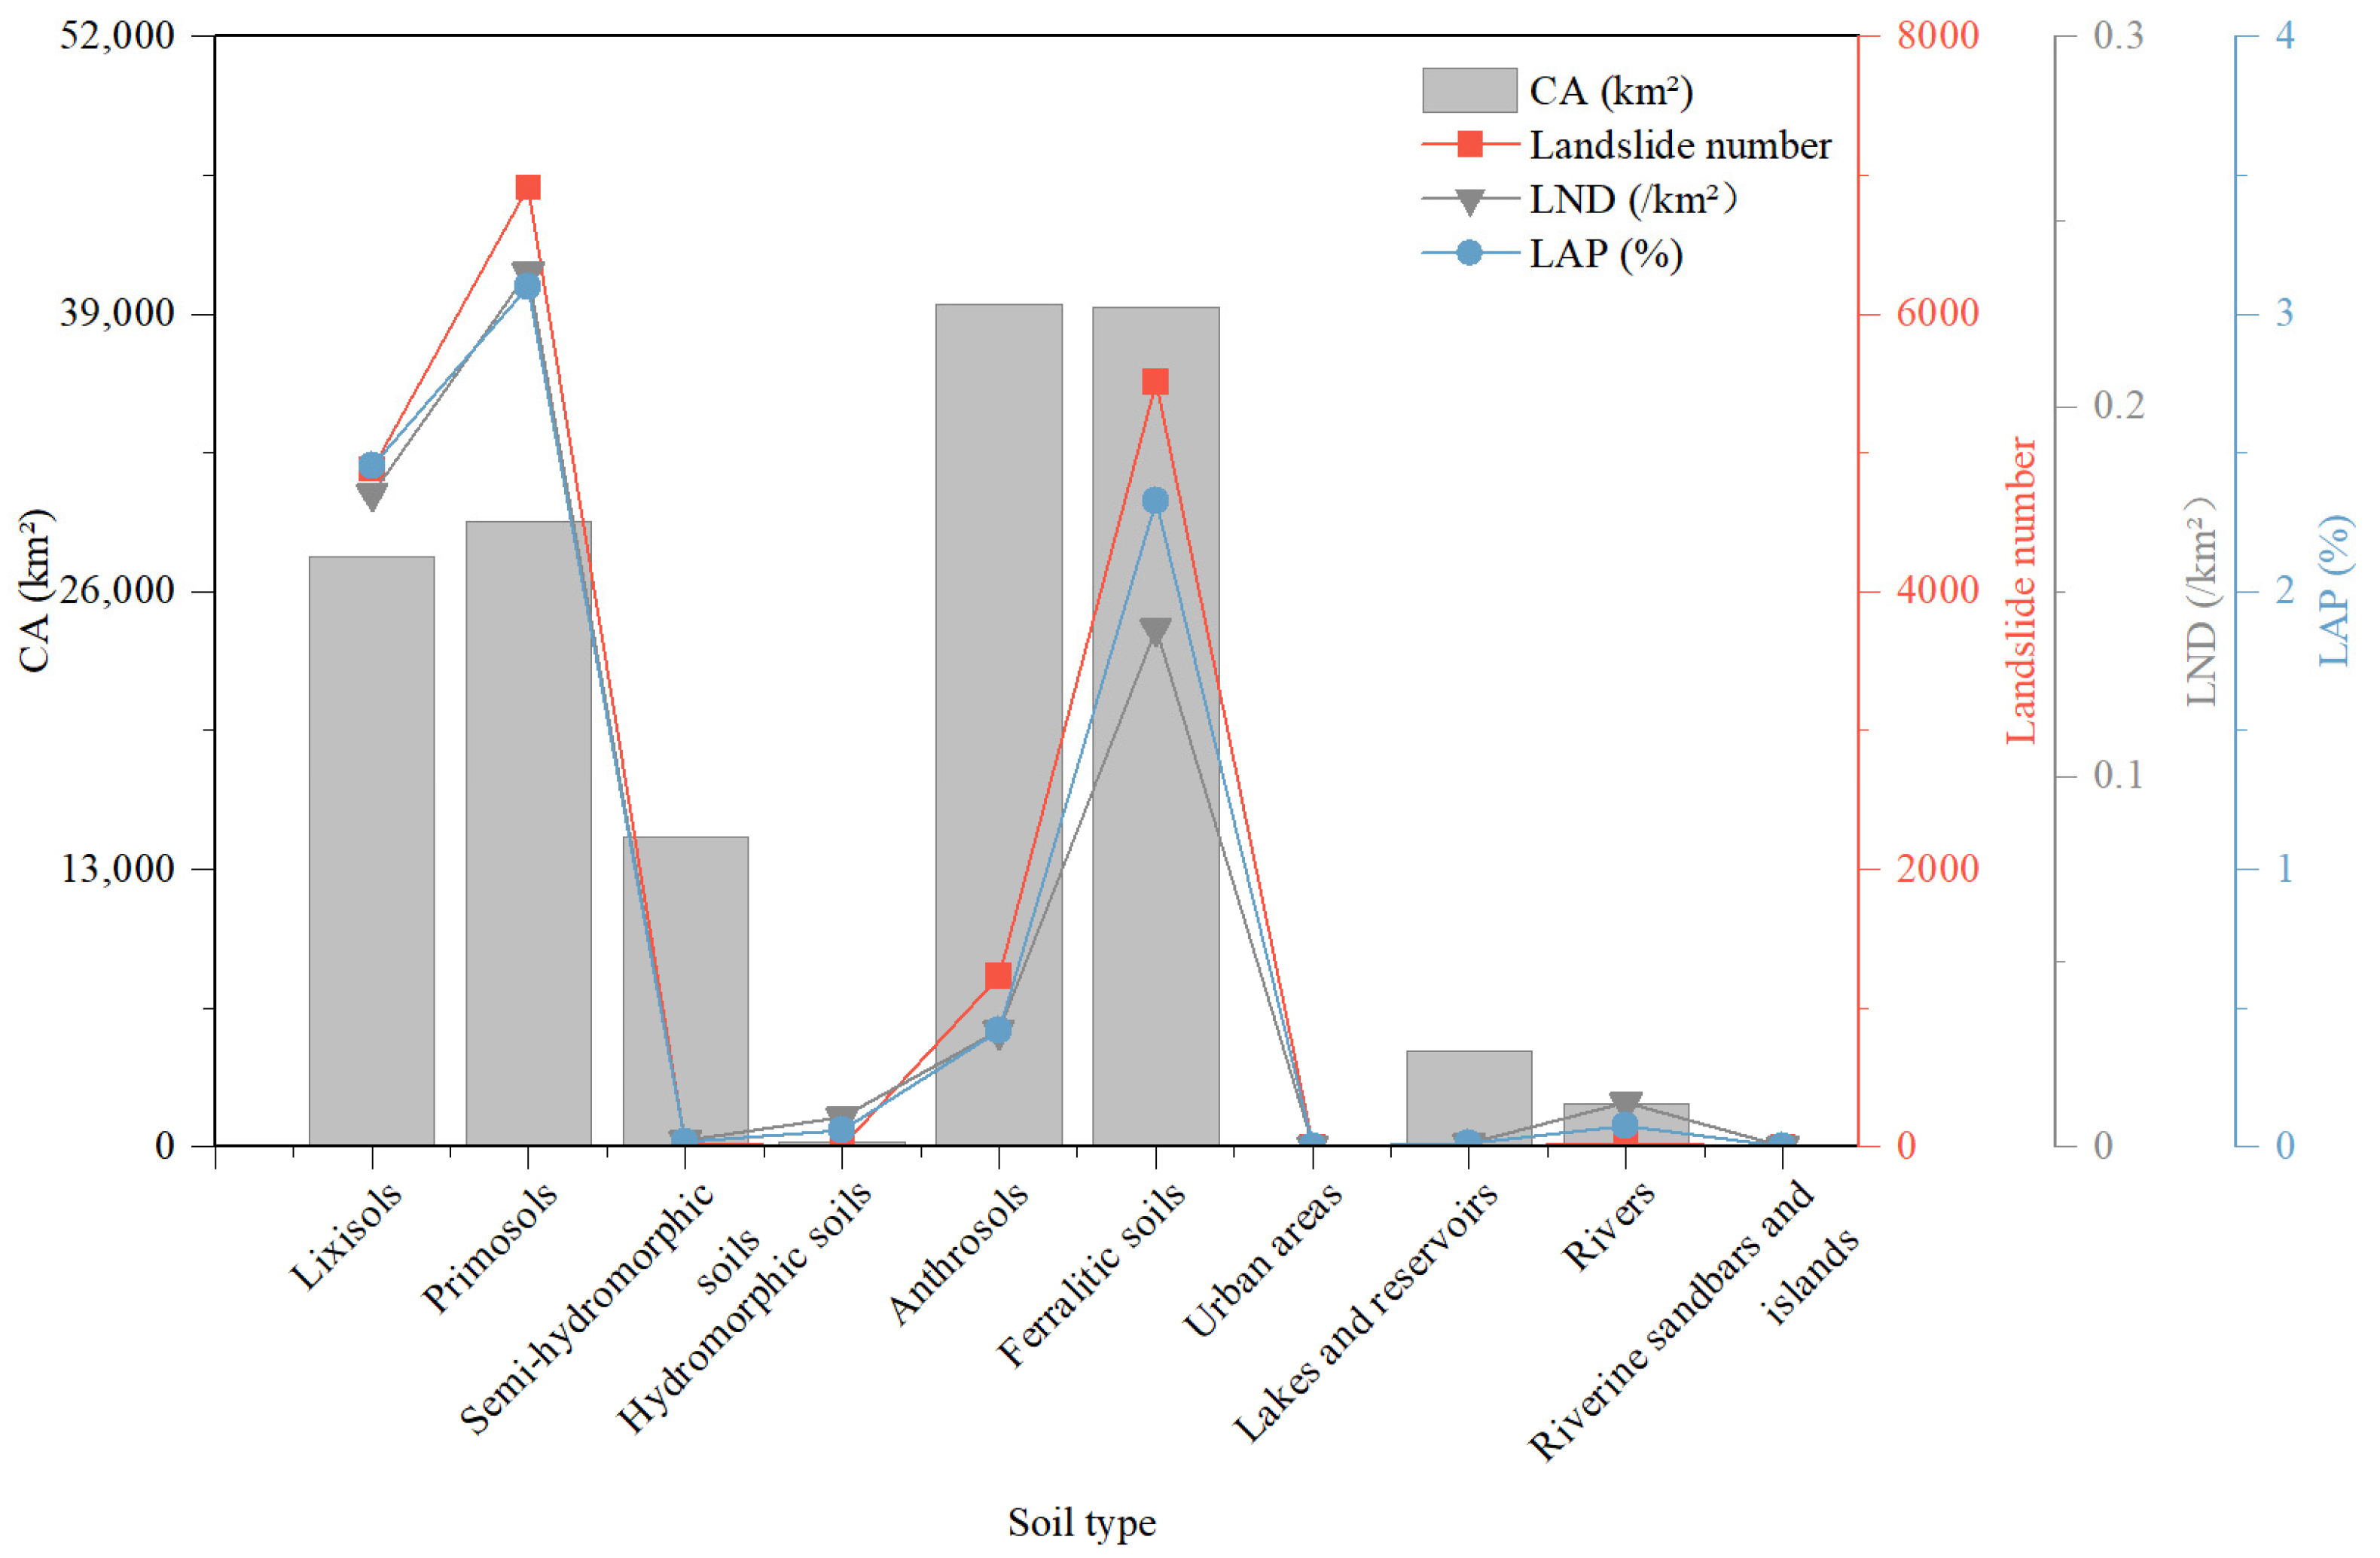
Figure 18 illustrates the relationship between soil type and landslides in the study area. As shown in Figure 3l, the soil types in the study area include 10 types: lixisols, primosols, semi-hydromorphic soils, hydromorphic soils, anthrosols, ferralitic soils, urban areas, lakes and reservoirs, rivers, riverine sandbars, and islands. Lixisols, ferralitic soils, and primosols are widely distributed throughout the eastern and western parts of the study area, while the central region is primarily characterized by semi-hydromorphic soils and anthrosols. The trends of landslide number, LND, and LAP are highly consistent, showing a significant positive correlation, with peaks occurring in areas dominated by lixisols and ferrallitic soils. This is because these soil types are generally distributed in hilly and low-mountain regions, where the parent material is highly weathered, soil structure is loose, and shear strength is low, making slopes more prone to instability under heavy rainfall. Additionally, these areas exhibit considerable terrain relief and steep slopes, providing favorable topographic conditions for landslide occurrence. In contrast, hydromorphic soils, anthrosols and urban areas are mostly located in valley plains or developed land, where terrain is relatively flat and soil–rock structures are stable, resulting in significantly lower landslide frequency and density.
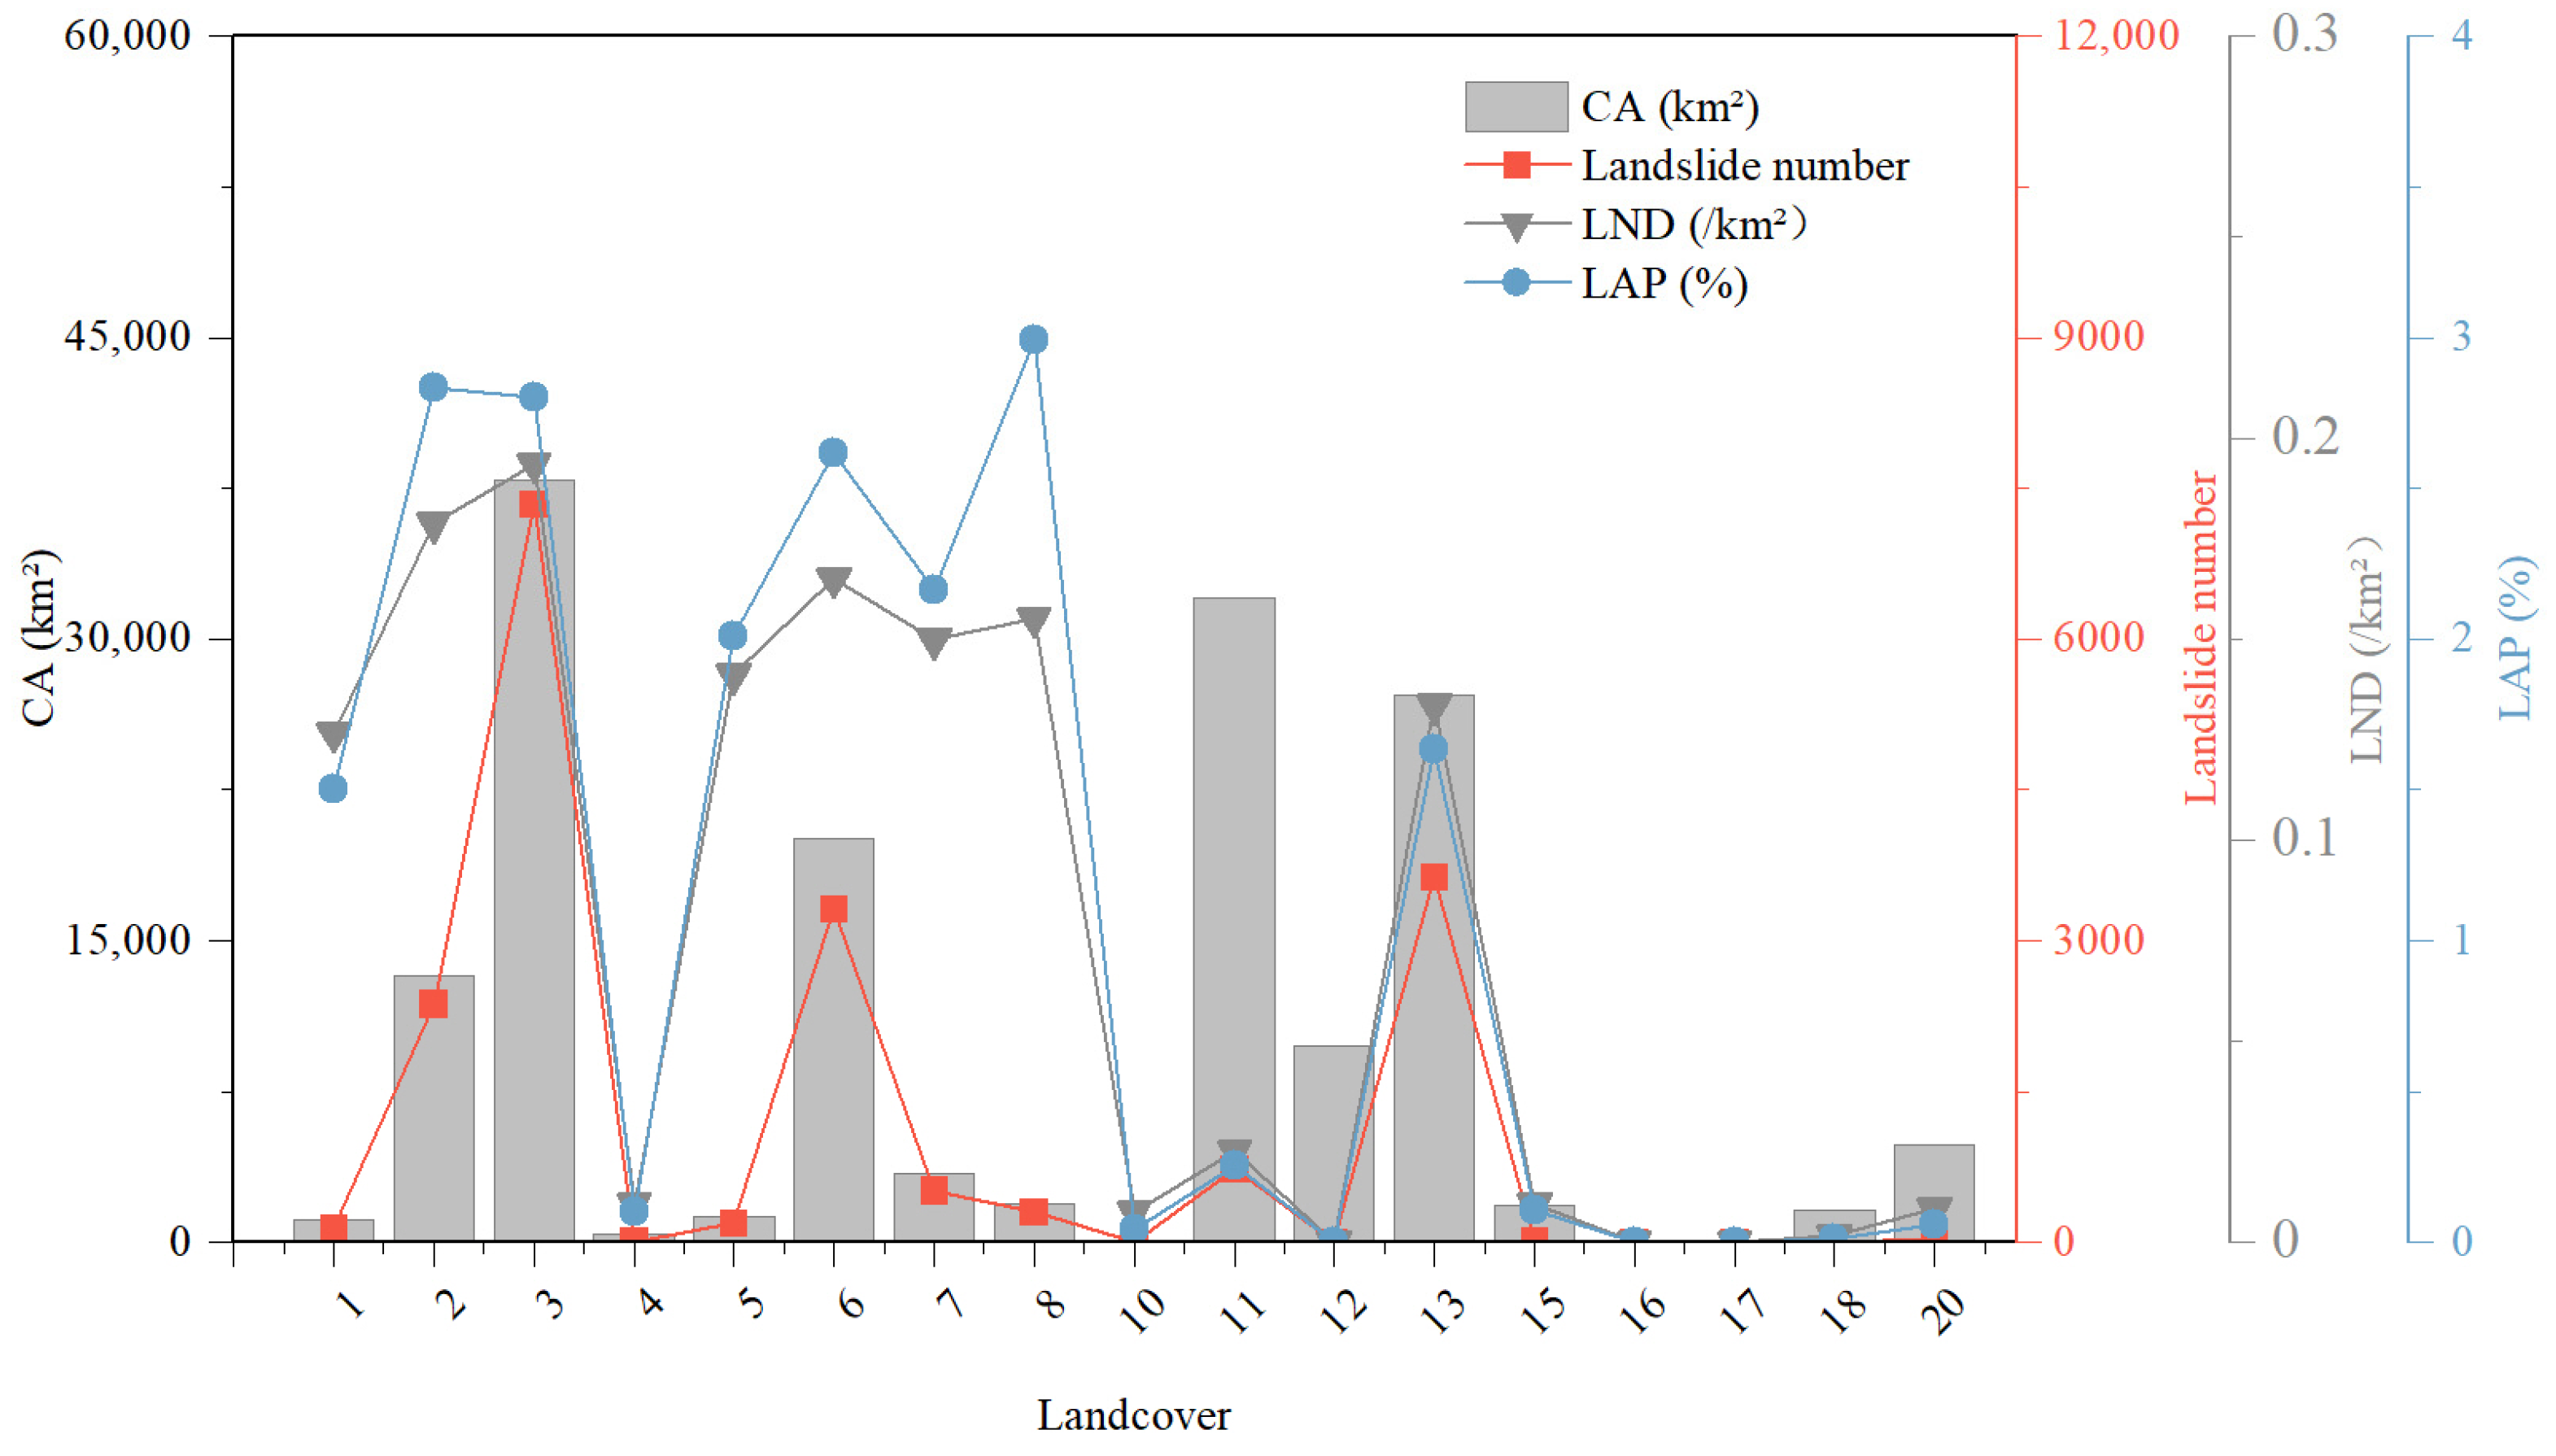
Figure 19 illustrates the relationship between land cover and landslides in the study area. As shown in Figure 3m, the western and eastern parts of the study area are primarily covered by evergreen coniferous forest and sparse forest, interspersed with grassland and areas of exposed consolidated rock, indicating a relatively fragile ecological environment. The central part is the main region for human activities and socioeconomic development, characterized predominantly by paddy fields, urban areas, and farmland. Landslides are mainly distributed within needleleaf evergreen forests and tree openings, with a total of 10,653 occurrences, accounting for 57.28% of all landslides. The maximum LND value of 0.19 km−2 is observed within the needleleaf evergreen forest areas. Notably, although the number of landslides in herbaceous areas is relatively low, LAP reaches its highest value of 2.99%. This is not only due to the small spatial extent of herbaceous plants in the study area but also reflects the loose soil structure and weak soil-stabilizing capacity of vegetation in these areas, making slopes more prone to instability under rainfall or external disturbances. Overall, landslides show higher concentrations in evergreen coniferous forests and sparse forest areas, while they are relatively scarce in cropland, water bodies, and urban areas.
Overall, the spatial pattern of landslides results from the integrated influence of various environmental factors, with topography, lithology, and mean annual rainfall exerting the most pronounced effects. The interactions and coupling among these factors across different parts of the region jointly determine the spatial configuration of landslides in the study area.

5. Discussion

5.1. Reliability of the Method

The Google Earth platform is a multidisciplinary tool that offers significant advantages for regional geological hazard identification, owing to its sub-meter high-resolution historical imagery, three-dimensional terrain visualization capabilities, and KML data management functions [42,43]. By providing freely accessible and globally consistent high-resolution satellite data alongside diverse geospatial information [44], the platform significantly reduces both technical and economic barriers, enabling researchers to conduct related studies quickly, accurately, and efficiently.
Specifically, sub-meter resolution optical imagery can clearly reveal microtopographic features of landslides, such as scarps, tension cracks, and transverse ridges, enabling precise delineation of landslide boundaries. Meanwhile, the integrated terrain data and three-dimensional visualization capabilities of the platform allow researchers to examine topographic relief and slope variations from multiple perspectives, facilitating the assessment of landslide bodies and their stability and reducing the uncertainty associated with interpretation from a single plane image. Moreover, the historical imagery archive enables researchers to access long-term remote sensing data of the region without conducting large-scale field surveys, which is particularly advantageous in mountainous areas with complex terrain and inconvenient transportation.
Although the Google Earth platform offers significant advantages for landslide identification, to ensure the completeness and reliability of the constructed landslide inventory, this study cross-validated the results using multiple data sources. Many researchers have conducted detailed investigations and analyses of multiple representative landslides within the study area by combining remote sensing imagery, field surveys, and numerical simulations, such as the Xiaonanhai landslide [45,46,47], Wangdahai landslide, and Zhangshangjie landslide [48]. Based on these efforts, this study integrated existing research results, high-resolution remote sensing imagery, and historical activity records to review and refine the preliminarily identified landslide boundaries. Through cross-validation, the completeness and reliability of the landslide inventory were enhanced, providing a robust data foundation for risk prevention and management along the transmission line.

5.2. Completeness of the Landslide Inventory

Landslide inventory is the basis for analyzing the spatial distribution of landslides in the region [49]. A comprehensive and detailed inventory is particularly crucial for subsequent landslide susceptibility assessments, early warning, and related applications [50,51,52,53]. Moreover, a high-quality landslide inventory holds significant practical value for regional planning, engineering construction, and disaster prevention. For linear infrastructure that spans multiple regions, such as railways and UHV transmission lines, the inventory not only provides a basis for route planning and site selection but also serves as an important reference for subsequent operation and maintenance.
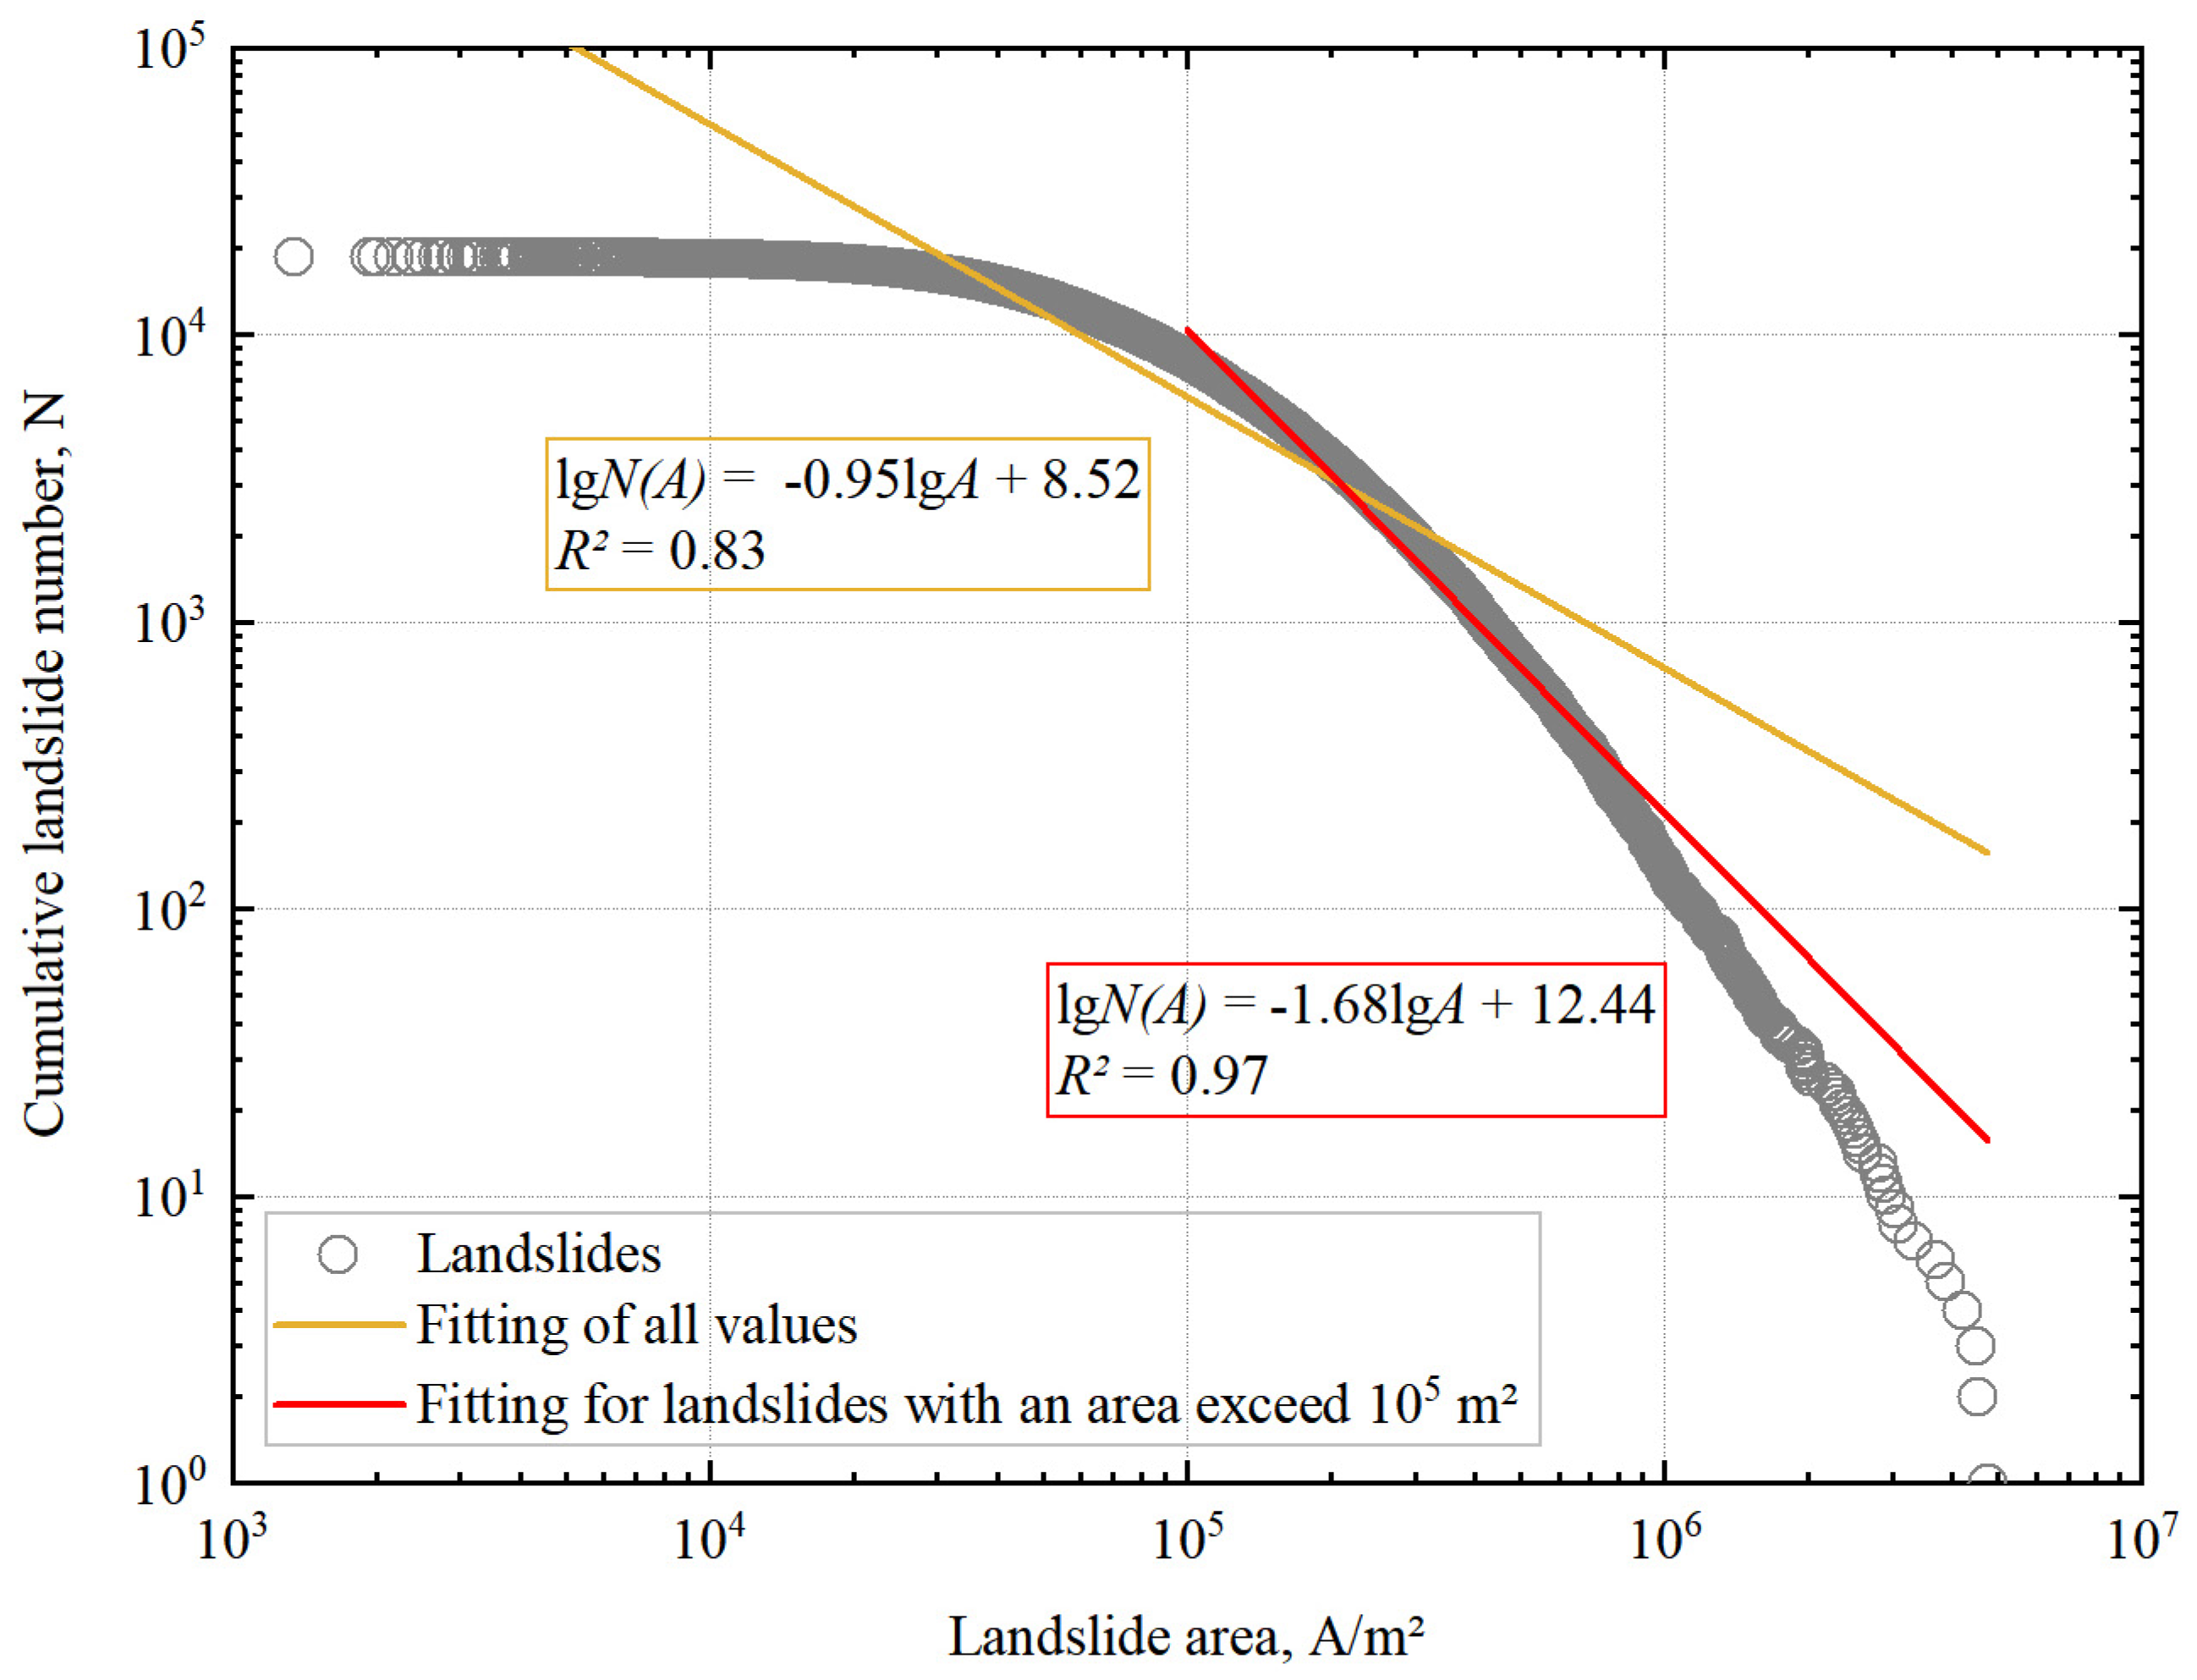
Based on this, we fit all the identified landslides (Figure 20), and the fitting formula is lgN(A) = −0.95lgA + 8.52, R2 = 0.83, where A represents the landslide area and N(A) denotes the number of landslides with an area greater than A. For landslides larger than 105 m2, the fitting equation is lgN(A) = −1.68lgA + 12.44. The curve generally follows a power-law distribution, R2 = 0.97, indicating that the fitting degree is good. In previous studies, this equation has been frequently used to evaluate the completeness of landslide inventories and has been validated across different regions. For example, in the almost complete inventory of seismic landslides established by Xu et al. [12], the landslides within a certain area satisfy the equation lgN(A) = −2.0745lgA + 13; Guzzetti et al. reported a similar power-law relationship in their statistical analysis of landslides in central Italy [54]; Van Den Eeckhaut et al. observed a comparable trend in landslide distributions within densely populated hilly regions [55]. These previous findings provide supporting evidence for the completeness of the landslide inventory constructed in this study.

5.3. Findings

Recent studies have focused on landslide hazards along transmission line corridors [1,56,57,58]. The associated findings primarily center on susceptibility assessment, quantitative risk evaluation, and hazard modeling under specific scenarios (e.g., rainfall). These studies are of significant importance for understanding landslide threats and ensuring the safety of power infrastructure. However, high-precision risk assessment and model construction critically depend on detailed and reliable landslide inventory data. By establishing a landslide traces inventory along the Hubei section of the Jinsha River–Hubei UHV transmission line, this study revealed the spatial relationship between landslides and factors such as topography, rainfall, lithology, and vegetation, thereby providing more targeted scientific evidence to support disaster prevention and mitigation along transmission corridors. For instance, the high-density landslide zone identified in the western region should be prioritized by power departments for line maintenance, intensified inspection, and the deployment of automated monitoring and early warning systems. These measures are crucial to prevent damage to transmission tower foundations and ensure the stable operation of the power grid.
The results indicate that landslide occurrence in the study area is primarily influenced by factors such as topography, lithology, precipitation, and land cover. Due to the large spatial extent and strong heterogeneity of the study area, factors like faults, rivers, and PGA did not exhibit significant correlations at the overall scale. Nevertheless, landslide formation remains the result of the coupling effect of multiple factors. In the western and eastern mountainous regions, where topographic relief is high, the dominant vegetation types are shallow-rooted coniferous forests and sparse vegetation. These areas also coincide with zones of concentrated rainfall. Under the combined action of heavy rainfall and high topographic relief, soils are subjected to water erosion and root exposure, while forest structure is altered [59,60], reducing slope stability and increasing the susceptibility to landslides. In contrast, the central plain is characterized by low-relief, gently undulating terrain. Although this region exhibits relatively dense river networks and faults and higher PGA values (Figure 3), landslides have not developed due to the absence of favorable topographic conditions.
In summary, the distribution of landslides in the study area exhibits pronounced spatial heterogeneity, and their occurrence reflects the combined influence of multiple natural and environmental factors.

5.4. Prospects

In this study, a landslide inventory was constructed for the Hubei section of the Jinsha River–Hubei UHV transmission line. By integrating multiple factors such as topography, geomorphology and geology, the spatial distribution of landslides was revealed. Future research can be further advanced on the basis of the database and analyses developed in this study in the following aspects: (1) incorporating numerical simulation methods to investigate the dynamics and triggering mechanisms of landslides, thereby deepening the understanding of their physical processes; (2) applying machine learning or deep learning approaches to establish susceptibility and risk prediction models, evaluate the potential impacts of landslides on the operational safety of transmission lines, and identify critical risk-prone sections, thus providing references for line operation, maintenance, and disaster prevention; and (3) integrating advanced remote sensing monitoring techniques, such as time-series InSAR, to conduct continuous deformation monitoring and dynamic updates in key hazard-prone areas, facilitating localized and detailed analysis and research.

6. Conclusions

Based on the Google Earth platform, this study compiled a landslide inventory for the Hubei section of the Jinsha River–Hubei ±800 kV UHV transmission line. The results reveal that the study area contains 18,598 landslides with a total area of 2671.82 km2, ranging in size from 1346.66 m2 to 4.76 km2. Spatially, the landslides exhibit an uneven distribution, characterized by a “denser in the west and sparser in the east” pattern. A comparison of the cumulative number–area distribution of landslides with previous studies confirms the completeness and reliability of the inventory. The landslides are predominantly distributed in areas with elevations of 278–1059 m, slopes of 10–30°, and relief of 200–600, predominantly on west-, northwest-, and southeast-facing slopes. Geologically, landslides occur mainly in Triassic and Jurassic strata. Areas with annual rainfall between 1200 and 1500 mm exhibit a higher frequency of landslide occurrence. Landslides are also concentrated in areas with TWI values of 3–9 and FVC values of 40–60. The dominant land cover types in landslide-susceptible areas are evergreen coniferous forest and sparse forest, and the predominant soil types are lixisols and ferrallitic soils.
Overall, landslide occurrence is controlled by the coupling of multiple factors, resulting in significant spatial heterogeneity. Topography, lithology, precipitation, soil type, and land use type are the primary influencing factors. In contrast, factors such as faults, rivers, and high-PGA zones—which are predominantly concentrated in the central plains—showed no statistically significant correlation with landslide spatial distribution at the regional scale. This study systematically elucidates the development and spatial patterns of landslides in the region, providing a scientific basis for transmission line planning, maintenance, and landslide risk mitigation.

Author Contributions

Conceptualization, W.Y. and C.X.; methodology, W.Y. and C.X.; software, W.Y. and C.X.; validation, W.Y. and C.X.; formal analysis, W.Y.; investigation, W.Y.; resources, W.Y. and C.X.; data curation, T.L., J.S., L.L., L.F., P.W., J.C. and Z.X.; writing—original draft preparation, W.Y.; writing—review and editing, W.Y., C.X. and T.L.; visualization, W.Y.; supervision, C.X.; project administration, C.X.; funding acquisition, C.X. All authors have read and agreed to the published version of the manuscript.

Funding

This study was supported by the National Institute of Natural Hazards, Ministry of Emergency Management of China (ZDJ2025-54).

Data Availability Statement

The datasets used and/or analyzed during the current study are available from the corresponding author on reasonable request.

Acknowledgments

The global land cover data used in this study were provided by the Global Land Cover by National Mapping Organizations (GLCNMO) dataset. We greatly appreciate this valuable dataset.

Conflicts of Interest

Author Peng Wang was employed by the Power China Beijing Engineering Corporation Limited. The remaining authors declare that the research was conducted in the absence of any commercial or financial relationships that could be construed as a potential conflict of interest.

References

  1. Huang, C.; Yin, K.; Liang, X.; Gui, L.; Zhao, B.; Liu, Y. Study of direct and indirect risk assessment of landslide impacts on ultrahigh-voltage electricity transmission lines. Sci. Rep. 2024, 14, 25719. [Google Scholar] [CrossRef] [PubMed]
  2. Zhang, Y.; Yu, Y.; Ma, T. System optimization of long-distance energy transportation in China using ultra-high-voltage power transmission. J. Renew. Sustain. Energy 2018, 10, 045503. [Google Scholar] [CrossRef]
  3. Wang, S.; Zhuang, J.; Zheng, J.; Mu, J.; Wang, Y.; Fu, Y. Landslide susceptibility evaluation based on deep learning along Kangding-Litang section of CZ railway. J. Eng. Geol. 2022, 30, 908–919. [Google Scholar]
  4. Korup, O.; Densmore, A.L.; Schlunegger, F. The role of landslides in mountain range evolution. Geomorphology 2010, 120, 77–90. [Google Scholar] [CrossRef]
  5. Petley, D. Global patterns of loss of life from landslides. Geology 2012, 40, 927–930. [Google Scholar] [CrossRef]
  6. Yu, Q.; Guo, Y.; Bao, T.; Liu, Q.; Liu, F. Landslide Hazard to Transmission Line and Its Prevention and Treatment Measures. Sichuan Electr. Power Technol. 2023, 46, 6–11. [Google Scholar]
  7. Pennington, C.; Freeborough, K.; Dashwood, C.; Dijkstra, T.; Lawrie, K. The National Landslide Database of Great Britain: Acquisition, communication and the role of social media. Geomorphology 2015, 249, 44–51. [Google Scholar] [CrossRef]
  8. Hader, P.R.P.; Horta, I.T.L.G.; da Silva do Valle, V.A.; Irigaray, C. Hydro-Meteorological Landslide Inventory for Sustainable Urban Management in a Coastal Region of Brazil. Sustainability 2025, 17, 7487. [Google Scholar] [CrossRef]
  9. Othman, A.A.; Gloaguen, R. Automatic extraction and size distribution of landslides in Kurdistan region, NE Iraq. Remote Sens. 2013, 5, 2389–2410. [Google Scholar] [CrossRef]
  10. Delgado, F.; Zerathe, S.; Schwartz, S.; Mathieux, B.; Benavente, C. Inventory of large landslides along the Central Western Andes (ca. 15–20 S): Landslide distribution patterns and insights on controlling factors. J. S. Am. Earth Sci. 2022, 116, 103824. [Google Scholar] [CrossRef]
  11. Gnyawali, K.R.; Adhikari, B.R. Spatial relations of earthquake induced landslides triggered by 2015 Gorkha earthquake Mw = 7.8. In Proceedings of the Workshop on World Landslide Forum, Ljubljana, Slovenia, 29 May–2 June 2017; Springer: Berlin/Heidelberg, Germany, 2017; pp. 85–93. [Google Scholar]
  12. Xu, C.; Xu, X.; Yao, X.; Dai, F. Three (nearly) complete inventories of landslides triggered by the May 12, 2008 Wenchuan Mw 7.9 earthquake of China and their spatial distribution statistical analysis. Landslides 2014, 11, 441–461. [Google Scholar] [CrossRef]
  13. Lan, H.; Zhou, C.; Wang, L.; Zhang, H.; Li, R. Landslide hazard spatial analysis and prediction using GIS in the Xiaojiang watershed, Yunnan, China. Eng. Geol. 2004, 76, 109–128. [Google Scholar] [CrossRef]
  14. Shao, X.; Xu, C.; Li, L.; Yang, Z.; Yao, X.; Shao, B.; Liang, C.; Xue, Z.; Xu, X. Spatial analysis and hazard assessment of Large-scale ancient landslides around the reservoir area of Wudongde Hydropower Station, China. Nat. Hazards 2024, 120, 87–105. [Google Scholar] [CrossRef]
  15. Wang, H.; Tan, R.; Wang, X. Investigation of Geological Disasters for Safe Operation of Hubei Power Grid. J. Green Sci. Technol. 2014, 2, 220–222. [Google Scholar]
  16. Guzzetti, F.; Mondini, A.C.; Cardinali, M.; Fiorucci, F.; Santangelo, M.; Chang, K.-T. Landslide inventory maps: New tools for an old problem. Earth-Sci. Rev. 2012, 112, 42–66. [Google Scholar] [CrossRef]
  17. Brabb, E.E.; Harrod, B.L. Landslides: Extent and economic significance. In Proceedings of the 28th International Geological Congress: Symposium on Land Slides, Washington, DC, USA, 17 July 1989. [Google Scholar]
  18. Fan, X.; Scaringi, G.; Korup, O.; West, A.J.; van Westen, C.J.; Tanyas, H.; Hovius, N.; Hales, T.C.; Jibson, R.W.; Allstadt, K.E. Earthquake-induced chains of geologic hazards: Patterns, mechanisms, and impacts. Rev. Geophys. 2019, 57, 421–503. [Google Scholar] [CrossRef]
  19. Damm, B.; Klose, M. The landslide database for Germany: Closing the gap at national level. Geomorphology 2015, 249, 82–93. [Google Scholar] [CrossRef]
  20. Lainas, S.; Sabatakakis, N.; Koukis, G. Rainfall thresholds for possible landslide initiation in wildfire-affected areas of western Greece. Bull. Eng. Geol. Environ. 2016, 75, 883–896. [Google Scholar] [CrossRef]
  21. Borgatti, L.; Soldati, M. Landslides as a geomorphological proxy for climate change: A record from the Dolomites (northern Italy). Geomorphology 2010, 120, 56–64. [Google Scholar] [CrossRef]
  22. Du, J.; Glade, T.; Woldai, T.; Chai, B.; Zeng, B. Landslide susceptibility assessment based on an incomplete landslide inventory in the Jilong Valley, Tibet, Chinese Himalayas. Eng. Geol. 2020, 270, 105572. [Google Scholar] [CrossRef]
  23. Keefer, D.K. Investigating landslides caused by earthquakes—A historical review. Surv. Geophys. 2002, 23, 473–510. [Google Scholar] [CrossRef]
  24. Peng, D.; Xu, Q.; Qi, X.; Fan, X.; Dong, X.; Li, S.; Ju, Y. Study on early recognition of loess landslides based on field investigation. Inttern. J. Geohazards Environ. 2016, 2, 35–52. [Google Scholar] [CrossRef]
  25. Santangelo, á.; Cardinali, á.; Rossi, á.; Mondini, A.; Guzzetti, F. Remote landslide mapping using a laser rangefinder binocular and GPS. Nat. Hazards Earth Syst. Sci. 2010, 10, 2539–2546. [Google Scholar] [CrossRef]
  26. Martha, T.R.; van Westen, C.J.; Kerle, N.; Jetten, V.; Kumar, K.V. Landslide hazard and risk assessment using semi-automatically created landslide inventories. Geomorphology 2013, 184, 139–150. [Google Scholar] [CrossRef]
  27. Lei, T.; Zhang, Y.; Lv, Z.; Li, S.; Liu, S.; Nandi, A.K. Landslide inventory mapping from bitemporal images using deep convolutional neural networks. IEEE Geosci. Remote Sens. Lett. 2019, 16, 982–986. [Google Scholar] [CrossRef]
  28. Pham, T.M.; Do, N.; Pham, H.T.; Bui, H.T.; Do, T.T.; Hoang, M.V. CResU-Net: A method for landslide mapping using deep learning. Mach. Learn. Sci. Technol. 2024, 5, 035008. [Google Scholar] [CrossRef]
  29. Milledge, D.G.; Bellugi, D.G.; Watt, J.; Densmore, A.L. Automated determination of landslide locations after large trigger events: Advantages and disadvantages compared to manual mapping. Nat. Hazards Earth Syst. Sci. 2022, 22, 481–508. [Google Scholar] [CrossRef]
  30. Zhang, Z.; Zeng, R.; Meng, X.; Zhao, S.; Meng, X.; Yao, Y.; Wang, H.; Guo, W.; Chen, G.; Zhang, Y. Estimating landslide sliding distance based on an improved Heim sled model. Catena 2021, 204, 105401. [Google Scholar] [CrossRef]
  31. Guerriero, L.; Prinzi, E.P.; Calcaterra, D.; Ciarcia, S.; Di Martire, D.; Guadagno, F.M.; Ruzza, G.; Revellino, P. Kinematics and geologic control of the deep-seated landslide affecting the historic center of Buonalbergo, southern Italy. Geomorphology 2021, 394, 107961. [Google Scholar] [CrossRef]
  32. Ding, H.; Zhang, M.; Li, L. Interpreting landslides in the northwestern loess plateau using remote sensing images. Quat. Sci. 2011, 31, 1077–1085. [Google Scholar]
  33. Sato, H.; Harp, E. Interpretation of earthquake-induced landslides triggered by the 12 May 2008, M7.9 Wenchuan earthquake in the Beichuan area, Sichuan Province, China using satellite imagery and Google Earth. Landslides 2009, 6, 153–159. [Google Scholar] [CrossRef]
  34. Causes, L. Landslide Types and Processes; US Geological Survey: Reston, VA, USA, 2001.
  35. Xu, X.; Han, Z.; Yang, X.; Zhang, S.; Yu, G.; Zhou, B.; Li, F.; Ma, B.; Chen, G.; Ran, Y. Seismotectonic Map in China and Its Adjacent Regions; Seismological Press: Beijing, China, 2016. [Google Scholar]
  36. Wu, X.; Xu, X.; Yu, G.; Ren, J.; Yang, X.; Chen, G.; Xu, C.; Du, K.; Huang, X.; Yang, H. The China Active Faults Database (CAFD) and its web system. Earth Syst. Sci. Data 2024, 16, 3391–3417. [Google Scholar] [CrossRef]
  37. Tateishi, R.; Uriyangqai, B.; Al-Bilbisi, H.; Ghar, M.A.; Tsend-Ayush, J.; Kobayashi, T.; Kasimu, A.; Hoan, N.T.; Shalaby, A.; Alsaaideh, B. Production of global land cover data—GLCNMO. Int. J. Digit. Earth 2011, 4, 22–49. [Google Scholar] [CrossRef]
  38. Xu, C.; Xu, X.; Zhou, B.; Shen, L. Probability of coseismic landslides: A new generation of earthquake-triggered landslide hazard model. J. Eng. Geol. 2019, 27, 1122–1130. [Google Scholar]
  39. Tian, Y.; Xu, C.; Xu, X.; Chen, J. Detailed inventory mapping and spatial analyses to landslides induced by the 2013 Ms 6.6 Minxian earthquake of China. J. Earth Sci. 2016, 27, 1016–1026. [Google Scholar] [CrossRef]
  40. Liu, C.; Qi, S.; Tong, L.; An, G.; Li, X. Great landslides in Hmalaya mountain area and their occurrence with lithology. J. Eng. Geol. 2010, 18, 669–676. [Google Scholar]
  41. Iverson, R.M. Landslide triggering by rain infiltration. Water Resour. Res. 2000, 36, 1897–1910. [Google Scholar] [CrossRef]
  42. Zhao, Q.; Yu, L.; Li, X.; Peng, D.; Zhang, Y.; Gong, P. Progress and trends in the application of Google Earth and Google Earth Engine. Remote Sens. 2021, 13, 3778. [Google Scholar] [CrossRef]
  43. Zhu, L.; Kan, W.; Zhang, Y.; Sun, J. Visualizing the structure of the Earth’s lithosphere on the Google Earth virtual-globe platform. ISPRS Int. J. Geo-Inf. 2016, 5, 26. [Google Scholar] [CrossRef]
  44. Potere, D. Horizontal positional accuracy of Google Earth’s high-resolution imagery archive. Sensors 2008, 8, 7973–7981. [Google Scholar] [CrossRef]
  45. Shen, T.; Wang, Y.; Wu, L. Discrete element simulation analysis of formation mechanism of Xiaonanhai landslide in Chongqing city. Rock Soil Mech. 2014, 35, 667–675. [Google Scholar]
  46. Wang, J.; Li, Y.; Zhang, C. Dynamics Mechanism of Low-intensity Earthquake Triggered the Collapse of the Soft Rock: Xiao Nanhai Seismic Landslide in Chongqing of China as an Example. Mt. Res. 2016, 34, 200–207. [Google Scholar]
  47. Zhou, X.; Zhou, Q.; Gao, S.; Li, X. Restoration of the original topography of the Xiaonanhai landslide in Chongqing and calculation of its volume. Seismol. Geol. 2020, 42, 936–954. [Google Scholar]
  48. Zhou, X.; Zhou, Q.; Gao, S. Investigation to landslides triggered by the 1856 Qianjiang-Xianfeng (Daluba) earthquake and their generation mechanisms. Seismol. Geol. 2018, 40, 410–425. [Google Scholar]
  49. Chigira, M.; Wu, X.; Inokuchi, T.; Wang, G. Landslides induced by the 2008 Wenchuan earthquake, Sichuan, China. Geomorphology 2010, 118, 225–238. [Google Scholar] [CrossRef]
  50. Fan, W.; Wei, X.-S.; Cao, Y.-B.; Zheng, B. Landslide susceptibility assessment using the certainty factor and analytic hierarchy process. J. Mt. Sci. 2017, 14, 906–925. [Google Scholar] [CrossRef]
  51. Emberson, R.; Kirschbaum, D.B.; Amatya, P.; Tanyas, H.; Marc, O. Insights from the topographic characteristics of a large global catalog of rainfall-induced landslide event inventories. Nat. Hazards Earth Syst. Sci. 2022, 22, 1129–1149. [Google Scholar] [CrossRef]
  52. Malamud, B.D.; Turcotte, D.L.; Guzzetti, F.; Reichenbach, P. Landslide inventories and their statistical properties. Earth Surf. Process. Landf. 2004, 29, 687–711. [Google Scholar] [CrossRef]
  53. Guo, F.; Lai, P.; Huang, F.; Liu, L.; Wang, X.; He, Z. Literature review and research progress of landslide susceptibility mapping based on knowledge graph. Earth Sci. 2024, 49, 1584–1606. [Google Scholar]
  54. Guzzetti, F.; Malamud, B.D.; Turcotte, D.L.; Reichenbach, P. Power-law correlations of landslide areas in central Italy. Earth Planet. Sci. Lett. 2002, 195, 169–183. [Google Scholar] [CrossRef]
  55. Van Den Eeckhaut, M.; Poesen, J.; Govers, G.; Verstraeten, G.; Demoulin, A. Characteristics of the size distribution of recent and historical landslides in a populated hilly region. Earth Planet. Sci. Lett. 2007, 256, 588–603. [Google Scholar] [CrossRef]
  56. Liu, S.; Yin, K.; Zhou, C.; Gui, L.; Liang, X.; Lin, W.; Zhao, B. Susceptibility assessment for landslide initiated along power transmission lines. Remote Sens. 2021, 13, 5068. [Google Scholar] [CrossRef]
  57. Byron, E.; Nelson, P.A.; Mountain-Plains Consortium. Probabilistic Modeling of Landslide Hazards to Improve the Resilience of Transportation Infrastructure; Mountain-Plains Consortium: Fargo, ND, USA, 2023. [Google Scholar]
  58. Jin, B.; Zeng, T.; Liu, S.; Li, Y.; Gui, L.; Zhao, B.; Yin, K.; Catani, F.; Peduto, D. Quantitative risk assessment for rainfall-induced landslides of transmission line towers: The case of Chongqing National transmission protection regions. Int. J. Disaster Risk Reduct. 2025, 128, 105715. [Google Scholar] [CrossRef]
  59. de Toledo, J.J.; Magnusson, W.E.; Castilho, C.V.; Nascimento, H.E. Tree mode of death in Central Amazonia: Effects of soil and topography on tree mortality associated with storm disturbances. For. Ecol. Manag. 2012, 263, 253–261. [Google Scholar] [CrossRef]
  60. Cushman, K.; Detto, M.; García, M.; Muller-Landau, H.C. Soils and topography control natural disturbance rates and thereby forest structure in a lowland tropical landscape. Ecol. Lett. 2022, 25, 1126–1138. [Google Scholar] [CrossRef]
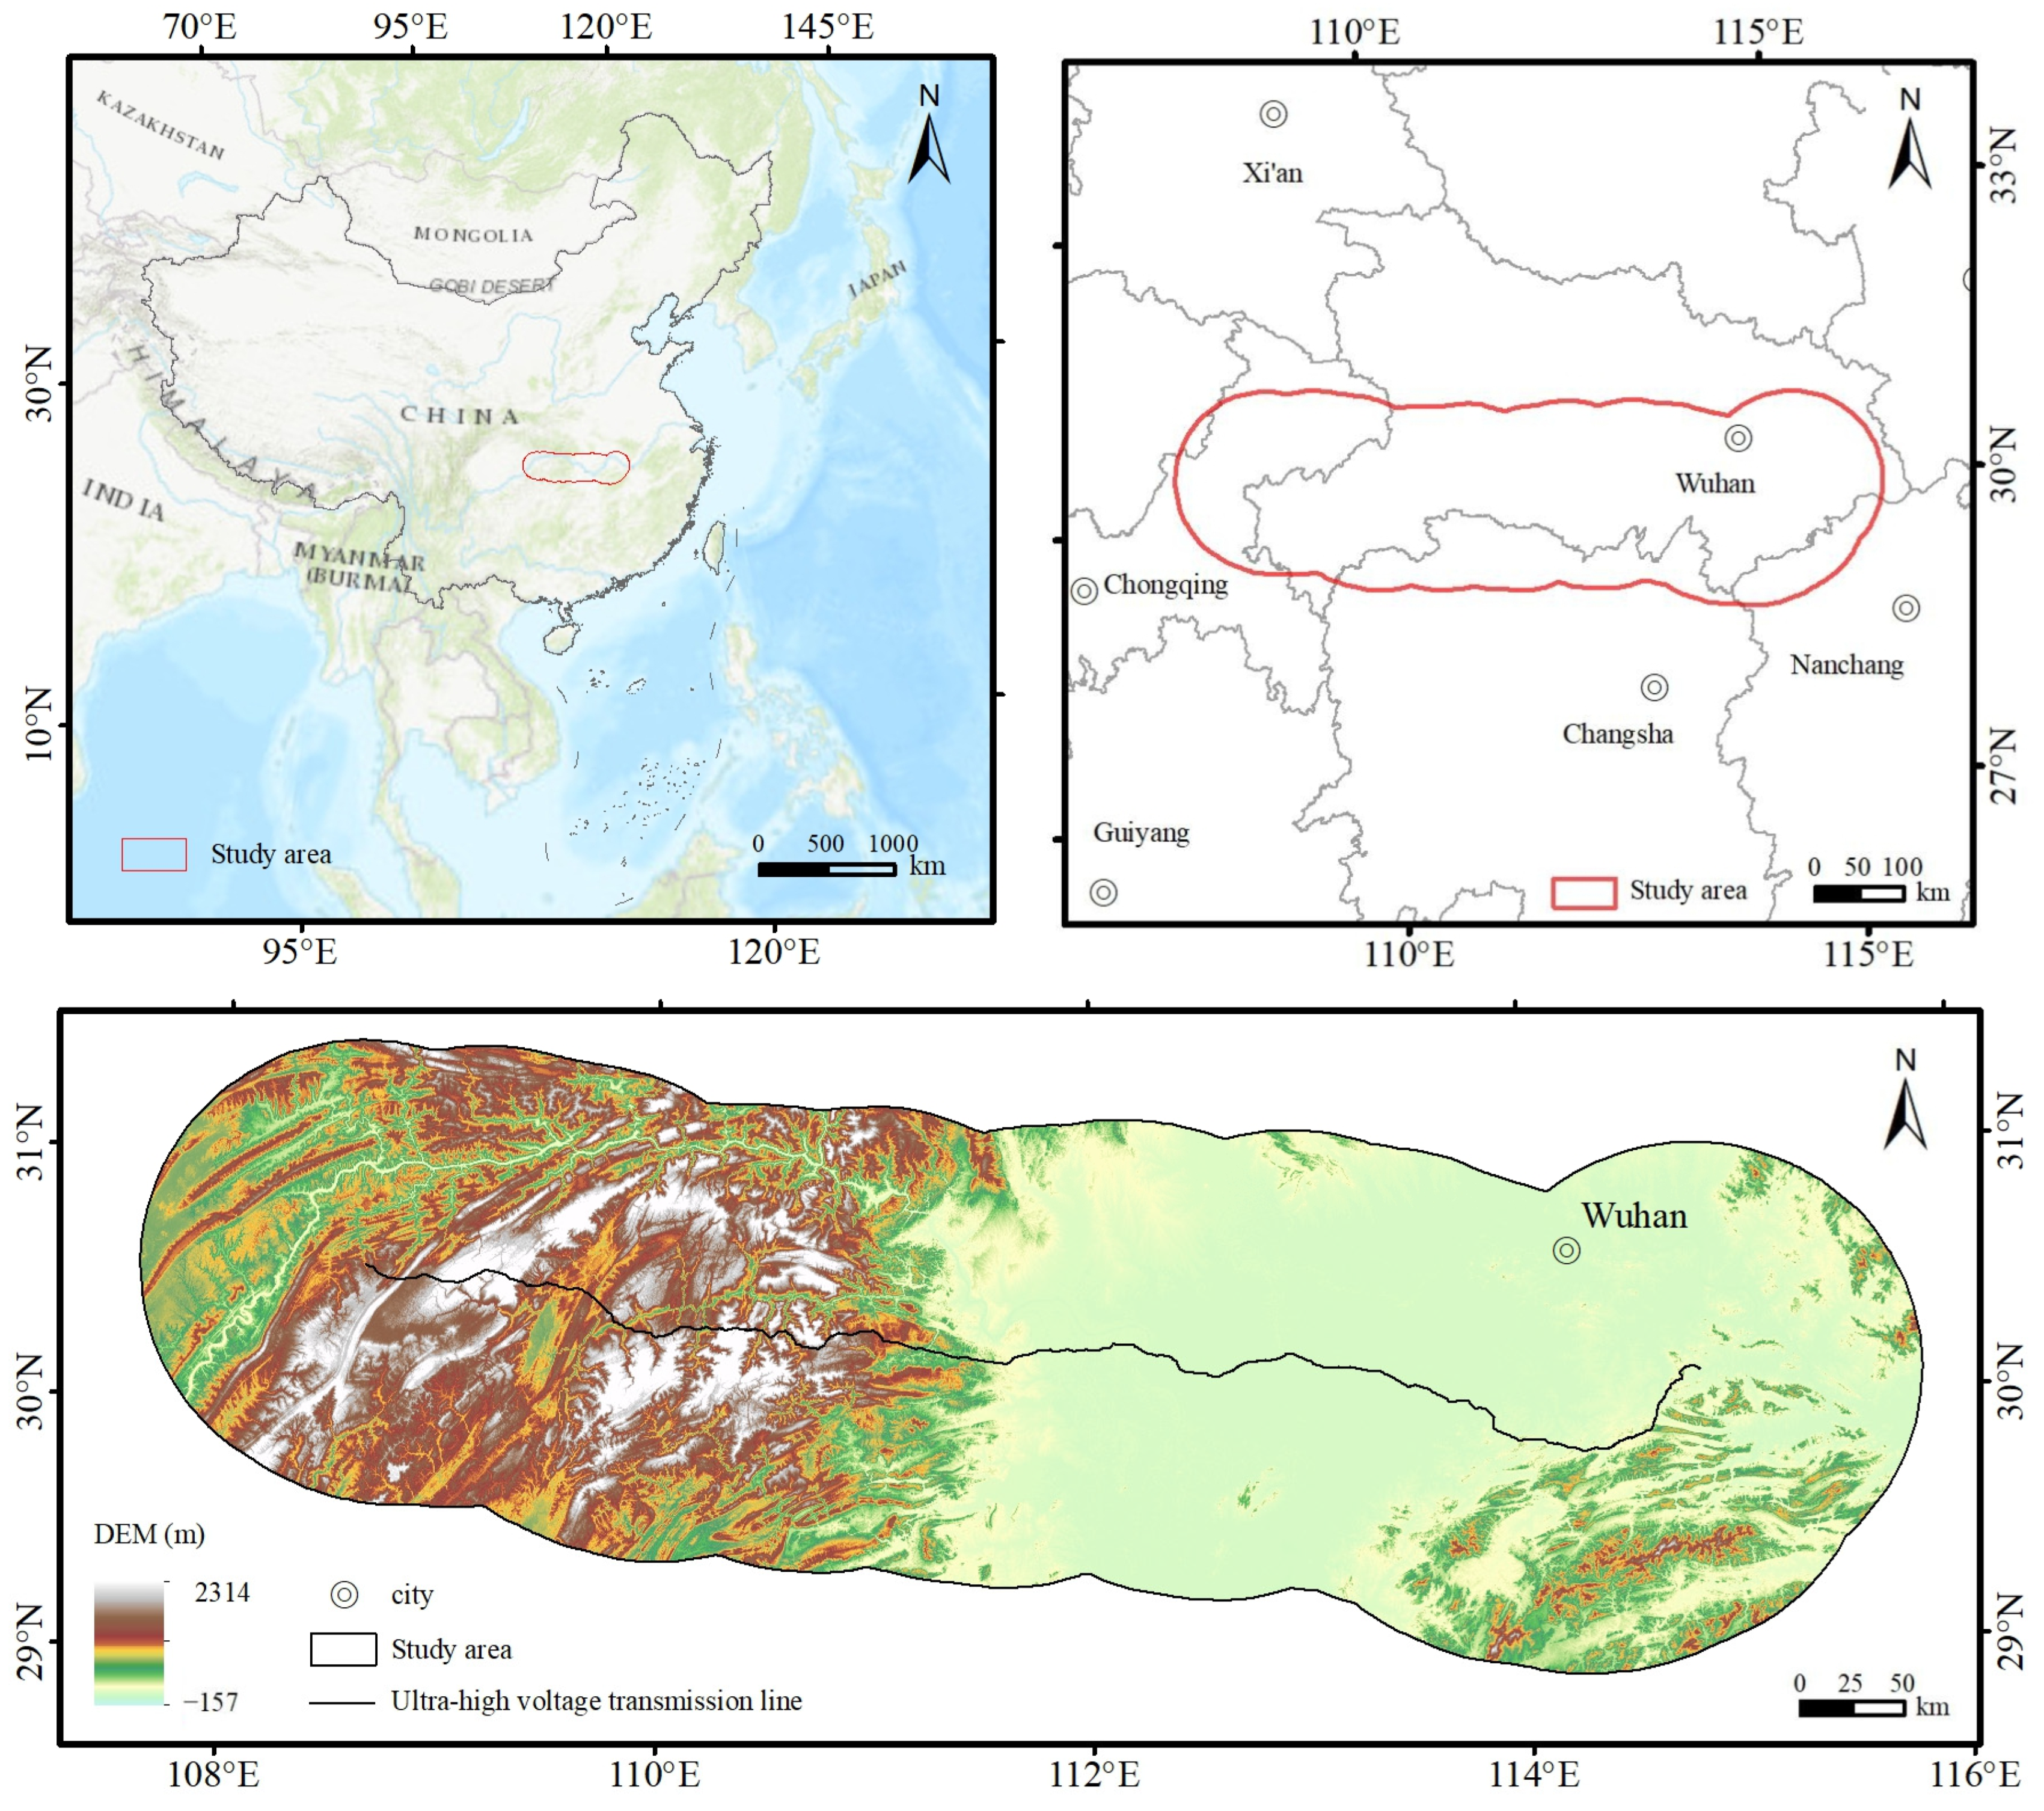
Figure 1. Overview of the study area.
Forests 16 01686 g001
Figure 2. Typical landslides in the study area. (a) at 29°39′16″ N, 108°44′45″ E; (b) at 31°01′54″ N, 110°29′46″ E; (c) at 31°01′28″ N, 110°23′09″ E; (d) at 31°00′22″ N, 110°33′32″ E; (e) at 29°37′38″ N, 110°38′54″ E; (f) at 31°14′16″ N, 109°58′16″ E.
Forests 16 01686 g002
Figure 3. Impact factor. (a) DEM; (b) slope; (c) aspect; (d) relief; (e) geology; (f) distance to fault; (g) Peak Ground Acceleration (PGA); (h) distance to river; (i) rainfall; (j) Topographic Wetness Index (TWI); (k) Fractional Vegetation Cover (FVC); (l) soil type; (m) land cover. Note: (e) In the figure, geology categories are represented as follows: Archean (Ar), Carboniferous (C), Devonian (D), Paleogene (E), Jurassic (J), Cretaceous (K), Neogene (N), Ordovician (O), Permian (P), Quaternary (Q), Silurian (S), Triassic (T), Sinian (Z), Cambrian (∈). (m) In the figure, land cover categories are represented as follows: 1 evergreen broadleaf forest; 2 deciduous broadleaf forest; 3 evergreen coniferous forest; 4 deciduous coniferous forest; 5 mixed forest; 6 sparse forest; 7 shrubland; 8 grassland; 10 sparse vegetation; 11 cropland; 12 paddy field; 13 other crop fields; 15 wetland; 16 exposed consolidated rock; 17 bare area, unconsolidated (sand); 18 urban land; 20 water bodies.
Forests 16 01686 g003aForests 16 01686 g003bForests 16 01686 g003cForests 16 01686 g003dForests 16 01686 g003e
Figure 4. Landslide distribution in the study area. (a) Overall distribution of landslides; (b,c) landslide-concentrated areas.
Forests 16 01686 g004
Figure 5. Proportion of landslides within different area classes.
Forests 16 01686 g005
Figure 6. Landslide density map. (a) Landslide number density (LND); (b) landslide area percentage (LAP).
Forests 16 01686 g006
Figure 7. Relationship between DEM and landslide distribution.
Forests 16 01686 g007
Figure 8. Relationship between slope and landslide distribution.
Forests 16 01686 g008aForests 16 01686 g008b
Figure 9. Relationship between aspect and landslide distribution.
Forests 16 01686 g009
Figure 10. Relationship between relief and landslide distribution.
Forests 16 01686 g010
Figure 11. Relationship between geology and landslide distribution. Note: Archean (Ar), Carboniferous (C), Devonian (D), Paleogene (E), Jurassic (J), Cretaceous (K), Neogene (N), Ordovician (O), Permian (P), Quaternary (Q), Silurian (S), Triassic (T), Sinian (Z), Cambrian (∈).
Forests 16 01686 g011
Figure 12. Relationship between fault and landslide distribution.
Forests 16 01686 g012
Figure 13. Relationship between PGA and landslide distribution.
Forests 16 01686 g013
Figure 14. Relationship between river and landslide distribution.
Forests 16 01686 g014
Figure 15. Relationship between rainfall and landslide distribution.
Forests 16 01686 g015
Figure 16. Relationship between TWI and landslide distribution.
Forests 16 01686 g016
Figure 17. Relationship between FVC and landslide distribution.
Forests 16 01686 g017
Figure 18. Relationship between soil type and landslide distribution.
Forests 16 01686 g018
Figure 19. Relationship between land cover and landslide distribution. Note: 1: evergreen broadleaf forest, 2: deciduous broadleaf forest, 3: evergreen coniferous forest, 4: deciduous coniferous forest, 5: mixed forest, 6: sparse forest, 7: shrubland, 8: grassland, 10: sparse vegetation, 11: farmland, 12: paddy field, 13: other cropland, 15: wetland, 16: exposed consolidated rock, 17: bare area, unconsolidated (sand); 18: urban area, 20: water body.
Forests 16 01686 g019
Figure 20. Correlation curves between the cumulative number of landslides and the landslide area.
Forests 16 01686 g020
Table 1. Lithologic classification of the study area.
NO.Stratigraphic ChronologyLithologic Classification
1Archean (Ar)Gneiss, Marble, Calc–Silicate Rock
2Carboniferous (C)Limestone, Shale, Sandstone
3Devonian (D)Sandstone, Shale, Quartzite
4Paleogene (E)Sandstone, Conglomerate, Shale
5Jurassic (J)Sandstone, Shale
6Cretaceous (K)Sandstone, Shale
7Neogene (N)Sandstone, Conglomerate
8Ordovician (O)Black Shale, Argillaceous Limestone, Limestone
9Permian (P)Limestone, Shale, Sandstone
10Quaternary (Q)Mud, Sand, and Other Sediments
11Silurian (S)Sandstone, Shale, Argillaceous Limestone
12Triassic (T)Limestone, Shale, Sandstone
13Sinian (Z)Dolomite, Shale, Limestone
14Cambrian (∈)Dolomite, Shale, Limestone
Table 2. Impact factors and their data sources.
Impact FactorData TypeData Source
DEMRasterALOS 30 m
SlopeRasterDerived from DEM
AspectRasterDerived from DEM
ReliefRasterDerived from DEM
Topographic Wetness Index (TWI)RasterDerived from DEM
GeologyVector1:2.5 M Geological Map
FaultVectorNational Seismic Fault Data
Peak Ground Acceleration (PGA)Raster5th Generation Seismic Zoning
PrecipitationRasterGlobal Climate Data
RiverVectorNational Geographic Information Resource Directory Service System
Fractional Vegetation Cover (FVC)RasterGLCNMO
Soil typeRaster1:1 M soil map of the People’s Republic of China
Land coverRasterGLCNMO
Disclaimer/Publisher’s Note: The statements, opinions and data contained in all publications are solely those of the individual author(s) and contributor(s) and not of MDPI and/or the editor(s). MDPI and/or the editor(s) disclaim responsibility for any injury to people or property resulting from any ideas, methods, instructions or products referred to in the content.