Abstract
The frequency, intensity, and duration of extreme climate events will probably increase in various areas in the 21st century. This trend is especially critical for the western Tianshan Mountains, which are highly sensitive to climate variability. Here, we used tree core samples of Picea schrenkiana Fisch. & C.A.Mey. (P. schrenkiana) from the Kashi River Basin to establish standardized earlywood and latewood density chronologies, analyze correlations between the density chronologies and extreme climate indices, and explore the response of tree-ring density to climate and altitudinal variation. Earlywood and latewood densities were significantly correlated with major climatic indices: positively with warm nights (TN90p; June–August), Max Tmin (TNx; June–August), and Min Tmin (TNn; July), and negatively correlated with cold nights (TN10p; June–September). The climate has undergone significant changes particularly in minimum temperatures, and the sensitivity of tree-ring density to major extreme climate indices (TN90p, TNx, TNn, and TN10p) strengthened significantly in sample sites below 1900 m and above 2200 m during 1980–2015 and 1974–2009, respectively, reflecting the vulnerability of mid–high-altitude forests to drought stress. Combined with teleconnection analysis, the positive phase of the AMO is synergistic with the negative phase of NAO/AO, which aggravates the response of tree growth to drought. These results indicate that changes in extreme climate indices primarily exacerbate drought stress in the region’s vulnerable mountain ecosystems, suggesting that future forest management plans should accordingly strengthen their focus on P. schrenkiana.
1. Introduction
The Intergovernmental Panel on Climate Change (IPCC) Sixth Assessment Report (AR6) states that climate change not only includes average climate change but also extreme climates. The intensity and frequency of extreme climates will increase in the future under warming scenarios, which strongly affect terrestrial ecosystem processes, especially the terrestrial carbon balance [1,2]. As a critical component of these ecosystems, forests are the mainstay of terrestrial ecosystems and play a key role in maintaining ecosystem stability and regulating the carbon cycle [3]. Mounting evidence reveals that extreme climatic stressors, including droughts, heatwaves, floods, and frost events, impose significant stress on forest ecosystems, disrupt the normal seasonal cycle of vegetation, and lead to a decline in productivity, a decrease in biodiversity, and the degradation of ecosystem services, which are often irreversible [4]. For example, Canada’s boreal forests are threatened by climate change. Specifically, with the increased prevalence of drought predicted for this century, the capacity of Canada’s boreal forests to act as a carbon sink will be further reduced, potentially initiating a significant positive climate feedback process [5]. Approximately 0.5% of the aboveground biomass carbon of tropical forests is lost when the temperature increases by 0.5 °C, and the effect of temperature anomalies on net biomass carbon is mainly caused by the loss of carbon associated with increased tree mortality [6]. Increased precipitation is effective in increasing the soil moisture content of forests, while the increased extreme precipitation and excessively wet soils in forests can exacerbate infestations of Phytophthora and pests [7]. Low-temperature frost events also affect the growth and development of trees by inducing damage to and the loss of various organs (e.g., new buds, flowers, and leaves) [8]. These impacts demonstrate that the growth of trees is affected by climatic perturbations, their physiological characteristics, and local environmental conditions [9]. To unravel these dynamics, dendroecological approaches provide unique historical perspectives.
Tree-ring data (Width, Density, Blue Intensity, and Isotopes) are used to reconstruct historical climates and characterize ecological responses, owing to their high resolution, wide spatial distribution, accurate dating, and climate sensitivity [10]. The fundamental ring width is largely governed by the number of tracheids produced during the growing season, whereas density is determined by the average size and the amount of wall material fixed in the tracheids during the intra-annual period [11]. Specifically, density metrics are closely associated with the proportion of tracheid diameter, wall thickness, and lumen size [12], with common indicators including earlywood density, latewood density, maximum density, and minimum density. These structural characteristics are determined by distinct physiological processes and provide critical supplementary information for extracting environmental signals [13]. For instance, studies have shown that, in the high-latitude regions of the Northern Hemisphere, such as Western Sichuan and the Da Hinggan Mountains [14,15], where temperatures are low and precipitation is relatively abundant, tree growth is primarily limited by summer temperature, and this relationship is mostly used to reconstruct the temperature series. In contrast, in arid and semi-arid regions, both temperature and precipitation may limit tree growth. Studies from Shimenshan (Gansu), Eurasian Mongolia, and the Qilian Mountains [16,17,18] have shown that the earlywood density was negatively correlated with precipitation, revealing drought stress on trees.
Notably, since the mid-20th century, an anomalous reduction in forest growth indices and temperature sensitivity has been detected in tree-ring density records from northern high-latitude regions [19]. In the high latitudes of the Northern Hemisphere, there has been a significant decrease in the responsiveness of the tree rings to temperature. If this is not accounted for in dendroclimatic reconstructions, past temperatures could be overestimated [20]. This phenomenon, known as the “divergence problem”, has potentially significant implications for the development of paleoclimatic reconstructions based on tree-ring records from forests, and for the global carbon cycle. Therefore, it is necessary to conduct systematic multi-regional studies utilizing density data to validate the spatial universality of this phenomenon.
The Xinjiang portion of the Tianshan Mountains is situated in the arid and semi-arid region. With its unique landform and mountain trend, the Ili River Valley, which was originally in the continental temperate arid climate, has become the precipitation center of the Tianshan Mountains (in China) and even central Asia, thus giving rise to a “wet island” in the arid region [21]. This climatic uniqueness prompted foundational dendroclimatic research. Some of the first tree-ring density studies in China were performed in this region, and these studies have focused on analyzing the response of tree growth to fundamental climatic drivers—temperature and precipitation [22,23]. Since the 1980s, the climate in Xinjiang has become warmer, and the increased temperatures are exacerbating droughts; vegetation degradation has been noted in areas such as the Ili River Valley, which is thought to be related to the climate transition and climate extremes [24]. Wang et al. (2020) [25] used tree-ring width indices to clarify that the warm night index (TN90p) during the growing season is a major extreme climate factor limiting the radial growth of Picea schrenkiana. Rescaled range analysis (R/S) projections suggested a continuing rise in TN90p; this trend is expected to further suppress tree radial growth. In another study, Yu et al. (2024) [26] calculated the Basal Area index (BAI) increment and used Resistance (Rt), Recovery (Rc), and Growth Change (Gc) indicators to evaluate the ecological elasticity of tree radial growth to climate change, and revealed that, during extreme drought, Picea schrenkiana exhibited a strong resistance and weak recovery at high altitudes, and the opposite trend at low altitudes; persistent drought resulted in a growth decline at all altitudes. Thus, research on the responses of tree-ring density to extreme climates is lacking, necessitating a systematic and multi-indicator approach to clarify their effects on forest ecosystems.
Previous studies have demonstrated that, under drought conditions, elevated earlywood density results from the reduced hydraulic conductivity caused by narrowed tracheid lumens, while an increased proportion of latewood density contributes to an enhanced drought resistance [27,28]. Therefore, we hypothesize that accelerated warming, reflected in extreme temperature indices, exacerbates drought stress via increased evapotranspiration, thereby increasing the sensitivity of tree-ring density to these indices. Here, we used Picea schrenkiana Fisch. & C.A.Mey. (P. schrenkiana) tree core samples from different altitudes in the Kashi River Basin of the Tianshan Mountains to build standardized density chronologies and analyze the variation in tree-ring density response to extreme climates. Specifically, we aimed to (1) determine the major extreme climate indices affecting P. schrenkiana and (2) evaluate the response and temporal stability of tree-ring density to extreme climates at different altitudes. This research advances the understanding of forest ecosystems and provides scientific support for management practices.
2. Materials and Methods
2.1. Study Area
The study area is located in the Kashi River Basin of Nileke County, within the Ili River Valley of the western Tianshan Mountains (443°37′12″–43°47′33″ N, 82°31′04–84°08′24″ E) (Figure 1). This region experiences a temperate continental climate (Figure 1). Hydrologically, the Kashi River is the second largest tributary of the Upper Ili River [29], with glacial and snowmelt water serving as a vital source of its flow recharge [30]. The vertical differentiation of mountain vegetation is pronounced, and P. schrenkiana is the dominant conifer, primarily distributed on shaded slopes and semi-shaded slopes between 1600 and 2700 m, where the soil is classified as mountain gray-brown forest soil [31]. Picea schrenkiana Fisch. & C.A.Mey. (P. schrenkiana) is renowned for its well-defined annual growth rings, which are easily distinguishable, and it is highly sensitive to environmental changes, which makes it an optimal tree species for dendroclimatological research [32].
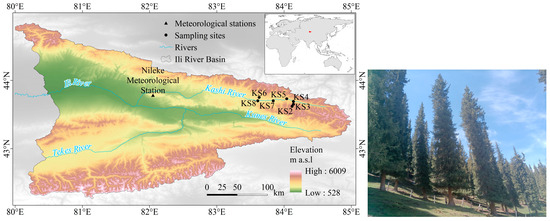
Figure 1.
Study area and sampling sites.
2.2. Sampling and Tree-Ring Density Measurement
Core samples were collected from seven sampling stands at approximately 100 m intervals within the optimal growth range (1804 m, 1900 m, 2006 m, 2095 m, 2200 m, 2300 m, and 2400 m). We prioritized sampling stands within the core forest range that remained largely undisturbed. Two core samples per tree were obtained from different directions at breast height (1.3 m) using 10 mm increment borers. See Table 1 and Figure 1 for sampling stand details.

Table 1.
Information on the tree-ring sampling stands.
The cores were mounted on woody supports, air-dried, and progressively sanded until the structure was clearly visible for identification. The widths were measured using the LINTAB measurement system (Rinntech, Heidelberg, Germany) at a 0.001 mm resolution [33]. PAST5 (1995–2016 by SCIEM. All Rights Reserved. Version 5.0.600) software was used to cross-date the tree-ring widths, and the COFECHA program (Verson v6.06p) was used to test the quality of the cross-dating results [34]. After obtaining the tree-ring width chronologies, the selected samples were soaked in water at 80 °C for 48 h to extract the resin and subsequently cut into thin 1.0 mm laths using a twin-bladed Dendrocut (WALESCH Electronic GmbH, Effretikon, Switzerland) [35]. The X-ray images were then measured using a Dendro 2003 workstation (Version V1.13, WALESCH Electronic GmbH) to obtain datasets. During the measurement and scanning process, factors such as residual resin were found to cause significant deviations in density values, particularly affecting minimum and maximum density measurements. Furthermore, minimum and maximum densities are derived from point values, whereas earlywood density and latewood density are derived from averages of two or more points and are less affected by noise interference. Therefore, to ensure data reliability, we used the earlywood density (EWD) and latewood density (LWD) for analysis [36]. The density datasets were cross-dated against the tree-ring width chronology. Subsequently, a negative exponential function method suitable for arid and semi-arid regions was used to remove the age-related trends, and the bi-weighted average was used to combine the detrended series into a standardized tree-ring density chronology [37,38].
2.3. Meteorological Data
Daily and monthly climatic data were derived from observational records (1959–2017) at the Nileke Meteorological Station (43°47′33″ N, 82°31′04″ E, 1105.3 m a.s.l.), near our sampling stands in Nileke County. As shown in Figure 2, the region has a temperate continental semi-arid climate, with mean minimum temperatures dropping below −20 °C in January, and warm summers, with mean maximum temperatures reaching up to 25 °C in July. Precipitation is concentrated from April to August, accounting for 60% of the annual total and peaking in June (57.6 mm). From 1960 to 2020, all temperature indices increased significantly, particularly in mean minimum temperatures (0.601 °C·(10a) −1; p < 0.001). Precipitation also showed an upward trend (20.985 mm·(10a) −1; p < 0.01).
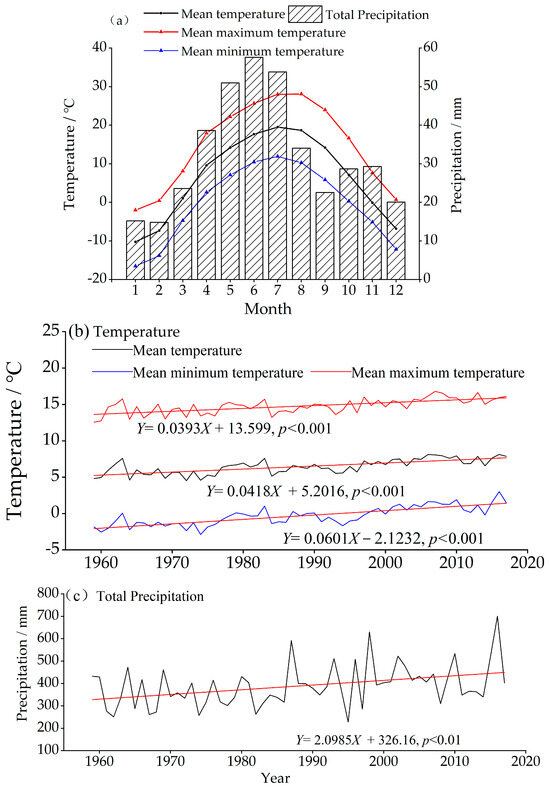
Figure 2.
Climate characteristics of Nileke Meteorological Station. (a) Monthly precipitation and temperature. (b) Variation in temperature; the red is the linear regression. (c) Variation in total precipitation; the red is the linear regression.
We adopted the set of extreme climate indices defined by the World Meteorological Organization (WMO) and the Expert Team on Climate Change Detection and Indices (ETCCDI) (http://etccdi.pacificclimate.org/indices.shtml, accessed on 11 November 2022) [39]. Data quality assessment and calculation of the indices were performed using the computer program RClimDex (Version 1.0) developed at the Climate Research Branch of the Meteorological Service of Canada. It computes the 27 temperature and precipitation indices recommended by the Expert Team on Climate Change Detection Monitoring and Indices (ETCCDI). Our analysis included 26 of the 27 core indices (Table 2), excluding the user-defined threshold index Rnn (annual count of days when PRCP ≥ nn mm) [40].
Table 2.
Extreme climate indices and Pettitt test results.
The Pettitt test can determine the year of the mutation point, and the statistical significance of the mutation point can be determined using non-parametric tests [41], and therefore it was used to analyze each climatic indicator. Significant mutations were identified for all the extreme temperature indices (Table 2), except for Max Tmax (TXx), Warm spell duration indicator (WSDI), Tropical nights (TR20), and Cold spell duration indicator (CSDI), and for the extreme precipitation indices, except for Consecutive dry days (CDD), Consecutive wet days (CWD), and Extremely wet days (R99P), respectively. Four of the climate indices had mutation years in the mid-1980s (p < 0.001), and seven had mutation years in the mid- and late 1990s (p < 0.001).
Extreme climate indices varied significantly from 1959 to 2017 (Figure 3). For the temperature indicators, significant increases were observed in Min Tmax (TXn), Max Tmin (TNx), Min Tmin (TNn), Warm nights (TN90p), Warm days (TX90p), Summer days (SU), and Growing season length (GSL) (p < 0.001). Meanwhile, significant decreases were observed in Cool nights (TN10p), Cool days (TX10p), Frost days (FD), Diurnal temperature range (DTR), and Ice days (ID) (p < 0.001). Significant increases were observed for the following precipitation indicators: Max1-day precipitation amount (RX1 day), Max5-day precipitation amount (RX5 day), Very wet days (R95P), Number of very heavy precipitation days (R20), and Simple daily intensity index (SDII) (p < 0.001).
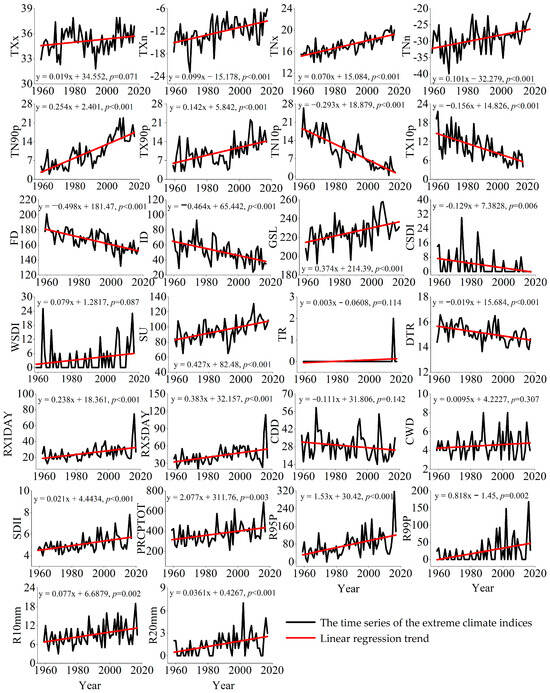
Figure 3.
Interannual variation in extreme climate indices from the Nileke Meteorological Station during 1959–2017.
In addition, we considered three atmospheric teleconnection patterns related to the study area [42]: the Atlantic Multidecadal Oscillation (AMO), North Atlantic Oscillation (NAO), and Arctic Oscillation (AO). The data were sourced from the National Climate Center of China Meteorological Administration. https://cmdp.ncc-cma.net/Monitoring/cn_index_130.php, accessed on 12 March 2025.
2.4. Statistical Analysis
Because the density chronologies and climatic data were not normally distributed, we employed Spearman correlation analysis to calculate the correlation coefficient between density and climate indices from October of last year to October of the current year. To investigate the dynamic response of tree parameters to climate extremes over time, the moving correlation function in SPSS (Version 26.0) was used to analyze the relationship between the tree-ring density chronology and the main extreme climate indices. Notably, the World Meteorological Organization proposed in 1989 that average climatic conditions over 30 years could be used to represent the average climatic state of a region (WMO, 1989) [43]. Meanwhile, most of the mutation years for the climate indices of the study area were around 1996. Thus, the sliding window was set to 36 years with a 1-year slide, and the threshold for statistical significance was p = 0.01. Finally, to evaluate the influence of atmospheric teleconnections, a first principal component (PC1) chronology was separately constructed from earlywood and latewood density via PCA, integrating altitudinal information. Subsequently, all datasets were standardized and subjected to a 36-year low-pass filter for comparative time-series analysis.
3. Results
3.1. Chronological Characteristics
The density chronology is an order of magnitude lower than the width chronology for each of the parameters examined [44]. The mean sensitivity (MS) of the seven points was above 0.026; the standard deviation (SD) ranged from 0.051 to 0.103, and the signal-to-noise ratio (SNR) ranged from 1.274 to 8.163. These values are consistent with the parameter range of chronological parameters in the surrounding regions [45], indicating that the common signal derived from the chronology is robust. The expressed population signal (EPS) was used to assess the reliable length of tree-ring chronologies. The statistical analyses were performed at 20-year intervals, with an overlap of 10 years across the chronology [46]. The subsample signal strength (SSS) was used to evaluate the adequacy of early replication in the chronology. For the seven stands, the SSS of 10 to 22 trees included after 1691–1886 was higher than 0.85, ensuring the reliability of the climate signals in the chronologies (Table 3 and Table 4).
Table 3.
Statistical parameters of the standardized earlywood density chronology of Picea schrenkiana Fisch. & C.A.Mey. (P. schrenkiana).
Table 4.
Statistical parameters of the standardized late wood density chronology of P. schrenkiana.
3.2. Spearman Correlation Between Tree-Ring Density and Extreme Climatic Indices
The response to pre-growing season climate (from the previous October to the current April) was fragmented relative to the current growing season (May to September). Thus, this study focuses on the relationships during the growing season.
As shown in Figure 4, earlywood density showed significant positive correlations with TN90p from June to August (p < 0.01), with TNx from June to September (p < 0.01), and with TNn from July to August (p < 0.01). Conversely, it was significantly negatively correlated with TN10p from June to September (p < 0.01). Compared to temperature indices, earlywood density showed weak positive correlations with extreme precipitation indices, with a significant correlation with RX1day observed at stands KS5 and KS6 within 2000–2100 m in June (p < 0.01).
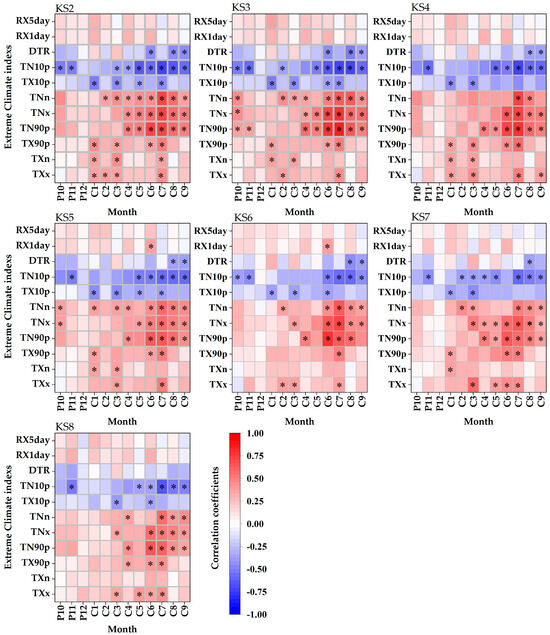
Figure 4.
Spearman correlation coefficients between the earlywood density and monthly values of 11 extreme climate indexes during 1960–2017. P: previous year, C: current year, black asterisks: significance level < 0.01.
As illustrated in Figure 5, latewood density showed significant positive correlations with TN90p from April to August (p < 0.01), with TNx from June to August (p < 0.01), and with TNn in July (p < 0.01). It was also negatively correlated with TN10p from May to September (p < 0.01).
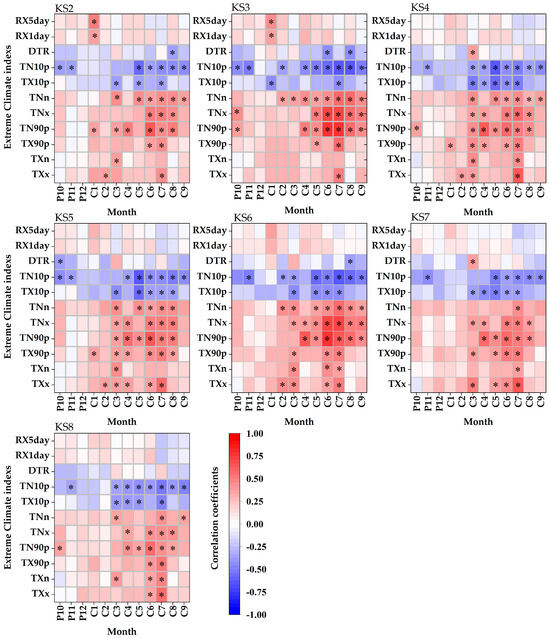
Figure 5.
Spearman correlation coefficients between the latewood density and monthly values of 11 extreme climate indexes during 1960–2017. P: previous year, C: current year, black asterisks: significance level < 0.01.
3.3. Moving Correlation Between Tree-Ring Density and Main Extreme Climate Indices
According to the correlation coefficients between the density and monthly values of 11 extreme climate indices (Figure 4 and Figure 5), we selected the extreme climate indices that reached the significance level (p < 0.01) for moving correlation analysis.
As shown in Figure 6, earlywood density at different altitudes was mainly positively correlated with TN90p, TNx, and TNn, and negatively correlated with TN10p. For TN90p, significant positive correlations were found during 1972–2007 at KS2 and KS4 (2400–2200 m; p < 0.01), and during 1977–2012 at stands KS5-KS8 below 2100 m (p < 0.01). For TNx, significant positive correlations during 1967–2002 were observed for sample stands KS2 and KS4 (2400–2200 m; p < 0.01), and during 1975–2010 at stands KS5-KS8 below 2100 m (p < 0.01). For TNn, positive correlations were found during 1966–2001 at stands KS2-KS3 (p < 0.01), and during 1980–2013 at stands KS6-KS8 below 2000 m (p < 0.01). For TN10p, significant negative correlations occurred during 1965–1998 at stands KS2-KS4 above 2200 m (p < 0.01) and during 1977–2012 for sample sites KS5-KS8 below 2200 m (p < 0.01).
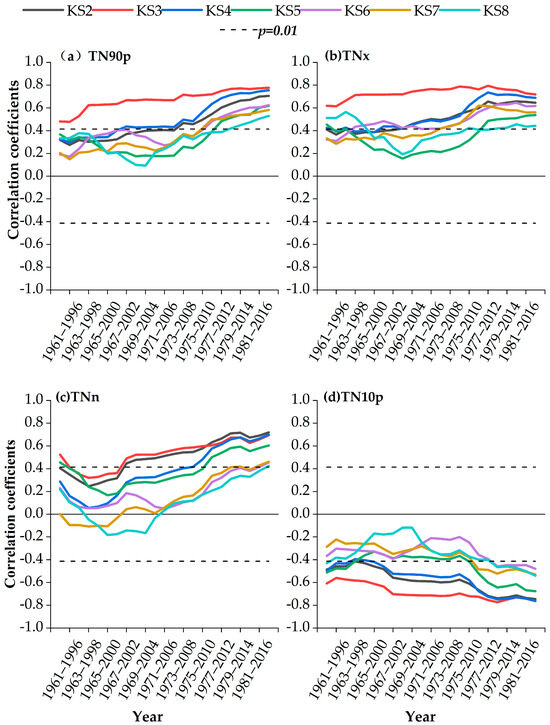
Figure 6.
Moving correlations between the earlywood density and main extreme climate indexes in May-September during 1960–2017.
As shown in Figure 7, the moving correlations between latewood density and the main extreme climate indices were consistent with those between earlywood density and extreme climate indices. For TN90p, significant positive correlations were observed during 1980–2015 at stands KS7-KS8 (1800–1900 m; p < 0.01) and during 1976–2011 at KS4-KS6 and KS2 above 2100 m (p < 0.01). For TNx, positive correlations were found during 1981–2016 at stands KS7-KS8 (1800–1900 m; p < 0.01) and during 1975–2010 for KS4, KS5, and KS2 above 2100 m (p < 0.01). For TNn, significant positive correlations existed during 1981–2016 at stands KS7-KS8 (1800–1900 m; p < 0.01) and during 1970–2005 at stands above 2300 m (p < 0.01). For TN10p, significant negative correlations were observed during 1978–2013 at stands KS7-KS8 below 1900 m (p < 0.01) and before and after 1974–2009 for KS4-KS5 (2100–2200 m; p < 0.01).
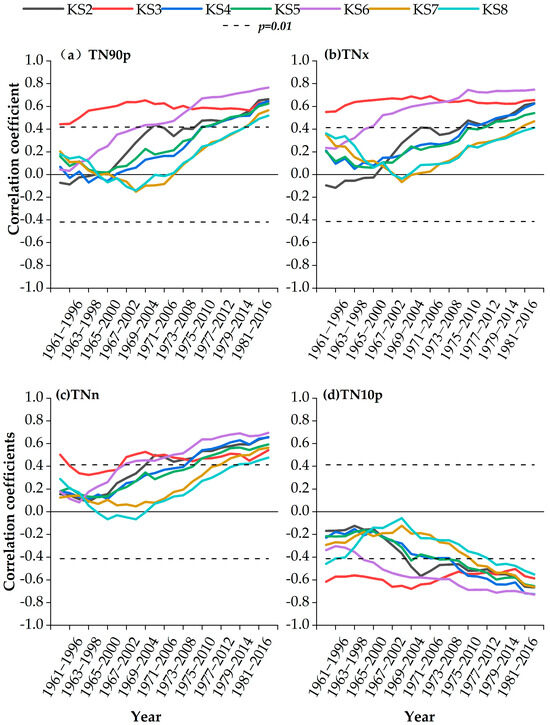
Figure 7.
Moving correlations between the latewood density and main extreme climate indexes in May-September during 1960–2017.
The first principal component of tree-ring density chronologies and atmospheric circulation indices showed that the earlywood density and latewood density were highly synchronized with the Atlantic Multidecadal Oscillation (AMO). The AMO index changed from a negative phase to a positive phase in 1996, respectively. The NAO index transitioned from a positive to a negative phase in 1999. The AO index exhibited a sustained upward trend after 2008, shifting from a negative to a positive phase (Figure 8).
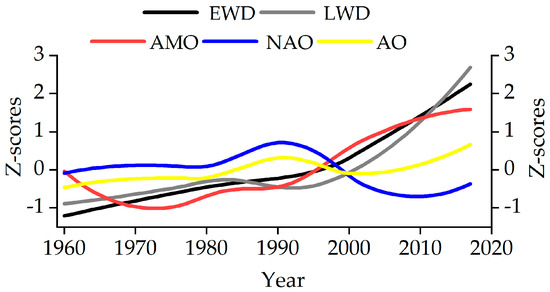
Figure 8.
Comparisons between the first principal component of tree-ring density chronologies and atmospheric circulation indices (NAO, AO, AMO) for 1960–2017. Note: All data is subject to 36-year low-pass filtering after standardized processing.
4. Discussion
4.1. Ecological Response of Density to Extreme Climatics
Picea schrenkiana Fisch. & C.A.Mey. (P. schrenkiana) is a gymnosperm, and the xylem of gymnosperm trees mainly consists of axial tracheids, which mediate the transport of water and provide structural support. Within each growth ring, there is a transition from wide thin-walled tracheids formed during spring (earlywood) to tracheids with thicker secondary cell walls and smaller cell diameters later in the season (latewood) [47].
The primary growing season of P. schrenkiana is approximately from May to September. Growth is most rapid from mid-June to early July, which is a critical period for early wood growth and radial growth. After the end of July, the rate of cell division and expansion decreases, and the cell wall thickens slowly. Cell growth ends in September, which is a critical period for latewood formation [48,49]. Notably, tree-ring density is an important indicator of radial growth, and it indirectly reflects the accumulation of cell wall deposits in the formation layer and cell volume; a larger cell volume is associated with the reduced accumulation of cell wall material and thus a smaller tree-ring density [50].
Earlywood density was positively correlated with TN90p from June to August, while a negative correlation was observed with TN10p. It was also positively correlated with TNx and TNn from July to August. It was positively correlated with TNx and TNn from July to August (Figure 4). This might be explained by the fact that the thickening and lignification of xylem cells mainly occur at night [51]; at higher temperatures (not exceeding the threshold temperature), more lignin accumulates in the cell wall, which increases the tree-ring density. The radial growth and expansion of P. schrenkiana mainly occurs from 7:00 p.m. to 10:00 a.m. the next day [49], and the minimum temperature during this period generally occurs at night [52]. As the minimum temperature increases, particularly during warm nights, it intensifies soil evaporation and plant transpiration, which results in a reduced fluid flow and hydraulic conductivity in trees. Generally, in arid and semi-arid regions, tree growth is more sensitive to precipitation, and earlywood density is negatively correlated with precipitation, such as in the Qilian Mountains [53]. However, the increase in temperature exacerbates the evaporation of soil moisture, and tree-ring density can also be positively correlated with temperature, which confirms the role of temperature (including minimum temperature) in the earlywood growth of trees in the western Tianshan Mountains and similar areas [54,55].
Latewood density was significantly and positively correlated with TN90p from April to August, and with TNx from June to August, while it was significantly negatively correlated with TN10p from May to September (Figure 5). Specifically, latewood densities had pronounced responses to temperatures in the early period. This is because the contribution of the cell wall to wood density in both earlywood and latewood depends on the resources obtained over an extended period, including the time before wood formation [11]. In addition, cell division slows after July, but the cell wall thickens more rapidly during this period; increases in temperature help promote the accumulation of substances, thereby increasing the density of tree rings. This finding coincides with the results from the Tien Shan and Tibetan Plateau that emphasize the importance of temperature in promoting cell wall synthesis [56,57], and further confirms that the cell wall thickening during this period is mainly limited by summer temperature.
Tree-ring density showed a significant response to RX1day in June at altitudes of 2000–2100 m (Figure 4). The study area is characterized by a climate of synchronous rain and heat, with the highest precipitation occurring in June, reaching 57.6 mm (Figure 2). Additionally, a distinct precipitation high-value zone appeared around 2060 m in the Yili River Basin, precisely within this elevation range. Under relatively sufficient moisture conditions, soil moisture tends to saturation and cannot be utilized by plants, thus having a limited promoting effect on growth [48]. Moreover, when precipitation is high, plants may be restricted by other factors such as photosynthetically active radiation or nutrient availability, resulting in diminishing growth returns from increased precipitation [58]. Therefore, the increase in precipitation has not effectively promoted tracheid production but has instead facilitated cell wall thickening through the aforementioned mechanism.
4.2. Response of Tree-Ring Density to Extreme Climates over Time
The analysis of extreme climate indices from 1959 to 2017 at adjacent meteorological stations revealed that the study area is experiencing rapid warming (Figure 3). In particular, TN90p significantly increased (2.517 days·(10a)−1) and TN10p significantly decreased (2.934 days·(10a)−1). Alexander et al. stated that over 70% of the global land area sampled has experienced a significant decrease in the annual occurrence of cold nights and a significant increase in the annual occurrence of warm nights, and that two-fold increases in these indices have been observed in some regions [59]. The results of this study were consistent with the global climate change trend. Within this climatic context, our study found unstable climate responses in tree-ring density chronologies.
The correlation between tree-ring density and the main extreme climate indices (TN90p, TNx, and TNn) from May to September strengthened and became significant around 1977–2012 (Figure 6 and Figure 7), which may indicate an enhanced sensitivity of tree growth to climatic extremes. Physiologically, the increase in minimum temperatures surpassed that of maximum temperatures; the nutrient consumption caused by the increase in plant respiration was more pronounced than that caused by the decreased photosynthetic efficiency associated with water deficiency, which promoted the formation of narrow rings [60]. This physiological mechanism is particularly critical in arid and semi-arid areas, where restrictions on the growth of trees have been gradually increased with temperature [61,62].
The response of tree-ring density to extreme climate is also affected by altitude. At stands below 1900 m and above 2200 m, tree-ring density showed significant positive correlations with TN90p, TNx, and TNn, and negative correlations with TN10p during approximately 1980–2015 and 1974–2009, respectively. This reflects the temporal inconsistency in the response of tree-ring density to extreme climate change at different elevations, and indicates that tree growth in mid- and high-elevation forests is more sensitive to responses to extreme climate change. Liu Yalan et al. also found that warming decreased the growth of P. schrenkiana tree rings at all altitudes, and the sensitivity of tree rings to warming was highest at the highest altitude [63]. This is caused by the fact that the rate of warming is generally thought to increase with altitude. Changes in temperature extremes increase linearly with altitude, and the rate of warming is more pronounced at middle and high altitudes than at low altitudes [64,65].
Considering the other factors, the activity of tree cambium in arid and semi-arid regions is mainly affected by soil moisture [66], and the root system of P. schrenkiana aggregates at the soil surface and mainly absorbs soil water from the 0–20 cm layer [67,68]. The water retention of the surface layer of the Tianshan forest ecosystem (such as non-capillary porosity, effective water holding capacity, and water-holding capacity of the litter layer) is relatively better in the middle- and low-altitude areas (1500–1900 m) [69]. In the context of climate change, soil moisture in Xinjiang has been decreasing, with the most pronounced reductions occurring in shallow soil layers (0–50 cm) [24]. Although the total precipitation and precipitation intensity of the research area have increased, the rapid increase in temperatures has exacerbated evaporation, resulting in the formation of smaller cells with thickened cell walls and higher wood density; during this process, high-altitude areas may face more severe water stress.
Based on previous studies, the warm periods in China generally coincided with the two major positive phases of the AMO. This close similarity between the AMO and multi-decadal temperature variability in China is supported by climate model simulations and underscores the critical role of surface heating over the Asian continent in connecting the AMO [70]. Meanwhile, the negative phase of the NAO/AO indicates that the weakening of westerly circulation affects the climatic factors related to moisture and is prone to cause drought events in northwest China [71,72]. This interaction has affected the hydrological climate of the region, as demonstrated by a multiproxy tree-ring climatological study in the Tianshan Mountains of East Central Asia [72]. Based on this, it can be hypothesized that, since approximately 1996, the positive phase of the AMO in the study area has co-occurred with the negative phase of the NAO (Figure 8), and this combination has aggravated the response of tree growth to drought.
In the dryland conifer forests of the western United States, the combination of increased precipitation variability, higher temperatures, elevated VPD, and reduced snowpack is creating novel climates. This phenomenon could result in continued forest degradation [58]. Similarly, under climate warming, the synergy between extreme temperature and precipitation seriously threatens the growth of P. schrenkiana.
5. Conclusions
This study collected core samples of Picea schrenkiana Fisch. & C.A.Mey. (P. schrenkiana), established a standardized chronology of early and latewood density, and analyzed their correlations with extreme climates. The main findings are as follows:
Both earlywood and latewood densities showed significant positive correlations with TN90p, TNx, and TNn, but negative correlations with TN10p. This relationship is driven by the increase in the minimum temperature and more frequent warm nights. These conditions enhance plant respiration and soil evaporation, resulting in a higher energy consumption and limited cell division and growth in P. schrenkiana.
The positive correlations of tree-ring density with TN90p, TNx, and TNn became significant in sample sites below 1900 m and above 2200 m during approximately 1980–2015 and 1974–2009, respectively; the opposite pattern was observed for TN10p, indicating an enhanced sensitivity of tree growth to climatic extremes over 1960–2017. The response of tree-ring density to extreme temperature is characterized by a significant altitudinal gradient, and this sensitivity is shown in the time advance response. The linear increase in the rate of warming and extreme temperature with elevation confirms that forests at mid- and high altitudes are particularly vulnerable to drought stress. Finally, the teleconnection analysis indicates that the positive AMO phase acted synergistically with the negative NAO/AO phases, and this synergy has aggravated the response of tree growth to drought. These findings offer valuable references for understanding potential forest dynamics under continued warming, particularly in the vulnerable mid- and high-altitude zones of the Tianshan Mountains. Future research should employ multi-parameter and multi-method approaches to dynamically monitor the comprehensive impacts of extreme climates on the radial growth of mid-to-high-altitude P. schrenkiana, coupled with an enhanced investigation into tree eco-physiological processes.
Author Contributions
T.Z., S.J., and S.Y. conceived and designed the experiments; S.J., D.G., Z.W., and C.C. performed the experiments; S.J. and R.L. analyzed the data; S.J. wrote the manuscript. All authors have read and agreed to the published version of the manuscript.
Funding
This research article was supported by the (1) Tianshan Talent Training Program-Young Scientific and Technological Innovation Talent (2023TSYCCX0076): Study on the climatic and hydrological reconstruction and future prediction and coping strategy in the Tarim River source area. (2) Natural Science Foundation of Xinjiang Uigur Autonomous Region-Science Fund for Distinguished Young Scholars (2022D01E105): Study on the Change Regulation of Tree-ring and the Climatic Influence Mechanism of the Main Conifer Trees in Xinjiang and Its Surrounding Areas. (3) Natural Key R&D Program of China (2023YFE0102700): Research on the facts of hydrometeorological changes in the past millennium, future prediction and response strategies in the Pamir Plateau. (4) The Key Laboratory Opening Subject of Xinjiang (2025D04018). (5) National Natural Science Foundation of China (42375196): Multiple Tree-Ring Parameters and Their Altitude-Dependent Climate Thresholds in Picea schrenkiana of the Tianshan Mountains.
Data Availability Statement
The data provided in this study are available from the authors upon request.
Conflicts of Interest
The authors declare that the research was conducted in the absence of any commercial or financial relationships that could be construed as potential conflicts of interest.
References
- Zhou, B.; Qian, J. Changes of weather and climate extremes in the IPCC AR6. Clim. Change Res. 2021, 17, 713–718. [Google Scholar]
- Fischer, E.M.; Knutti, R. Anthropogenic contribution to global occurrence of heavy-precipitation and high-temperature extremes. Nat. Clim. Change 2015, 5, 560–564. [Google Scholar] [CrossRef]
- Seddon, A.W.R.; Macias-Fauria, M.; Long, P.R.; Benz, D.; Willis, K.J. Sensitivity of global terrestrial ecosystems to climate variability. Nature 2016, 531, 229–232. [Google Scholar] [CrossRef]
- Gampe, D.; Zscheischler, J.; Reichstein, M.; O’Sullivan, M.; Smith, W.K.; Sitch, S.; Buermann, W. Increasing impact of warm droughts on northern ecosystem productivity over recent decades. Nat. Clim. Change 2021, 11, 772–779. [Google Scholar] [CrossRef]
- Liu, Q.; Peng, C.; Schneider, R.; Cyr, D.; McDowell, N.G.; Kneeshaw, D. Drought-induced increase in tree mortality and corresponding decrease in the carbon sink capacity of Canada’s boreal forests from 1970 to 2020. Glob. Change Biol. 2023, 29, 2274–2285. [Google Scholar] [CrossRef]
- Bennett, A.C.; Rodrigues De Sousa, T.; Monteagudo-Mendoza, A.; Esquivel-Muelbert, A.; Morandi, P.S.; Coelho De Souza, F.; Castro, W.; Duque, L.F.; Flores Llampazo, G.; Dos Santos, R.M. Sensitivity of South American tropical forests to an extreme climate anomaly. Nat. Clim. Change 2023, 13, 967–974. [Google Scholar] [CrossRef]
- Hubbart, J.A.; Guyette, R.; Muzika, R.M. More than drought: Precipitation variance, excessive wetness, pathogens and the future of the western edge of the eastern deciduous forest. Sci. Total Environ. 2016, 566–557, 463–467. [Google Scholar] [CrossRef]
- Hufkens, K.; Friedl, M.A.; Keenan, T.F.; Sonnentag, O.; Bailey, A.; O’Keefe, J.; Richardson, A.D. Ecological impacts of a widespread frost event following early spring leaf-out. Glob. Change Biol. 2012, 18, 2365–2377. [Google Scholar] [CrossRef]
- Wang, T.; Yu, D.; Li, J.; Ma, K. Advances in research on the relationship between climatic change and tree-ring width. Chin. J. Plant Ecol. 2003, 27, 23–33. [Google Scholar] [CrossRef]
- Fang, K.; Gou, X.; Chen, F.; Peng, J.; Liu, P. The Advance of Dendroecology. J. Glaciol. Geocryol. 2008, 30, 825–834. [Google Scholar]
- Björklund, J.; Seftigen, K.; Schweingruber, F.H.; Fonti, P.; von Arx, G. Cell size and wall dimensions drive distinct variability of earlywood and latewood density in Northern Hemisphere conifers. New Phytol. 2017, 216, 728–740. [Google Scholar] [CrossRef]
- Li, W. Climate Response and Reconstruction of Earlywood and Latewood Multi-Indicators of Tree Rings in Daowu Mountain, Hunan Province over the Past 214 Years. Master’s Thesis, Fujian Normal University, Fuzhou, China, 2024. [Google Scholar]
- Deng, G.; Li, M. Advances of study on the relationship between tree-ring density and climate and climate reconstruction. Prog. Geogr. 2021, 40, 343–356. [Google Scholar] [CrossRef]
- Wu, P.; Wang, L.; Shao, X. Reconstruction of summer temperature variation from maximum density of alpine pine during 1917–2002 for west Sichuan Plateau, China. J. Geogr. Sci. 2008, 18, 201–210. [Google Scholar] [CrossRef]
- Sun, Y.; Wang, L.; Chen, J.; Duan, J. Reconstructing mean maximum temperatures of May–August from tree-ring maximum density in North Da Hinggan Mountains, China. Chin. Sci. Bull. 2012, 57, 2007–2014. [Google Scholar] [CrossRef]
- Chen, F.; Yuan, Y. May–June Maximum Temperature Reconstruction from Mean Earlywood Density in North Central China and Its Linkages to the Summer Monsoon Activities. PLoS ONE 2014, 9, e107501. [Google Scholar] [CrossRef]
- Yang, L.; Qin, C.; Li, G. Climatic signals recorded by Qinghai spruce tree-ring density in the western part of Qilian Mountains, China. Chin. J. Appl. Ecol. 2021, 32, 3636–3642. [Google Scholar] [CrossRef]
- Camarero, J.J.; Fernández-Pérez, L.; Kirdyanov, A.V.; Shestakova, T.A.; Knorre, A.A.; Kukarskih, V.V.; Voltas, J. Minimum wood density of conifers portrays changes in early season precipitation at dry and cold Eurasian regions. Trees 2017, 31, 1423–1437. [Google Scholar] [CrossRef]
- D’Arrigo, R.; Wilson, R.; Liepert, B.; Cherubini, P. On the ‘Divergence Problem’ in Northern Forests: A review of the tree-ring evidence and possible causes. Glob. Planet. Change 2008, 60, 289–305. [Google Scholar] [CrossRef]
- Briffa, K.R.; Schweingruber, F.H.; Jones, P.D.; Osborn, T.J.; Shiyatov, S.G.; Vaganov, E.A. Reduced sensitivity of recent tree-growth to temperature at high northern latitudes. Nature 1998, 391, 678–682. [Google Scholar] [CrossRef]
- Nie, H.; Zhao, Y.; Zhu, J.; Ning, A.; Zheng, W. Ecological Security Pattern Construction in Typical Oasis Area Based on Ant Colony Optimization: A Case Study in Yili River Valley, China. Ecol. Indic. 2024, 169, 112770. [Google Scholar] [CrossRef]
- Chen, J.; Wang, L.; Zhu, H.; Wu, P. Reconstructing mean maximum temperature of growing season from the maximum density of the Schrenk Spruce in Yili, Xinjiang, China. Chin. Sci. Bull. 2009, 54, 1295–1302. [Google Scholar] [CrossRef]
- Ma, Y.; Song, H.; Liu, Y.; Ren, M.; Cai, Q.; Zhang, T.; Duan, X.; Pourtahmasi, K.; Li, P. Drought reconstructions over the past 552 years based on minimum earlywood density in central Tianshan Mountains. Palaeogeography 2025, 667, 112853. [Google Scholar] [CrossRef]
- Yao, J.; Mao, H.; Chen, J.; Dilinuer, T. Signal and impact of wet-to-dry shift over Xinjiang, China. Acta Geogr. Sin. 2021, 76, 57–72. [Google Scholar] [CrossRef]
- Wang, S.; Jiao, L.; Jiang, Y.; Chen, K.; Liu, X.; Qi, C.; Xue, R. Extreme climate historical variation based on tree-ring width record in the Tianshan Mountains of northwestern China. Int. J. Biometeorol. 2020, 64, 2127–2139. [Google Scholar] [CrossRef]
- Yu, S.; Guo, D.; Jiang, S.; Zhang, T.; Fan, Y.; Zhang, R.; Qin, L.; Shang, H.; Zhang, H.; Gou, X.; et al. Ecological Resilience of Picea schrenkiana along Altitude Gradients in the Western Section of the Northern Slope of Tianshan Mountains, China. Desert Oasis Meteorol. 2024, 18, 82–90. [Google Scholar]
- Torresan, C.; Hilmers, T.; Avdagi, A.; Di Giuseppe, E.; Klopi, M.; Lévesque, M.; Motte, F.; Uhl, E.; Zlatanov, T.; Pretzsch, H. Changes in tree-ring wood density of European beech (Fagus sylvatica L.), silver fir (Abies alba Mill.), and Norway spruce (Picea abies (L.) H. Karst.) in European mountain forests between 1901 and 2016. Ann. For. Sci. 2024, 81, 49. [Google Scholar] [CrossRef]
- Martínez-Meier, A.; Sanchez, L.; Pastorino, M.; Gallo, L.; Rozenberg, P. What is hot in tree rings? The wood density of surviving Douglas-firs to the 2003 drought and heat wave. For. Ecol. Manag. 2008, 256, 837–843. [Google Scholar] [CrossRef]
- Zeng, K.; Yang, Y.; Hu, Y.; Feng, X. Isotopic characteristics and water vapor sources of precipitation in the Kashi River Basin. Arid Zone Res. 2021, 38, 1263–1273. [Google Scholar] [CrossRef]
- Yu, Y.; Mu, Z. Influence of DEM Resolution on Runoff Simulation Accuracy of Kashi River Basin. Water Resour. Power 2016, 34, 19–23. [Google Scholar] [CrossRef]
- Du, H.; Chang, S.; Song, C.; Zhang, Y. Diversity of Mycorrhizal Fungi of Picea schrenkiana Forest and Its Affecting Factors in the Tianshan Mountains. Arid Zone Res. 2019, 36, 1194–1201. [Google Scholar] [CrossRef]
- Zhang, Y.; Zheng, H.; Yu, D.; Yang, M.; Shi, B.; Wang, L. Tree Ring-width Response of Picea schrenkiana to Climate Change. Bull. Bot. Res. 2017, 37, 340–350. [Google Scholar]
- Stokes, M.A. An Introduction to Tree-Ring Dating; University of Arizona Press: Tucson, AZ, USA, 1996; pp. 1–61. [Google Scholar]
- Holmes, R.L. Computer-assisted quality control in tree ring dating and measurement. Tree-Ring Bull. 1983, 43, 69–78. [Google Scholar]
- Wang, L.; Duan, J.; Chen, J.; Huang, L.; Shao, X. Temperature reconstruction from tree-ring maximum density of Balfour spruce in eastern Tibet, China. Int. J. Climatol. 2010, 30, 972–979. [Google Scholar] [CrossRef]
- Cleaveland, M.K. X-ray Densitometric Measurement of Climatic Influence on the Intra-Annual Characteristics of Southern Semiarid Conifer Tree Rings. Ph.D. Thesis, Department of Geosciences, University of Arizona, Tucson, AZ, USA, 1983. [Google Scholar]
- Conkey, L.E. Response of tree-ring density to climate in Maine, USA. Tree-Ring Bull. 1979, 39, 29–38. [Google Scholar]
- Zeng, X. Climate Response and Reconstruction Based on Tree-Ring Width and Wood Density in the Monsoon Marginal Zone and the Qinling Mountains. Ph.D. Thesis, Chinese Academy of Sciences, Beijing, China, 2022. [Google Scholar] [CrossRef]
- Karl, T.R.; Nicholls, N.; Ghazi, A. Clivar/GCOS/WMO Workshop on Indices and Indicators for Climate Extremes Workshop Summary. Clim. Change 1999, 42, 3–7. [Google Scholar] [CrossRef]
- International CLIVAR Project Office. Report on the Activities of the Working Group on Climate Change Detection and Related Rapporteurs 1998–2001; International CLIVAR Project Office: Qingdao, China, 2001. [Google Scholar]
- Xu, R.; Gao, P.; Mu, X.; Chai, X.; Gu, Z. Dynamic of Streamflow and Sediment Load and Its Response to Human Activities in the Weihe River Basin. Yellow River 2020, 42, 17–24. [Google Scholar] [CrossRef]
- Wang, Y.; Chen, Y.; Li, Z.; Fang, G.; Wang, C.; Zhang, X.; Li, Y.; Guo, Y. Climatic factor-driven time-lag effects of extreme precipitation in the Tienshan Mountains of Central Asia. J. Hydrol. 2025, 654, 132902. [Google Scholar] [CrossRef]
- World Meteorological Organization. Calculation of Monthly and Annual 30-Year Standard Normals; World Meteorological Organization: Geneva, Switzerland, 1989. [Google Scholar]
- Li, M.; Duan, J.; Wang, L. Differences in responses of tree-ring width and density of Larix mastersiana to climatic factors in the west Sichuan Plateau. Quat. Sci. 2024, 44, 963–975. [Google Scholar]
- Yu, S.; Yuan, Y.; Chen, F.; Shang, H.; Zhang, T.; Zhang, B. Tree-ring Density Chronology Features of Gongnaisi Riverhead Area in Western Tianshan Mountain. Desert Oasis Meteorol. 2010, 4, 6–11. [Google Scholar] [CrossRef]
- Wigley, T.M.L.; Briffa, K.R.; Jones, P.D. On the Average Value of Correlated Time Series, with Applications in Dendroclimatology and Hydrometeorology. J. Appl. Meteorol. Climatol. 1984, 23, 201–213. [Google Scholar] [CrossRef]
- Fredriksson, M.; Pedersen, N.B.; Thygesen, L.G. The Cell Wall Composition of Norway Spruce Earlywood and Latewood Revisited. Holzforschung 2018, 72, 1073–1084. [Google Scholar] [CrossRef]
- Wu, Y.; Gan, M.; Yu, R.; Yang, M.; Guo, Y.; Zhao, P. Process-based modeling radial growth of Picea schrenkiana in the eastern Tianshan Mountains. Arid Land Geogr. 2020, 43, 64–71. [Google Scholar]
- Zhang, R. Tree-Ring-Based Droughts Variability in Western Tianshan Mountains, Central Asia. Ph.D. Thesis, Lanzhou University, Lanzhou, China, 2017. [Google Scholar]
- Duan, J. Advances in Tree-Ring Density Study. Quat. Sci. 2015, 35, 1271–1282. [Google Scholar]
- Hosoo, Y.; Yoshida, M.; Imai, T.; Okuyama, T. Diurnal difference in the amount of immunogold-labeled glucomannans detected with field emission scanning electron microscopy at the innermost surface of developing secondary walls of differentiating conifer tracheids. Planta 2002, 215, 1006–1012. [Google Scholar] [CrossRef] [PubMed]
- Zhao, J.; Duan, Z. Analysis of Occurrence Time of Maximum and Minimum Temperature. Meteorol. Environ. Sci. 2014, 37, 86–89. [Google Scholar] [CrossRef]
- Xu, J.; Lv, J.; Bao, F.; Huang, R.; Liu, X.; Evans, R.; Zhao, Y. Response of wood density of Picea crassifolia to climate change in Qilian Mountains of northwestern China. J. Beijing For. Univ. 2011, 33, 115–121. [Google Scholar] [CrossRef]
- Jiao, L.; Wang, S.; Chen, K.; Liu, X. Dynamic response to climate change in the radial growth of Picea schrenkiana in western Tien Shan, China. J. For. Res. 2022, 33, 147–157. [Google Scholar] [CrossRef]
- Abudureheman, R.; Zhang, T.; Wang, Y.; Yu, S.; Zhang, R.; Yuan, Y.; Guo, D. A 219-year reconstruction of April–June mean minimum temperature from the tree-ring earlywood density on the Changbai Mountains, China. Int. J. Climatol. 2023, 43, 6150–6163. [Google Scholar] [CrossRef]
- Liang, H.; Lyu, L.; Wahab, M. A 382-year reconstruction of August mean minimum temperature from tree-ring maximum latewood density on the southeastern Tibetan Plateau, China. Dendrochronologia 2016, 37, 1–8. [Google Scholar] [CrossRef]
- Sun, Y.; Wang, L.; Yin, H. Effects of Climatic Factors on Tree-ring Maximum Latewood Density of Picea schrenkiana in Xinjiang, China. Agric. Sci. Technol. 2016, 17, 1479–1487. [Google Scholar] [CrossRef]
- Dannenberg, M.P.; Wise, E.K.; Smith, W.K. Reduced Tree Growth in the Semiarid United States Due to Asymmetric Responses to Intensifying Precipitation Extremes. Sci. Adv. 2019, 5, eaaw0667. [Google Scholar] [CrossRef]
- Alexander, L.V.; Zhang, X.; Peterson, T.C.; Caesar, J.; Gleason, B.; Klein Tank, A.M.G.; Haylock, M.; Collins, D.; Trewin, B.; Rahimzadeh, F.; et al. Global observed changes in daily climate extremes of temperature and precipitation. J. Geophys. Res. Atmos. 2006, 111, D05109. [Google Scholar] [CrossRef]
- Jiao, L.; Jiang, Y.; Zhang, W.; Wang, M.; Wang, S.; Liu, X. Assessing the stability of radial growth responses to climate change by two dominant conifer trees species in the Tianshan Mountains, northwest China. For. Ecol. Manag. 2019, 433, 667–677. [Google Scholar] [CrossRef]
- Guo, D.; Zhang, T.; Hasimu, T.; Zhang, R.; Yu, S.; Liu, K.; Gou, X.; Liu, R.; Jiahan, S.; Wang, Z.; et al. Radial growth of two coniferous species in the western Kunlun Mountains and its response to climate change. Acta Ecol. Sin. 2022, 42, 10226–10240. [Google Scholar] [CrossRef]
- Xu, K.; Wei, J.; Zhang, Y.; Miao, N.; Peng, T.; Liu, S. Drought in May Inhibited Conifer Growth More Seriously with Climate Warming in the Southeastern Tibetan Plateau. Agric. For. Meteorol. 2025, 375, 110860. [Google Scholar] [CrossRef]
- Liu, Y.; Gou, X.; Zhang, F.; Yin, D.; Wang, X.; Li, Q.; Du, M. Effects of warming on radial growth of Picea crassifolia in the eastern Qilian Mountains, China. Chin. J. Appl. Ecol. 2021, 32, 3576–3584. [Google Scholar] [CrossRef]
- Yan, W.; He, Y.; Cai, Y.; Cui, X.; Qu, X. Analysis of Spatiotemporal Variability in Extreme Climate and Potential Driving Factors on the Yunnan Plateau (Southwest China) during 1960–2019. Atmosphere 2021, 12, 1136. [Google Scholar] [CrossRef]
- Zhang, H.; Immerzeel, W.; Zhang, F.; Kok, R.; Yan, W. 2021. Snow cover persistence reverses the altitudinal patterns of warming above and below 5000 m on the Tibetan Plateau. Sci. Total Environ. 2021, 803, 149889. [Google Scholar] [CrossRef]
- Liu, H.; Yin, Y.; Wang, Q.; He, S. Climatic effects on plant species distribution within the forest–steppe ecotone in northern China. Appl. Veg. Sci. 2014, 18, 43–49. [Google Scholar] [CrossRef]
- Tian, S.; Zhao, S.; Zheng, X.; Wang, Y.; Li, Y. Water source of spruce (Picea schrenkiana) at different altitudes in the Tianshan Mountains during the growing season. Arid Zone Res. 2023, 40, 436–444. [Google Scholar] [CrossRef]
- Wu, X.; Liao, L.; Liu, X.; Xue, R.; Qi, C.; Du, D. Ecological Adaptation of Two Dominant Conifer Species to Extreme Climate in the Tianshan Mountains. Forests 2023, 14, 1434. [Google Scholar] [CrossRef]
- Fang, Y.; Liang, Z.; Zhang, Y.; Shi, Q.; Sun, X.; Li, J.; Li, X.; Dong, Z. Characteristics of Altitudinal Gradient Changes in Water Retention of Tianshan Spruce Forest Ecosystems. Ecol. Environ. Sci. 2023, 32, 1574–1584. [Google Scholar] [CrossRef]
- Wang, J.; Yang, B.; Ljungqvist, F.C.; Zhao, Y. The Relationship Between the Atlantic Multidecadal Oscillation and Temperature Variability in China During the Last Millennium. J. Quat. Sci. 2013, 28, 653–658. [Google Scholar] [CrossRef]
- Xu, G.; Liu, X.; Qin, D.; Chen, T.; Sun, W.; An, W.; Wang, W.; Wu, G.; Zeng, X.; Ren, J. Drought history inferred from tree ring δ13C and δ18O in the central Tianshan Mountains of China and linkage with the North Atlantic Oscillation. Theor. Appl. Climatol. 2014, 116, 385–401. [Google Scholar] [CrossRef]
- Li, T. Climatological Study Based on Tree-Ring Multiproxy in the Tianshan Mountains, East Central Asia. Ph.D. Thesis, Institute of Earth Environment, Chinese Academy of Sciences, Xi’an, China, 2023. [Google Scholar] [CrossRef]
Disclaimer/Publisher’s Note: The statements, opinions and data contained in all publications are solely those of the individual author(s) and contributor(s) and not of MDPI and/or the editor(s). MDPI and/or the editor(s) disclaim responsibility for any injury to people or property resulting from any ideas, methods, instructions or products referred to in the content. |
© 2025 by the authors. Licensee MDPI, Basel, Switzerland. This article is an open access article distributed under the terms and conditions of the Creative Commons Attribution (CC BY) license (https://creativecommons.org/licenses/by/4.0/).