Article

Modeling the Climate-Driven Spread of Pine Wilt Disease for Forest Pest Risk Assessment and Management Using MaxEnt

1
Division of Environmental Forest Science, Gyeongsang National University, Jinju 52828, Republic of Korea
2
Institute of Agriculture and Life Science, Gyeongsang National University, Jinju 52828, Republic of Korea
*
Author to whom correspondence should be addressed.
Forests 2025, 16(11), 1677; https://doi.org/10.3390/f16111677
Submission received: 7 August 2025 / Revised: 22 September 2025 / Accepted: 1 November 2025 / Published: 3 November 2025
(This article belongs to the Special Issue Management of Forest Pests and Diseases—3rd Edition)

Abstract

Pine wilt disease (PWD), caused by the invasive nematode Bursaphelenchus xylophilus, poses a growing threat to East Asian coniferous forests, which is further exacerbated by climate change. While studies have successfully applied Maximum Entropy (MaxEnt) models to map the potential spread of PWD, they have primarily focused on broad spatial scales and climatic factors. This highlights the need for fine-scale, integrative modeling approaches that also account for environmental and anthropogenic factors. Therefore, we applied the MaxEnt model combined with change vector analysis to evaluate the spatial risk and potential future spread of PWD in Andong-si, Republic of Korea, under the SSP1-2.6 climate scenario. We integrated forest structure, soil conditions, topography, climate variables, and anthropogenic factors to generate high-resolution risk maps and identify the most influential environmental drivers. Notably, we demonstrated that historical infection proximity and isothermality strongly influence habitat suitability. We also, for the first time, projected an eastward shift of high-risk areas in Andong-si under future climate conditions. These findings provide timely insights for designing proactive surveillance networks, implementing risk-based monitoring, and developing climate-resilient management strategies. Our integrative modeling framework offers decision-support tools that can enhance early detection and targeted interventions against invasive forest pests under environmental change.

1. Introduction

Pine wilt disease (PWD), caused by the invasive pine wood nematode Bursaphelenchus xylophilus, poses a critical threat to pine ecosystems worldwide, including those in the Republic of Korea, where it has led to substantial ecological degradation and economic losses [1,2,3]. Considering its widespread impact, PWD has emerged as a global forest health concern and is now subject to intensive control measures across more than 40 countries [4]. The disease is mainly transmitted via insect vectors, particularly longhorn beetles (Monochamus spp.) [5], and primarily affects major native species such as Pinus densiflora, P. koraiensis, and P. thunbergii [6,7,8], which collectively represent a dominant share of Korean coniferous forests [9].
Despite various management strategies implemented by national forestry authorities [10], the spread of PWD continues to exhibit spatial heterogeneity and temporal variability [9,11,12,13]. Recent outbreaks, such as the surge to over one million infected trees in 2022, have renewed the urgency for more effective, predictive, and adaptive disease management strategies [9]. Therefore, predictive modeling tools are required to anticipate PWD spread and inform spatially targeted interventions.
Species distribution models (SDMs) have emerged as valuable tools for understanding and predicting the potential spread of pests and diseases by analyzing their relationships with environmental and climatic conditions [14,15,16]. Among these, the Maximum Entropy (MaxEnt) model has gained prominence owing to its robust predictive capacity with presence-only data. MaxEnt has been widely used to model the distribution of plant pests and pathogens [17,18,19]. It has also been applied in several PWD-related studies across East Asia, demonstrating its relevance in forestry health risk mapping under climate change [20,21,22].
However, most existing studies have focused on large-scale assessments that rely primarily on climatic variables [23,24,25,26], potentially overlooking the complex interplay between ecological, topographic, and anthropogenic factors affecting PWD incidence. Furthermore, modeling at broader geographic scales often incorporates unsuitable land cover types, such as urban areas or agricultural land, thereby limiting the precision of the model in forest-specific contexts [23,24,25,26]. In particular, stand density and forest structure significantly influence vector movement and the transmission dynamics of Monochamus spp. [27], highlighting the importance of incorporating forest variables in habitat prediction models. Moreover, soil moisture and texture are important environmental factors affecting the incidence and progression of PWD [28,29]. Overall, these data suggest the need to advance beyond climate-only approaches.
To address this gap in the literature, the present study developed a more context-specific and integrative modeling approach for PWD. Therefore, we focused on Andong-si (a city) in Gyeongsangbuk-do (a province), Republic of Korea [30], an area that is highly affected by this disease, and incorporated a comprehensive suite of environmental variables, including forest stand structure, soil characteristics, and proximity to human activity, alongside climatic predictors. To enhance spatial precision and practical relevance, we utilized a statistically representative sampling design [31] and focused on a sub-regional (city-level) scale rather than broader national models. We predicted the spatial distribution of PWD under current and future climate scenarios (SSP1-2.6), and analyzed the directionality of potential habitat shifts using change vector analysis (CVA). This approach enabled us to identify forest areas at high risk and anticipate the spatial trajectory of disease spread, providing important insights for supporting sustainable pest management.
This study exemplifies the practical integration of pest modeling with spatial planning in real-world forestry contexts, directly supporting the core aims of this Special Issue on sustainable agriculture and disease model application. The findings serve as a decision-support tool for forest managers and policymakers, enabling them to design proactive, climate-resilient control strategies and to address emerging challenges in pest dynamics driven by environmental change.

2. Materials and Methods

2.1. Study Area and Data Collection

2.1.1. Study Area

This study was conducted in Andong-si in the Republic of Korea. As of the end of 2023, Gyeongsangbuk-do accounted for approximately 44% of all PWD-infected trees in the Republic of Korea [9]. According to the most recent data from the end of 2022, Andong-si contained 28% of the PWD-infected trees within Gyeongsangbuk-do [30]. Andong-si is located in the northern inland mountainous region of Gyeongsangbuk-do and has the highest incidence of PWD within the province. Notably, it exemplifies the typical forest structure, including extensive pine forests and mixed stands, commonly found in the Republic of Korea (Figure 1).

2.1.2. Data Source

The PWD occurrence point data were collected from the 2023 Andong-si PWD control data provided by the Korea Forestry Promotion Institute. From an initial dataset of 129,121 points, we randomly selected 4200 points using Cochran’s formula [31], ensuring a 99% confidence level and 2% margin of error. This method ensures a statistically representative sample and robust data collection. The formula is presented in Equation (1):
n = Z 2 × P × ( 1 P ) d 2
where n is the required sample size, Z is the Z -score corresponding to the desired confidence level (2.576), P is the estimated proportion of prevalence of the characteristic investigated in the population (assumed to be 0.5 for maximum variability), and d is the desired margin of error.
To establish the candidate variables for analyzing potential PWD habitats, we first considered P. densiflora, P. koraiensis, and P. thunbergii, which are the primary tree species susceptible to PWD in the Republic of Korea [6,7,8]. To reflect the distribution of these species, we extracted data from the forest type maps generated by the Korea Forest Service (KFS). We classified stands dominated by P. densiflora, P. koraiensis, and P. thunbergii as susceptible pine areas, whereas other forest types were treated as non-susceptible. We incorporated this categorical classification as a candidate variable in the MaxEnt model. As the spread distance of vectors, such as Monochamus spp., is related to the stand density [27], we also extracted the stand density from forest type maps as another candidate variable. Considering the correlation between PWD infection and moisture [28,29], we extracted soil moisture and soil texture from forest soil maps provided by the KFS. Additionally, we utilized lake and reservoir data from the National Geographic Information Institute (NGII) to calculate Euclidean distances between each analysis unit and the nearest water body. This variable represents proximity to water bodies and was included to capture potential effects of local moisture and microclimatic conditions on PWD dynamics, rather than the ecology of aquatic insects. Altitude, aspect, and slope affect both the ecology of vector insects and pine trees that serve as their host plants [32,33,34]. Therefore, we utilized topographic maps from the NGII to develop a digital elevation model (DEM), and subsequently extracted data on altitude, aspect, and slope.
The natural dispersal range of PWD vectors is limited; however, human activities, particularly the transport of infested dead trees, significantly contribute to the nationwide spread of the disease [35]. In the Republic of Korea, forests cover approximately 63% of the national territory; however, most of this area is mountainous and difficult to access. Consequently, infested trees are most likely to be harvested and removed from stands located near roads. Therefore, we derived proximity layers for roads and buildings by computing Euclidean (straight-line) distances from each grid cell to the nearest feature, using spatial data from the Ministry of the Interior and Safety. We included road proximity to account for the risk of infested trees being transported out of forest areas and used building proximity to reflect the potential utilization of infested trees as household resources. Although standard sanitation measures require infested trees to be destroyed at the site of detection, the unintentional removal or local use of infested wood remains a concern. The distance from infected trees in the previous year is also an important factor for determining the distribution of high PWD risk regions in the Republic of Korea [36]. Therefore, using data on the locations of PWD infections in 2022 (from the Korea Forestry Promotion Institute), we constructed historical proximity data by calculating straight-line distances to the nearest infected sites.
We obtained climate and bioclimate variables from WorldClim version 2.1 (https://www.worldclim.org (accessed on 2 April 2025)). We utilized historical climate data (1970–2000) and future climate data (2021–2040 and 2041–2060) from the Shared Socioeconomic Pathways (SSPs), specifically the SSP1-2.6 scenario. We established baseline variables using average temperature, precipitation, and bioclimate variables. For the mean temperature, we used data from February, April, May, and September [37], and added July and August, which are the hottest months in the Republic of Korea. For precipitation, we used data from May and June [37], and included July and August, which are the months with the heaviest rainfall in the Republic of Korea. Finally, we derived candidate variables from the 19 bioclimate variables that are the most commonly used in studies of species distribution characteristics and other insects [18]. Processing and analysis of geographical data, including candidate variable construction, were conducted using ArcGIS Pro 3.0.0 (ESRI Inc., Redlands, CA, USA) and Python 3.13 (Python Software Foundation, Beaverton, OR, USA). All data had a spatial resolution of 30 arc-seconds (approximately 1 km at the equator).

2.1.3. Final Variable Selection

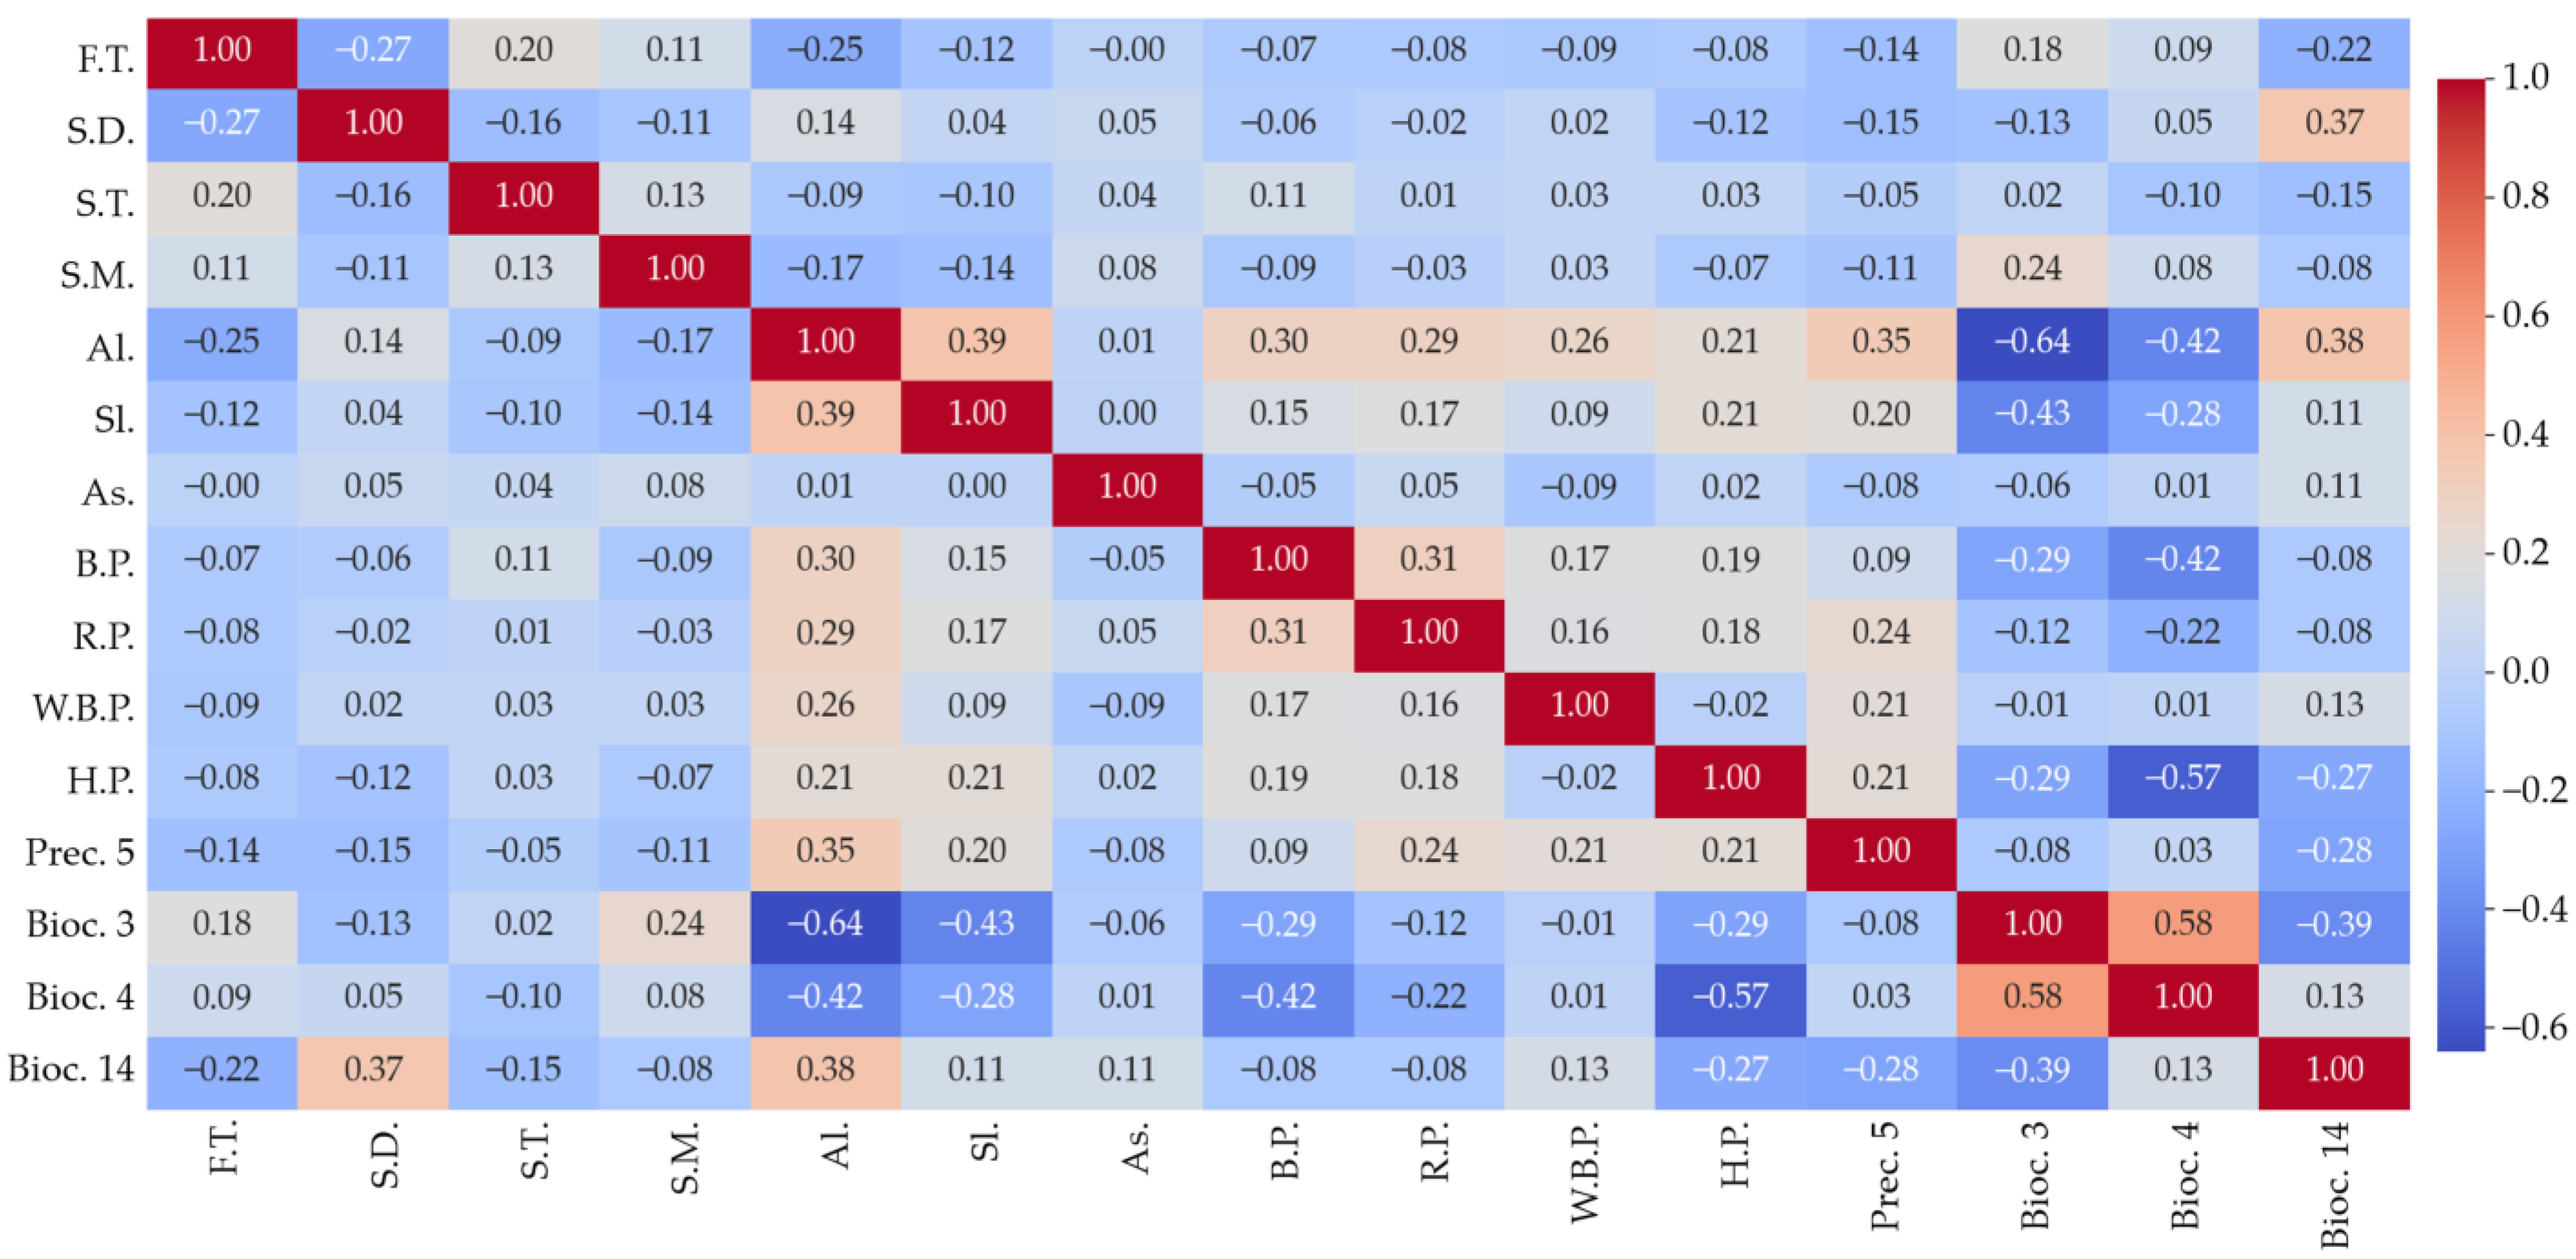
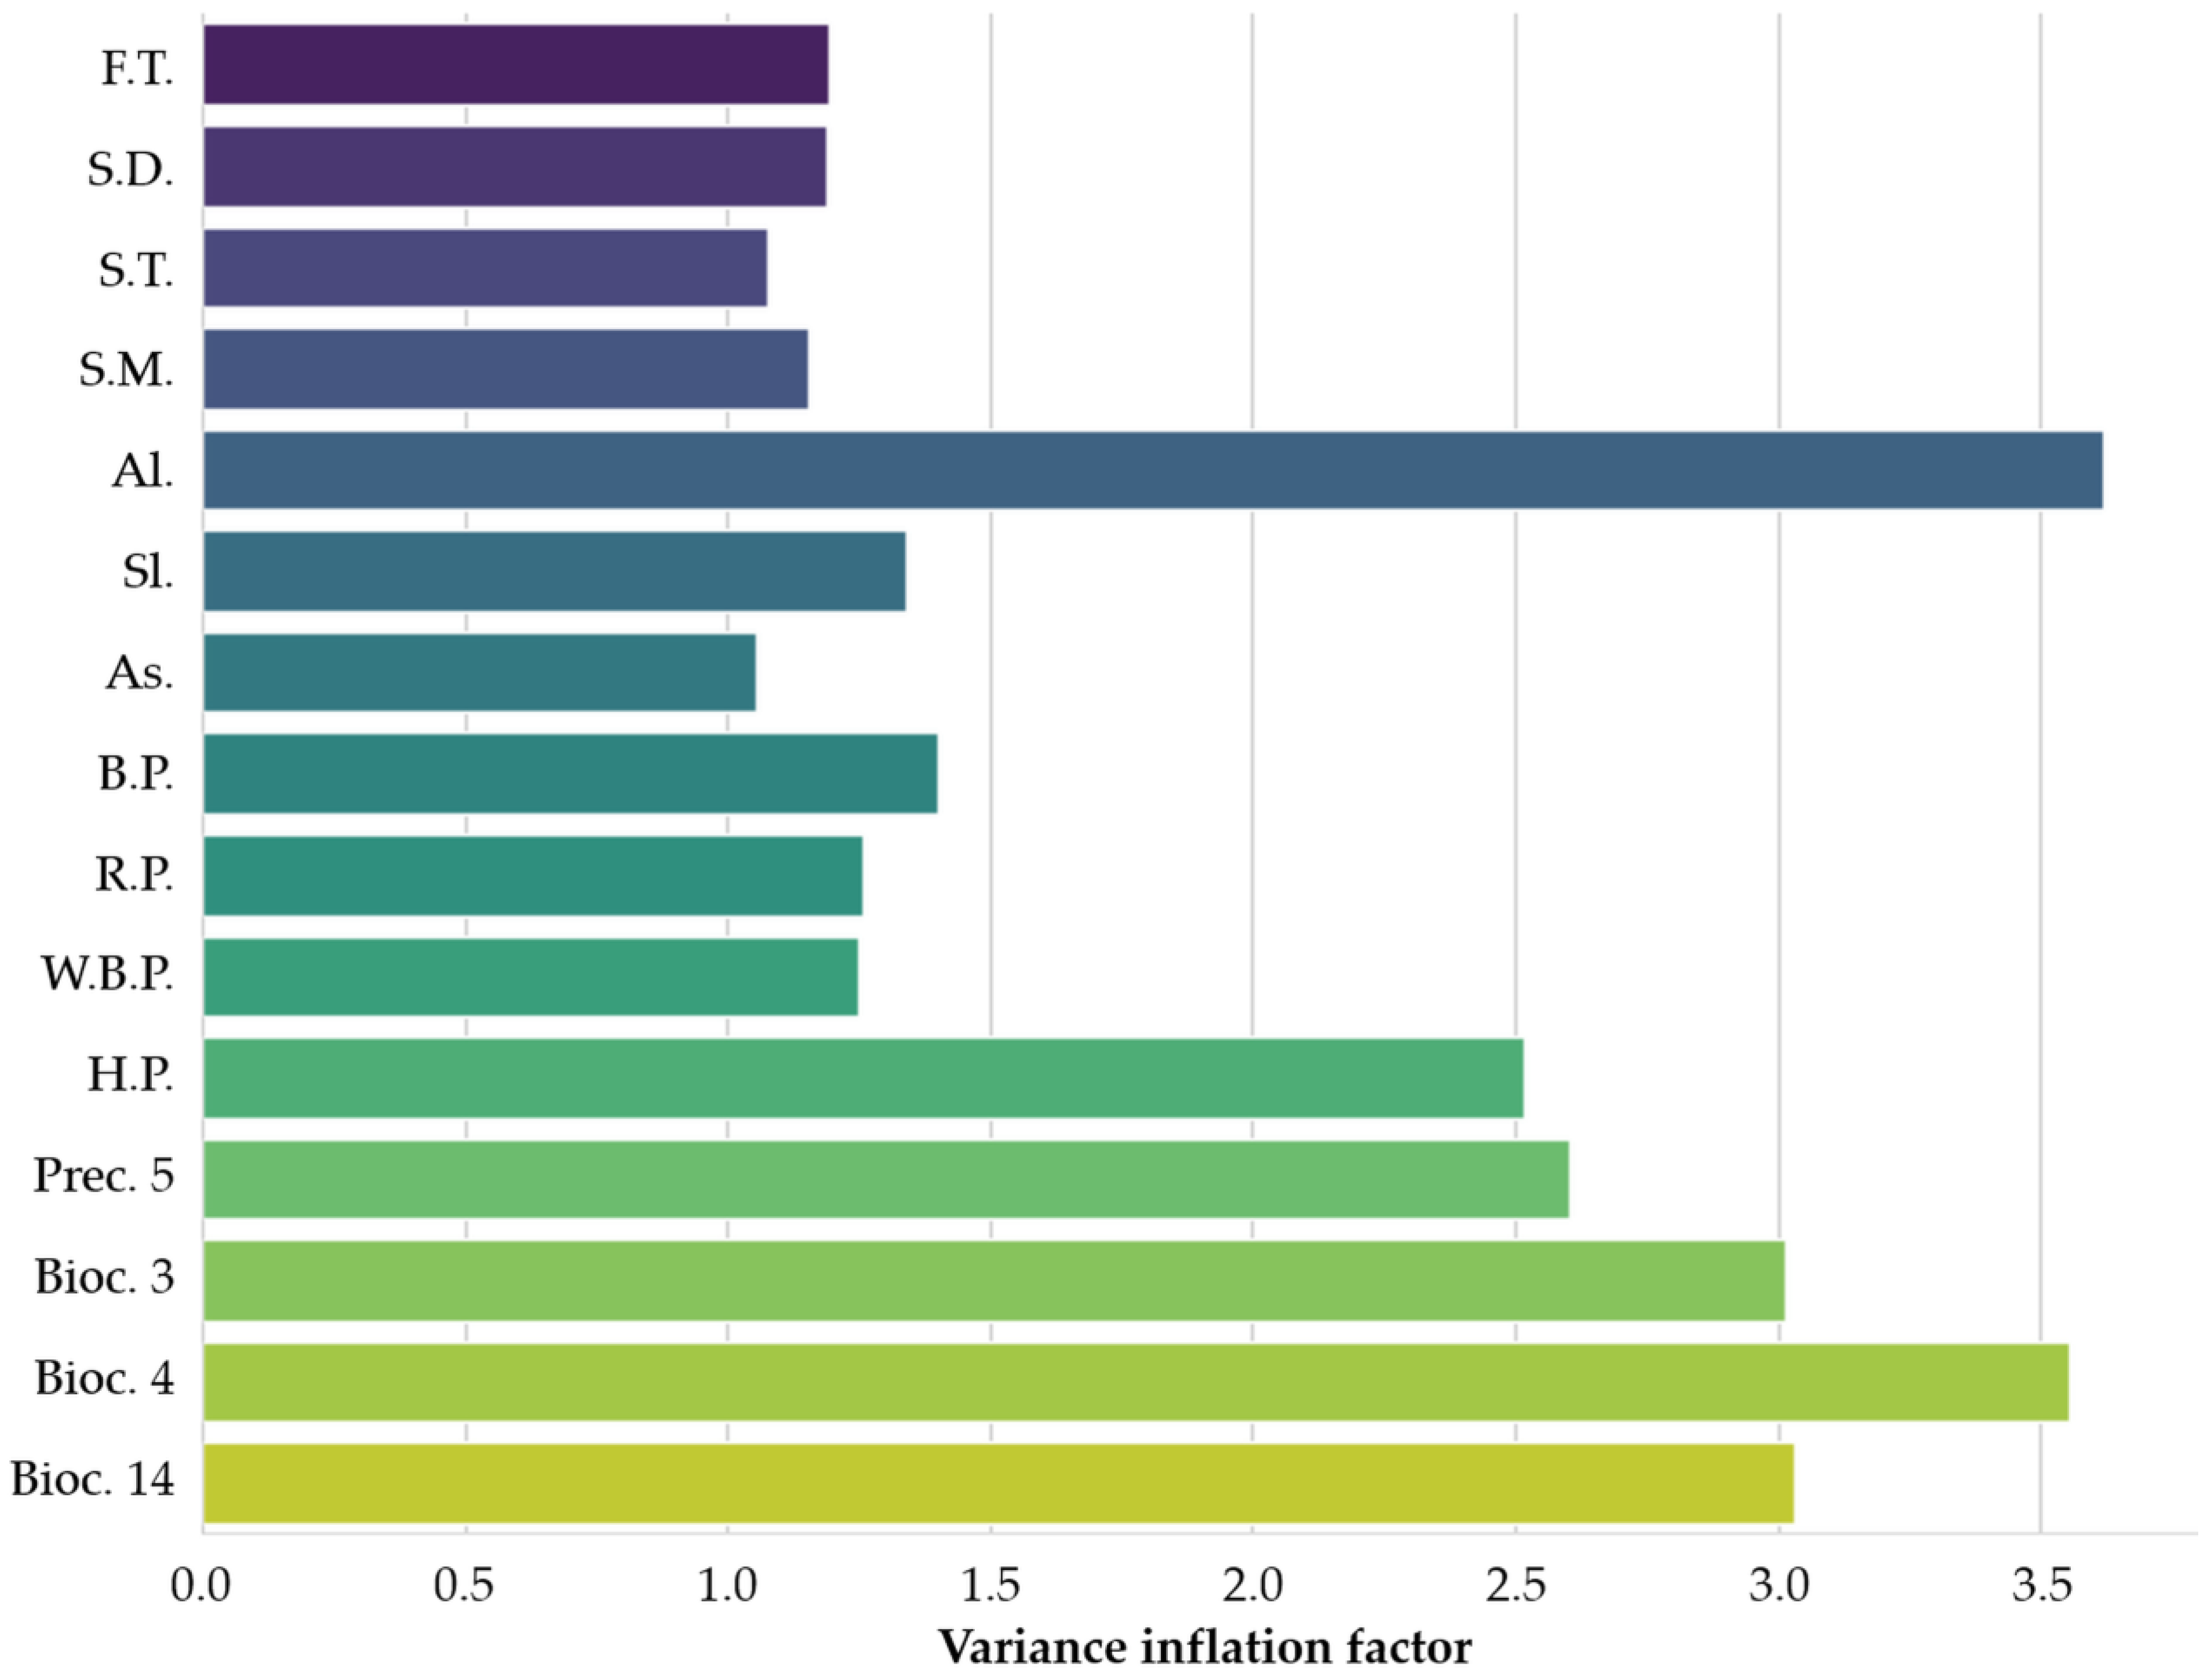
We initially compiled 40 candidate variables to represent environmental, climatic, topographic, and anthropogenic factors potentially influencing PWD occurrence. To enhance model representativeness and predictive reliability, we conducted Spearman’s correlation analysis [21] and excluded variables with an absolute correlation coefficient >0.7 [38] (Appendix A, Figure A1). We further assessed multicollinearity using the variance inflation factor (VIF) analysis [26] (Appendix A, Figure A2). Following the correlation and VIF analyses, we excluded 25 variables and retained the remaining 15 variables for MaxEnt modeling; these variables are hereafter referred to as final variables (Table 1).
This selected set of final variables was designed to capture multifactorial influences on disease distribution based on prior findings emphasizing the importance of forest stand structure, soil moisture, and proximity to human activity in PWD dynamics [23,24,25]. To provide ecological justification for the retained climatic predictors, Bioc. 3 (isothermality) reflects the relative variability between diurnal and annual temperature ranges, influencing pine stress physiology and vector activity. Bioc. 4 (temperature seasonality) captures the degree of seasonal temperature fluctuation, affecting nematode reproduction and the timing of Monochamus spp. vector emergence. Bioc. 14 (precipitation of driest month) represents drought stress, which impairs host defenses and increases susceptibility to PWD. These climatic factors have been highlighted as important determinants of PWD occurrence and spread in previous studies [23,24,25].
All statistical analyses for variable selection were conducted using SPSS version 21 (IBM Inc., Armonk, NY, USA).

2.2. Model and Analytical Methods

2.2.1. MaxEnt Model Selection and Performance Assessment

The MaxEnt model captured various species–environment interactions, from simple linear to highly complex nonlinear relationships, using six feature classes (FCs): linear, quadratic, product, hinge, threshold, and categorical [39]. In this study, we adopted the MaxEnt model to meet the practical needs of administrative forestry planning in the Republic of Korea, where annual PWD management must be developed under time constraints. To facilitate rapid yet interpretable modeling at an initial exploratory stage, we set the feature classes to “auto features,” and fixed the regularization multiplier (RM) at 1. We selected this default configuration to reflect operational conditions and provide timely decision support for forest pest control efforts.
We assessed model performance using a combination of the following metrics: (1) the relative contribution and permutation importance of each variable; (2) a Jackknife test for variable importance; and (3) 10-fold cross-validation to evaluate predictive accuracy. We calculated the area under the curve (AUC) as a summary metric for model discrimination, with higher values indicating better predictive performance [26].
We conducted all modeling procedures using MaxEnt software, version 3.4.4 (American Museum of Natural History, New York, NY, USA).

2.2.2. Scenario Setting and Analysis

We predicted the distribution of potential PWD habitats in 2023. We selected the SSP1-2.6 scenario, as it represents a low-emission and sustainability-oriented pathway consistent with climate mitigation strategies and the carbon-neutral policy in the Republic of Korea. Therefore, we predicted the distributions of potential habitats in the near future (2021–2040) and far future (2041–2060).
Based on the predicted results, we analyzed the changes in distribution and direction of movement of potential PWD habitats in the near future, far future, and post-near future (defined as the far future relative to the near future) compared with those of the present. To analyze the change in distribution, we calculated differences in the paired raster pixel values, with positive values indicating an increase in potential habitats and negative values indicating a decrease.
To analyze the shift in the distribution, we performed CVA using the spatial analysis tools in ArcGIS Pro 3.0.0 (arcpy library, Python 3.9 environment). We applied CVA to calculate the change vectors between two time points for each pixel and analyze the mean direction of change, enabling integrative assessment of both magnitude and direction [40,41]. The resulting directional vectors of habitat shifts can inform targeted surveillance and control programs by highlighting regions likely to face increased future risk under changing climatic conditions.

3. Results

3.1. Distribution of Potential PWD Habitats Using MaxEnt

3.1.1. Evaluation of Final Variables

We analyzed potential PWD habitats using 4200 points of PWD infections (2023) and 15 final variables. We also evaluated the contribution and importance of each of the 15 variables.
Among the 15 final variables used in the MaxEnt model, historical proximity (H.P.) exhibited the highest contribution (30.6%) and importance (30.0%), followed by isothermality (Bioc. 3), precipitation of the driest month (Bioc. 14), and soil texture (S.T.) (Table 2). These findings suggest that proximity to prior-year infection sites and thermal stability are key determinants influencing potential PWD habitat distribution.
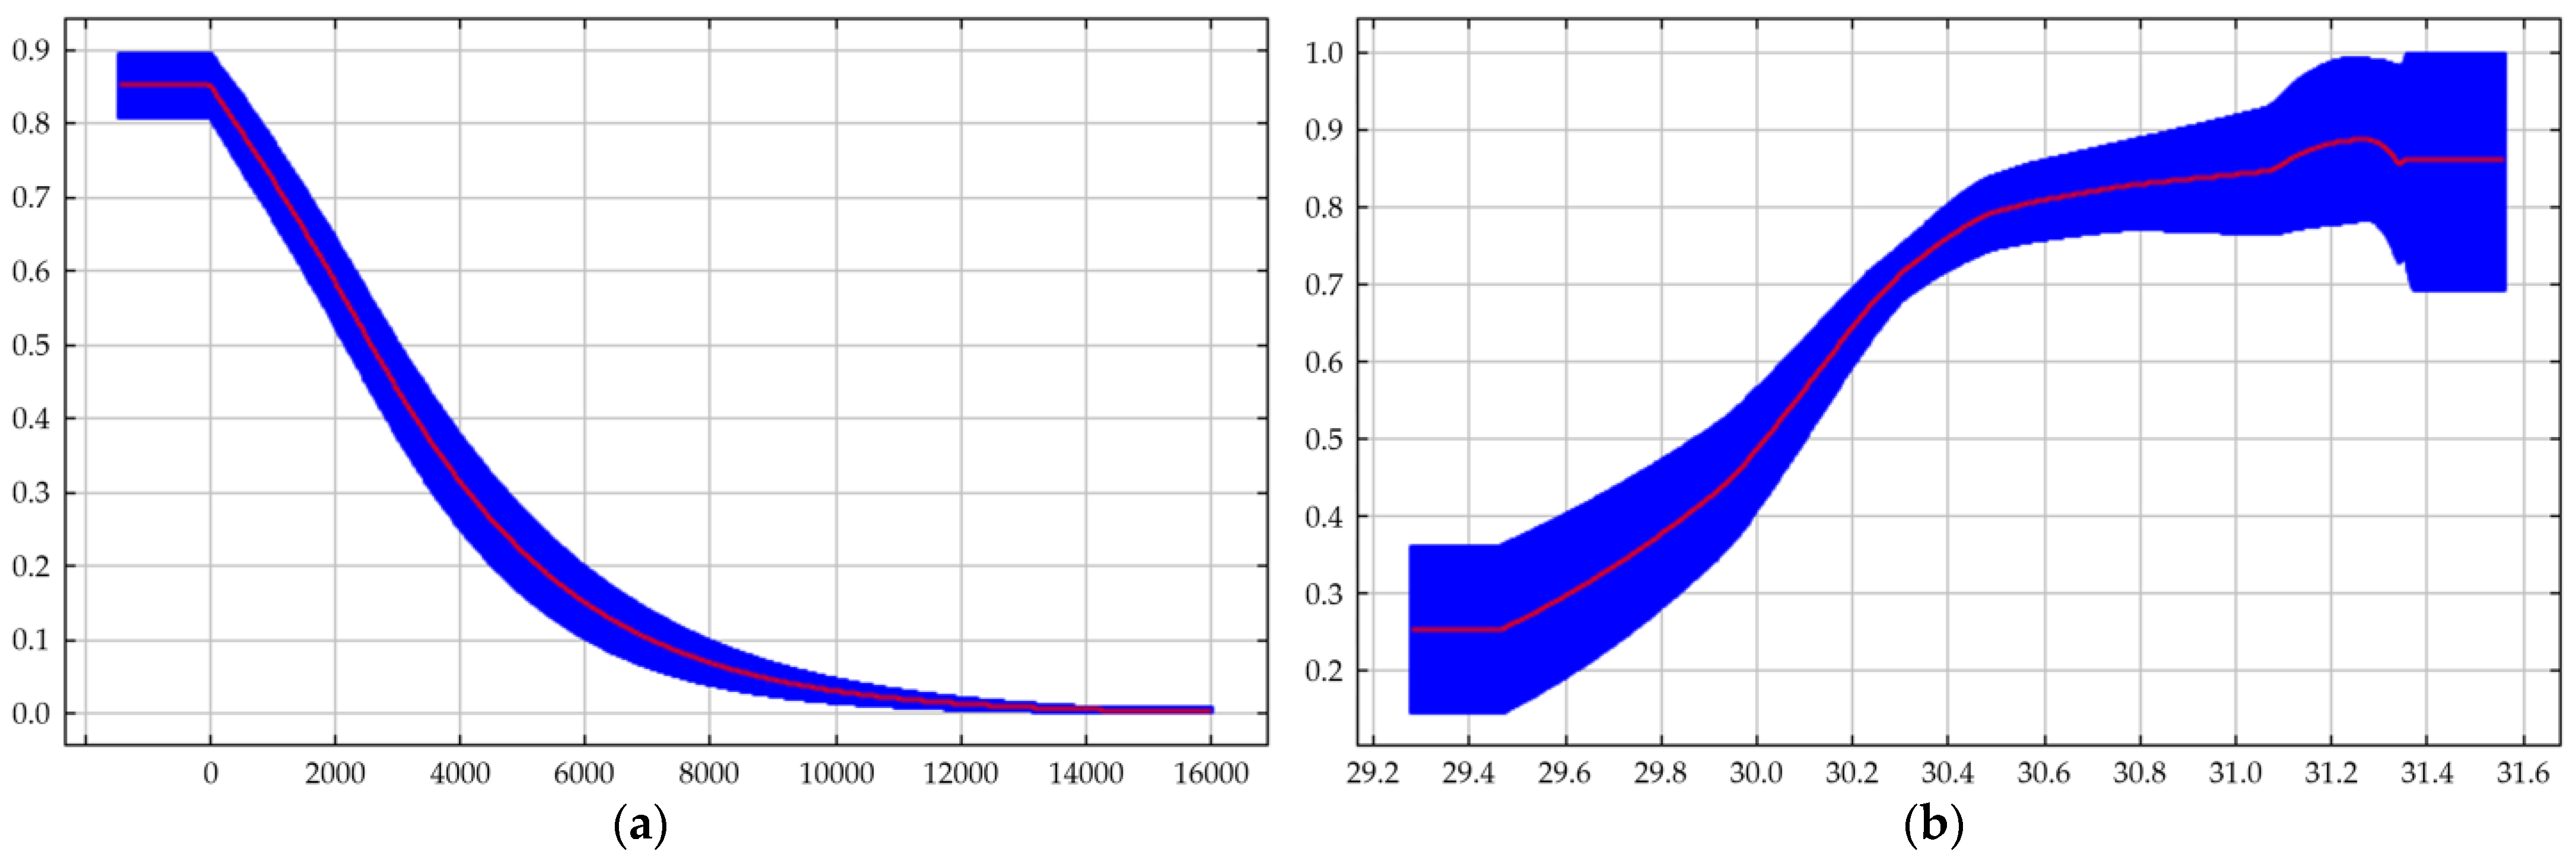
The response curves for the two most influential variables, historical proximity (H.P.) and isothermality (Bioc. 3), revealed contrasting effects on habitat suitability. For H.P., the predicted probability of PWD occurrence decreased as the distance from 2022 infection sites increased, indicating a strong distance-decay effect (Figure 2a). In contrast, elevated values of Bioc. 3 were positively associated with increased infection likelihood, suggesting that areas with more stable temperatures may favor the persistence or spread of PWD (Figure 2b).

3.1.2. Jackknife Validation

Consistent with the contribution analysis, Jackknife validation confirmed the critical importance of H.P., Bioc. 3, and Bioc. 14 (Figure 3). These results reinforce the sensitivity of the model to prior outbreak patterns and specific climatic conditions.

3.1.3. Evaluating Accuracy

The MaxEnt model exhibited reliable predictive accuracy, yielding a mean AUC of 0.794 (standard deviation = 0.016) across 10-fold cross-validation, indicating good model quality for species distribution prediction (Figure 4).

3.2. Changes in the Distribution of Potential PWD Habitats

Using the final set of 15 selected variables, we mapped the potential PWD habitats in Andong-si, Republic of Korea, for the year 2023 (Figure 5a). We used WorldClim (ver. 2.1) climate and bioclimate data (Prec. 5, Bioc. 3, 4, 14) as final variables to analyze the potential PWD habitats. Based on the SSP1-2.6 scenario, Figure 5b depicts potential habitats in the near future (2021–2040), whereas Figure 5c presents potential habitats in the far future (2041–2060).
Using maps of potential PWD habitat distribution (Figure 5), we analyzed changes in the distribution in the near future, far future, and post-near future relative to the present (2023). Spatial projections under the SSP1-2.6 scenario indicated an 8.0% net increase in potential PWD habitats in the near future (2021–2040), followed by a 3.1% net decrease in the far future (2041–2060). The post-near-future comparison also exhibited a decline of 8.8%, suggesting that while short-term risk may increase, long-term contraction or redistribution may occur (Table 3).

3.3. Direction of Movement of the Distribution of Potential PWD Habitats

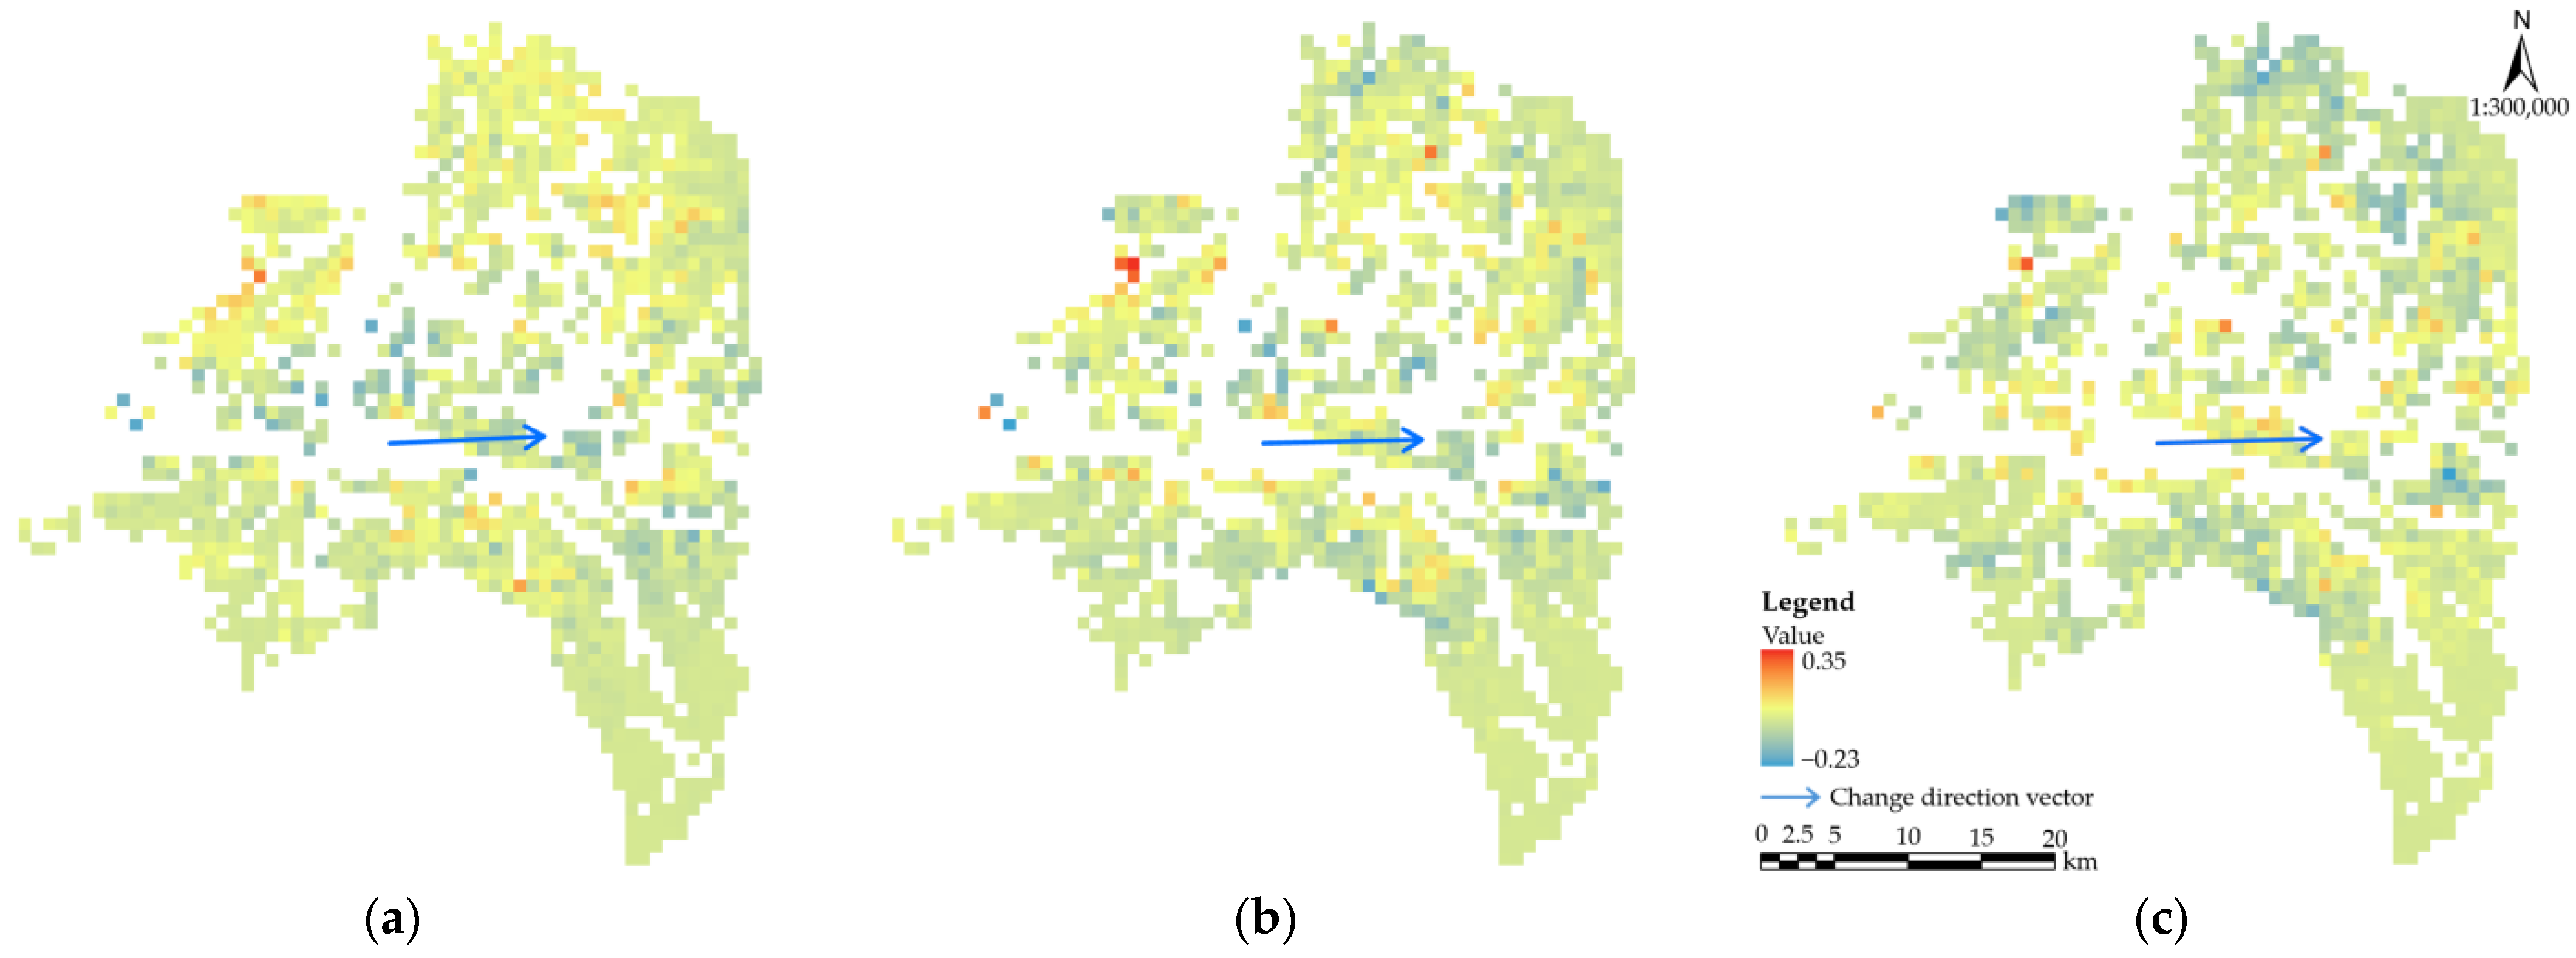
CVA revealed a consistent eastward shift in potential habitat distribution across all future scenarios, with 87.4° in the near future (Figure 6a), 88.7° in the far future (Figure 6b), and 88.5° in the post-near future (Figure 6c). This directional trend highlights the potential geographic expansion of PWD risk into eastern forest regions, serving as a spatial dispersal model to infer future disease trajectories.
These results provide spatially explicit insights that can inform climate-resilient pest surveillance and early intervention planning, aligning with the broader goal of integrating predictive modeling into sustainable and adaptive forest pest management practices.

4. Discussion

Previous studies on the distribution of PWD have primarily relied on climatic predictors at broader scales, limiting their applicability to localized management [21,26,42,43,44]. In contrast, in the present study, we employed the MaxEnt model to predict potential PWD habitats at a fine spatial resolution in Andong-si, integrating a diverse set of environmental, ecological, and anthropogenic variables. This approach allowed for more context-specific and operationally relevant risk mapping, contributing to the objective of proactive pest management under climate uncertainty.
In the present study, we identified historical proximity (H.P.) as a key contributor to the model, highlighting the strong spatial autocorrelation of PWD spread. The finding is consistent with the known epidemiological patterns of vector-mediated transmission [37,38]. Similarly, isothermality (Bioc. 3) was identified as a major climatic factor, aligning with prior studies that emphasized the importance of thermal stability for PWD persistence and vector activity [21,23].
Under the SSP1-2.6 scenario, the spatial projections revealed a notable eastward shift in potential PWD habitats over time. This directional change, quantified through CVA, has critical implications for forest health monitoring and localized intervention strategies. Specifically, targeted surveillance in eastern regions may improve early detection and containment efforts. In particular, forest districts adjacent to current high-risk zones should be prioritized for monitoring and resource allocation, enabling timely intervention before the disease becomes established. These findings provide actionable guidance forestry agencies to optimize surveillance and control strategies across newly emerging high-risk areas. Notably, the integration of CVA with MaxEnt modeling enhances risk prediction and serves as an effective dispersal modeling approach under climate change scenarios.
We observed contrasting trends in this study: an increase in potential PWD habitats in the near future, followed by a decline in the far future, likely reflecting ecological constraints on long-term expansion. Possible explanations include vector limitation (restricted dispersal capacity of Monochamus spp.), climatic saturation (reduced habitat gains once optimal thermal thresholds are exceeded), and host availability (finite distribution of susceptible pine species). These interacting factors suggest that short-term climate change may temporarily expand PWD suitability, whereas long-term trajectories could involve contraction or redistribution of risk zones.
We applied default settings in the MaxEnt model (i.e., auto features and RM = 1) to ensure simplicity and interpretability for timely decision-making in forestry operations. While this approach provides a useful initial assessment, future studies should incorporate optimization of feature classes (FCs) and regularization multipliers (RMs) to enhance model precision [21,39,45,46]. Comparative analysis across multiple climate scenarios, beyond SSP1-2.6, would also provide more comprehensive insights into long-term distribution dynamics and emerging risk zones. Additionally, integrating vector population dynamics and accounting for potential differences in host susceptibility among pine species would further enhance the accuracy of PWD risk projections. Collectively, these improvements would enable more reliable identification of future high-risk areas, supporting targeted monitoring, early detection, and efficient allocation of management resources.
Overall, our results provide spatially explicit insights that support targeted monitoring, risk assessment, and early intervention in forest pest control. By offering a scalable decision-support tool, we inform surveillance strategies in Andong-si and in other regions facing similar pest threats. Our study also contributes to the Special Issue on Management of Forest Pests and Diseases (3rd Edition) [47], as it linked species distribution modeling with surveillance planning.
Beyond the methodological implications, our findings underscore the importance of integrating predictive modeling into climate-resilient pest management strategies. Anticipating eastward shifts in high-risk areas can inform proactive surveillance networks, early eradication campaigns, and resource allocation tailored to future risk hotspots. Such measures are increasingly critical under climate change, where rising temperatures and altered precipitation patterns may exacerbate the spread of invasive pests [23,24,25].
The socioeconomic consequences of PWD are also noteworthy, as the loss of pine forests threatens timber resources, rural livelihoods, and cultural landscapes while increasing management costs for local authorities [34,44]. Similar studies in China and Japan have also reported climate-driven habitat expansions and emphasized the need for adaptive forest health strategies [21,23,25]. Within this broader context, our study contributes to the expanding body of evidence supporting integrated pest risk management across East Asia and highlights the urgent need to address climate-sensitive forest diseases from both ecological and socioeconomic perspectives.

Author Contributions

Conceptualization, M.H., C.L. and H.K.; methodology, M.H., C.L. and H.K.; software, H.K.; validation, M.H. and H.K.; formal analysis, M.H. and H.K.; investigation, C.L., M.H. and H.K.; resources, C.L. and H.K.; data curation, C.L., M.H. and H.K.; writing—original draft preparation, M.H. and H.K.; writing—review and editing, H.K.; visualization, H.K.; supervision, H.K.; project administration, H.K.; funding acquisition, M.H. and H.K. All authors have read and agreed to the published version of the manuscript.

Funding

This research received no external funding.

Institutional Review Board Statement

Not applicable.

Data Availability Statement

The original contributions presented in this study are included in the article. Further inquiries can be directed to the corresponding author.

Conflicts of Interest

The authors declare no conflicts of interest.

Abbreviations

The following abbreviations are used in this manuscript:
AUCArea Under the Curve
Al.Altitude
As.Aspect
B.P.Building Proximity
Bioc. 3Bioclimate Variable 3: Isothermality
Bioc. 4Bioclimate Variable 4: Temperature Seasonality
Bioc. 14Bioclimate Variable 14: Precipitation of Driest Month
CVAChange Vector Analysis
DEMDigital Elevation Model
ESRIEnvironmental Systems Research Institute
F.T.Forest Type
FCsFeature Classes
H.P.Historical Proximity
KFSKorea Forest Service
MaxEntMaximum Entropy
NGIINational Geographic Information Institute
PWDPine Wilt Disease
Prec. 5May Precipitation
R.P.Road Proximity
RMsRegularization Multipliers
ROCReceiver Operating Characteristic
S.D.Stand Density
S.M.Soil Moisture
S.T.Soil Texture
SDStandard Deviation
SSPShared Socioeconomic Pathways
VIFVariance Inflation Factor
W.B.P.Water Body Proximity

Appendix A

Figure A1. Heatmap of Spearman’s correlation coefficients between the final variables.
Forests 16 01677 g0a1
Figure A2. Variance inflation factors (VIFs) for the selected final variables.
Forests 16 01677 g0a2

References

  1. Ye, J.-r. Epidemic status of pine wilt disease in China and its prevention and control techniques and counter measures. Sci. Silvae Sin. 2019, 55, 1–10. [Google Scholar]
  2. Faria, J.M.; Sousa, E.; Bonifácio, L.; Carrasquinho, I.; Varela, A.R.; Inácio, M.L. Bursaphelenchus. In Compendium of Phytopathogenic Microbes in Agro-Ecology: Vol. 3, Bacteria, Protozoa, Algae and Nematodes; Springer: Berlin/Heidelberg, Germany, 2025; pp. 353–386. [Google Scholar]
  3. Futai, K.; Ishiguro, H. Hidden Threats: The Unnoticed Epidemic System of Pine Wilt Disease Driven by Sexually Mature Monochamus Beetles and Asymptomatic Trees. Biology 2025, 14, 485. [Google Scholar] [CrossRef] [PubMed]
  4. Tóth, Á. Bursaphelenchus xylophilus, the pinewood nematode: Its significance and a historical review. Acta Biol. Szeged. 2011, 55, 213–217. [Google Scholar]
  5. Dwinell, L.D. An Overview of the Pine Wood Nematode Ban in North America. Available online: https://play.google.com/books/reader?id=mfy537QflSgC&pg=GBS.PA4&hl=en (accessed on 1 August 2025).
  6. Kwon, T.-S.; Lim, J.-H.; Sim, S.-J.; Kwon, Y.-D.; Son, S.-K.; Lee, K.-Y.; Kim, Y.-T.; Park, J.-W.; Shin, C.-H.; Ryu, S.-B. Distribution patterns of Monochamus alternatus and M. saltuarius (Coleoptera: Cerambycidae) in Korea. J. Korean Soc. For. Sci. 2006, 95, 543–550. [Google Scholar]
  7. Han, H.; Chung, Y.-J.; Shin, S.-C. First report of pine wilt disease on Pinus koraiensis in Korea. Plant Dis. 2008, 92, 1251. [Google Scholar] [CrossRef]
  8. Kim, M.-J.; Kim, J.; Yoo, N.S.; Jung, J.-K. Spatiotemporal Dynamics of Trunk-Injected Pesticide Residue for Management of Pine Wilt Disease in Pinus koraiensis. Forests 2024, 15, 1996. [Google Scholar] [CrossRef]
  9. Korea Forest Service. 2024 Statistical Yearbook of Forestry; Korea Forest Service: Daejeon, Republic of Korea, 2024; pp. 140–141, 178.
  10. Korea Forest Service. Plan for the Surveillance and Control of Forest Pests and Diseases. Available online: https://www.forest.go.kr/kfsweb/cop/bbs/selectBoardArticle.do?bbsId=BBSMSTR_1069&mn=NKFS_06_09_01&nttId=3203081 (accessed on 1 August 2025).
  11. Kwon, K.C.; Han, S.A.; Lee, D.K.; Jung, I.K.; Seo, Y.J.; Hong, E.P.; Choi, H.S. The site characteristics and stand structure of Pinus densiflora Forests in the Republic of Korea. J. Korean Soc. For. Sci. 2021, 110, 496–503. [Google Scholar]
  12. Li, M.; Li, H.; Ding, X.; Wang, L.; Wang, X.; Chen, F. The detection of pine wilt disease: A literature review. Int. J. Mol. Sci. 2022, 23, 10797. [Google Scholar] [CrossRef]
  13. Kim, C.; Park, B.-J. A Study on Improving the Quantitative Analysis Method for the Control Performance of Pine Wilt Disease. J. Korean Soc. For. Sci. 2024, 113, 259–270. [Google Scholar]
  14. Lee, M.-G.; Cho, H.-B.; Youm, S.-K.; Kim, S.-W. Detection of pine wilt disease using time series UAV imagery and deep learning semantic segmentation. Forests 2023, 14, 1576. [Google Scholar] [CrossRef]
  15. Sánchez-Mercado, A.; Ferrer-Paris, J.; Franklin, J. Mapping species distributions: Spatial inference and prediction. Oryx 2010, 44, 615. [Google Scholar] [CrossRef]
  16. Shabani, F.; Kumar, L.; Ahmadi, M. A comparison of absolute performance of different correlative and mechanistic species distribution models in an independent area. Ecol. Evol. 2016, 6, 5973–5986. [Google Scholar] [CrossRef] [PubMed]
  17. Hayat, U.; Shi, J.; Wu, Z.; Rizwan, M.; Haider, M.S. Which SDM Model, CLIMEX vs. MaxEnt, Best Forecasts Aeolesthes sarta Distribution at a Global Scale under Climate Change Scenarios? Insects 2024, 15, 324. [Google Scholar] [CrossRef] [PubMed]
  18. Su, X.; Ouyang, X.; Ding, X.; Wang, Y.; Liu, W.; Liu, Y. Predicting Suitable Habitat for Glipa (Coleoptera: Mordellidae: Mordellinae) Under Current and Future Climates Using MaxEnt Modeling. Insects 2025, 16, 642. [Google Scholar] [CrossRef]
  19. Phillips, S.J.; Dudík, M. Modeling of species distributions with Maxent: New extensions and a comprehensive evaluation. Ecography 2008, 31, 161–175. [Google Scholar] [CrossRef]
  20. Estay, S.A.; Labra, F.A.; Sepulveda, R.D.; Bacigalupe, L.D. Evaluating habitat suitability for the establishment of Monochamus spp. through climate-based niche modeling. PLoS ONE 2014, 9, e102592. [Google Scholar] [CrossRef]
  21. Ouyang, X.; Chen, A.; Li, Y.; Han, X.; Lin, H. Predicting the potential distribution of pine wilt disease in China under climate change. Insects 2022, 13, 1147. [Google Scholar] [CrossRef]
  22. Mori, N.; Yamashita, M.; Inoue, M.N. Integration of satellite remote sensing and MaxEnt modeling for improved detection and management of forest pests. Environ. Monit. Assess. 2024, 196, 616. [Google Scholar] [CrossRef]
  23. Hirata, A.; Nakamura, K.; Nakao, K.; Kominami, Y.; Tanaka, N.; Ohashi, H.; Takano, K.T.; Takeuchi, W.; Matsui, T. Potential distribution of pine wilt disease under future climate change scenarios. PLoS ONE 2017, 12, e0182837. [Google Scholar] [CrossRef]
  24. Ikegami, M.; Jenkins, T.A. Estimate global risks of a forest disease under current and future climates using species distribution model and simple thermal model–Pine Wilt disease as a model case. For. Ecol. Manag. 2018, 409, 343–352. [Google Scholar] [CrossRef]
  25. Tang, X.; Yuan, Y.; Li, X.; Zhang, J. Maximum entropy modeling to predict the impact of climate change on pine wilt disease in China. Front. Plant Sci. 2021, 12, 652500. [Google Scholar] [CrossRef]
  26. Wang, J.; Deng, J.; Yan, W.; Zheng, Y. Habitat suitability of pine wilt disease in Northeast China under climate change scenario. Forests 2023, 14, 1687. [Google Scholar] [CrossRef]
  27. Yu, L.; Zhan, Z.; Ren, L.; Li, H.; Huang, H.; Luo, Y. Impact of stand-and landscape-level variables on pine wilt disease-caused tree mortality in pine forests. Pest Manag. Sci. 2023, 79, 1791–1799. [Google Scholar] [CrossRef] [PubMed]
  28. Suzuki, K.; Kiyohara, T. Influence of water stress on development of pine wilting disease caused by Bursaphelenchus lignicolus. Eur. J. For. Pathol. 1978, 8, 97–107. [Google Scholar] [CrossRef]
  29. Miki, N.; Sakamoto, K.; Nishimoto, T.; Yoshikawa, K.; Hada, Y. Relationship between the incidence of pine wilt disease and the drainage area. J. For. Res. 2001, 6, 181–186. [Google Scholar] [CrossRef]
  30. Basic Statistics of Gyeongsangbuk-do: Occurrence and Control Status of Forest Pests and Diseases. Available online: https://stat.kosis.kr/statHtml_host/statHtml.do?orgId=216&tblId=DT_21603_E001048&conn_path=I2&dbUser=NSI_IN_216 (accessed on 1 August 2025).
  31. Obeng, H.A.; Arhinful, R.; Tessema, D.H.; Nuhu, J.A. The mediating role of organisational stress in the relationship between gender diversity and employee performance in Ghanaian public hospitals. Future Bus. J. 2025, 11, 38. [Google Scholar] [CrossRef]
  32. Futai, K. Pine wilt in Japan: From first incidence to the present. In Pine Wilt Disease; Springer: Berlin/Heidelberg, Germany, 2008; pp. 5–12. [Google Scholar]
  33. Ohsawa, M.; Akiba, M. Possible altitude and temperature limits on pine wilt disease: The reproduction of vector sawyer beetles (Monochamus alternatus), survival of causal nematode (Bursaphelenchus xylophilus), and occurrence of damage caused by the disease. Eur. J. For. Res. 2014, 133, 225–233. [Google Scholar] [CrossRef]
  34. Boyd, I.L.; Freer-Smith, P.H.; Gilligan, C.A.; Godfray, H.C.J. The consequence of tree pests and diseases for ecosystem services. Science 2013, 342, 1235773. [Google Scholar] [CrossRef]
  35. Sim, S.T.; Lee, S.-H.; Lee, C.Y.; Nam, Y. Analysis of occurrence characteristics of pine wilt disease in Korea based on monitoring data from 2016 to 2018. J. Korean Soc. For. Sci. 2021, 110, 280–288. [Google Scholar]
  36. Lee, S.; Jeong, K.; Park, Y.-J.; Park, J. Prediction of risk area distribution of pine wilt disease using maximum entropy model in Gyeongju-si. J. Korean Cartogr. Assoc. 2021, 21, 43–57. [Google Scholar] [CrossRef]
  37. Ha, U.R.; Son, E.H.; Seong, H.J.; Kang, H.D.; Lee, D.W.; Kim, H.H. Predicting potential distribution of the pine wilt disease using MaxEnt model in Jinju-si. J. Agric. Life Sci. 2023, 57, 93–104. [Google Scholar] [CrossRef]
  38. Hao, Z.; Fang, G.; Huang, W.; Ye, H.; Zhang, B.; Li, X. Risk Prediction and Variable Analysis of Pine Wilt Disease by a Maximum Entropy Model. Forests 2022, 13, 342. [Google Scholar] [CrossRef]
  39. Low, B.W.; Zeng, Y.; Tan, H.H.; Yeo, D.C. Predictor complexity and feature selection affect Maxent model transferability: Evidence from global freshwater invasive species. Divers. Distrib. 2021, 27, 497–511. [Google Scholar] [CrossRef]
  40. Carvalho Júnior, O.A.; Guimarães, R.F.; Gillespie, A.R.; Silva, N.C.; Gomes, R.A. A new approach to change vector analysis using distance and similarity measures. Remote Sens. 2011, 3, 2473–2493. [Google Scholar] [CrossRef]
  41. ZhiYong, L.; Wang, F.; Xie, L.; Sun, W.; Falco, N.; Benediktsson, J.A.; You, Z. Diagnostic analysis on change vector analysis methods for LCCD using remote sensing images. IEEE J. Sel. Top. Appl. Earth Obs. Remote Sen. 2021, 14, 10199–10212. [Google Scholar] [CrossRef]
  42. Chen, L.; Lu, W.; Lamont, B.B.; Liu, Y.; Wei, P.; Xue, W.; Xiong, Z.; Tang, L.; Wang, Y.; Wang, P. Modeling the distribution of pine wilt disease in China using the ensemble models MaxEnt and CLIMEX. Ecol. Evol. 2024, 14, e70277. [Google Scholar] [CrossRef]
  43. Kim, I.; Nam, Y.; Park, S.; Cho, W.; Choi, K.; Ko, D.W. Enhancing pest control interventions by linking species distribution model prediction and population density assessment of pine wilt disease vectors in South Korea. Front. Ecol. Evol. 2024, 11, 1305573. [Google Scholar] [CrossRef]
  44. Wang, W.; Peng, W.; Liu, X.; He, G.; Cai, Y. Spatiotemporal dynamics and factors driving the distributions of pine wilt disease-damaged forests in China. Forests 2022, 13, 261. [Google Scholar] [CrossRef]
  45. Jung, B.-J.; Lee, M.-G.; Kim, S.-W. Prediction of Potential Habitat of Monochamus alternatus Based on Shared Socioeconomic Pathway Scenarios. Forests 2024, 15, 1563. [Google Scholar] [CrossRef]
  46. Xiao, Y.; Guo, Q.; Xie, N.; Yuan, G.; Liao, M.; Gui, Q.; Ding, G. Predicting the global potential distribution of Bursaphelenchus xylophilus using an ecological niche model: Expansion trend and the main driving factors. BMC Ecol. Evol. 2024, 24, 48. [Google Scholar] [CrossRef]
  47. Forests. Special Issue: Management of Forest Pests and Diseases—3rd Edition. Available online: https://www.mdpi.com/journal/forests/special_issues/7Z97KI0Y2U (accessed on 16 September 2025).
Figure 1. Location of the study area. Andong-si is located in the northern inland mountainous region of Gyeongsangbuk-do, Republic of Korea.
Forests 16 01677 g001
Figure 2. MaxEnt model key-variable response graph: (a) H.P. (historical proximity) and (b) Bioc. 3 (bioclimate 3: isothermality). The red line represents the average predicted suitability, and the blue band shows the variation across model replicates.
Forests 16 01677 g002
Figure 3. MaxEnt model Jackknife validation results. Note: As., aspect; Bioc. 14, bioclimate 14 (rainfall in driest month); Bioc. 3, bioclimate 3 (isothermality); Bioc. 4, bioclimate 4 (temperature seasonality); B.P., building proximity; Al., altitude; S.D., stand density; H.P., historical proximity; F.T., forest type; S.M., soil moisture; Prec. 5, May precipitation; W.B.P., water body proximity; R.P., road proximity; Sl., slope; S.T., soil texture.
Forests 16 01677 g003
Figure 4. Receiver operating characteristic (ROC) curve of the MaxEnt model for predicting PWD distribution.
Forests 16 01677 g004
Figure 5. MaxEnt model maps: (a) present, (b) near future (2021–2040) under SSP1-2.6, and (c) far future (2041–2060) under SSP1-2.6.
Forests 16 01677 g005
Figure 6. Maps of magnitude of change raster and change direction vector: (a) near future (movement direction: 87.39°), (b) far future (movement direction: 88.66°), and (c) post-near future (movement direction: 88.46°) under SSP1-2.6.
Forests 16 01677 g006
Table 1. List of final variables incorporated in the MaxEnt model.
Final VariableDescriptionVariable Type
F.T.Forest type (tree species)Nominal
S.D.Stand densityOrdinal
S.M.Soil moistureOrdinal
S.T.Soil textureNominal
W.B.P.Water body proximity: Euclidean distance analysisContinuous
Al.AltitudeContinuous
As.AspectContinuous
Sl.SlopeContinuous
R.P.Road proximity: Euclidean distance analysisContinuous
B.P.Building proximity: Euclidean distance analysisContinuous
H.P.Historical proximity: Euclidean distance analysis from 2022 PWD occurrence points based on 2023Continuous
Prec. 5May precipitationContinuous
Bioc. 3 Bioclimate   3 :   isothermality   ( Bioc .   2 / Bioc .   7 )   ( × 100)Continuous
Bioc. 4 Bioclimate   4 :   temperature   seasonality   ( standard   deviation   × 100)Continuous
Bioc. 14Bioclimate 14: precipitation of driest monthContinuous
Table 2. Contribution and importance of each variable in the MaxEnt model.
Final VariableContribution (%)Importance (%)
H.P.30.630.0
Bioc. 312.416.5
Bioc. 149.914.3
S.T.8.63.2
S.M.7.11.7
S.D.4.70.6
W.B.P.3.73.8
As.3.53.0
B.P.3.33.7
R.P.3.33.7
Prec. 53.25.4
F.T.2.81.0
Al.2.73.3
Sl.2.34.1
Bioc. 42.15.8
Note: H.P., historical proximity; Bioc. 3, bioclimate 3 (isothermality); Bioc. 14, bioclimate 14 (rainfall in driest month); S.T., soil texture; S.M., soil moisture; S.D., stand density; W.B.P., water body proximity; As., aspect; B.P., building proximity; R.P., road proximity; Prec. 5, May precipitation; F.T., forest type; Al., altitude; Sl., slope; Bioc. 4, bioclimate 4 (temperature seasonality).
Table 3. Changes in cell values for PWD potential habitat in the near future, far future, and post-near future.
Time PeriodNear Future
(2021–2040)
Far Future
(2041–2060)
Post-Near Future
Increase (a)689 (54.0) 1618 (48.4)582 (45.6)
Decrease (b)587 (46.0)658 (51.6)694 (54.4)
Difference (a − b)102 (8.0)−40 (−3.1)−112 (−8.8)
Total1276 (100.0)1276 (100.0)1276 (100.0)
1 Numbers represent the count of cells, and numbers in parentheses indicate the percentage relative to the total cell count.
Disclaimer/Publisher’s Note: The statements, opinions and data contained in all publications are solely those of the individual author(s) and contributor(s) and not of MDPI and/or the editor(s). MDPI and/or the editor(s) disclaim responsibility for any injury to people or property resulting from any ideas, methods, instructions or products referred to in the content.