Article

Influence of Eucalyptus Plantation on Soil Microbial Characteristics in Severely Degraded Land of Leizhou Peninsula

1
Life Science and Technology School, Lingnan Normal University, Zhanjiang 524048, China
2
College of Forestry, Jiangxi Agricultural University, Nanchang 330045, China
*
Author to whom correspondence should be addressed.
Forests 2025, 16(10), 1602; https://doi.org/10.3390/f16101602
Submission received: 19 August 2025 / Revised: 15 October 2025 / Accepted: 16 October 2025 / Published: 18 October 2025
(This article belongs to the Section Forest Soil)

Abstract

Soil microorganisms are important decomposers in soil, and they play important roles in litter degradation, nutrient cycle and balance, soil physicochemical property improvement, and soil fertility maintenance. To understand the influence of Eucalyptus plantations on the growth, reproduction, and activity of soil microorganisms in severely degraded land, the Leizhou Peninsula in tropical China was selected as the research area. The vegetation restoration types of Eucalyptus urophylla × grandis planted in its severely degraded red soil areas (ES: Eucalyptus–shrub, EG: Eucalyptus–grass, and ED: EucalyptusDicranopteris pedata (Houtt.) Nakaike) were studied, and the nearby natural vegetation types (S: shrub, G: grass, and D: Dicranopteris pedata) served as control groups. The microbial characteristics of different vegetation restoration types were compared, and the influence of Eucalyptus plantations on the growth, reproduction, and activity of soil microorganisms in severely degraded red soil areas was discussed by setting up sample plots for investigation, sample determination, and statistical analysis. The structure of soil microorganisms differed significantly between Eucalyptus vegetation restoration (ER) and natural vegetation restoration without Eucalyptus (NER). Key organic decomposers, including bacterial genera such as Candidatus Solibacter (ER: 1.2 ± 0.4% vs. NER: 0.9 ± 0.1%), Candidatus Koribacter (ER: 1.0 ± 0.4% vs. NER: 0.7 ± 0.1%), and Edaphobacter (ER: 0.9 ± 0.1% vs. NER: 0.4 ± 0.1%), as well as fungal genera such as Rhizophagus (ER: 0.1 ± 0.0% vs. NER: 0.0 ± 0.0%), Paxillus (ER: 0.1 ± 0.0% vs. NER: 0.0 ± 0.0%), and Pisolithus (ER: 0.1 ± 0.0% vs. NER: 0.0 ± 0.0%), exhibited a significantly higher relative richness and a broader distribution in ER compared to NER (p < 0.05). Soil microbial biomass carbon, nitrogen and phosphorus (MBC, MBN, MBP), community structure (keystone taxa and symbiosis network complexity), and functional genes (for growth, reproduction, and decomposition) in ER, especially in ES, were significantly higher than in NER. This study illustrated that Eucalyptus plantations, especially ES types, can promote the growth and reproduction of soil organic decomposers, improve microbial metabolic and biological activities, and increase functional diversity and interactions among microorganisms, thus accelerating the cycle of soil carbon, nitrogen, and phosphorus nutrients, improving soil quality and fertility, and accelerating the recovery of degraded soil fertility. In areas with serious soil degradation and where natural vegetation restoration is difficult, planting Eucalyptus, especially while guiding the understory vegetation to develop into the shrub vegetation type, is an effective vegetation restoration model.

1. Introduction

As vital decomposers, soil microorganisms play a central role in the soil ecological cycle, influencing key processes such as nutrient cycling, litter decomposition, humus formation, soil aggregation, and overall soil productivity [1,2,3]. Given their sensitivity to changes in soil quality [4], they serve as effective indicators for assessing short-term variations in recovering ecosystems [5]. This makes them valuable for monitoring the restoration progress of degraded soils and guiding ecosystem recovery efforts [6].
The growth and reproduction of microorganisms are affected by environmental conditions such as light, nutrients, moisture, and pH value [7,8]. The influence of vegetation type on soil microorganisms is mediated by factors such as canopy cover, litter quality, and root dynamics. By altering the availability of soil nutrients [9], water [10], pH [7], and light [11], these factors directly affect the structure and activity of microbial communities.
Red soil, derived from complex parent materials, is inherently prone to aridity and degradation [12]. This vulnerability is severely exacerbated by human activities such as animal breeding, excavation, and brick-making, which destroy the surface ecological structure. The resulting degradation leads to rapid erosion and nutrient loss, especially under intense heat and heavy rainfall [13], posing a significant threat to ecosystem sustainability in southern China. While vegetation restoration is the primary strategy to combat this degradation, the choice of appropriate restoration methods and tree species is highly debated. Eucalyptus species, primarily Eucalyptus urophylla × grandis, are widely planted in the region for their rapid growth and economic value, often being promoted for the swift canopy closure they provide [14]. However, their use in restoration is contentious. Globally, Eucalyptus plantations have been reported to potentially exert negative impacts on soil ecosystems, including allelopathic effects that may suppress understory vegetation, high water consumption, and alterations to soil microbial communities and biogeochemical cycles, which could lead to soil fertility decline in the long term [15,16]. Conversely, some studies suggest that, under specific management practices, they can facilitate site recovery [17,18,19]. In contrast, natural regeneration, which allows native species to recolonize, is often seen as a more ecologically sound approach, but may have a slower initial pace for above-ground biomass accumulation [20,21]. Given this controversy and the critical role of soil microbial properties as indicators of ecosystem health and drivers of soil fertility, a comparative assessment of these two restoration pathways is urgently needed.
Therefore, this study aims to fill this knowledge gap by comprehensively evaluating the effects of Eucalyptus plantations versus natural regeneration on soil microbial properties and their implications for soil fertility restoration in the severely degraded red soil areas of the Leizhou Peninsula, China. We hypothesized that (1) natural regeneration would support a more diverse and active soil microbial community compared to Eucalyptus plantations, due to the greater plant diversity and the absence of allelopathic compounds; and (2) consequently, soil fertility indicators would be more favorable under natural regeneration than under Eucalyptus plantations. To test these hypotheses, we selected paired sites with Eucalyptus-based restoration (ER) and adjacent natural vegetation restoration (NER). The results of this research are expected to provide a critical theoretical reference for guiding effective ecosystem restoration strategies and the sustainable management of degraded red soils, an issue of paramount importance for land managers and policymakers in subtropical China.

2. Materials and Methods

2.1. Study Site

Leizhou Peninsula is located at the southernmost tip of mainland China, with geographical coordinates of 20°12′–21°35′ N and 109°30′–110°55′ E. It is located in the northern edge of the tropics and belongs to the northern tropical marine monsoon climate, with an average annual temperature of 22.8–23.5 °C, an extreme maximum temperature of 38.8 °C, and an extreme minimum temperature of up to 2.2 °C [22]. The annual rainfall is 1400–1600 mm, the spatiotemporal distribution of precipitation is unbalanced, and precipitation increases from south to north. May–September is the rainy season, accounting for 85% of the annual rainfall. The drought in winter and spring is severe. Easterly and southeasterly winds prevail throughout the year, and the effects of low pressure, tropical storms, and typhoons are frequent from May to October [23]. The topography of the study area is relatively flat, showing a turtle back topography of high in the north, low in the middle, and high in the south. The main soil type is red soil developed from basalt, but coastal or tidal sandy soil is also present. As the understory vegetation in artificial forests, the herbaceous plants mainly include Chromolaena odorata (L.) R. M. King & H. Rob. and Ageratum conyzoides L., shrubs mainly include Aporosa dioica (Roxb.) Müll. Arg., Litsea glutinosa (Lour.) C. B. Rob., Lantana camara L., Clerodendrum cyrtophyllum Turcz., and Rhodomyrtus tomentosa (Aiton) Hassk., and ferns mainly include Dicranopteris pedata (Houtt.) Nakaike.

2.2. Experimental Design

To ensure spatial replication and consistent pre-restoration degradation backgrounds, seven representative degraded red soil areas in Leizhou Peninsula were selected as restoration research points. The selection criteria included (1) a documented history of severe vegetation destruction due to human activities (kiln construction and brick burning) prior to 2013; (2) comparable degrees of soil erosion and habitat degradation; and (3) geographical distribution across different towns to capture regional variability. The selected sites were CK (Chikan District), XS (Xiashan District), HT (Hetou Town), JJ (Jijia Town), YJ (Yangjia Town), QS (Qishui Town), and LM (Longmen Town) (Figure 1). Before 2013, these areas were intensively disturbed by local production activities, resulting in the severe degradation observed.
In 2013, ecological destruction activities, such as the illegal construction of brick factories, were stopped, Eucalyptus urophylla × grandis was planted (row spacing was 3 m × 2 m, and all slopes were less than 5°), and the degraded red soil areas were enclosed. After planting and enclosure, there were no management practices, such as fertilization, deweeding, and cleaning, and the soil remained in the natural condition. The main types of understory vegetation in Eucalyptus forests were shrubs, grasses, and Dicranopteris pedata. Nearby plots without Eucalyptus planted were naturally restored and formed our study vegetation types of shrub, grass, and Dicranopteris pedata. Because the vegetation restoration period of the sample plot was short (6–7 years), the understory vegetation in Eucalyptus forests had not yet undergone vegetation succession.
The investigation was performed from June to October in 2021. Three types of Eucalyptus vegetation restoration plots (ES: Eucalyptus–shrub, EG: Eucalyptus–grass, and ED: EucalyptusDicranopteris pedata) were established in each research site, and plots without Eucalyptus or natural vegetation restoration, corresponding to the shrub type (S), grass type (G), and Dicranopteris pedata type (D), were established near each Eucalyptus vegetation restoration plot as control groups. There were 21 groups of sample plots in seven study sites (21 Eucalyptus forest sample plots and 21 natural vegetation restoration sample plots without Eucalyptus). The size of Eucalyptus forest sample plots was 20 m × 20 m to adequately sample the tree community, whereas the size of natural vegetation restoration sample plots without Eucalyptus was 10 m × 10 m, which was sufficient for the shrub and herbaceous layers. During clay brick production and kiln construction, fresh bricks need to be stored and dried in a large area (flat open space) of the brick yard before burning, and, in preparing soil and building brick yards, vegetation was removed. Therefore, the kiln/brick production point was in a state of no vegetation before restoration. To further minimize differences in background conditions between sample plots and the influence of environmental conditions such as litter and light on the sample plots without Eucalyptus, the distance between each sample plot was limited to 50–500 m. Furthermore, based on detailed field surveys and visual assessment, the plots were carefully chosen to ensure they were as similar as possible in key background conditions (including topography, soil type, and history of human interference) to minimize initial heterogeneity.

2.3. Sample Investigation and Sampling

The growth of all trees with a diameter at breast height (DBH) ≥ 5 cm (woody plants with a DBH < 5 cm were considered shrubs) in the sample plot was measured by the per-tree survey method, including growth indicators such as number, height (measured using a hypsometer), DBH (measured using a tape measure), annual rings, and crown width. Within each sample plot, five 2 m × 2 m shrub quadrats and five 1 m × 1 m herb quadrats were systematically distributed (at the four corners and the center) to investigate the growth of shrubs and grasses, including indicators such as the number of plants (clumps), basal (clump) diameter, crown diameter, height, and cover. Topographic factors, such as latitude and longitude, elevation, slope direction, slope position, slope and landform type, and canopy density of tree layer, and community characteristics, such as main species, cover, and height of undergrowth vegetation layer (shrub layer, herb layer, and interlayer plant layer), as well as the thickness of the humus layer, the thickness and cover of litter leaves, and the interference mode and degree of human or environmental stress, were recorded. Five litter quadrats of 1 m × 1 m were arranged in the sample plot, and the biomass of litter was determined by the harvesting method after oven-drying at 75 °C to a constant weight.
Five soil cores were taken from each quadrat according to the S-shape, and soil samples of the same soil layer were mixed into one soil sample after removing stones and roots. The soil samples were put into plastic self-sealing bags and taken back to the laboratory for processing. Fresh soil was divided into three parts after passing through a 2 mm sieve. The first part was screened after air drying and was used to determine soil physicochemical properties. The second part was refrigerated at 4 °C for measuring soil microbial biomass carbon (C), nitrogen (N), and phosphorus (P), and the third part was stored at −80 °C for extracting and analyzing DNA. In addition, the soil next to each sampling point was collected using a ring knife and brought back to the laboratory in an aluminum box to measure soil bulk density and moisture content by oven drying. The basic conditions and soil physicochemical properties of each plot were investigated and determined (Table 1 and Table 2).

2.4. Laboratory Analysis

Soil bulk density was measured using the ring knife method. Soil pH was measured potentiometrically. Soil organic matter (SOM) was determined by the potassium dichromate sulfuric acid oxidation method, and soil total nitrogen (TN) was measured using the semi-micro Kjeldahl method [24]. Soil available nitrogen (AN) was determined by the alkali hydrolysis diffusion method, while soil total phosphorus (TP) and available phosphorus (AP) were measured by sodium hydroxide melting–molybdenum antimony anti-colorimetry and ammonium fluoride–hydrochloric acid extraction, respectively [24]. All analytical procedures followed the standard methods described by Bao [24]. Soil microbial biomass C, N, and P (MBC, MBN, and MBP) were determined by chloroform fumigation. In brief, two 10 g fresh soil subsamples were divided into two parts, one for fumigation and the other for non-fumigation. After fumigation, the two soils were subjected to shaking extraction (0.5 M K2SO4 on a shaker for 30 min) and filtration to obtain extracts, and then the contents of total organic carbon and organic nitrogen in the extracts were determined. MBC and MBN were calculated as the difference in extractable organic C and total N between the fumigated and non-fumigated samples, divided by a conversion factor: MBC = (C_fumigated—C_non-fumigated)/k_EC, where k_EC = 0.45; MBN = (N_fumigated—N_non-fumigated)/k_EN, where k_EN = 0.54. For MBP analysis, a similar procedure was applied, but the fumigated and non-fumigated soils were extracted with 0.5 M NaHCO3 (pH 8.5). MBP was then calculated as follows: MBP = (P_fumigated—P_non-fumigated)/k_EP, where k_EP = 0.40 [25,26,27].
Metagenome sequencing method was used for DNA sequencing. Total DNA was extracted from each soil sample using a DNA extraction kit (Tiangen Biotech., Beijing, China) following the manufacturer’s instructions. The purity and quality of DNA were detected using a Qubit dsDNA Assay Kit inQubit® 2.0 Flurometer (Life Technologies, Carlsbad, CA, USA) and 1% agarose gel electrophoresis. Sequencing libraries were constructed from 1 μg of DNA per sample using the NEBNext® Ultra DNA Library Prep Kit for Illumina (NEB, Ipswich, MA, USA, Catalog #: E7370L), following the manufacturer’s protocol. The process included DNA fragmentation, end repair, adenylation, adapter ligation, and PCR amplification. The final libraries were quantified and quality-controlled before being pooled and sequenced on an Illumina PE150 platform (Illumina, San Diego, CA, USA).

2.5. Data Processing and Analysis

Data were analyzed using SPSS 20.0 software (SPSS Inc., Chicago, IL, USA). One-way analysis of variance was used to compare differences in vegetation types.
Principal component analysis (PCA) was conducted using CANOCO for Windows (version 5.0, Microcomputer Power, Ithaca, NY, USA) to sort and classify the soil microbial community structures at the phylum, genus, and species levels in different vegetation restoration types. Clusterheatmap was drawn to show distribution differences in dominant genera in different vegetation restoration types. The alpha diversity of soil microorganisms (ChaoI, Shannon, and Pielou indices) was calculated using QIIME2 (version 2020.11, https://qiime2.org) based on the number of observed species obtained by DNA sequencing. Origin 2021 (OriginLab, Northampton, MA, USA) was used to draw column charts. The significance level was set at p < 0.05.
A microbial co-occurrence network analysis was performed to investigate inter-species interactions and the overall structure of the microbial community across different vegetation habitats. The network was constructed based on strong (|r| > 0.6) and significant (p < 0.01) correlations among OTUs. The topological properties (including node number, edge number, betweenness centrality, and closeness centrality) of the global network were calculated using the igraph package in R [28]. OTUs with a degree greater than 100, a closeness centrality higher than 0.400, and a betweenness centrality lower than 0.0020 were defined as keystone taxa. The resulting network was visualized and analyzed using Gephi software (v0.9.2, The Gephi Consortium, https://gephi.org) [29].

3. Results

3.1. Soil MBC, MBN, and MBP and Their Stoichiometric Ratios in Different Vegetation Restoration Types

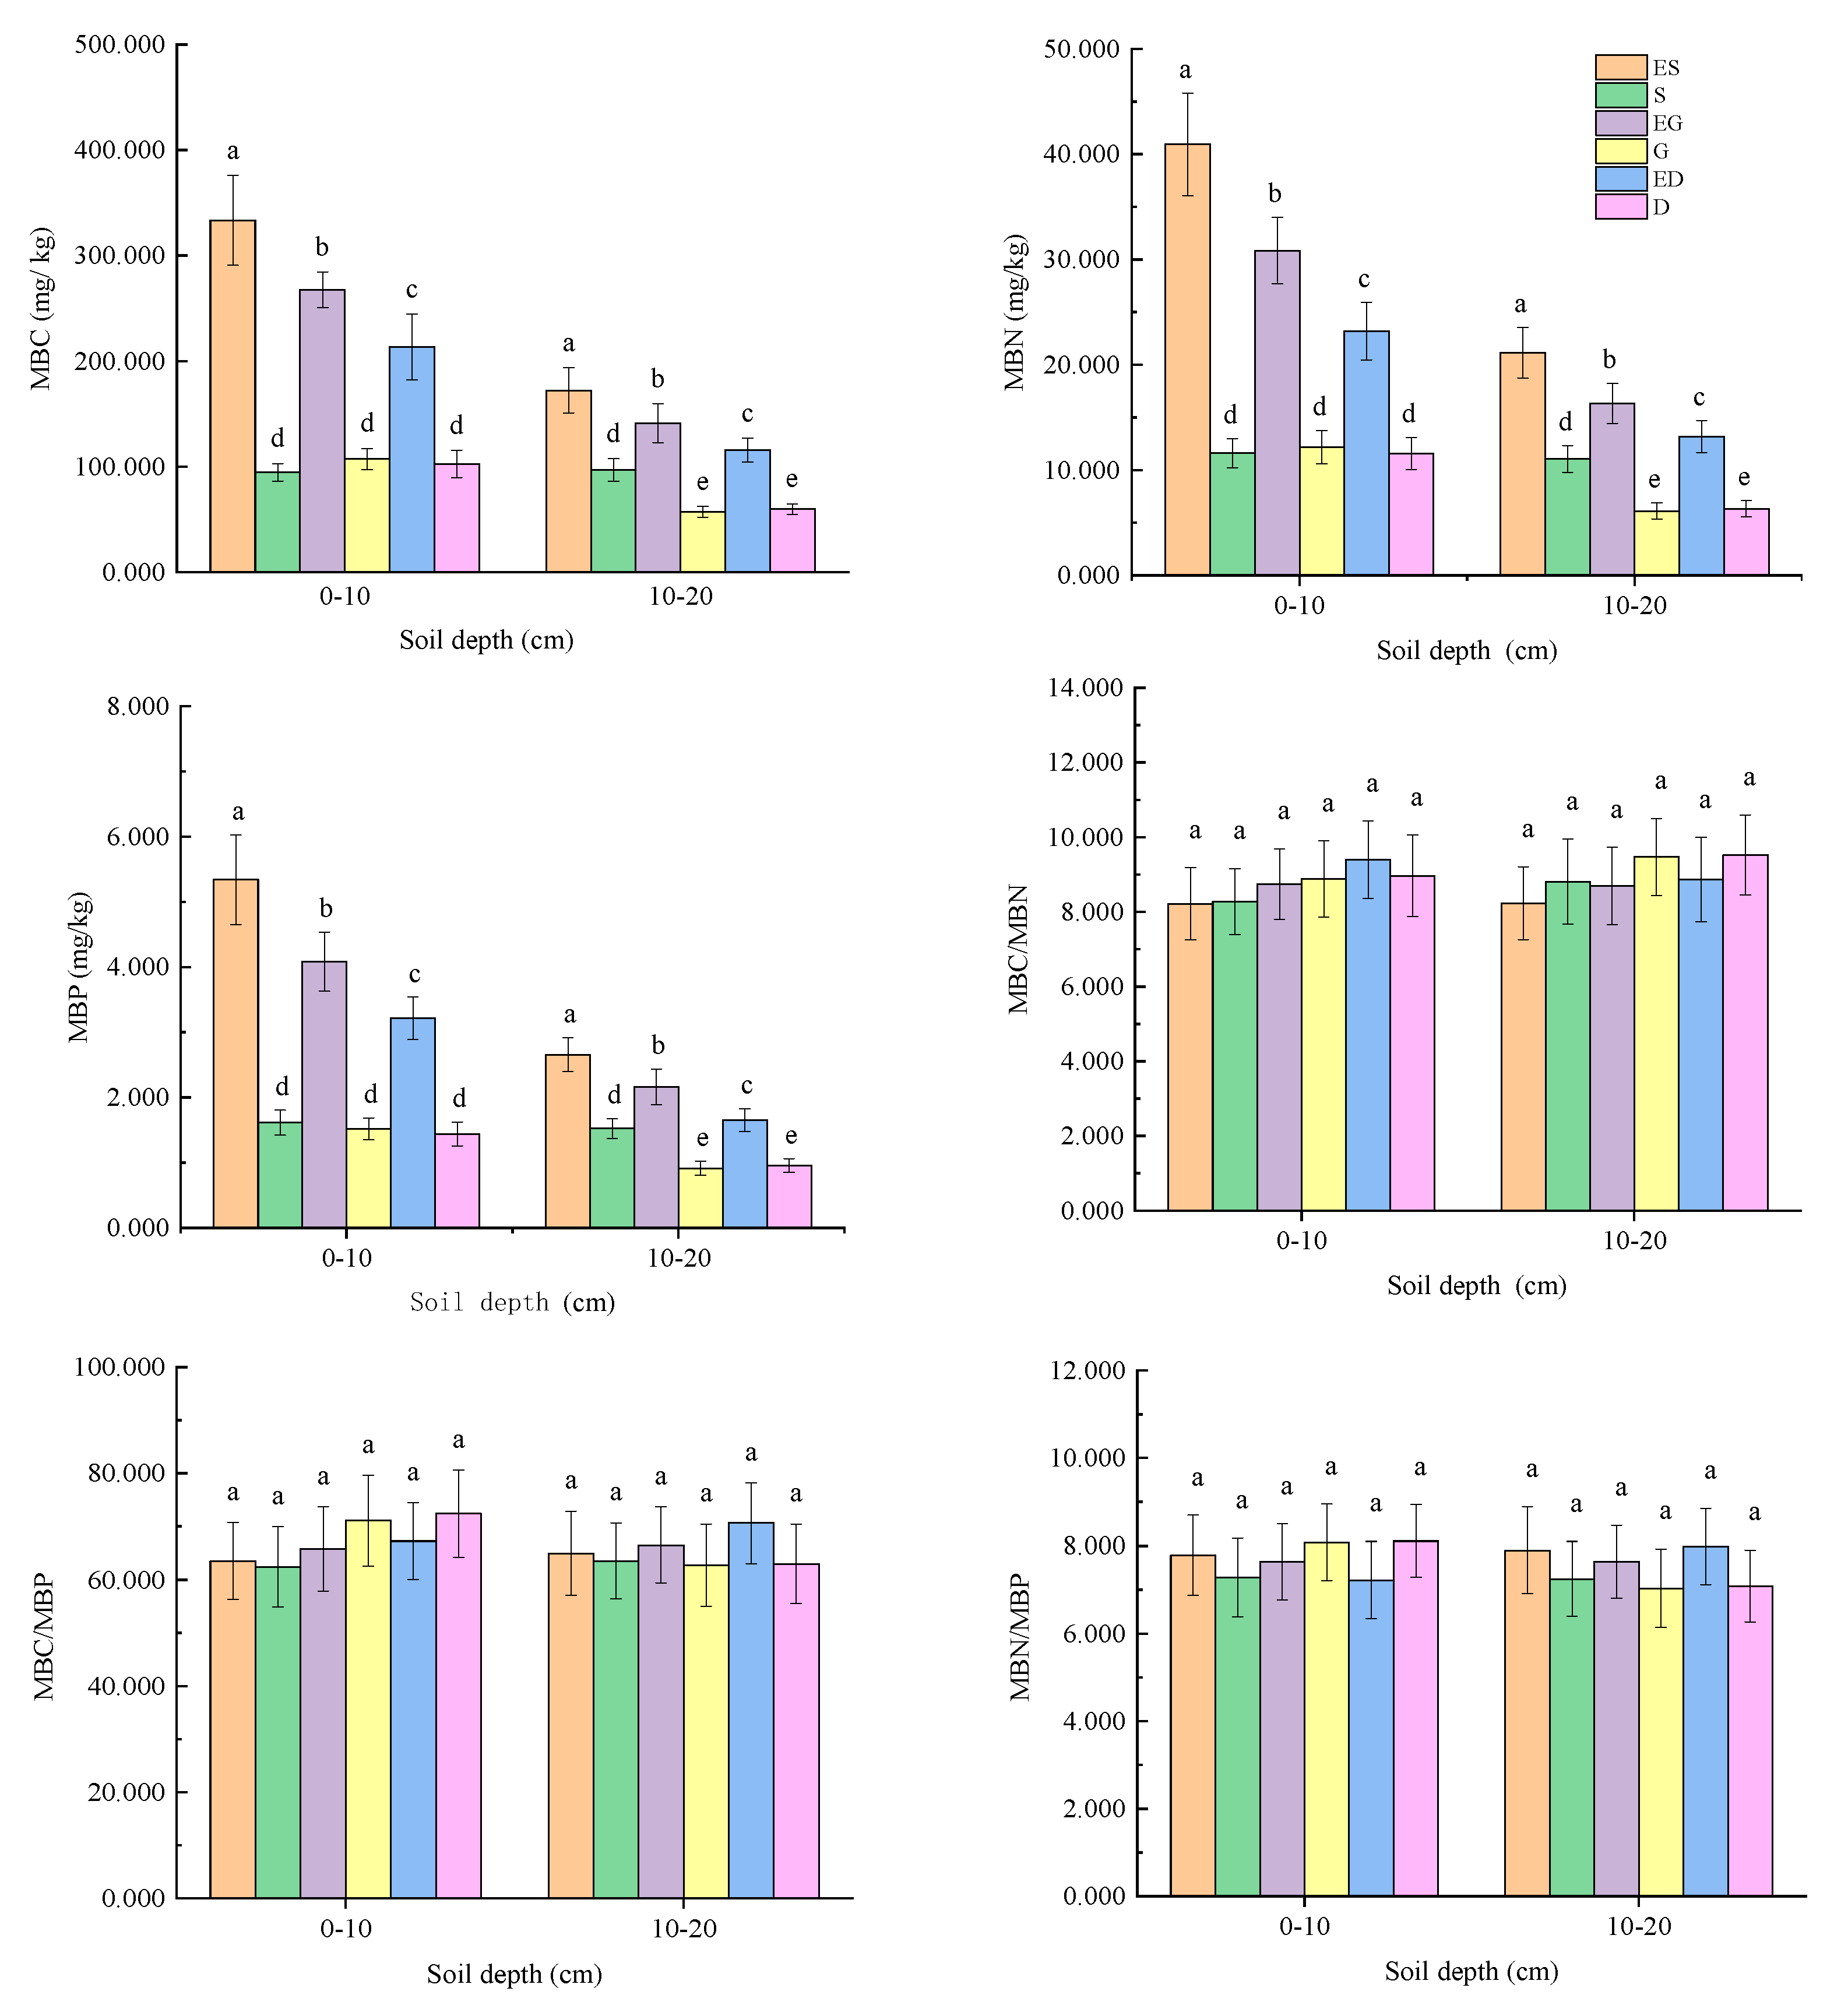
Figure 2 illustrates the contents and stoichiometric ratios of soil microbial biomass carbon (MBC), nitrogen (MBN), and phosphorus (MBP) across different vegetation restoration types. The bar graphs present the mean values along with error bars, and different letters above the bars indicate significant differences among the types (n = 7, p < 0.05). Specifically, the soil MBC (ER: 207.323 ± 23.652 mg/kg; NER: 1.995 ± 0.227 mg/kg), MBN (ER: 24.284 ± 2.760 mg/kg; NER: 14.736 ± 1.823 mg/kg), and MBP (ER: 3.186 ± 0.362 mg/kg; NER: 1.995 ± 0.227 mg/kg) in ER were significantly higher than those in NER (p < 0.05). Furthermore, within the ER type, a significant gradient was observed, as shown in the figure, with the order of MBC (ES: 252.955 ± 32.037 mg/kg; EG: 204.441 ± 17.673 mg/kg; ED: 164.572 ± 21.246 mg/kg), MBN (ES: 31.052 ± 3.631 mg/kg; EG: 23.597 ± 2.518 mg/kg; ED: 18.203 ± 2.132 mg/kg), and MBP (ES: 4.000 ± 0.472 mg/kg; EG: 3.123 ± 0.364 mg/kg; ED: 2.435 ± 0.249 mg/kg) being ES > EG > ED. However, the figure clearly demonstrates that no significant difference was found in the soil stoichiometric ratios (MBC/MBP, MBC/MBN, and MBN/MBP) among the different vegetation restoration types. This detailed view of the data provided in Figure 2 underscores that the vegetation restoration type significantly influences the absolute pools of microbial biomass but not their relative balances.

3.2. Microbial Diversity in Different Vegetation Restoration Types

A study has shown that the diversity of higher taxa (such as family level) may provide more accurate diversity information [30]. This study demonstrated that there were no significant differences in the microbial ChaoI indices among different vegetation restoration types at the level of families, genera, and species, reflecting that vegetation types had little influence on microbial abundance (Table 3). The Shannon and Pielou indices of soil microorganisms at the level of family, genus, and species in ER were significantly lower than in NER (as determined by one-way ANOVA with Tukey’s HSD test, p < 0.05; Table 3), which reflected that the diversity and uniformity of soil microorganisms in NER were higher than that in ER. There was no significant difference in the Shannon and Pielou indices of soil microorganisms at family, genus, and species levels among different types of Eucalyptus vegetation restoration.

3.3. Microbial Community Structure and Composition in Different Vegetation Restoration Types

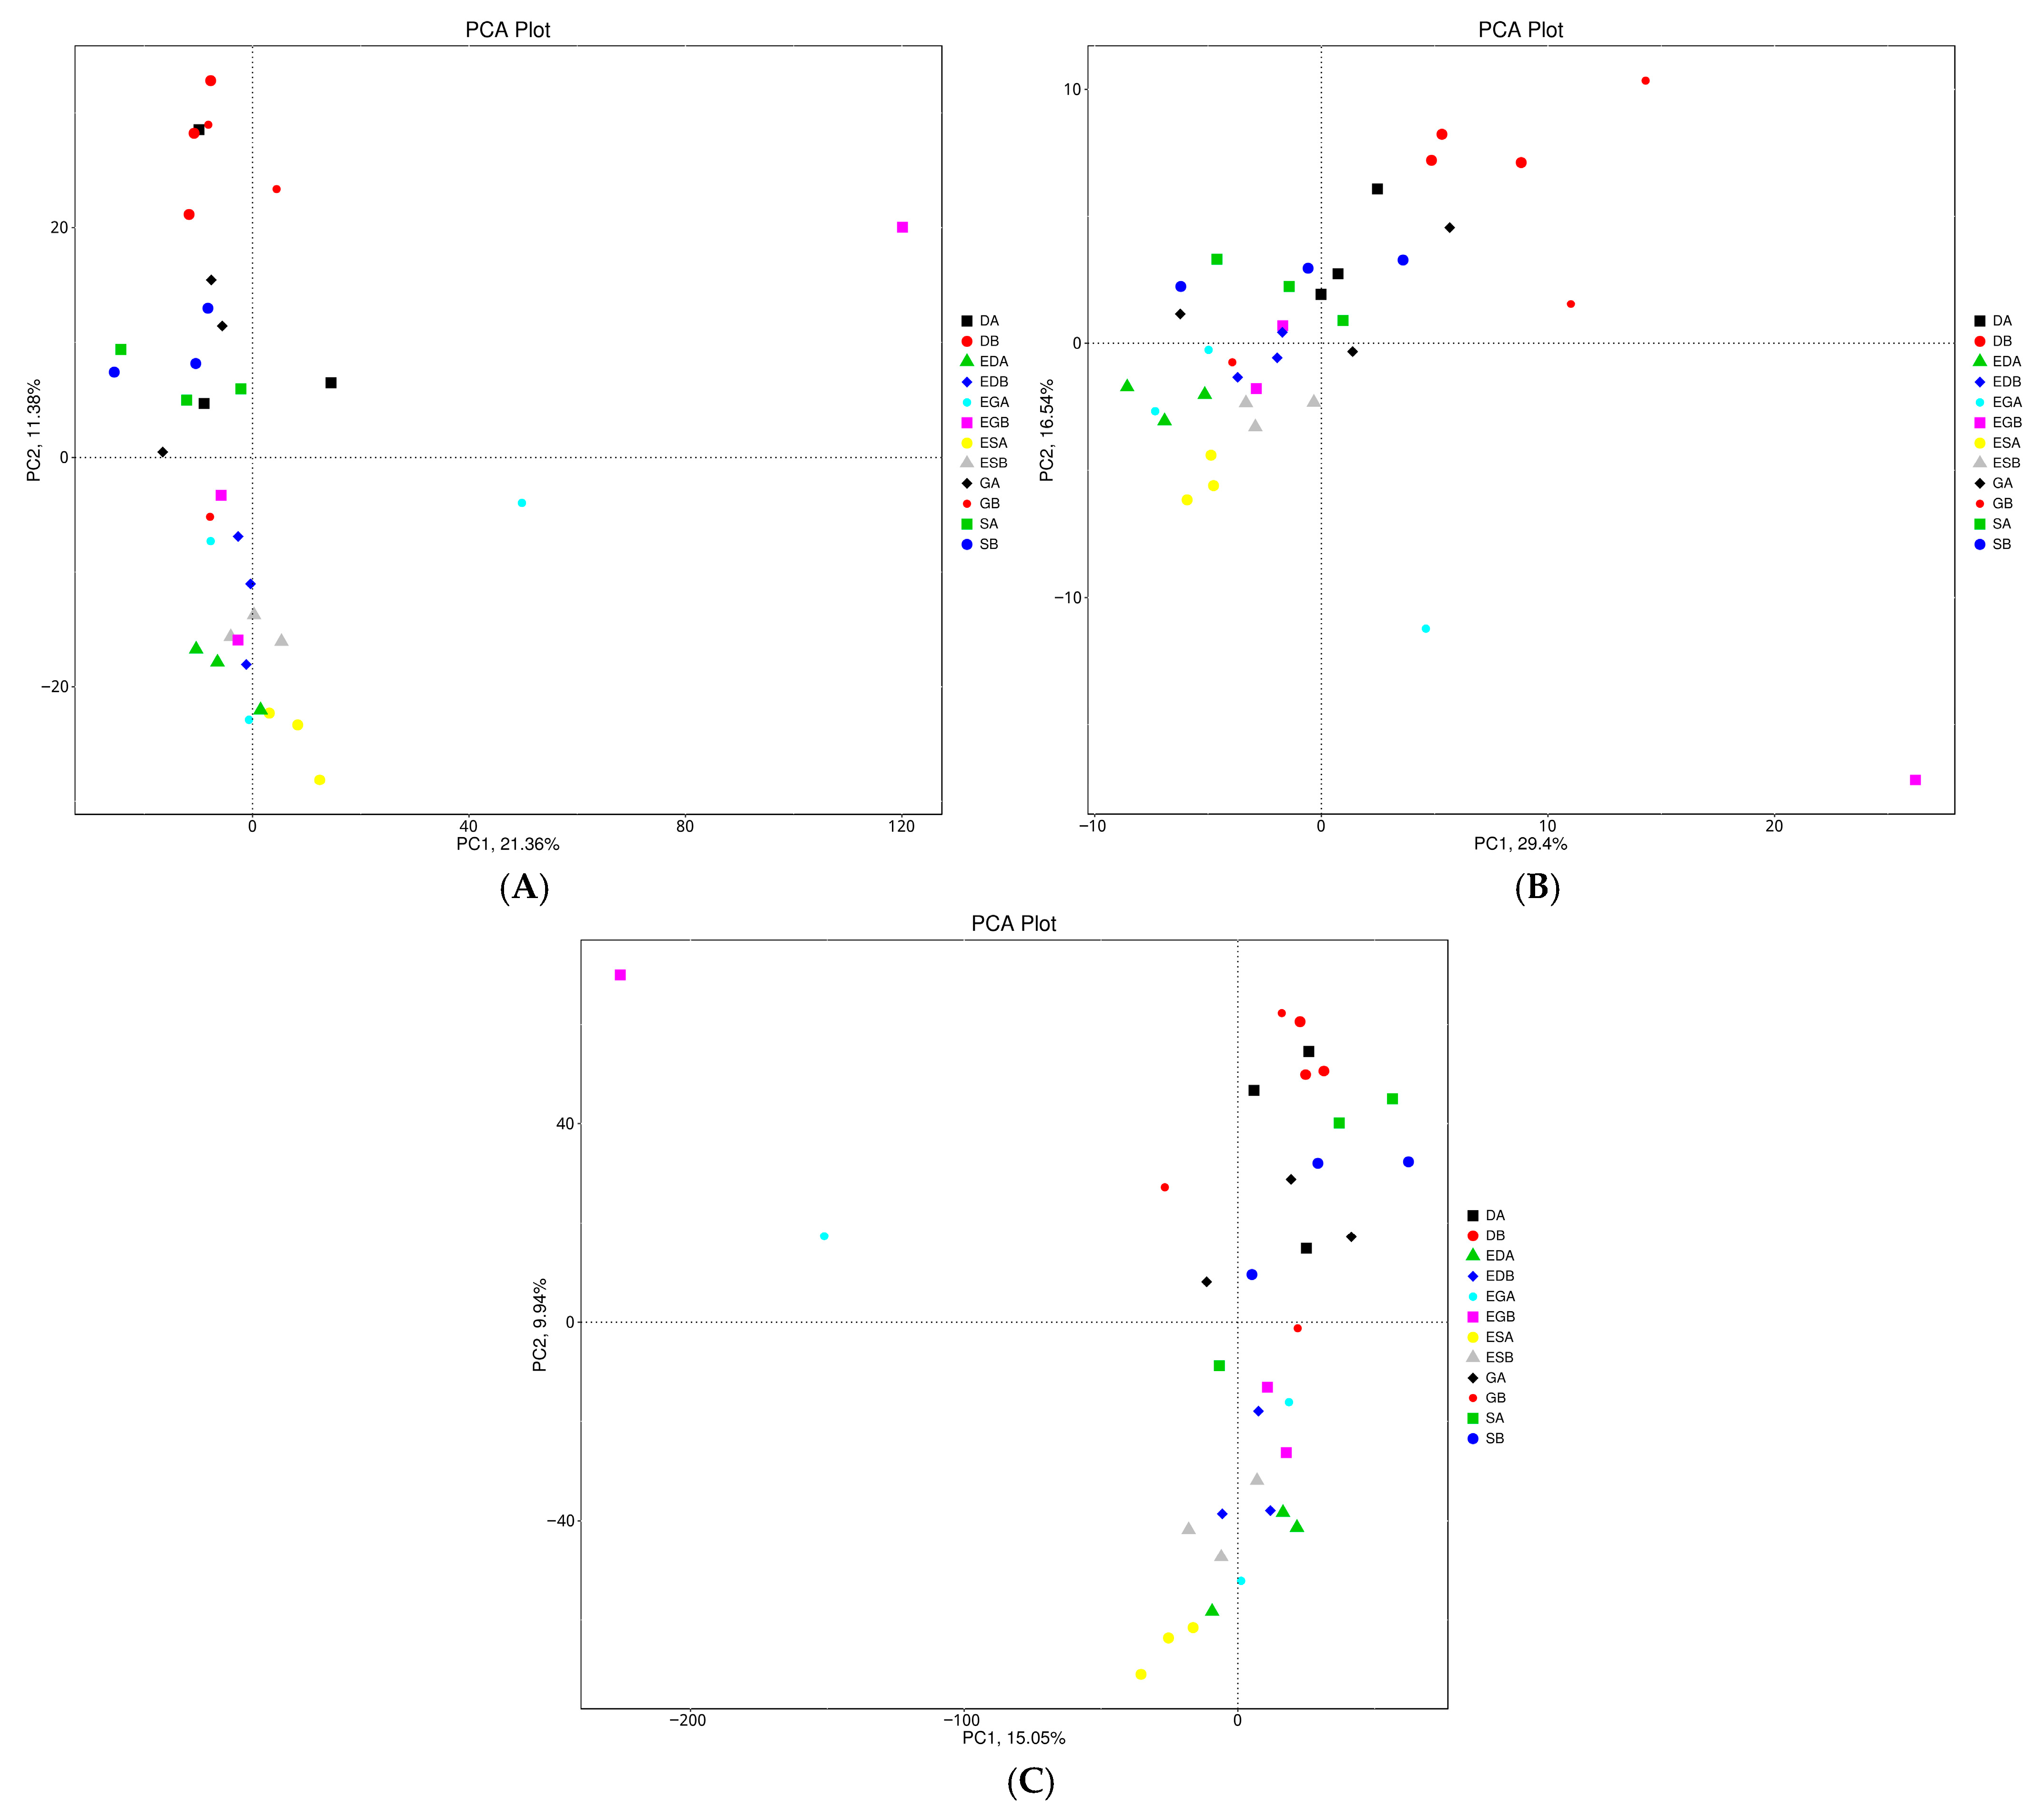
At the phylum level, principal component 1 (PC1, 29.40%) clearly distinguished the soil microbial composition in the vegetation restoration of Dicranopteris pedata from that in other vegetation restoration types, whereas principal component 2 (PC2, 16.54%) clearly distinguished the soil microbial composition in ER from that in NER (cumulative variance explained by PC1 and PC2: 45.94%). At the genus and species levels, principal component 1 (contribution values of 15.05% and 21.36%, respectively) clearly distinguished the soil microbial composition in ES from that in other vegetation restoration types, while principal component 2 (contribution values of 9.94% and 11.38%, respectively) clearly distinguished the soil microbial composition in ER from that in NER (cumulative variance explained: 24.99% and 32.74%, respectively). Differences were obvious at the levels of phylum, genus, and species between ER and NER, and genus and species between ES and other ER (EG and ED, Figure 3).
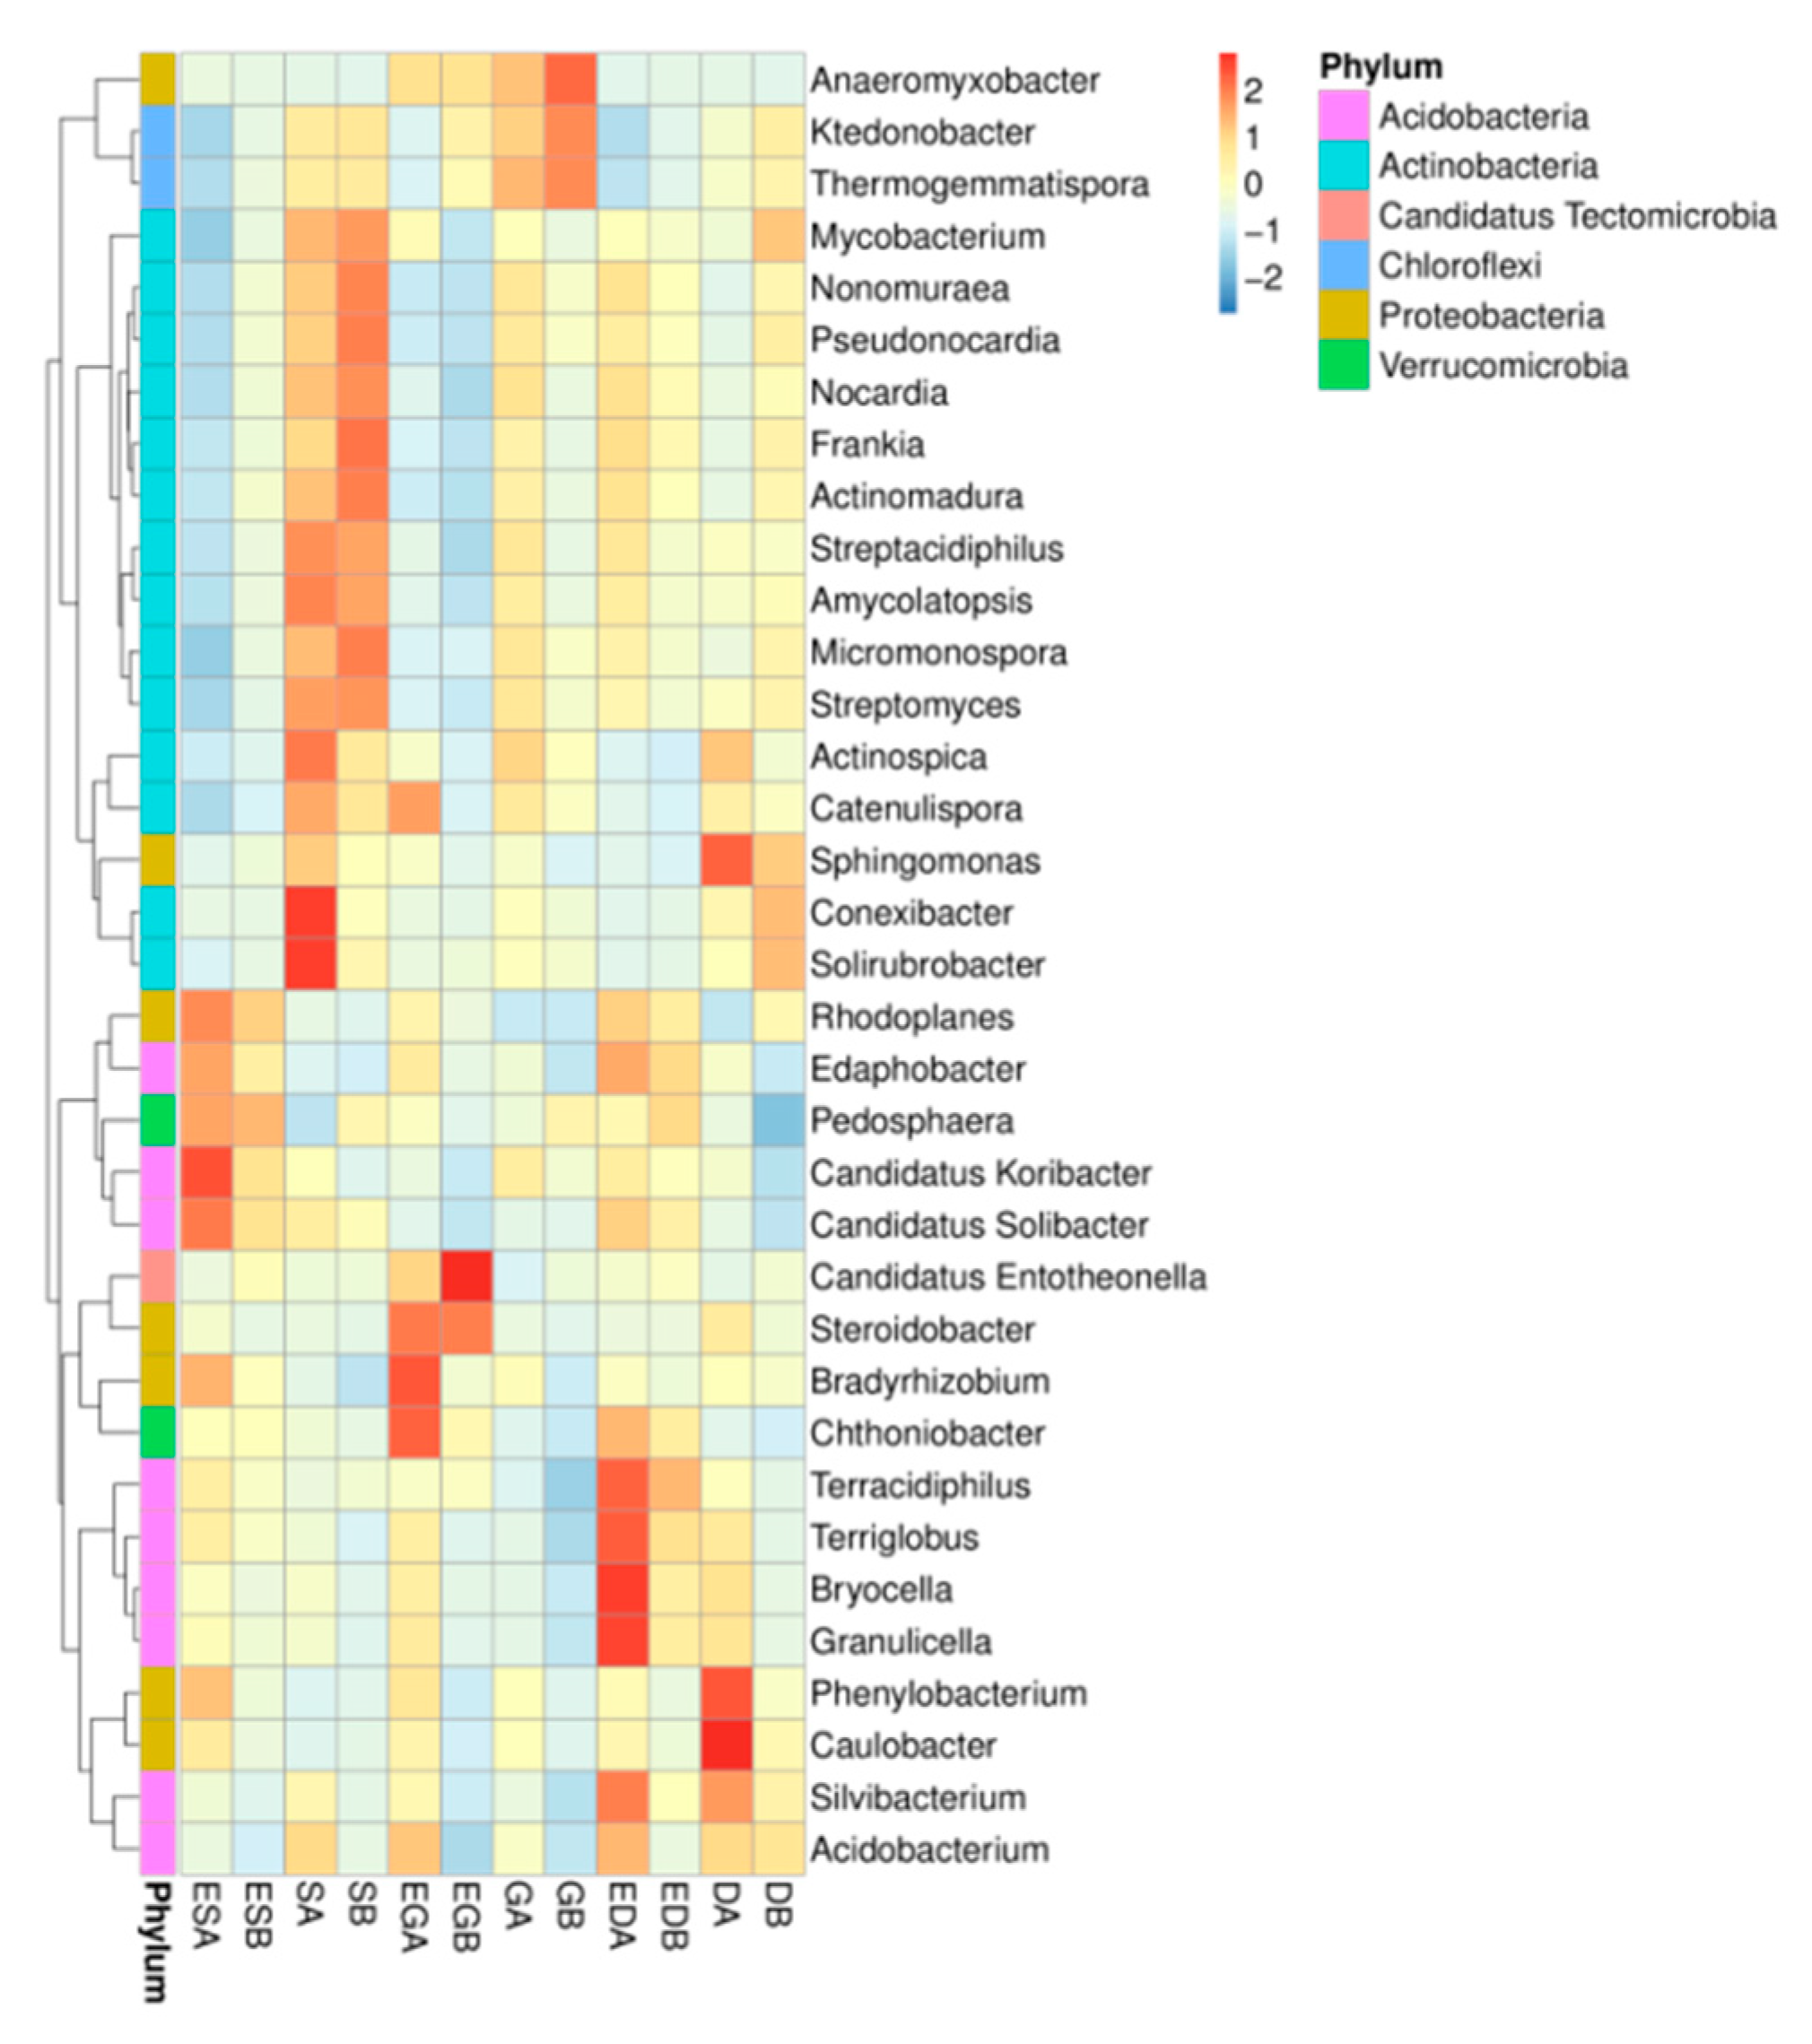
The top 35 dominant bacteria were obtained according to the maximum ranking method (Figure 4). Bradyrhizobium (Proteobacteria) and Candidatus Solibacter, Candidatus Koribacter, Edaphobacter, Rhodoplanes, Pedosphaera, and Chthoniobacter (Acidobacteria) were distributed more in soil of ER than in soil of NER. Bacteria such as Actinomycetes, Actinomadura, Thermogemmatispora, Streptomyces, etc., were widely distributed in the soil of NER but less in the soil of ER.
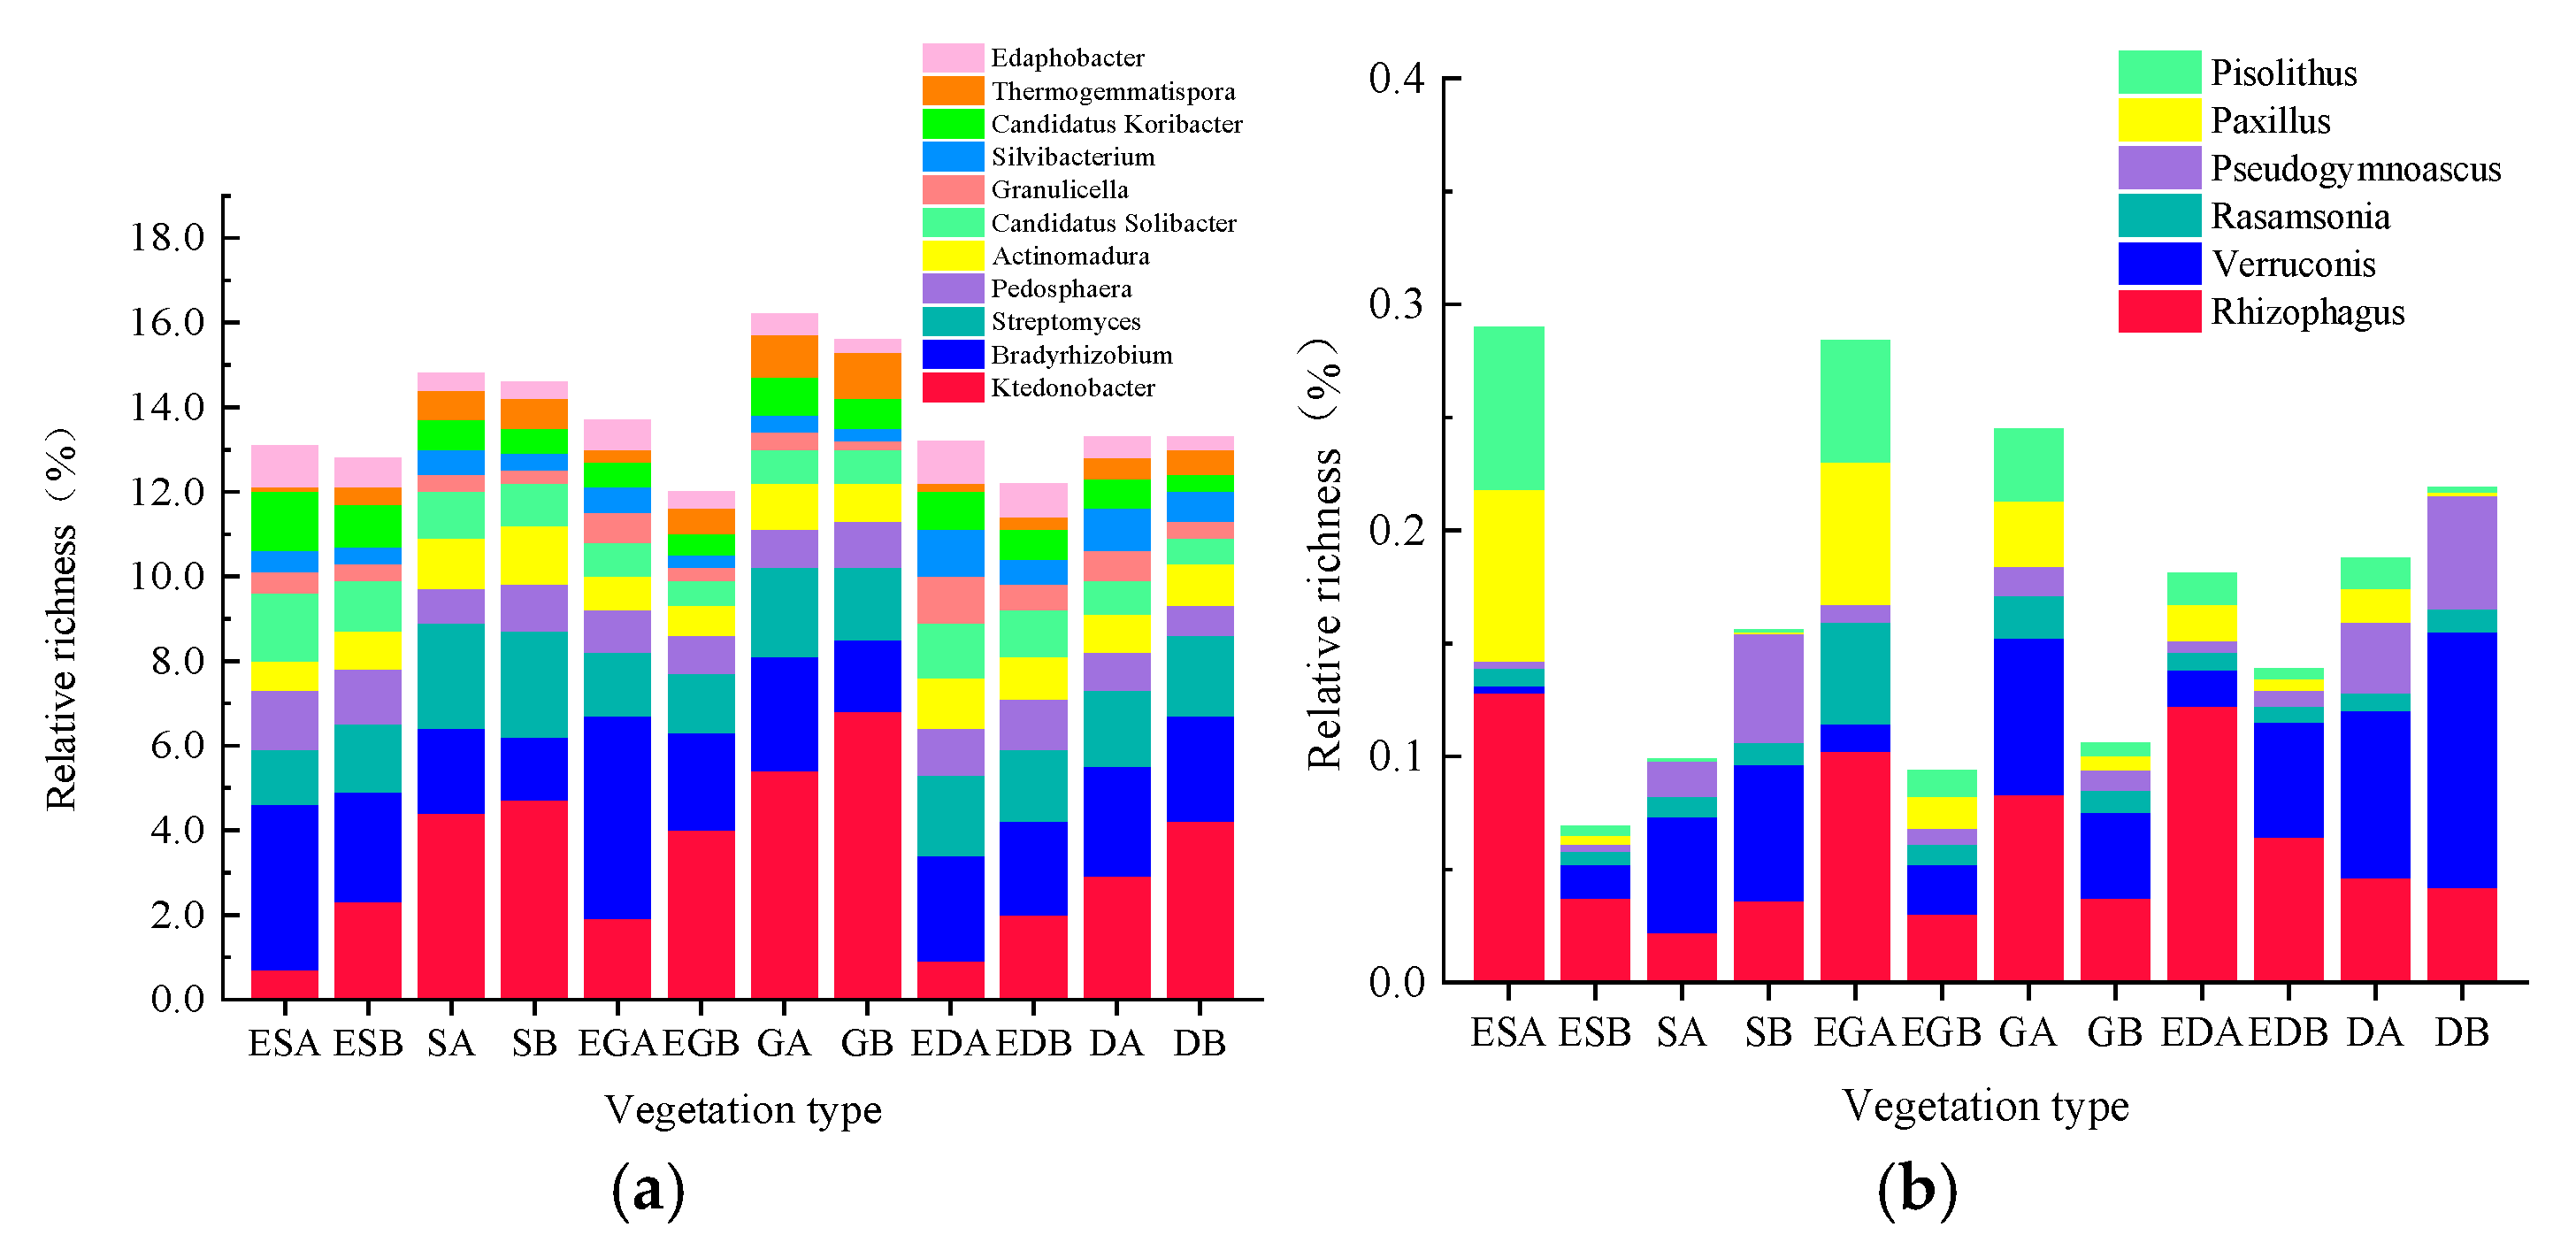
Further, the top 11 dominant bacterial genera (relative richness >1.28%) were ranked (Figure 5a). The relative richness of Bradyrhizobium (Proteobacteria) and Candidatus Solibacter (ER: 1.2 ± 0.4% vs. NER: 0.9 ± 0.1%), Candidatus Koribacter (ER: 1.0 ± 0.4% vs. NER: 0.7 ± 0.1%), and Edaphobacter (ER: 0.9 ± 0.1% vs. NER: 0.4 ± 0.1%) in soil was significantly higher in ER than in NER (p < 0.05, one-way ANOVA with Tukey’s HSD test), whereas the relative richness of Ktedonobacter and Thermogemmatispora (Chloroflexi) and Streptomyces and Actinomadura (Actinobacteria) in soil was significantly lower in ER than in NER (p < 0.05). In this study, the richness of fungal flora was lower than that of bacterial flora, but, considering that fungal flora also played an important role in cellulose degradation, the dominant fungal flora that ranked in the top six (relative richness > 0.08%) were also considered based on the same metagenomic analysis (Figure 5b). The relative richness of fungi such as Rhizophagus (ER: 0.1 ± 0.0% vs. NER: 0.0 ± 0.0%) (Glomeromycota), Paxillus (ER: 0.1 ± 0.0% vs. NER: 0.0 ± 0.0%), and Pisolithus (ER: 0.1 ± 0.0% vs. NER: 0.0 ± 0.0%) in soil was significantly higher in ER than in NER (p < 0.05), whereas the relative richness of fungi such as Verruconis (Deuteromycotina) and Pseudogymnoascus (Ascomycota) in soil was significantly lower in ER than in NER (p < 0.05).

3.4. Microbial Functions in Different Vegetation Restoration Types

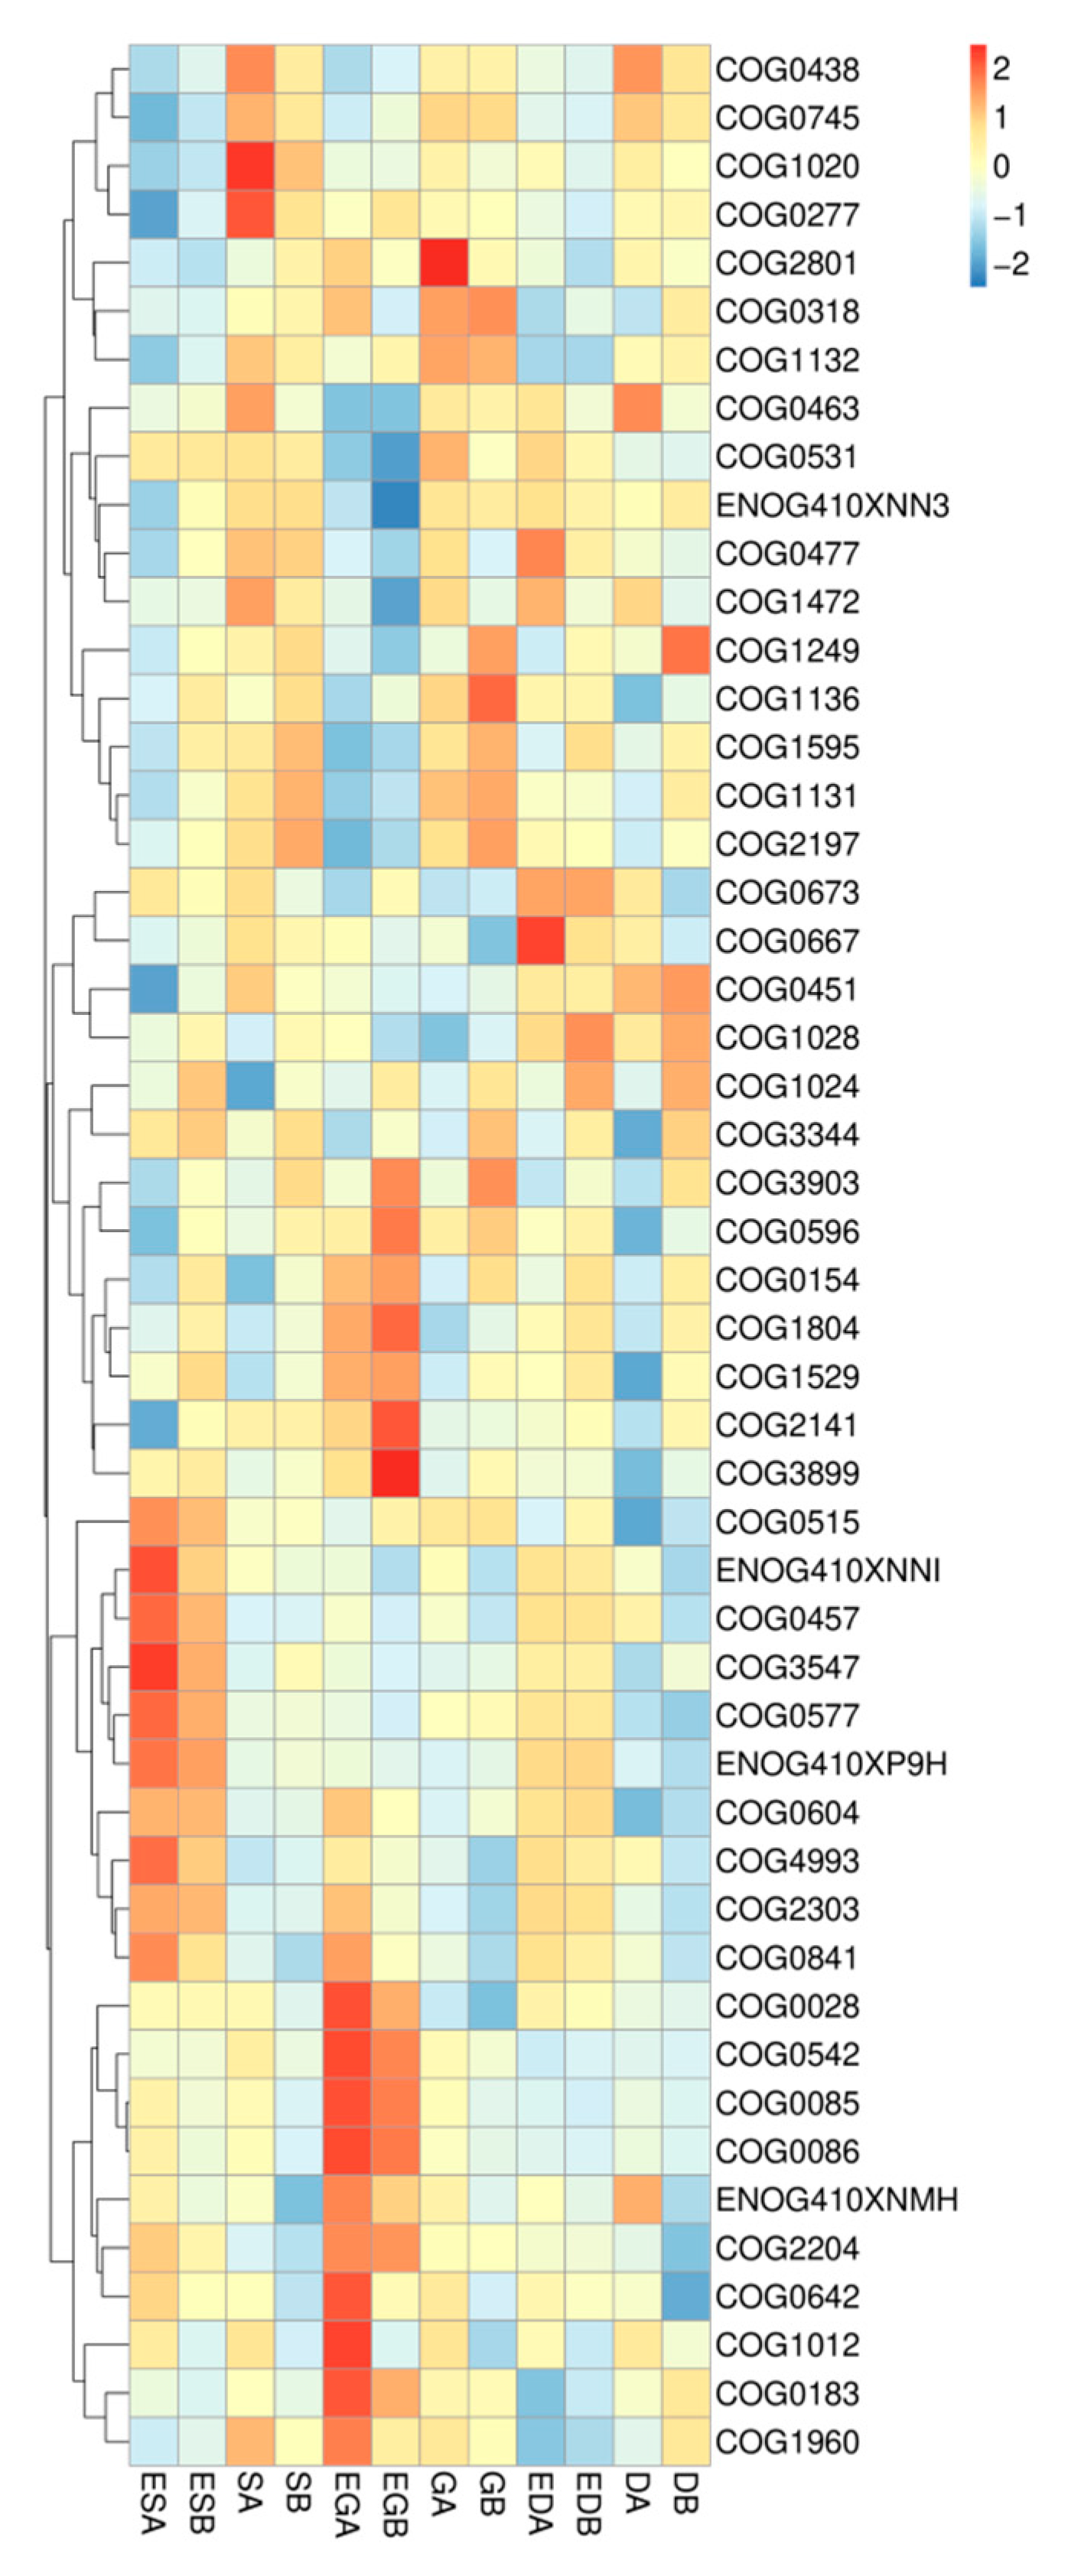
Functional genes related to the synthesis, metabolism, modification, and transport of microbial cell proteins (such as COG0028, COG0542, COG0515, COG0577, and ENOG410XP9H) and related to DNA synthesis and transport (such as COG2204, COG0085, COG0086, COG3547), as well as genes related to organic matter decomposition (such as COG2303, COG4993, COG1012, COG1960, COG0604), were more distributed in the soil of ER but less in the soil of NER. However, functional genes related to microbial cell wall/membrane/envelope biogenesis (such as COG0438, COG0451, COG0463) were more distributed in the soil of NER but less in the soil of ER (Figure 6).

3.5. The Microbial Symbiosis Network in Different Vegetation Restoration Types

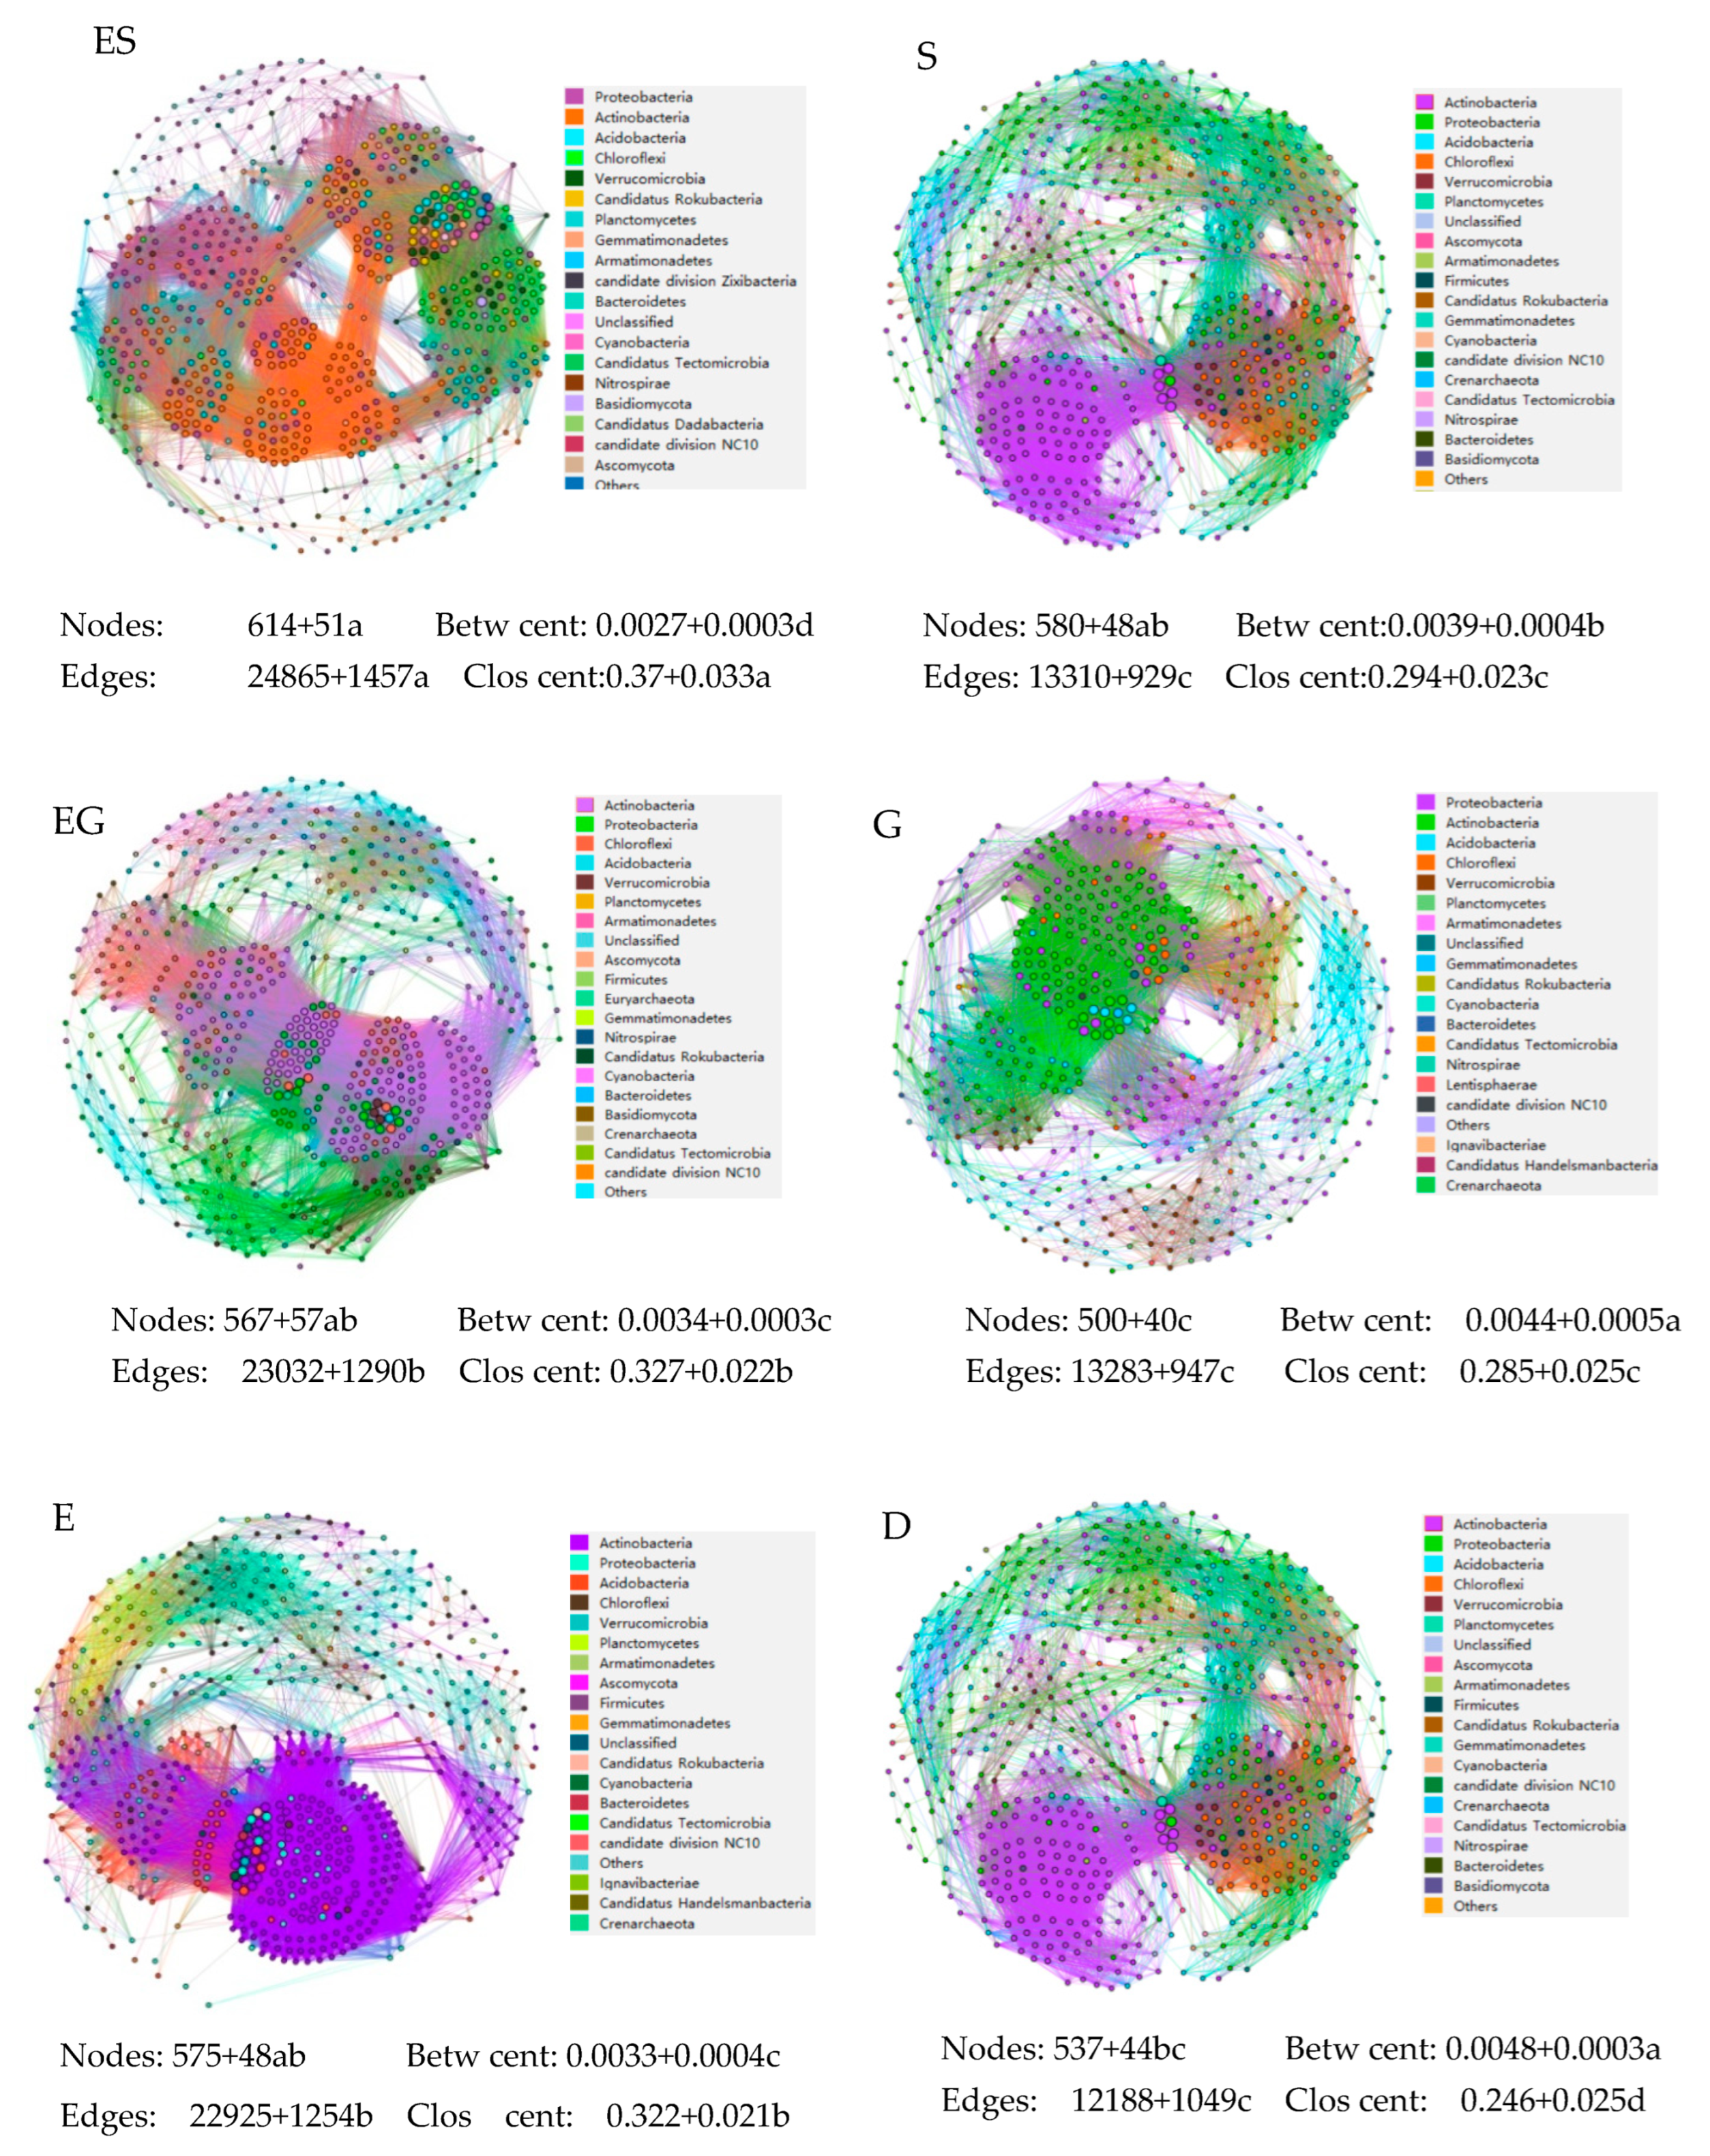
The ER network harbored 109, 75, and 64 keystone taxa in ES, EG, and ED, respectively, compared to none in NER. For the overall network, OTUs with a degree greater than 100, closeness centrality higher than 0.400, and betweenness centrality lower than 0.0020 were selected as the keystone taxa. The majority of these keystone taxa belonged to the phyla Actinobacteria (38 OTUs in ES, 41 OTUs in EG, and 53 OTUs in ED), Proteobacteria (18 OTUs in ES, 8 OTUs in EG, and 9 OTUs in ED), and Acidobacteria (17 OTUs in ES, 3 OTUs in EG, and 1 OTU in ED) (Figure 6, Table 4).
The evaluation of soil microbial symbiotic network complexity relies on several key topological metrics. In the network, “nodes” correspond to distinct microbial operational taxonomic units (OTUs), where a greater number of nodes indicates a higher microbial species richness and larger network scale. “Edges” represent symbiotic relationships between nodes, with more edges signifying more frequent interactions and stronger associations among microorganisms. “Closeness centrality” reflects the efficiency of information transfer between nodes—higher values indicate a better network connectivity and stronger integration. Conversely, “betweenness centrality” measures the extent to which nodes serve as network hubs, with lower values suggesting a more decentralized structure that enhances stability and robustness. As can be seen in Figure 7, the soil microbial symbiotic network in ER had higher node numbers, edge numbers, and closeness centrality, but lower betweenness centrality than that in NER (p < 0.05), indicating a higher correlation complexity among soil microorganisms in ER. The soil microbial symbiotic network in ES exhibited higher node numbers, edge numbers, and closeness centrality, yet lower betweenness centrality compared to that in EG and ED (Figure 7, p < 0.05), suggesting that the network complexity was highest among soil microorganisms in ES.
The nodes in the diagram represent OTUS, and their size is proportional to the number of connections. The higher the node edge numbers and closeness centralities (Clos cent), and the smaller the betweenness centralities (Betw cent), the greater the network complexity is. The symbiotic network complexity of the top 20 microorganism phyla is shown, and the intensity of the symbiotic relationship of microorganism phyla gradually weakens from top to bottom in the legend. Betw cent and Clos cent represent betweenness centralities and closeness centralities, respectively. Different letters indicate significant differences in vegetation types (n = 7, p < 0.05). Significant differences among vegetation types (indicated by different letters) were determined using one-way ANOVA followed by Tukey’s post hoc test (n = 7, p < 0.05).

4. Discussion

4.1. Effects of Vegetation Restoration Types on Soil MBC, MBN, and MBP and Their Stoichiometric Ratios

This study showed that the MBC, MBN, and MBP of ER were significantly higher than those of NER. This might be related to the higher soil nutrients, such as C, N, and P, in ER. A higher soil C, N, and P environment can provide more nutrients for microbial growth and reproduction, thus enriching the microbial population and increasing the microbial biomass content [31]. The vegetation of ER grew better, the amount of litter input was higher, and the C, N, and P nutrients that returned to the soil were correspondingly higher (Table 1 and Table 2). Therefore, the soil MBC, MBN, and MBP of ER were higher.
This study also showed that the soil MBC, MBN, and MBP were higher in ES than in EG and ED. This pattern can be attributed to the significantly higher soil nutrient content in ES (Table 2), coupled with a more open habitat structure, which facilitated gas exchange (aeration). In contrast, the habitat of Eucalyptus-herbaceous types (especially ED) was characterized by a dense accumulation of seasonal litters that impeded aeration, thereby hindering microbial growth and leading to lower biomass.
No significant difference was found in the soil MBC/MBP, MBC/MBN, and MBN/MBP ratios among different vegetation restoration types, which indicated that the stoichiometric amount of soil microbial biomass was not affected by environmental factors such as vegetation types and soil nutrients, and was consistent with the results obtained by Li et al. [32]. The reason might be that soil microorganisms maintain microbial homeostasis by adjusting their community structure and population dynamics to stabilize the C/N/P ratios [33], thereby enhancing their resistance to environmental stress [34].

4.2. Effects of Vegetation Restoration Types on Microbial Diversity

No significant difference was found in soil microbial richness among different vegetation restoration types, which might be attributed to the internal stability of microorganisms that maintained a relatively stable number of microbial species across various vegetation habitats. Soil microorganisms had a self-balancing mechanism, and the community composition could be changed by adjusting their own structural composition and population dynamics to maintain internal stability [33]. Griebler et al. (2009) also showed that the number of microbial species was less affected by the environment, and the total number of microbial species could remain relatively stable in habitats with either abundant or scarce resources of nutrients and water [35]. Therefore, although differences were observed in the soil microbial species composition between Eucalyptus vegetation restoration with abundant resources and natural vegetation restoration without Eucalyptus with insufficient resources, there was little difference in the total number of soil microbial species between them, and the total number of soil microbial species was relatively stable.
Diversity includes two indicators of community richness and evenness [36], in which evenness plays an essential role in the measurement of diversity. Studies have shown that, the higher the microbial species evenness, the higher the community species diversity, and vice versa [37]. The evenness of microbial species was affected by the uniformity of resource distribution in the environment, and the uniformity of microbial species distribution increased with the increase in the uniformity of resource distribution in the environment [38]. The soil microbial diversity and evenness in ER were lower than in NER. This may be attributed to the differences in resource distribution uniformity influenced by vegetation type. Although ER had better vegetation restoration and higher coverage, it likely exhibited a greater heterogeneity in resource distribution—such as between wooded areas and gaps, or rhizosphere versus non-rhizosphere zones. Consequently, resource distribution in Eucalyptus restoration sites was less even, leading to a correspondingly lower soil microbial diversity and evenness. In contrast, NER, with a lower vegetation cover and higher bare soil rate, showed relatively uniform habitat resources, which supported a more even distribution of soil microbial species and higher overall diversity.
Therefore, the relatively low microbial diversity in the soil of the Eucalyptus vegetation restoration type was not caused by the low species number and richness due to the restriction of microbial growth and reproduction by the limitation of nutrient resources, but by the uneven distribution of microbial species richness in the soil.

4.3. Effects of Vegetation Restoration Types on Microbial Species Structure and Composition

Soil–plant–microbial interactions may contribute to variations in soil microbial communities among different types of forest ecosystems [39]. Therefore, different vegetation habitats may lead to different species structures and compositions of soil microorganisms [40]. Significant differences were found in the soil microbial structure and composition between ER and NER at the phylum, genus, and species levels. The relative abundance of soil organic matter-decomposing microorganisms—including certain soil bacteria (e.g., Candidatus Solibacter, Candidatus Koribacter, and Edaphobacter [41,42]), endophytic fungi (e.g., Rhizophagus [43]), ectomycorrhizal fungi (e.g., Paxillus and Pisolithus [44,45]), and rhizobia (e.g., Bradyrhizobium)—was generally higher in ER. In contrast, drought-tolerant and light/heat-preferring microorganisms such as Ktedonobacter, Thermogemmatispora [46,47], Streptomyces, and Actinomadura [29] were more abundant in NER. This divergence was closely associated with differences in vegetation and environmental conditions. In ER, high plant coverage and substantial organic matter inputs (e.g., litter) supported a greater abundance of microbial decomposers. Moreover, the presence of numerous host plants facilitated the formation of mutualistic symbioses with rhizobia (e.g., Bradyrhizobium) and mycorrhizal fungi (e.g., Rhizophagus), wherein the microbes enhance plant nitrogen nutrition through fixation in exchange for carbon sources from the hosts [48,49]. In contrast, NER had sparse vegetation, limited litter accumulation, and stronger light and heat exposure, leading to drier soil conditions. Consequently, drought- and radiation-tolerant microorganisms (e.g., Ktedonobacter) were more prevalent in NER due to their adaptation to arid, high-insolation environments. The richness of Bradyrhizobium, rhizophagus, Paxillus, and Pisolithus in the soil of ES was higher than that of other Eucalyptus vegetation types (EG and ED), which might be due to the high understory species richness and diversity in ES, with a large number of various types of plant roots that easily formed symbiotic relationships with rhizobia and mycorrhiza.
The composition of species structure varies with the change in environment [40]. No significant difference was found in the soil microbial structure among ES, EG, and ED at the phylum level, which reflected certain similarities in the soil microbial structure among these groups. This might be attributed to the similar microclimate environments created for soil microorganisms by Eucalyptus vegetation habitats. For example, Eucalyptus vegetation restoration habitats had low light and high moisture and nutrients, indicating that all microbial populations were tolerant to shade, humidity, and nutrients. However, the soil microbial structure of ES was significantly different from that of EG and ED at the genus and species levels, which might be caused by the different microenvironments formed by different understory types. Studies have shown that shrub litter possessed a lower C/N ratio compared to herbaceous litter [50,51]. Accordingly, in ES, which featured a high diversity of shrub understory species and abundant litter, the litter was characterized by a high lignin content and a low C/N ratio. Consequently, lignin-decomposing microorganisms with lower C/N requirements were more prevalent in the soil. In contrast, the litter in EG and ED primarily consisted of non-lignin material with a high C/N ratio, which favored the abundance of non-lignin decomposers exhibiting higher C/N demands.
A key factor driving microbial community composition at the finer taxonomic levels was soil pH. We found a clear relationship between a low soil pH and the abundance of acidophilic bacteria. Specifically, the soil under D. pedata vegetation (ED) had a characteristically low pH, which created a favorable environment for acidophilic bacteria. This explains the significantly higher distribution of known acidophilic genera, such as Granulicella, Terracidiphilus, Bryocella, and Terriglobus [52,53,54,55], in the ED soil compared to the ES and EG soils, which had relatively higher pH values.
Thus, no significant difference was found in the soil microbial structure between ES and EG and ES and ED at the phylum level, but significant differences were observed at the genus and species levels.

4.4. Effects of Vegetation Restoration Types on Microbial Functions

Functional genes related to the synthesis, metabolism, modification, and transport of microbial cell proteins and related to DNA synthesis and transport, as well as genes related to organic matter decomposition, were more distributed in the soil of ER but less in the soil of NER. This may be because the high input of organic matter such as litter and roots was conducive to attracting more microbial decomposers, and the high content of soil nutrient resources was conducive to the growth, reproduction, and metabolic activities of soil microorganisms, which made soil microorganisms, especially decomposers, grow and reproduce more vigorously, and their functional genes were more distributed in ER correspondingly. However, functional genes related to microbial cell wall, membrane, and envelope biogenesis were more distributed in the soil of NER but less in the soil of ER. This might be related to the lack of water in NER soil, which is not conducive to the decomposition of hyphae, cell walls, and cell membranes produced by microorganisms, and thus causes most of them to eventually transform into microbial necromass and become sequestered [56,57,58]. Therefore, the functional genes related to microbial cell wall, cell membrane, and encapsulated biogenesis were more distributed in the arid soil of NER. The results were consistent with the discovery by Song et al. [59] that the functional genes related to microbial cell wall, membrane, and biofilm biogenesis were negatively correlated with the annual average precipitation in an arid desert grassland. In conclusion, the Eucalyptus vegetation restoration type is conducive to the growth and reproduction of soil microorganisms and to attracting more organic decomposers.

4.5. Effects of Vegetation Restoration Types on the Microbial Symbiosis Network

The majority of these keystone taxa belonged to the phyla Actinobacteria, Proteobacteria, and Acidobacteria in ER, which were also the most abundant phyla. In Acinetobacter, some keystone species belong to the genera Candidatus solibater and Candidatus koribacter, indicating that these microbial decomposers play an important role in microbial symbiosis. In Proteobacteria, some keystone species belong to the order Rhizobiales, known for their nitrogen fixation ability. The occurrence of keystone species of Rhizobia indicated the influence of root activities on the symbiotic relationships of microorganisms in soil. Other keystone species also play an important role in microbial symbiosis, but their function needs to be further explored.
The degradation of organic matter, the cycling of soil carbon, nitrogen, and phosphorus nutrients, and the transformation of nutrient forms all need the participation of soil microorganisms. Soil organic matter can reduce soil thermal conductivity, increase soil thermal capacity, reduce soil temperature variability, reduce soil daily temperature and seasonal temperature fluctuations [60], and reduce the death of soil microorganisms from temperature variation. This study showed that the relationships in the soil microbial symbiotic network were more complex in ER than in NER. This might be attributed to the presence of a greater abundance of functional microorganisms, such as Candidatus Solibacter and Candidatus Koribacter, in the soil of ER. Due to the high input of organic matter from litter and roots, these microorganisms were actively involved in decomposing organic compounds and facilitating the transformation of soil carbon, nitrogen, and phosphorus nutrients, thereby enhancing the functional diversity of the soil microbial community. In addition, the high soil nutrients and sufficient water environment of ER could also provide suitable nutrient environment conditions for the growth and reproduction of functional microorganisms [29], and high organic soil conditions can also reduce the death of functional flora from soil temperature variation. Therefore, the microbial functional diversity and the complexity of the symbiotic network of ER were high. On the contrary, the vegetation coverage and the input of organic matter such as litter and roots in NER were low, and the soil environment with high light, drought, and a low organic matter content often hindered the growth and reproduction of microorganisms, and most functional microorganisms died of their discomfort in the harsh environment. This was consistent with the results that the photophilic, drought- and barren-tolerant microorganisms, such as Ktedonobacter and Thermogemmatispora, were more distributed in NER. Therefore, the functional diversity of soil microorganisms in NER was relatively simple. In addition, ER had an abundance of keystone taxa, while NER had none, possibly supporting the higher symbiotic network complexity and connectivity in ER. In conclusion, planting Eucalyptus is conducive to promoting the growth and reproduction of soil microorganisms, enhancing the interactions between soil microorganisms and improving their functional diversity and symbiosis.
The correlation complexity between soil microorganisms was higher in ES than in EG and ED. This might also be related to the difference in habitat nutrient resources and organic matter content caused by vegetation types. The soil C, N, and P nutrient resources and organic matter content of ER were in the order of ES > EG > ED in the study. Therefore, the order of correlation complexity among soil microorganisms in ER was ES > EG > ED. In addition, other environmental conditions such as habitat permeability and pH might be factors affecting the complexity of soil microbial symbiotic networks. A low habitat permeability and pH could prevent the growth and reproduction of soil microorganisms and reduce the metabolic activity and functional diversity of microorganisms [61,62]. Specifically, in the Eucalyptus-herb type (especially ED), the seasonal withering and death of a large number of plants directly caused a substantial input and accumulation of litter. This litter layer, in turn, reduced the habitat permeability. The combined effects of litter accumulation and low permeability inhibited microbial growth and reproduction, leading to a reduced functional diversity and symbiotic network complexity. Therefore, compared to the Eucalyptus-herb types, the superior conditions in ES promoted a greater functional diversity and stronger interactions among soil microorganisms, which in turn fostered a greater abundance of keystone taxa and drove the highest symbiotic network complexity and connectivity.

5. Conclusions

Our research results showed obvious differences in microbial structure and composition and function between ER and NER. Microbial decomposers (e.g., bacterial genera Candidatus Solibacter and fungal genus Rhizophagus) and their growth- and decomposition-related genes were highly rich in ER. In contrast, NER hosted more acidophilic and drought-tolerant genera (e.g., Ktedonobacter, Streptomyces) and genes involved in cell wall and membrane biogenesis. Eucalyptus plantations, particularly the ES vegetation restoration type, can enhance the growth, reproduction, and metabolic activity of soil microorganisms, promote the abundance of keystone taxa, and strengthen microbial interactions as well as functional diversity. Despite the documented water and nutrient consumption of Eucalyptus plantations, which could cause long-term soil depletion, this study demonstrated that the introduction of Eucalyptus (particularly the ES restoration type) effectively enhanced soil microbial properties and fostered the recovery of fertility in severely degraded soils where natural regeneration was challenging.
In conclusion, Eucalyptus plantations, especially ES types, can effectively improve soil microbial characteristics, accelerate the improvement of soil quality and fertility, and accelerate the recovery of degraded soil fertility. Therefore, in areas with serious soil degradation and where natural vegetation restoration is difficult, planting Eucalyptus, especially while guiding the understory vegetation to develop into the shrub vegetation type, is an effective vegetation restoration model. Our research results can provide a theoretical reference for ecological restoration and sustainable management in soil degradation areas.

Author Contributions

Conceptualization, J.Z. and X.O.; methodology, J.Z. and S.X.; formal analysis, J.Z., Z.C. and X.O.; investigation, J.Z., Z.C., K.Y., H.X. and S.X.; data curation, J.Z., S.X., H.X. and X.O.; writing—original draft preparation, J.Z.; writing—review and editing, Z.C., K.Y. and X.O.; visualization, J.Z. and H.X.; funding acquisition, J.Z. and X.O. All authors have read and agreed to the published version of the manuscript.

Funding

This research was funded by the High-Level Talent Special Research Fund of Lingnan Normal University (2025) and the National Natural Science Foundation of China (grant numbers 31760207, 31360181).

Institutional Review Board Statement

Not applicable.

Informed Consent Statement

Not applicable.

Data Availability Statement

The data presented in this study are available on request from the corresponding author.

Conflicts of Interest

The authors declare no conflicts of interest.

References

  1. Breulmann, M.; Masyutenko, N.P.; Kogut, B.M.; Schroll, R.; Dörfler, U.; Buscot, F.; Schulz, E. Short-term bioavailability of carbon in soil organic matter fractions of different particle sizes and densities in grassland ecosystems. Sci. Total Environ. 2014, 497, 29–37. [Google Scholar] [CrossRef] [PubMed]
  2. Shi, F.; Ren, J.; Zhang, Y. Updates on Plants, Soil, Microorganisms, and Their Interactions in Forest Ecosystems. Forests 2024, 16, 58. [Google Scholar] [CrossRef]
  3. Zhang, X.; Gao, G.; Wu, Z.; Wen, X.; Zhong, H.; Zhong, Z.; Yang, C.; Bian, F.; Gai, X. Responses of soil nutrients and microbial communities to intercropping medicinal plants in moso bamboo plantations in subtropical China. Environ. Sci. Pollut. R. 2020, 27, 2301–2310. [Google Scholar] [CrossRef] [PubMed]
  4. Harris, J. Measurements of the soil microbial community for estimating the success of restoration. Eur. J. Soil Sci. 2003, 54, 801–808. [Google Scholar] [CrossRef]
  5. Valentini, A.; Taberlet, P.; Miaud, C.; Civade, R.; Herder, J.; Thomsen, P.F.; Dejean, T. Next-generation monitoring of aquatic biodiversity using environmental DNA metabarcoding. Mol Ecol. 2016, 25, 929–942. [Google Scholar] [CrossRef]
  6. Deng, J.; Bai, X.; Zhou, Y.; Zhu, W.; Yin, Y. Variations of soil microbial communities accompanied by different vegetation restoration in an open-cut iron mining area. Sci. Total Environ. 2020, 704, 135243–135254. [Google Scholar] [CrossRef]
  7. Zheng, L.; Song, W. Phosphorus limitation of trees influences forest soil fungal diversity in China. Forests 2022, 13, 223. [Google Scholar] [CrossRef]
  8. Pan, J.; Peng, Y.; Wang, J.; Tian, D.; Zhang, R.; Li, Y.; Niu, S. Controlling factors for soil bacterial and fungal diversity and composition vary with vegetation types in alpine grasslands. Appl. Soil. Ecol. 2023, 184, 104777–104787. [Google Scholar] [CrossRef]
  9. McBride, S.G.; Choudoir, M.; Fierer, N.; Strickland, M.S. Volatile organic compounds from leaf litter decomposition alter soil microbial communities and carbon dynamics. Ecology 2020, 101, e03130. [Google Scholar] [CrossRef]
  10. Waldrop, M.P.; Holloway, J.M.; Smith, D.B.; Goldhaber, M.B.; Drenovsky, R.E.; Scow, K.M.; Dick, R.; Howard, D.; Wylie, B.; Grace, J.B. The interacting roles of climate, soils, and plant production on soil microbial communities at a continental scale. Ecology 2017, 98, 1957–1967. [Google Scholar] [CrossRef]
  11. Liu, K.L.; Chen, B.Y.; Zhang, B.; Wang, R.H.; Wang, C.S. Understory vegetation diversity, soil properties and microbial community response to different thinning intensities in Cryptomeria japonica var. sinensis plantations. Front. Microbiol. 2023, 14, 1117384–1117397. [Google Scholar] [CrossRef] [PubMed]
  12. Yan, L.; Peng, H.; Zhang, S.; Zhang, R.; Kašanin-Grubin, M.; Lin, K.; Tu, X. The Spatial Patterns of Red Beds and Danxia Landforms: Implication for the formation factors-China. Sci. Rep. 2019, 9, 1961. [Google Scholar] [CrossRef] [PubMed]
  13. Yan, P.; Lin, K.R.; Yu, C.X.; Tu, X.J. Spatial Variability of Soil Phosphorus and Potassium and Its Influencing Factors in the Fragile Red Beds Ecosystem in Southern China. Pol. J. Environ. Stud. 2021, 30, 5307–5315. [Google Scholar] [CrossRef]
  14. Fu, D.G.; Wu, X.N.; Duan, C.Q.; Chadwick, D.R.; Jones, D.L. Response of soil phosphorus fractions and fluxes to different vegetation restoration types in a subtropical mountain ecosystem. Catena 2020, 193, 104663. [Google Scholar] [CrossRef]
  15. Jiang, C.; He, Y.; Cui, Y.; Lan, Y.; Zhang, H.; Ye, S. Soil Microbial Communities Responses to Multiple Generations’ Successive Planting of Eucalyptus Trees. Forests 2024, 15, 1166. [Google Scholar] [CrossRef]
  16. Medeiros, P.L.D.; Pimenta, A.S.; Miranda, N.D.O.; Melo, R.R.D.; Amorim, J.D.S.; Azevedo, T.K.B.D. The myth that Eucalyptus trees deplete soil water—A review. Forests 2025, 16, 423. [Google Scholar] [CrossRef]
  17. Paulucio, V.D.O.; Silva, C.F.D.; Martins, M.A.; Pereira, M.G.; Schiavo, J.A.; Rodrigues, L.A. Reforestation of a degraded area with Eucalyptus and Sesbania: Microbial activity and chemical soil properties. Rev. Bras. Cienc. Solo 2017, 41, e0160239-52. [Google Scholar] [CrossRef]
  18. Boulmane, M.; Oubrahim, H.; Halim, M.; Bakker, M.R.; Augusto, L. The potential of Eucalyptus plantations to restore degraded soils in semi-arid Morocco (NW Africa). Ann. For. Sci. 2017, 74, 57. [Google Scholar] [CrossRef]
  19. Zhong, J.; Pan, P.; Xiao, S.; Ouyang, X. Influence of Eucalyptus plantation on soil organic carbon and its fractions in severely degraded soil in Leizhou Peninsula, China. Forests 2022, 13, 1606. [Google Scholar] [CrossRef]
  20. Li, J.; Li, H.; Zhou, X.; Zhao, X.; Yan, J. Labile and recalcitrant organic matter and microbial communities in soil after conversion of abandoned lands in the Loess Plateau, China. Soil Sci. 2011, 176, 313–325. [Google Scholar] [CrossRef]
  21. Hu, P.; Xiao, J.; Zhang, W.; Xiao, L.; Yang, R.; Xiao, D.; Zhao, J.; Wang, K. Response of soil microbial communities to natural and managed vegetation restoration in a subtropical karst region. Catena 2020, 195, 104849–104859. [Google Scholar] [CrossRef]
  22. Zhong, J.D.; Cheng, X.L.; Zhou, X.X.; Liu, K.D.; Yuan, C.C.; Chen, Y. The analysis of Ceriops tagal development trend in different tide level. J. Cent. South Univ. For. Technol. 2015, 35, 74–78. [Google Scholar]
  23. Han, W.D.; Huang, J.J. Study on tree species characteristics of natural forest community in Leizhou peninsula based on flora. Acta Ecol. Sin. 2017, 37, 8537–8548. [Google Scholar] [CrossRef]
  24. Bao, S.D. Soil and Agricultural Chemistry Analysis, 3rd ed.; China Agriculture Press: Beijing, China, 2019. [Google Scholar]
  25. Manral, V.; Bargali, K.; Bargali, S.S.; Jhariya, M.K.; Padalia, K. Relationships between soil and microbial biomass properties and annual flux of nutrients in Central Himalaya forests, India. Land Degrad. Dev. 2022, 33, 2014–2025. [Google Scholar] [CrossRef]
  26. Ladd, J.; Amato, M. Relationship between microbial biomass carbon in soils and absorbance (260 nm) of extracts of fumigated soils. Soil. Biol. Biochem. 1989, 21, 457–459. [Google Scholar] [CrossRef]
  27. Brookes, P.; Powlson, D.; Jenkinson, D. Measurement of microbial biomass phosphorus in soil. Soil. Biol. Biochem. 1982, 14, 319–329. [Google Scholar] [CrossRef]
  28. Csardi, G.; Nepusz, T. The igraph software package for complex network research. Complex Syst. 2005, 1695, 1–9. [Google Scholar]
  29. Qiu, L.; Zhang, Q.; Zhu, H.; Reich, P.B.; Banerjee, S.; van der Heijden, M.G.A.; Sadowsky, M.J.; Ishii, S.; Jia, X.X.; Shao, M.A.; et al. Erosion reduces soil microbial diversity, network complexity and multifunctionality. ISME J. 2021, 15, 2474–2489. [Google Scholar] [CrossRef]
  30. Song, W. Negative Linear or Unimodal: Why Forest Soil Fungal Latitudinal Diversity Differs across China. Microbiol. Spectr. 2023, 11, e02515-22. [Google Scholar] [CrossRef] [PubMed]
  31. Li, F.R.; Zhao, W.Z.; Liu, J.L.; Huang, Z.G. Degraded vegetation and wind erosion influence soil carbon, nitrogen and phosphorus accumulation in sandy grasslands. Plant Soil. 2008, 317, 79–92. [Google Scholar] [CrossRef]
  32. Li, Y.T.; Yu, Y.H.; Song, Y.P. Stoichiometry of Soil, microorganisms, and extracellular enzymes of Zanthoxylum planispinum var. dintanensis plantations for different allocations. Agronomy 2022, 12, 15–27. [Google Scholar]
  33. Khan, K.S.; Joergensen, R.G. Stoichiometry of the soil microbial biomass in response to amendments with varying C/N/P/S ratios. Biol. Fert. Soils. 2019, 55, 265–274. [Google Scholar] [CrossRef]
  34. Hu, N.; Li, H.; Tang, Z.; Li, Z.; Li, G.; Jiang, Y.; Hu, X.M.; Lou, Y. Community size, activity and C:N stoichiometry of soil microorganisms following reforestation in a Karst region. Eur. J. Soil. Biol. 2016, 73, 77–83. [Google Scholar] [CrossRef]
  35. Griebler, C.; Lueders, T. Microbial biodiversity in groundwater ecosystems. Freshw. Biol. 2009, 54, 649–677. [Google Scholar] [CrossRef]
  36. Naveed, M.; Herath, L.; Moldrup, P.; Arthur, E.; Nicolaisen, M.; Norgaard, T.; Ferré, T.P.A.; de Jonge, L.W. Spatial variability of microbial richness and diversity and relationships with soil organic carbon, texture and structure across an agricultural field. Appl. Soil. Ecol. 2016, 103, 44–55. [Google Scholar] [CrossRef]
  37. Oyang, X.Z.; Ding, S. Species diversity and distribution pattern of main evergreen broad-leaved forests in Jinggangshan National Nature Reserve. Pract. forest Tech. 2014, 9, 16–20. [Google Scholar]
  38. Zheng, W.; Wu, Q.; Rao, C.; Chen, X.; Wang, E.; Liang, X.; Yan, W. Characteristics and interactions of soil bacteria, phytocommunity and soil properties in rocky desertification ecosystems of Southwest China. Catena 2023, 220, 106731–106743. [Google Scholar] [CrossRef]
  39. Song, W.; Zhou, Y. Linking leaf δ15N and δ13C with soil fungal biodiversity, ectomycorrhizal and plant pathogenic abundance in forest ecosystems of China. Catena 2021, 200, 105176. [Google Scholar] [CrossRef]
  40. Zhao, X.; Huang, J.; Lu, J.; Sun, Y. Study on the influence of soil microbial community on the long-term heavy metal pollution of different land use types and depth layers in mine. Ecotox. Environ. Safe. 2019, 170, 218–226. [Google Scholar] [CrossRef]
  41. Zhang, P.; Cui, Z.; Guo, M.; Xi, R. Characteristics of the soil microbial community in the forestland of Camellia oleifera. PeerJ 2020, 8, e9117. [Google Scholar] [CrossRef]
  42. Su, Y.; He, Z.; Yang, Y.; Jia, S.; Yu, M.; Chen, X.; Shen, A. Linking soil microbial community dynamics to straw-carbon distribution in soil organic carbon. Sci. Rep. 2020, 10, 5526–5538. [Google Scholar] [CrossRef]
  43. Hodge, A.; Campbell, C.D.; Fitter, A.H. An arbuscular mycorrhizal fungus accelerates decomposition and acquires nitrogen directly from organic material. Nature 2001, 413, 297–299. [Google Scholar] [CrossRef]
  44. Rineau, F.; Roth, D.; Shah, F.; Smits, M.; Johansson, T.; Canbäck, B.; Olsen, P.B.; Persson, P.; Grell, M.N.; Lindquist, E.; et al. The ectomycorrhizal fungus Paxillus involutus converts organic matter in plant litter using a trimmed brown-rot mechanism involving Fenton chemistry. Environ. Microbiol. 2012, 14, 1477–1487. [Google Scholar] [CrossRef]
  45. Cao, W.; Crawford, D.L. Carbon nutrition and hydrolytic and cellulolytic activities in the ectomycorrhizal fungus Pisolithus tinctorius. Can. J. Microbiol. 1993, 39, 529–535. [Google Scholar] [CrossRef]
  46. Cavaletti, L.; Monciardini, P.; Bamonte, R.; Schumann, P.; Rohde, M.; Sosio, M.; Donadio, S. New lineage of filamentous, spore-forming, gram-positive bacteria from soil. Appl. Environ. Microbiol. 2006, 72, 4360–4369. [Google Scholar] [CrossRef] [PubMed]
  47. Wilson, C.K.; King, G.M. Short-term exposure to thermophilic temperatures facilitates co uptake by thermophiles maintained under predominantly mesophilic conditions. Microorganisms 2022, 10, 656. [Google Scholar] [CrossRef] [PubMed]
  48. Zhou, X.; Xin, J.; Huang, X.; Li, H.; Li, F.; Song, W. Linking Leaf Functional Traits with Soil and Climate Factors in Forest Ecosystems in China. Plants 2022, 11, 3545. [Google Scholar] [CrossRef]
  49. Omari, R.A.; Yuan, K.; Anh, K.T.; Reckling, M.; Halwani, M.; Egamberdieva, D.; Ohkama-Ohtsu, N.; Bellingrath-Kimura, S.D. Enhanced soybean productivity by inoculation with indigenous Bradyrhizobium strains in agroecological conditions of northeast Germany. Front. Plant Sci. 2021, 12, 707080–707094. [Google Scholar] [CrossRef]
  50. Zhou, Y.; Pei, Z.Q.; Su, J.Q.; Zhang, J.L.; Zheng, Y.R.; Ni, J.; Xiao, C.W.; Wang, R.Z. Comparing soil organic carbon dynamics in perennial grasses and shrubs in a saline-alkaline arid region, northwestern China. PLoS ONE 2012, 7, e42927. [Google Scholar] [CrossRef]
  51. Vargas, D.N.; Bertiller, M.B.; Ares, J.O.; Carrera, A.L.; Sain, C.L. Soil C and N dynamics induced by leaf-litter decomposition of shrubs and perennial grasses of the Patagonian Monte. Soil Biol. Biochem. 2006, 38, 2401–2410. [Google Scholar] [CrossRef]
  52. Pankratov, T.A.; Dedysh, S.N. Granulicella paludicola gen. nov., sp. nov., Granulicella pectinivorans sp. nov., Granulicella aggregans sp. nov. and Granulicella rosea sp. nov., acidophilic, polymer-degrading Acidobacteria from Sphagnum peat bogs. Int. J. Syst. Evol. Micr. 2010, 60, 2951–2959. [Google Scholar] [CrossRef]
  53. García-Fraile, P.; Benada, O.; Cajthaml, T.; Baldrian, P.; Lladó, S. Terracidiphilus gabretensis gen. nov., sp. nov., an abundant and active forest soil acidobacterium important in organic matter transformation. Appl. Environ. Microb. 2016, 82, 560–569. [Google Scholar] [CrossRef]
  54. Dedysh, S.N.; Kulichevskaya, I.S.; Serkebaeva, Y.M.; Mityaeva, M.A.; Sorokin, V.V.; Suzina, N.E.; Rijpstra, I.; Sinninghe Damsté, J.S. Bryocella elongata gen. nov., sp. nov., a member of subdivision 1 of the Acidobacteria isolated from a methanotrophic enrichment culture, and emended description of Edaphobacter aggregans Koch et al. 2008. Int. J. Syst. Evol. Micr. 2012, 62 Pt 3, 654–664. [Google Scholar] [CrossRef] [PubMed]
  55. Rawat, S.R.; Männistö, M.K.; Starovoytov, V.; Goodwin, L.; Nolan, M.; Hauser, L.; Land, M.; Davenport, K.W.; Woyke, T.; Häggblom, M.M. Complete genome sequence of Terriglobus saanensis type strain SP1PR4 T, an Acidobacteria from tundra soil. Stand. Genom. Sci. 2012, 7, 59–69. [Google Scholar] [CrossRef]
  56. Joergensen, R.G.; Wichern, F. Quantitative assessment of the fungal contribution to microbial tissue in soil. Soil. Biol. Biochem. 2008, 40, 2977–2991. [Google Scholar] [CrossRef]
  57. Joergensen, R.G. Amino sugars as specific indices for fungal and bacterial residues in soil. Biol Fert Soils 2018, 54, 559–568. [Google Scholar] [CrossRef]
  58. Wang, S.; Zuo, X.; Awada, T.; Medima-Roldán, E.; Feng, K.; Yue, P.; Lian, J.; Zhao, S.; Cheng, H. Changes of soil bacterial and fungal community structure along a natural aridity gradient in desert grassland ecosystems, Inner Mongolia. Catena 2021, 205, 105470–105480. [Google Scholar] [CrossRef]
  59. Song, W.; Wang, Y.; Peng, B.; Yang, L.; Gao, J.; Xiao, C. Structure and function of microbiomes in the rhizosphere and endosphere response to temperature and precipitation variation in Inner Mongolia steppes. Front. Plant Sci. 2023, 14, 1297399. [Google Scholar] [CrossRef] [PubMed]
  60. Abu-Hamdeh, N.H.; Reeder, R.C. Soil thermal conductivity: Effects of density, moisture, salt concentration, and organic matter. Soil. Sci. Soc. Am. J. 2000, 64, 1285–1290. [Google Scholar] [CrossRef]
  61. Sun, F.; Xiao, B.; Kidron, G.J.; Tuller, M. Towards the effects of moss-dominated biocrusts on surface soil aeration in drylands: Air permeability analysis and modeling. Catena 2023, 223, 106942–106958. [Google Scholar] [CrossRef]
  62. Wang, C.Y.; Zhou, X.; Guo, D.; Zhao, J.H.; Yan, L.; Feng, G.Z.; Gao, Q.; Yu, H.; Zhao, L.P. Soil pH is the primary factor driving the distribution and function of microorganisms in farmland soils in northeastern China. Ann. Microbiol. 2019, 69, 1461–1473. [Google Scholar] [CrossRef]
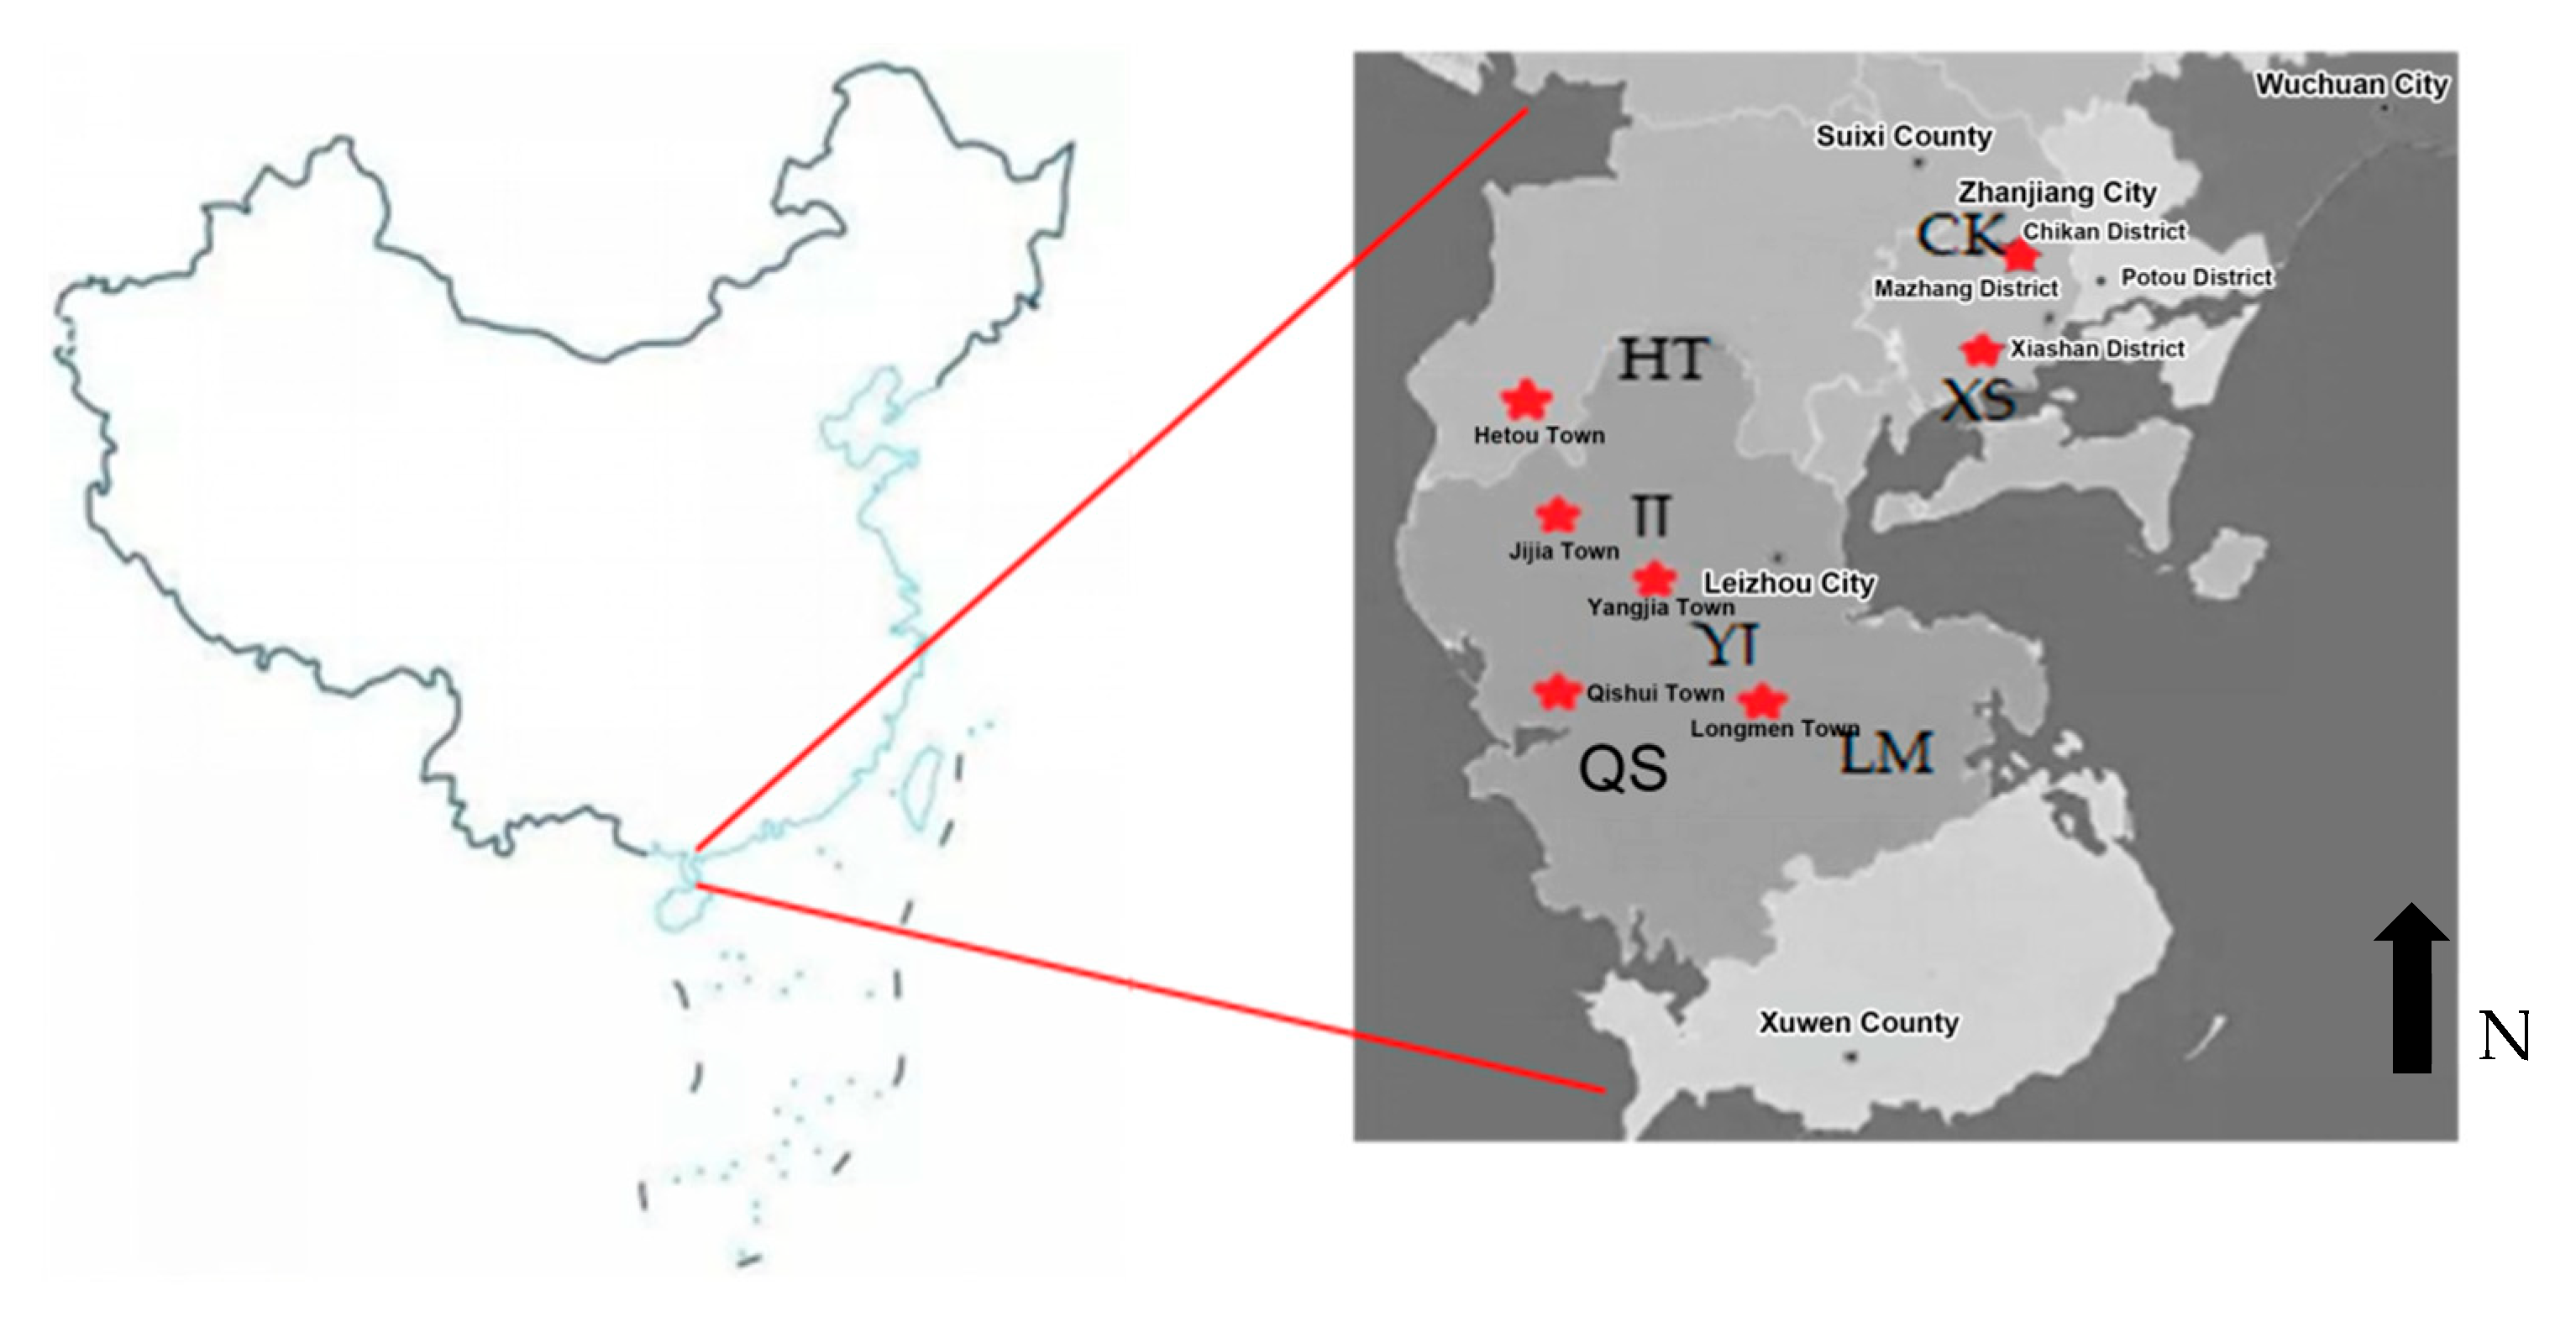
Figure 1. Distribution of survey plots. Stars and letters represent restoration research points and their names, respectively: CK (Chikan District, 21°25′31″ N–21°32′13″ N, 110°31′47″ E–110°39′24″ E), XS (Xiashan District, 21°16′85″ N–21°19′47″ N, 110°30′40″ E–110°36′43″ E), HT (Hetou Town, 21°00′99″ N–21°08′63″ N, 109°74′26″ E–109°86′00″ E), JJ (Jijia Town, 20°90′86″ N–20°97′41″ N, 109°72′17″ E–109°91′37″ E), YJ (Yangjia Town, 20°83′47″ N–20°94′12″ N, 110°01′79″ E–109°84′69″ E), QS (Qishui Town, 20°73′01″ N–20°78′98″ N, 109°77′69″ E–109°85′62″ E), and LM (Longmen Town, 20°79′09″ N–20°71′69″ N, 109°88′38″ E–110°06′82″ E). The left and right pictures are taken from the following networks, respectively: http://finance.sina.com.cn/roll/2019-08-02/doc-ihytcitm6415659.shtml (accessed 17 October 2025) and https://baijiahao.baidu.com/s?id=1645744118429649412&wfr=spider&for=pc (accessed 17 October 2025).
Forests 16 01602 g001
Figure 2. Contents and proportions of soil microbial biomass carbon, nitrogen, and phosphorus in different vegetation types. Different letters indicate significant differences in vegetation types (n = 7, p < 0.05).
Forests 16 01602 g002
Figure 3. Soil microbial community structure of phylum (A), genus (B), and species (C) level in different vegetation types. ES, EG, and ED represent Eucalyptus–shrub, Eucalyptus–grass, and Eucalyptus–Dicranopteris pedata (Houtt.) Nakaike), respectively. Vegetation restoration with Eucalyptus; S, G, and D represent shrub, grass, and Dicranopteris pedata, respectively. Natural vegetation restoration without Eucalyptus; A and B represent 0–10 cm and 10–20 cm soil layers, respectively. The same as below.
Forests 16 01602 g003
Figure 4. Clusterheatmap of dominant genera of microorganisms with relative abundance of top 35 in different vegetation restoration types.
Forests 16 01602 g004
Figure 5. Relative richness of the top 11 bacterial genera (a) and the top 6 fungal genera (b) in different vegetation types.
Forests 16 01602 g005
Figure 6. Clusterheatmap of dominant functional genes of microorganisms with relative abundance of top 50 in different vegetation restoration types.
Forests 16 01602 g006
Figure 7. Symbiotic network relationships of soil microorganisms in different vegetation types.
Forests 16 01602 g007
Table 1. Basic details of the sample area.
IndicatorVegetation
Type
ESSEGGEDD
Soil    Surface Soil Depth (cm)30–4010–1530–405–1030–405–10
VegetationTotal cover (%)75–8515–2075–8515–2580–9025–35
Eucalyptus
    DBH (cm)12.6 ± 2.1-10.9 ± 2.7-9.4 ± 2.6-
    Height (m)11.9 ± 1.8-10.3 ± 1.7-9.4 ± 1.5-
    Canopy
    Cover (%)
40–50-40–50-40–50-
Understory
    Cover (%)70–8015–2070–8015–2575–8525–35
    Height (m)1.40.70.80.51.10.4
    Dominant
    Species
Aporosa dioica (Roxb.) Müll. Arg., Litsea glutinosa (Lour.) C. B. Rob., Micromelum falcatum (Lour.) Tan. Aporosa dioica (Roxb.) Müll. Arg., Litsea glutinosa (Lour.) C. B. Rob., Antidesma ghaesembilla Gaertn.Miscanthus sinensis Anderss.,
Imperata cylindrica (L.) Beauv.
Miscanthus sinensis Anderss.,
Imperata cylindrica (L.) Beauv.
Dicranopteris pedata
(Houtt.) Nakaike
Dicranopteris pedata
Leaf Litter    Cover (%)69 ± 59 ± 179 ± 72 ± 092 ± 138 ± 5
    Thickness (cm)3.5 ± 0.20.5 ± 0.16.7 ± 1.60.4 ± 0.116.5 ± 1.71.5 ± 0.2
    Biomass (g m−2)303.9 ± 5.916.1 ± 2.7398.9 ± 4.72.3 ± 0.4921.0 ± 17.158.8 ± 2.8
ES, EG, and ED represent Eucalyptus–shrub, Eucalyptus–grass, and Eucalyptus–Dicranopteris pedata, respectively. Vegetation restoration with Eucalyptus; S, G, and D represent shrub, grass, and Dicranopteris pedata, respectively. Natural vegetation restoration without Eucalyptus; DBH, diameter at breast height. Data are mean ± SD (n = 7). The same as below.
Table 2. Soil physicochemical properties in vegetation restoration with Eucalyptus and natural vegetation restoration without Eucalyptus.
Soil
Layer
Vegetation TypeSW
(%)
BD
(g m−3)
pHTN
(g kg−1)
TP
(g kg−1)
AN
(mg kg−1)
AP
(mg kg−1)
SOM
(g kg−1)
C/N
0–10
cm
ES10.21 ± 2.011.39 ± 0.085.2 ± 0.21.49 ± 0.220.85 ± 0.10238.2 ± 0.393.70 ± 0.5832.49 ± 2.8412.64 ± 0.15
S8.19 ± 0.121.35 ± 0.074.7 ± 0.10.40 ± 0.100.36 ± 0.0744.25 ± 3.880.92 ± 0.127.9 ± 0.8910.57 ± 0.38
EG13.51 ± 0.561.37 ± 0.14.9 ± 0.41.00 ± 0.110.61 ± 0.05131.4 ± 4.282.14 ± 0.3123.16 ± 2.9113.39 ± 0.19
G7.97 ± 0.581.35 ± 0.134.7 ± 0.20.54 ± 0.070.36 ± 0.0447.81 ± 6.441.02 ± 0.147.09 ± 1.168.91 ± 0.99
ED14.90 ± 0.781.37 ± 0.024.5 ± 0.20.76 ± 0.060.49 ± 0.0394.8 ± 9.851.47 ± 0.2919.39 ± 1.6714.9 ± 0.62
D8.26 ± 0.151.38 ± 0.184.6 ± 0.10.37 ± 0.050.34 ± 0.0551.82 ± 6.031.12 ± 0.138.27 ± 0.9310.77 ± 1.8
10–20
cm
ES10.98 ± 1.551.42 ± 0.054.8 ± 0.10.84 ± 0.080.51 ± 0.07125.2 ± 8.121.87 ± 0.3815.09 ± 1.8610.01 ± 1.82
S10.40 ± 0.251.44 ± 0.054.6 ± 0.10.4 ± 0.070.34 ± 0.0854.07 ± 2.801.16 ± 0.16.55 ± 0.339.88 ± 1.92
EG13.53 ± 0.711.4 ± 0.094.5 ± 0.10.69 ± 0.130.37 ± 0.0376.19 ± 5.131.13 ± 0.1612.42 ± 0.9110.22 ± 1.9
G10.11 ± 0.441.42 ± 0.044.8 ± 0.20.42 ± 0.060.43 ± 0.0446.50 ± 5.481.30 ± 0.054.26 ± 0.545.94 ± 1.99
ED15.22 ± 0.851.42 ± 0.084.5 ± 0.10.48 ± 0.070.40 ± 0.0463.48 ± 3.141.21 ± 0.149.85 ± 0.8411.86 ± 0.87
D10.96 ± 0.831.37 ± 0.134.5 ± 0.10.31 ± 0.060.34 ± 0.0736.91 ± 6.611.4 ± 0.194.35 ± 0.348.44 ± 1.37
Note. SW, soil water content; BD, bulk density; TN, total nitrogen; TP, total phosphorus; AN, available nitrogen; AP, available phosphorus; SOM, soil organic matter; C/N, ratio of soil organic carbon to total nitrogen.
Table 3. Abundance and diversity of soil microorganisms at the level of families, genera, and species in different vegetation types.
Soil Layer S Soil Layer Cheme.Vegetation TypeFamily Genus Species
ChaoIShannonPielou ChaoIShannonPielou ChaoIShannonPielou
0–10
cm
ES613 + 42a4.26 + 0.21b0.80 + 0.05b 2265 + 165a5.41 + 0.34c0.82 + 0.05b 12,860 + 528a8.37 + 0.24c0.76 + 0.04c
S626 + 56a5.27 + 0.32a0.92 + 0.04a 2303 + 205a7.24 + 0.47a0.93 + 0.05a 12,957 + 237a9.13 + 0.14a0.92 + 0.03a
EG607 + 59a4.49 + 0.32b0.82 + 0.06b 2294 + 151a5.74 + 0.41bc0.83 + 0.06b 12,861 + 610a8.5 + 0.21bc0.80 + 0.05bc
G604 + 44a5.37 + 0.36a0.92 + 0.06a 2324 + 214a7.15 + 0.34a0.92 + 0.06a 12,429 + 640a9.08 + 0.42a0.93 + 0.05a
ED612 + 30a4.48 + 0.22b0.83 + 0.04b 2370 + 203a6.14 + 0.51b0.81 + 0.05b 12,912 + 490a8.73 + 0.26b0.83 + 0.03b
D626 + 42a5.48 + 0.34a0.94 + 0.05a 2334 + 210a7.31 + 0.46a0.92 + 0.06a 13,171 + 263a9.18 + 0.25a0.93 + 0.04a
10–20
cm
ES621 + 58a4.27 + 0.33b0.82 + 0.07b 2316 + 184a6.23 + 0.56b0.82 + 0.06b 12,137 + 681a8.72 + 0.11c0.80 + 0.04b
S618 + 52a5.38 + 0.27a0.93 + 0.05a 2313 + 195a7.26 + 0.41a0.93 + 0.06a 12,590 + 333a9.15 + 0.18b0.92 + 0.05a
EG623 + 40a4.33 + 0.31b0.83 + 0.06b 2380 + 203a6.27 + 0.56b0.82 + 0.06b 12,431 + 317a8.7 + 0.14c0.82 + 0.04b
G615 + 39a5.24 + 0.32a0.92 + 0.05a 2345 + 214a7.24 + 0.49a0.92 + 0.07a 12,450 + 533a9.08 + 0.3b0.93 + 0.04a
ED630 + 46a4.44 + 0.23b0.84 + 0.06b 2303 + 195a6.41 + 0.53b0.83 + 0.05b 12,565 + 413a8.71 + 0.15c0.83 + 0.03b
D619 + 51a5.42 + 0.36a0.93 + 0.06a 2374 + 199a7.21 + 0.51a0.93 + 0.05a 12,823 + 412a9.44 + 0.19a0.93 + 0.05a
Data are mean ± SD (n = 7). Different letters indicate significant differences in vegetation types (p < 0.05).
Table 4. Keystone taxa number of symbiosis networks in different vegetation types.
Phylum of Soil Microorganism Vegetation Type
ESSEGGEDD
Actinobacteria 360410530
Proteobacteria 1808090
Acidobacteria 1703010
Verrucomicrobia 1000000
Chloroflexi 8021000
Candidatus_Rokubacteria 700000
Gemmatimonadetes 400000
Candidatus_Tectomicrobia 300000
Bacteroidetes 200000
Nitrospirae 102000
Cyanobacteria 100000
Candidatus_Handelsmanbacteria 100000
Armatimonadetes 100000
Ignavibacteriae 000010
total1090750640
Disclaimer/Publisher’s Note: The statements, opinions and data contained in all publications are solely those of the individual author(s) and contributor(s) and not of MDPI and/or the editor(s). MDPI and/or the editor(s) disclaim responsibility for any injury to people or property resulting from any ideas, methods, instructions or products referred to in the content.