Article

Optimal Phenology Windows for Discriminating Populus euphratica and Tamarix chinensis in the Tarim River Desert Riparian Forests with PlanetScope Data

1
School of Surveying and Land Information Engineering, Henan Polytechnic University, Jiaozuo 454003, China
2
College of Resources and Environment, University of Chinese Academy of Sciences, Beijing 100049, China
3
Laboratory of Biodiversity and Conservation, Co-Innovation Center for Sustainable Forestry in Southern China, College of Ecology and Environment, Nanjing Forestry University, Nanjing 210037, China
4
Independent Researcher, Beijing 100083, China
*
Authors to whom correspondence should be addressed.
Forests 2025, 16(10), 1560; https://doi.org/10.3390/f16101560
Submission received: 31 August 2025 / Revised: 29 September 2025 / Accepted: 4 October 2025 / Published: 10 October 2025

Abstract

The desert riparian forest oasis, dominated by Populus euphratica and Tamarix chinensis, is an important barrier to protect the economic production and habitat of the Tarim River Basin. However, there is still a lack of high-precision spatial distribution data of desert ri-parian forest species below 10 m. The recently launched PlanetScope CubeSat constella-tion, which provides daily earth observation imagery with a resolution of 3 m, offers a highly favorable dataset for mapping the high-resolution distribution of P. euphratica and T. chinensis and an unprecedented opportunity to explore the optimal phenology window to distinguish between them. In this study, time-series PlanetScope images were first used to extract phenological metrics of P. euphratica, dividing the annual life cycle into four phenology windows: duration of leaf expansion (DLE), duration of leaf maturity (DLM), duration of leaf fall (DLF), and duration of the dormancy period (DDP). The random forest model was used to obtain the classification accuracy of 16 phenological window combinations. Results indicate that after gap filling of vegetation index time series, the identification accuracy for P. euphratica and T. chinensis exceeded 0.90. Among individual phenology windows, the DLE window exhibited the highest classification accuracy (average F1-score 0.87). Among the two phenology window combinations, the DLE-DLF and DLE-DLM windows have the highest classification accuracy (average F1-score 0.90). Among the three phenology window combinations, DLE-DLM-DLF displayed the highest classification accuracy (average F1-score 0.91). Nevertheless, the inclusion of features within the DDP window led to a decrease in accuracy by 1–2% points, which was unfavorable for discriminating tree species. Additionally, features observed during the phenology asynchrony period were found to be more valuable for distinguishing between tree species. Our findings highlight the potential of PlanetScope constellation imagery in tree species classification, offering guidance for selecting optimal image acquisition timing and identifying the most valuable images within time series data for future large-scale tree mapping.

1. Introduction

Dryland forests are valuable but often neglected resources that provide habitat for biodiversity and prevent the expansion of desertification [1,2]. Populus euphratica (P. euphratica) is a widely distributed deciduous broad-leaved tree able to live in extreme drought areas [3,4]. Tamarix chinensis (T. chinensis) is a shrub extensively growing on sandy deserts or alkaline soils located from arid to semi-arid areas [5]. These two-plant species dominate the desert riparian forests along the Tarim River, with P. euphratica predominant [6]. The Tarim River Basin in Xinjiang, China, contains 54% of the world’s P. euphratica forests [7]. They can not only serve as a natural barrier against regional farmland desertification caused by strong winds and sandstorms, but also actively control the extension of deserts to riverbanks within the entire basin system [8,9]. However, the excessive water demands of human life and economic exploitation have led to a catastrophic reduction in its area to only 53.48% of what it was half a century ago [10]. It is consoling to note that since 2000, the government has taken the initiative to irrigate these riparian forests by enhancing the connectivity of the river through ecological water transfer [11]. However, the current lack of accurate spatial distribution maps of P. euphratica forests is one of the most difficult and problematic issues for the effective implementation of conservation measures.
Satellite-based remote sensing is currently the most effective technology for wide-area Earth observation, providing the best way to depict plant characteristics over large areas with high spatial resolution, high spectral and multi-temporal observations [12,13,14]. Researchers have employed high-spatial-resolution remote sensing images, such as WorldView, QuickBird, and GeoEye, for tree species classification [15,16,17,18,19]. When the spatial resolution surpasses the canopy size of trees, tree species can be identified based on their shape, texture, and spectral features [20]. Sentinel-2 and Landsat-8/9 images, limited by their spatial resolution, might not provide adequate detail for identifying tree species in a single time-phase image. However, research indicates that utilizing multi-temporal remote sensing imagery yields satisfactory results in tree species identification [21,22]. These studies have demonstrated the advantages of employing multi-seasonal or multi-temporal images over single-date imagery for tree species classification [23]. Transitioning from single-time-window remote sensing imagery to continuous diurnal remote sensing observations is crucial, as this approach captures species-specific developmental dynamics and their responses to daily environmental drivers [24,25]. These characteristics are key elements for achieving effective species identification. Additionally, combining multiple data sources, such as optical and SAR remote sensing images along with topography data has also become an effective way to improve the accuracy of tree species identification [26,27].
Recent studies have shown that phenological indicators are reliable information for distinguishing tree species, and their incorporation into classification models can improve species identification accuracy [23,28]. The multi-temporal Vegetation Indices (VIs) profile of a specific vegetation would be expected to reflect the vegetation’s general phenology metrics (e.g., timing of greenup, peak greenness, and senescence) if the data have sufficient spatial, spectral, and temporal resolution [29,30]. Peng et al. [31] found that combining geographic distribution features and phenological indicators improved the identification accuracy of P. euphratica by 13% compared to using only Sentinel-1/2 spectral information and vegetation index features. Using time-series Sentinel-2 images, Li et al. [32] investigated the spectral differences between P. euphratica and T. chinensis and concluded that the period from 22 April to 1 May represents the optimal time window for mapping the distribution of the two species. By using deep learning, the accuracy of identifying P. euphratica and T. chinensis on QuickBird images and drone images reaches more than 85% [33,34,35]. Using WorldView-2 imagery with ultra-high spatial resolution, it has even been possible to count the number of P. euphratica in the lower reaches of the Tarim River [36]. Although existing research provides reliable information for accurately identifying P. euphratica and T. chinensis, some limitations also existed: Firstly, Landsat and Sentinel-2 are unable to provide recognition precision at the canopy level due to the limitation of spatial resolution greater than or equal to 10 m; secondly, Due to the limitation of revisit time, the time series of previous high spatial resolution satellite remote sensing images could not reach the level of days, which affected the accuracy of the analysis results and led to the inaccurate identification of important phenology nodes; Finally, there is a lack of comparison of identification accuracy of P. euphratica species during different phenological periods.
Due to the development of new-generation CubeSat constellation missions such as Planet Labs’ PlanetScope (PS), in recent years, it has dramatically dropped construction and launch costs for earth observation satellites [37]. The PlanetScope satellite constellation achieves a daily imaging frequency exceeding that of global regions, enabling the acquisition of satellite remote sensing imagery data with a resolution of 3–5 m on a daily basis. Up to now, PS has about 200 active Dove small satellites. This allows satellite remote sensing to capture time series of daily VIs at the canopy resolution of a single tree, providing the most appropriate data for extracting phenology metrics of forests and distinguishing between specific tree species [30,38,39]. In this study, we hypothesize that the accuracy of P. euphratica and T. chinensis identification varies across different phenology periods, suggesting the existence of optimal phenology windows and combinations best suited for discriminating between them. To validate this assumption, our primary objectives were as follows: (1) Utilizing PS images to acquire time-series Enhanced Vegetation Index (EVI) of P. euphratica and T. chinensis, extracting key phenology metrics for each species, and delineating the annual growth cycle of P. euphratica and T. chinensis into distinct phenology windows. (2) Integrating multiple VIs features from different phenology windows into the random forest (RF) classifier to explore the optimal phenology windows for discrimination between P. euphratica and T. chinensis through classification accuracy. The innovation of this study lies in the use of remote sensing imagery that not only possesses high spatial resolution but also offers a near-daily revisit capability. This capability will provide significant insights for comparing the accuracy of tree species extraction across different phenological time windows.

2. Materials and Methods

2.1. Study Sites

The study area for this study is located in the Tarim River Basin, spanning from 88°19′E to 88°24′E longitude and 40°04′ N to 40°09′ N latitude, with an average elevation of approximately 820 m. The Tarim River is the largest inland river in China, with an average annual flow of about 4.65 billion m3. Its water source mainly comes from glaciers and alpine snow melt water [40] (Figure 1). Due to the imbalance between precipitation and potential evaporation (average annual precipitation < 60 mm, evaporation potential > 2000 mm), oasis agricultural and natural vegetation in the basin are mainly distributed on both sides of the riverbank and flood plains where rivers overflow [7]. We took the lower reaches of the Tarim River as the research site. The lower Tarim River floodplain is densely vegetated with P. euphratica and T. chinensis as the main construction species, accounting for more than 90% of the total vegetation area. It is a good experimental area for identifying P. euphratica and T. chinensis [41].

2.2. Materials

2.2.1. PlanetScope Images

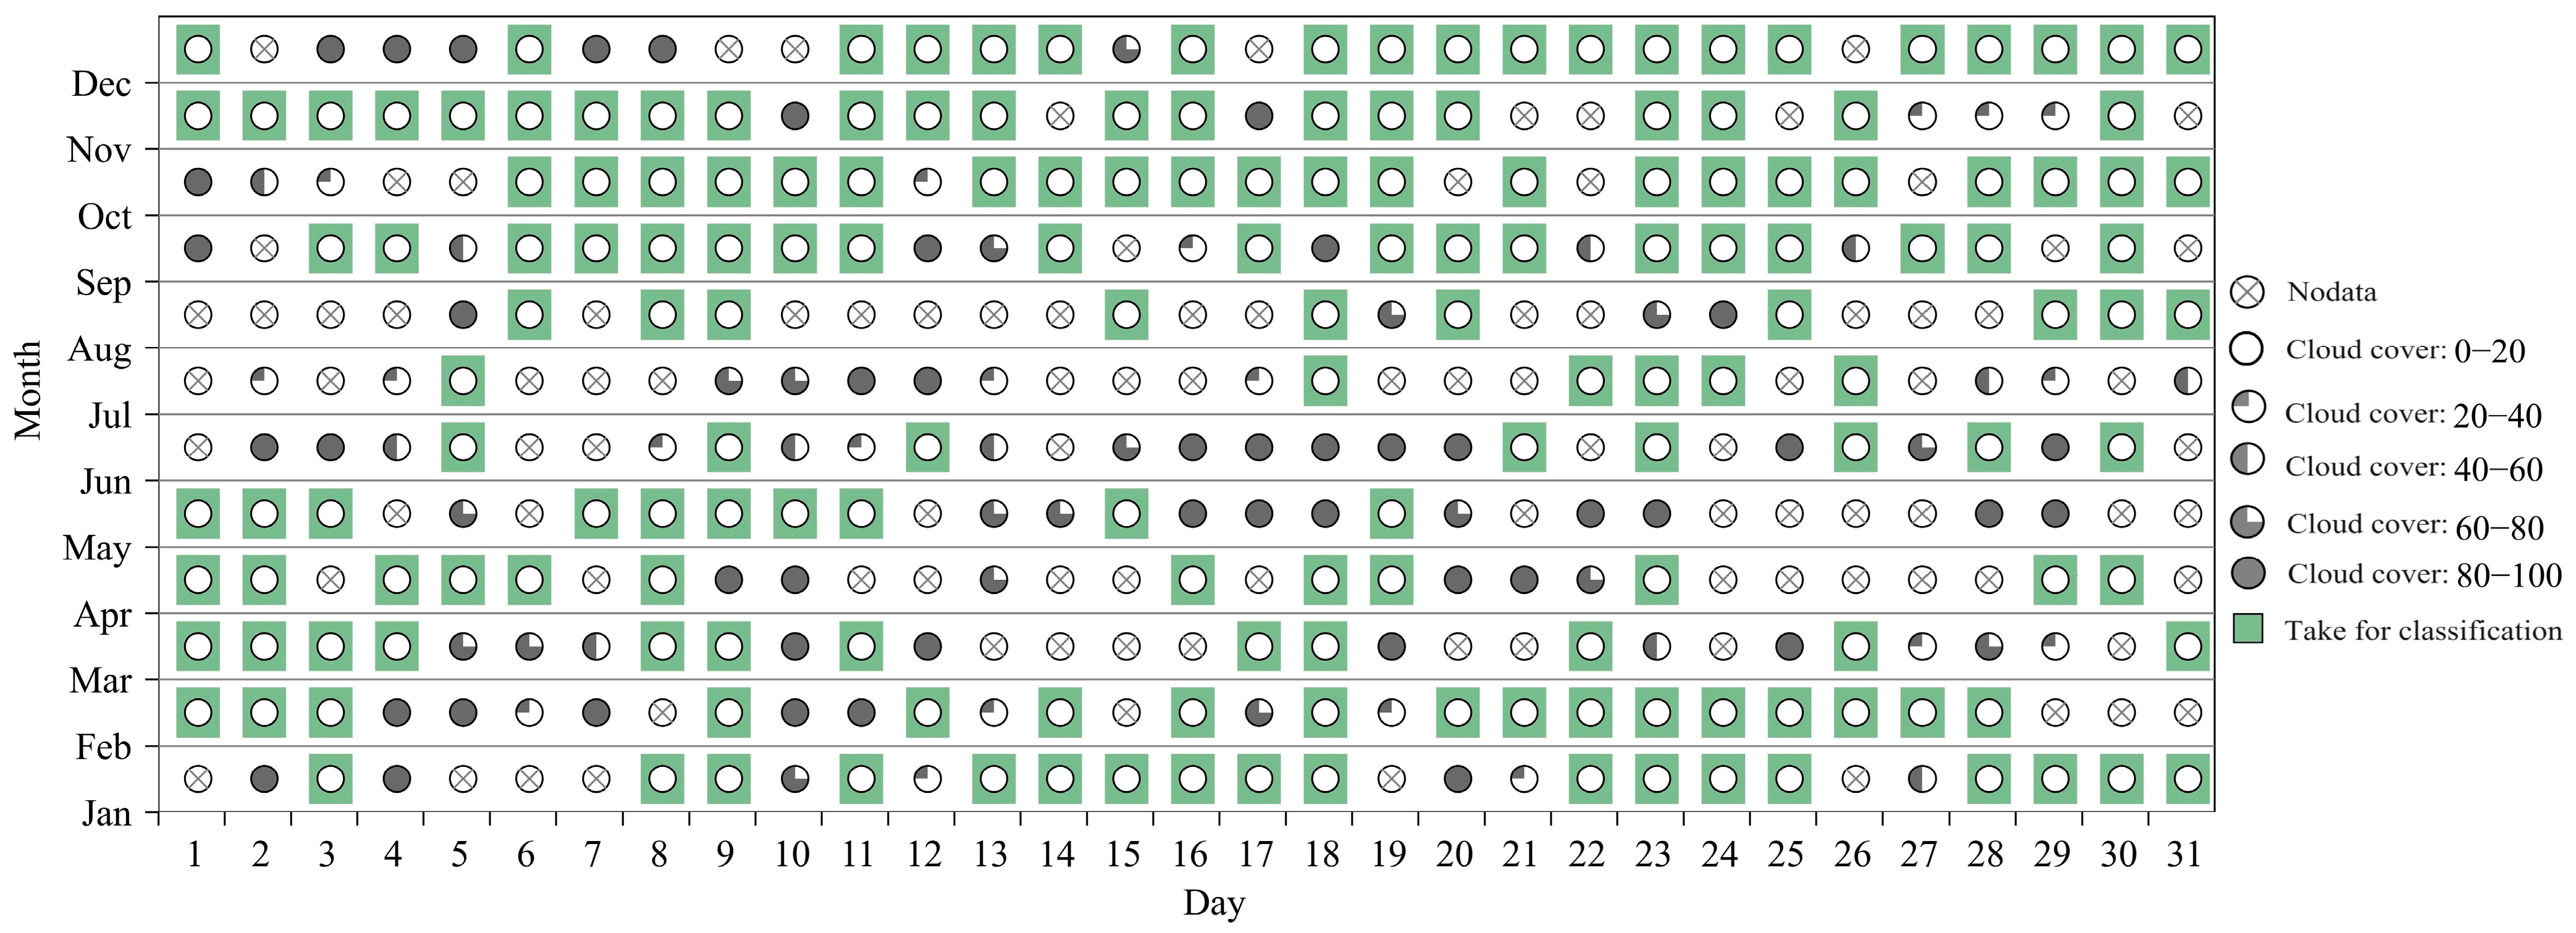
Daily scale remote sensing images from PS Earth observation satellites were used for the extraction of VIs and phenology metrics for P. euphratica and T. chinensis [37]. PS Scenes Level 3B surface reflectance product with a pixel size of 3 m was downloaded from Planet Labs (Available online: https://www.planet.com/, accessed on 23 November 2023). This product offers near-daily global coverage, making it a preferred option for fine-scale plant time series observations [30]. We obtained four spectral bands from PSB.SD instruments, namely blue, green, red, and near-infrared (NIR). Images have been orthorectified, radiometrically corrected, and harmonized with Sentinel-2 to ensure radiometric consistency [42]. Images with cloud cover <40% cover between January and December 2022 were downloaded (Figure 2). All PS imagery was processed to retain only the pixels labeled as “clear” in the Usable Data Mask to remove contaminated pixels. Multiple images in one day were combined into a geo-referenced single frame by mosaicking. Ultimately, we acquired a total of 116 cloud-free mosaic images that covered the study area.

2.2.2. Reference Imagery and Processing

GF-7 is China’s first civil sub-meter resolution optical stereoscopic earth observation satellite, successfully launched on 3 November 2019 [43]. It is equipped with payloads including two optical cameras and a laser altimeter, enabling the acquisition of high-resolution and highly accurate stereoscopic optical imagery and laser altimetry data [44]. The optical cameras comprise a forward-looking panchromatic camera and a multispectral backward-looking camera. The backward-looking camera includes a panchromatic band with a 0.65 m resolution and four multispectral bands, each with a 3.2 m resolution. We obtained GF-7 observation images of the study area on 28 September 2022, and 3 October 2022. The panchromatic and multispectral bands from the backward-looking camera were selected and fused to generate a 0.65 m multispectral reference image. The fused image showed good distinguishability between P. euphratica and T. chinensis visually (Figure S1).
Expert interpreters with extensive experience in studying P. euphratica and T. chinensis labeled the pixels of these species on PS images, using both the fused GF-7 true and false-color images as a reference. For challenging labels, P. euphratica and T. chinensis labels were confirmed through field surveys and drone imagery. A total of 75 representative areas, each with a size of 500 × 500 m, were selected for the label of P. euphratica and T. chinensis (Figure 1). Pixels with NDVI > 0.1 during the growing season but not belonging to P. euphratica or T. chinensis were labeled as “Vegetation”, while all other pixels were labeled as “Others”. This procedure resulted in 20,000 labeled pixels for model training.

2.2.3. Vegetation Indices

VIs are indicators that reflect the greenness or health of vegetation [45]. Seasonal trajectories of VIs are commonly used in vegetation phenology studies [46]. Additionally, VIs are crucial features for vegetation classification [38]. Table 1 lists the four VIs used in this study. The reason for selecting these VIs is that they are frequently used in vegetation monitoring, and their calculation formulas incorporate the four spectral bands of the PS imagery [47]. These four VIs were selected as the feature variables for model training.

2.3. Methods

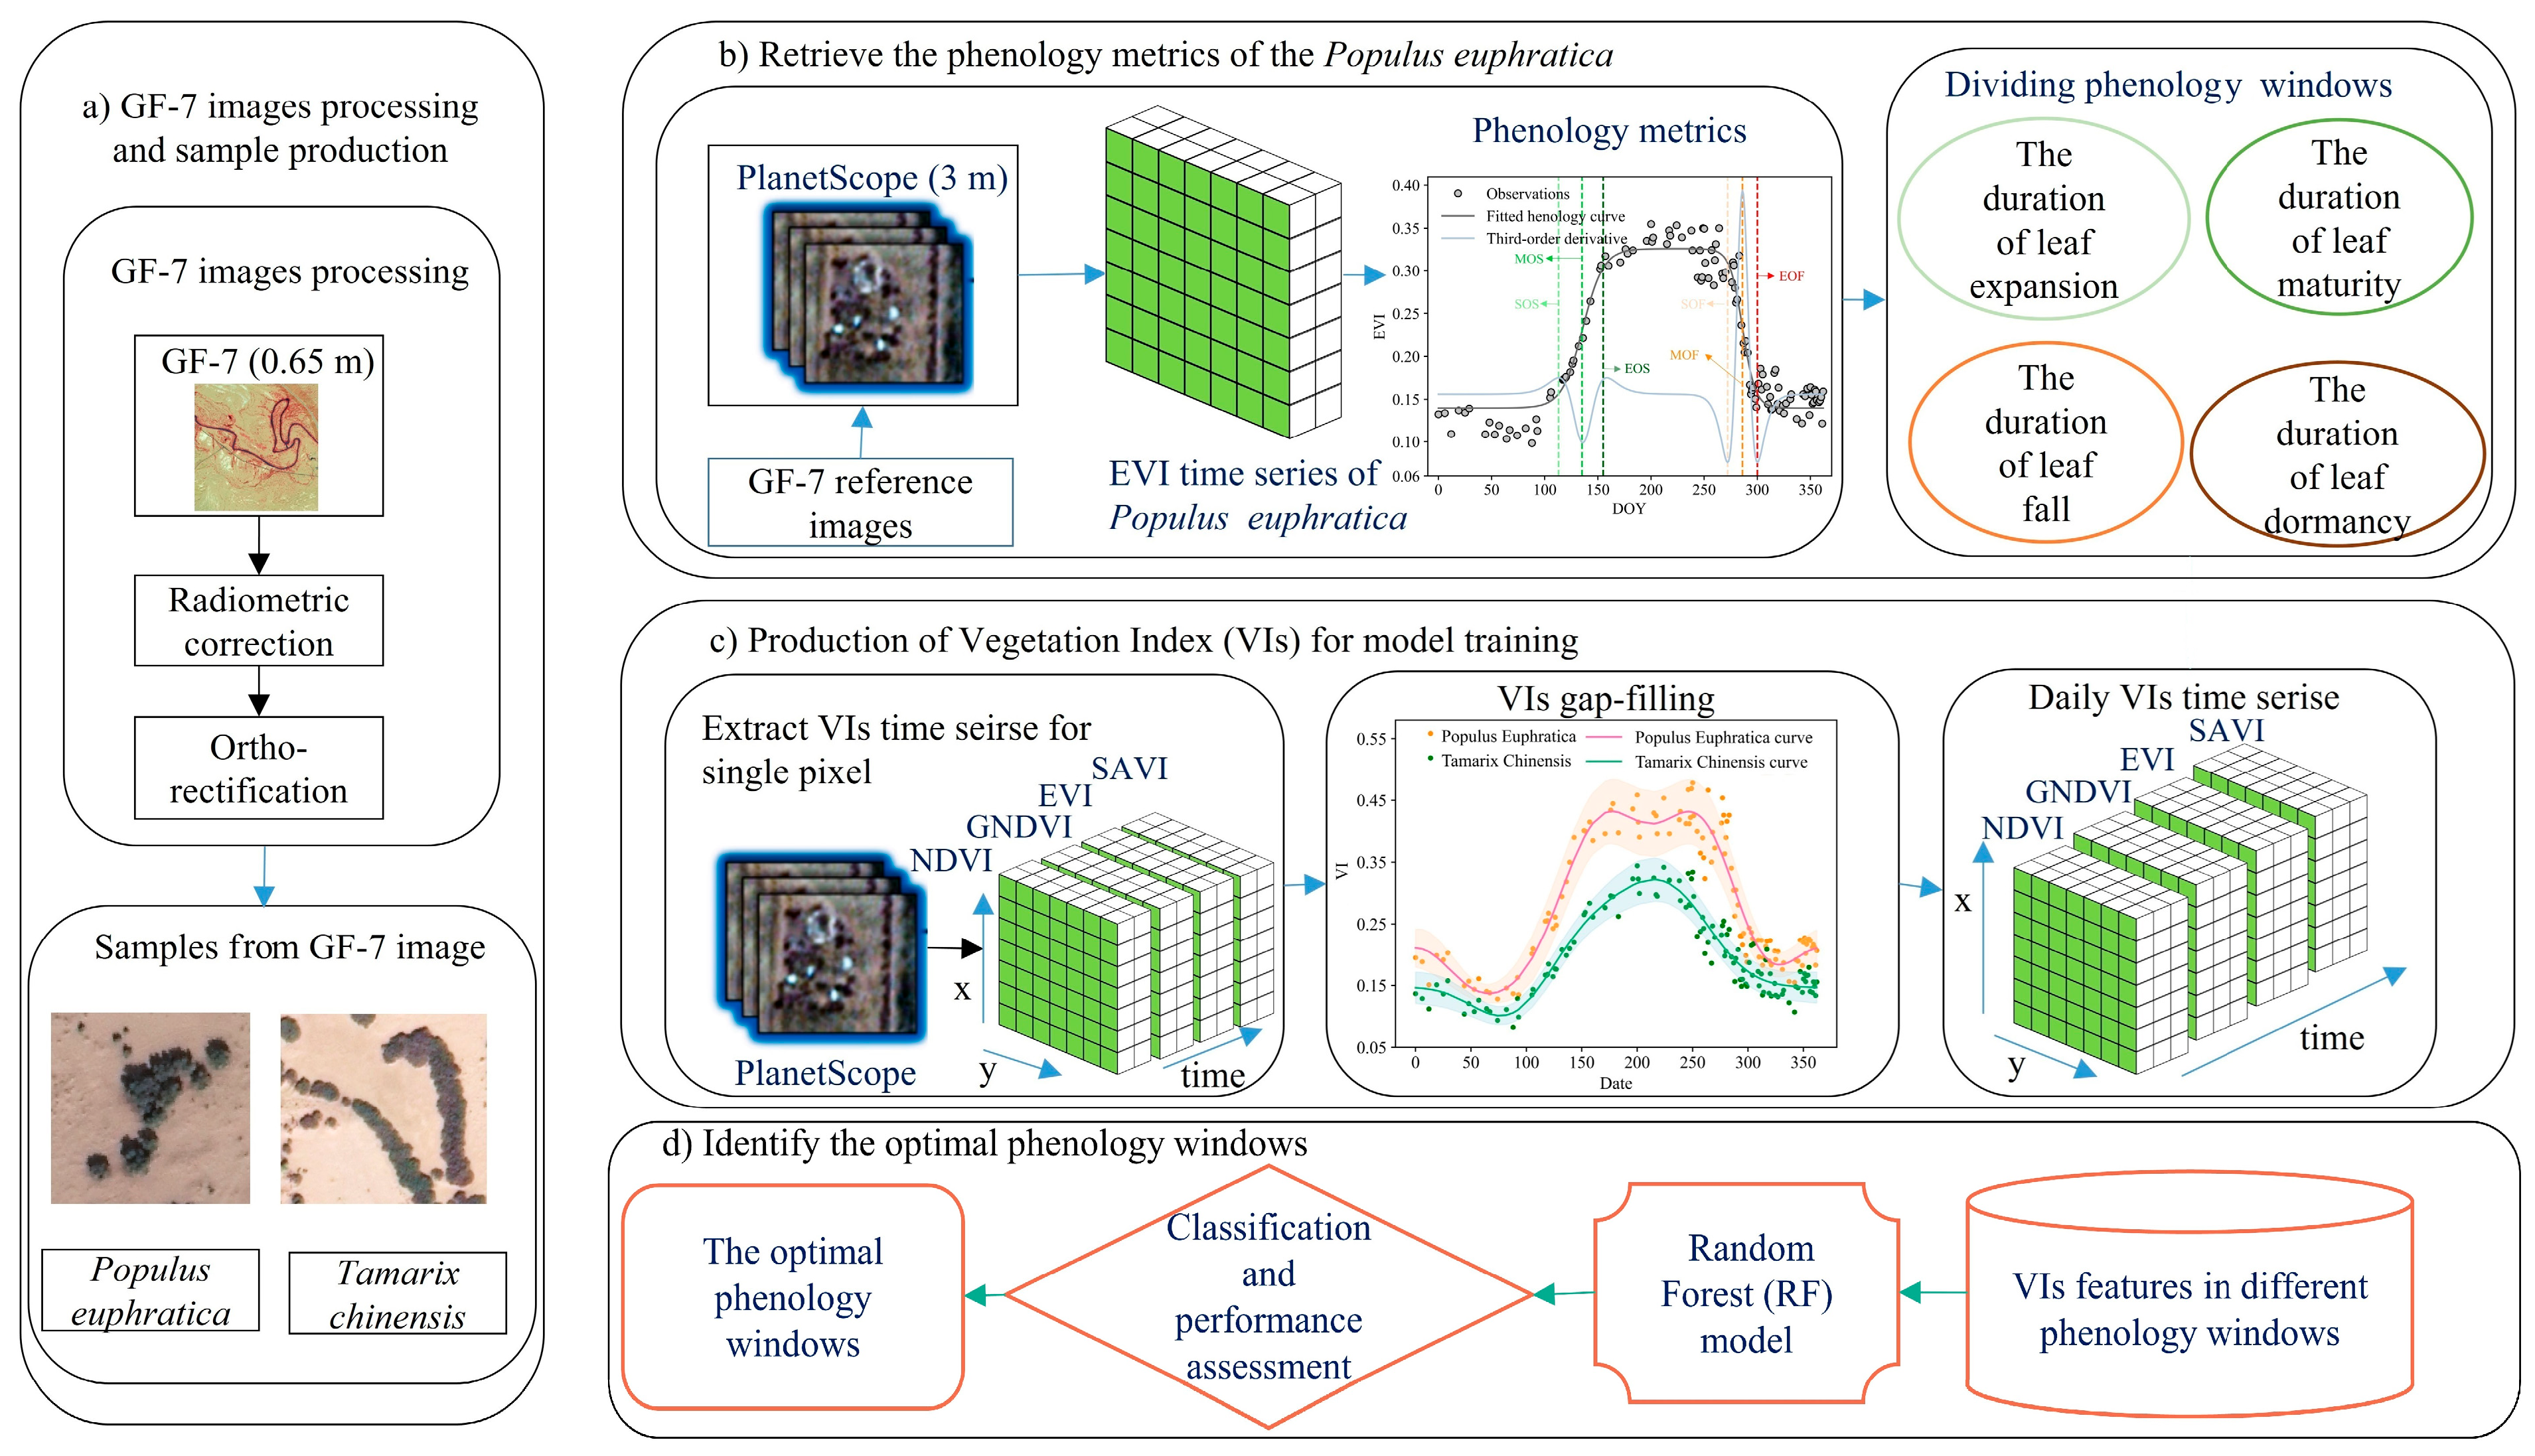
A full overview of the methodological flow chart can be found in Figure 3. This study utilized orthorectified GF-7 imagery as a reference and labeled samples of P. euphratica and T. chinensis on PS imagery. The EVI time series derived from pure P. euphratica pixels from PS imagery was employed to extract phenology metrics, enabling the delineation of the phenology windows. Interpolated daily time series of VIs were employed as training features for the RF. By training RF with VIs features from various phenology windows and their combinations, the performance of the classification results was assessed to determine the optimal phenology window for discriminating P. euphratica and T. chinensis.

2.3.1. Time-Series VIs Reconstruction and Gap-Filling

The continuity of VIs is often interrupted by residual atmospheric contamination, clouds, and haze, resulting in inconsistent data intervals across different phenology windows. This discontinuity poses a significant obstacle to analyzing the optimal phenology windows. Liu et al. [48] conducted a global-scale assessment of several gap-filling approaches for NDVI, and the Fourier-based approach demonstrated robust performance in filling data gaps while preserving the curve’s stability. This approach uses the sum of a series of cosine and sine waves to fit the vegetation growth curve. In Liu’s study, a harmonic value of 4 yielded the best outcomes, this value is also used in this study after verification. After gap-filling, the VIs were interpolated into daily time series.

2.3.2. Extracting Key Metrics of Phenology from PlanetScope

In this section, six phenology metrics, namely the Start of Spring (SOS), Middle of Spring (MOS), End of Spring (EOS), Start of Fall (SOF), Middle of Fall (MOF), and End of Fall (EOF), were derived from P. euphratica and T. chinensis EVI time series. Using GF-7 imagery as a reference, we individually selected 500 pure pixels representing P. euphratica and T. chinensis from PS images. By calculating the average EVI values, we obtained time-series EVI datasets specifically characterizing the phenology changes in P. euphratica and T. chinensis. Subsequently, the double logistic function was applied to reconstruct the EVI time series (Equation (1)), resulting in a fitted EVI curve. In the final step, the third derivatives of the fitted curves were used to derive the phenology metrics for P. euphratica and T. chinensis [49]. As shown in Figure 4, P. euphratica and T. chinensis display distinct phenological patterns, with noticeable differences in the timing of their key phenology indicators.
y ( t ) = v 1 + v 2 ( 1 1 + e x p ( m 1 ( t n 1 ) ) 1 1 + e x p ( m 2 t n 2 ) )
where y(t) represents the fitted EVI value on day t; v1 and v2 denote the annual background and amplitude of EVI, respectively, while m1 & n1, m2 & n2 are paired parameters that describe the vegetation growth trends during the green-up and senescence phases.

2.3.3. Classification and Performance Assessment

The random forest (RF) model is a widely used and modern nonparametric machine learning algorithm for supervised classification, utilizing multiple decision trees [38]. Concerning the accuracy results, RF proved to be the best solution [50,51]. This study employed the RF implementation of Scikit-learn [52]. According to Belgiu and Drăguţ [53] review, the majority of researchers set the number of decision trees (Ntree) value between 100 and 500 to minimize errors. This study used the default values, and set Ntree to 500 trees, consistent with Immitzer’s description [54]. RF also measures the importance of input features. In Scikit-learn, features’ importance is calculated as the Mean Decrease Impurity (MDI), which can be used for features ranking or selection [23]. We use MDI to evaluate the importance of the VIs and phenology windows. RF generates an internal, unbiased estimate of its generalization error using a method called “out-of-bag” (OOB) samples. In remote sensing image classification, relying solely on the OOB accuracy of RF classifiers may lead to inflated accuracy due to strong spatial autocorrelation. To address this issue, this study employs a spatial partitioning strategy with five-fold cross-validation, dividing all samples into five spatial blocks. Within each fold, all samples within a given block are reserved as the validation set, whilst the remaining blocks are employed for training. By separating the training and validation sets into spatially distinct blocks, the potential for overestimation due to spatial autocorrelation is mitigated. The confusion matrices generated through cross-validation ultimately yield producer’s accuracy (PA), user’s accuracy (UA), and F1 score, providing a comprehensive and reliable assessment of model performance.

2.3.4. Selection of Optimal Phenology Windows

In MODIS vegetation phenology monitoring, Zhang et al. [49] defined four key phenology windows of vegetation dynamics at annual time scales: greenup, maturity, senescence, and dormancy. The annual growth cycle of P. euphratica and T. chinensis was divided into the following four key phenology windows: the duration of leaf expansion (DLE) represents the days from SOS to EOS; the duration of leaf Maturity (DLM) represents the days from EOS to SOF; the duration of leaf fall (DLF) represents the days from SOF to EOF; the duration of dormancy period (DDP) represents the days from EOF to SOS. To ensure the phenology windows encompass the characteristics of both plant species, key phenology transition points (SOS/EOS/SOF/EOF) were first extracted for both P. euphratica and T. chinensis. The boundaries of the phenology windows were then defined as the average dates of the phenology segments for both species, thereby ensuring the segmentation of phenology periods is not biased towards either species. We consider all 16 possible combinations based on the four phenology windows and then compare the model’s accuracy in recognizing P. euphratica and T. chinensis. This allows us to determine the most suitable phenology windows and their combinations for discriminating between P. euphratica and T. chinensis.

3. Results

3.1. Vegetation Indices Profiles and Phenology Metrics

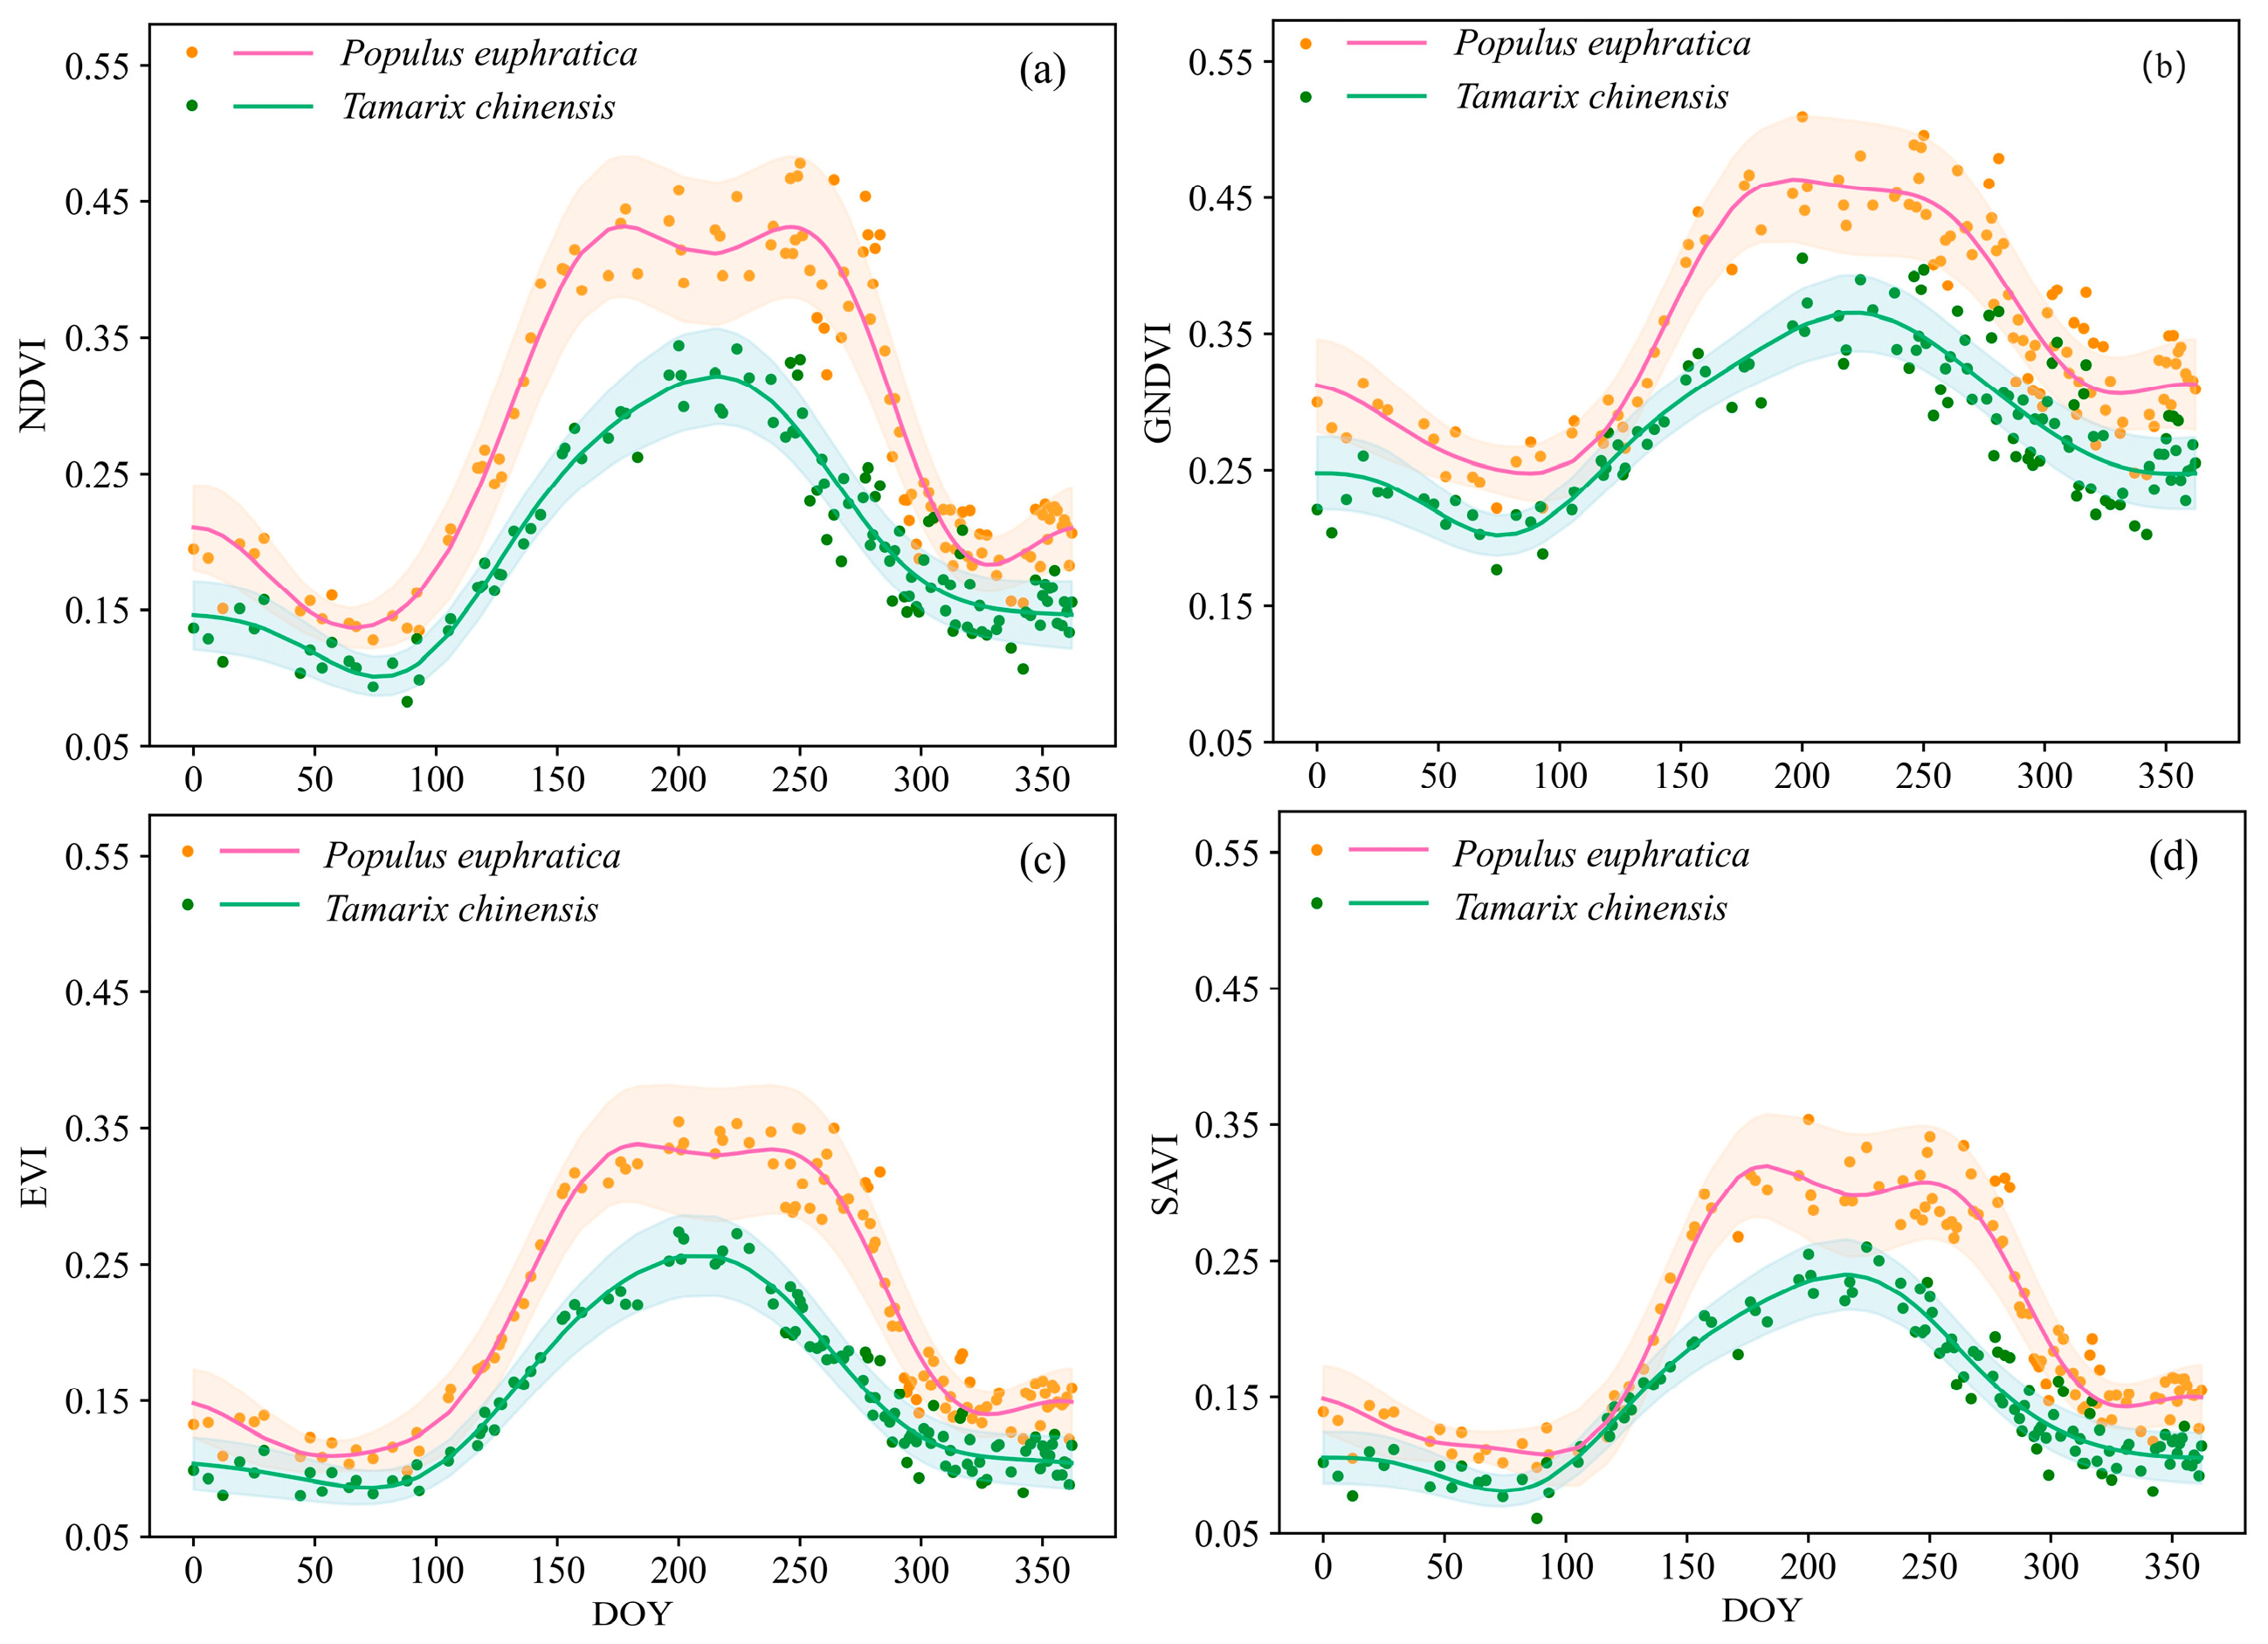
Among the four VIs curves, the P. euphratica shows more pronounced greenness than T. chinensis (Figure 5). Although NDVI and GNDVI perform higher values compared to EVI and SAVI, saturation is not observed. Following leaf budding in April, P. euphratica enters a rapid growth phase, indicated by an increase in VIs values. By June, as the growth and development of P. euphratica progresses, the VIs reach their peak, maintaining a relatively stable high value thereafter. By October, with the onset of autumn, leaves enter a declining phase as the foliage gradually loses its green hue. As the leaves begin to fall, VIs rapidly decrease, entering dormancy by November. The growth rate of T. chinensis greenness during the growth period is slower than that of P. euphratica, with a longer duration in the ascending phase of VIs and a shorter period of maintaining relatively high values. T. chinensis enters the declining phase earlier than P. euphratica.
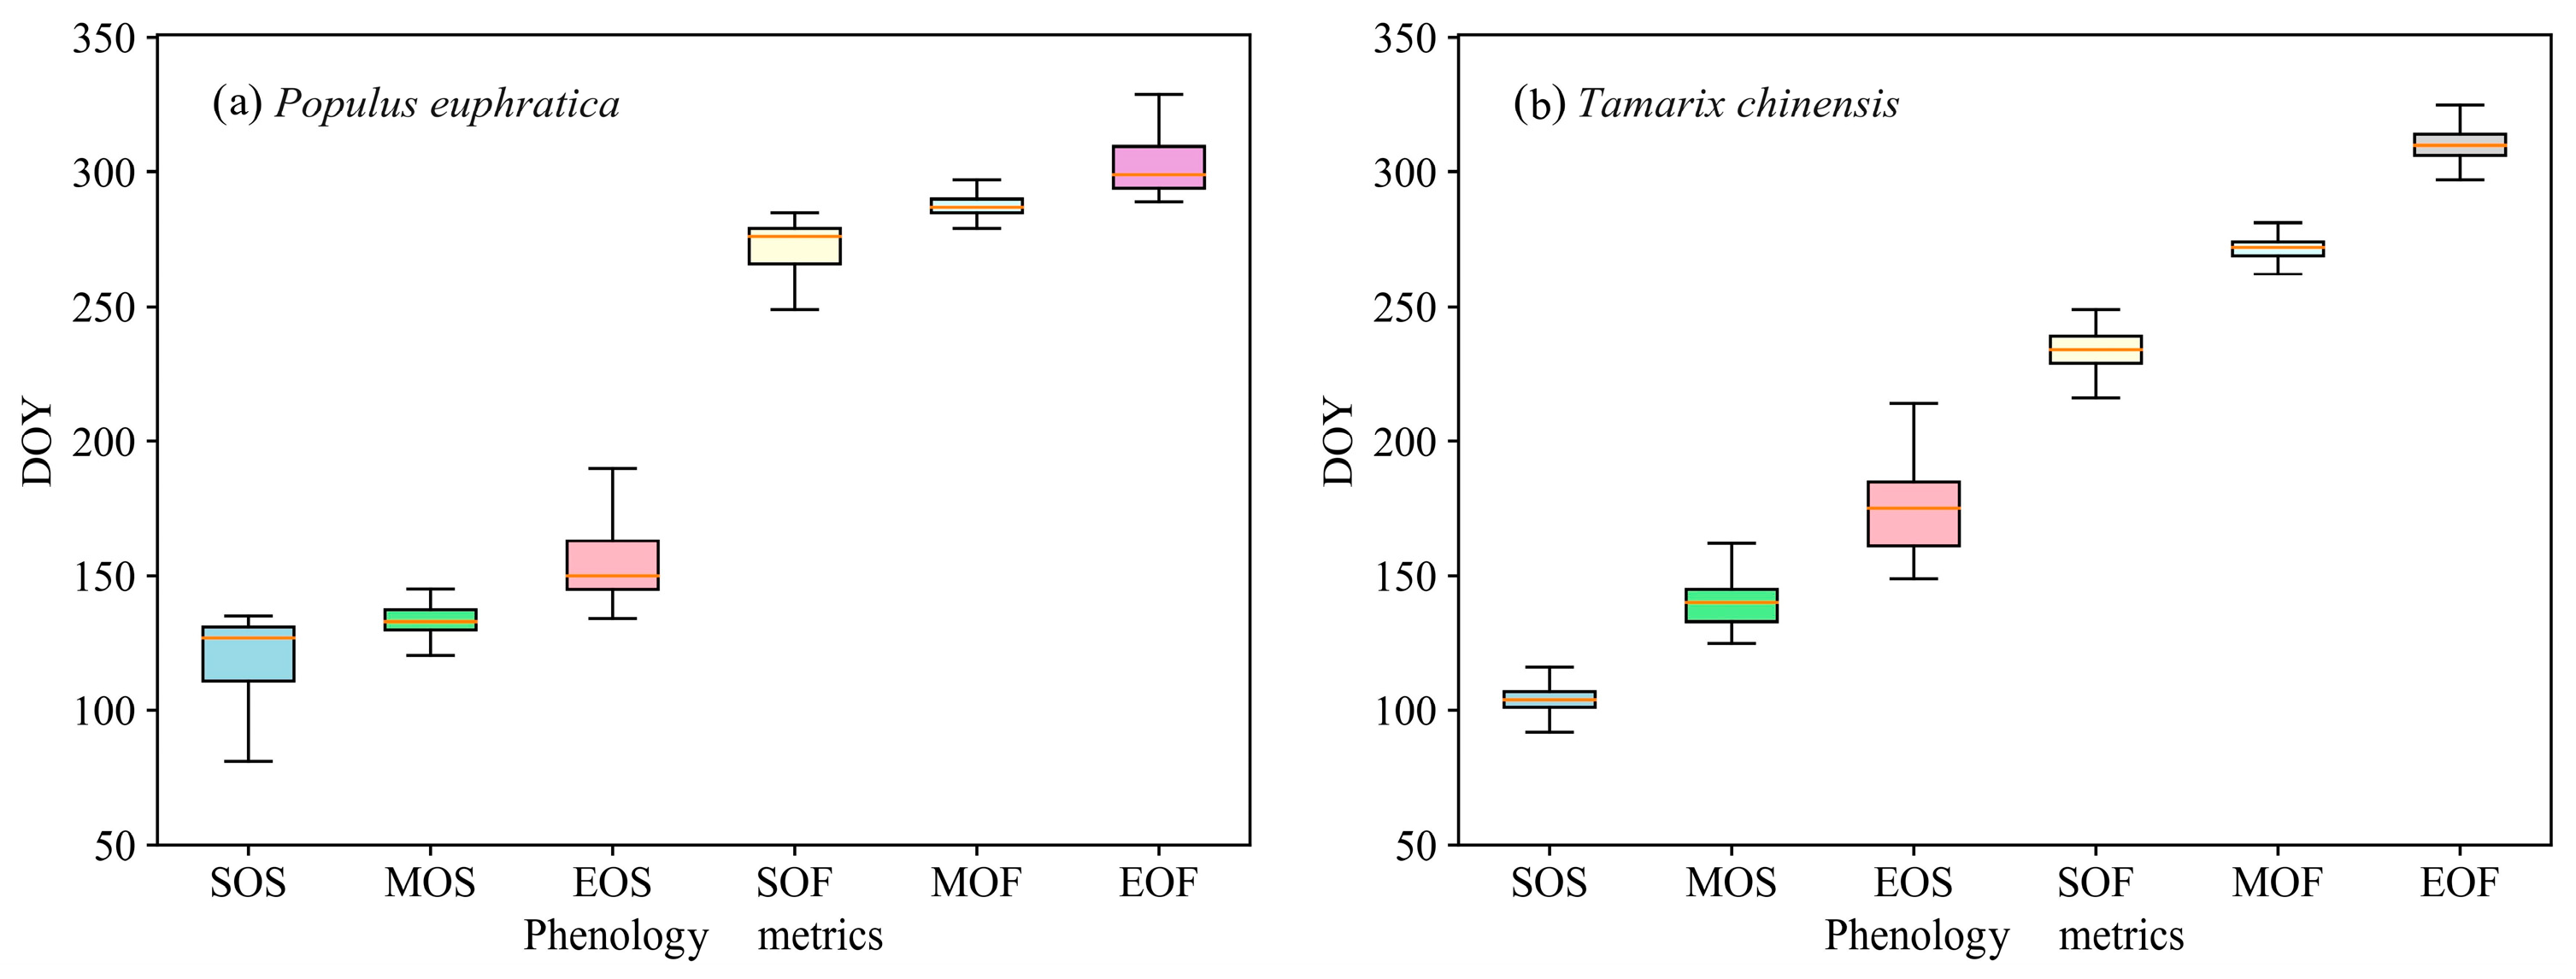
Figure 6 displays the phenology metrics of P. euphratica and T. chinensis. The differences in phenology between P. euphratica and T. chinensis are most evident in three metrics. The DLM window for P. euphratica (96 days) was 44 days longer than that of T. chinensis (52 days). In contrast, the DLE window for P. euphratica (56 days) was 20 days shorter than that of T. chinensis (76 days), and the DLF window for P. euphratica (33 days) was 47 days shorter than that of T. chinensis (80 days). In terms of phenology metrics, T. chinensis exhibits an earlier SOS compared to P. euphratica by 14 days, the EOS for P. euphratica is 6 days earlier than T. chinensis. The SOF for P. euphratica is delayed by 38 days compared to T. chinensis. Lastly, the EOF for P. euphratica occurs 9 days earlier than T. chinensis. The phenological differences between P. euphratica and T. chinensis can be attributed to species variation and their geographical distribution. As a deep-rooted deciduous broadleaf tree, P. euphratica primarily inhabits areas near riverbanks with relatively stable water sources. In contrast, T. chinensis, a shallow-rooted deciduous shrub, exhibits greater sensitivity to soil moisture and temperature, responding more rapidly. This adaptability enables T. chinensis to sprout leaves earlier in spring and enter dormancy sooner in autumn.

3.2. Model Training and Feature Importance

The VIs time series features were incorporated into an RF model for training. The identification results for P. euphratica and T. chinensis are presented in Table 2. The F1 scores for P. euphratica and T. chinensis identification are both >0.89, with improved results observed for the gap-filled VIs. For the VIs without gap-filling, the F1 scores for P. euphratica and T. chinensis are 0.8910 and 0.8912, respectively. With gap-filled VIs, there is a 1–2% point increase in F1 scores for P. euphratica and T. chinensis. The average F1 score reaches 0.9075.
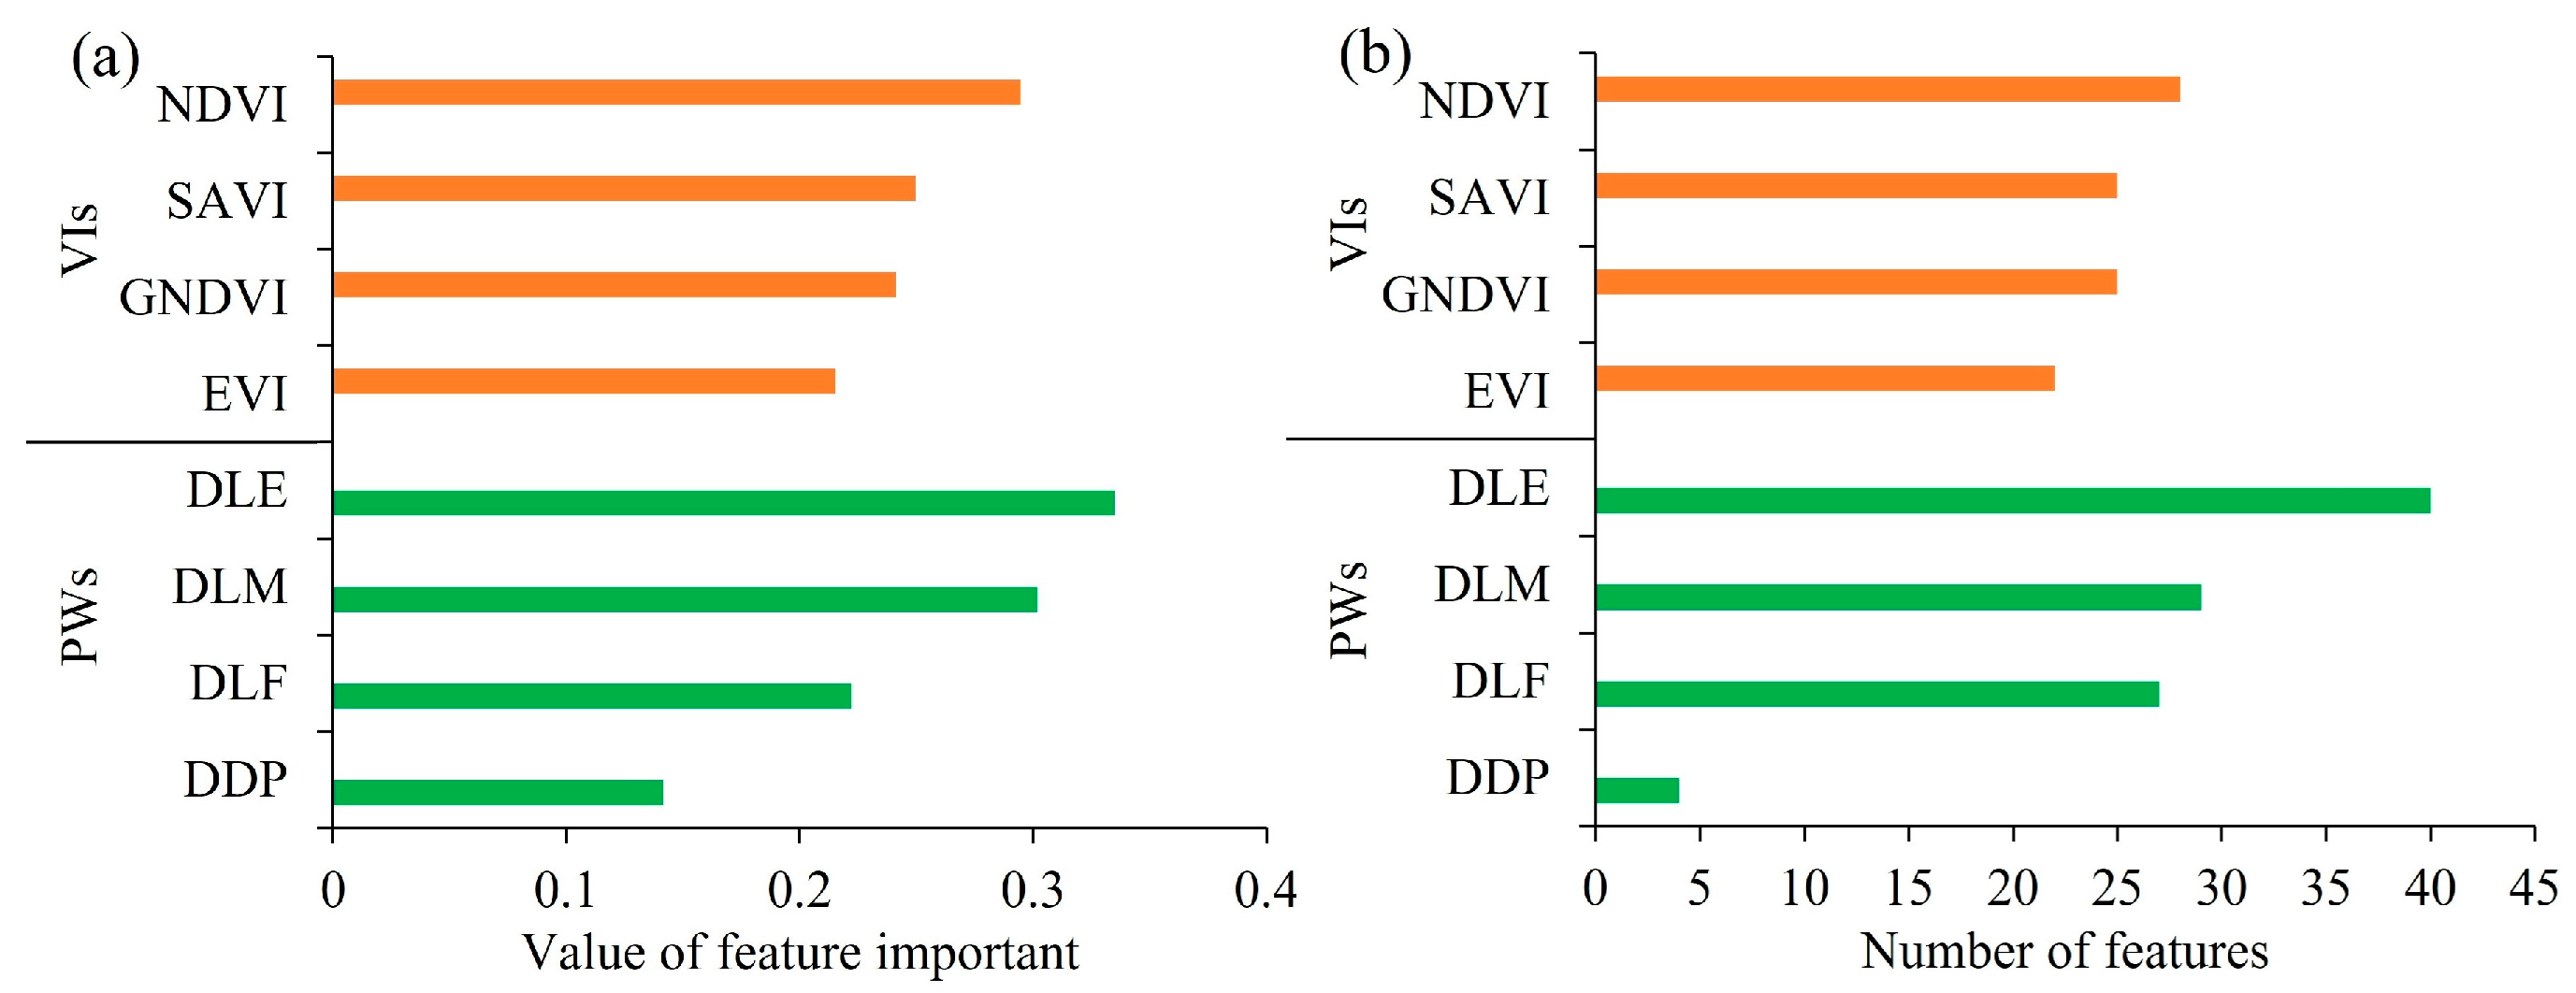
The random forest feature importance analysis indicates that the importance ranking of VIs is NDVI > SAVI > GNDVI > EVI. Regarding phenology windows, the importance ranking is DLE > DLM > DLF > DDP (Figure 7a). NDVI’s total MDI was 0.2944, and EVI has the lowest MDI (0.2152). The feature importance ranking across different phenology windows shows that features in DLE are the most significant, with an MDI of 0.3384, while DDP is the least significant, with an MDI of 0.1414. Analysis of the top 100 ranked features (Figure 7b) showed results similar to the importance ranking of the features. Among all VIs, NDVI encompasses the largest quantity, comprising 28 features in total. Across different phenology windows, DLE has the most features, with a total of 40.

3.3. Performance of RF Model in Different Phenology Windows

Figure 8 shows the identification accuracy of P. euphratica and T. chinensis using single and multiple phenology window classification setups. The average F1 score of single-phenology window classification setups, DLE is the highest (0.87). For two-phenology windows setups, DLE-DLM and DLE-DLF had the highest average F1 scores of 0.90. The highest average F1 score (0.91) among the Three-phenology window classification setups was reached when DLE, DLM, and DLS were combined.
The DDP phenology window is unsuitable for discriminating P. euphratica and T. chinensis. The classification accuracy using DDP phenology window is below 75%, and combining DDP with other phenology windows leads to a decrease in the discrimination accuracy of P. euphratica and T. chinensis. Among two-phenology windows combinations, when combined with DDP, accuracy decreases by 1–2 percentage points. However, combining other phenology windows leads to an increase in discrimination accuracy compared to individual setups. Specifically, the combination of DLE-DLM achieves the highest accuracy, with 90.35% for P. euphratica and 90.43% for T. chinensis, and the accuracy of the DLE-DLF combination was 90.29% for P. euphratica and 90.38% for T. chinensis. Among the three-phenology window combinations, the highest identification accuracy is observed in DLE-DLM-DLF, reaching 90.96% for P. euphratica and 91.01% for T. chinensis.

3.4. Classification Performance Between Phenology Asynchrony and Synchrony Windows

The Phenology Asynchrony Window (PAW) between P. euphratica and T. chinensis is the largest between DLM and DLF. PAW occurs across four time intervals (DOY: 104–118, 174–180, 232–270, 303–312) (Figure S2). Utilizing PAW’s features to discriminate P. euphratica and T. chinensis, the results indicate that the classification accuracy using the PAW (88.70%) is slightly 1% point higher than that of the Phenological Synchrony Window (PSW) (Figure 9). The PAW spans 67 days, while the PSW spans 298 days. Using PAW resulted in better classification outcomes compared to PSW, while utilizing only about one-third of the features.

3.5. Classification Results

The results of using the RF model with the highest accuracy (Combining features from the DLE, DLM and DLS phenology windows) to identify P. euphratica and T. chinensis reveal distinct distribution patterns for each species (Figure 10). P. euphratica was mainly distributed on both sides of the river and was the dominant species in areas close to the water. T. chinensis was primarily distributed at the periphery of P. euphratica, further from the water, indicating that T. chinensis is more drought-tolerant than P. euphratica. Regarding classification performance, dense P. euphratica and sparse T. chinensis were better identified (Figure 10c,d). Poorly grown P. euphratica farther from the river was sometimes misclassified as T. chinensis (Figure 10b). Conversely, better grown T. chinensis closer to the river could be mistakenly classified as P. euphratica (Figure 10e).

4. Discussion

This study demonstrates that the PS satellite constellation can capture a relatively comprehensive daily scale time series of earth observations, achieving a resolution capable of reaching the canopy scale of P. euphratica and T. chinensis. This capability enables the discrimination of P. euphratica and T. chinensis in sparse riparian forests within arid regions. In addition, PS remote sensing imagery has a revisit period of less than 1 day, and highly dense time-series imagery provides an opportunity to explore the optimal phenological window for classification. Determining the optimal remote sensing image acquisition period through the methodology in this paper is valuable for purchasing high-resolution imagery for future large-scale P. euphratica forest identification, and for selecting the optimal time for drone data acquisition [38].

4.1. Optimal Phenology Windows for Discriminating P. euphratica and T. chinensis

When using remote sensing images to identify tree species, the best time window is usually in the season when the characteristics of trees change most significantly, or in the season when the characteristics of different tree species are most obvious [55]. Trees usually germinate and leaf out in spring, and shed leaves in autumn. Each tree species exhibits a different trajectory of greening and defoliation during this period, which is often an effective window for identifying tree species [56]. In summer, the VIs for each tree species remain relatively stable. However, if substantial differences in greenness persist among tree species, favorable classification outcomes can still be achieved [57]. Our research indicates that, in discriminating between P. euphratica and T. chinensis, aside from the DDP window, the overall accuracy of identification for DLE, DLM, and DLF windows exceeds 85%, with the highest classification accuracy found in the DLE window. Li et al. [32] discovered that the optimal time window for distinguishing between P. euphratica and T. chinensis based on Sentinel-2 imagery’s spectral differences is during April and May, which falls within the DLE window. However, the F1-score of P. euphratica identified by Sentinel-2 was 0.77, our utilization of more temporally dense and higher-resolution PS imagery achieved an F1-score of 0.87, resulting in improved performance. The F1 score for identifying P. euphratica was 0.86 in both the DLM and DLF windows. Despite their similar precision, the DLM window spans 96 days, whereas the DLF window covers only 33 days. In terms of identification efficiency, DLF outperforms DLM. Fang et al. [58] also found images obtained during the autumn aging peak were the most valuable variables for tree classification. In addition, relevant research also shows that combining spring and autumn images can enhance the ability to distinguish tree species [59]. Therefore, this study suggests that the most valuable time windows to identify P. euphratica are DLE and DLF.

4.2. Phenology Asynchrony Windows as Critical Time Windows for Tree Species Discrimination

Differences in phenology between species are greater than differences in phenology between individuals of the same species [60]. In the time window of tree species phenological differences, trees exhibit different phenological behaviors, providing potential best dates for tree species mapping [61]. Li et al. [28] based on the classification results of different phenological stages, they concluded that the phenological difference period is the best time window for mangrove mapping. The results of this study also show that the characteristics of the phenological difference stages of P. euphratica and T. chinensis are more valuable in classification. Although the phenological difference stage only accounts for about one-quarter of the days throughout the year, the recognition accuracy is 1% higher than that of the same phenological stage and only 2% lower than that of the whole phenological stage. Separability of P. euphratica and T. chinensis on phenological trajectory is the decisive factor in the successful distinction between these two tree species using time series remote sensing images.

4.3. Future Perspectives and Uncertainty Analysis

The classification results of this study also found that P. euphratica and T. chinensis have different living habits. P. euphratica is mainly close to both sides of the river and close to water sources. T. chinensis is distributed around P. euphratica, far away from water sources. Previous studies have also shown that P. euphratica is the dominant species in places with abundant water sources [62]. Based on this discovery, subsequent research can incorporate geographical environment characteristics into the classification of P. euphratica and T. chinensis. Previous studies have shown that in specific areas, incorporating geographical environment variables can improve the accuracy of tree species classification [26,63]. Geographical and environmental factors are even more important than texture characteristics in some tree species classifications [64]. Furthermore, to ensure consistent time series density of variables within each phenological window, this study only used VIs features for classification. This decision was made because the technology to reconstruct and fill missing values in VIs is mature. However, after knowing the optimal classification time window, if only pursue higher classification accuracy, integrating spectral features into the classification model will help improve classification accuracy. In addition, because PlanetScope is a commercial satellite, there is limited access to image data for education and research programs. Only data from 2022 was used in this study, which leads to some uncertainty in the results. However, it provides a reference for innovative applications of high-resolution remote sensing imagery for daily observations, which will provide more comprehensive analyses in the future when such satellites become freely available. The workflow of this study involves multiple processing steps; however, perturbation analysis (by introducing ±5% random noise into the input time series) indicates that the derived phenological features exhibit robustness to minor uncertainties in input data and curve fitting. The associated impact on classification accuracy is minimal (with an F1 score reduction of <1%), demonstrating the robustness of our framework. Nevertheless, we acknowledge that the reliability of the workflow could be further elucidated through more formal uncertainty propagation methods, which will be explored in future work.

5. Conclusions

In this investigation, we utilized daily scale 3 m resolution earth observation imagery obtained from the PS satellite constellation to study the optimal phenology windows for discriminating P. euphratica and T. chinensis. The primary conclusions can be summarized as follows: except for the DDP window, the F1-scores for identifying P. euphratica and T. chinensis exceed 0.85. Among individual phenology windows, the DLE window shows the highest overall accuracy in identifying P. euphratica and T. chinensis. Among combinations of two phenology windows, the interpretation of the DLE-DLM and DLE-DLF combination yields the highest identification accuracy. Among combinations of three phenology windows, the DLE-DLM-DLF combination exhibits the highest identification accuracy. Including features from the DDP phenology window reduces accuracy in identifying P. euphratica and T. chinensis. Additionally, we found that features within the PAW between P. euphratica and T. chinensis are more valuable than those within the PSW. The main contribution of this study lies in providing an approach for exploring at which phenology stage remote sensing imagery can more efficiently and accurately distinguish tree species. Moreover, we also demonstrated the greater value of features in PAW for tree species classification. This provides insights for future large-scale tree mapping by selecting optimal image acquisition times and the most useful images.

Supplementary Materials

The following supporting information can be downloaded from the https://www.mdpi.com/article/10.3390/f16101560/s1, Figure S1: Morphology and discrimination of P. euphratica and T. chinensis on GF-7 images shown in standard false color (NIR, Red, Green); Figure S2: The distribution of phenology synchrony and asynchrony periods between P. euphratica and T. chinensis.

Author Contributions

Conceptualization, Z.W.; methodology, Z.W. and X.C.; software, Z.W.; validation, Z.W. and X.C.; formal analysis, Z.W. and X.C.; investigation, Z.W. and X.C.; resources, Z.W. and S.Z.; data curation, Z.W. and X.C.; writing—original draft preparation, Z.W.; writing—review and editing, Z.W. and X.C.; visualization, Z.W. and X.C.; supervision, Z.W. and S.Z.; project administration, Z.W.; funding acquisition, Z.W. and S.Z. All authors have read and agreed to the published version of the manuscript.

Funding

This work was funded by Henan Polytechnic University Key Discipline Construction Project.

Data Availability Statement

Remote sensing image data for this study can be downloaded from the corresponding website. The raw data supporting the conclusions of this article will be made available by the authors on request.

Acknowledgments

The authors would like to thank Planet Labs, Inc. for providing the PlanetScope imagery used in this study. We also gratefully acknowledge the technical support from the PlanetScope team. Thanks to the China Remote Sensing Data and Application Service Platform for providing GF-7 high-resolution remote sensing images. Thanks to Henan Polytechnic University for providing the equipment and laboratory required for this research.

Conflicts of Interest

The authors declare no conflicts of interest.

Abbreviations

The following abbreviations are used in this manuscript:
SOSStart of Spring
MOSMiddle of Spring
EOSEnd of Spring
SOFStart of Fall
MOFMiddle of Fall
EOFEnd of Fall
DLEDuration of Leaf Expansion
DLMDuration of Leaf Maturity
DLFDuration of Leaf Fall
DDPDuration of the Dormancy Period
PAWPhenology Asynchrony Window
PSWPhenological Synchrony Window
RFRandom Forest

References

  1. Guirado, E.; Delgado-Baquerizo, M.; Martínez-Valderrama, J.; Tabik, S.; Alcaraz-Segura, D.; Maestre, F.T. Climate legacies drive the distribution and future restoration potential of dryland forests. Nat. Plants 2022, 8, 879–886. [Google Scholar] [CrossRef]
  2. Wang, L.; Song, X.; Liu, Y.; Li, L.; Zhao, X.; Meng, P.; Fu, C.; Wei, W.; Wang, X.; Li, H. Effects of Long-Term Vegetation Restoration on Green Water Utilization Heterogeneity in the Loess Plateau Based on Field Experiments and Modeling. Plants 2025, 14, 644. [Google Scholar] [CrossRef] [PubMed]
  3. Keram, A.; Halik, Ü.; Keyimu, M.; Aishan, T.; Mamat, Z.; Rouzi, A. Gap dynamics of natural Populus euphratica floodplain forests affected by hydrological alteration along the Tarim River: Implications for restoration of the riparian forests. For. Ecol. Manag. 2019, 438, 103–113. [Google Scholar] [CrossRef]
  4. Peng, Y.; He, G.; Wang, G. Spatial-temporal analysis of the changes in Populus euphratica distribution in the Tarim National Nature Reserve over the past 60 years. Int. J. Appl. Earth Obs. Geoinf. 2022, 113, 103000. [Google Scholar] [CrossRef]
  5. Wang, J.; Han, P.; Zhang, Y.; Li, J.; Xu, L.; Shen, X.; Yang, Z.; Xu, S.; Li, G.; Chen, F. Analysis on ecological status and spatial–temporal variation of Tamarix chinensis forest based on spectral characteristics and remote sensing vegetation indices. Environ. Sci. Pollut. Res. 2022, 29, 37315–37326. [Google Scholar] [CrossRef]
  6. Ling, H.; Xu, H.; Guo, B.; Deng, X.; Zhang, P.; Wang, X. Regulating water disturbance for mitigating drought stress to conserve and restore a desert riparian forest ecosystem. J. Hydrol. 2019, 572, 659–670. [Google Scholar] [CrossRef]
  7. Zhang, P.; Deng, X.; Long, A.; Xu, H.; Ye, M.; Li, J. Change in Spatial Distribution Patterns and Regeneration of Populus euphratica under Different Surface Soil Salinity Conditions. Sci. Rep. 2019, 9, 9123. [Google Scholar] [CrossRef]
  8. Keyimu, M.; Halik, Ü.; Betz, F.; Dulamsuren, C. Vitality variation and population structure of a riparian forest in the lower reaches of the Tarim River, NW China. J. For. Res. 2018, 29, 749–760. [Google Scholar] [CrossRef]
  9. Deng, X.; Xu, H.; Ye, M.; Li, B.; Fu, J.; Yang, Z. Impact of long-term zero-flow and ecological water conveyance on the radial increment of Populus euphratica in the lower reaches of the Tarim River, Xinjiang, China. Reg. Environ. Chang. 2015, 15, 13–23. [Google Scholar] [CrossRef]
  10. Halik, Ü.; Aishan, T.; Betz, F.; Kurban, A.; Rouzi, A. Effectiveness and challenges of ecological engineering for desert riparian forest restoration along China’s largest inland river. Ecol. Eng. 2019, 127, 11–22. [Google Scholar] [CrossRef]
  11. Ling, H.; Zhang, P.; Xu, H.; Zhao, X. How to Regenerate and Protect Desert Riparian Populus euphratica Forest in Arid Areas. Sci. Rep. 2015, 5, 15418. [Google Scholar] [CrossRef]
  12. Yang, Y.; Zou, J.; Huang, Y.; Wu, Z.; Fang, T.; Xue, J.; Wang, D.; Wang, Y.; Wang, J.; Yang, X.; et al. Investigating the Earliest Identifiable Timing of Sugarcane at Early Season Based on Optical and SAR Time-Series Data. Remote Sens. 2025, 17, 2773. [Google Scholar] [CrossRef]
  13. Reiner, F.; Gominski, D.; Fensholt, R.; Brandt, M. An Operational Framework to Track Individual Farmland Trees Over Time at National Scales Using PlanetScope. IEEE J. Sel. Top. Appl. Earth Obs. Remote Sens. 2025, 18, 1109–1121. [Google Scholar] [CrossRef]
  14. Mikołajczyk, Ł.; Hawryło, P.; Netzel, P.; Talaga, J.; Zdunek, N.; Socha, J. Classification of Tree Species in Poland Using CNNs Tabular-to-Pseudo Image Approach Based on Sentinel-2 Annual Seasonality Data. Forests 2025, 16, 1039. [Google Scholar] [CrossRef]
  15. Liu, H.; An, H. Analysis of the importance of five new spectral indices from WorldView-2 in tree species classification. J. Spat. Sci. 2020, 65, 455–466. [Google Scholar] [CrossRef]
  16. Yan, S.; Jing, L.; Wang, H. A New Individual Tree Species Recognition Method Based on a Convolutional Neural Network and High-Spatial Resolution Remote Sensing Imagery. Remote Sens. 2021, 13, 479. [Google Scholar] [CrossRef]
  17. Gazzea, M.; Kristensen, L.M.; Pirotti, F.; Ozguven, E.E.; Arghandeh, R. Tree Species Classification Using High-Resolution Satellite Imagery and Weakly Supervised Learning. IEEE Trans. Geosci. Remote Sens. 2022, 60, 1–11. [Google Scholar] [CrossRef]
  18. Adelabu, S.; Dube, T. Employing ground and satellite-based QuickBird data and random forest to discriminate five tree species in a Southern African Woodland. Geocarto Int. 2015, 30, 457–471. [Google Scholar] [CrossRef]
  19. Agarwal, S.; Vailshery, L.S.; Jaganmohan, M.; Nagendra, H. Mapping Urban Tree Species Using Very High Resolution Satellite Imagery: Comparing Pixel-Based and Object-Based Approaches. ISPRS Int. J. Geo-Inf. 2013, 2, 220–236. [Google Scholar] [CrossRef]
  20. Huang, Y.; Wen, X.; Gao, Y.; Zhang, Y.; Lin, G. Tree Species Classification in UAV Remote Sensing Images Based on Super-Resolution Reconstruction and Deep Learning. Remote Sens. 2023, 15, 2942. [Google Scholar] [CrossRef]
  21. Polyakova, A.; Mukharamova, S.; Yermolaev, O.; Shaykhutdinova, G. Automated Recognition of Tree Species Composition of Forest Communities Using Sentinel-2 Satellite Data. Remote Sens. 2023, 15, 329. [Google Scholar] [CrossRef]
  22. Grabska, E.; Frantz, D.; Ostapowicz, K. Evaluation of machine learning algorithms for forest stand species mapping using Sentinel-2 imagery and environmental data in the Polish Carpathians. Remote Sens. Environ. 2020, 251, 112103. [Google Scholar] [CrossRef]
  23. Kollert, A.; Bremer, M.; Löw, M.; Rutzinger, M. Exploring the potential of land surface phenology and seasonal cloud free composites of one year of Sentinel-2 imagery for tree species mapping in a mountainous region. Int. J. Appl. Earth Obs. Geoinf. 2021, 94, 102208. [Google Scholar] [CrossRef]
  24. Qiu, T.; Song, C.H.; Clark, J.S.; Seyednasrollah, B.; Rathnayaka, N.; Li, J.X. Understanding the continuous phenological development at daily time step with a Bayesian hierarchical space-time model: Impacts of climate change and extreme weather events. Remote Sens. Environ. 2020, 247, 111956. [Google Scholar] [CrossRef]
  25. Moon, M.; Seyednasrollah, B.; Richardson, A.D.; Friedl, M.A. Using time series of MODIS land surface phenology to model temperature and photoperiod controls on spring greenup in North American deciduous forests. Remote Sens. Environ. 2021, 260, 112466. [Google Scholar] [CrossRef]
  26. Liu, X.; Frey, J.; Munteanu, C.; Still, N.; Koch, B. Mapping tree species diversity in temperate montane forests using Sentinel-1 and Sentinel-2 imagery and topography data. Remote Sens. Environ. 2023, 292, 113576. [Google Scholar] [CrossRef]
  27. Lechner, M.; Dostálová, A.; Hollaus, M.; Atzberger, C.; Immitzer, M. Combination of Sentinel-1 and Sentinel-2 Data for Tree Species Classification in a Central European Biosphere Reserve. Remote Sens. 2022, 14, 2687. [Google Scholar] [CrossRef]
  28. Li, H.; Jia, M.; Zhang, R.; Ren, Y.; Wen, X. Incorporating the Plant Phenological Trajectory into Mangrove Species Mapping with Dense Time Series Sentinel-2 Imagery and the Google Earth Engine Platform. Remote Sens. 2019, 11, 2479. [Google Scholar] [CrossRef]
  29. Zhang, X.; Wang, J.; Henebry, G.M.; Gao, F. Development and evaluation of a new algorithm for detecting 30 m land surface phenology from VIIRS and HLS time series. ISPRS J. Photogramm. Remote Sens. 2020, 161, 37–51. [Google Scholar] [CrossRef]
  30. Zhao, Y.; Lee, C.K.F.; Wang, Z.; Wang, J.; Gu, Y.; Xie, J.; Law, Y.K.; Song, G.; Bonebrake, T.C.; Yang, X.; et al. Evaluating fine-scale phenology from PlanetScope satellites with ground observations across temperate forests in eastern North America. Remote Sens. Environ. 2022, 283, 113310. [Google Scholar] [CrossRef]
  31. Peng, Y.; He, G.; Wang, G.; Zhang, Z. Large-Scale Populus euphratica Distribution Mapping Using Time-Series Sentinel-1/2 Data in Google Earth Engine. Remote Sens. 2023, 15, 1585. [Google Scholar] [CrossRef]
  32. Li, H.; Shi, Q.; Wan, Y.; Shi, H.; Imin, B. Using Sentinel-2 Images to Map the Populus euphratica Distribution Based on the Spectral Difference Acquired at the Key Phenological Stage. Forests 2021, 12, 147. [Google Scholar] [CrossRef]
  33. You, H.; Tian, S.; Yu, L.; Lv, Y. Pixel-Level Remote Sensing Image Recognition Based on Bidirectional Word Vectors. IEEE Trans. Geosci. Remote Sens. 2020, 58, 1281–1293. [Google Scholar] [CrossRef]
  34. Li, D.; Shi, Q.; Peng, L.; Wan, Y. Plant Population Classification Based on PointCNN in the Daliyabuyi Oasis, China. Forests 2023, 14, 1943. [Google Scholar] [CrossRef]
  35. Wang, Y.; Ma, H.; Alifu, K.; Lv, Y. Remote sensing image description based on word embedding and end-to-end deep learning. Sci. Rep. 2021, 11, 3162. [Google Scholar] [CrossRef] [PubMed]
  36. Wang, H.Y.; Li, J.L.; Voorde, T.V.D.; Zhou, C.H.; Maeyer, P.D.; Ma, Y. Individual Populus euphratica Tree Detection in Sparse Desert Forests Based on Constrained 2-D Bin Packing. IEEE Trans. Geosci. Remote Sens. 2024, 62, 4407219. [Google Scholar] [CrossRef]
  37. Sadeh, Y.; Zhu, X.; Dunkerley, D.; Walker, J.P.; Zhang, Y.; Rozenstein, O.; Manivasagam, V.S.; Chenu, K. Fusion of Sentinel-2 and PlanetScope time-series data into daily 3 m surface reflectance and wheat LAI monitoring. Int. J. Appl. Earth Obs. Geoinf. 2021, 96, 102260. [Google Scholar] [CrossRef]
  38. Valderrama-Landeros, L.; Flores-Verdugo, F.; Rodríguez-Sobreyra, R.; Kovacs, J.M.; Flores-de-Santiago, F. Extrapolating canopy phenology information using Sentinel-2 data and the Google Earth Engine platform to identify the optimal dates for remotely sensed image acquisition of semiarid mangroves. J. Environ. Manag. 2021, 279, 111617. [Google Scholar] [CrossRef]
  39. Cheng, Y.; Vrieling, A.; Fava, F.; Meroni, M.; Marshall, M.; Gachoki, S. Phenology of short vegetation cycles in a Kenyan rangeland from PlanetScope and Sentinel-2. Remote Sensing of Environment 2020, 248, 112004. [Google Scholar] [CrossRef]
  40. Zhao, R.; Chen, Y.; Shi, P.; Zhang, L.; Pan, J.; Zhao, H. Land use and land cover change and driving mechanism in the arid inland river basin: A case study of Tarim River, Xinjiang, China. Environ. Earth Sci. 2013, 68, 591–604. [Google Scholar] [CrossRef]
  41. Liu, G.; Kurban, A.; Duan, H.; Halik, U.; Ablekim, A.; Zhang, L. Desert riparian forest colonization in the lower reaches of Tarim River based on remote sensing analysis. Environ. Earth Sci. 2014, 71, 4579–4589. [Google Scholar] [CrossRef]
  42. Wu, S.; Wang, J.; Yan, Z.; Song, G.; Chen, Y.; Ma, Q.; Deng, M.; Wu, Y.; Zhao, Y.; Guo, Z.; et al. Monitoring tree-crown scale autumn leaf phenology in a temperate forest with an integration of PlanetScope and drone remote sensing observations. ISPRS J. Photogramm. Remote Sens. 2021, 171, 36–48. [Google Scholar] [CrossRef]
  43. Tang, H.; Xie, J.; Tang, X.; Chen, W.; Li, Q. On-Orbit Radiometric Performance of GF-7 Satellite Multispectral Imagery. Remote Sens. 2022, 14, 886. [Google Scholar] [CrossRef]
  44. Xie, J.; Liu, R.; Tang, X.; Yang, X.; Zeng, J.; Mo, F.; Mei, Y. A Geometric Calibration Method Without a Field Site of the GF-7 Satellite Laser Relying on a Surface Mathematical Model. IEEE Trans. Geosci. Remote Sens. 2023, 61, 1–14. [Google Scholar] [CrossRef]
  45. Camps-Valls, G.; Campos-Taberner, M.; Moreno-Martínez, Á.; Walther, S.; Duveiller, G.; Cescatti, A.; Mahecha, M.D.; Muñoz-Marí, J.; García-Haro, F.J.; Guanter, L.; et al. A unified vegetation index for quantifying the terrestrial biosphere. Sci. Adv. 2021, 7, eabc7447. [Google Scholar] [CrossRef] [PubMed]
  46. Graesser, J.; Stanimirova, R.; Friedl, M.A. Reconstruction of Satellite Time Series with a Dynamic Smoother. IEEE J. Sel. Top. Appl. Earth Obs. Remote Sens. 2022, 15, 1803–1813. [Google Scholar] [CrossRef]
  47. Farmonov, N.; Amankulova, K.; Szatmári, J.; Urinov, J.; Narmanov, Z.; Nosirov, J.; Mucsi, L. Combining PlanetScope and Sentinel-2 images with environmental data for improved wheat yield estimation. Int. J. Digit. Earth 2023, 16, 847–867. [Google Scholar] [CrossRef]
  48. Liu, R.; Shang, R.; Liu, Y.; Lu, X. Global evaluation of gap-filling approaches for seasonal NDVI with considering vegetation growth trajectory, protection of key point, noise resistance and curve stability. Remote Sens. Environ. 2017, 189, 164–179. [Google Scholar] [CrossRef]
  49. Zhang, X.; Friedl, M.A.; Schaaf, C.B.; Strahler, A.H.; Hodges, J.C.F.; Gao, F.; Reed, B.C.; Huete, A. Monitoring vegetation phenology using MODIS. Remote Sens. Environ. 2003, 84, 471–475. [Google Scholar] [CrossRef]
  50. Rodriguez-Galiano, V.F.; Ghimire, B.; Rogan, J.; Chica-Olmo, M.; Rigol-Sanchez, J.P. An assessment of the effectiveness of a random forest classifier for land-cover classification. ISPRS J. Photogramm. Remote Sens. 2012, 67, 93–104. [Google Scholar] [CrossRef]
  51. Liu, H.; Liu, Y.; Xu, W.; Wu, M.; Wang, L.; Lu, N.; Ou, G. A Seasonal Fresh Tea Yield Estimation Method with Machine Learning Algorithms at Field Scale Integrating UAV RGB and Sentinel-2 Imagery. Plants 2025, 14, 373. [Google Scholar] [CrossRef]
  52. Pedregosa, F.; Varoquaux, G.; Gramfort, A.; Michel, V.; Thirion, B.; Grisel, O.; Blondel, M.; Prettenhofer, P.; Weiss, R.; Dubourg, V.; et al. Scikit-learn: Machine Learning in Python. J. Mach. Learn. Res. 2011, 12, 2825–2830. Available online: https://scikit-learn.sourceforge.net (accessed on 29 November 2023).
  53. Belgiu, M.; Drăguţ, L. Random forest in remote sensing: A review of applications and future directions. ISPRS J. Photogramm. Remote Sens. 2016, 114, 24–31. [Google Scholar] [CrossRef]
  54. Immitzer, M.; Vuolo, F.; Atzberger, C. First Experience with Sentinel-2 Data for Crop and Tree Species Classifications in Central Europe. Remote Sens. 2016, 8, 166. [Google Scholar] [CrossRef]
  55. Grybas, H.; Congalton, R.G. A Comparison of Multi-Temporal RGB and Multispectral UAS Imagery for Tree Species Classification in Heterogeneous New Hampshire Forests. Remote Sens. 2021, 13, 2631. [Google Scholar] [CrossRef]
  56. Osińska-Skotak, K.; Radecka, A.; Piórkowski, H.; Michalska-Hejduk, D.; Kopeć, D.; Tokarska-Guzik, B.; Ostrowski, W.; Kania, A.; Niedzielko, J. Mapping Succession in Non-Forest Habitats by Means of Remote Sensing: Is the Data Acquisition Time Critical for Species Discrimination? Remote Sens. 2019, 11, 2629. [Google Scholar] [CrossRef]
  57. Zhang, C.; Xia, K.; Feng, H.; Yang, Y.; Du, X. Tree species classification using deep learning and RGB optical images obtained by an unmanned aerial vehicle. J. For. Res. 2021, 32, 1879–1888. [Google Scholar] [CrossRef]
  58. Fang, F.; McNeil, B.E.; Warner, T.A.; Maxwell, A.E.; Dahle, G.A.; Eutsler, E.; Li, J. Discriminating tree species at different taxonomic levels using multi-temporal WorldView-3 imagery in Washington D.C., USA. Remote Sens. Environ. 2020, 246, 111811. [Google Scholar] [CrossRef]
  59. Grabska, E.; Hostert, P.; Pflugmacher, D.; Ostapowicz, K. Forest Stand Species Mapping Using the Sentinel-2 Time Series. Remote Sens. 2019, 11, 1197. [Google Scholar] [CrossRef]
  60. Weil, G.; Lensky, I.M.; Levin, N. Using ground observations of a digital camera in the VIS-NIR range for quantifying the phenology of Mediterranean woody species. Int. J. Appl. Earth Obs. Geoinf. 2017, 62, 88–101. [Google Scholar] [CrossRef]
  61. Cristani, M.; Lisein, J.; Michez, A.; Claessens, H.; Lejeune, P. Discrimination of Deciduous Tree Species from Time Series of Unmanned Aerial System Imagery. PLoS ONE 2015, 10, e0141006. [Google Scholar] [CrossRef]
  62. Wan, Y.; Shi, Q.; Dai, Y.; Marhaba, N.; Peng, L.; Peng, L.; Shi, H. Water Use Characteristics of Populus euphratica Oliv. and Tamarix chinensis Lour. at Different Growth Stages in a Desert Oasis. Forests 2022, 13, 236. [Google Scholar] [CrossRef]
  63. Dong, C.; Zhao, G.; Meng, Y.; Li, B.; Peng, B. The Effect of Topographic Correction on Forest Tree Species Classification Accuracy. Remote Sens. 2020, 12, 787. [Google Scholar] [CrossRef]
  64. Wang, M.; Li, M.; Wang, F.; Ji, X. Exploring the Optimal Feature Combination of Tree Species Classification by Fusing Multi-Feature and Multi-Temporal Sentinel-2 Data in Changbai Mountain. Forests 2022, 13, 1058. [Google Scholar] [CrossRef]
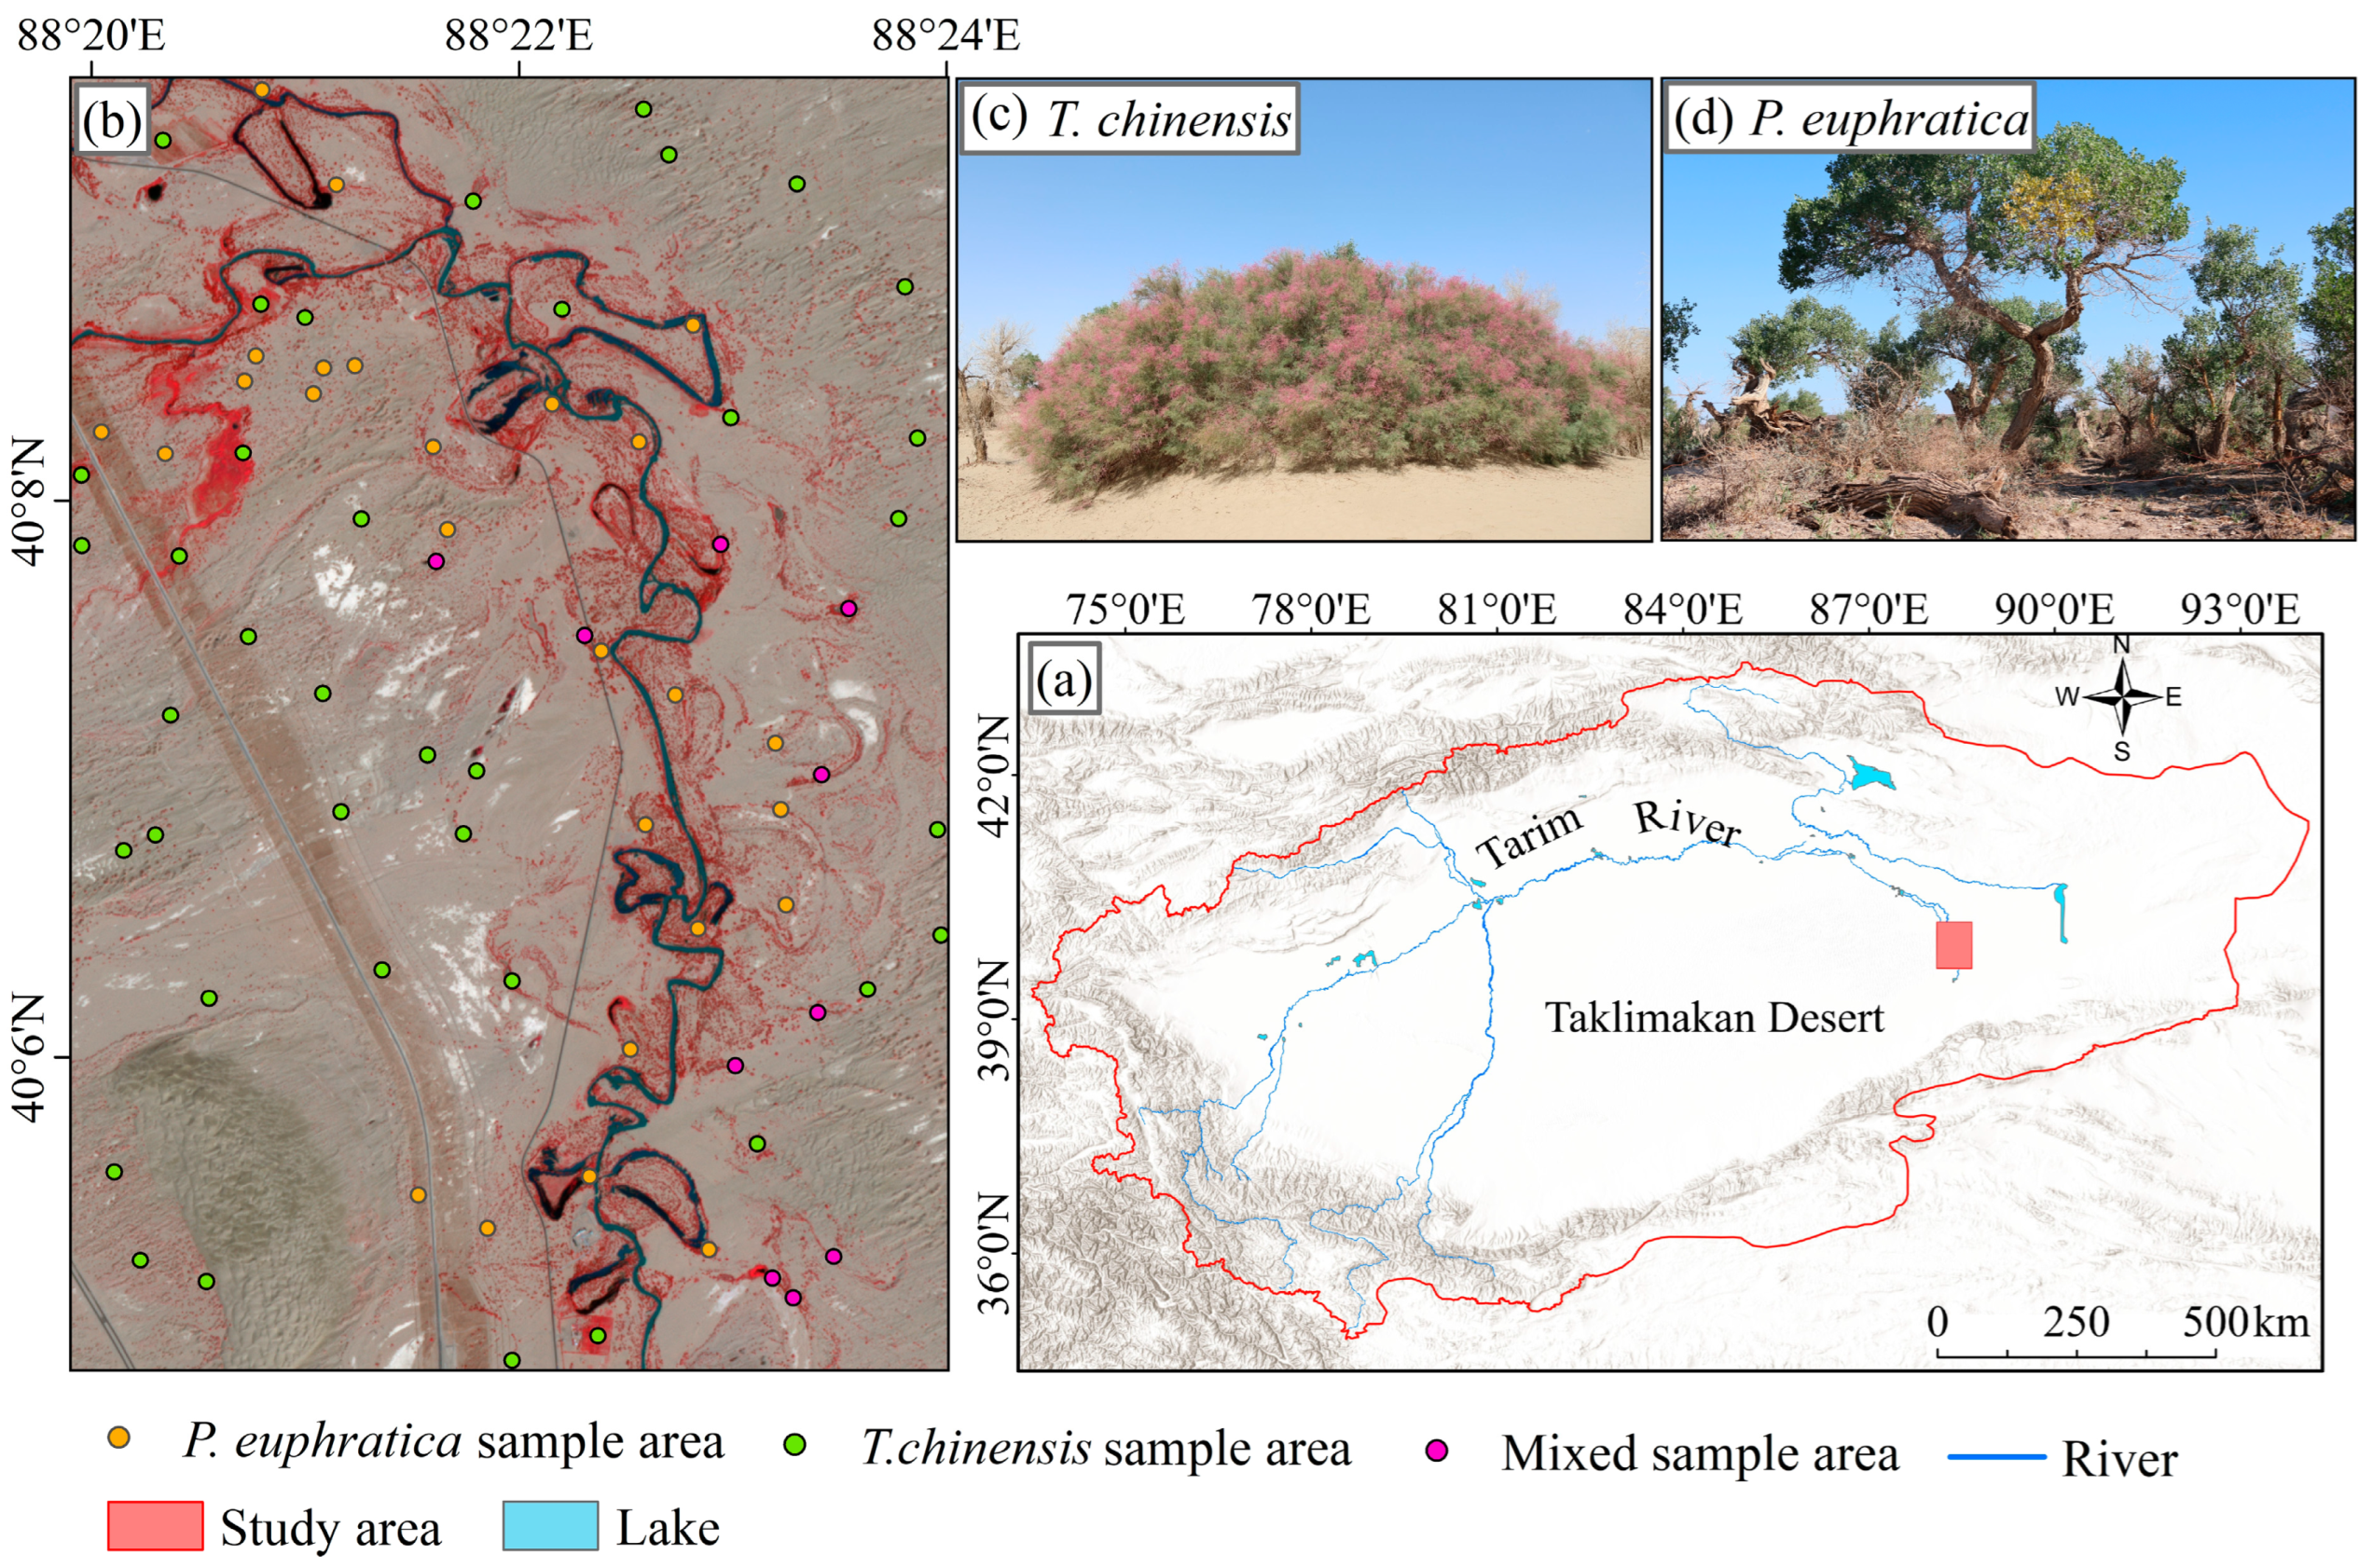
Figure 1. Location of the study area and distribution of P. euphratica and T. chinensis sample plots within it: (a) location of the Tarim River Basin and study area; (b) the PlanetScope standard false-color (NIR-Red-Green) composite image, and the distribution of P. euphratica and T. chinensis sample plots; (c) pictures of T. chinensis; (d) pictures of P. euphratica.
Forests 16 01560 g001
Figure 2. PlanetScope data availability and cloud cover statistics for the study area for 2022. Images were visually inspected to select cloud-free data. The green labels are the images selected for analysis.
Forests 16 01560 g002
Figure 3. Workflow for exploring the optimal phenology windows for discriminating P. euphratica and T. chinensis: (a) obtaining samples of P. euphratica and T. chinensis from GF-7 imagery; (b) extracting phenology metrics for P. euphratica and delineating phenology windows; (c) time-series vegetation indices reconstruction and gap-filling; (d) training the Random Forest model with vegetation indices variables extracted from different phenology windows and their combinations, comparing model accuracies to determine the optimal phenology window.
Forests 16 01560 g003
Figure 4. Using the PlanetScope time series EVI data from pure P. euphratica and pure T. chinensis pixels, extract the phenology metrics for P. euphratica and T. chinensis using the double logistic curve fitting method along with the third derivative of the fitted curves: (a) examples of P. euphratica phenology metrics extraction; (b) examples of T. chinensis phenology metrics extraction. (SOS: start of spring, MOS: middle of spring, EOS: end of spring, SOF: start of fall, MOF: middle of fall, EOF: end of fall).
Forests 16 01560 g004
Figure 5. Temporal profiles of vegetation indices for P. euphratica and T. chinensis. (a) NDVI; (b) GNDVI; (c) EVI; (d) SAVI. (NDVI: Normalized Difference Vegetation Index, GNDVI: Green Normalized Difference Vegetation Index, EVI: Enhanced Vegetation Index, SAVI: Soil-Adjusted Vegetation Index). Shaded areas indicate the standard deviation around the fitted curve.
Forests 16 01560 g005
Figure 6. The phenology metrics for P. euphratica (a) and T. chinensis (b), extracted from the EVI time series of pure P. euphratica and pure T. chinensis pixels using PlanetScope imagery (SOS: start of spring, MOS: middle of spring, EOS: end of spring, SOF: start of fall, MOF: middle of fall, EOF: end of fall).
Forests 16 01560 g006
Figure 7. Ranking of importance of vegetation indices and phenology windows: (a) the importance score for each vegetation index and each phenology window based on the mean decrease in impurity; (b) among the top 100 features ranked by importance score, the count of features attributed to each vegetation index and each phenology window (VIs are vegetation indices, and PWs are phenology windows).
Forests 16 01560 g007
Figure 8. Recognition accuracy of P. euphratica and T. chinensis under different phenology windows and their combinations: (a) recognition results for single phenology windows; (b) recognition results for two phenology windows combination; (c) recognition results for three phenology windows combination; (d) The optimal recognition accuracy among different number phenology window combinations; (e) comparison of the average recognition accuracy of P. euphratica and T. chinensis across all phenology windows. (DLE: the duration of leaf expansion, DLM: the duration of leaf Maturity, DLF: the duration of leaf fall, DDP: the duration of dormancy period, PWs: phenology windows).
Forests 16 01560 g008
Figure 9. Recognition accuracy of P. euphratica and T. chinensis during periods of phenological synchrony and asynchrony between the two species.
Forests 16 01560 g009
Figure 10. Classification results of P. euphratica and T. chinensis using the optimal phenology combinations: (a) mixed zones of P. euphratica and T. chinensis; (b) sparse areas of P. euphratica; (c) sparse areas of T. chinensis; (d) dense areas of P. euphratica; (e) dense areas of T. chinensis.
Forests 16 01560 g010
Table 1. Calculation formula for vegetation indices used in this study.
Vegetation IndicesEquation
Normalized Difference Vegetation Index (NDVI) N I R R e d N I R + R e d
Enhanced Vegetation Index (EVI) 2.5 × N I R R e d N I R + 6 × R e d 7.5 × B l u e + 1
Soil-Adjusted Vegetation Index (SAVI) ( 1 + L ) × ( N I R R e d ) N I R + R e d + L
Green Normalized Difference Vegetation Index (GNDVI) N I R G r e e n N I R + G r e e n
Note: Red, Green, Blue, and NIR are the red, green, blue, and near-infrared bands, respectively. L = 0.5.
Table 2. Performance of the Random Forest model in discriminating P. euphratica and T. chinensis using vegetation index time series variables with and without gap-filling.
MetricP. euphraticaT. chinensisAverage F1 Score
PAUAF1 ScorePAUAF1 Score
VIs (not filling-gap)0.91650.86620.89100.90020.88240.89120.8911
VIs (gap-filling)0.92100.89250.90710.92220.89410.90790.9075
Note: PA: producer’s accuracy; UA: user’s accuracy; VIs: Vegetation Indices include NDVI GNDVI SAVI EVI.
Disclaimer/Publisher’s Note: The statements, opinions and data contained in all publications are solely those of the individual author(s) and contributor(s) and not of MDPI and/or the editor(s). MDPI and/or the editor(s) disclaim responsibility for any injury to people or property resulting from any ideas, methods, instructions or products referred to in the content.