Article

Forest Fire Analysis Prediction and Digital Twin Verification: A Trinity Framework and Application

1
College of Engineering, Sichuan Normal University, Chengdu 610101, China
2
Sichuan Academy of Safety Science and Technology, Chengdu 610045, China
*
Authors to whom correspondence should be addressed.
Forests 2025, 16(10), 1546; https://doi.org/10.3390/f16101546
Submission received: 1 August 2025 / Revised: 7 September 2025 / Accepted: 4 October 2025 / Published: 7 October 2025
(This article belongs to the Special Issue Forest Fire: Landscape Patterns, Risk Prediction and Fuels Management)

Abstract

In recent years, frequent wildfires have posed significant threats to both the ecological environment and socioeconomic development. Investigating the mechanisms underlying the influencing factors of forest fires and accurately predicting the likelihood of such events are crucial for effective prevention strategies. However, the field currently faces challenges, including the unclear characterization of influencing factors, limited accuracy in forest fire predictions, and the absence of models for mountain fire scenarios. To address these issues, this study proposes a research framework of “decoupling analysis-model prediction-scenario validation” and employs Principal Component Analysis (PCA) and Shapley Additive Explanations (SHAP) value quantification to elucidate the significant roles of meteorological as well as combustible state indicators through multifactor coupling. Furthermore, the Attention-based Long Short-Term Memory (ALSTM) network trained on PCA-decoupled data achieved mean accuracy, recall, and area under the precision-recall curve (PR-AUC) values of 97.82%, 94.61%, and 99.45%, respectively, through 10-time cross-validation, significantly outperforming traditional LSTM neural networks and logistic regression (LR) methods. Based on digital twin technology, a three-dimensional mountain fire scenario evolution model is constructed to validate the accuracy of the ALSTM network’s predictions and to quantify the impact of key factors on fire evolution. This approach offers an interpretable solution for predicting forest fires in complex environments and provides theoretical and technical support for the digital transformation of forest fire prevention and management.

1. Introduction

In recent years, forest fires have become increasingly frequent, establishing themselves as the predominant and most destructive natural disaster within forest ecosystems [1]. Algeria, in particular, has been significantly impacted by this phenomenon. It ranks as the fourth most affected nation according to the European Forest Fire Information System (EFFIS) [2]. From 2008 to 2017, Algeria experienced over 31,513 forest fires, resulting in the burning of more than 320,409 hectares of forested land. The year 2012 alone witnessed over 5110 fires, consuming more than 99,061 hectares [3]. Regions including North America, Australia, and Southern Europe are frequently impacted by large-scale forest fires. In recent years, the wildfire season in the western United States has consistently lengthened, with burned areas repeatedly reaching record levels [4]; During the 2019–2020 fire season in Australia, approximately 18.95 million hectares of forest were destroyed [5]; Similarly, southern European countries such as Portugal and Greece have experienced multiple catastrophic fires, resulting in significant ecological damage and socio-economic consequences [6]. These instances illustrate that forest fires constitute a critical global challenge, necessitating urgent and collaborative responses from the international research community.
To accurately predict the likelihood of forest fires in a given area, it is imperative to identify the factors that contribute to fire occurrence, such as climate, terrain, and fuel conditions [7,8,9]. Understanding the relationship between these factors and the probability of fire is crucial [10]. These elements, often termed impact factors, significantly impact both the incidence and propagation of forest fires. Meteorological factors are critical determinants [11]. Given this context, the study utilizes a publicly accessible dataset of Algerian forest fires [12] to explore the dynamics of key meteorological factors—such as temperature, humidity, and ambient winds—during forest fire combustion. Additionally, the study reevaluates the physical significance of extended state indicators, including the Fine Fuel Moisture Code (FFMC), Duff Moisture Code (DMC), and Drought Code (DC).
The process of forest fire propagation is complicated by a strong nonlinear coupling of multiple environmental parameters [13,14,15], which impedes the accurate identification of the individual effects of these factors on fire behavior in empirical studies. The interactions among these factors often lead to feature confusion, thus challenging the ability of models to delineate the independent effects of crucial variables. Principal Component Analysis (PCA), a classical method for reducing dimensionality, offers an effective solution to this spatial coupling issue [16]. Through PCA, feature extraction is performed, transforming relevant variables into independent principal components (PCs) to minimize information redundancy and achieve feature decoupling while reducing dimensionality. This facilitates the identification of predominant factors in fire risk prediction and provides insights into the impact of each environmental variable on the transitions in forest fire behavior. Although scholars have attempted to achieve dimensionality reduction and decoupling of high-dimensional variables through PCA, this method primarily addresses the coupling issues of spatial dimensions and does not effectively handle the time-series dependencies of factors such as temperature and humidity, which are crucial for revealing dynamic interactions [17]. To address the temporal coupling issues—namely, the time lag effects in forest fire data and the dependencies among variables—this study integrates the Attention-based Long Short-Term Memory (ALSTM) network [18]. This approach predicts forest fires using data refined by PCA, aiming to enhance the accuracy of these predictions.
Current research on forest fire prediction predominantly aims to enhance prediction accuracy through the development of advanced algorithms and models. Despite the substantial benefits of machine learning models in addressing nonlinear challenges, their “black box” nature restricts interpretability [19,20], thereby limiting their utility in providing a comprehensive assessment of forest fire prediction outcomes [21]. Consequently, there is a pressing need for an objective and interpretable method to identify the key factors affecting the occurrence of forest fire disasters and to elucidate the decision-making mechanisms of the model. The Shapley Additive Explanations (SHAP) method [22], one of the most recent interpretable techniques, illustrates the impact of individual features through the collaborative interaction among factors [23]. This method explains each feature’s contribution to the model output and clarifies the significance and role of each influencing factor in model decision-making.
Traditional simulation research on fire occurrence in one-dimensional and two-dimensional forest environments [24,25,26] is hampered by an inherent limitation: the assumption of low-dimensional space. This assumption fails to capture the dynamic behavior of fire in three-dimensional terrains accurately. Furthermore, the inherent dangers associated with forest fires preclude extensive field testing of predictive analysis techniques. To overcome these limitations, this study adopted digital twin technology to develop a mountain fire scenario evolution model. This model enables the visualization of the impact of meteorological factors on forest fires through 3D scene replication and dynamic parameter adjustment. Furthermore, it allows for the quantification of the evolving dynamics within the traditional Canadian Fire Weather Index (FWI) system metrics and validates the accuracy of predictions made by the ALSTM model. Simultaneously, the model incorporates physically based equations, utilizing the topographical “block” burning equation and forest fire spread speed equation to represent physical spatial processes. This approach provides an additional enhancement and novel application of the forest fire spread model [27].
Based on the foregoing discussion, it can be reasonably concluded that the primary contribution of this paper is the introduction of a tripartite forest fire research framework comprising “decoupling analysis, model prediction, and scenario validation” to address the three principal challenges in forest fire management. This framework integrates three essential stages (e.g., decoupling analysis, model prediction, and scenario validation), each constituting a deeply interconnected cyclical system. Collectively, these stages establish a closed-loop decision support system that extends from data processing to physical perception. The specific rationale underlying this framework is detailed as follows:
  • Decoupling analysis phase: To address the challenge of distinguishing the characteristics of various influencing factors, this study engages in a multi-factor decoupling analysis. By integrating PCA and SHAP, this study develops a framework termed “factor screening-importance ranking-interpretation analysis.” This framework is designed to elucidate the impact of different factors on forest fire occurrence more clearly.
  • Model prediction phase: The research introduces a pioneering approach to spatiotemporal decoupling in model prediction. This involves resolving the issue of spatial coupling of multiple factors through PCA and addressing the time-delay effects using the ALSTM time-series prediction model. By decoupling the spatial and temporal data sources, this method enhances the accuracy of forest fire predictions.
  • Scenario validation phase: Employing digital twin technology, this paper constructs a three-dimensional model that dynamically analyzes the physical mechanisms and quantitative relationships of key meteorological and combustible indices affecting forest fire behavior. This model addresses the limitations of traditional one-dimensional and two-dimensional static simulations and the challenges faced by conventional machine learning models in field testing.
Compared to existing paradigms in forest fire research—including data-driven prediction models [28], physical simulation models [29,30], and hybrid models that integrate data-driven and physical simulation approaches [31,32,33]—the proposed framework not only achieves high predictive accuracy but also provides interpretability, physical plausibility, and three-dimensional visualization. For a comprehensive comparison and discussion of the distinctions and relationships between this framework and existing paradigms, please refer to Table S1.

2. Related Research

2.1. Research on Influencing Factors

Current academic investigations into the factors affecting forest fires predominantly concentrate on meteorological, topographical, and fuel-related variables and their impact on the initiation and propagation of fires [34]. Table 1 summarizes various factors that affect the occurrence of forest fires.
Research into forest fires has consistently highlighted the role of meteorological conditions in the evolution of these disasters [35,36]. Numerous studies elucidated the correlations between meteorological elements—such as temperature, humidity, and precipitation—and fire incidence through static correlation analyses. Xiao et al. [37] focused on the Guizhou Qiannan Buyi and Miao Autonomous Prefecture, utilizing the Bayesian estimation model to deduce a correlation between the frequency of forest fires and variations in monthly minimum relative humidity and monthly maximum wind speed. Gao Bo et al. [38] developed a prediction model for forest fires in the Daxinganling region based on logistic regression, assessing and analyzing principal factors affecting fire occurrence. Preisler and Westerling [39] examined the significant impact of meteorological factors and various extended composite indices on the occurrence and progression of fires in the western United States. Despite these advances, the majority of studies have concentrated on static analyses of individual factors, largely overlooking the complex interactions and spatiotemporal variations among different variables. Furthermore, there is a relative paucity of in-depth investigations into the mechanisms through which these factors affect fires. Although there has been an incremental increase in research employing methodologies such as machine learning and statistical modeling [40], the factor studies are evolving to a more dynamic and complex level, but there remains a significant gap in research on state-driven influencing factors under conditions of multi-environmental parameter coupling. Consequently, further research is imperative to unravel the complex relationships between multiple factors across various dimensions.

2.2. Current Status of Forest Fire Prediction

Forest fire prediction constitutes a critical area of research within the broader context of forest fire prevention and control. In recent years, the robust integration of machine learning technologies has significantly enhanced the precision of predictions in this field [41,42]. Nevertheless, the spatio-temporal dynamics of forest fires introduce significant time-lag coupling effects among various factors. Current time-series models struggle to effectively capture the dynamic interrelations of these critical factors and often falter due to the interference of redundant information in long-series multivariate data. This results in an imbalance in the allocation of weights and ultimately limits prediction accuracy [43,44]. To address this challenge, Lin et al. [45] employed the Long-term and Short-term time series network (LSTNet) model to achieve high-precision predictions of forest fires (ACC 0.941), thereby validating the utility of spatial prediction for forest fire susceptibility using time-series data. Furthermore, Pengle Cheng et al. [46] developed the SimAM modulated Full Attention Network to address data imbalance issues, thereby significantly enhancing the accuracy of wildfire risk predictions. Based on the research of scholars, this study incorporates the ALSTM network into forest fire prediction, optimizes temporal dependency modeling through a gating mechanism, and dynamically concentrates on the temporal segments rich in fire information using attention weights. This approach significantly optimizes the recognition of the contributions of key factors and improves the reliability of predictions.
The opacity of deep learning models, often referred to as “black box” systems, poses challenges in the use of machine learning for predicting forest fires. These models typically allow only for an analysis of the global relative importance of each influencing factor, without enabling a deeper exploration of the interactions among them. The SHAP value, a game theory-based model interpretation technique [22,47], offers a robust solution to this issue. Abdollahi et al. [48] have demonstrated that this technique can effectively identify key factors and elucidate the decision-making logic in wildfire prediction. Building on previous research, this study employs SHAP value analysis to identify the key factors affecting the occurrence of forest fire disasters and elucidates the decision-making mechanism of the model. Consequently, it equips fire risk prevention and control practitioners with a deeper understanding of fire mechanisms and fosters the transition of forest fire prediction from a data-driven to a mechanism-driven paradigm.

2.3. Three-Dimensional Fire Modeling

With the iterative evolution of computer technology, fire simulation has emerged as a fundamental tool within the field of fire prevention and control, primarily through the application of three-dimensional fire modeling and simulation [49]. The advent of the digital twin technology paradigm has introduced innovative ideas and methodologies into the realm of fire simulation [50]. Zhong et al. [51] introduced a digital twin fire model based on JULES-INFERNO, significantly enhancing the efficiency of online prediction within the digital twin system. Furthermore, Dourvas et al. [52] devised a digital twin platform for monitoring environmental parameters such as temperature and humidity inside buildings, by integrating metacellular automata with digital twin technology, thereby achieving dynamic predictions and simulations of fire spread within structures.
In the realm of forest fire prediction, existing three-dimensional model simulations primarily utilize rule-driven spatial lattice point evolution methods, such as cellular automata [29]. Although these methods possess certain simulation capabilities, they generally lack the integration of physical mechanisms essential for dynamically quantifying the impacts of critical factors such as temperature, wind speed, and fuel availability. Simultaneously, these systems are hindered by the presence of data silos, which limit their capacity to effectively support dynamic fire warning requirements. Additionally, some simulation studies are grounded in fire spread formula (e.g., the US FARSITE 3D model [53]) and are evolving towards multi-physics coupled models (e.g., the WRF-FIRE model [54]) as well as AI-driven immersive wildfire simulations [55]. However, these approaches encounter a trade-off between computational efficiency and realism, frequently facing challenges in balancing the dual imperatives of speed and accuracy essential for wildfire prevention and control.
Digital twin technology [56,57,58], characterized by its symbiosis with reality, data-driven, user-friendly interaction and dynamic updating features [59] has been effectively employed to accurately represent physical processes across various fields including industrial production [60], urban management [61,62], healthcare [63,64,65], aerospace [66,67], ecosystem management [68,69], and so on. To this end, this study introduces the first digital twin-driven forest fire validation paradigm. It integrates a physics engine to dynamically quantify the effects of key factors, deeply coupling the twin model with the predictive model, by leveraging dynamic data to balance simulation efficiency and realism, thereby confirming the feasibility and rationality of design solutions within digital and virtualized environments. This approach offers a significant advancement in forest fire prediction research. The interactive relationships between forest digital twins are detailed in Figure S1.

3. Overview

This study aims to investigate the theory concerning the role of forest influencing factors and enhance the accuracy of forest fire prediction. It achieves this by decoupling and reducing the dimensionality of environmental multidimensional variables through PCA, extracting the principal influencing factors, eliminating redundant information, and conducting forest fire predictions using the ALSTM network. This method not only reduces the time-dependence of the data but also improves prediction accuracy by creating a spatio-temporal double-decoupling effect with PCA. Subsequently, SHAP values are employed to elucidate the contributions of each feature to the model output, thereby clarifying the importance of each influencing factor in model decision-making and fire-driven effects through multiple SHAP plots. Lastly, the accuracy of the ALSTM outputs and the impact of each influencing factor on fire evolution are dynamically verified using the digital twin technique. The overall structure of this study is illustrated in Figure 1.

4. Materials and Methods

4.1. Data Preparation

The foundation of this study is forest fire data, which encompasses variations across multiple data dimensions. The study utilized the publicly available Algerian fire dataset [12] (hereinafter referred to as the “original dataset”). In the processed version of this dataset, columns 1 through 10 contain data on factors affecting fire impact, column 11 identifies the area, and column 12 describes the burning situation. This dataset includes critical meteorological factors that affect the occurrence of wildfires, such as temperature, RH, wind speed, and rainfall. Additionally, it incorporates six principal sub-indices derived from the Canadian Fire Weather Index (FWI) system, with specific details as follows:
The Canadian Fire Weather Index (FWI) system [70,71] is among the most extensively utilized global indices for assessing fire risk. This system integrates daily meteorological measurements—temperature, RH, wind speed, and precipitation—considering the effects of fuel types, moisture content, and wind conditions on fire dynamics. The FWI system comprises six core sub-indices: three basic sub-indices representing combustible moisture, namely FFMC, DMC, and DC; two intermediate sub-indices, which gauge the rate of spread and depletion of combustibles, including ISI and BUI; and one final index that quantifies fire intensity, designated as FWI.
For the development of the digital twin model, multidimensional data were collected, including historical fire occurrences, topographic vegetation, and meteorological conditions from a specific forest section (the real physical entity represented by the twin model) in the Bejaia area. The ASTER Digital Elevation Model V004, sourced from the National Aeronautics and Space Administration (NASA) (Washington, DC, USA), retrieved via the NASA Earthdata site (https://www.earthdata.nasa.gov/, accessed on 16 May 2025), provided essential slope, orientation, and elevation parameters for the model. Additionally, land cover maps from the CCI-LC team, which detail plant functional types at a spatial resolution of 300 m (https://maps.elie.ucl.ac.be/CCI/viewer/index.php, accessed on 13 February 2025), supported the vegetation modeling for the twin. Furthermore, satellite imagery from the Bigemap software (Bigemap Pro, Version1.6.8; http://www.bigemap.com/, accessed on 5 April 2025) supplied environmental context for the model’s development.

4.2. Multi-Factor Decoupling Analysis

4.2.1. Principal Component Analysis

PCA is utilized to assess the principal components accounting for the majority of the variance in the influencing factors during forest fire combustion. This technique serves to reduce the dimensionality of the data [16,72], extract critical latent elements, and clarify complex information. It assists in identifying salient features within the data and provides foundational support for subsequent modeling and analysis. PCA reconfigures the relevant predictor variables into a reduced set of uncorrelated PCs, expressed as follows [73]:
X = TPT ,
where X is the normalized matrix of predictor variables; T represents the matrix of scores (PCs); P denotes the matrix of loadings.
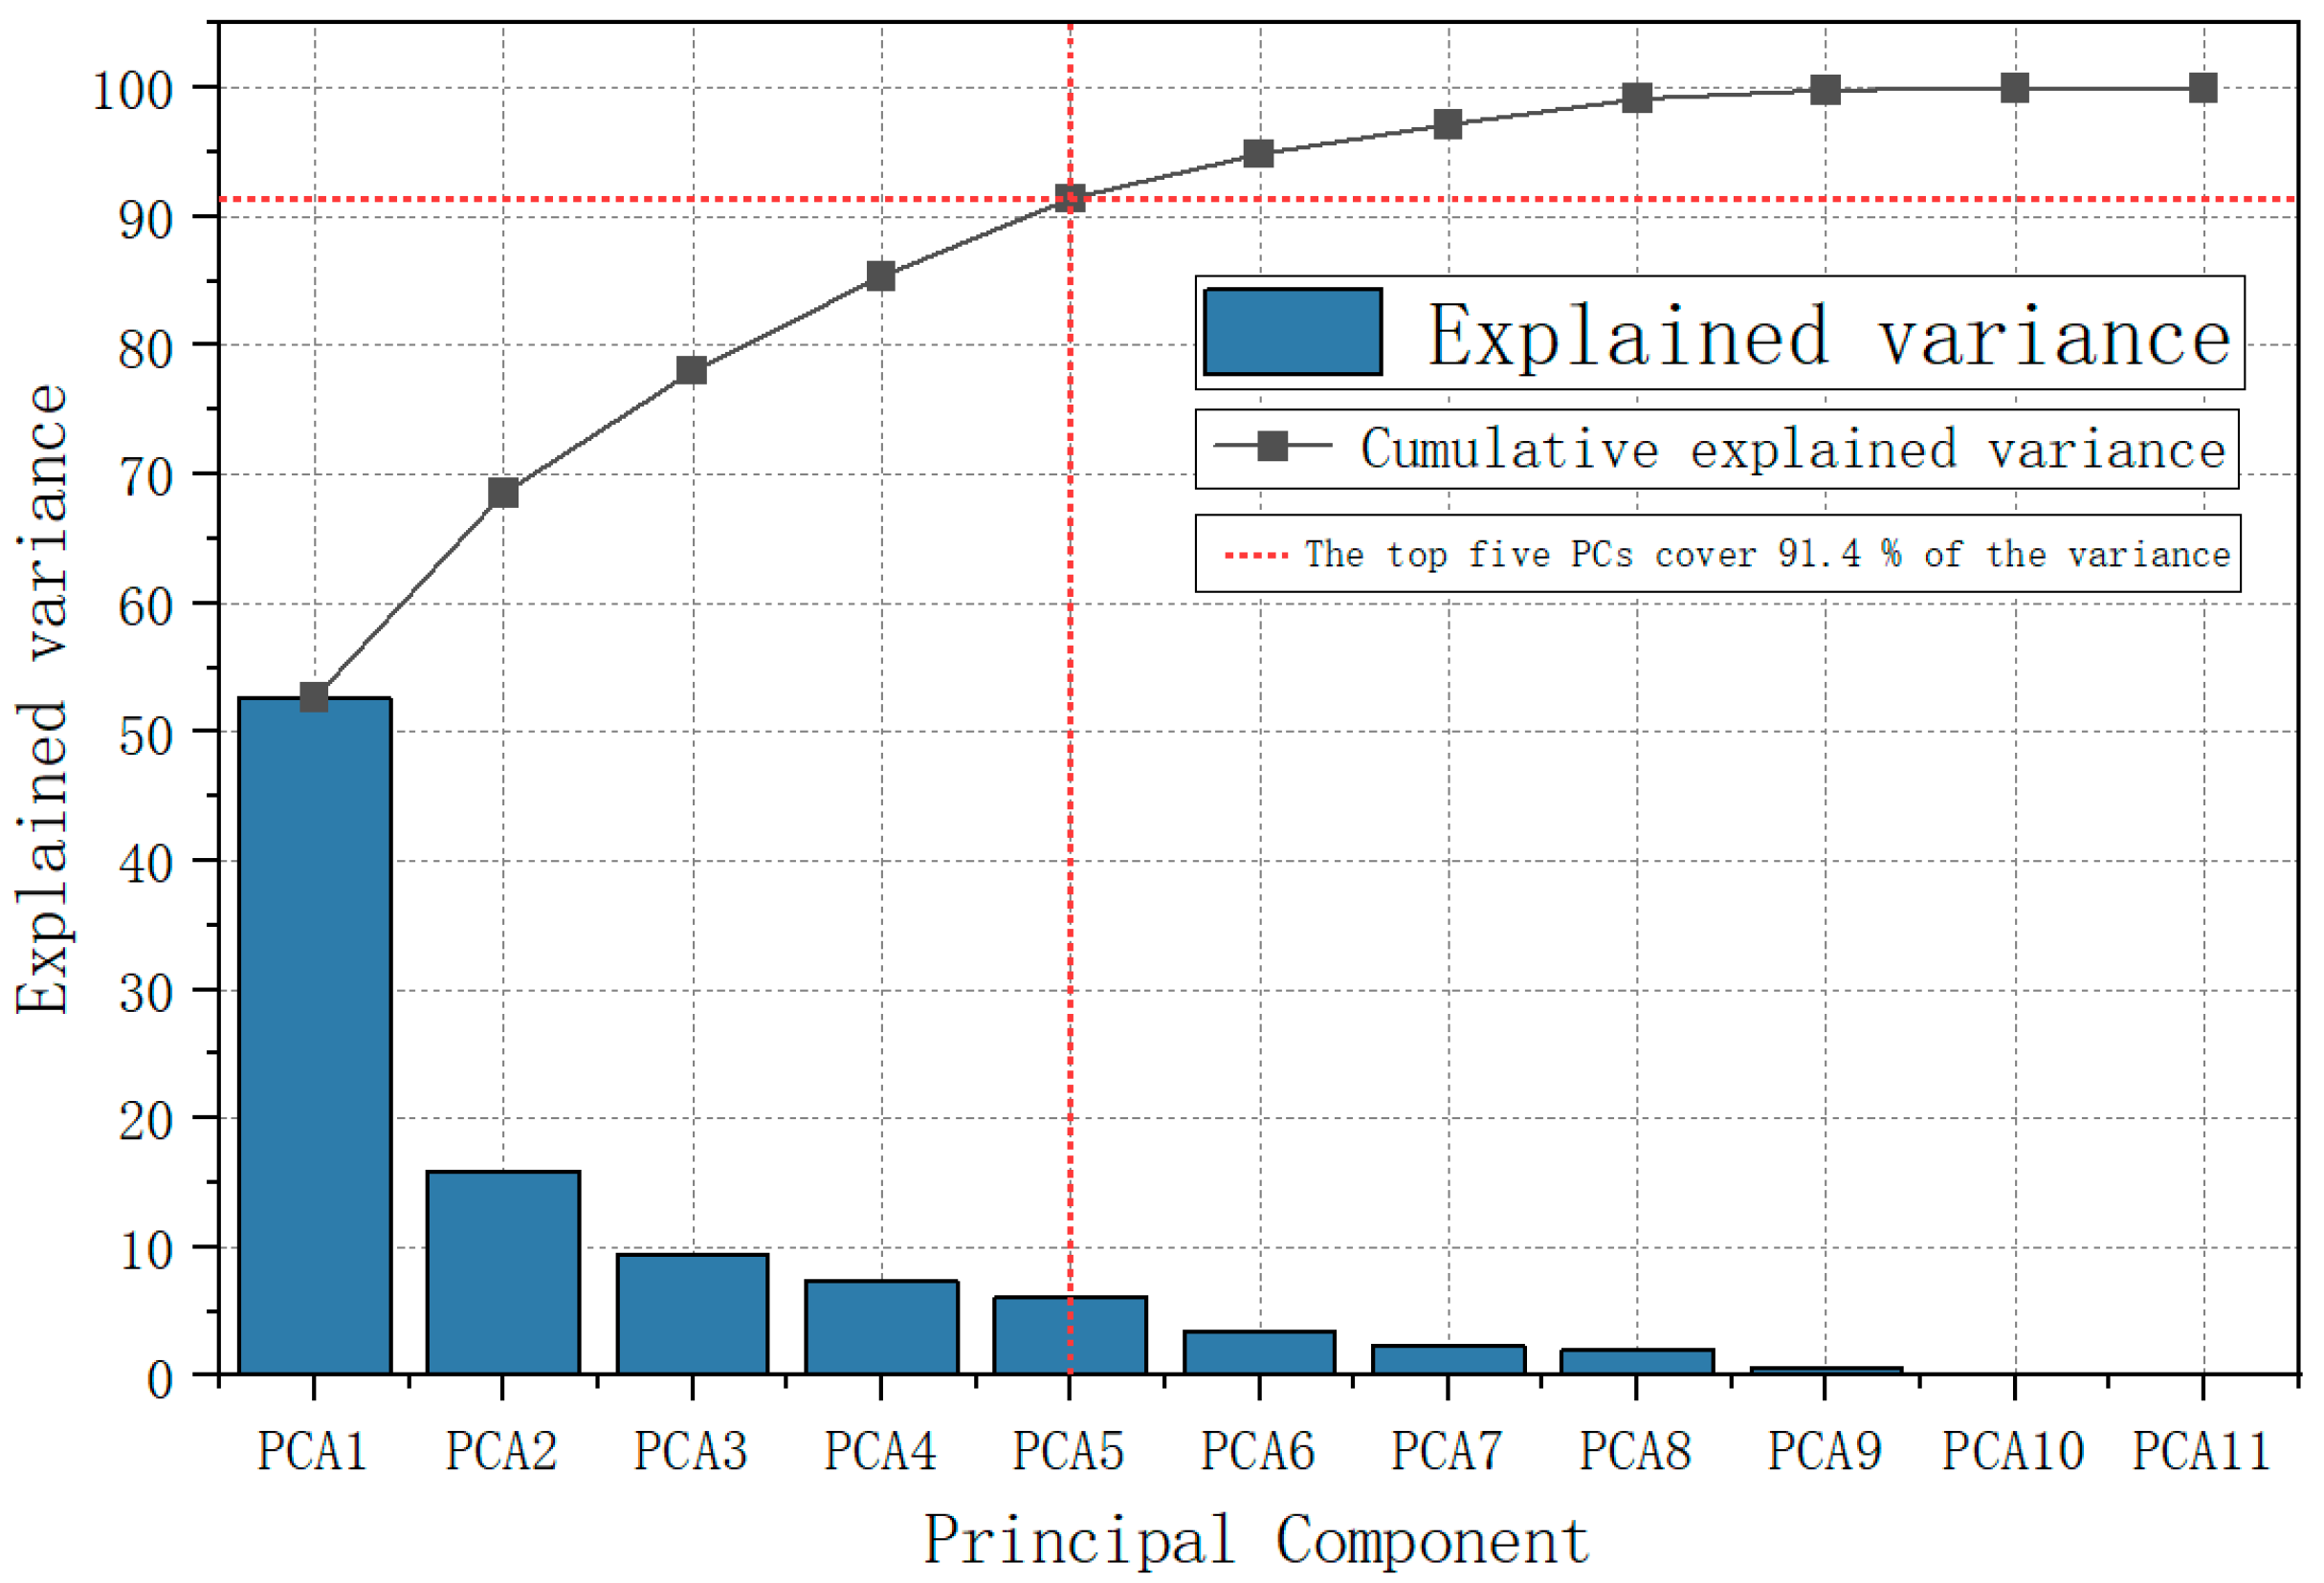
PCA effectively decreases the number of variables within the dataset while preserving essential information, such as dominant trends. The determination of the number of PCs in this study was based on cumulative variance contribution rates [72]. In practical applications, an empirical threshold of 80%–90% is commonly employed for PC selection. Given the stringent requirements for data integrity and reliability in subsequent modeling and parameter optimization stages, a cumulative variance contribution threshold of 90% was prioritized to ensure the retention of critical information and to enhance computational accuracy. Following the PCA, the cumulative variance contribution of the first five PCs reached 91.40%, indicating that these components collectively accounted for over 90% of the variance present in the original dataset. Consequently, the first five principal components (PCs) were utilized as a secondary dataset (herein referred to as the “PCA dataset”). These PCs constituted a compressed yet representative dataset.

4.2.2. Interpretability Analyses

In the domain of Interpretable Artificial Intelligence, SHAP values are widely recognized as a fundamental tool for quantifying the importance of features [74]. For any specific sample, the SHAP value for feature parameter I can be determined using Equation (2) [75]:
ϕ i f , x = z x z ! M z 1 ! M ! f x z f x z \ i ,
where ϕ i denotes the Shapley value of feature i ; f represents the black-box model; x denotes the sample feature set; z indicates the subset of features preceding feature i in the set; x denotes the complete set of features; z ! calculates the permutations of the subset i ; M z 1 ! calculates the permutations of the subset of features following feature i ; M ! represents the permutations of all features; f x z f x z \ i measures the difference between the model’s predicted values with and without the inclusion of feature i , thereby quantifying the impact of feature i on the model’s predicted outcome.
This study utilizes SHAP values to quantify the contribution of features to fire prediction outcomes, employing the following specific configuration: TreeExplainer (integrated in the SHAP library, developed by the University of Washington, Seattle, WA, USA) is used to compute Shapley values by precisely parsing the decision paths of tree models, thereby accommodating the LightGBM (developed by Microsoft Corporation, Redmond, WA, USA) tree ensemble architecture. The background samples consist of the entire training dataset to represent the temporal distribution of features, including fire indices such as FFMC and DMC. The tree_path_dependent feature perturbation method is applied to capture feature dependencies. Input features are standardized using Z-score normalization, resulting in output values that represent the contribution to the original regression estimates. Bar plots of feature variables highlighted key determinants of forest fire risk, with features exhibiting higher SHAP values being ranked as more influential, thereby indicating a stronger impact on model predictions. Dependency plots of feature variables examined the relationships between features and predictions, offering insights into the relevance of specific features in forecasting outcomes. This methodology enhances the transparency of the model and supports efforts in forest fire prevention and management.
The Input data for the predictive model In this study consist specifically of feature data derived through PCA decoupling. The original dataset includes key fire-influencing factors such as FFMC, DMC, temperature, humidity, wind speed, and precipitation. Through PCA decoupling, the information contained in these variables is transformed into mutually independent PCs. These decoupled PCA components ultimately serve as the inputs to the model. This approach not only reduces feature dimensionality and eliminates redundancy but also maintains a direct correspondence between the model inputs and established fire hazard indices such as FFMC and DMC. As a result, the subsequent interpretation of feature contributions using SHAP values can be directly related to existing domain knowledge concerning critical fire-influencing factors, thereby enhancing the domain-specific interpretability of the model.

4.3. Forest Fire Prediction Model

4.3.1. Model Architecture Design

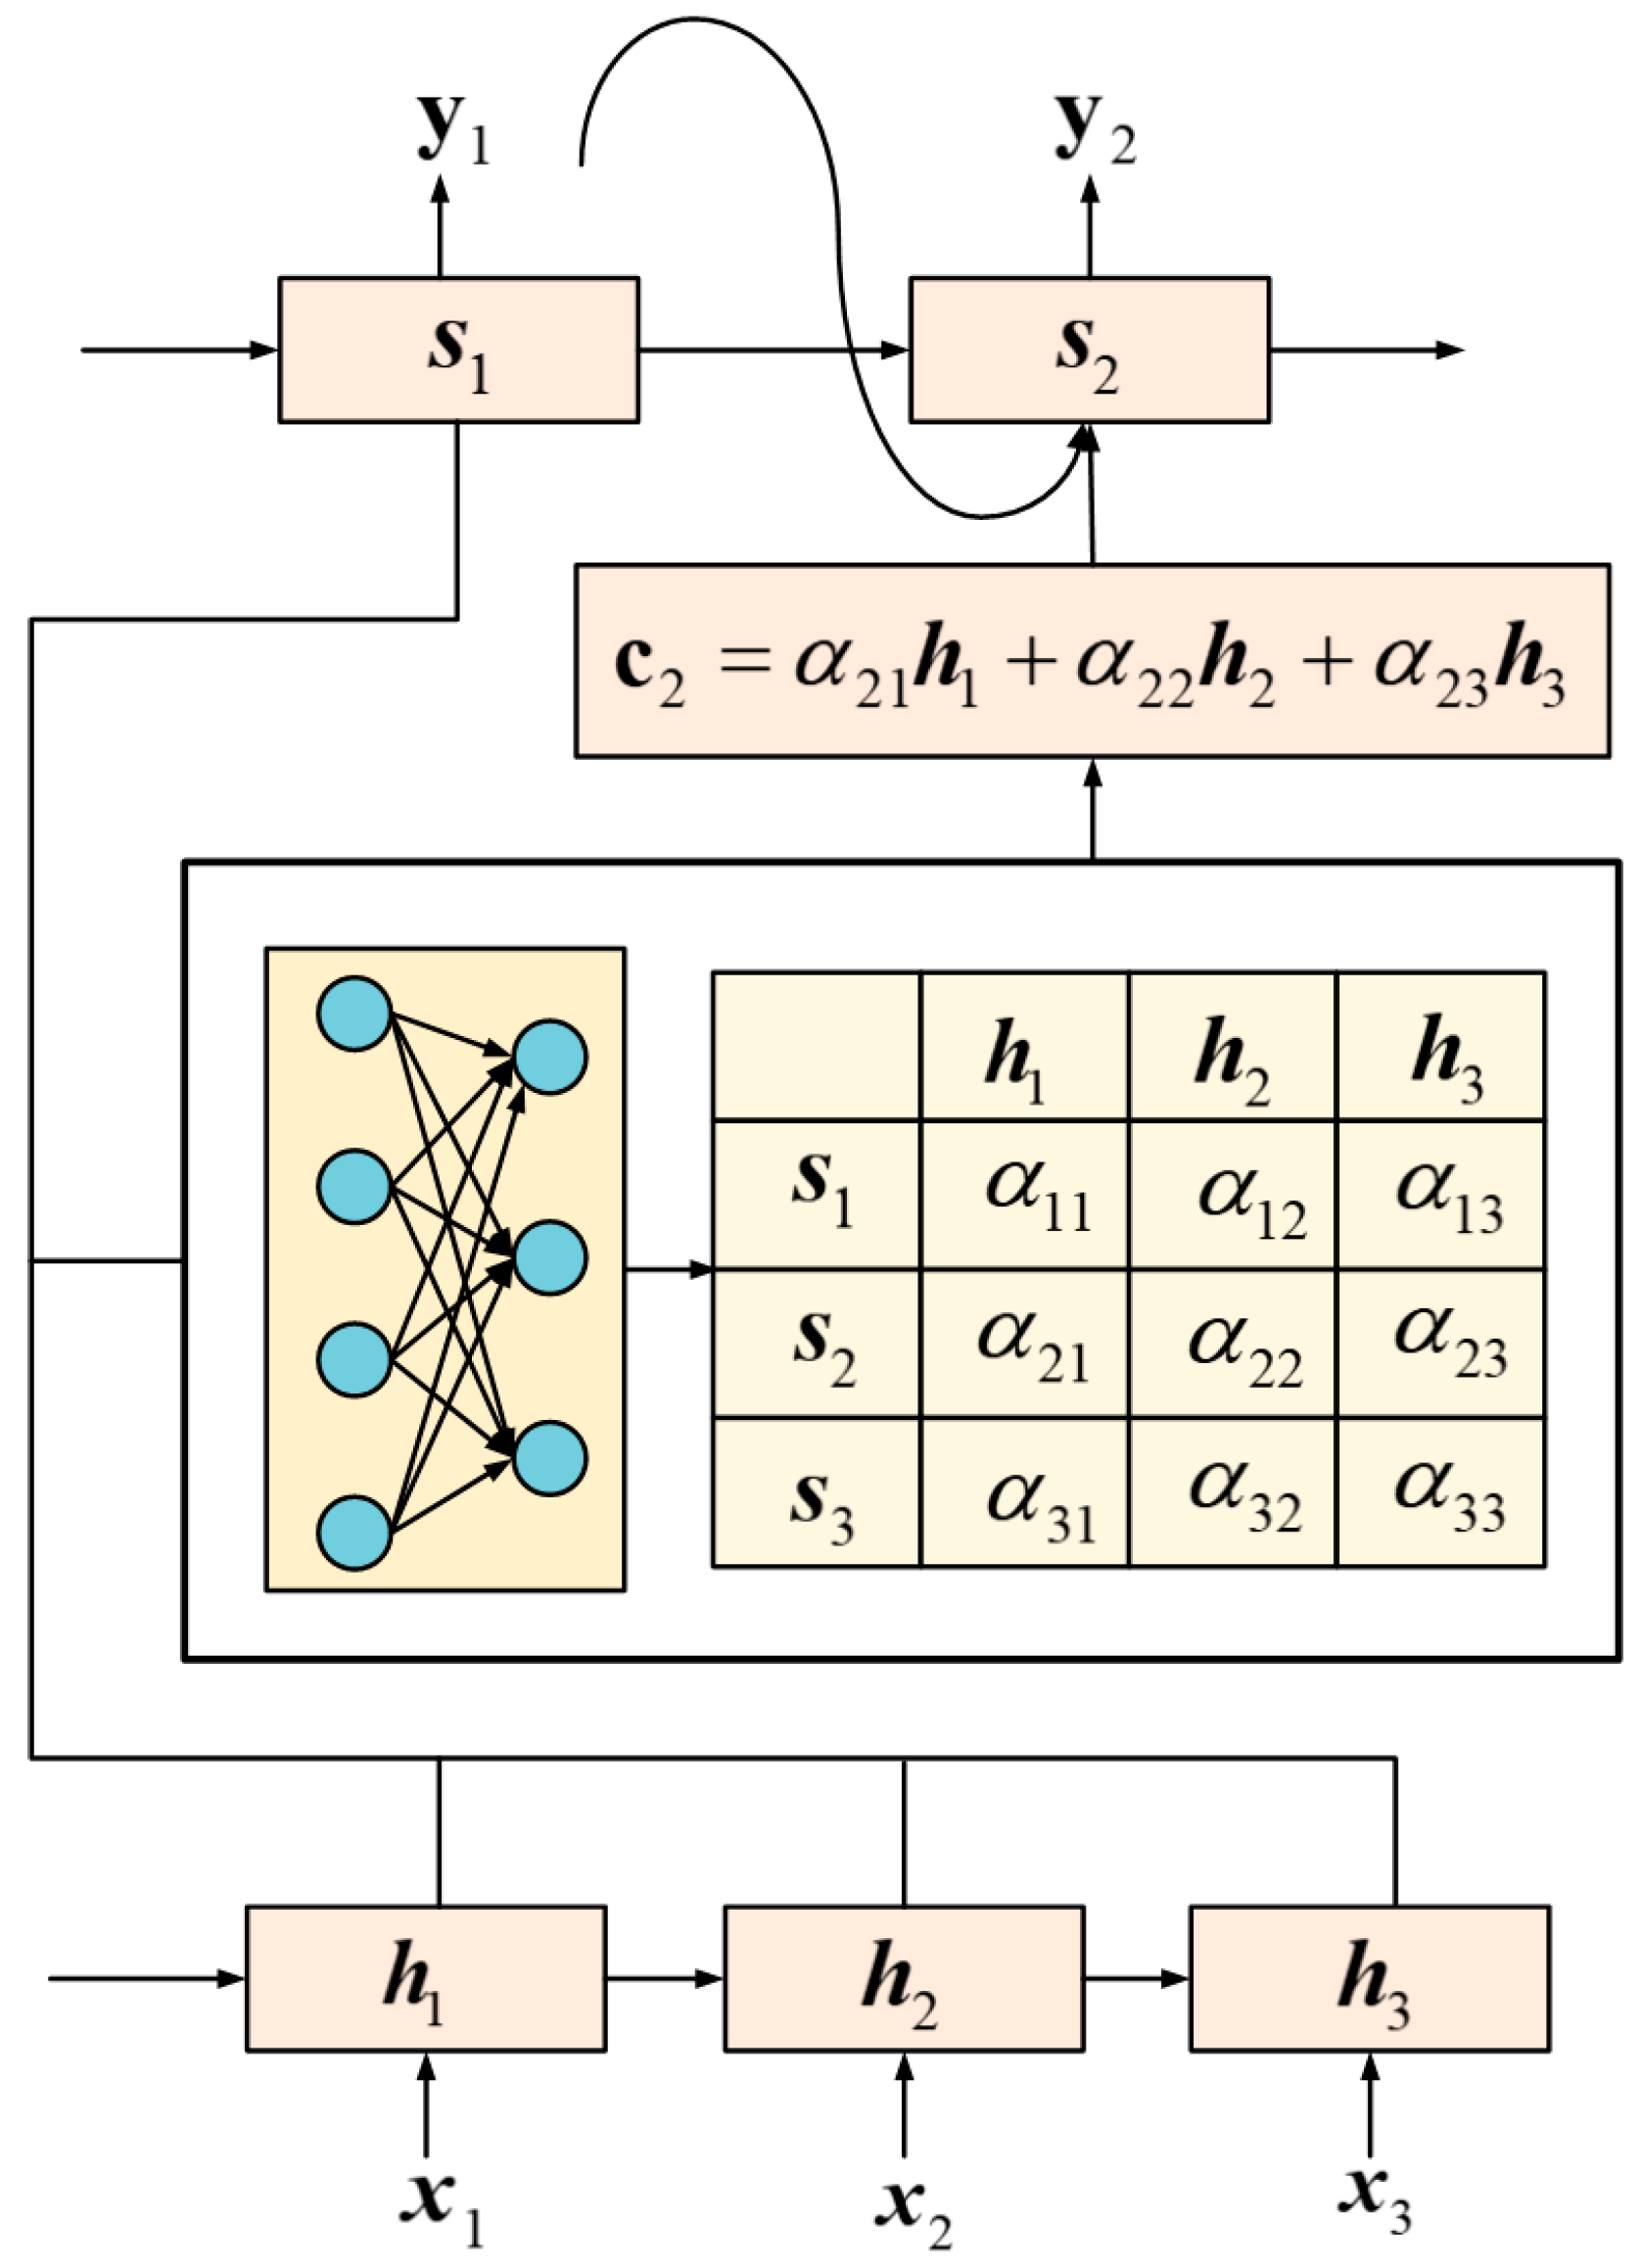
The process of forest fire propagation is characterized by nonlinear temporal coupling among various factors, such as the lagged effect of temperature changes on humidity levels. To address this complexity, this research employs an LSTM network enhanced by an attention mechanism (herein referred to as the ALSTM model). The attention mechanism refines the LSTM’s capability by enabling selective concentration on segments of the input time-series data that are more informative regarding fire dynamics [76]. This inclusion effectively identifies and amplifies time-series features critical to fire information, while diminishing the impact of irrelevant or redundant information. The mechanism significantly reduces issues related to vanishing or exploding gradients, lengthy computation times, and improper weight allocation due to extensive sequence inputs, thereby enabling the model to more accurately represent the complex logical structure and dynamic correlations within the fire data, thus enhancing prediction performance. The corresponding encoder–decoder architecture with the attention mechanism is depicted in Figure 2.
The attention module within this architecture autonomously learns attention weights, α i j , and captures h i and s j (where h i , termed as the candidate state, represents the hidden state of the encoder, and s j , termed as the query state, represents the hidden state of the decoder, with a discernible correlation between them). Subsequently, the attention mechanism constructs the content vector c , assigning more precise attention weights. These weights facilitate a more logical transition between s j during decoding and h i during encoding. The content vector c j represents the weighted sum of all hidden states of the encoder, multiplied by their respective attention weights, as shown in Equation (3) [77,78]:
c j = i = 1 T α i j h i .
The function of the attention mechanism parallels a feed-forward neural network, yet with a distinctive learning of special attention weights α i j , which are essential in constructing the conversion function between h i and s j 1 during the learning process. The ALSTM network developed in this study incorporates a potential gating mechanism, detailed in Table 2.
The proposed approach was optimized specifically for the prediction of forest fires through a time-series model:
(1)
Core time-series feature extraction: This study employs an LSTM layer to capture the long-term dependencies within the sequence data. The layer’s gating mechanisms—comprising a forget gate, an input gate, and an output gate—effectively model the temporal dynamics associated with fire-related factors.
(2)
Attention fusion: A Multiply layer is introduced to achieve a weighted fusion between attention weights and LSTM hidden states, thereby emphasizing key factors driving forest fires.
(3)
Efficiency and generalization: To reduce the dimensionality and, consequently, the number of parameters and computational overhead, this study utilizes a GlobalAveragePooling1D layer. Additionally, a Dropout layer with a 0.3 inactivation rate is incorporated to effectively mitigate the risk of overfitting, thus enhancing the model’s ability to generalize across diverse and variable forest environments.
(4)
Probabilistic output: The model concludes with a layer utilizing a Sigmoid activation function, which outputs the probability of a forest fire occurrence within a range of [0, 1].
To develop a predictive model for forest fires, the research used PC data, training the ALSTM over progressively increasing time steps. This model was ultimately utilized to estimate the likelihood of forest fire occurrences.

4.3.2. Key Parameter Optimization Experiments

  • Time Step Optimization
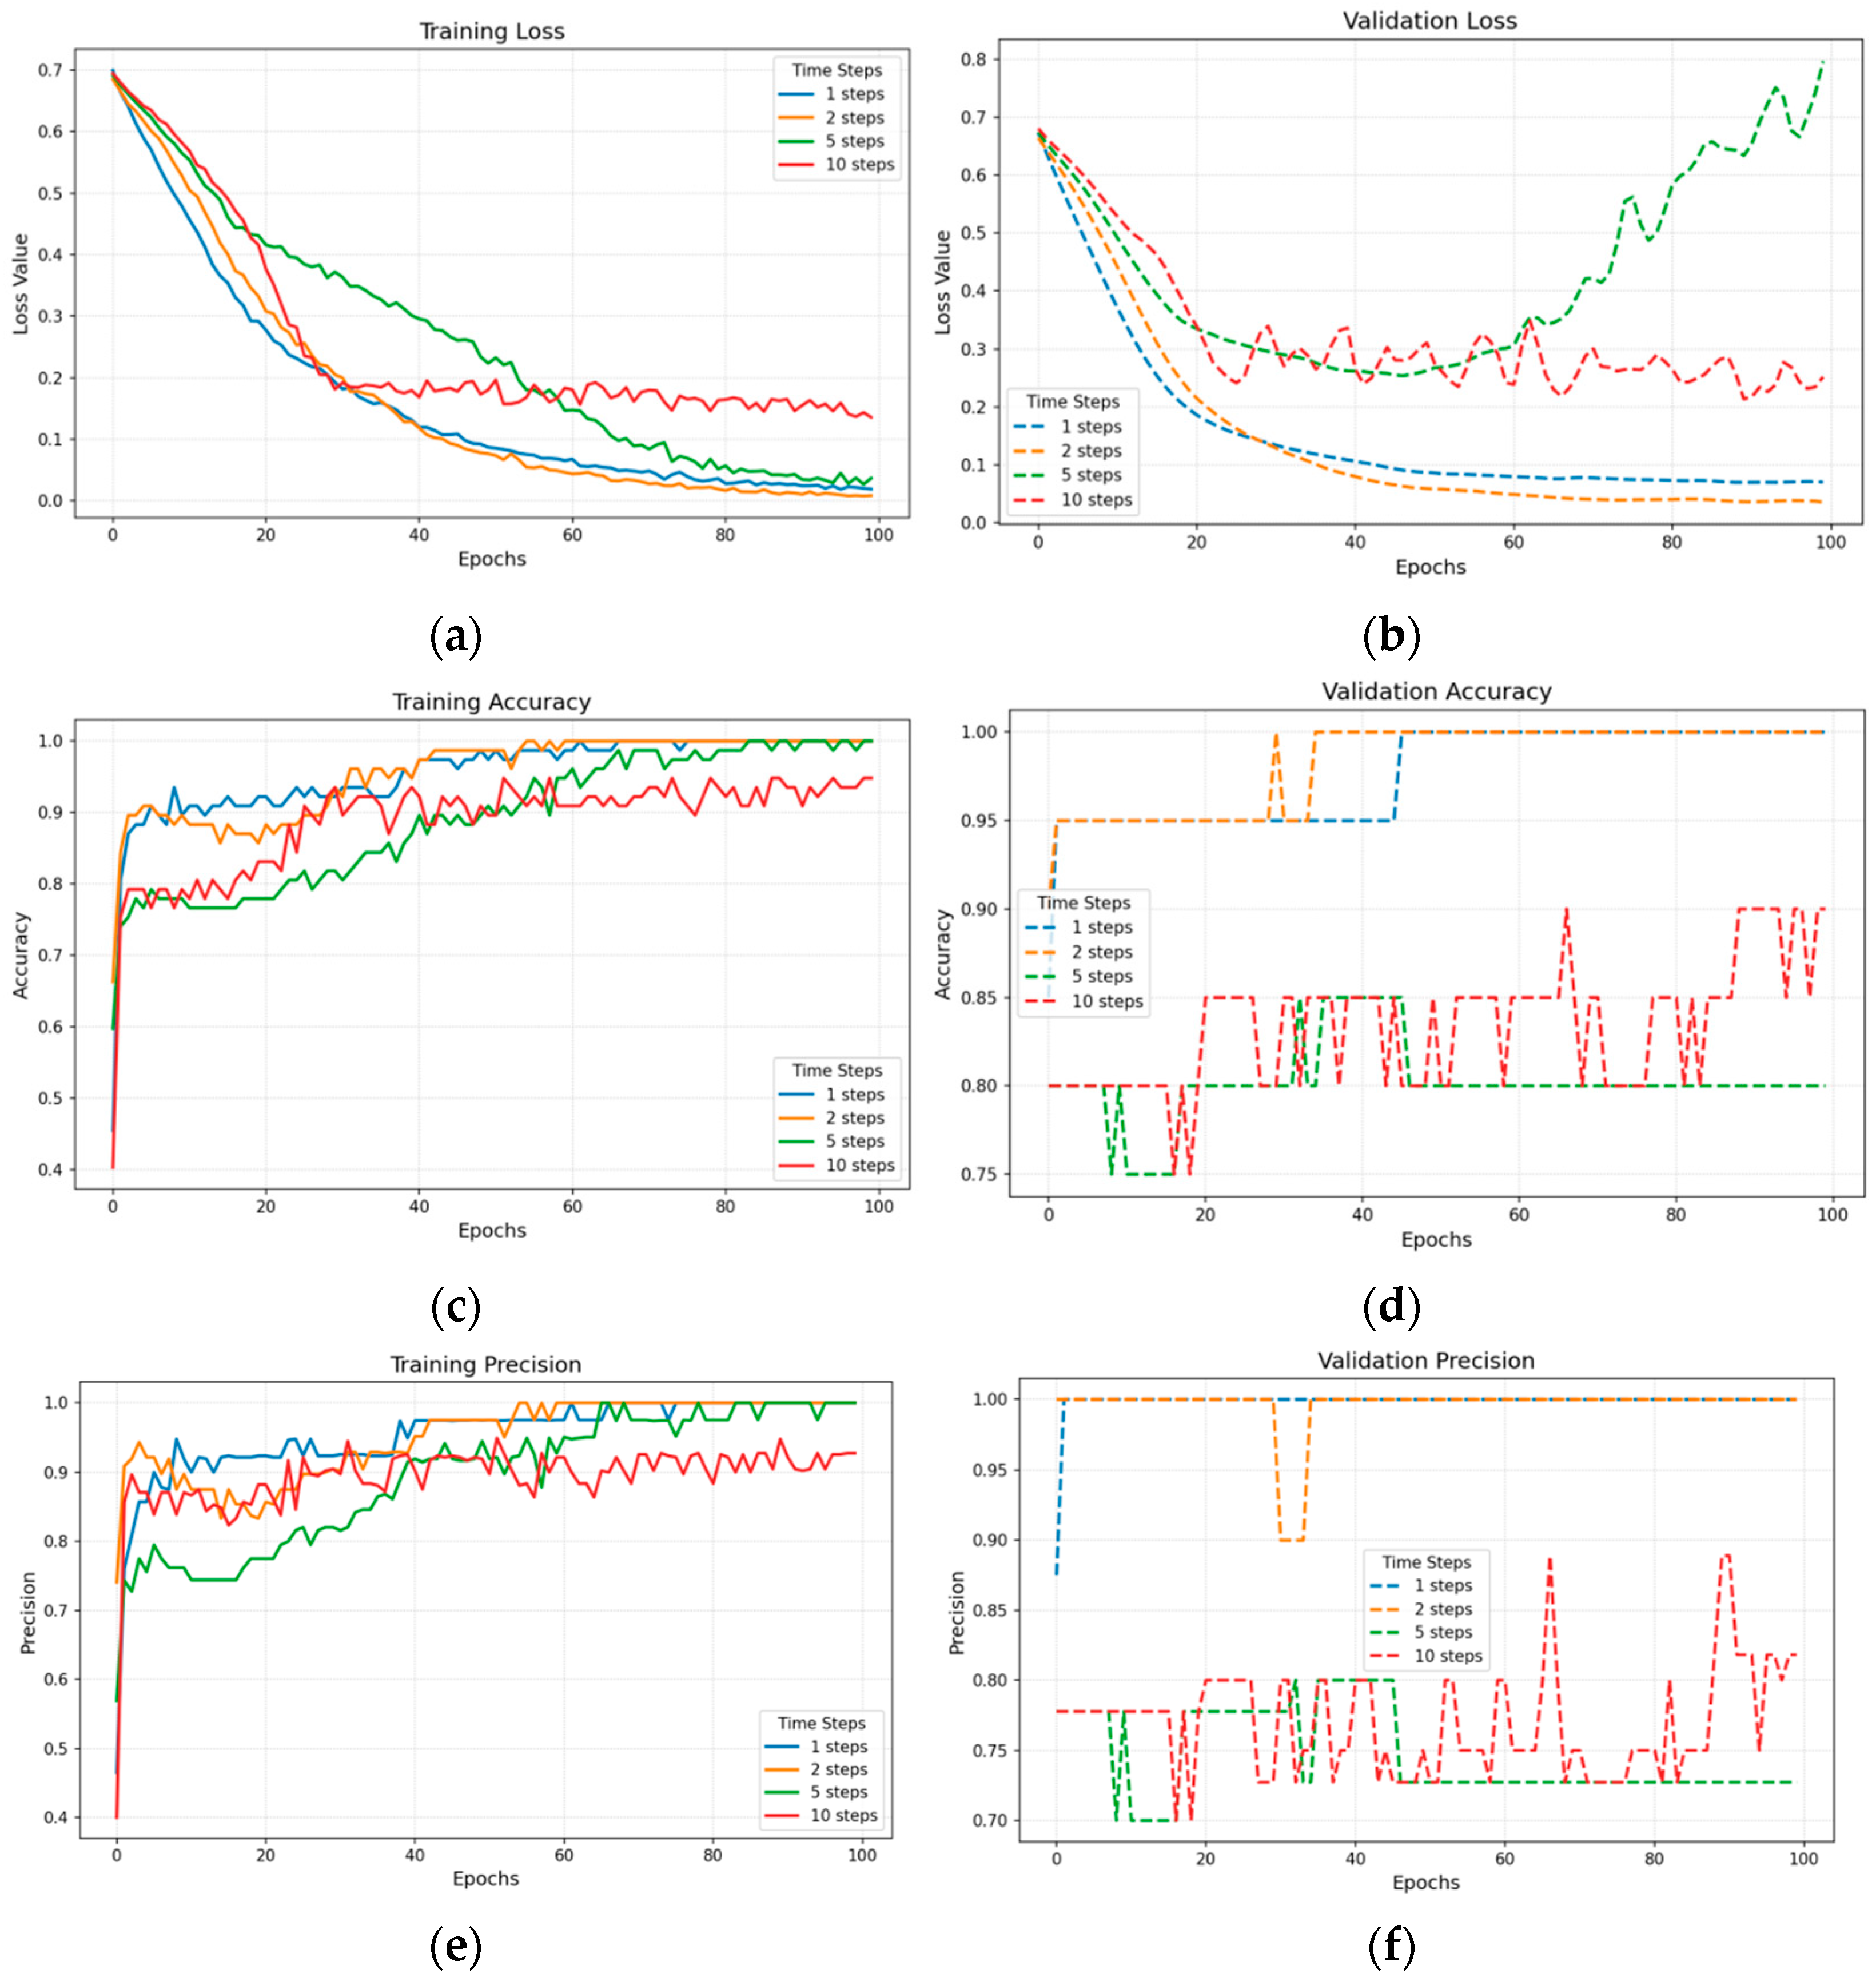
The time step is a crucial parameter that affects the ability of the ALSTM model to capture temporal dependencies. To investigate its impact, this study conducted experiments comparing the performance of various step sizes (1, 2, 5, 10) over 100 iterations (Figure 3).
Experimental comparisons of time step sizes indicate that a step size of 2 yields optimal model performance. The training loss decreases sharply to approximately 0.05, and the validation loss to approximately 0.07, which is substantially superior to the losses observed with other step sizes. Concurrently, both training and validation accuracy and precision increase rapidly to high levels with minimal fluctuation. These results suggest that a stride of 2 provides stable and reliable temporal feature representation for forest fire monitoring. Therefore, a stride of 2 is selected as the optimal time window parameter for the ALSTM model.
2.
Learning Rate Optimization
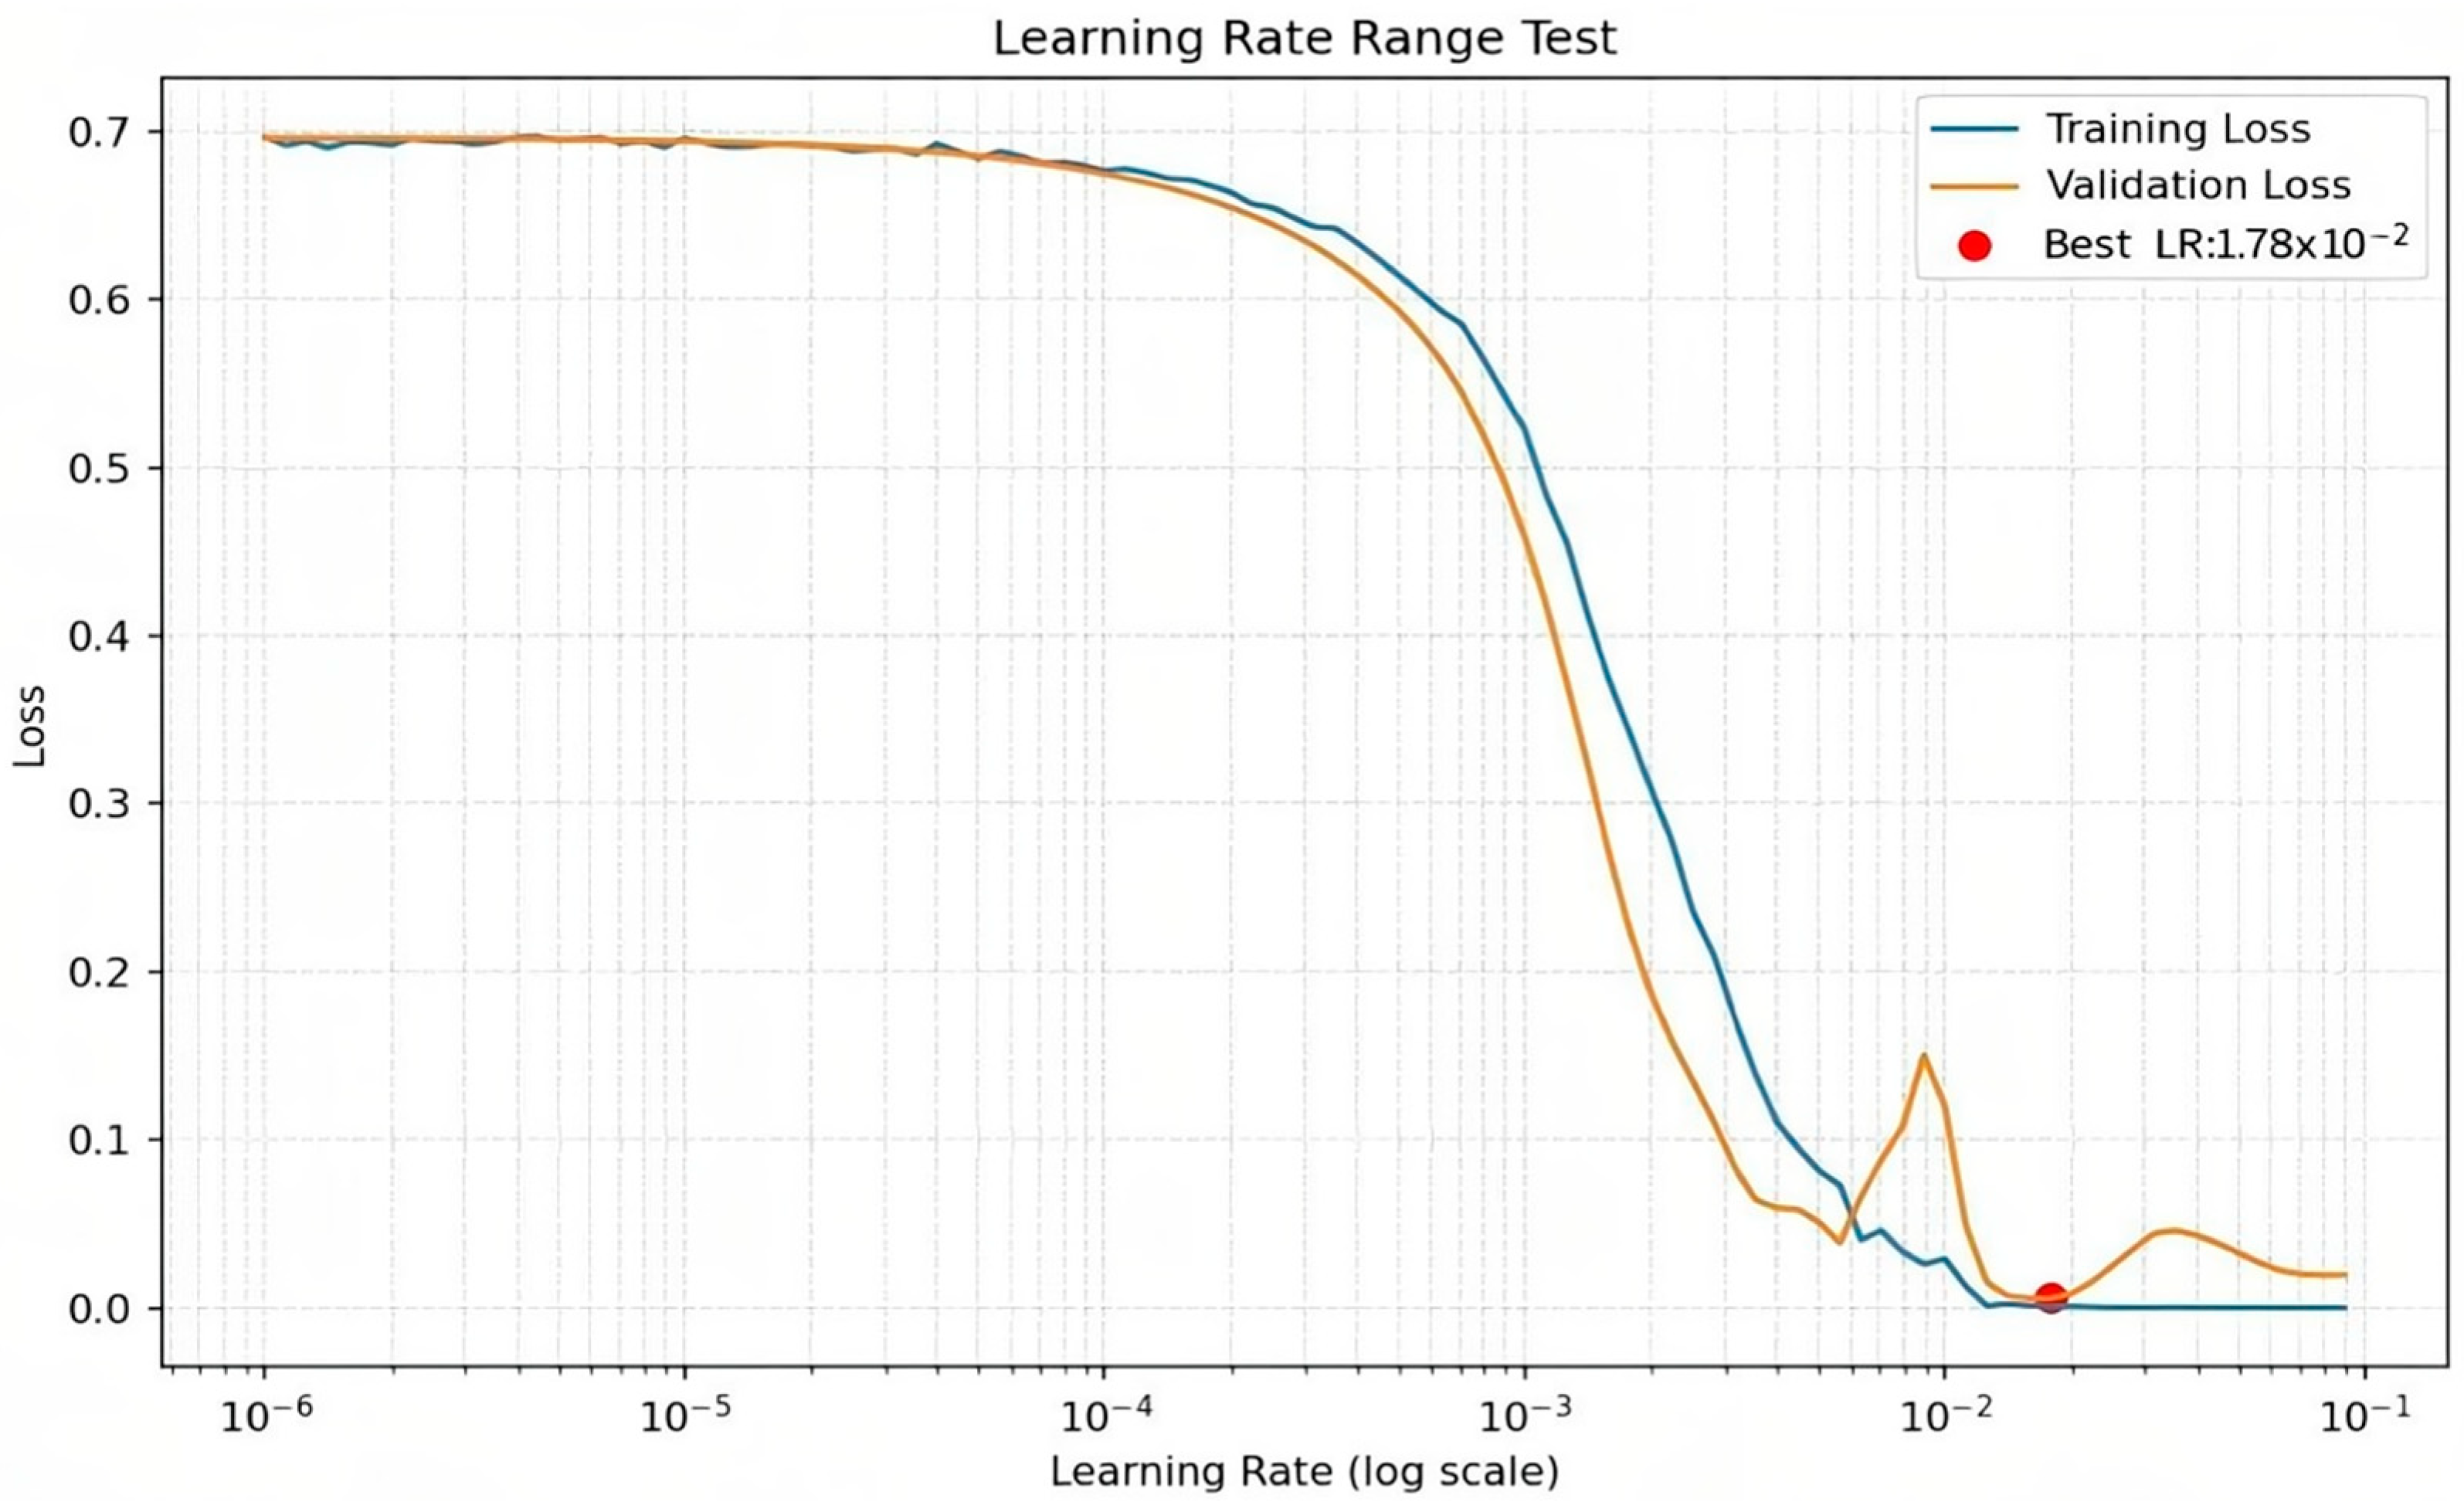
The learning rate is a pivotal parameter that determines the magnitude of updates made to the model parameters, directly affecting the speed of convergence and the overall model performance. To ascertain the optimal learning rate, the paper monitored the training loss across various learning rates while maintaining a fixed step size of 2 (Figure 4).
The analysis revealed that a learning rate of 0.0178 enables the fastest convergence and a smooth loss descent trend, with the lowest and most stable loss values. This indicates that this learning rate optimally balances the acceleration of convergence with stability maintenance. Therefore, this learning rate, 0.0178, has been chosen as the training parameter for the ALSTM model.
3.
Optimizer Selection
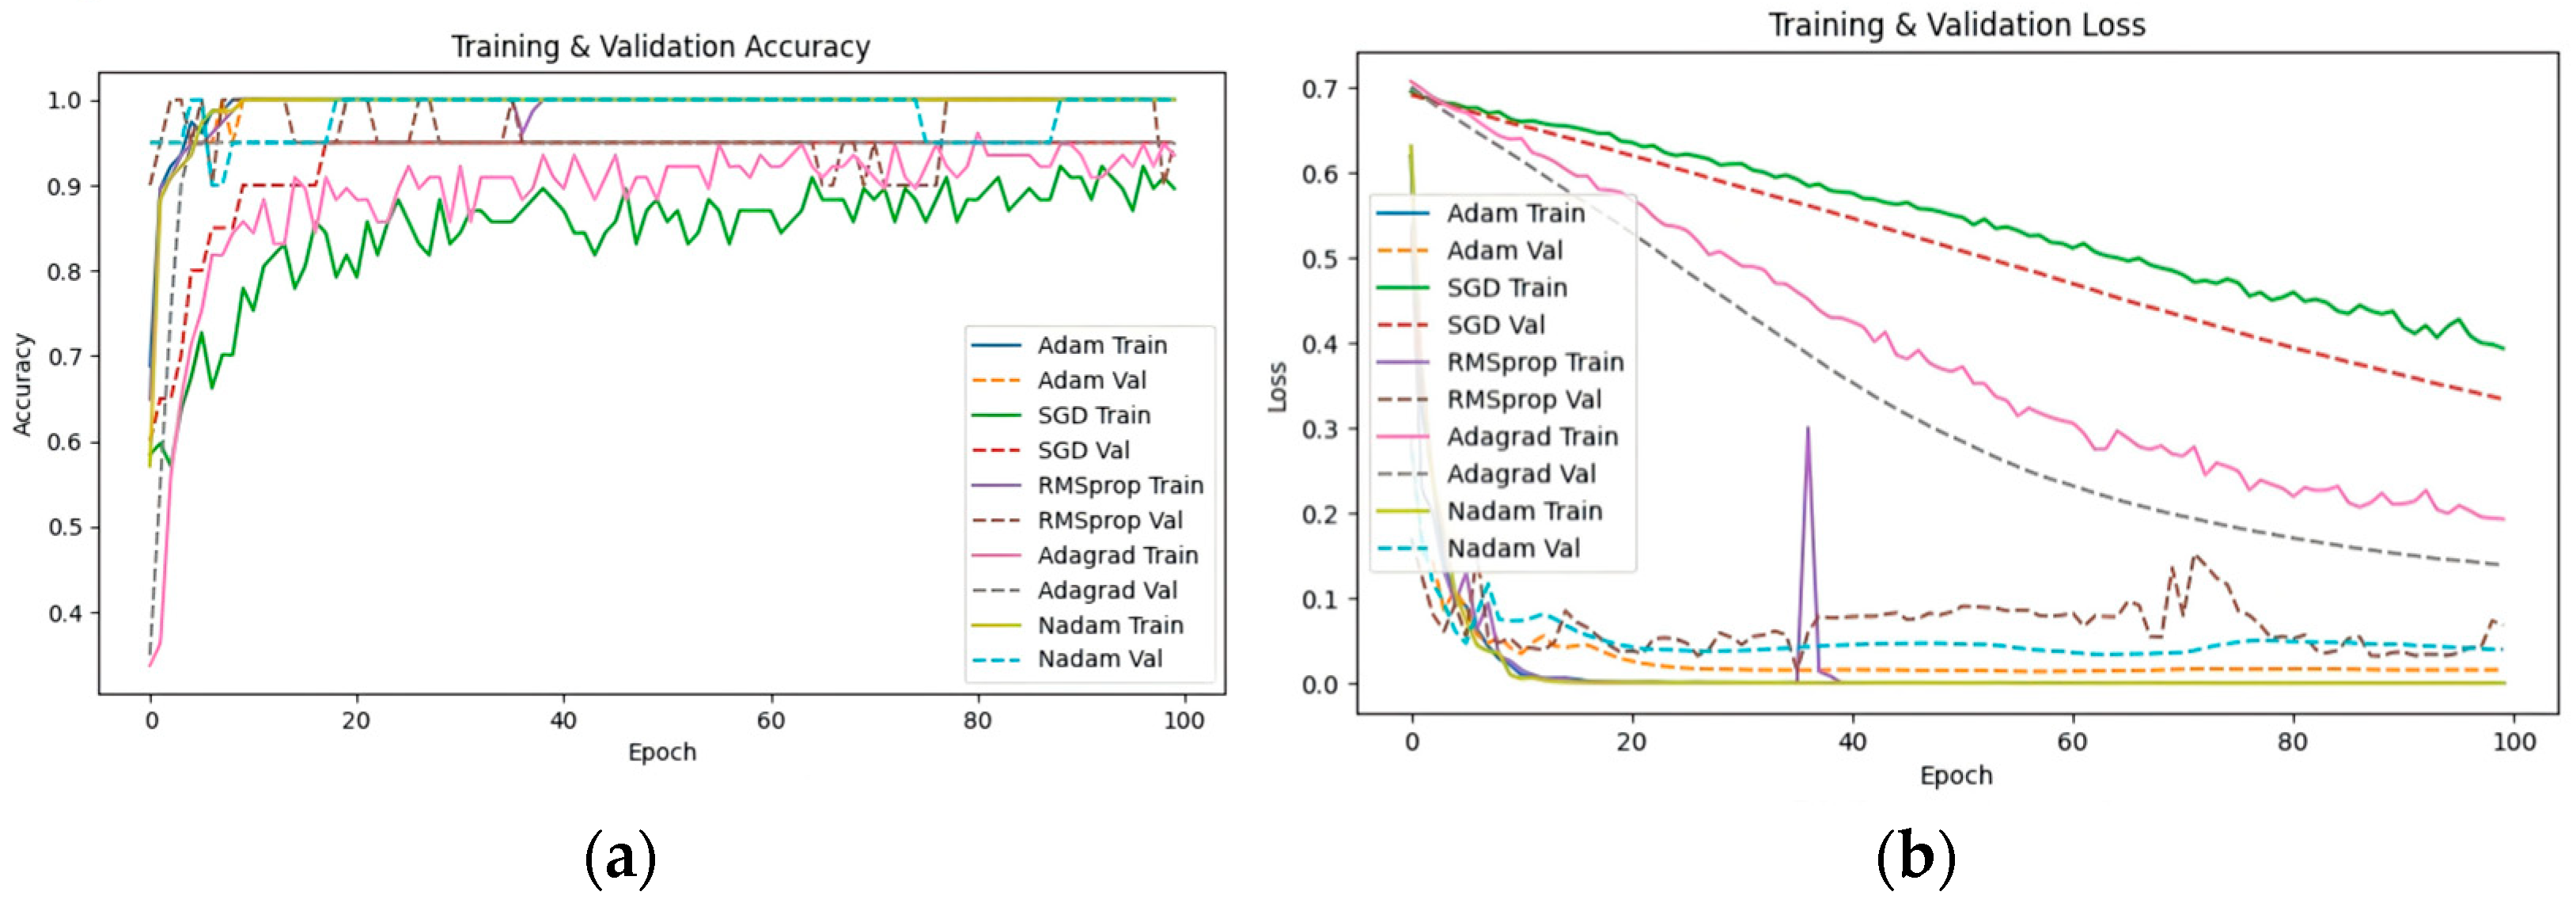
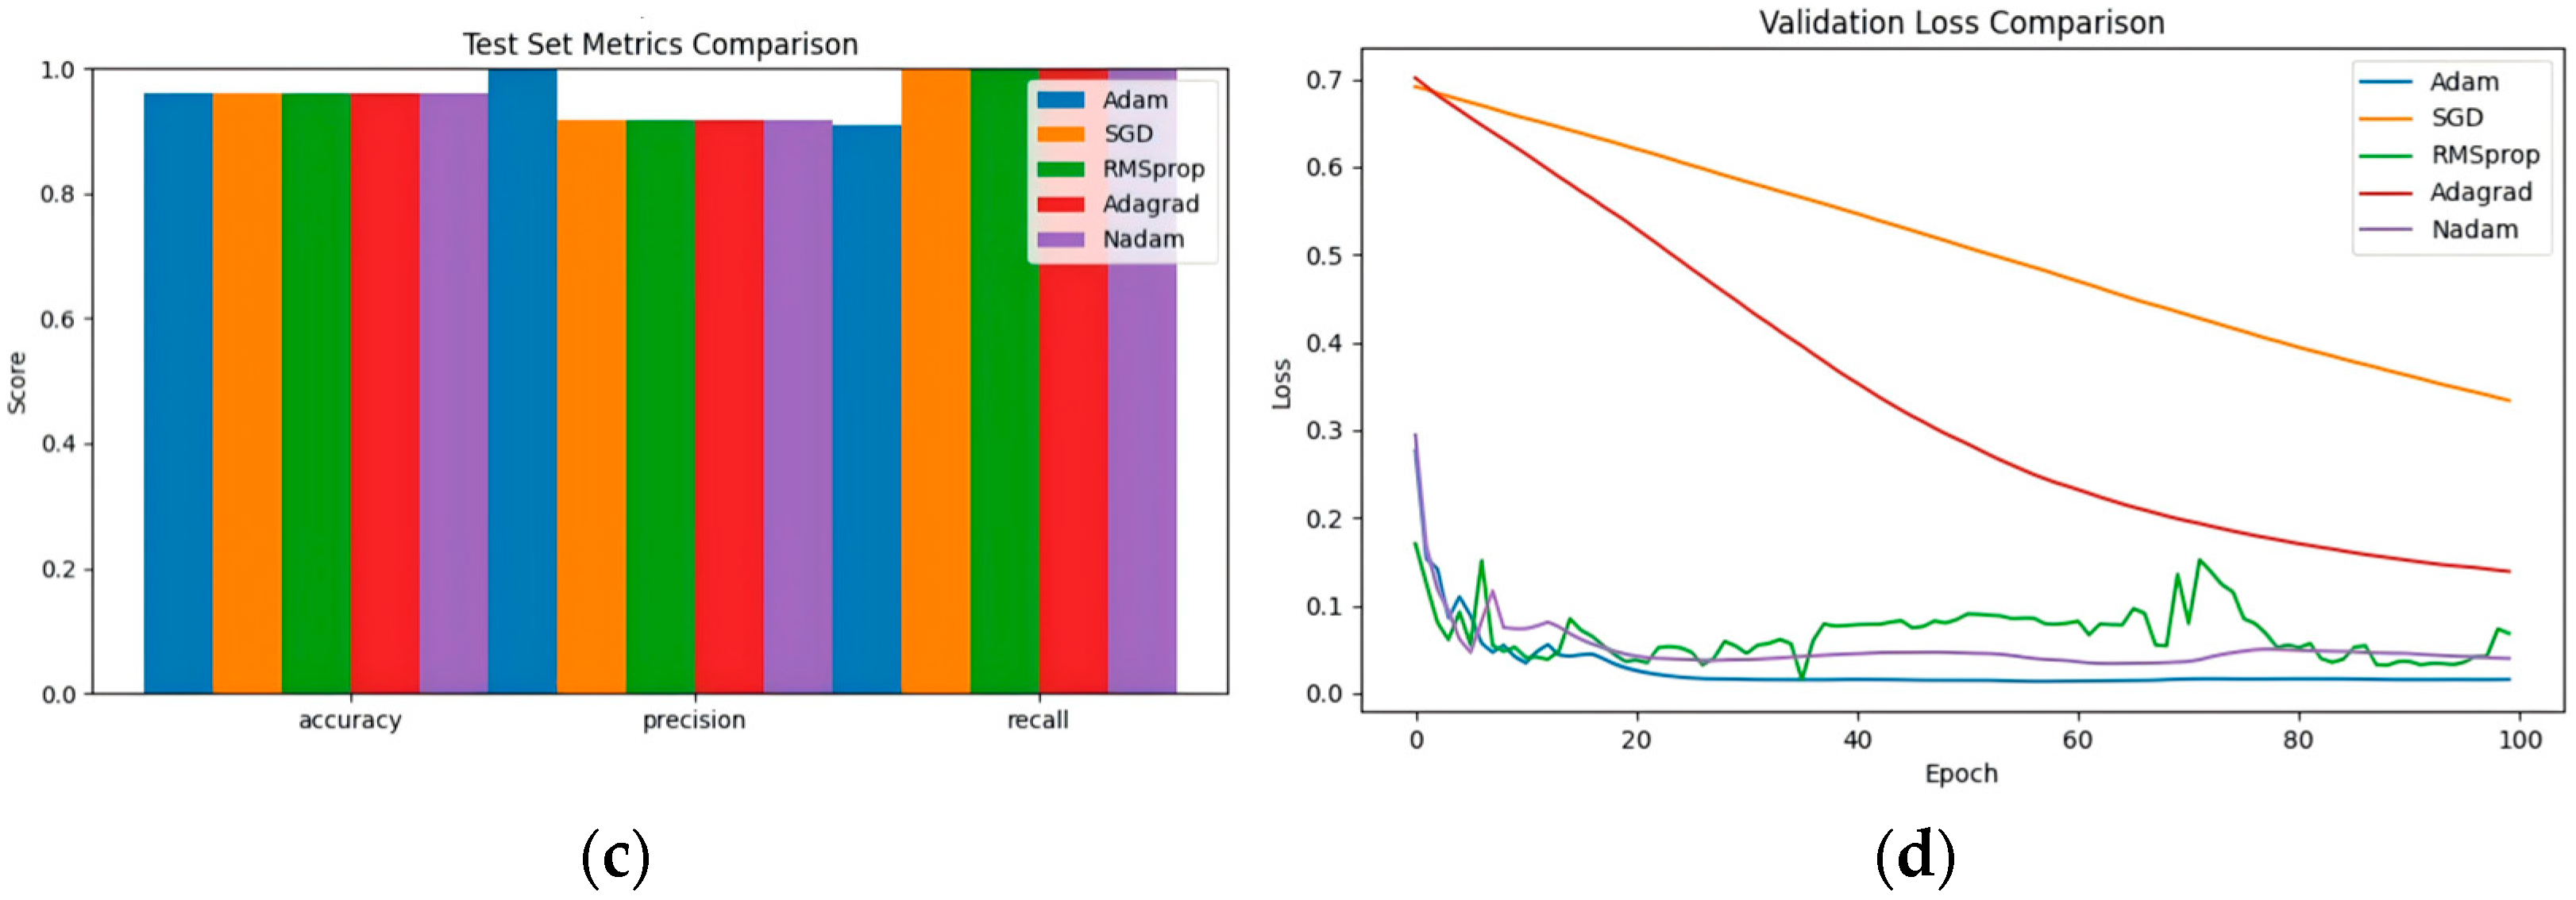
The selection of an optimizer is critical, especially in tasks requiring precision, such as forest fire prediction. In this study, five optimizers—Adam, SGD, RMSprop, Adagrad, and Nadam—were evaluated using the same PCA dimensionality reduction dataset (Figure 5 and Table 3).
The evaluation results demonstrate that all tested optimizers yield accuracies exceeding 96.00% on the test set. However, significant variations are observed in their Precision and Recall metrics. Given the crucial need for a low false positive rate (high Precision) in forest fire prediction, the Adam optimizer proves superior by maintaining an exceptional Precision of 0.9983 and a Recall of 0.9361, alongside the highest overall Accuracy (96.72%). Therefore, the Adam optimizer has been selected for the ALSTM model.
In summary, the final parameter configuration for the ALSTM model includes a step size of 2, a learning rate of 0.0178, a Dropout rate of 0.3, and the Adam optimizer. This configuration ensures that the model achieves a balance of high efficiency, stability, and accuracy in the task of predicting forest fires.

4.4. Mountain Fire Scenario Evolution Model

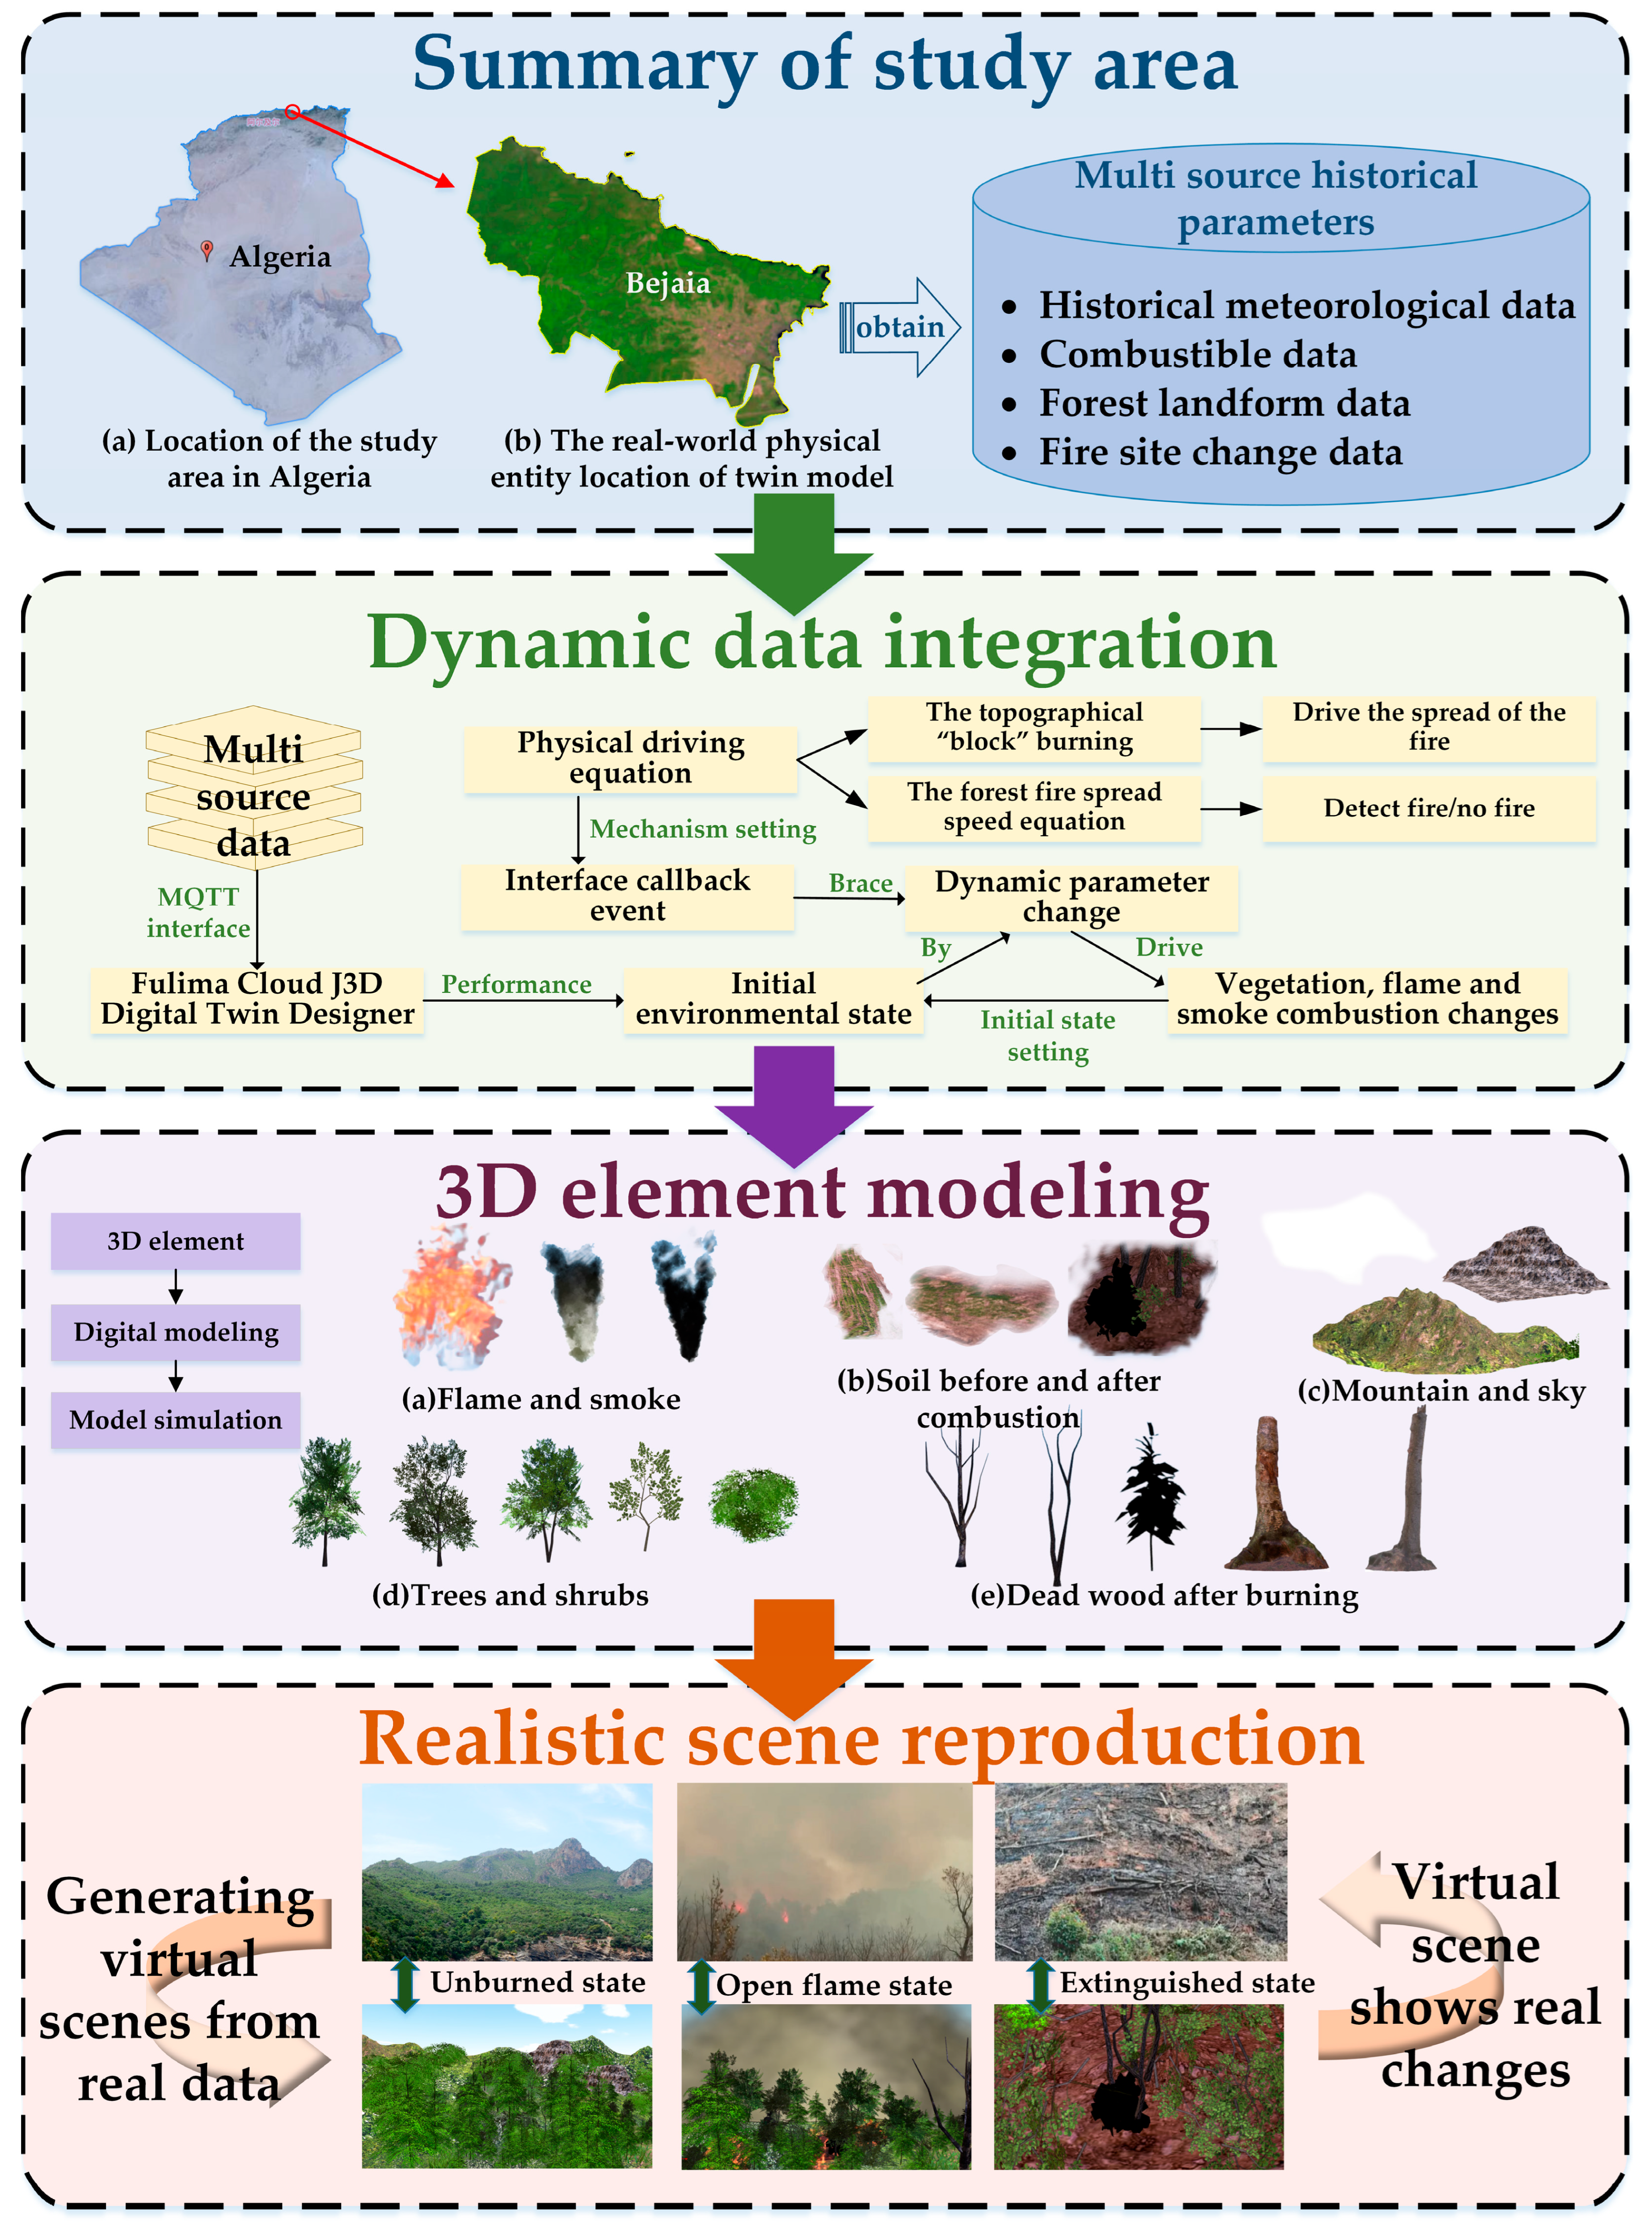
This study details the construction of a mountain fire evolution model, which encompasses three critical components: the formulation of physical driving equations, the integration of dynamic data, and the development of a three-dimensional model. Dynamic equations serve as the mechanistic basis for simulating virtual fire spread, ensuring that the evolution of the fire adheres to physical laws. Additionally, Internet of Things (IoT)-driven modifications to model scenarios facilitate dynamic simulations of forest fire propagation. Utilizing Digital Twin Designer software, the model integrates data from multiple sources to create a coherent visual digital representation that effectively simulates the progress of a forest fire. Through the seamless integration of these three components, the digital twin framework advances traditional static scenario simulation to dynamic predictive validation. The resulting twin model functions not only as a visualized digital representation of the forest fire combustion process but also as a verification tool that connects ALSTM predictions with actual fire propagation scenarios.

4.4.1. Physical Driving Equations

The three-dimensional model discussed in this study integrates meteorological factors, combustibles, and topography to simulate the combustion process. It establishes independent kinetic models for environmental parameters based on historical data, topographic “block” burning equation, and the forest fire spread speed equation within a digital twin framework. This approach supports the physico-spatial processes explored in this study.
The topographical “block” burning equation is utilized to determine the presence or absence of flames. Three primary mechanisms of ignition are identified on the ground [79]: (1) ground spread, (2) airborne dispersal of sparks, and (3) a combination of both ground spread and airborne dispersal.
For ground-based ignition to occur, the following conditions must be met:
ν e n I J 0 ,
where v e denotes the ambient wind speed (m/s), representing the velocity at which the surrounding atmospheric flow influences particle movement; n I J represents the transition from the I th cell to the J th cell. When these conditions are satisfied, flames can propagate to adjacent cells via ground spread.
The combustion equation for the mass of the ground block unit is as follows:
M = β I ζ I ,
where β I indicates the rate of combustion, determined by the state of the combustible material, and ζ I represents an “evolutionary” cutoff function, which progresses from 0 to 1 (until the burning mass is depleted, as determined by the initial mass).
For airborne combustion particle ignition, the following conditions must be satisfied for the i th combustion particle and the J th cell:
x i ( t ) x J J t o l y i ( t ) y J J t o l z i ( t ) z J ,
J tol α M J ,
where x i t , y i t , z i t denote the coordinates of the ith combustion particle in the x-axis, y-axis, and z-axis over time, respectively, within the model space. x J , y J , z J denote the boundary positions of the J th cell in the x-axis, y-axis, and z-axis, respectively, in the model space. J tol denotes a variable proportional to the mass of the J th cell’s ground mass of the block unit, α is the scaling coefficient, and M J denotes the rate of mass change in the J th cell’s ground mass of the block unit.
Meteorological factors, as dynamic elements, exert a considerable impact on forest fires, particularly when the wind aligns with the direction of flame propagation, thereby directly accelerating the rate of forest fire spread [80]. Consequently, it is imperative to consider principal influencing factors such as fuel type, wind speed, humidity, and slope in the formulation of the forest fire spread speed equation, as follows [81]:
R = R 0 × K ϕ × K θ × K S × K r
R 0 = a × T + b × W + c × ( 100 R H ) d ,
W = Int v 0.836 2 3 ,
K ϕ = e 0.1783 × v × cos ϕ ,
K θ = e 3.553 × g × tan ( 1.2 × θ ) .
In the aforementioned equations, R represents the rate of forest fire spread (m/min), R 0 denotes the initial rate of forest fire spread (m/min), K φ is the wind correction coefficient, K θ is the terrain correction coefficient, K S indicates the flammability index [82], and K r is the time correction coefficient (adjusted according to actual fire conditions). The constants are defined as a = 0.03, b = 0.05, c = 0.01, and d = 0.3. Additionally, T represents the air temperature (°C), W signifies the wind speed (m/s), RH is the air relative humidity, Int is an integer placeholder (%), v denotes the wind speed (m/s), and cos φ is the cosine of the angle of spread between the direction of the wind and the fire’s direction. The variable θ represents the slope, and g indicates the slope direction, where 1 stands for uphill and −1 for downhill.
Further, the moisture content of combustibles impacts the initial rate of forest fire spread, necessitating an adjustment as delineated in Equation (13) [83], where m is the moisture content of combustibles (%):
R 0 = 1.0372 × e 0.057 × m .
Equations (8)–(13) enable the quantification of the dynamic effects of wind speed, slope gradient, and fuel moisture content (FFMC, DMC, and DC) on fire spread trajectories and velocities. This approach facilitates the reconstruction of the underlying mechanisms governing authentic fire behaviors, including upslope fire acceleration and downwind fire elongation.

4.4.2. Data Preparation for Twin Model Construction

The construction of the simulation scene requires the integration of multi-source data and dynamic drive capability. This study imports relevant data such as meteorology, combustibles, terrain, and fire field data into the Fulima Cloud J3D Digital Twin Designer (https://www.fulima.com/, accessed on 2 November 2024). By integrating MQTT type interface data, a dynamic driving mechanism based on the IoT is established to facilitate the mapping between virtual scenes and actual forest environments.
The digital model construction of the forest fire environment encompasses the precise simulation of multiple elements. Utilizing the Fulima Cloud J3D Digital Twin Designer, a comprehensive scene is generated featuring basic model frameworks of mountains, soils, and trees, based on imported historical meteorological data, forest topography and geomorphology data, and vegetation distribution data. Spatial alignment techniques are then employed to accurately position each localized model, thereby forming a cohesive forest scene. Physical parameters are assigned to each scene element, and their values are continually updated through state transition equations and IoT data streams, providing essential parameter support for subsequent combustion simulations. The modeling process of the forest fire environment is illustrated in Figure 6.
The forest fire burning process delineated in this study is characterized by three primary states: the Unburned state, the Open Flame state, and the Extinguished state. The dynamic transitions between these states, alongside their visual simulations, are facilitated through interface callback event code that integrates the physical driving equations. The specific logic governing these transitions is outlined in Table 4.

5. Results and Analyses

5.1. Results of Decoupling Analyses

5.1.1. Principal Component Analysis Results

The PCA effectively disentangled the complex interactions among factors affecting forest fires, unveiling the fundamental dimensions that govern the probability of fire occurrence in the Algerian study area (Figure 7 and Table 5). Following PCA of the entire dataset, the first five PCs cumulatively accounted for 91.40% of the total variance, demonstrating that the complex dataset was condensed into several principal axes of variation. Specifically, PC1, with high loadings from indices such as ISI and FFMC, captures the primary dimension of “combustible dryness and fire potential.” PC2 articulates the critical dimension of “wind speed effect and drought degree,” which significantly contributes to the rapid propagation and increased intensity of fires. PC3, the “humidity suppression effect,” quantifies how moisture conditions inhibit ignitability and sustainment of flames in combustible materials. PCs 4 and 5 capture the dimension of “local wind–temperature interaction and spatial heterogeneity,” reflecting secondary yet noteworthy effects of region-specific patterns in wind speed, temperature, and spatial variability on fire occurrence.
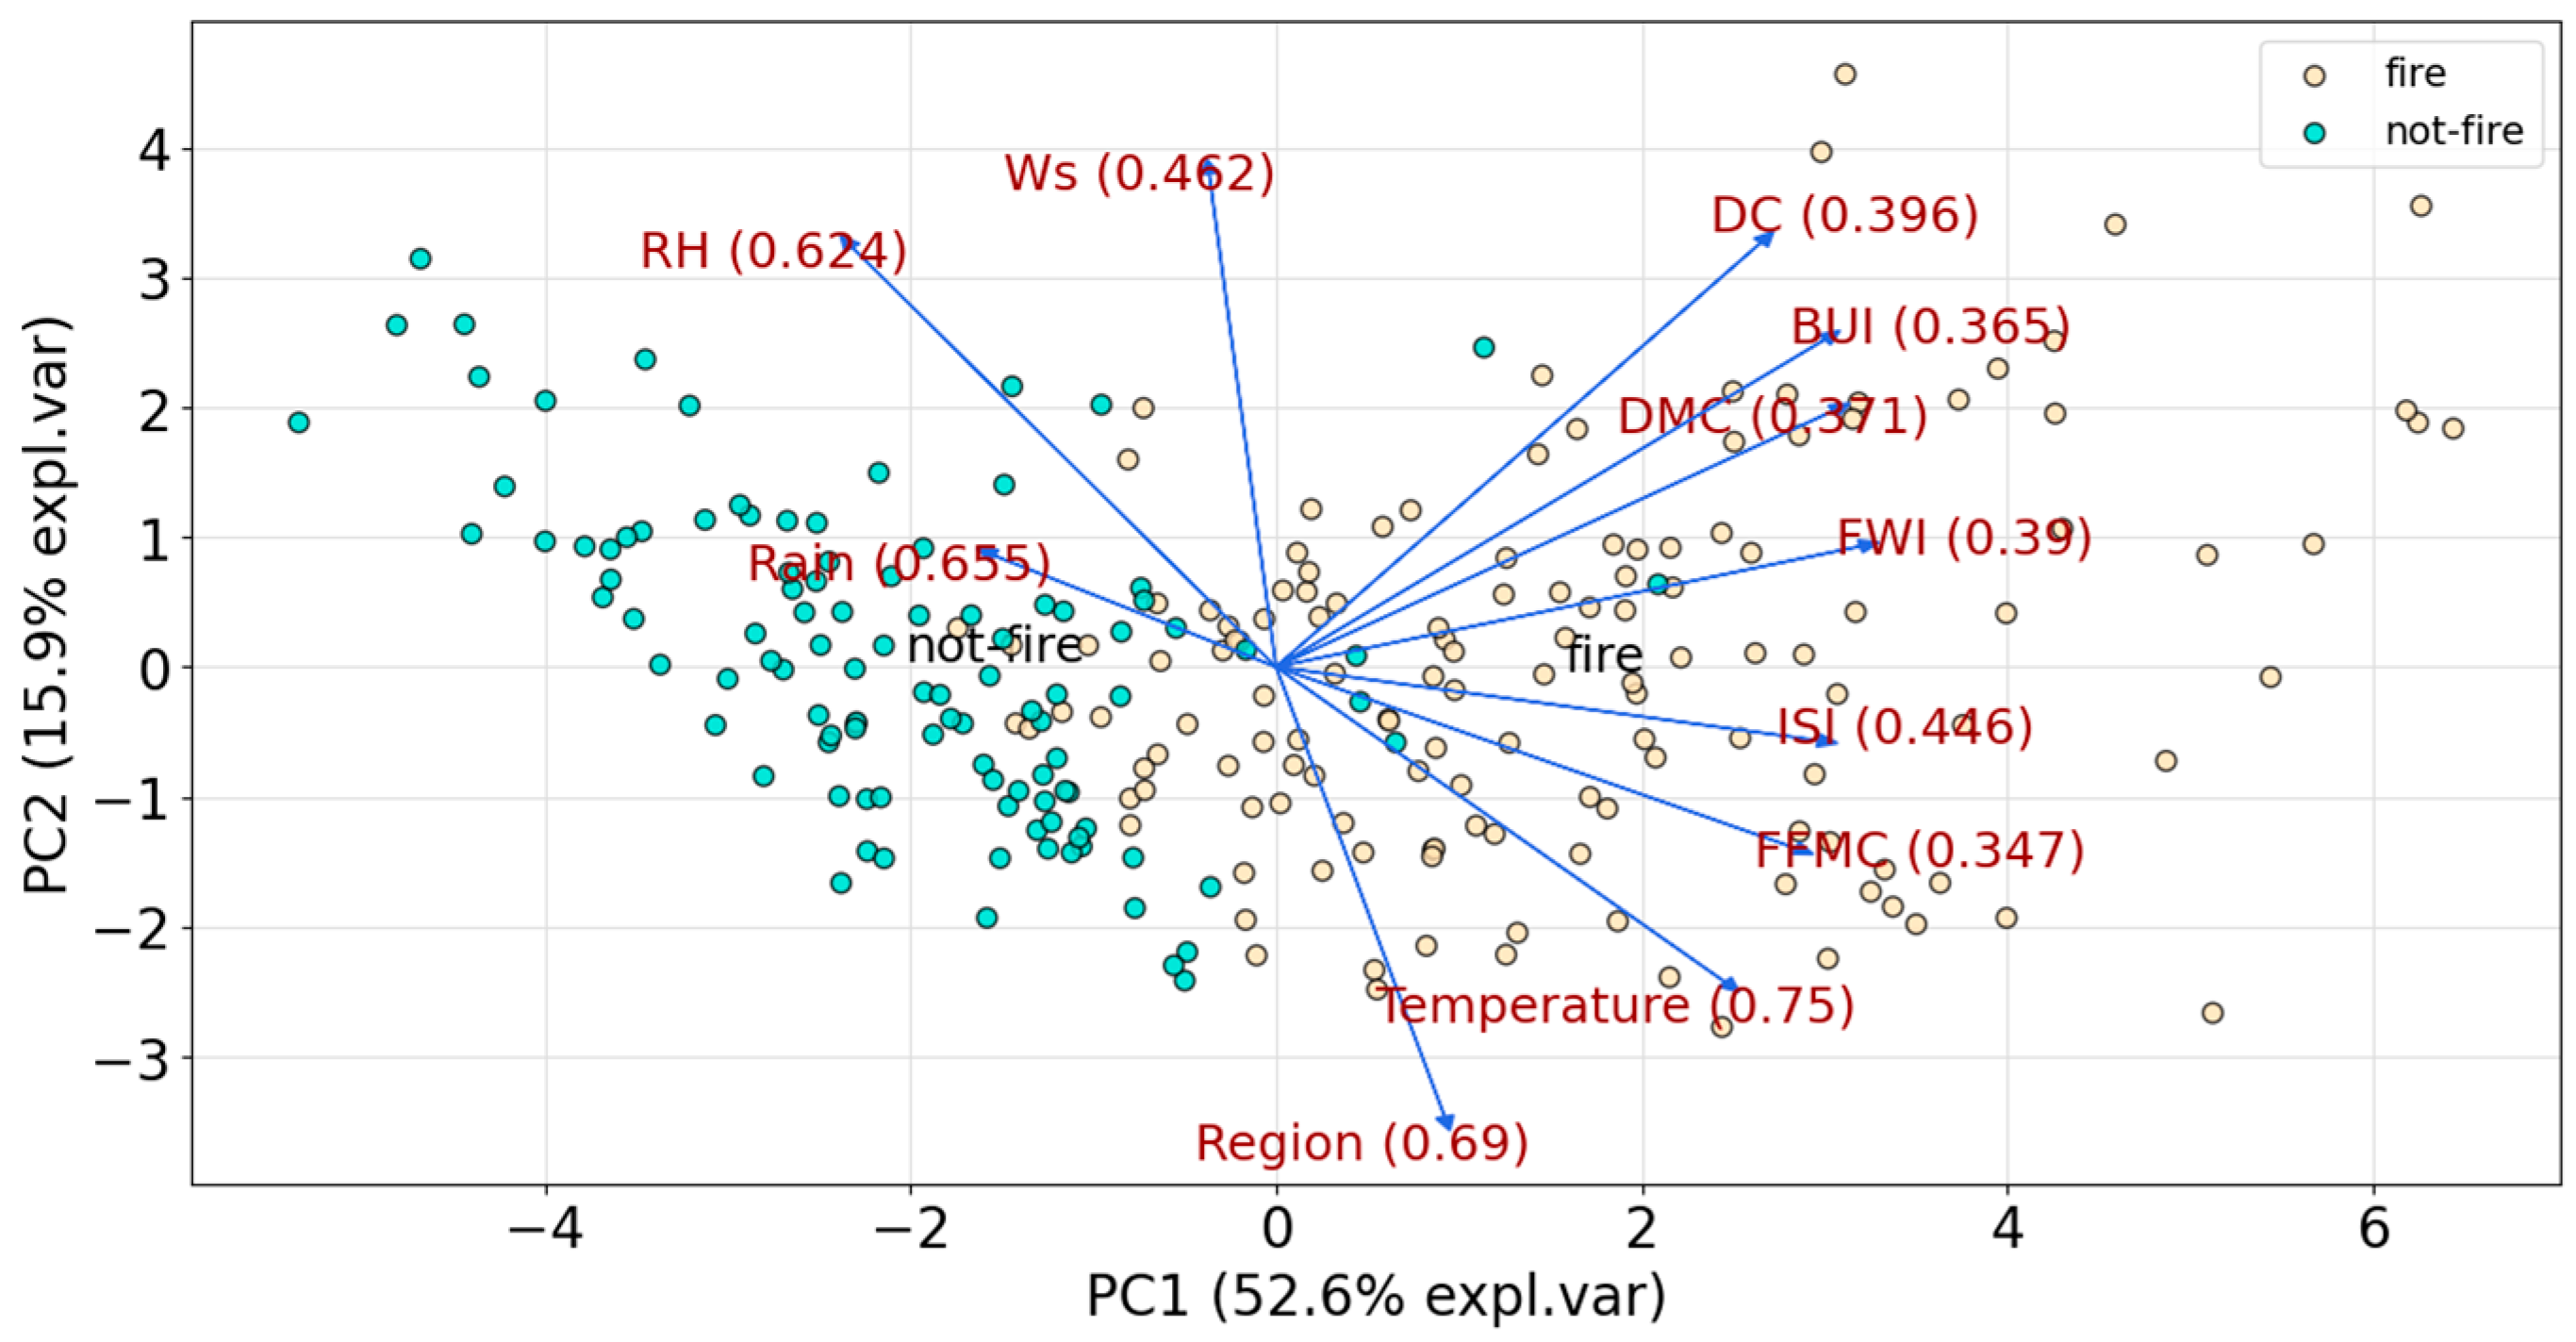
Among the most informative graphical representations of multivariate datasets are bi-plots [84]. These plots facilitated the distinction between “fire” and “no-fire” occurrences in Figure 8, where a clear pattern of separation reaffirms that PCA effectively disentangles the contributory factors and elucidates the principal driving dimensions. The loadings of characteristic variables, as indicated by arrows in Figure 8, show that ISI, FFMC, FWI, DMC, and BUI cluster tightly in the positive direction of PC1, underscoring their cohesive role in characterizing the dimension of “combustible dryness and fire potential.” Conversely, RH and Rainfall cluster in the negative direction of PC1, emphasizing their collective impact in the “humidity suppression” dimension. Ws and DC are oriented towards PC2, demonstrating their distinctive mechanisms of action, independent of PC1. Temperature appears in both PC1 and PC2, suggesting its dual impact: indirectly enhancing risk by accelerating the drying process and constituting an independent dimension due to its variable patterns.
In conclusion, PCA not only achieves data dimensionality reduction but, more critically, it deconstructs the multifactorial interaction system. It identifies the primary dimensions of “combustible dryness and fire potential” (PC1) and “wind speed effect and drought degree” (PC2), along with the “humidity suppression effect” (PC3) and two secondary dimensions. This analytical approach provides a coherent framework for understanding the predominant mechanisms driving forest fire occurrences in Algeria and establishes a solid basis for the feature inputs and interpretability in subsequent predictive model analyses.

5.1.2. Analysis of Variable Contributions

SHAP value analysis was conducted on the ALSTM model, which was trained using both the original features and those reduced through PCA, to examine the primary factors affecting forest fire prediction and their operational mechanisms. This analysis also aimed to quantitatively evaluate whether the PCA-reduced data preserved the essential information pertinent to fire prediction found in the original data, thereby validating the efficacy of spatial decoupling.
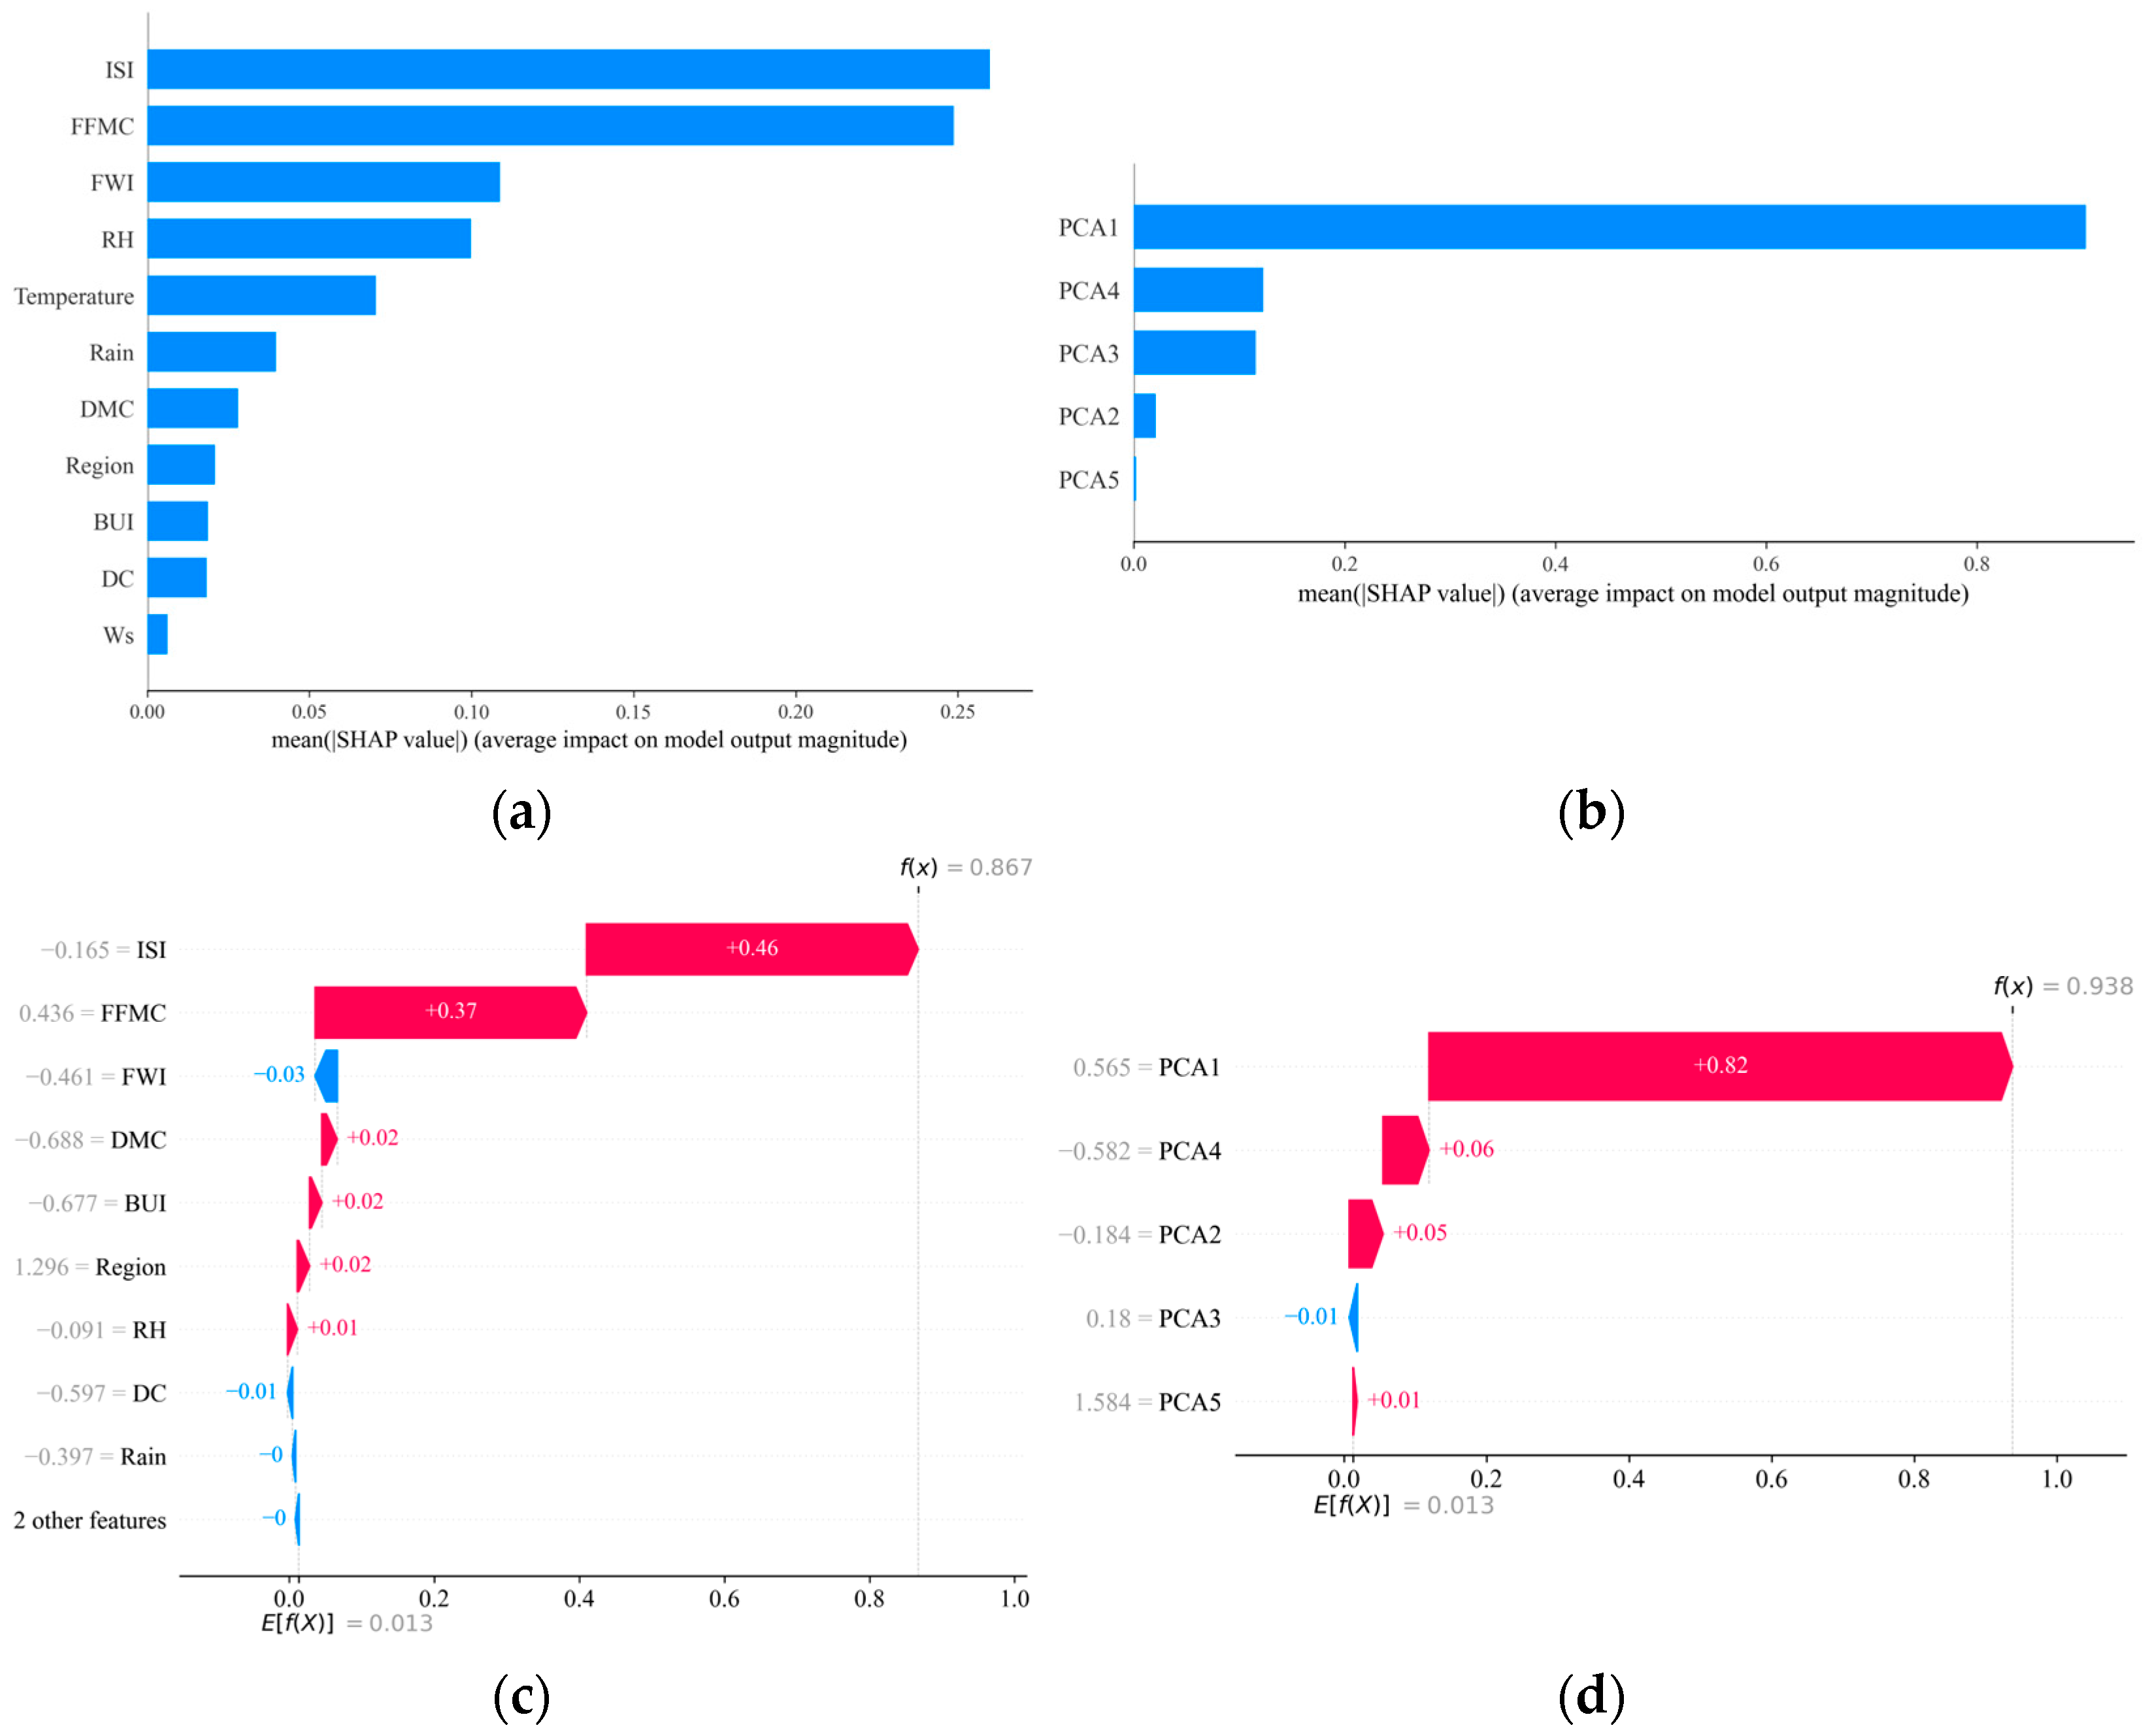
The relevance of the 11 driving factors was determined through an aggregation of SHAP values across the characteristic variables in Figure 6. In Figure 9a,b, the importance of ISI and FFMC significantly exceeds the other variables. This observation underscores the crucial roles that the rate of combustible dispersion and the moisture condition of fine combustibles play in affecting model outcomes. These factors are followed in importance by FWI and RH, aligning closely with the central themes of “combustible dryness and fire potential” (predominantly represented by PC1) and “humidity suppression” (dominated by PC3) as identified by the PCA. The impact of variables such as WS and DC appears less pronounced, yet remains noteworthy, corresponding to their association with the dimension of “wind speed effect and drought degree” (PC2). For the PCA dataset, PC1 encapsulates the majority of information critical to fire prediction in the original dataset, validating that key factors such as ISI and FFMC are predominant in the original feature analysis.
In Figure 9c, the significant positive impacts of ISI and FFMC on the model output are illustrated by red arrows, reflecting their intrinsic characteristics where ISI denotes a faster spreading rate and stronger combustion potential, and FFMC indicates a high propensity for combustion due to dry conditions. The effect of other factors is comparatively weak, which may be overshadowed by the dominant effects of FFMC and ISI, thus obscuring a clear elucidation of their mechanisms. In Figure 9d, PC1 demonstrates a strong, monotonically increasing positive effect, consistent with the effects of ISI and FFMC, suggesting that PCA downscaling effectively concentrates and amplifies the core signals related to fire risk, while eliminating extraneous noise.
The integrated analysis utilizing both PCA and SHAP not only quantifies the importance ranking of impact factors: ISI ≈ FFMC > FWI > RH > Temperature > Rain > DMC > BUI > WS > DC, but more critically, it elucidates the core hierarchy of mechanisms driving forest fires in Algeria. The findings indicate that the dryness of combustible materials is the predominant factor for open fire ignition, serving as the fundamental prerequisite for fire occurrence. The fire spread potential, represented by ISI, and immediate meteorological conditions, affected by Ws, determine the development rate of a fire once initiated. High humidity emerges as the most effective natural suppressant of fire occurrences, while temperature primarily indicates whether a fire will start at a given location.

5.2. Model Prediction Results

To validate the predictive performance of the proposed ALSTM model within the “spatial-temporal double decoupling” framework, this study conducted comparative training performance analyses and multi-metric accuracy assessments.

5.2.1. Improvement of Training Effect by Feature Decoupling

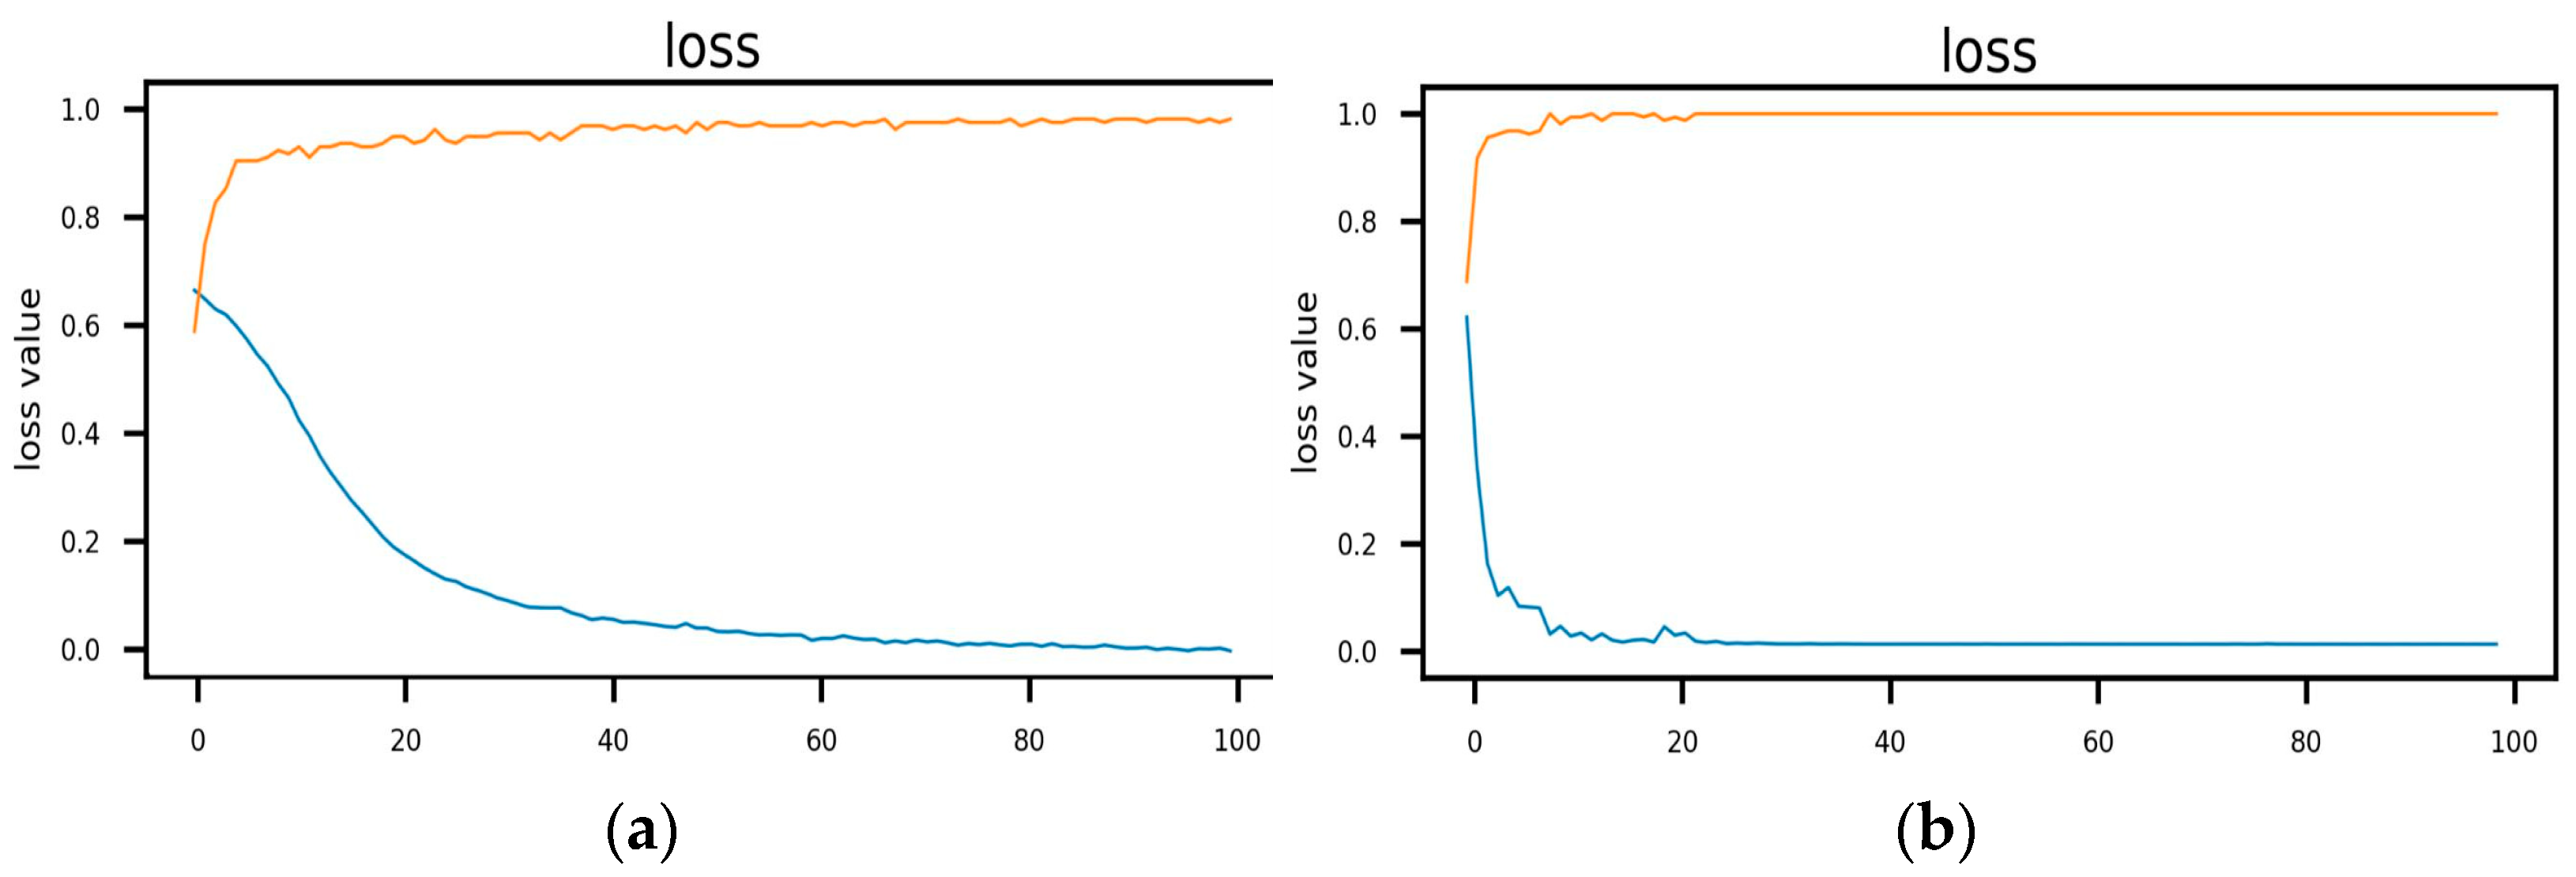
During the training phase, this study evaluated the performance of an ALSTM model trained with the original complete feature dataset against that which utilized data reduced in dimensionality by PCA. The loss function and probability prediction curves are presented in Figure 10.
The analysis of the results reveals that the loss curve for the original dataset (Figure 10a) decreases gradually and exhibits fluctuations in later iterations, suggesting that feature redundancy hampers the model’s convergence efficiency and limits its generalization capacity. Conversely, the loss curve for the PCA-reduced dataset (Figure 10b) shows a rapid decline to 0.05 within 10 iterations and maintains stability thereafter, confirming consistently lower loss compared to the original dataset. This evidence robustly supports the assertion that dimensionality reduction through PCA not only simplifies the feature space by eliminating redundancy and noise but also enhances model convergence, prediction stability, and generalization performance.
To further substantiate the performance benefits of ALSTM in forest fire prediction, traditional LSTM and LR models were selected for comparison. Ten independent replicate experiments were conducted using the same PCA dataset to assess the performance of ALSTM relative to traditional LSTM and LR. In each experiment, the training and test sets were randomly resplit using different random seeds. The comparison results are summarized in Table 6.
The comparison of key metrics indicates that ALSTM surpasses the other models on the majority of indicators, notably demonstrating exceptional performance in recall and F1 score, which underscores its superior overall effectiveness.
To ensure robustness and statistical power, the research conducted paired t-tests to compare model performance. For each experiment, single-sample t-tests were performed on the differences in performance metrics between ALSTM and the comparison models (LSTM, LR), with the null hypothesis stating that “the mean difference of the metrics is zero.” The results reveal not only the mean ± standard deviation of the original metrics but also the mean difference, 95% confidence interval, and p-value to assess statistical significance. This comprehensive analysis confirms whether the superiority of ALSTM over the baseline models is statistically significant (Table 7).
In comparison to the LSTM model (Table 7), the ALSTM model demonstrates statistically significant improvements in accuracy, precision, F1 score, and t he area under the precision-recall curve (PR-AUC). Furthermore, when compared to LR, ALSTM shows significant enhancements in accuracy, recall, F1 score, and PR-AUC. These findings confirm the superior performance of the ALSTM model relative to both traditional LSTM and LR approaches.

5.2.2. Comprehensive Model Accuracy Assessment

In this study, the final ALSTM model, trained utilizing PCA-reduced data (The PCA dataset was divided into independent training, validation, and test sets in a 7:2:1 ratio according to temporal order), underwent a comprehensive evaluation based on metrics such as precision, recall, F1 score, and PR-AUC value (Figure 11). A detailed explanation of each metric is outlined in Table S2 of the Supplementary Materials.
In Figure 11a, the precision increases rapidly as classification thresholds rise, stabilizing near 1.0 once thresholds exceed 0.1. This finding indicates that the model achieves exceptionally high predictive accuracy for the “fire” category over a wide range of thresholds, with the probability of false alarms effectively minimized. In Figure 11b, recall gradually decreases with increasing thresholds but consistently remains above 0.8 within the interval [0, 0.8]. This result statistically confirms the model’s capacity to capture the vast majority of true fire instances, thereby indicating a low risk of false negatives. The F1 score analysis in Figure 11c shows a maximum value of 0.937 at a threshold of approximately 0.02, maintaining a high level close to 0.9 across the broad threshold range [0.02, 0.8]. These findings collectively validate the model’s ability to balance the critical objectives of reducing both false positives and false negatives. Furthermore, PR-AUC in Figure 11d attains a value of 0.987. This result rigorously demonstrates the model’s robustness in handling class imbalance scenarios, indicating that even when confronted with the typical data distribution characteristic of forest fire prediction tasks—where fire instances represent the minority class—the model sustains exceptionally high precision across various recall levels, thereby delivering outstanding overall classification performance.
The experimental outcomes consistently and convincingly demonstrate that the forest fire prediction model developed in this study, based on the “spatio-temporal double decoupling” framework, achieves efficient convergence, high stability, exceptional accuracy, and substantial robustness. It effectively addresses the critical issues of feature confusion and insufficient prediction accuracy inherent in traditional methods, providing a dependable technology for accurate early warning of forest fires.

5.3. Verification of Simulation Results

In this study, the parametric simulation experiments were designed to evaluate the effect of the meteorological factors (wind speed, humidity, temperature) and combustible factors (FFMC, DMC, DC), within a mountain fire scenario evolution model maintaining consistent initial environmental parameters. By controlling each variable independently, a thorough analysis was conducted to discern the physical effects of these factors on critical fire behavior characteristics, including ignition, spread, and intensity within a three-dimensional, real-terrain environment. This study aimed to validate the plausibility of key factors identified through decoupling analysis in affecting fire evolution, and to evaluate the predictive accuracy of forest fire occurrence probabilities generated by the ALSTM network.
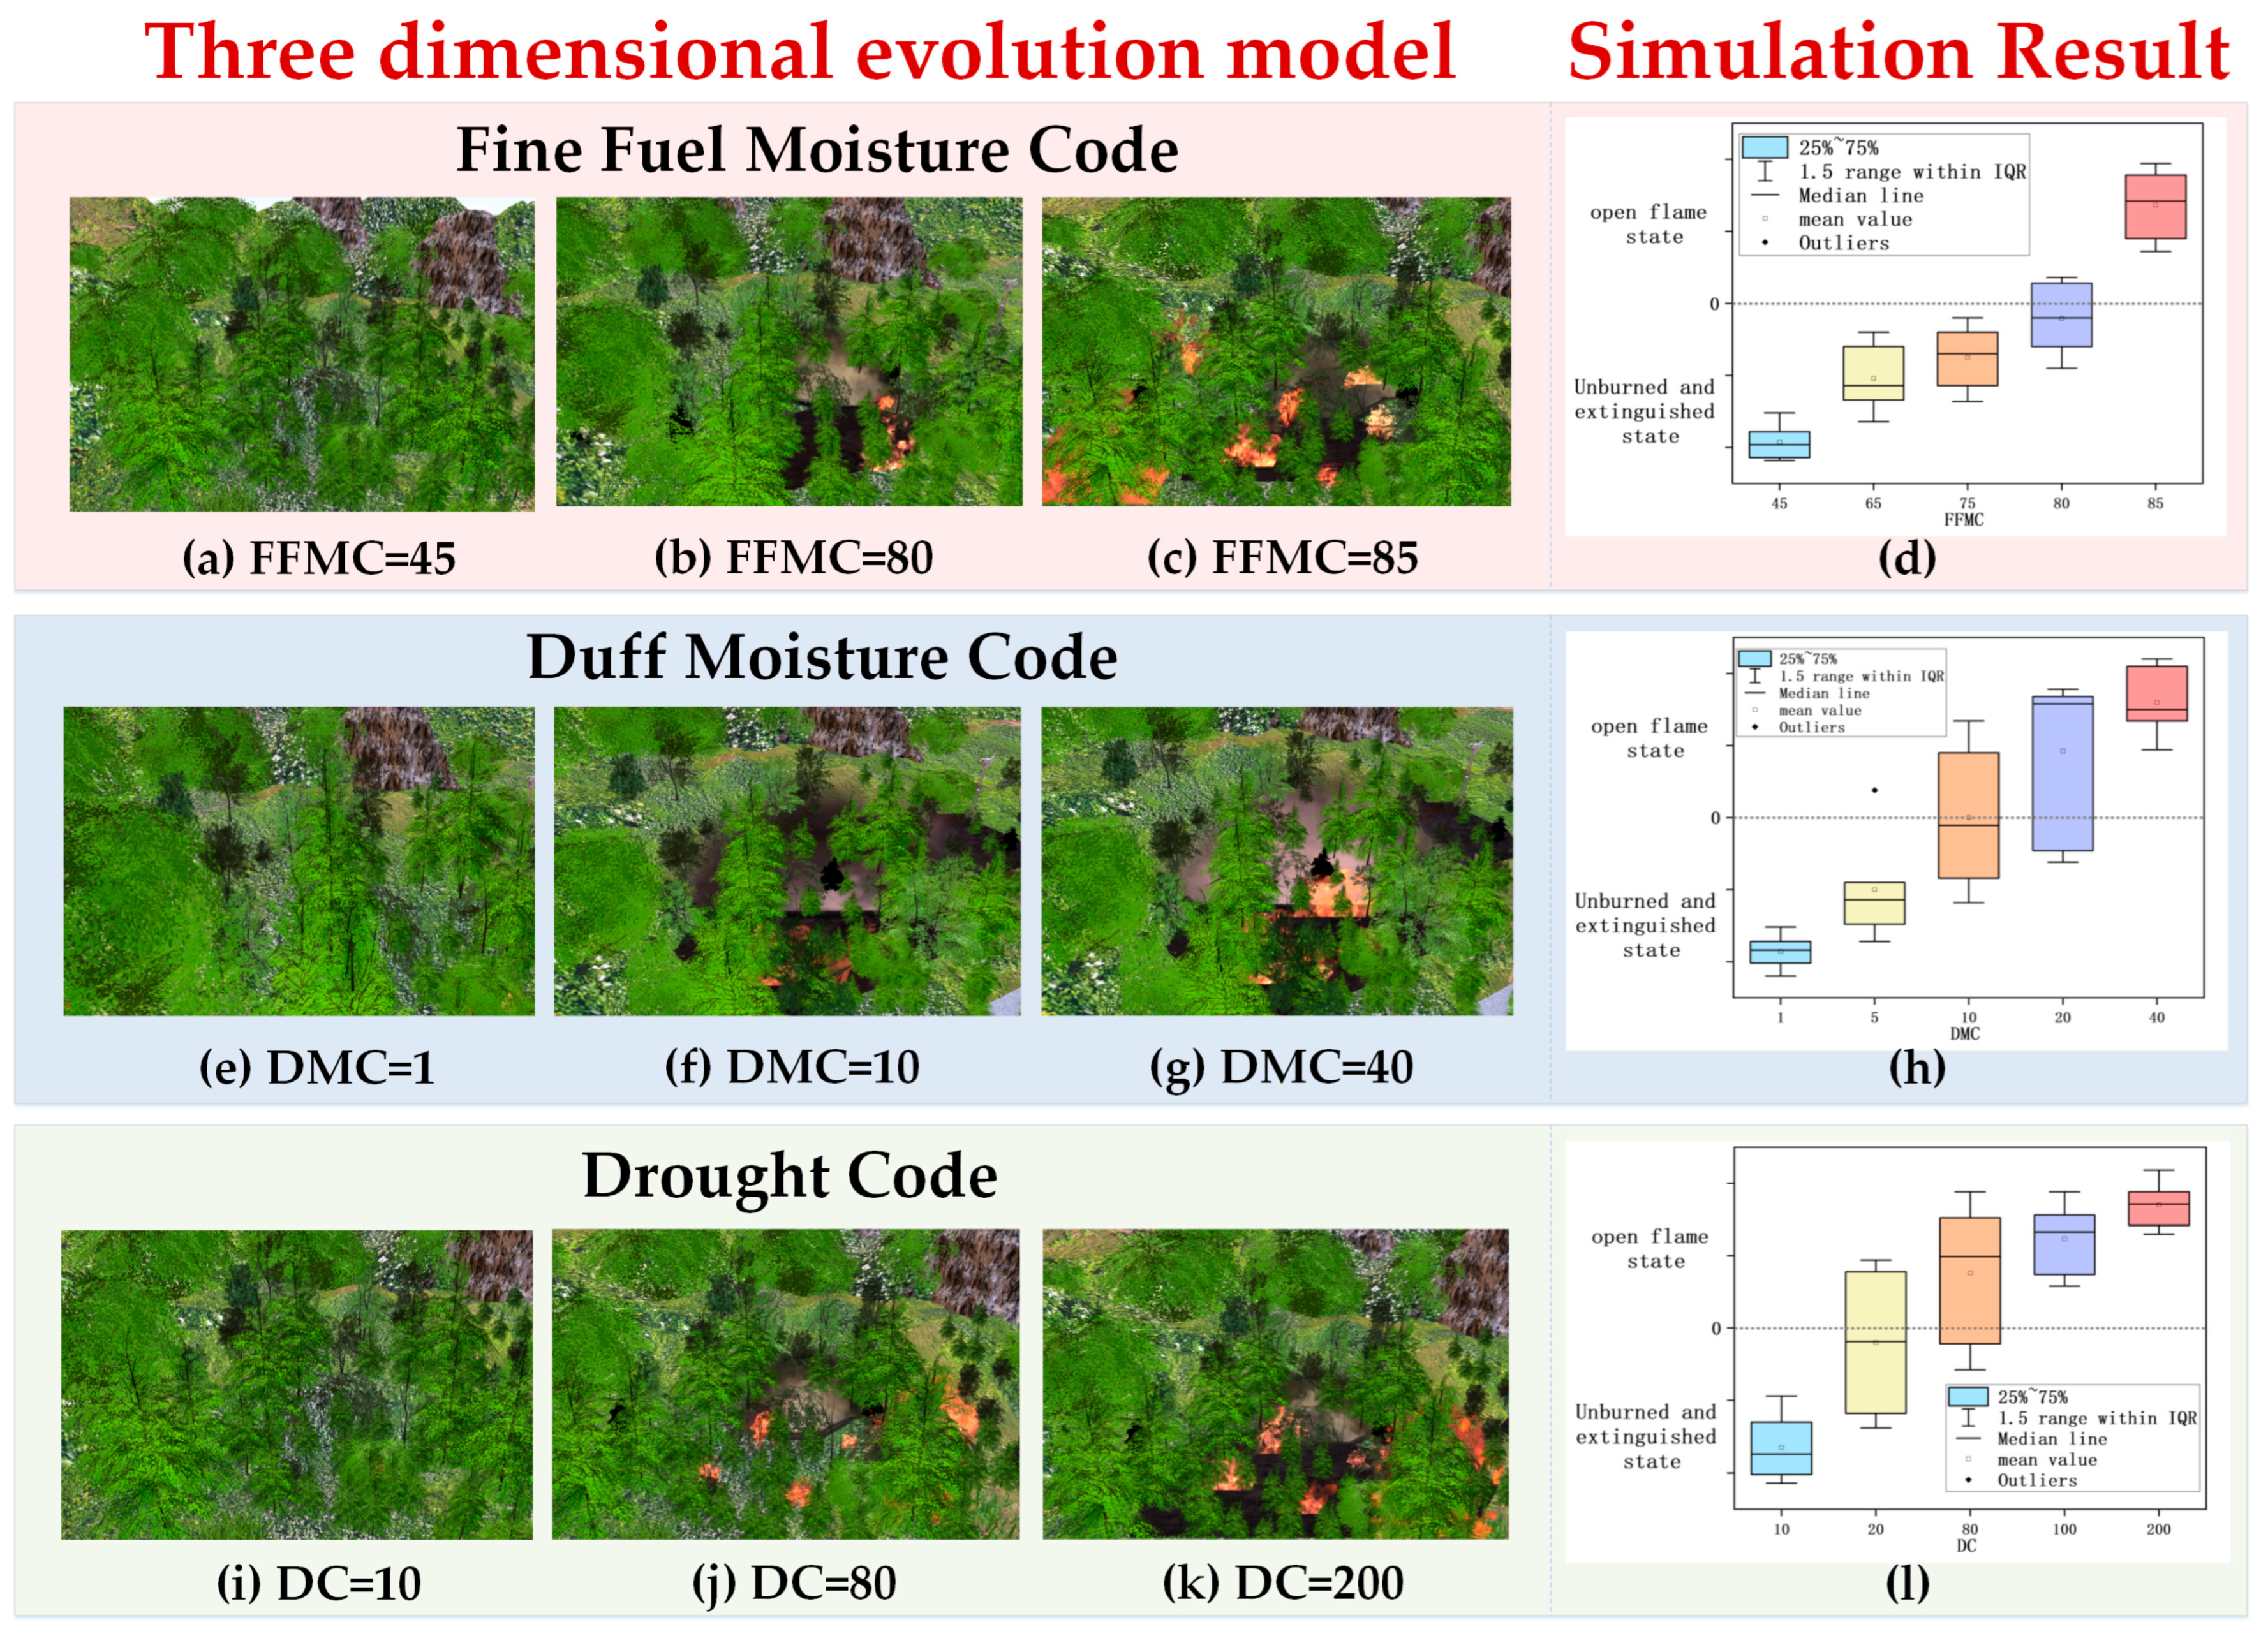
Within the context of the designated study area, this study established five temperature gradients for simulation purposes. Each temperature condition was subjected to 30 replicate simulation trials. All subsequent experiments involving additional factors similarly consisted of 30 replicate simulations; this detail will not be reiterated in the following descriptions (Figure 12a–d). The analysis demonstrated that within a single time step, the likelihood of open fire initiation increased significantly with rising ambient temperatures, and the number of fire points escalated significantly. Furthermore, the proportion of areas affected by open fires exhibited a nonlinear escalation with temperature increases.
Air humidity (Figure 12e–h) plays a crucial role in determining the ignition threshold and the capacity to sustain flames by regulating the moisture content of During the simulation experiments, setting the RH to 85% effectively suppressed the generation of open flames throughout the simulation period. This observation elucidates the physical mechanism whereby combustibles in highly humid environments possess elevated water content, necessitating greater energy expenditure for water evaporation. Additionally, even when ignition occurs at a RH of 65%, both the average spread rate and the burned area remain significantly lower than those observed under low-humidity conditions.
Ambient wind affects the trajectory of airborne embers and enhances the evaporation and desiccation of soil and surface fuels at the initial stage of a fire, directly impacting the likelihood and intensity of forest fire spread. The impact of wind speed on the combustion dynamics of forest fires is illustrated in Figure 12i–l. The findings indicate that within a specified range, an increase in wind speed accelerates the initiation of open fires and elevates the number of fire points across individual time intervals. High wind speeds cause flames to become noticeably sloped and elongated, with the fire’s head advancing much faster than its flanks and tail, and the dominant fire direction being rapidly propelled along the wind. The model demonstrates the nonlinearity of the wind speed effect (limited at low speeds, dramatic at high speeds) and its dependency on the scenario (notably significant in downwind areas). Additionally, the indirect facilitation of wind speed on the FFMC (via drying) and the ISI (directly affecting spread) were also visualized through the digital twin model.
The FFMC serves as a pivotal indicator that characterizes the moisture condition of fine combustibles (e.g., dead leaves, fine twigs) with a diameter of ≤1 mm. In Figure 13a–d, the FFMC regulates the ignition temperature and the resistance to flame propagation within the fuel bed. Experimental observations have shown that at low FFMC values, no fire ignition occurs and the fire risk remains minimal. Conversely, at high FFMC values, the rate of flame propagation is significantly rapid, leading to the formation of high-intensity, extensive, and continuous fire lines within a discrete time step.
The DMC quantifies the moisture content of medium-grained surface combustible materials and plays a critical role in moderating fire intensity. Elevated DMC values indicate a deeper drying of these combustibles. Experimental results in Figure 13e–h demonstrate that high DMC values substantially extend the duration of flame maintenance, thereby increasing the total energy released from individual fires and contributing more significantly to subsurface or deep-seated fires.
The DC evaluates the long-term drought severity affecting deep organic soils. It reflects the cumulative impact of seasonal precipitation deficits on combustible materials and their correlation with prolonged flaming and expansion. An elevated DC indicates an extremely dry state of deep combustibles following prolonged drought conditions. Simulation results in Figure 13i–l indicate that as the DC value increases within a certain range, the depth of combustible material burning and the size of the overfire area per unit time step also increase.
The digital twin simulation results effectively reproduce and validate the core findings derived from the independent analysis, providing an intuitive visual representation of the physical and spatial processes impacting these factors and quantifying the dynamic mechanisms of traditional FWI system metrics over time. Additionally, a multitude of simulated scenarios encompassing various meteorological and combustible conditions have been established. The final combustion states in these scenarios align closely with the probabilities of high and low fire occurrences as predicted by the ALSTM model, based on identical input parameters. This congruence at the level of three-dimensional physical mechanisms substantiates the ALSTM prediction model significantly beyond mere statistical indicators, and based on physical processes, thereby greatly enhancing the reliability of the prediction outcomes

6. Conclusions

To address three core challenges in forest fire research—feature confusion, insufficient prediction accuracy, and the absence situational models, this study introduces the novel “decoupling analysis-model prediction-scenario validation” trinity framework, developed to analyze meteorological and combustible state indicators in Algeria using PCA-SHAP synergistic analysis. The dryness of combustible materials, accounting for 52.61% of the variance in PC1, serves as the primary driving factor. Additionally, Ws emerged as a critical factor for rapid fire propagation and increased fire intensity, whereas humidity was identified as the central negative driving factor. The forest fire prediction model, based on the “spatial-temporal double decoupling” mechanism. The model achieved mean values of 97.82% accuracy (±0.0213), 94.61% recall (±0.0373), and a PR-AUC of 99.45% (±0.0048), significantly outperforming traditional methods. These results confirm that the proposed model exhibits efficient convergence, high stability, and robustness, significantly addressing the issues of feature confusion and insufficient prediction accuracy inherent in traditional methods. This model also pioneers a verification paradigm, driven by digital twins and based on a physics engine, to achieve closed-loop verification of ALSTM prediction results and three-dimensional fire evolution. This approach provides a dynamic and traceable physical mechanism verification environment for complex prediction models.
This study adopts Algerian forests as a representative case, offering practical guidance for forest fire early warning systems and resource allocation strategies: Monitoring and forecasting efforts should prioritize combustible moisture conditions, particularly under conditions of high temperatures and low humidity, necessitating heightened vigilance. FFMC, ISI, RH, and temperature are identified as key indicators for primary monitoring in forest fire risk assessment. The findings underscore the practical value of digital twin technology in enhancing training and simulation exercises. Accordingly, relevant agencies are encouraged to develop analogous simulation-based prediction systems to support the training of fire commanders and facilitate decision-making drills across diverse disaster scenarios, thereby strengthening emergency preparedness and response capabilities.
The study acknowledges certain limitations due to data dimensions and computational constraints:
(1)
The model training depends on data from specific climatic zones in Algeria, exhibiting strong regional specificity. Its generalizability to broader forested areas remains to be verified.
(2)
The physical-spatial processes under the coupled interactions of the influencing factors are highly complex. The study constructs a mountain fire scenario evolution model based on a simplified hypothetical dynamics module, which restricts the precision of quantitative fire behavior simulations and limits the capacity to fully capture the impacts of extreme weather events.
Future research will aim to incorporate multi-region data (e.g., historical fire and environmental records from tropical rainforest regions beyond the Mediterranean) to construct a cross-regional generalized model, enhancing the universality of the framework. It will also explore the integration of cutting-edge deep learning models, such as ISONet [85], within the framework established in this study to optimize the prediction module. Furthermore, introducing the physical driving equations of extreme weather will improve the accuracy of physical simulations.

Supplementary Materials

The following supporting information can be downloaded at https://www.mdpi.com/article/10.3390/f16101546/s1: Table S1. Differences and Connections Between the Tripartite Framework and Existing Paradigms; Figure S1: Interaction diagram of forest land digital twins; Table S2. Model performance evaluation index.

Author Contributions

Conceptualization, W.L.; data curation, W.L.; formal analysis, W.L.; funding acquisition, W.Z. and Y.T.; investigation, W.L.; methodology, W.L. and W.F.; project administration, W.Z.; resources, W.L.; software, W.L. and W.F.; supervision, W.Z. and Y.T.; validation, W.L. and W.F.; visualization, W.L.; writing—original draft, W.L.; writing—review and editing, W.L. All authors have read and agreed to the published version of the manuscript.

Funding

This research was funded by the Innovation and Entrepreneurship Training Program for Undergraduates of Sichuan Normal University under grant number 202410636159; the Open Project of Key Laboratory in Sichuan Provincial Universities (Technology of Public Fire Prevention and Control) under grant number SC KLPFPCT2024Y09; and the Sichuan Science and Technology Program under grant number 2024YFFK0111.

Data Availability Statement

The data will be made available on request.

Conflicts of Interest

The authors declare no conflicts of interest.

References

  1. Bargali, H.; Pandey, A.; Bhatt, D.; Sundriyal, R.C.; Uniyal, V.P. Forest fire management, funding dynamics, and research in the burning frontier: A comprehensive review. Trees For. People 2024, 16, 100526. [Google Scholar] [CrossRef]
  2. San-Miguel-Ayanz, J.; Durrant, T.; Boca, R.; Libertà, G.; Branco, A.; de Rigo, D.; Ferrari, D.; Maianti, P.; Artés Vivancos, T.; Costa, H.; et al. Advance EFFIS Report on Forest Fires in Europe, Middle East and North Africa 2017; European Commission: Luxembourg, Luxembourg, 2020; pp. 31–32. ISBN 978-92-79-92776-8. [Google Scholar] [CrossRef]
  3. Abid, F.; Izeboudjen, N. Predicting Forest Fire in Algeria Using Data Mining Techniques: Case Study of the Decision Tree Algorithm. In Proceedings of the Advanced Intelligent Systems for Sustainable Development (AI2SD’2019), Marrakech, Morocco, 8–11 July 2019; pp. 363–370. [Google Scholar] [CrossRef]
  4. Mishra, M.; Guria, R.; Baraj, B.; Nanda, A.P.; Santos, C.A.G.; da Silva, R.M.; Laksono, F.X.A.T. Spatial analysis and machine learning prediction of forest fire susceptibility: A comprehensive approach for effective management and mitigation. Sci. Total Environ. 2024, 926, 171713. [Google Scholar] [CrossRef] [PubMed]
  5. Abatzoglou, J.T.; Kolden, C.A.; Cullen, A.C.; Sadegh, M.; Williams, E.L.; Turco, M.; Jones, M.W. Climate change has increased the odds of extreme regional forest fire years globally. Nat. Commun. 2025, 16, 6390. [Google Scholar] [CrossRef]
  6. El Garroussi, S.; Di Giuseppe, F.; Barnard, C.; Wetterhall, F. Europe faces up to tenfold increase in extreme fires in a warming climate. npj Clim. Atmos. Sci. 2024, 7, 30. [Google Scholar] [CrossRef]
  7. Turco, M.; Llasat, M.C.; von Hardenberg, J.; Provenzale, A. Impact of climate variability on summer fires in a Mediterranean environment (northeastern Iberian Peninsula). Clim. Change 2013, 116, 665–678. [Google Scholar] [CrossRef]
  8. Zumbrunnen, T.; Pezzatti, G.B.; Menéndez, P.; Bugmann, H.; Bürgi, M.; Conedera, M. Weather and human impacts on forest fires: 100 years of fire history in two climatic regions of Switzerland. For. Ecol. Manag. 2011, 261, 2188–2199. [Google Scholar] [CrossRef]
  9. Mollicone, D.; Eva, H.D.; Achard, F. Human role in Russian wild fires. Nature 2006, 440, 436–437. [Google Scholar] [CrossRef]
  10. Naderpour, M.; Rizeei, H.M.; Ramezani, F. Forest fire risk prediction: A spatial deep neural network-based framework. Remote Sens. 2021, 13, 2513. [Google Scholar] [CrossRef]
  11. Wu, Z.; Li, M.; Wang, B.; Quan, Y.; Liu, J. Using artificial intelligence to estimate the probability of forest fires in Heilongjiang, northeast China. Remote Sens. 2021, 13, 1813. [Google Scholar] [CrossRef]
  12. Algerian Forest Fires—UCI Machine Learning Repository. Available online: https://archive.ics.uci.edu/dataset/547/algerian+forest+fires+dataset (accessed on 24 October 2024).
  13. Moritz, M.A.; Batllori, E.; Bradstock, R.A.; Gill, A.M.; Handmer, J.; Hessburg, P.F.; Leonard, J.; McCaffrey, S.; Odion, D.C.; Schoennagel, T.; et al. Learning to coexist with wildfire. Nature 2014, 515, 58–66. [Google Scholar] [CrossRef]
  14. Black, F.; Schulze, P.; Unger, B. Efficient Wildland Fire Simulation via Nonlinear Model Order Reduction. Fluids 2021, 6, 280. [Google Scholar] [CrossRef]
  15. Abram, N.J.; Henley, B.J.; Sen Gupta, A.; Lippmann, T.J.R.; Clarke, H.; Dowdy, A.J.; Sharples, J.J.; Nolan, R.H.; Zhang, T.; Wooster, M.J.; et al. Connections of climate change and variability to large and extreme forest fires in southeast Australia. Commun. Earth Environ. 2021, 2, 8. [Google Scholar] [CrossRef]
  16. Jolliffe, I.T.; Cadima, J. Principal component analysis: A review and recent developments. Philos. Trans. R. Soc. A Math. Phys. Eng. Sci. 2016, 374, 20150202. [Google Scholar] [CrossRef]
  17. Ermitão, T.; Páscoa, P.; Trigo, I.; Alonso, C.; Gouveia, C. Mapping the Most Susceptible Regions to Fire in Portugal. Fire 2023, 6, 254. [Google Scholar] [CrossRef]
  18. Wang, Q.; Hao, Y. ALSTM: An attention-based long short-term memory framework for knowledge base reasoning. Neurocomputing 2020, 399, 342–351. [Google Scholar] [CrossRef]
  19. Wang, Y.; Li, H.; Huang, J.; Su, C.; Yang, B.; Qi, C. An improved bar-shaped sliding window CNN tailored to industrial process historical data with applications in chemical operational optimizations. Ind. Eng. Chem. Res. 2019, 58, 21219–21232. [Google Scholar] [CrossRef]
  20. Zhang, L.; Wang, L.; Ji, D.; Xia, Z.; Nan, P.; Zhang, J.; Li, K.; Qi, B.; Du, R.; Sun, Y.; et al. Explainable ensemble machine learning revealing the effect of meteorology and sources on ozone formation in megacity Hangzhou, China. Sci. Total Environ. 2024, 922, 171295. [Google Scholar] [CrossRef] [PubMed]
  21. Iban, M.C.; Sekertekin, A. Machine learning based wildfire susceptibility mapping using remotely sensed fire data and GIS: A case study of Adana and Mersin provinces, Turkey. Ecol. Inform. 2022, 69, 101647. [Google Scholar] [CrossRef]
  22. García, M.V.; Aznarte, J.L. Shapley additive explanations for NO2 forecasting. Ecol. Inform. 2020, 56, 101039. [Google Scholar] [CrossRef]
  23. Yue, W.; Ren, C.; Liang, Y.; Liang, J.; Lin, X.; Yin, A.; Wei, Z. Assessment of wildfire susceptibility and wildfire threats to ecological environment and urban development based on GIS and multi-source data: A case study of Guilin, China. Remote Sens. 2023, 15, 2659. [Google Scholar] [CrossRef]
  24. Encinas, L.H.; White, S.H.; Del Rey, A.M.; Sánchez, G.R. Modelling forest fire spread using hexagonal cellular automata. Appl. Math. Model. 2007, 31, 1213–1227. [Google Scholar] [CrossRef]
  25. Koo, E.; Pagni, P.; Woycheese, J.; Stephens, S.; Weise, D.; Huff, J. A simple physical model for forest fire spread rate. Fire Saf. Sci. 2005, 8, 851–862. [Google Scholar] [CrossRef]
  26. Yassemi, S.; Dragićević, S.; Schmidt, M. Design and implementation of an integrated GIS-based cellular automata model to characterize forest fire behaviour. Ecol. Model. 2008, 210, 71–84. [Google Scholar] [CrossRef]
  27. Sun, L.; Xu, C.; He, Y.; Zhao, Y.; Xu, Y.; Rui, X.; Xu, H. Adaptive forest fire spread simulation algorithm based on cellular automata. Forests 2021, 12, 1431. [Google Scholar] [CrossRef]
  28. Li, L.; Sali, A.; Noordin, N.K.; Ismail, A.; Hashim, F. Prediction of peatlands forest fires in Malaysia using machine learning. Forests 2023, 14, 1472. [Google Scholar] [CrossRef]
  29. Meng, Q.; Lu, H.; Huai, Y.; Xu, H.; Yang, S. Forest fire spread simulation and fire extinguishing visualization research. Forests 2023, 14, 1371. [Google Scholar] [CrossRef]
  30. Farguell, A.; Cortés, A.; Margalef, T.; Miró, J.R.; Mercader, J. Scalability of a multi-physics system for forest fire spread prediction in multi-core platforms. J. Supercomput. 2019, 75, 1163–1174. [Google Scholar] [CrossRef]
  31. Sun, X.; Li, N.; Chen, D.; Chen, G.; Sun, C.; Shi, M.; Gao, X.; Wang, K.; Hezam, I.M. A Forest Fire Prediction Model Based on Cellular Automata and Machine Learning. IEEE Access 2024, 12, 55389–55403. [Google Scholar] [CrossRef]
  32. Li, X.; Zhang, M.; Zhang, S.; Liu, J.; Sun, S.; Hu, T.; Sun, L. Simulating Forest Fire Spread with Cellular Automation Driven by a LSTM Based Speed Model. Fire 2022, 5, 13. [Google Scholar] [CrossRef]
  33. Xu, Y.; Li, D.; Ma, H.; Lin, R.; Zhang, F. Modeling Forest Fire Spread Using Machine Learning-Based Cellular Automata in a GIS Environment. Forests 2022, 13, 1974. [Google Scholar] [CrossRef]
  34. Tengteng, L.; Jiyan, Y.; Zhaorong, O.; Qiang, Y.; Yong, L.; Qiuhua, W. Comprehensive assessment and spatial pattern study on forest fire risk in Yunnan Province. China Saf. Sci. J. 2021, 31, 167. [Google Scholar] [CrossRef]
  35. Wei, S.; Luo, S.; Luo, B.; Li, X.; Wang, Z.; Wu, Z.; Zhou, Y.; Zhong, Y.; Li, Q. Occurrence regularity of forest fire under the background of climate change. For. Environ. Sci. 2020, 36, 133–143. [Google Scholar]
  36. Tian, C.; Su, Z.; Yang, X.; Guo, F. Investigations on spatial distribution and driving factors of forest fire in western Fujian. For. Environ. 2017, 37, 88–94. [Google Scholar]
  37. Xiao, Y.; Ji, P. Predicting forest fire occurrence based on zero-inflated negative binomial model using Bayesian method. J. Cent. South Univ. For. Technol. 2021, 41, 49–56. [Google Scholar] [CrossRef]
  38. Gao, B.; Chen, X.; Shan, Z.H.; Han, X.Y.; Shan, Y.L.; Yin, S.N.; Yu, B. Prediction of forest fire probability in Daxing’an Mountains area based on Logistic regression model. J. Saf. Sci. Technol. 2022, 18, 163–168. [Google Scholar]
  39. Preisler, H.K.; Westerling, A.L. Statistical Model for Forecasting Monthly Large Wildfire Events in Western United States. J. Appl. Meteorol. Climatol. 2007, 46, 1020–1030. [Google Scholar] [CrossRef]
  40. Wang, Y.; Zhao, L.; Yang, X.; Liang, L.; Yuan, X.; Ren, L.; Zhang, H. Study on the Impact of Atmospheric and Topographical Environments on Wildfire Spread: A Case Study of a Forest Fire in Shanxi Province. Disaster Sci. 2023, 38, 118–125. [Google Scholar]
  41. Singh, K.R.; Neethu, K.; Madhurekaa, K.; Harita, A.; Mohan, P. Parallel SVM model for forest fire prediction. Soft Comput. Lett. 2021, 3, 100014. [Google Scholar] [CrossRef]
  42. Majid, S.; Alenezi, F.; Masood, S.; Ahmad, M.; Gündüz, E.S.; Polat, K. Attention based CNN model for fire detection and localization in real-world images. Expert Syst. Appl. 2022, 189, 116114. [Google Scholar] [CrossRef]
  43. Ding, Y.; Zhu, Y.; Feng, J.; Zhang, P.; Cheng, Z. Interpretable spatio-temporal attention LSTM model for flood forecasting. Neurocomputing 2020, 403, 348–359. [Google Scholar] [CrossRef]
  44. Yu, Y.; Kim, Y.-J. Attention-LSTM-attention model for speech emotion recognition and analysis of IEMOCAP database. Electronics 2020, 9, 713. [Google Scholar] [CrossRef]
  45. Lin, X.; Li, Z.; Chen, W.; Sun, X.; Gao, D. Forest fire prediction based on long-and short-term time-series network. Forests 2023, 14, 778. [Google Scholar] [CrossRef]
  46. Zhu, J.; Liu, X.; Cheng, P.; Wang, M.; Huang, Y. Unveiling spatiotemporal patterns of wildfire risk: A transformer-based earth system analysis. Clim. Dyn. 2025, 63, 21. [Google Scholar] [CrossRef]
  47. Hancock, J.T.; Khoshgoftaar, T.M.; Liang, Q. A problem-agnostic approach to feature selection and analysis using shap. J. Big Data 2025, 12, 12. [Google Scholar] [CrossRef]
  48. Abdollahi, A.; Pradhan, B. Explainable artificial intelligence (XAI) for interpreting the contributing factors feed into the wildfire susceptibility prediction model. Sci. Total Environ. 2023, 879, 163004. [Google Scholar] [CrossRef]
  49. Sanchez-Guzman, G.; Velasquez, W.; Alvarez-Alvarado, M.S. Modeling a simulated forest to get burning times of tree species using a digital twin. In Proceedings of the 2022 IEEE 12th Annual Computing and Communication Workshop and Conference (CCWC), Las Vegas, NV, USA, 26–29 January 2022; pp. 639–643. [Google Scholar]
  50. Huang, Y.; Li, J.; Zheng, H. Modeling of Wildfire Digital Twin: Research Progress in Detection, Simulation, and Prediction Techniques. Fire 2024, 7, 412. [Google Scholar] [CrossRef]
  51. Zhong, C.; Cheng, S.; Kasoar, M.; Arcucci, R. Reduced-order digital twin and latent data assimilation for global wildfire prediction. Nat. Hazards Earth Syst. Sci. 2023, 23, 1755–1768. [Google Scholar] [CrossRef]
  52. Dourvas, N.I.; Papagianni, A.; Koulalis, I.; Ioannidis, K.; Vrochidis, S.; Kompatsiaris, I. An early-warning system for fire spreading by monitoring simple climate conditions and combining Cellular Automata with Digital Twins. In Proceedings of the 2022 IEEE International Workshop on Metrology for Living Environment (MetroLivEn), Cosenza, Italy, 25–27 May 2022; pp. 252–257. [Google Scholar] [CrossRef]
  53. Ghodrat, M.; Shakeriaski, F.; Fanaee, S.A.; Simeoni, A. Software-Based Simulations of Wildfire Spread and Wind-Fire Interaction. Fire 2023, 6, 12. [Google Scholar] [CrossRef]
  54. Eghdami, M.; Juliano, T.W.; Jiménez, P.A.; Kosovic, B.; Castellnou, M.; Kumar, R.; Vila-Guerau de Arellano, J. Characterizing the Role of Moisture and Smoke on the 2021 Santa Coloma de Queralt Pyroconvective Event Using WRF-Fire. J. Adv. Model. Earth Syst. 2023, 15, e2022MS003288. [Google Scholar] [CrossRef]
  55. Huang, J.; Lucash, M.S.; Scheller, R.M.; Klippel, A. Walking through the forests of the future: Using data-driven virtual reality to visualize forests under climate change. Int. J. Geogr. Inf. Sci. 2021, 35, 1155–1178. [Google Scholar] [CrossRef]
  56. Zheng, H.; Wang, J.; Wang, S.; Gu, W. Educational application of cognitive digital twins: Connotation, Dilemma and countermeasures. Mod. Distance Educ. 2021, 01, 13–23. [Google Scholar] [CrossRef]
  57. Tao, F.; Xiao, B.; Qi, Q.; Cheng, J.; Ji, P. Digital twin modeling. J. Manuf. Syst. 2022, 64, 372–389. [Google Scholar] [CrossRef]
  58. Tao, F.; Qi, Q. Make more digital twins. Nature 2019, 573, 490–491. [Google Scholar] [CrossRef]
  59. Li, H.; Tao, F.; Wang, H.; Song, W.; Zhang, Z.; Fan, B.B.; Wu, C.; Li, Y.; Li, L.L.; Wen, X.Y.; et al. Integration Framework and Key Technologies of Complex Product Design-Manufacturing Based on Digital Twin. Comput. Integr. Manuf. Syst. 2019, 25, 1320–1336. [Google Scholar]
  60. Cimino, C.; Negri, E.; Fumagalli, L. Review of digital twin applications in manufacturing. Comput. Ind. 2019, 113, 103130. [Google Scholar] [CrossRef]
  61. Yeh, A.G. From urban modelling, GIS, the digital, intelligent, and the smart city to the digital twin city with AI. Environ. Plan. B Urban Anal. City Sci. 2024, 51, 1085–1088. [Google Scholar] [CrossRef]
  62. Ferré-Bigorra, J.; Casals, M.; Gangolells, M. The adoption of urban digital twins. Cities 2022, 131, 103905. [Google Scholar] [CrossRef]
  63. Elayan, H.; Aloqaily, M.; Guizani, M. Digital twin for intelligent context-aware IoT healthcare systems. IEEE Internet Things J. 2021, 8, 16749–16757. [Google Scholar] [CrossRef]
  64. Liu, Y.; Zhang, L.; Yang, Y.; Zhou, L.; Ren, L.; Wang, F.; Liu, R.; Pang, Z.; Deen, M.J. A novel cloud-based framework for the elderly healthcare services using digital twin. IEEE Access 2019, 7, 49088–49101. [Google Scholar] [CrossRef]
  65. Sun, T.; He, X.; Song, X.; Shu, L.; Li, Z. The digital twin in medicine: A key to the future of healthcare? Front. Med. 2022, 9, 907066. [Google Scholar] [CrossRef]
  66. Aydemir, H.; Zengin, U.; Durak, U. The digital twin paradigm for aircraft review and outlook. In Proceedings of the AIAA Scitech 2020 Forum, Orlando, FL, USA, 6–10 January 2020; p. 553. [Google Scholar] [CrossRef]
  67. Kairat, K.; Ildar, P.; Karygash, A.; Saule, B.; Indira, K.; Markhaba, K.; Aizhan, B. Digital Twins Technology in the Educational Process of the Aviation Equipment Repair. Indones. J. Electr. Eng. Comput. Sci 2023, 32, 752–762. [Google Scholar] [CrossRef]
  68. Qiu, H.; Zhang, H.; Lei, K.; Zhang, H.; Hu, X. Forest digital twin: A new tool for forest management practices based on Spatio-Temporal Data, 3D simulation Engine, and intelligent interactive environment. Comput. Electron. Agric. 2023, 215, 108416. [Google Scholar] [CrossRef]
  69. Cirulis, A.; Taube, L.; Erics, Z. Automated generation of digital twin in virtual reality for interaction with specific nature ecosystem. In Proceedings of the International Conference on Human-Computer Interaction, Virtual, 26 June–1 July 2022; pp. 187–202. [Google Scholar] [CrossRef]
  70. The Canadian Forest Fire Weather Index (FWI) System. Available online: https://cwfis.cfs.nrcan.gc.ca/background/summary/fwi (accessed on 23 April 2025).
  71. Xin, X.-Y.; Jiang, H.; Zhou, G.-M.; Yu, S.-Q.; Wang, Y.-H. The principle and application of the Canadian Forest Fire Hazard Climate Index (FWI) system. J. Zhejiang Agric. For. Univ. 2011, 28, 314–318. [Google Scholar]
  72. Abdi, H.; Williams, L.J. Principal component analysis. Wiley Interdiscip. Rev. Comput. Stat. 2010, 2, 433–459. [Google Scholar] [CrossRef]
  73. Souane, A.A.; Khurram, A.; Huang, H.; Shu, Z.; Feng, S.; Belgherbi, B.; Wu, Z. Utilizing Machine Learning and Geospatial Techniques to Evaluate Post-Fire Vegetation Recovery in Mediterranean Forest Ecosystem: Tenira, Algeria. Forests 2025, 16, 53. [Google Scholar] [CrossRef]
  74. Lundberg, S.M.; Lee, S.-I. A unified approach to interpreting model predictions. Adv. Neural Inf. Process. Syst. 2017, 30, 4768–4777. [Google Scholar]
  75. Molnar, C. Interpretable Machine Learning: A Guide for Making Black Box Models Explainable, 3rd ed.; 2025; Available online: https://christophm.github.io/interpretable-ml-book (accessed on 24 May 2025).
  76. Heidari, A.; Khovalyg, D. Short-term energy use prediction of solar-assisted water heating system: Application case of combined attention-based LSTM and time-series decomposition. Sol. Energy 2020, 207, 626–639. [Google Scholar] [CrossRef]
  77. Huang, J.Q.; Qin, L.X. Study on the correlation prediction of temperature and rainfall using alstm model. J. Guangxi Univ. (Nat. Sci. Ed.) 2021, 46, 1024–1035. [Google Scholar] [CrossRef]
  78. Wenfeng, S. In-Depth Understanding of Natural Language Processing: From Deep Learning to Large Model Applications, 1st ed.; Tsinghua University Press: Beijing, China, 2025. [Google Scholar]
  79. Zohdi, T. A machine-learning framework for rapid adaptive digital-twin based fire-propagation simulation in complex environments. Comput. Methods Appl. Mech. Eng. 2020, 363, 112907. [Google Scholar] [CrossRef]
  80. Wu, Z.; Wang, B.; Li, M.; Tian, Y.; Quan, Y.; Liu, J. Simulation of forest fire spread based on artificial intelligence. Ecol. Indic. 2022, 136, 108653. [Google Scholar] [CrossRef]
  81. Rui, X.; Hui, S.; Yu, X.; Zhang, G.; Wu, B. Forest fire spread simulation algorithm based on cellular automata. Nat. Hazards 2018, 91, 309–319. [Google Scholar] [CrossRef]
  82. Wang, Z. Current forest fire danger rating system. J. Nat. Disasters 1992, 1, 39–44. [Google Scholar] [CrossRef]
  83. Zhang, X.; Liu, P. Research on improvement of wang zhengfei’s forest fire spread model. J. Shandong For. Sci. Technol. 2020, 50, 1–6. [Google Scholar]
  84. Gabriel, K.R. The biplot graphic display of matrices with application to principal component analysis. Biometrika 1971, 58, 453–467. [Google Scholar] [CrossRef]
  85. Xiang, Q.; Wang, X.; Song, Y.; Lei, L. ISONet: Reforming 1DCNN for aero-engine system inter-shaft bearing fault diagnosis via input spatial over-parameterization. Expert Syst. Appl. 2025, 277, 127248. [Google Scholar] [CrossRef]
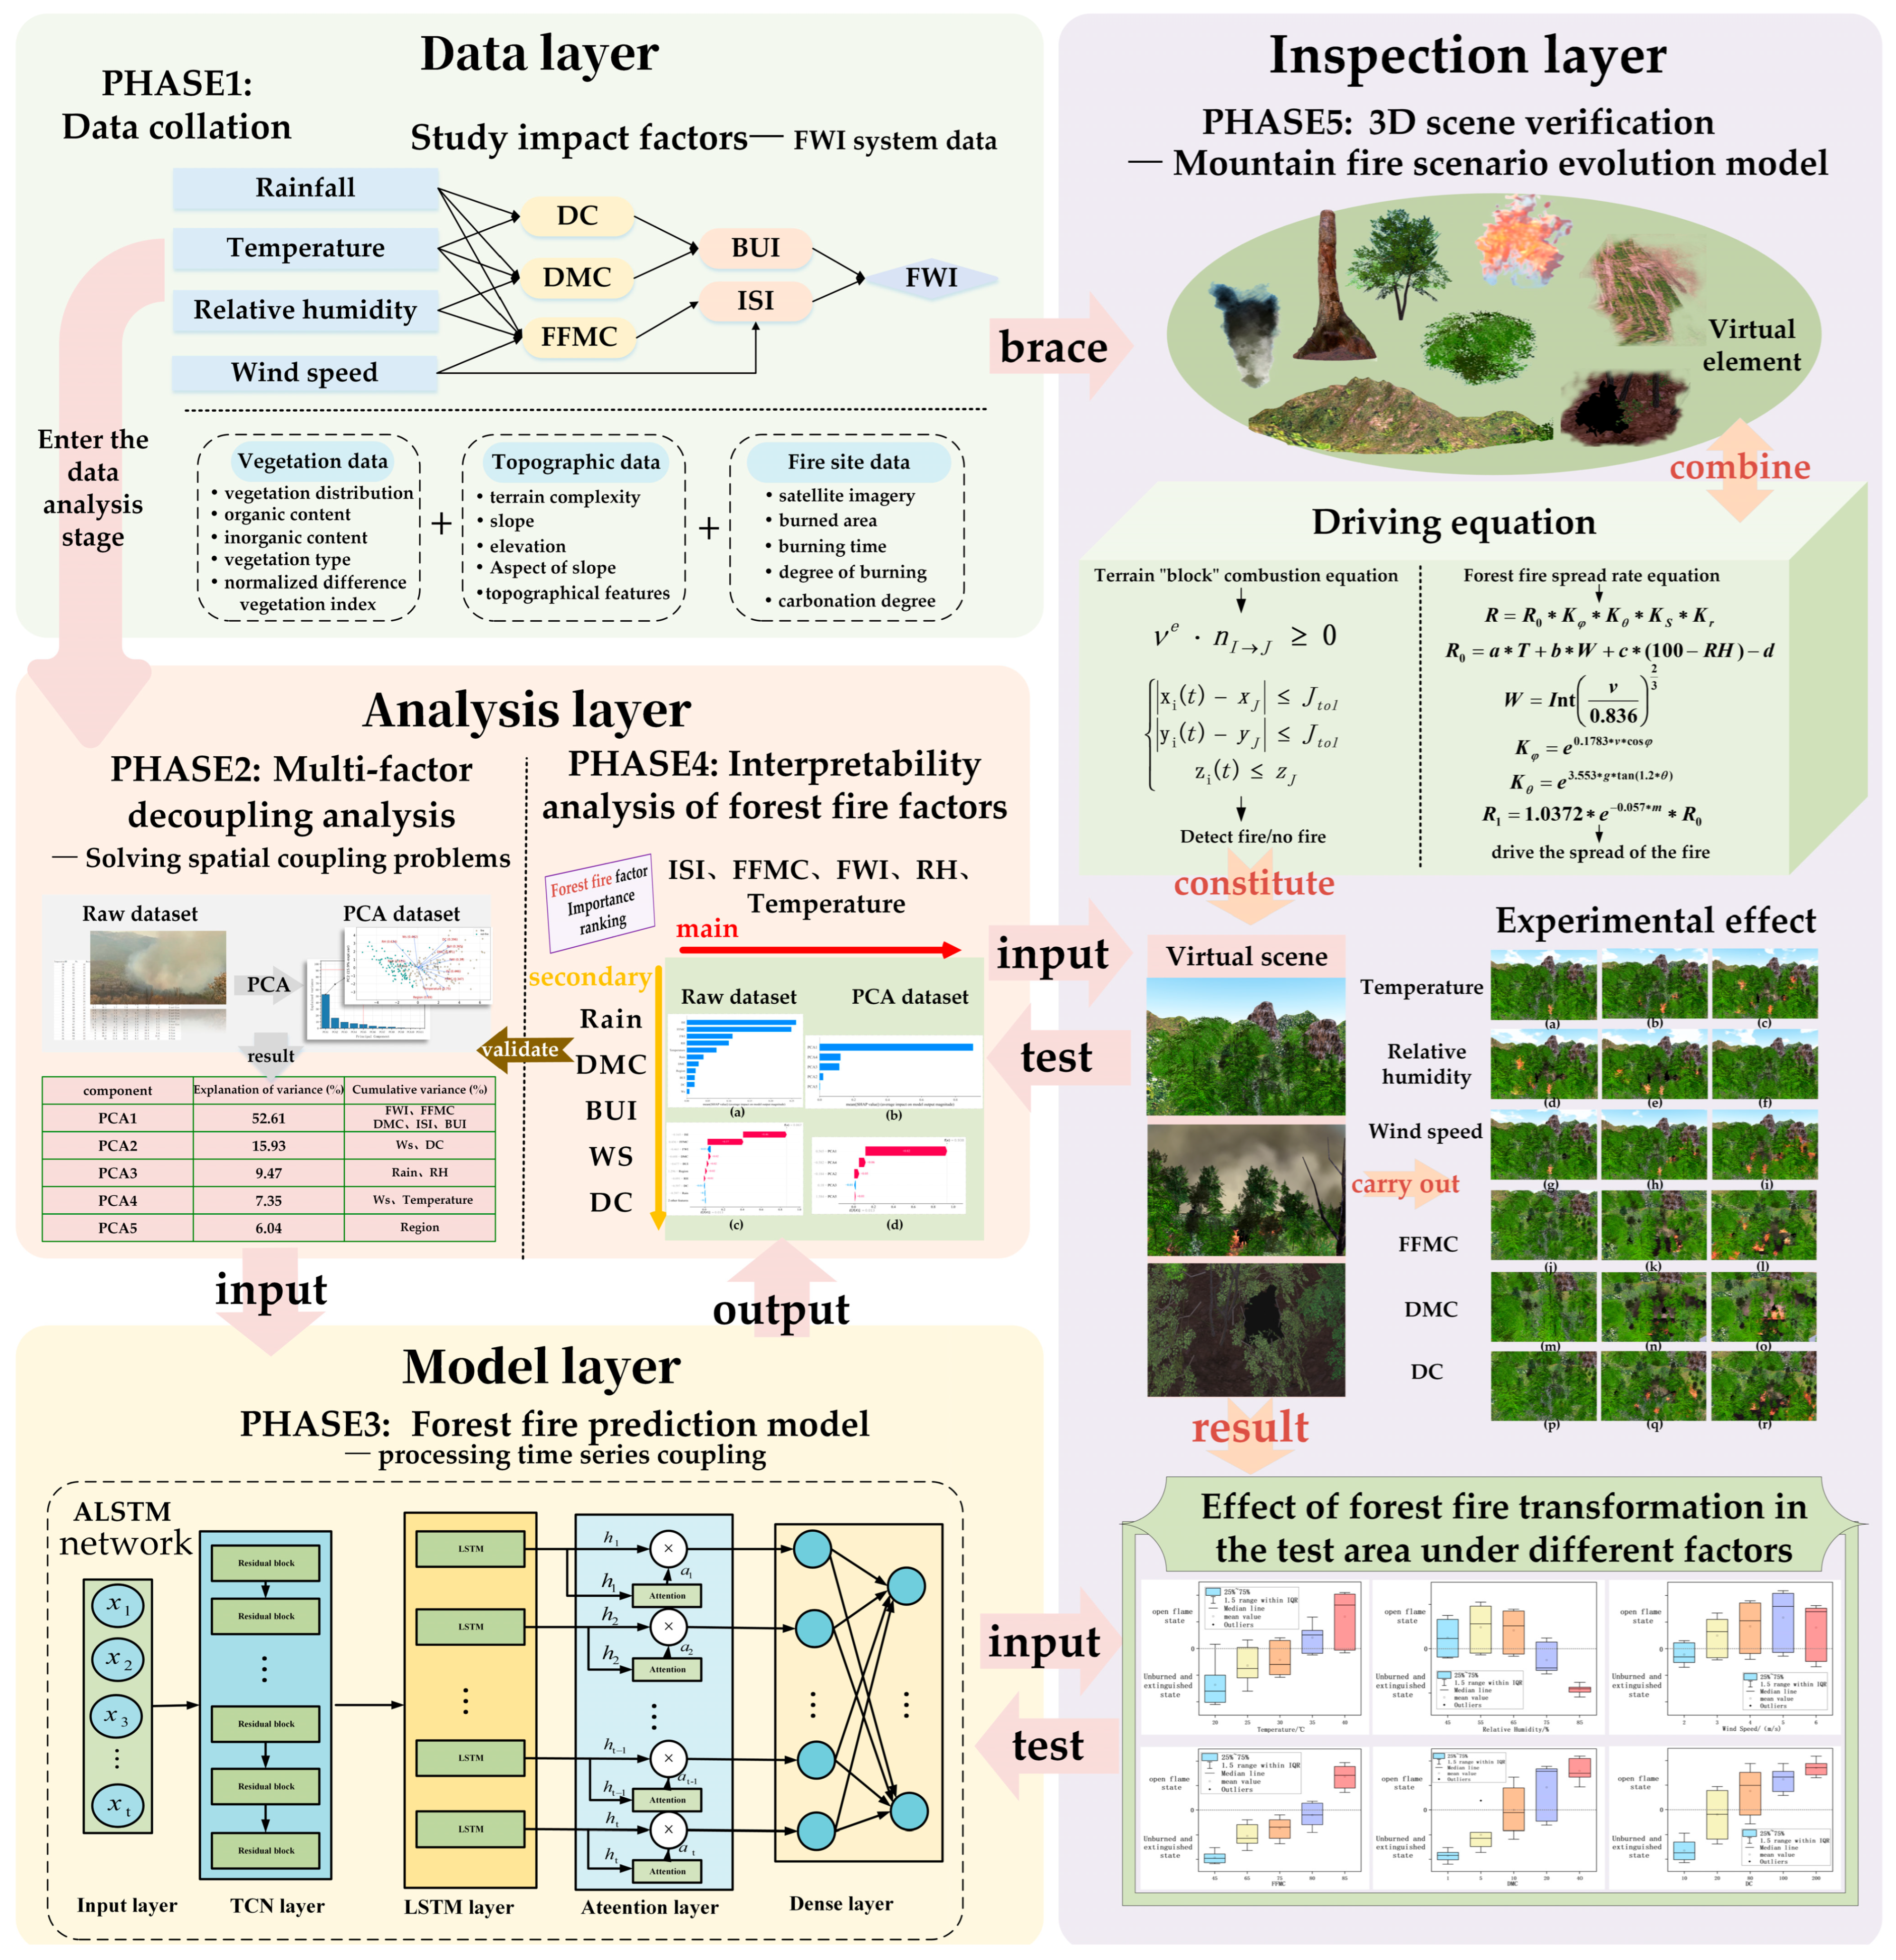
Figure 1. Research framework.
Forests 16 01546 g001
Figure 2. Encoder–decoder architecture with an attention mechanism.
Forests 16 01546 g002
Figure 3. Training loss and accuracy curves for different step sizes. (a) Loss decline curve on the training set; (b) Loss fluctuation on the validation set; (c) Accuracy enhancement on the training set; (d) Accuracy metrics on the validation set; (e) Improved precision on the training set; (f) Performance of precision on the validation set.
Forests 16 01546 g003
Figure 4. Losses at various learning rates.
Forests 16 01546 g004
Figure 5. Comparison of training results of five optimisers. (a) Training and Validation Accuracy; (b) Training and Validation Loss; (c) Test Set Metrics Comparison; (d) Validation Loss Comparison.
Forests 16 01546 g005aForests 16 01546 g005b
Figure 6. Digital twin virtual environment building process.
Forests 16 01546 g006
Figure 7. Explained variance plot of PCA.
Forests 16 01546 g007
Figure 8. Bi-plots of PCA characteristic variables and sample distribution.
Forests 16 01546 g008
Figure 9. Graphical outputs of feature variable SHAP. (a) Bar plot for the original dataset; (b) bar plot for the PCA dataset; (c) dependency plot for the original dataset; (d) dependency plot for the PCA dataset.
Forests 16 01546 g009
Figure 10. Loss function and prediction curve. (a) Training curve with unprocessed complete feature data; (b) training curve post-dimensionality reduction by PCA.
Forests 16 01546 g010
Figure 11. Evaluation metrics curve for PCA data training model. (a) Precision vs. Threshold; (b) Recall vs. Threshold; (c) F1-Score vs. Threshold; (d) Precision-Recall Curve.
Forests 16 01546 g011
Figure 12. Effect of forest fire transformation in the test area under different meteorological factors. (ad) Temperature: (a) A single flame appears at 20 °C, (b) three flames appear at 30 °C, (c) multiple flames appear at 40 °C, (d) combustion occurs at 20 °C, 25 °C, 30 °C, 35 °C, and 40 °C; (eh) RH: (e) At 45%, there is a large-scale open flame; (f) At 65%, there is a large-scale open flame; (g) At 85%, there is no combustion; (h) combustion occurs at 45%, 55%, 65%, 75%, and 85%; (il) Wind speed: (i) At 2 m/s, one fire point appears; (j) At 4 m/s, open flames appear in the downwind area; (k) At 6 m/s, large-scale open flames appear in the downwind area; (l) combustion occurs at 2 m/s, 3 m/s, 4 m/s, 5 m/s, and 6 m/s.
Forests 16 01546 g012
Figure 13. Forest fire transformation effects in the test area under the impact of different combustible factors. (a) No combustion occurs when FFMC = 45; (b) Fire points appear when FFMC = 80; (c) Large-scale open flames appear when FFMC = 85; (d) Combustion states at FFMC values of 45, 65, 75, 80, and 85; (e) No combustion occurs when DMC = 1; (f) Multiple fire points appear when DMC = 10; (g) Large-scale open flames appear when DMC = 40; (h) Combustion states at DMC values of 1, 5, 10, 20, and 40; (i) No combustion occurs when DC = 10; (j) Small-scale open flames appear when DC = 80; (k) Large-scale open flames appear when DC = 200; (l) Combustion states at DC values of 10, 20, 80, 100, and 200.
Forests 16 01546 g013
Table 1. Classification of forest fire impact factors (grouped by categories, not ranked by importance).
ConsiderationsMeteorological FactorCombustibility FactorTopographic FactorAnthropogenic FactorsVegetation FactorDerivatives Index
(FWI System)
Impact factorTemperatureFine Fuel Moisture Code (FFMC)SlopeIgnition SourcesNormalized Differential Vegetation Index (NDVI)Initial Spread Index (ISI)
Relative Humidity (RH)Duff Moisture Code (DMC)Slope directionFire Managementvegetation typeBuildup Index (BUI)
Wind Speed (WS)Drought Code (DC)ElevationPopulation Densityvegetation coverFire Weather Index (FWI)
Rainfall (Rain)Type of combustibleTopography ComplexityDistance from the rivervegetative diversity
Atmospheric PressureFuel Loadterrain roughnessDistance from roadvegetation
Table 2. ALSTM network explanation.
Layer NameTypologyParameters/SettingsOutput Shape ExtrapolationFunction
input_layerinput layer-(None, 1, 7)Receives preprocessed time-series data after PCA dimensionality reduction
LSTMLSTM layerUnits = 64, return_sequences = True, Activation = tanh(None, 1, 64)Captures sequential dependencies and extracts temporal features via gating mechanisms
Dense_1full connectivity layerUnits = 1, Activation = tanh(None, 1, 1)Computes raw attention weight scores
Activationactivation layerActivation = softmax(None, 1, 1)Normalizes attention weights into a probability distribution
Multiplyelement-by-element multiplication-(None, 1, 64)Applies attention weights to LSTM outputs, emphasizing key features
GlobalAveragePooling1DGlobal average pooling-(None,64)Reduces temporal dimension while preserving feature information
Dense_2full connectivity layerUnits = 64, Activation = relu(None,64)Performs nonlinear transformation and advanced feature mapping
Dropoutstochastic inactivationRate = 0.3(None,64)Randomly deactivates 30% of neurons to prevent overfitting
Dense_3input layerUnits = 1, Activation = sigmoid(None, 1)Produces binary classification probability for fire occurrence
Table 3. Comparison of optimiser robustness.
OptimiserAccuracyPrecisionRecall
Adam96.72%0.99830.9691
SGD96.10%0.91670.9856
RMSprop96.56%0.92480.9741
Adagrad96.45%0.91560.9826
Nadam96.06%0.92110.9778
Table 4. State transition logic table.
State of AffairsTrigger ConditionInteraction Events and Scene Effects
Unburned stateEnvironmental parameters do not satisfy combustion conditions and topographic “block” impedes combustion equationVegetation retains its normal textures and colors; no flame particles are generated, resulting in no smoke effect in the scene; the three-dimensiona model is displayed as a static natural environment.
Open flame stateEnvironmental parameters satisfy combustion conditions, and no topographic “block” impedes combustion equationActivation of the flame particle system occurs, the flame model expands as temperature rises, and smoke particles are generated concurrently; the vegetation model dynamically transitions to a burning texture, enhanced by particle effects such as sparks and splashes.
extinguished stateEnvironmental parameters no longer satisfy combustion conditions or topographic “block” impedes combustion equationFlame particles gradually decay and vanish, and smoke concentration diminishes; the vegetation model updates to a “burnt” texture, retaining indications of possible rekindling if combustible material remains unburnt.
Table 5. PCA summary table.
IngredientExplanation of Variance (%)Cumulative Variance (%)Main Environmental Impacts
PCA152.6152.61FWI, FFMC, DMC, ISI, BUI
PCA215.9368.54Ws, DC
PCA39.4778.01Rain, RH
PCA47.3585.36Ws, Temperature
PCA56.0491.40Region
Table 6. Performance Evaluation of ALSTM, LSTM, and LR.
ModelPrecisionAccuracyRecallF1PR-AUC
ALSTM0.9782 (±0.0237)0.9571 (±0.0213)0.9461 (±0.0373)0.9612 (±0.0196)0.9945 (±0.0048)
LSTM0.9634 (±0.0434)0.9449 (±0.0205)0.9398 (±0.0402)0.9499 (±0.0164)0.9926 (±0.0068)
LR0.9865 (±0.0208)0.9224 (±0.0238)0.8710 (±0.0396)0.9246 (±0.0243)0.9893 (±0.0087)
Table 7. Statistical Significance Analysis of Model Performance Comparison (Based on Paired t-tests from 10 Independent Experiments).
MetricComparisonMean Difference95% CI Lower95% CI Upperp-Value
AccuracyALSTM vs. LSTM0.0122448980.0018591920.0263489880.001126189 *
AccuracyALSTM vs. LR0.0346938780.0177661710.0516215840.001225564 *
PrecisionALSTM vs. LSTM0.0147762610.0097899910.0393425130.002718957 *
PrecisionALSTM vs. LR−0.0082631510.0069968950.0104705930.004445289 *
RecallALSTM vs. LSTM0.006283075−0.0114138250.0239799760.442580109
RecallALSTM vs. LR0.075085760.0450200520.1051514690.000313807 *
F1 ScoreALSTM vs. LSTM0.0113464720.001635060.0243280050.00941261 *
F1 ScoreALSTM vs. LR0.0366250920.018615640.0546345430.001289685 *
PR-AUCALSTM vs. LSTM0.0019099560.0009949910.0048149040.001099468 *
PR-AUCALSTM vs. LR0.0052377260.0001133480.0103621040.046070699 *
* Indicates statistical significance at the α = 0.05 level.
Disclaimer/Publisher’s Note: The statements, opinions and data contained in all publications are solely those of the individual author(s) and contributor(s) and not of MDPI and/or the editor(s). MDPI and/or the editor(s) disclaim responsibility for any injury to people or property resulting from any ideas, methods, instructions or products referred to in the content.