Article

Ecosystem Health Assessment and Zoning at the County Scale: Evidence from Fujian, Southern China’s Key Forest Region

1
College of Digital Economy, Fujian Agriculture and Forestry University, Anxi 362400, China
2
College of Economics and Management, Fujian Agriculture and Forestry University, Fuzhou 350002, China
*
Author to whom correspondence should be addressed.
Forests 2025, 16(10), 1518; https://doi.org/10.3390/f16101518
Submission received: 19 August 2025 / Revised: 13 September 2025 / Accepted: 24 September 2025 / Published: 26 September 2025
(This article belongs to the Section Forest Ecology and Management)

Abstract

Investigating the spatiotemporal distribution patterns of regional ecosystem health and the methods for optimizing their zoning is essential for enhancing ecosystem management and sustainable development. This study takes Fujian Province, a pivotal forest region in southern China, as the research object to establish a county-level ecosystem health evaluation framework grounded in the vitality–organization–resilience–ecosystem (VORS) model. It further conducts a comprehensive spatial–temporal analysis of ecosystem health dynamics from 2000 to 2020 and explores ecological management zoning and optimization strategies. The results indicate that (1) from 2000 to 2020, the overall ecosystem health level in Fujian Province maintained a relatively high status and exhibited a steady upward trajectory, with the index rising from 0.4694 in 2000 to 0.4762 in 2010, and further increasing to 0.4865 in 2020. (2) The health of ecosystems in Fujian exhibits significant geographical autocorrelation and aggregation, characterized mostly by high–high and low–low clusters. Typically, it has a geographical distribution characterized by elevated values in the northwest and diminished values in the southeast. (3) In light of the present condition and temporal dynamics of ecosystem health, the study classifies Fujian’s counties into three ecological management categories—conservation, stabilization, and reshaping zones—and puts forward tailored optimization measures for each region. The methodology employed in this study provides a general framework for ecosystem health assessment, which can offer useful references and insights for forest ecosystem health evaluation and refined, zone-specific ecological management in forest regions.

1. Introduction

Ecosystems are complex, interactive systems whose interdependent components sustain ecological functions and deliver essential services to human society, forming a fundamental basis for sustainable development [1]. Maintaining regional ecosystem health (EH) is thus critical not only for socio-economic sustainability but also for safeguarding human well-being. Yet, under the dual pressures of intensified human activities and accelerating climate change, many regions worldwide have experienced marked ecosystem degradation. For example, in China, many impoverished households in ecologically fragile areas have long depended on forests for fuel, food, and income, and such livelihood reliance has frequently led to deforestation and forest degradation, reflecting the vicious cycle between poverty and forest ecosystem decline [2]; the Dadabad forest region in Iran is under increasing pressure from degradation and fragmentation amid intensified human activities such as urbanization, agricultural expansion, and land use change, resulting in heightened ecological vulnerability and biodiversity loss [3]; And large areas of Central and Eastern Europe have suffered severe forest degradation under massive spruce bark beetle outbreaks, which are intensified by climate change and associated fungal infestations [4]. Within this context, analyzing the spatiotemporal evolution of regional ecosystem health and developing corresponding zoning strategies are essential for advancing science-based management. In particular, the approach adopted in this study can offer valuable insights for refined, zone-specific management in forested and other ecologically significant regions.
EH denotes the ability of ecosystems, at defined spatial and temporal scales, to sustain structural integrity and functional balance amid human disturbances, ensuring the long-term stability of ecosystem services (ES) [5,6]. Regarding evaluation methods, existing studies mainly employ two approaches: indicator-system methods [7,8,9,10,11] and indicator-species approaches [12,13]. The indicator-species approach is generally suitable for single ecosystems, assessing EH indirectly through species abundance, diversity, or community structure, but its applicability is limited. By contrast, indicator-system methods integrate multiple ecological metrics into a theoretical framework, providing a more comprehensive and objective basis for regional EH assessment, and are therefore more widely applied. For example, in forest ecosystems, these methods often employ indicators such as NDVI, stand structure, carbon storage, soil retention, and water yield, which together capture both ecological integrity and the provision of forest-based ecosystem services [14]. Commonly used indicator-based frameworks include the Pressure–State–Response (PSR) model [15,16], the Driving–Pressure–State–Impact–Response (DPSIR) model [17], the Vitality–Organization–Resilience (VOR) model [18,19], and the VORS model [20]. While PSR and DPSIR are effective in evaluating ecosystem conditions and external pressures, they overlook the capacity of ecosystems to sustain service provision and support human well-being. The VORS framework addresses this gap by explicitly incorporating ecosystem service (ES) indicators—representing the benefits humans derive from nature—into the assessment. Its relatively stable structure enables a more systematic and holistic evaluation, which has led to its broad application in regional studies of watersheds [21,22], urban agglomerations [23,24], and islands [25].
With growing attention to ecological protection and sustainable development, zonal management of EH has become a major focus in ecology and environmental science. Increasing academic interest in ecological restoration zoning has generated diverse management strategies and policy guidance, thereby advancing regional ecological governance [26,27,28]. Most existing studies on EH zoning have concentrated on meso- and macro-scales, including national-level ecological divisions based on ecological sensitivity [26], ecosystem service (ES) supply-demand relationships [27], and trade-offs and synergies among ES [28]. These efforts have established differentiated zoning strategies and provided a scientific basis for more refined ecosystem governance. For instance, Bai et al. [26] identified key ES such as water retention and soil conservation, mapped their spatial distribution, and delineated ecological redlines based on ecological sensitivity and functional importance, which were then integrated with land use planning to guide differentiated management. Lyu et al. [27] analyzed ES supply–demand mismatches and classified the Yellow River urban belt in Ningxia into four zones: ecological protection, restoration, development, and coordination. Huang et al. [28] emphasized ES trade-offs and divided Fujian Province into four functional zones—ecological restoration, control, resilient development, and conservation—while proposing tailored zoning strategies to balance ecological protection with development.
In summary, research on ecosystem health assessment has often concentrated on regions such as urban agglomerations and watersheds, with analytical scales mainly conducted at the provincial and prefectural levels, while county-scale studies in key forest regions have received comparatively less attention. Because ecosystems differ in type, structure, and function, their EH conditions and trajectories vary, making county-level analysis important for diagnosing localized pressures and informing targeted management strategies. Fujian Province in southeastern China is a key forest region in the south, functioning as an important ecological barrier with one of the highest forest coverage rates nationwide and exceptional biodiversity. Its forest ecosystems not only underpin regional ecological security but also play an indispensable role in carbon sequestration, climate regulation, soil and water conservation, and habitat maintenance, making the province a representative area for advancing research on forest ecosystem health and sustainable management. Nevertheless, rapid economic growth and urbanization have intensified human pressures, driving biodiversity loss, soil erosion, and forest degradation, which accentuate the urgency of conducting ecosystem health assessments in this key forest region. To address these challenges, this study applies the VORS model to construct a county-level EH assessment framework for Fujian. EH is evaluated in 2000, 2010, and 2020, and the province is classified into three ecological management zones—conservation, stable, and reshaping areas—based on EH status and evolution. Differentiated strategies are then proposed to optimize ecological management, providing theoretical support and practical guidance for localized restoration and policy-making. Overall, this study develops a generalizable framework for ecosystem health assessment, which not only offers methodological references for the construction of forest ecosystem health evaluation systems but also provides strategic insights for refined and science-based ecological zoning management in forest regions.

2. Materials and Methods

2.1. Study Area

Fujian Province (23°33′–28°20′ N, 115°50′–120°40′ E) is located on China’s southeastern coast, with an area of around 124,000 square kilometers, or about 1.3% of the nation’s total land area (Figure 1). Fujian Province is a key forest region in southern China with significant ecological importance. According to the 2024 Forestry Bulletin, the province maintained a forest coverage rate of 65.12%, ranking among the highest nationwide. In 2024, afforestation reached 79,500 ha, including 2300 ha of barren hill planting, 50,500 ha of site regeneration, and 19,500 ha of low-yield forest improvement. At the same time, 1267.17 km2 of soil erosion control was implemented, while urban greening expanded with 1999 ha of new green space, a green coverage rate of 40.9%, and 492 ha of new parks, providing 16.46 m2 of parkland per capita. Collectively, these indicators demonstrate that Fujian not only serves as an important timber and biodiversity base but also functions as a critical ecological barrier in southern China, where the maintenance of forest ecosystem health is fundamental to regional ecological security and sustainable development.

2.2. Research Framework Construction

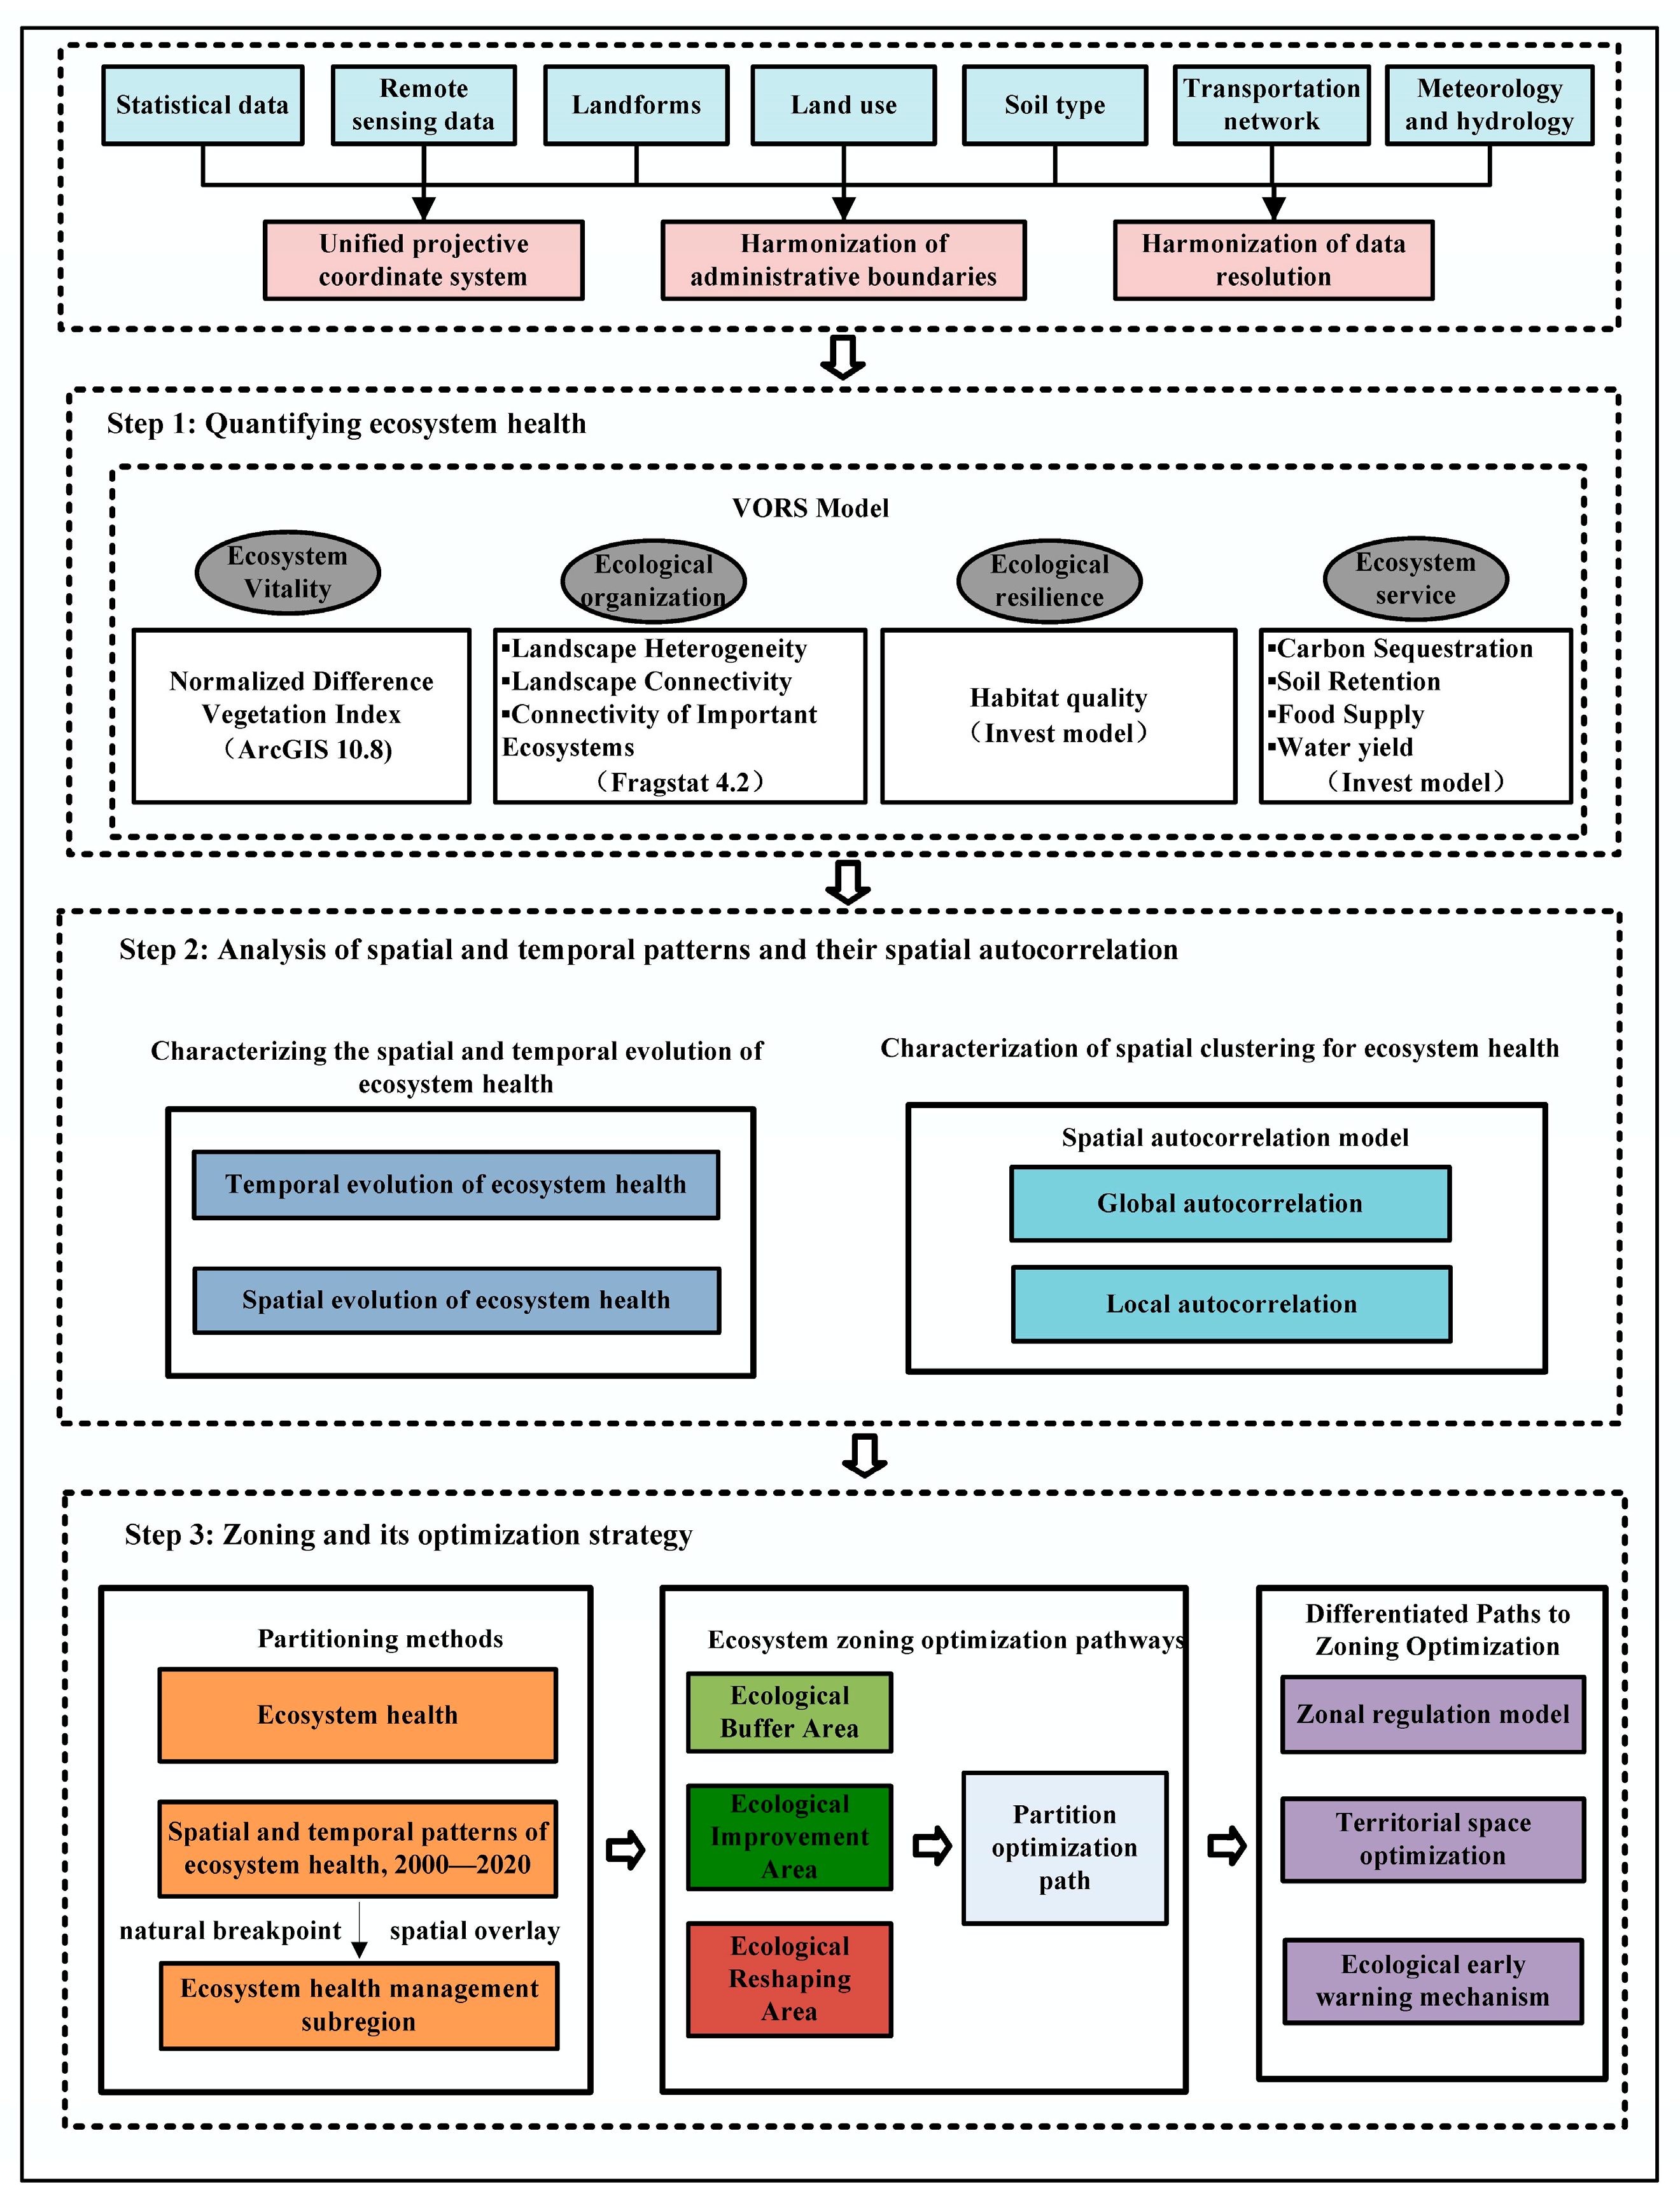
In this study, a general EH assessment framework was developed for the years 2000, 2010, and 2020 in Fujian Province, a key forest region in southern China, by applying the VORS model with reference to [29] (Figure 2). As a general framework, it enables systematic EH evaluation and is readily applicable to forest-dominated settings, offering methodological references for forest ecosystem health assessment and for refining zoning-based management in key forest regions. This study emphasizes the following three major components. Firstly, it constructs an EH assessment model applicable to Fujian Province by incorporating four key dimensions: Ecosystem Vigor (EV), Ecosystem Organization (EO), Ecosystem Resilience (ER), and ES. This model serves as a scientific tool for comprehensively quantifying EH status. Secondly, based on the VORS framework, the research clarifies the spatial-temporal patterns of ecosystem health (EH) in Fujian Province for the years 2000, 2010, and 2020. The study further employs spatial autocorrelation analysis to investigate the clustering characteristics of EH from both global and local perspectives, revealing the intrinsic pattern of its spatial distribution and regional differences, and providing solid data support for the subsequent zoning management strategy. Finally, based on the assessment results, Fujian Province is categorized into three ecological management zones: ecological conservation zones, ecological enhancement zones, and ecological reshaping zones. In response to the current EH conditions in each zone, the study proposes differentiated and refined management strategies.

2.3. VORS-Based EH Assessment Model

This study evaluates regional ecosystem health by utilizing the methodology from previous literature [29], focusing on the mean value of the ecosystem health index (EHI) as the primary metric. This index integrates multiple dimensions, including EV, EO, ER, and ES, to comprehensively reflect the overall health status of the ecosystem. The specific calculation formula is as follows:
EHI = PHI × ES
PHI = EV × EO × ER 3
In Equations (1) and (2), EHI denotes the EH Index, which is designed to provide a comprehensive assessment of the overall health of an ecosystem. PHI denotes the index of natural ecological health, highlighting the inherent state of the natural ecosystem.
To more precisely evaluate the status of each ecosystem dimension, we applied the natural breaks (Jenks) method for analysis, which is in line with the characteristics of the data distribution. EV, EO, ER, ES, and EHI were categorized into five tiers: low, comparatively low, medium, moderately high, and high. This classification method facilitates a more detailed analysis of the spatial distribution differences in each indicator and the overall EH status. The measurement approaches for each EHI are presented as follows:

2.3.1. EV

Ecosystem vitality is a crucial metric of an ecosystem’s health, assessing its capacity to withstand external perturbations and sustain functional stability, often measured by the NDVI [30]. The NDVI relies on remote sensing technology to indicate vegetation coverage and growth by capturing the reflectance contrast of surface vegetation in the visible and near-infrared bands. Thus, it serves as an effective proxy for tracking the temporal dynamics of EV.
NDVI = NIR RED NIR + RED
In Equation (3), NDVI is the normalized vegetation index; NIR is the near-infrared band; RED is the red band.

2.3.2. EO

EO encapsulates the intricacy and logic of ecological architecture, functioning as a crucial metric for assessing EH. The sensitivity of landscape pattern indices to changes in ecosystem structure makes them a commonly used tool for characterizing EO [31]. According to the computational approaches outlined in references [32,33], weights of 0.35, 0.35, and 0.3 should be allocated to landscape heterogeneity, overall landscape connectivity, and critical ecosystem connectivity, respectively, to develop a comprehensive ecological assessment model.
EO = 0.35 LC + 0.35 LH + 0.30 CIE = ( 0.25 DIVISION + 0.10 CONTAG ) + ( 0.10 AWMPFD + 0.25 SHDI ) + ( 0.10 DIVISION f + 0.05 COHESION f + 0.10 DIVISION w + 0.05 COHESION w )
In Equation (4), EO uses a variety of landscape ecological indicators for comprehensive assessment. LC stands for overall landscape connectivity and is used to evaluate the connectivity across the entire landscape. LH represents landscape heterogeneity, which reflects the diversity and complexity of landscape composition. CIE represents critical ecosystem connectivity, with a focus on the connections between key ecological systems. Moreover, LH is measured by the Area-Weighted Mean Patch Fractal Dimension (AWMPFD) and the Shannon Diversity Index (SHDI). Overall landscape connectivity is assessed using the Landscape Division Index (DIVISION) and the Contagion Index (CONTAG). The evaluation of essential ecosystem connection depends on the Patch Fragmentation Index (DIVISION) and the Patch Cohesion Index (COHESION). DIVISIONf and DIVISIONw denote the patch fragmentation indices for forestland and aquatic environments, respectively. COHESIONf and COHESIONw represent the patch cohesion indices for forestland and aquatic environments, respectively.

2.3.3. ER

ER indicates the capacity of an ecosystem to sustain its structural integrity in the face of anthropogenic disturbances. Based on existing literature [33,34], habitat quality is adopted in this study as a proxy for assessing regional ER. The construction of the habitat quality index integrates three critical elements: threat intensity, spatial proximity between habitats and threat sources, and the vulnerability of different land cover types to disturbance. Parameters such as the habitat suitability index, habitat threat index, and half-saturation constant are primarily determined based on existing studies [28]. This model effectively evaluates the potential for ecosystem restoration by quantifying habitat quality and functional integrity. The detailed computation formula is presented below:
Q xj = H i 1 D xj z D xj z + K z
In Equation (5), Qxj represents the habitat quality index for land use type j inside grid cell x. Dxj denotes the extent of habitat degradation for this land use category inside the grid cell. Hi is the habitat suitability parameter for the land use type. The constant K in the equation denotes the half-saturation value, defined as half of the highest deterioration score. z is a normalization constant that assumes the default value defined in the model.

2.3.4. ES

The capacity of ecosystem services (ES) is a crucial metric for evaluating the contribution of ecosystems to human society. It reflects the efficacy of ecosystem products and services, encompassing the broad array of benefits that humans obtain directly or indirectly from ecosystems and natural capital [35,36]. Referring to relevant studies [28,29] and considering the ecological and socio-economic characteristics of the study area in Fujian Province, four key ecosystem services—carbon sequestration, soil conservation, food supply, and water yield—were selected to represent the overall ecosystem services. (Table 1). To determine the relative importance of these services, six experts in ecology and geography were invited to apply the Analytic Hierarchy Process (AHP). Using a 1–9 pairwise comparison scale, they evaluated the four ES indicators, resulting in weights of 0.30 for carbon sequestration, 0.25 for soil conservation, 0.25 for water yield, and 0.20 for food supply [28,29]. The assigned weights (0.30 for carbon sequestration, 0.25 for soil conservation, 0.25 for water yield, and 0.20 for food supply) reflect the ecological priorities of Fujian Province. Carbon sequestration received the highest weight given the province’s extensive forest cover and its critical role in climate regulation. Soil conservation and water yield were weighted equally due to the region’s mountainous terrain, frequent rainfall, and vulnerability to erosion and hydrological fluctuations. Food supply was assigned a relatively lower weight, yet remains essential for sustaining livelihoods and regional food security. The detailed calculation formula is presented below:
CES i = j = 1 m ES i j × W j
In Equation (6), CESi denotes the CES index of the i-th grid cell; m represents the quantity of ES kinds (m = 4); ESij is the normalized value of the j-th type of ES in the i-th grid cell; Wj is the weight coefficient of each type of ES.

2.4. Spatial Autocorrelation Model

The spatial autocorrelation model functions as a statistical instrument for examining geographical data structures and their interrelationships, facilitating the assessment of correlation and variability of an observed variable from both global and local viewpoints [29]. This research utilized a spatial autocorrelation model to examine the geographic clustering attributes of EH in Fujian Province, with the calculation formula presented as follows:
I = n i = 1 n j = 1 n W i j ( x i x ¯ ) ( x j x ¯ ) i = 1 n j = 1 n W i j i = 1 n ( x i x ¯ ) 2
I l o c a l = j = 1 , j i n W i j ( x i x ¯ ) ( x j x ¯ ) i = 1 n ( x i x ¯ ) 2
In Equations (7) and (8), I represents the global Moran index, reflecting spatial autocorrelation of ecosystem health across the region; Ilocal represents the local Moran index, which measures the extent to which the ecological health value of a county is correlated with that of its neighboring counties; n represents the total number of counties, which represents the average of the ecosystem health of all the counties; and xi and xj are the ecosystem health values at locations i and j, respectively; Wij is the spatial weight between i and j.

2.5. Data Sources

The datasets employed in this study and their corresponding sources are detailed in Table 2. Land data were obtained from the China Land Cover Dataset (CLCD) (https://zenodo.org/record/8176941, accessed on 16 August 2025). Data on vegetation cover and administrative boundaries for Fujian Province were acquired from the Resource and Environment Science and Data Center, Chinese Academy of Sciences (http://www.resdc.cn, accessed on 17 May 2025). Soil-texture data were obtained from the World Soil Database (HWSD) hosted by the National Tibetan Plateau Data Center (https://data.tpdc.ac.cn, accessed on 24 April 2025). Since soil texture is relatively stable over time, 2019 data were used to represent conditions in 2000, 2010, and 2020. Elevation data were retrieved from the Geospatial Data Cloud (https://www.gscloud.cn, accessed on 12 January 2025) and precipitation records were compiled from the Monthly Observation Dataset of Meteorological Elements at Chinese weather stations (https://www.resdc.cn, accessed on 12 February 2025). Data on grain production are from Statistical Yearbook of China’s Counties.

3. Results and Discussion

3.1. The Overall Changes in the Constituent Indicators of EH

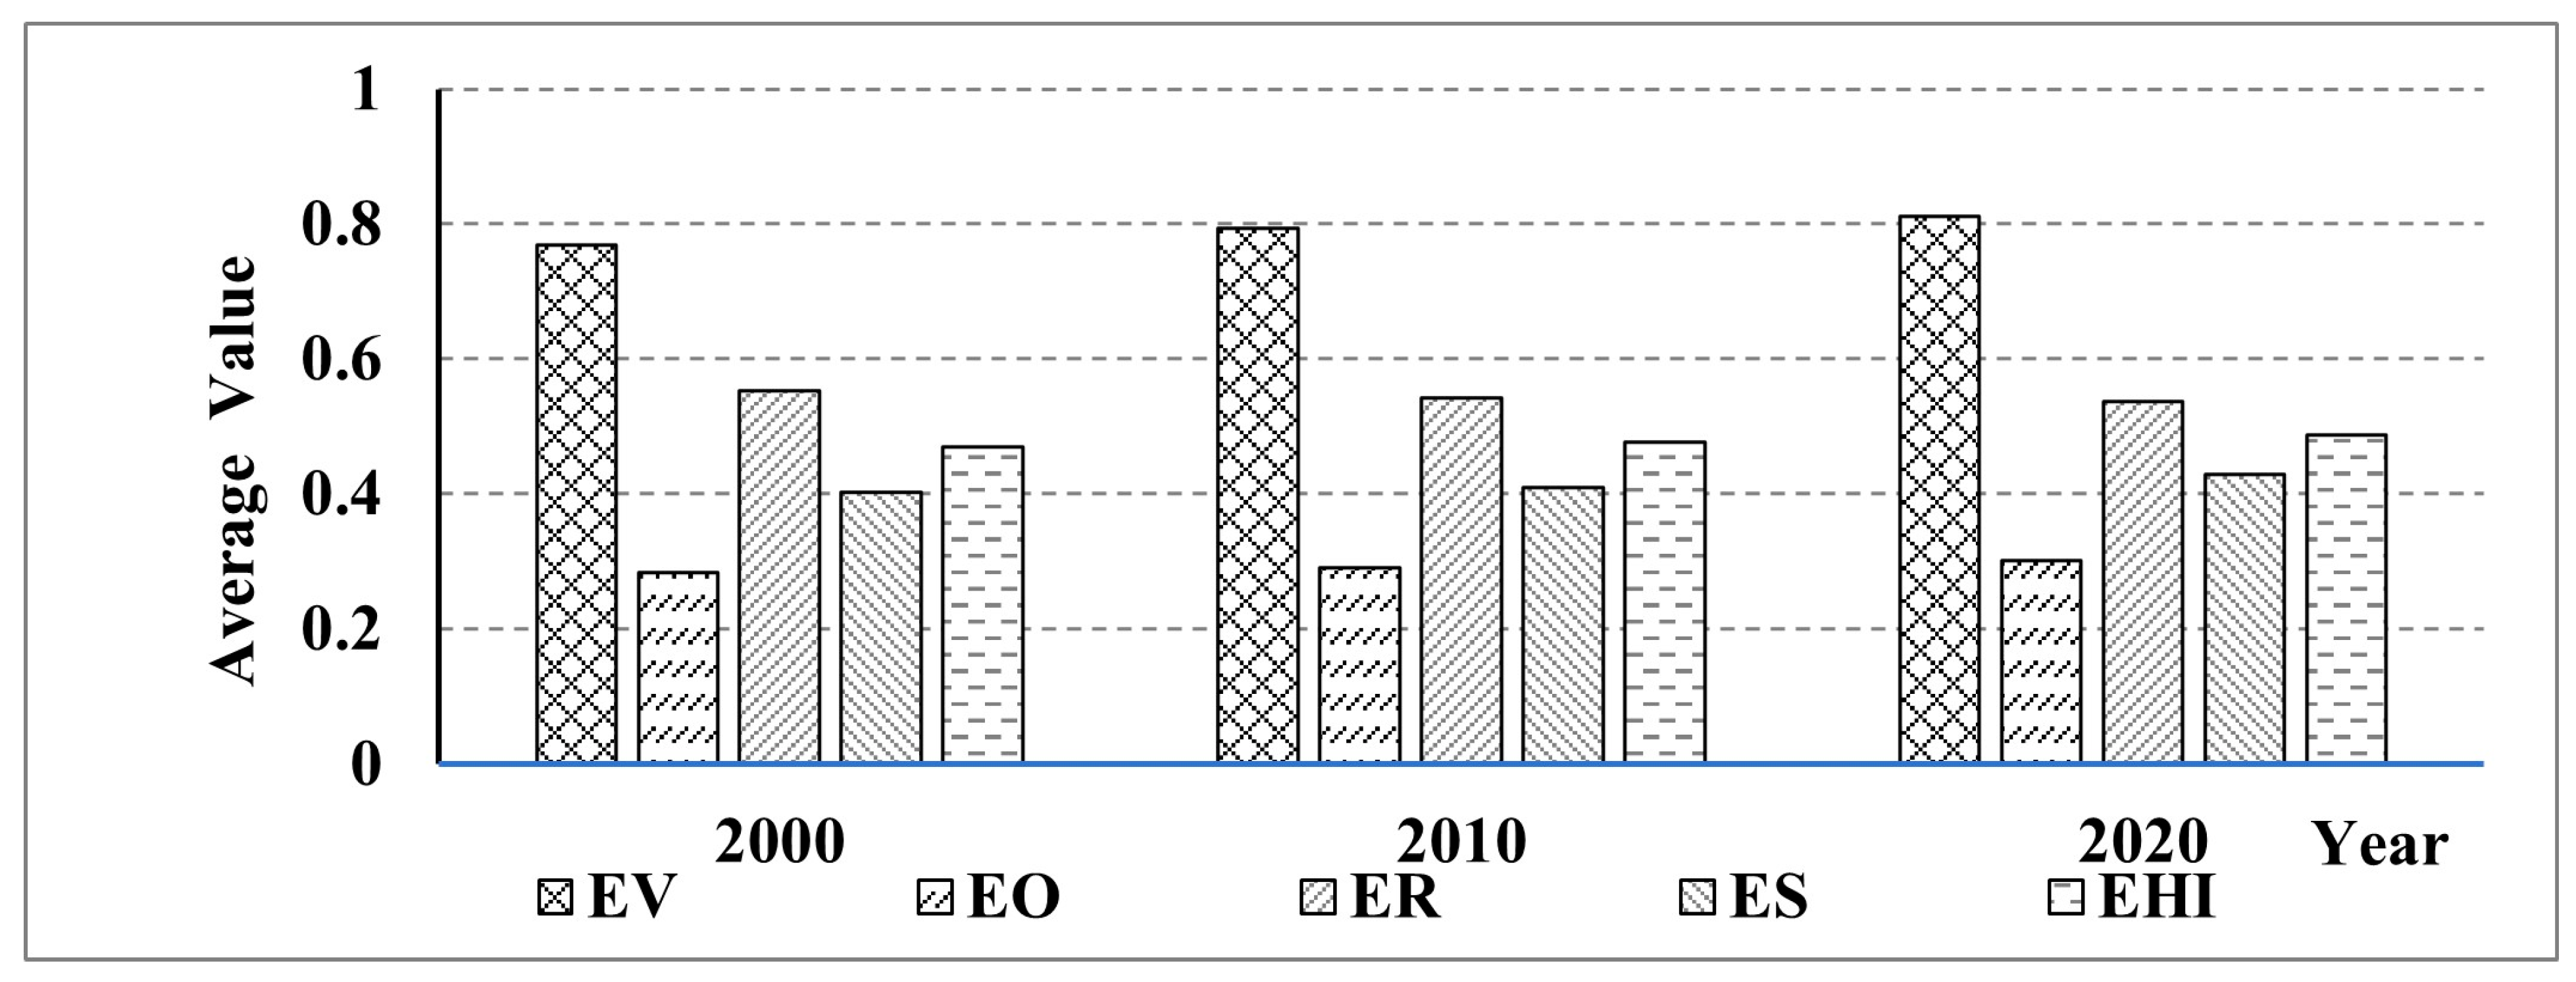
Figure 3 presents an overview of the county-scale Ecosystem Health Index (EHI) for Fujian Province during the period 2000–2020. Throughout the observation window, the individual components of ecosystem health showed distinctly differentiated trajectories, manifested as follows:

3.1.1. Changes in EV

Throughout the study period, the EV in Fujian Province had a consistent upward trajectory, growing from 0.769 in 2000 to 0.794 in 2010, and subsequently to 0.811 in 2020. This favorable transformation was mostly ascribed to a succession of ecological conservation laws and initiatives enacted in Fujian Province from 2000 to 2020. The execution of collective forest tenure reform and the Grain for Green Program enhanced vegetation cover in the short term. In the long term, clearer property rights and benefit incentive mechanisms enhanced the enthusiasm of forest farmers for afforestation and reforestation, promoting the sustained growth of forest resources. The implementation of the Grain for Green Program systematically restored sloped agricultural land in ecologically sensitive areas to forest and grassland, enhancing land use patterns and increasing the ecosystem’s carbon storage capacity and biological productivity. In addition, supporting mechanisms such as ecological compensation and restoration projects—like forest closure and soil erosion control—further improved the ecological environment and enhanced ecosystem stability and service functions. The synergistic effects of these policies improved the structure and function of ecosystems, enhanced their self-regulation and recovery capacity, and laid a solid foundation for the continuous improvement of EV.

3.1.2. Changes in EO

During the study period, the EO index in Fujian Province exhibited a steadily increasing trend, rising from 0.284 to 0.301. This change was primarily attributed to the optimization of land use patterns. In urban planning, the emphasis on protecting and allocating ecological spaces—such as the rational planning of urban green areas, wetlands, and ecological corridors—has not only increased vegetation cover and habitat area but also significantly enhanced ecosystem connectivity and integrity. The promotion of sustainable agricultural development models, including eco-agriculture practices and agroecological landscape optimization, has diminished the reliance on chemical inputs, alleviated non-point source pollution, and safeguarded soil fertility and biodiversity. These measures minimized damage to ecosystems and helped maintain their integrity and organizational capacity. In addition, the ecosystem’s self-regulation mechanisms and adaptive evolution enabled it to reorganize and optimize its structure and function under certain levels of disturbance, further contributing to the improvement of EO.

3.1.3. Changes in ER

Throughout the study period, the ER in Fujian Province exhibited a slight but overall declining trend, decreasing from 0.553 in 2000 to 0.536 in 2020. This decline is closely associated with the disruptions induced by human activities amid the rapid urbanization process at the county level. Large-scale expansion of construction land led to the fragmentation and degradation of natural ecosystems, undermining their integrity and connectivity. These changes not only reduced habitat areas and biodiversity but also disrupted key ecological processes such as material cycling, energy flow, and information transfer, thereby weakening ecosystem stability and resistance to disturbance. In addition, intensive industrial production, transportation, and other human activities caused environmental pollution and resource overexploitation, further increasing ecological stress and limiting recovery capacity.
Exogenous factors also contributed to this decline. Meteorological anomalies—such as typhoons and extreme rainfall—frequently impacted Fujian, causing vegetation damage, soil erosion, and temporary loss of ecological functions. Natural disasters, including floods and landslides, further disrupted vegetation structure and soil stability, particularly in mountainous and ecologically sensitive areas. Moreover, shifts in agricultural policies, such as changes in fertilizer subsidies and land use incentives, indirectly influenced land management practices, leading to unsustainable land conversion and chemical input, thereby further weakening long-term ecosystem resilience.

3.1.4. Changes in ES

The ES exhibited a steady upward trend, rising from 0.402 in 2000 to 0.410 in 2010, and reaching 0.428 in 2020. This sustained improvement can be closely linked to the cumulative effects of ecological restoration and environmental governance measures implemented since the early 2000s. In particular, Fujian Province adopted an integrated strategy of ecological management that combined large-scale afforestation, ecological forest construction, and farmland-to-forest conversion, significantly increasing forest coverage and enhancing landscape connectivity. These initiatives not only improved vegetation biomass and carbon sequestration capacity but also strengthened soil retention and hydrological regulation, thereby boosting the regulating functions of ecosystems.
Beyond biophysical improvements, policy innovations further amplified ecosystem service provision. The designation of ecological redlines established strict spatial boundaries for conservation, ensuring that ecologically sensitive areas were shielded from urban expansion and industrial encroachment. Similarly, the optimization of the nature reserve network and the pilot establishment of Wuyi Mountain National Park promoted systematic protection of biodiversity hotspots, rare species habitats, and key ecological corridors, enhancing ecosystem stability and functional integrity at the regional scale.
The rise in ES also reflects a structural shift in regional development priorities. As Fujian’s economy diversified and moved toward high-value and service-oriented industries, pressures from traditional resource extraction gradually declined, creating space for ecological functions to recover. Moreover, ecological initiatives such as the “Forest into Cities, Villages, and Factories” campaign redefined urban–rural spatial relationships, embedding ecosystem services directly into human settlements. This integration of green infrastructure into urban planning not only enhanced local habitat quality but also expanded the social and cultural value of ecosystems, indirectly reinforcing public support for ecological protection.
Overall, the steady increase in ES illustrates how proactive ecological restoration, strict conservation policies, and evolving socio-economic structures collectively improved the provisioning and regulating services of ecosystems in Fujian.

3.1.5. Characteristics of Spatial Variability in Sub-Indicators of Ecosystem Health

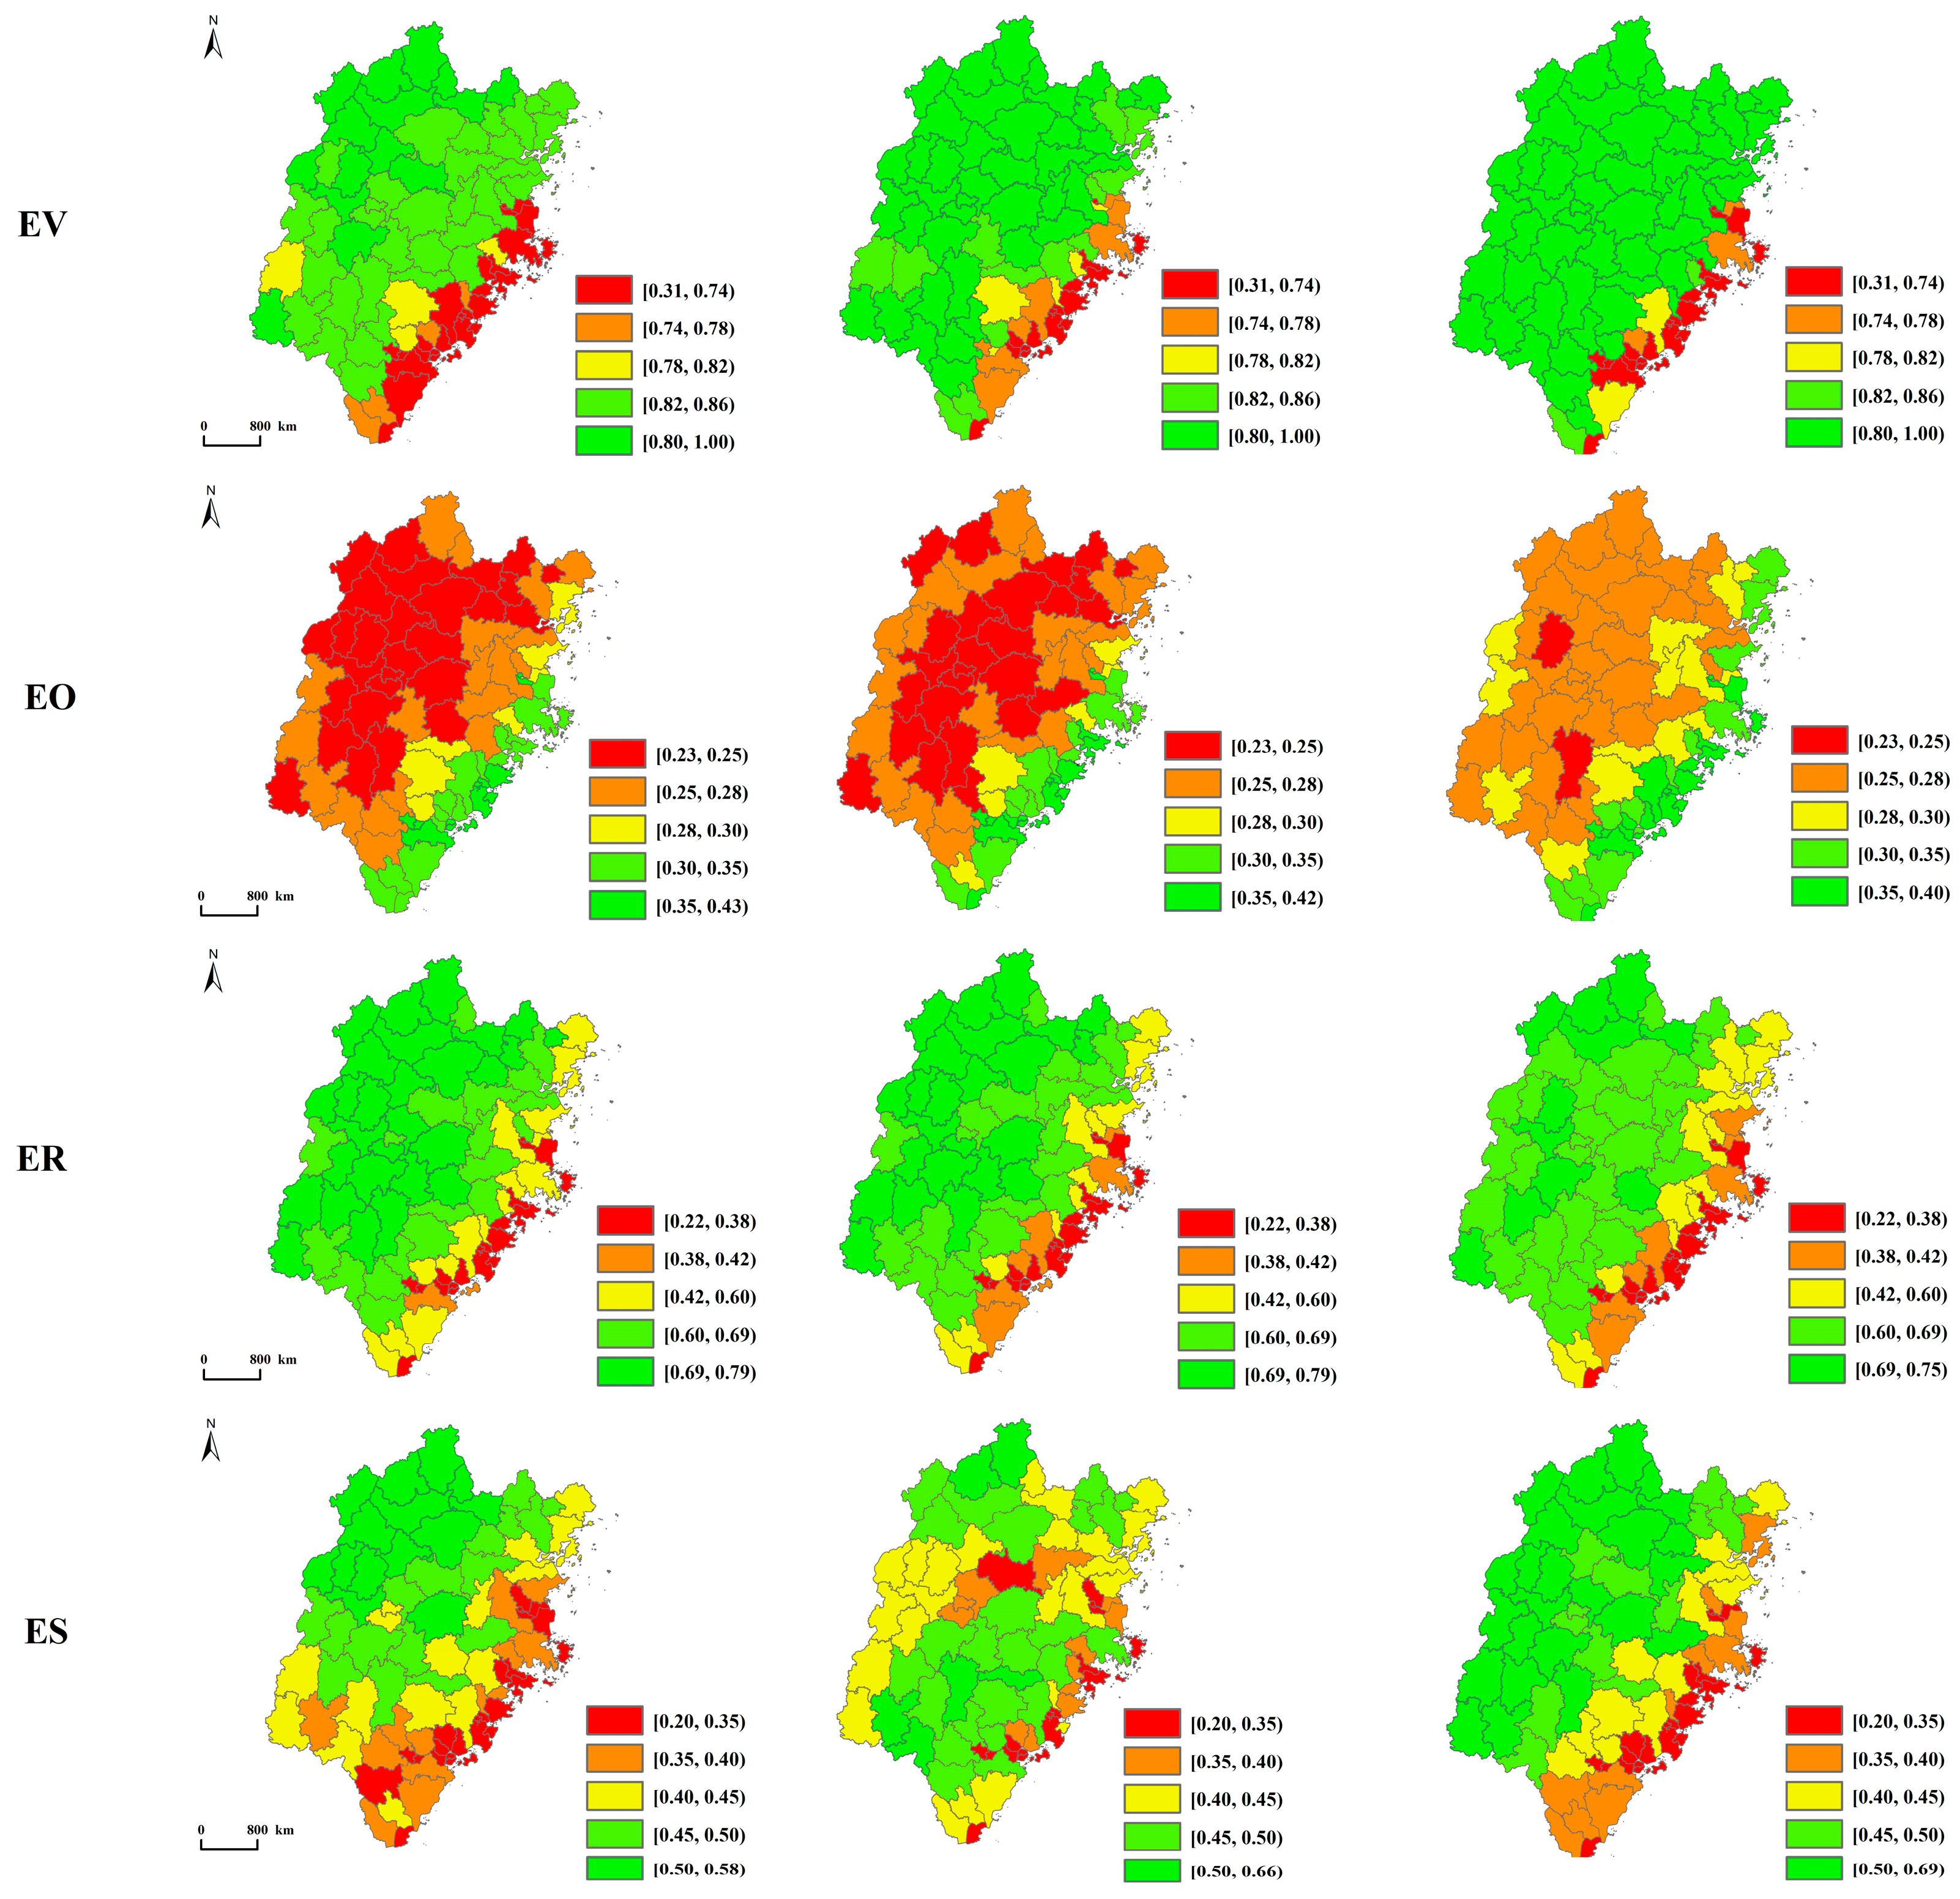
Regarding spatial distribution, Fujian Province demonstrated good performance in EV, ecological resilience, and ES during the study period, but spatial disparities and room for improvement remain in EO (Figure 4). Specifically, the EV was generally at a high level, dominated by the “relatively high” and “high” categories. Most counties had EV above 0.82, indicating strong ecological vitality. However, low-value areas were mainly concentrated in southeastern coastal counties such as Jinjiang, Xiang’an, Xiuyu, and Licheng, where intense human activities and development pressures may have weakened EV. The EO index was generally low, with most areas falling into the “low” and “relatively low” categories, and index values commonly below 0.28, indicating a need to enhance the ecosystem structure and organizational capacity in these regions. Nevertheless, counties such as Zhangpu, Longhai, Huian, and Shishi in the southern and southeastern coastal areas exhibited high values, which may be related to favorable natural conditions or specific land use patterns. The ER was generally high, with most counties having resilience values above 0.60, indicating strong ecological recovery potential. However, Fuzhou’s Fuqing City and the eastern part of Chengxiang District showed medium values. At the same time, counties and cities such as Zhangpu, Longhai, and Longwen displayed low or relatively low values, possibly indicating insufficient resilience to disturbances in these areas. The overall ES level in Fujian Province was relatively high, with most counties scoring above 0.45, indicating that the majority of the region provides substantial ecosystem service value. However, counties classified within the ‘medium’ and ‘relatively low’ categories were mainly concentrated in the southern and eastern parts of the province. These spatial disparities are likely associated with intensive land use changes, such as urban expansion, coastal industrial development, and farmland conversion, which can fragment habitats, reduce vegetation cover, and impair regulating services such as carbon sequestration and soil conservation. In addition, the southeastern coastal areas are more exposed to anthropogenic pressures and climatic disturbances such as typhoons and storm surges, which further constrain the capacity of ecosystems to deliver stable services.

3.2. Temporal and Spatial Dynamics of EH in Fujian Province

In this study, an evaluation framework called VORS was established to calculate the EHI at the county level in Fujian Province. All indicators were normalized using the range standardization method, bringing their values within a range of [0, 1]. Employing the natural breaks (Jenks) categorization, EH was categorized into five classes: low value [0.00, 0.40], comparatively low value [0.40, 0.45], moderate value [0.45, 0.50], relatively high value [0.50, 0.55], and high value [0.55, 1.00] (Figure 5).
During the study period, the mean EHI for counties in Fujian Province exhibited a consistent upward trajectory, increasing from 0.4694 in 2000 to 0.4762 in 2010 and rising further to 0.4865 in 2020. This trend suggests that the overall ecological health (EH) of Fujian Province has steadily improved over the past two decades, reflecting the cumulative effects of ecological restoration initiatives, strengthened environmental governance, and long-term policy commitments to sustainable development. From the statistics on EH types, in 2000, the county-level EH in Fujian Province was mainly characterized by “moderately healthy” and “relatively high” categories, accounting for 20.24% and 41.67%, respectively (Table 3). By 2010, county-level EH in Fujian Province was predominantly concentrated in the “higher health” and “moderately healthy” categories, accounting for 40.48% and 29.76% of counties, respectively. This indicates that the majority of ecosystems at that time maintained relatively favorable conditions, reflecting the effectiveness of ecological restoration projects and policy-driven environmental management during the first decade of the study period. By 2020, however, the distribution had shifted toward greater polarization. The “highly healthy” category became dominant, comprising 35.71% of counties, while the proportion of counties in the “low health” category also increased sharply to 23.81%. This divergence suggests that, although ecological restoration and conservation efforts have significantly improved conditions in certain regions, other areas have experienced intensified degradation due to urban expansion, industrialization, and land use pressures, leading to marked spatial differentiation in ecosystem health across the province.
From a spatial distribution standpoint, the environmental health (EH) of counties in Fujian Province demonstrated considerable spatial variability in 2000, 2010, and 2020, typically exhibiting a pattern of “high in the northwest, low in the southeast”. Regions with elevated EHI are primarily concentrated in Wuyishan, Guangze, and Jianyang, where abundant natural resources, limited human disturbance, and effective ecological conservation strategies contribute to maintaining high ecosystem health. Medium-value zones are mainly distributed in counties such as Jinjiang, Lianjiang, Zhangpu, and Yunxiao, reflecting intermediate ecological conditions influenced by both natural endowments and moderate human pressures. In contrast, low-value zones are largely located in Dongshan, Jinjiang, Shishi, Licheng, and Xiuyu, which are typically subject to intense human activity pressures and urban expansion. This contrasting spatial pattern largely reflects the uneven impacts of urbanization: in economically developed southeastern coastal counties, intensive land use conversion has driven notable ecological degradation, whereas in the less urbanized northwestern regions such pressures are weaker, resulting in a pronounced spatial disparity in ecosystem health across the province.
An in-depth examination of the spatiotemporal trend reveals that the continuous improvement of ecosystem health (EH) in Fujian Province from 2000 to 2020 was closely tied to comprehensive ecological restoration policies and sustainable development initiatives. Since the early 2000s, Fujian has advanced integrated governance of mountains, rivers, forests, farmlands, lakes, and grasslands through large-scale ecological engineering. Key programs—including the construction of water-conservation forests in the upper Min River, coastal shelterbelts, the expansion of ecological public welfare forests, and the “Forest into Cities, Villages, and Factories” campaign—collectively enhanced forest cover, reduced soil erosion, strengthened water regulation services, and improved biodiversity and spatial connectivity via ecological corridors. At the institutional level, measures such as reserve consolidation, the pilot Wuyi Mountain National Park, the establishment of ecological redlines, and agricultural restructuring (such as ecological farming and pollution reduction) reinforced ecosystem structure, watershed integrity, and sustainability. Rising public participation in conservation further contributed to a positive feedback cycle in which ecological engineering, governance innovation, and social engagement mutually strengthened one another. Taken together, these region-specific strategies generated long-term synergistic benefits for ecosystem health at both local and provincial scales.
Further analysis suggests that regional disparities in economic development can lead to variations in ecological protection investment and the effectiveness of environmental management, ultimately influencing the evolution of EHI. Specifically, the ecosystem in the northwest of Fujian Province is healthier than that in the southeast, mainly due to three reasons. First, the region’s relatively lagging economic development and lower levels of urbanization and human disturbance have resulted in less ecological damage. Second, the northwest has a strong natural ecological foundation, with abundant mountain and forest resources, resulting in relatively stable ecosystem structures and strong self-regulation and recovery capacities. Third, local governments have implemented effective ecological protection policies, such as natural forest protection projects and ecological resettlement programs, which have reduced human impact and facilitated the restoration and maintenance of ecosystem health. In contrast, southeastern Fujian is economically developed and rapidly urbanizing, with frequent human disturbances. Despite significant environmental investments and advanced technologies, ecological pressure remains immense, posing serious challenges to EH.

3.3. Spatial Clustering of EHI

The county-level pattern of EHI in Fujian Province is characterized by significant spatial aggregation: high-scoring areas are contiguous with other high-scoring areas, while low-scoring areas cluster together, producing clear spatial clusters. Through spatial clustering analysis, we can gain deeper insights into the spatial correlation and dependence of EH, which helps identify vulnerable zones and key ecological functional areas within the ecosystem, thereby offering crucial guidance for formulating targeted ecological conservation and restoration strategies and achieving science-based management and sustainable ecosystem development. Based on the EHI assessment results, this study integrates the spatial analysis features of ArcGIS 10.8 software. It employs the global Moran’s I tool to perform a detailed analysis of the spatial clustering characteristics of the EHI in Fujian’s counties. The analysis findings are presented in Table 4. From 2000 to 2020, the worldwide Moran’s I index for EHI in Fujian Province exhibited positive values for each year, specifically 0.641, 0.757, and 0.776, with p < 0.01. This indicates that the EHI in Fujian Province’s counties in 2000, 2010, and 2020 exhibits significant spatial autocorrelation and is positively spatially correlated.
The percentage of counties exhibiting low–low clustering was the highest, accounting for 23.81%, 32.14%, and 30.95% of the total counties in 2000, 2010, and 2020, respectively (Figure 6). These counties are primarily distributed across Jinjiang, Shishi, Nan’an, Lianjiang, and Changle, with additional scattered areas in other coastal and peri-urban regions. This spatial pattern reflects the concentration of ecological pressure in densely populated and economically developed zones, where rapid urbanization and intensive land use change have significantly influenced ecosystem health. Areas such as Changle and Lianjiang experienced rapid urbanization and industrial expansion between 2000 and 2020, with large areas of forest and wetland converted into construction land, leading to reduced forest cover, fragmentation of ecosystem structures, and weakened regulating services such as water conservation and soil retention. Similarly, counties such as Jinjiang and Shishi are highly industrialized, with sectors such as textile printing and dyeing, papermaking, and chemicals generating substantial wastewater, exhaust gases, and solid residues. These pollutants degrade soil, water, and air quality, impair habitat conditions, reduce biodiversity, and ultimately damage EH. Furthermore, ecosystem service functions in these regions have been degraded due to overdevelopment, resulting in weakened wetland purification and flood regulation capacity, as well as diminished ecological tourism and recreational value of forests—factors that collectively contribute to the persistence of low-health clustering.
In contrast, the high–high clustering type accounted for 8.33%, 11.90%, and 9.52% of the total counties in 2000, 2010, and 2020, respectively. These counties were primarily distributed in Zhangping, Jianyang, Xinluo, and Wuping, along with surrounding counties and cities. The prevalence of high–high clusters in these regions can be attributed to their location within important ecological function zones, such as the Wuyi Mountains, which possess favorable ecological conditions, abundant forest resources, high biodiversity, and stable ecosystems with strong self-regulation and recovery capacity. During the study period, strengthened ecological protection policies—including natural forest protection projects, farmland-to-forest conversion, and the establishment of nature reserves—further enhanced ecosystem stability and resilience. These factors collectively ensured that the counties in high–high clusters maintained strong ecosystem structure, robust ecological functions, and consistently high levels of EH.

3.4. Ecological Management Zones and Optimization Strategies

To scientifically promote the optimization of Fujian Province’s territorial spatial pattern and achieve refined and differentiated land use management, this study utilizes the EHI of Fujian Province for the years 2000, 2010, and 2020 as a basis. County-level units are selected for evaluation, combining the current state and evolution trends of EHI to establish a method for dividing ecological management zones [29,30]. This method aims to provide precise ecological management strategies tailored for Fujian Province by deeply analyzing the spatiotemporal differentiation characteristics of EHI, thereby contributing to the sustainable development and efficient management of regional ecosystems.
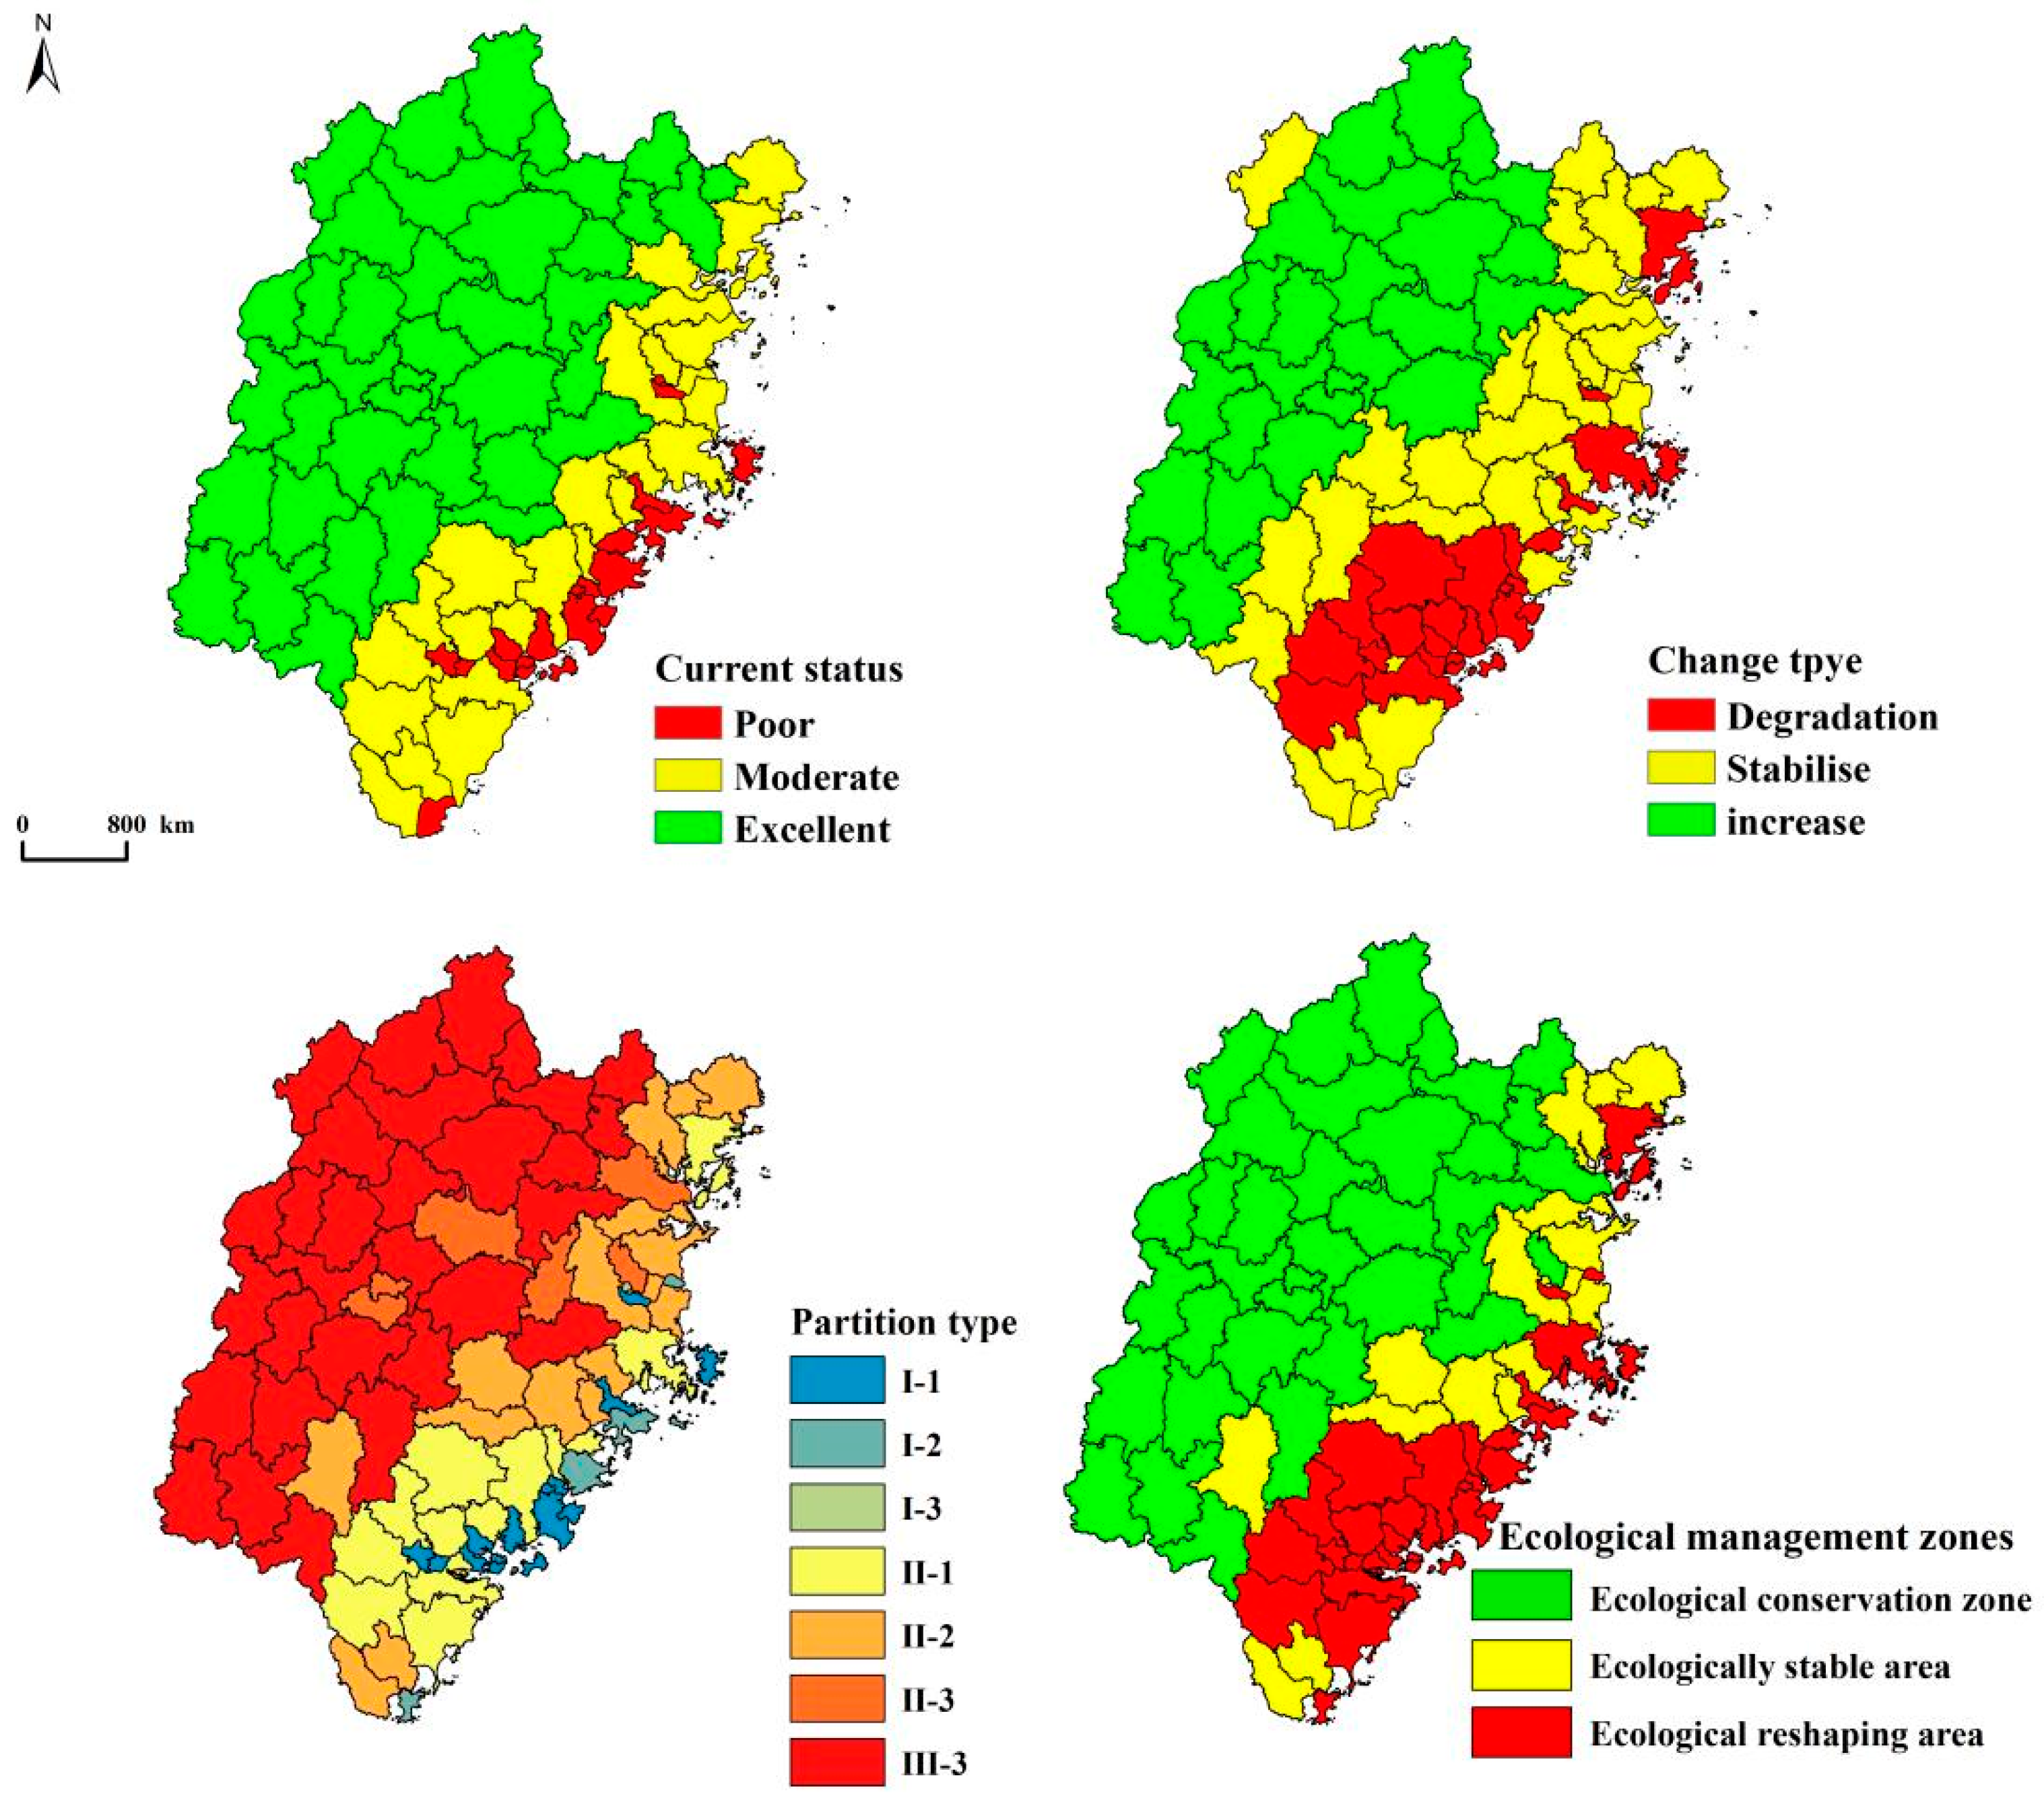
The delineation of ecological management zones in Fujian Province follows the process outlined below: First, using the natural break method, EHI is classified into three levels from low to high: poor [0, 0.3), moderate [0.3, 0.5), and excellent [0.5, 1.0]. Simultaneously, the variation in the EHI from 2000 to 2020 categorizes its evolutionary pattern into three classifications: degradation (<0), stability [0, 0.02], and improvement (>0.02). Then, a spatial overlay analysis of EH levels and evolution trends is conducted, which theoretically results in nine sub-zones. However, the actual analysis shows that the sub-zones II-3, III-1, and III-2 do not exist in Fujian Province. Therefore, the final result is the formation of seven sub-zones. Finally, considering the characteristics of these seven sub-zones and their primary functions, they are integrated into three major ecological management zones: ecological conservation areas, ecological stability areas, and ecological restoration areas (Figure 7). The basis for division, control objectives, and characteristics of each zone are detailed in Table 5 and Figure 7.
To more effectively promote the sustainable development of regional ecosystem health and socio-economic systems, this study divides Fujian Province into three management zones: ecological conservation zones, ecological stability zones, and ecological reshaping zones. Differentiated and refined zoning optimization strategies are developed based on the characteristics of each ecological management zone. The specifics are as follows:
(1)
For Ecological Conservation Area (Type III-3): This sub-type accounts for 41.86% of all counties, mainly distributed in the western and northern parts of Fujian Province, where EH conditions are generally favorable. These areas demonstrate high levels of EV, EO, ER, and ES, underscoring their role as ecological strongholds. The primary management objective in conservation zones should be to safeguard the authenticity and integrity of ecosystems. Strict protection measures and minimization of anthropogenic disturbance can enhance ecosystem regulation and restoration capacities, improve resilience to external pressures, and secure biodiversity and long-term service provision. Natural restoration should serve as the core strategy, supported by scientific forest management practices to improve forest quality. In addition, the establishment of multi-dimensional ecological corridors is recommended to strengthen landscape connectivity and biodiversity protection, thereby consolidating their function as critical ecological barriers.
(2)
For Ecological Stability Zone (Types I-3 and II-2): This zone accounts for 20.93% of the total counties and is mainly distributed in the central region of Fujian Province. Ecosystems in these areas exhibit high vitality, strong service capacity, well-structured organization, above-average resilience, rich biodiversity, and robust self-restoration potential. Management should prioritize strengthening natural regenerative capacity and optimizing the spatial configuration of ecological elements to maintain long-term stability. Key measures include forest restoration, landscape pattern optimization, and biodiversity enhancement to reinforce ecosystem self-recovery mechanisms. At the same time, the rational use of green resources should be promoted without compromising ecological integrity. Limited, low-intensity development activities may be allowed, provided they are compatible with ecological protection objectives and support sustainable regional development.
(3)
For Ecological Reshaping Zone (Types I-1, I-2, and II-1): This zone constitutes 37.20% of the counties and is mainly distributed in the southern and eastern regions of Fujian Province. Due to intensive human activities—particularly in the southeastern coastal areas—ecosystems in this zone have experienced significant degradation, diminished ecological functions, and weakened self-repair capacity. The management priority should therefore focus on ecological restoration and reconstruction, supported by appropriate human intervention and scientific planning. Active measures such as vegetation restoration, soil improvement, and land use optimization are essential to restore ecosystem functions, enhance structural stability, and promote recovery. In parallel, efforts should be directed toward reducing unsustainable development, strengthening ecological monitoring, and ensuring the long-term effectiveness of restoration projects. Practical experiences in southeastern Fujian underscore the feasibility of such approaches. For instance, the “Retreat from Aquaculture and Restore Wetlands” program in Xiamen and Quanzhou Bays successfully converted large areas of aquaculture ponds into mangroves and natural wetlands, significantly enhancing coastal resilience, biodiversity, and ecological buffering capacity. Similarly, hillside afforestation in Jiaocheng District combined reforestation with erosion control, improving vegetation cover, soil stability, and landscape connectivity. Together, these cases demonstrate how targeted ecological reshaping strategies can progressively restore ecosystem health and support regional sustainable development.

3.5. Model Strengths, Similarities and Differences with Other Studies

A variety of models have been developed to assess ecosystem health (EH) under diverse regional conditions. For instance, Li et al. [16] constructed a remote sensing-driven EH index based on the PSR framework to evaluate ecological restoration in the Guangxi Karst region, showing that ecological health improved significantly and was positively correlated with restoration area. Similarly, Mosaffaie [17] applied the DPSIR framework to the Gorganroud watershed in northern Iran and reported declining health during 2004–2018 due to groundwater depletion, flood risk, and soil erosion, with limited effectiveness of fragmented governance measures [18,19]. Building on these approaches, the present study integrates the ecosystem service (ES) dimension into the assessment framework and employs the InVEST model to quantify carbon sequestration (CES) in Fujian Province. A regional EH assessment model based on the VORS framework was established to evaluate county-level spatiotemporal dynamics from 2000 to 2020. Compared with previous models, this study develops a generalizable framework for ecosystem health assessment that not only enhances understanding at the regional scale but also provides a methodological reference for assessing forest ecosystem health in key forest regions and diverse ecological settings, while offering strategic guidance for refined, zone-specific forest management.
Our findings demonstrate a continuous upward trend in county-level ecosystem health (EH) across Fujian Province from 2000 to 2020. This trajectory is corroborated by regional studies. For instance, Wang et al. [40] evaluated EH across the Golden Triangle of Southern Fujian using a PSR (Pressure–State–Response) framework; they reported an overall good ecological condition, albeit with significant spatial heterogeneity related to urbanization pressure. Similarly, Zheng et al. [41] quantified ecological quality and ecosystem service value using the Remote-Sensing Ecological Index (RSEI) and the Equivalent Factor Approach, documenting fluctuating yet predominantly upward temporal trends across Fujian, particularly in central and northern regions. These consistent outcomes reinforce our conclusion that EH in Fujian has steadily improved over the past two decades. In comparison, Li et al. [42] observed a sustained improvement in ecosystem health in Suez, Egypt, driven by extensive reforestation and strong regulatory policies. This parallel underscores a crucial implication: sustained improvements in ecosystem health—whether in Fujian or Suez—are closely tied to the interplay of ecological restoration efforts and institutional innovations.
The ecosystem health assessment methods and zoning management strategies proposed in this study offer valuable insights for evaluating forest health and managing forest areas. By adopting more refined zoning management, it becomes possible to address the specific ecological needs of different forest regions, leading to a more targeted and scientific approach to forest health management. Given Fujian’s significance as a key forest region in southern China, translating these improvements into long-term ecological stability requires the implementation of targeted strategies that address both forest ecosystem health and the unique needs of each zone. Specifically, forest ecosystem health management in key forest areas should prioritize differentiated strategies. For example, in ecologically sensitive counties like Wuping and Jianyang, the focus should be on ecological restoration through the continued implementation of programs such as the Natural Forest Protection Program, the “Grain for Green” initiative, and the expansion of nature reserves. These efforts are critical for enhancing forest coverage, improving biodiversity, and building the resilience of forest ecosystems. In contrast, in mountainous areas like the Wuyi Mountains, stricter land use regulations and the enforcement of ecological redline policies are necessary to mitigate the negative impacts of urbanization and protect the long-term stability of forest landscapes.

3.6. Shortcomings and Prospects

This study has several limitations that should be acknowledged and addressed in future research.
(1)
Although this study employed four representative ecosystem services—carbon sequestration, soil conservation, water yield, and food provisioning—to capture key regulating and provisioning functions, the framework remains incomplete. Cultural services were not included due to difficulties in quantification. In particular, at the county scale in China, relevant cultural indicators are often statistically incomplete and lack uniform standards, which constrains their reliable measurement. Future research should address these limitations by incorporating proxy indicators, such as the frequency of cultural events and participatory survey data, to improve the assessment of cultural services.
(2)
The current VORS-based assessment framework, while structurally comprehensive, still relies on expert judgment for assigning weights and thresholds to core indicators (ecological vitality, organizational structure, resilience, and service function). The absence of a unified standard and data-driven calibration may affect regional comparability and limit broader applicability. To address this, future studies could incorporate machine learning approaches (e.g., random forests, Bayesian networks) to dynamically optimize indicator weights using spatiotemporal big data. Furthermore, developing a standardized toolkit based on ecological baselines and pressure thresholds would enable the construction of differentiated parameter systems tailored to distinct geographic regions.
(3)
The ecological zoning scheme proposed in this study offers valuable theoretical guidance for regional EH management. However, its practical implementation requires further refinement. Future work should integrate analyses of land use conflicts, socio-economic heterogeneity, and policy implementation costs to design and test more detailed management strategies. Land use simulation models such as CLUE-S and PLUS can be employed for multi-scenario simulations to quantify ecological impacts under alternative development pathways. Additionally, market-based instruments, such as eco-banking, could be explored in reshaping zones to enhance policy precision and incentive effectiveness.
In summary, based on the zoning management approach proposed in our study, future assessments of forest ecosystem health in key forest regions of Fujian can be conducted regularly. By analyzing the ecological change rates over different time periods, scientific criteria for regional classification can be established. This dynamic evaluation method allows for the flexible adjustment of management strategies based on the rate of change at different time points, effectively responding to fluctuations in forest ecosystem health. Specifically, by considering the ecological health status and trends in different regions, differentiated forest management strategies can be implemented. This not only helps optimize resource allocation but also enhances the region’s ability to adapt to the broader context of global climate change. With this time-change-rate-driven dynamic assessment system, more precise decision-making support for forest ecosystem management can be provided. This approach ensures that management strategies are adaptable to natural ecological changes and can effectively respond to the evolving impacts of human activities, thus ensuring the long-term sustainability and stability of forest ecosystems in the region.

4. Conclusions

This study focuses on Fujian Province, a key forest region in southern China, and establishes a county-scale EH assessment framework based on the VORS model. It systematically analyzes the spatiotemporal evolution of EHI in Fujian Province from 2000 to 2020 and further divides the region into ecological management zones while exploring paths for optimization. This study develops an ecosystem health assessment framework together with a zoning perspective for management, which can provide references for forest ecosystem health evaluation and offer guidance for refined ecological governance in key forest regions. The study reaches the following main conclusions:
(1)
Between 2000 and 2020, the EHI of counties in Fujian Province remained at a relatively high level and exhibited a clear upward trajectory, rising from 0.4694 in 2000 to 0.4762 in 2010, and further increasing to 0.4865 by 2020.
(2)
Fujian’s EHI shows significant spatial autocorrelation and clustering, predominantly with high–high and low–low clusters, and overall follows a spatial pattern of higher values in the northwest and lower values in the southeast.
(3)
This study categorizes the counties of Fujian Province into three ecological management zones—ecological conservation zones, ecological stability zones, and ecological restoration zones—based on the current status and trends of EHI. It proposes specific, targeted management strategies tailored to the characteristics of each zone, intending to offer theoretical references and practical insights for future ecological management policies in Fujian Province.

Author Contributions

Conceptualization, S.Y. and Y.Z.; methodology, Y.D. and J.H.; software, W.L. and S.Y.; validation, S.Y.; formal analysis, S.Y.; investigation, S.Y. and Y.Z.; resources, Y.D. and J.H.; data curation, S.Y.; writing—original draft preparation, S.Y. and J.H.; writing—review and editing, S.Y.; supervision, Y.D. and J.L.; funding acquisition, Y.D. and J.L. All authors have read and agreed to the published version of the manuscript.

Funding

This research was funded by the National Natural Science Foundation of China (71973027); the Special Fund Project of Fujian Provincial Department of Finance (Min Caiji [2022] No. 870); the Special Research Base Project of Xi Jinping Thought on Socialism with Chinese Characteristics in the New Era in Fujian Province in 2024; and the National Social Science Youth Project Fund: Mechanisms and Pathways for Digitalisation of Agricultural Product Circulation to Promote Income Growth for Farmers (24CJY116).

Data Availability Statement

All raw data contained in this study can be provided on demand based on editorial needs. If in doubt, please consult the corresponding author.

Conflicts of Interest

The authors declare no conflicts of interest.

References

  1. Qu, H.; You, C.; Feng, C.; Guo, L. The spatial spillover effects of ecosystem services: A case study in Yangtze River economic belt in China. Ecol. Indic. 2024, 168, 112741. [Google Scholar] [CrossRef]
  2. Chen, F.; Chen, W.; Qiu, H. Poverty alleviation resettlement in China reduces deforestation. Proc. Natl. Acad. Sci. USA 2025, 122, e2421526122. [Google Scholar] [CrossRef]
  3. Mansori, M.; Badehian, Z.; Ghobadi, M.; Maleknia, R. Assessing the environmental destruction in forest ecosystems using landscape metrics and spatial analysis. Sci. Rep. 2023, 13, 15165. [Google Scholar] [CrossRef]
  4. Hýsek, Š.; Löwe, R.; Turčáni, M. What Happens to Wood after a Tree Is Attacked by a Bark Beetle? Forests 2021, 12, 1163. [Google Scholar] [CrossRef]
  5. Wang, X.; Dong, Q. Assessment of urban ecosystem health and its influencing factors: A case study of Zibo City, China. Sci. Rep. 2024, 14, 8455. [Google Scholar] [CrossRef] [PubMed]
  6. He, J.; Pan, Z.; Liu, D.; Guo, X. Exploring the regional differences of ecosystem health and its driving factors in China. Sci. Total Environ. 2019, 673, 553–564. [Google Scholar] [CrossRef]
  7. Chen, W.; Gu, T.; Zeng, J. Urbanisation and ecosystem health in the Middle Reaches of the Yangtze River urban agglomerations, China: A U-curve relationship. J. Environ. Manag. 2022, 318, 115565. [Google Scholar] [CrossRef] [PubMed]
  8. Chen, W.; Gu, T.; Xiang, J.; Luo, T.; Zeng, J.; Yuan, Y. Ecological restoration zoning of territorial space in China: An ecosystem health perspective. J. Environ. Manag. 2024, 364, 121371. [Google Scholar] [CrossRef]
  9. Pan, Z.; He, J.; Liu, D.; Wang, J.; Guo, X. Ecosystem health assessment based on ecological integrity and ecosystem services demand in the Middle Reaches of the Yangtze River Economic Belt, China. Sci. Total Environ. 2021, 774, 144837. [Google Scholar] [CrossRef]
  10. Du, W.; Liao, X.; Tong, Z.; Rina, S.; Rong, G.; Zhang, J.; Guo, E. Early warning and scenario simulation of ecological security based on DPSIRM model and Bayesian network: A case study of east Liaohe river in Jilin Province, China. J. Clean. Prod. 2023, 398, 136649. [Google Scholar] [CrossRef]
  11. Shen, W.; Li, Y.; Qin, Y. Research on the influencing factors and multi-scale regulatory pathway of ecosystem health: A case study in the Middle Reaches of the Yellow River, China. J. Clean. Prod. 2023, 406, 137038. [Google Scholar] [CrossRef]
  12. Zhao, C.; Shao, N.; Yang, S.; Ren, H.; Ge, Y.; Zhang, Z.; Zhao, Y.; Yin, X. Integrated assessment of ecosystem health using multiple indicator species. Ecol. Eng. 2019, 130, 157–168. [Google Scholar] [CrossRef]
  13. Pourchet, M.; Debrauwer, L.; Klanova, J.; Price, E.; Covaci, A.; Caballero-Casero, N.; Antignac, J. Suspect and non-targeted screening of chemicals of emerging concern for human biomonitoring, environmental health studies and support to risk assessment: From promises to challenges and harmonisation issues. Environ. Int. 2020, 139, 105545. [Google Scholar] [CrossRef] [PubMed]
  14. Li, Z.; Zhu, K.; Ba, Y.; Zhang, Y.; Yang, W.; Wang, J.; Chen, W.; Dong, C.; Qian, K.; Zhou, K. Rigidity and resilience framework-based health diagnosis of mountain forest ecosystems: A case study of Yiliang County in Yunnan Province. J. Clean. Prod. 2025, 507, 145569. [Google Scholar] [CrossRef]
  15. Xiao, Z.; Liu, R.; Gao, Y.; Yang, Q.; Chen, J. Spatiotemporal variation characteristics of ecosystem health and its driving mechanism in the mountains of southwest China. J. Clean. Prod. 2022, 345, 131138. [Google Scholar] [CrossRef]
  16. Liao, C.; Yue, Y.; Wang, K.; Fensholt, R.; Tong, X.; Brandt, M. Ecological restoration enhances ecosystem health in the karst regions of southwest China. Ecol. Indic. 2018, 90, 416–425. [Google Scholar] [CrossRef]
  17. Mosaffaie, J.; Jam, A.S.; Tabatabaei, M.R.; Kousari, M.R. Trend assessment of the watershed health based on DPSIR framework. Land Use Policy 2021, 100, 104911. [Google Scholar] [CrossRef]
  18. Cui, N.; Feng, C.-C.; Han, R.; Guo, L. Impact of Urbanization on Ecosystem Health: A Case Study in Zhuhai, China. Int. J. Environ. Res. Public Health 2019, 16, 4717. [Google Scholar] [CrossRef]
  19. Xie, X.; Fang, B.; Xu, H.; He, S.; Li, X. Study on the coordinated relationship between Urban Land use efficiency and ecosystem health in China. Land Use Policy 2021, 102, 105235. [Google Scholar] [CrossRef]
  20. He, R.; Huang, X.; Ye, X.; Pan, Z.; Wang, H.; Luo, B.; Liu, D.; Hu, X. County Ecosystem Health Assessment Based on the VORS Model: A Case Study of 183 Counties in Sichuan Province, China. Sustainability 2022, 14, 11565. [Google Scholar] [CrossRef]
  21. Li, K.; Hou, Y.; Fu, Q.; Randall, M.; Andersen, P.; Qiu, M.; Skov-Petersen, H. Integrating decision-making preferences into ecosystem service conservation area identification: A case study of water-related ecosystem services in the Dawen River watershed, China. J. Environ. Manag. 2023, 340, 117972. [Google Scholar] [CrossRef]
  22. Han, P.; Hu, H.; Zhou, J.; Wang, M.; Zhou, Z. Integrating key ecosystem services to study the spatio-temporal dynamics and determinants of ecosystem health in Wuhan’s central urban area. Ecol. Indic. 2024, 166, 112352. [Google Scholar] [CrossRef]
  23. Li, Y.; Qin, L.; Wang, Y.; Liu, H.; Zhang, M.; Hao, H. Ecosystem health assessment of the largest lake wetland in the Yellow River basin using an improved vigor-organization-resilience-services model. Ecol. Indic. 2024, 166, 112539. [Google Scholar] [CrossRef]
  24. Wu, Y.; Wu, Y.; Li, C.; Gao, B.; Zheng, K.; Wang, M.; Deng, Y.; Fan, X. Spatial Relationships and Impact Effects between Urbanization and Ecosystem Health in Urban Agglomerations along the Belt and Road: A Case Study of the Guangdong-Hong Kong-Macao Greater Bay Area. Int. J. Environ. Res. Public Health 2022, 19, 16053. [Google Scholar] [CrossRef]
  25. Wang, P.; Zhang, J.; Xu, D.; Chen, D.; Tao, J.; Wang, J.; Ma, X. Study on driving factors of island ecosystem health and multi-scenario ecology simulation using ecological conservation and eco-friendly tourism for achieving sustainability. J. Environ. Manag. 2025, 373, 123480. [Google Scholar] [CrossRef]
  26. Bai, Y.; Wong, C.; Jiang, B.; Hughes, A.; Wang, M.; Wang, Q. Developing China’s Ecological Redline Policy using ecosystem services assessments for land use planning. Nat. Commun. 2018, 9, 3034. [Google Scholar] [CrossRef]
  27. Lyu, R.; Clarke, K.; Tian, X.; Zhao, W.; Pang, J.; Zhang, J. Land use zoning management to coordinate the supply–demand imbalance of ecosystem services: A case study in the city belt along the yellow river in Ningxia, China. Front. Environ. Sci. 2022, 10, 911190. [Google Scholar] [CrossRef]
  28. Huang, J.; Yang, S.; Zhu, W.; Lin, J.; Zhu, Y.; Ren, J.; Zhang, A. Spatial and temporal characterization of critical ecosystem services in China’s terrestrial area, 2000–2020: Trade-off synergies, driving mechanisms and functional zoning. Front. Ecol. Evol. 2024, 12, 1443683. [Google Scholar] [CrossRef]
  29. Zhu, W.; Huang, J.; Yang, S.; Liu, W.; Dai, Y.; Huang, G.; Lin, J. Spatiotemporal Evolution, Driving Mechanisms, and Zoning Optimization Pathways of Ecosystem Health in China. Forests 2024, 15, 1987. [Google Scholar] [CrossRef]
  30. Ran, C.; Wang, S.; Bai, X.; Tan, Q.; Wu, L.; Luo, X.; Lu, Q. Evaluation of temporal and spatial changes of global ecosystem health. Land Degrad. Dev. 2021, 32, 1500–1512. [Google Scholar] [CrossRef]
  31. Lv, T.; Zeng, C.; Lin, C.; Liu, W.; Cheng, Y.; Li, Y. Towards an integrated approach for land spatial ecological restoration zoning based on ecosystem health assessment. Ecol. Indic. 2023, 147, 110016. [Google Scholar] [CrossRef]
  32. Hernández-Blanco, M.; Costanza, R.; Chen, H.; DeGroot, D.; Jarvis, D.; Kubiszewski, I.; Montoya, J.; Sangha, K.; Stoeckl, N.; Turner, K.; et al. Ecosystem health, ecosystem services, and the well-being of humans and the rest of nature. Glob. Change Biol. 2022, 28, 5027–5040. [Google Scholar] [CrossRef]
  33. Wu, C.; Chen, W. Indicator system construction and health assessment of wetland ecosystem—Taking Hongze Lake Wetland, China as an example. Ecol. Indic. 2020, 112, 106164. [Google Scholar] [CrossRef]
  34. Liu, P.; Rong, L.; Teng, F. The evaluation of ecosystem health based on hybrid TODIM method for Chinese case. Technol. Econ. Dev. Econ. 2019, 25, 542–570. [Google Scholar] [CrossRef]
  35. Liu, R.R.; Dong, X.B.; Wang, X.C.; Zhang, P.; Liu, M.X.; Zhang, Y. Relationship and driving factors between urbanization and natural ecosystem health in China. Ecol. Indic. 2023, 147, 109972. [Google Scholar] [CrossRef]
  36. Xu, X.; Yang, G.; Tan, Y.; Liu, J.; Hu, H. Ecosystem services trade-offs and determinants in China’s Yangtze River Economic Belt from 2000 to 2015. Sci. Total Environ. 2018, 634, 1601–1614. [Google Scholar] [CrossRef]
  37. Ouyang, Z.; Zheng, H.; Xiao, Y.; Polasky, S.; Liu, J.; Xu, W.; Daily, G. Improvements in ecosystem services from investments in natural capital. Science 2016, 352, 1455–1459. [Google Scholar] [CrossRef]
  38. Huang, C.; Zhao, D.; Liao, Q.; Xiao, M. Linking landscape dynamics to the relationship between water purification and soil retention. Ecosyst. Serv. 2023, 59, 101498. [Google Scholar] [CrossRef]
  39. Wang, F.; Wu, Y.; Zhang, Y.; Wang, J.; Xue, Z.; Tan, X.; Jia, W. Research on ecosystem service value and landscape ecological risk prediction and zoning: Taking Fujian province as an example. Ecol. Mod. 2025, 507, 111173. [Google Scholar] [CrossRef]
  40. Wang, Z.; Tang, L.; Qiu, Q.; Chen, H.; Wu, T.; Shao, G. Assessment of Regional Ecosystem Health—A Case Study of the Golden Triangle of Southern Fujian Province, China. Int. J. Environ. Res. Public Health 2018, 15, 802. [Google Scholar] [CrossRef]
  41. Zheng, P.; Jin, L.; Huang, Y.; Pan, W. Spatial and Temporal Dynamic Evolution and Correlation of Ecological Quality and Ecosystem Service Value in Fujian Province. Sustainability 2024, 16, 5063. [Google Scholar] [CrossRef]
  42. Li, X.; Fan, Z.; Sha, J.; Sha, J.; Guo, X.; Zheng, C.; Shifaw, E.; Wang, J. The comparative study of urban ecosystem health change in Asian and African coastal cities—Changle in China and Suez in Egypt. Ecol. Indic. 2024, 159, 111648. [Google Scholar] [CrossRef]
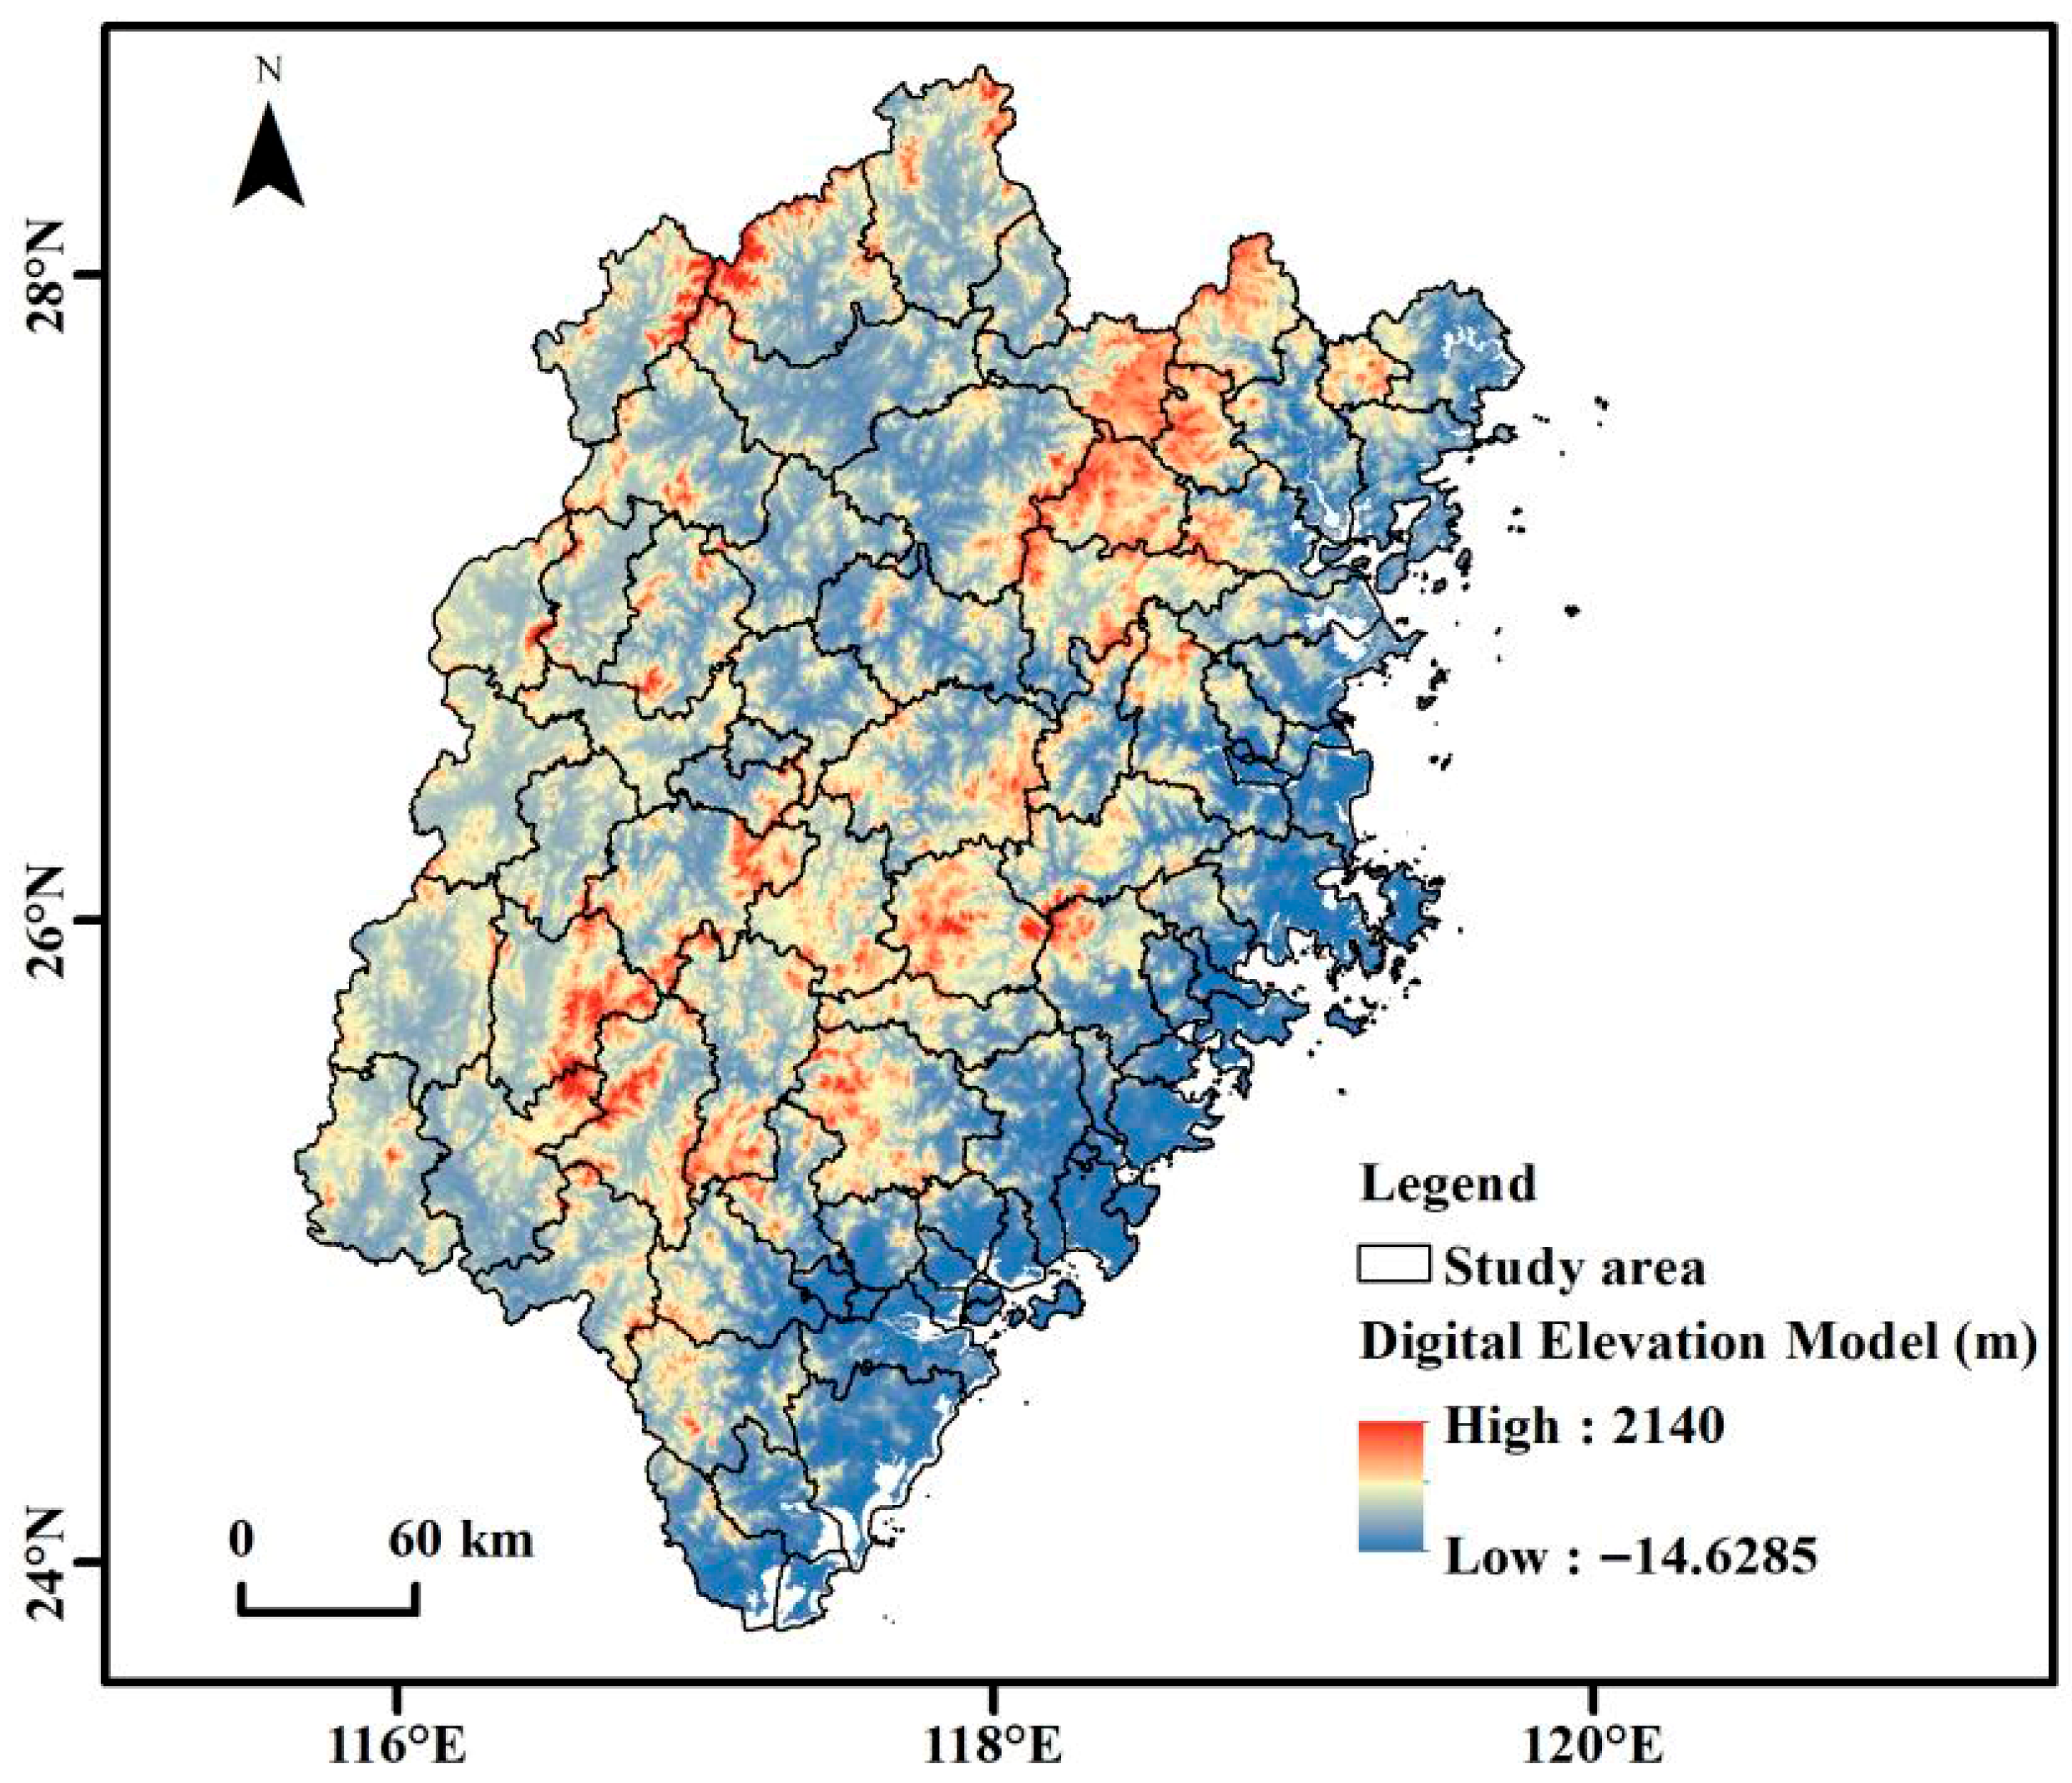
Figure 1. Overview of the study area in Fujian Province.
Forests 16 01518 g001
Figure 2. Technology roadmap.
Forests 16 01518 g002
Figure 3. Overall Status of EHI in Counties from 2000 to 2020.
Forests 16 01518 g003
Figure 4. Spatial distribution pattern of EH components in Fujian Province.
Forests 16 01518 g004
Figure 5. Spatiotemporal Pattern of EHI in Fujian Province from 2000 to 2020.
Forests 16 01518 g005
Figure 6. LISA Cluster Map of EH in Counties of Fujian Province.
Forests 16 01518 g006
Figure 7. Ecological Health Management Zones for Counties in Fujian Province.
Forests 16 01518 g007
Table 1. Methods for quantifying different ES capacities.
ES TypeCalculation MethodFormula
sequestrationThe research performed a comprehensive assessment of carbon sequestration across four principal carbon reservoirs: Subterranean biomass, aerial biomass, necromass, and edaphic organic matter. The total regional carbon storage was methodically calculated by utilizing the average carbon density and the area associated with each land use/cover type [37]. CS total = CS above + CS below + CS soil + CS dead
where CStotal denotes the total ecosystem carbon storage; CSabove refers to above ground carbon storage; CSbelow indicates below ground carbon storage; CSsoil stands for soil carbon storage; and CSdead represents the carbon storage in dead organic matter.
Soil conservationThis study utilized the revised Universal Soil Loss Equation (USLE) model to evaluate the present and potential soil erosion levels in the region. By calculating the difference between the two, a spatially explicit quantitative assessment of regional soil retention was achieved [38]. A s = A p A a
A p = R i × K i × L i S i
Aa = Ri × Ki × LSi × Ci × Pi
In this equation, As denotes the amount of soil retained per unit area (t/(hm2·a)); Aa and Ap are the actual and potential soil erosion per unit area (t/(hm2·a)), respectively. Ri is the rainfall erosivity factor for the i-th grid cell (MJ mm hm−2 h−1); Ki indicates the soil erodibility factor; Si and Li represent coefficients for slope gradient and slope length.
Meanwhile, Ci and Pi represent vegetation cover management factors and protective practice factors.
Grain supplyThe regional food supply function is closely tied to food production, playing a vital role in ensuring food security and advancing regional sustainable development [39]. This research, utilizing county-level grain yield, land distribution, and NDVI data from Fujian Province, uncovers the spatial distribution characteristics of food supply functions between 2000 and 2020, with a spatial resolution of 30 m. F i = NDVI i NDVI sum × F sum
In the equation: Fi refers to the total grain production of the i-th grid unit; NDVIi is the NDVI value of the i-th grid cell on cultivated land; NDVIsum refers to the total sum of NDVI values for the cultivated land within a particular county-level unit. Fsum is the total grain output of the county.
Water yieldThe representation of water yield capacity was based on the principle of water balance, calculated as the difference between precipitation and actual evapotranspiration at the grid-cell level. The settings and selection of key parameters, such as potential and actual evapotranspiration, were determined with reference to previous studies [29] and the InVEST model user guide to ensure scientific rigor and comparability of the results. W i = ( 1 ( AET ( i ) P ( i ) ) ) × P ( i )
where Wi represents the water yield of grid cell i, indicating its potential water conservation capacity;
AETi denotes the annual actual evapotranspiration of grid cell i;
and P(i) refers to the annual precipitation of grid cell i.
Table 2. Data source.
Data TypeIndexYearResolution Ratio/m Data Source
Land useTypes of land use2000, 2010, 202030China Land Cover Dataset, CLCD (https://zenodo.org/record/8176941, accessed on 16 August 2025) [3]
Administrative divisionProvincial and county-level administrative divisions2020/Chinese Academy of Sciences Resource and Environmental Science Data Center (http://www.resdc.cn, accessed on 17 May 2025) [29]
Vegetational coverageNormalized Difference Vegetation Index (NDVI)2000, 2010, 202030Chinese Academy of Sciences Resource and Environmental Science Data Center (http://www.resdc.cn, accessed on 17 May 2025) [6]
Soil statusSoil texture20191 000World Soil Database of the National Tibetan Plateau Data Center (HWSD) Soil dataset (https://data.tpdc.ac.cn, accessed on 24 April 2025) [28]
LandformsDigital Elevation Model (DEM)202030Geospatial Data Cloud (https://www.gscloud.cn, accessed on 12 January 2025) [15]
Climatic conditionPrecipitation2000, 2010, 202030Monthly Dataset of Meteorological Elements Observed at Chinese Weather Stations (https://www.resdc.cn, accessed on 12 February 2025) [11]
Grain productionGrain yield2000, 2010, 2020/Statistical Yearbook of China’s Counties [28]
Table 3. Statistics of EHI Types in the Counties of Fujian Province for 2000, 2010, and 2020.
YearNumber of Low Health CountiesPercentage/%Number of Less Healthy CountiesPercentage/%Number of Moderately Healthy CountiesPercentage/%Number of Higher Health CountiesPercentage/%Number of Highly Healthy CountiesPercentage/%
20001517.86910.711720.243541.6789.52
20102023.812428.572529.763440.481619.04
20202023.8155.951315.481720.243035.71
Table 4. Moran’s Index of EHI in the Counties of Fujian Province.
YearsMoran’s IndexZ-Valuep-Value
20000.6417.8480
20100.7579.1890
20200.7769.3920
Table 5. Ecological Health Management Zones in Counties of Fujian Province.
TypeInclude RegionsManagement Objective
Ecological conservation zonesIII-3Leveraging the natural restoration capacity of ecosystems and integrating regional environmental features, optimize the ecological spatial structure, enhance ecological functions and biodiversity protection, and realize sustainable development.
Ecological enhancement zonesI-3, II-2Honor natural processes, allow ecosystems to evolve independently, restrict the negative effects of human activities on ecological spaces, carry out ecological restoration projects, and promote models of sustainable development.
Ecological
reshaping
zones
I-1, I-2, II-1In necessary cases, actively intervene through human efforts, using scientific methods to rebuild or restore damaged ecosystems, promote positive ecological succession, and enhance their function and stability.
Disclaimer/Publisher’s Note: The statements, opinions and data contained in all publications are solely those of the individual author(s) and contributor(s) and not of MDPI and/or the editor(s). MDPI and/or the editor(s) disclaim responsibility for any injury to people or property resulting from any ideas, methods, instructions or products referred to in the content.