Exploring Preference Heterogeneity and Acceptability for Forest Restoration Policies: Latent Class Choice Modeling and Principal Component Analysis
Abstract
1. Introduction
2. Discrete Choice Framework and Model Specification
2.1. Evidence on Preference Heterogeneity and Environmental Risks
2.2. Choice Experiment and Model Specification
3. Empirical Study
3.1. Attributes, Experimental Design, and Scenario
3.2. Results
3.2.1. The Sample Demographics of the Respondents
3.2.2. Results from the PCA-Based Classification of Latent Environmental Attitudes and Behaviors
3.2.3. Results of Classifying Latent Environmental Groups Using LCM Based on Environmental Attitudes and Behaviors
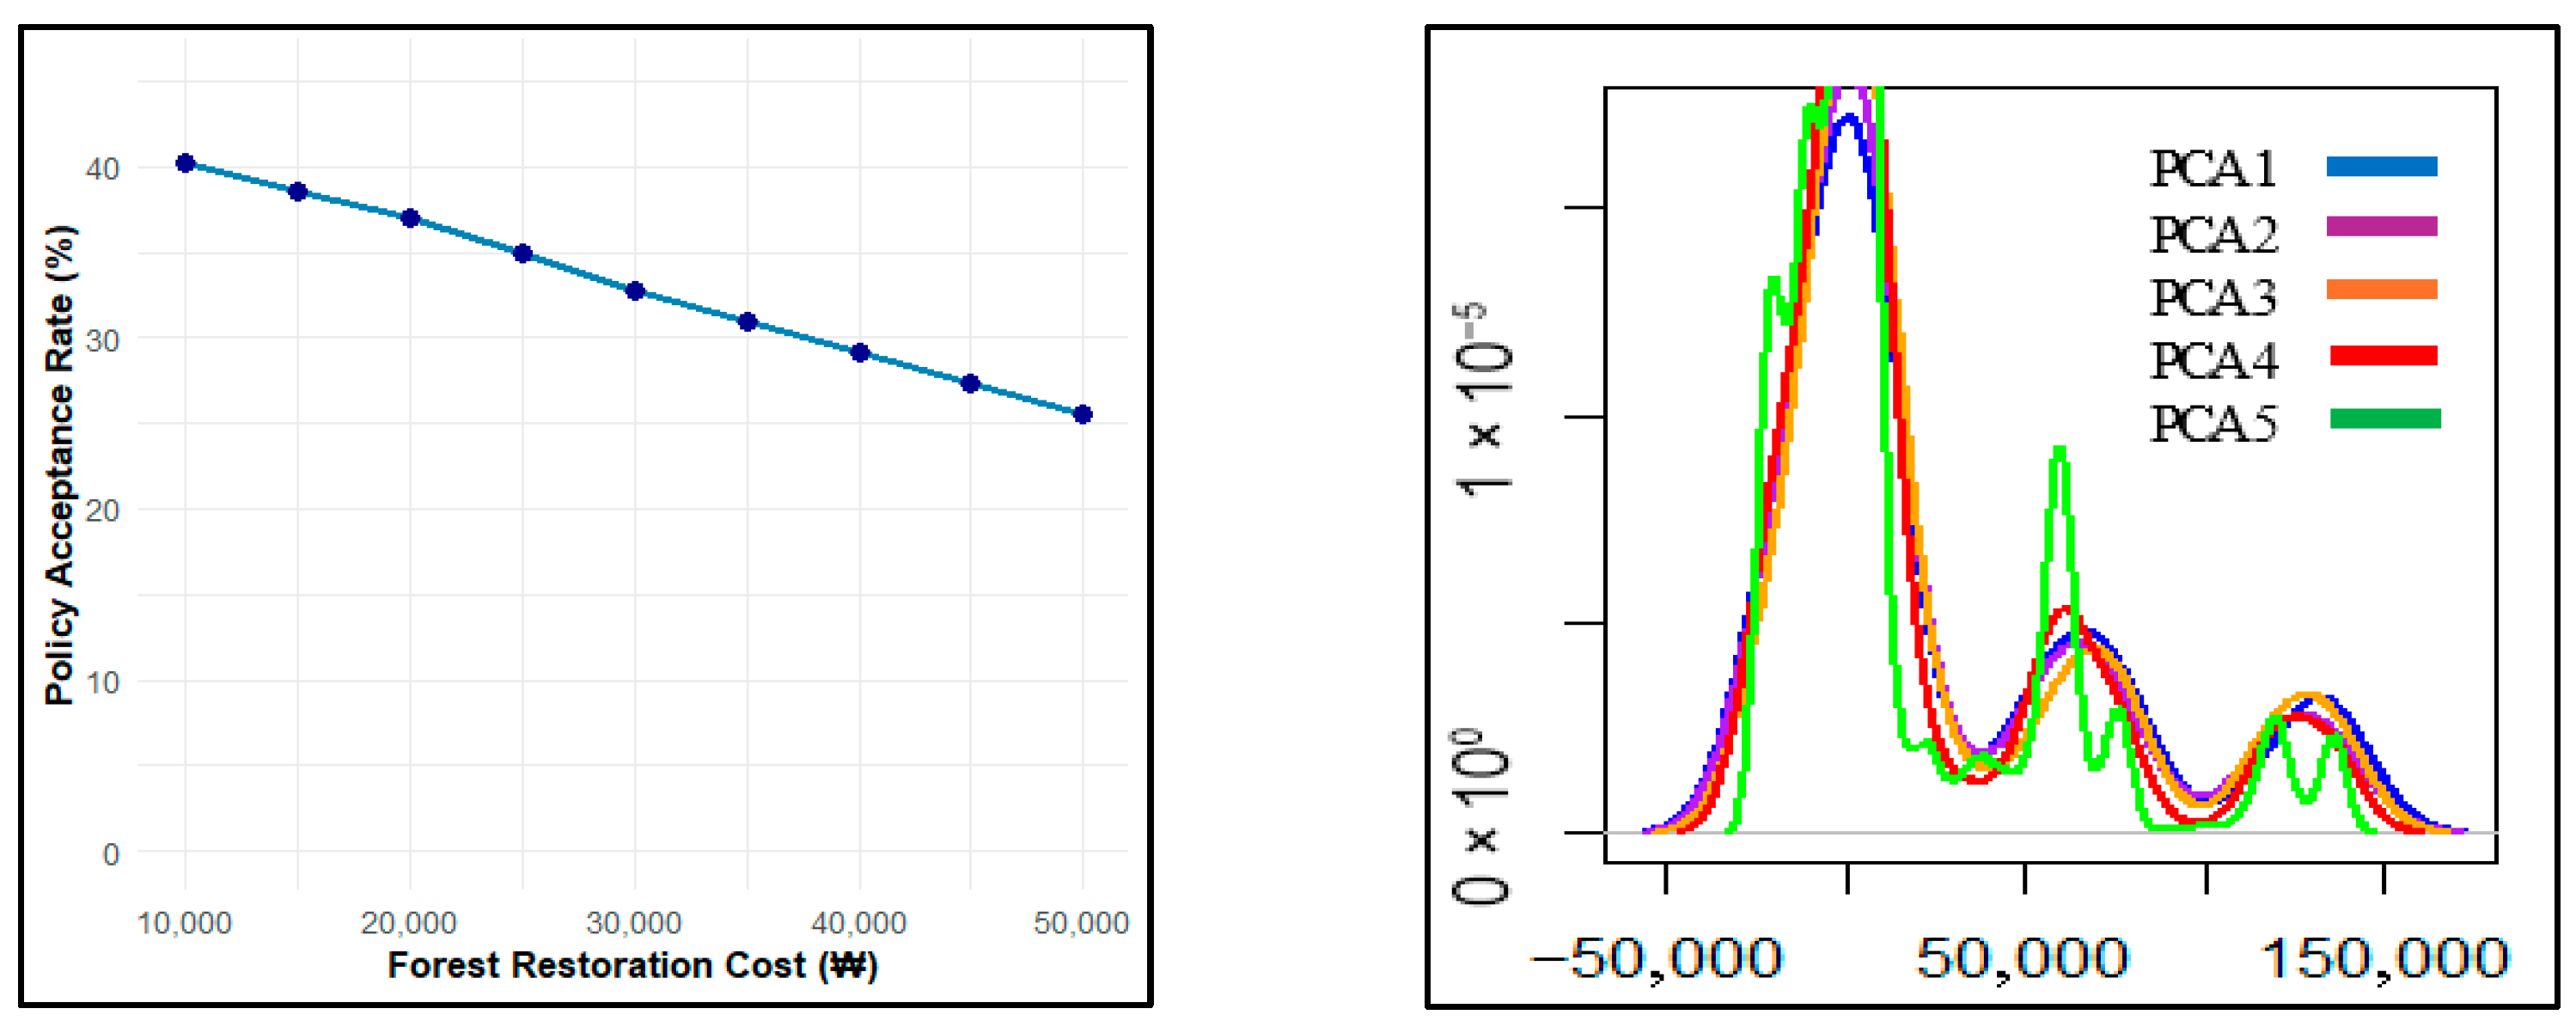
3.2.4. Simulation Results for Forest Restoration Policy Acceptance Using LCM
- -
- is the total policy acceptance rate across the population;
- -
- is the probability of belonging to Latent Class C;
- -
- is the multinomial logit-based choice probability for the policy in Class C.
4. Discussion
5. Conclusions
Author Contributions
Funding
Institutional Review Board Statement
Data Availability Statement
Conflicts of Interest
Abbreviations
| LCM | Latent class choice modeling |
| PCA | Principal component analysis |
| WTP | Willingness to pay |
| ASC | Alternative-specific constant |
| SFM | Sustainable forest management |
Appendix A
| Variables | Description of Variables | Frequencies (Ratio) | Mean | Standard Deviation |
|---|---|---|---|---|
| Gender | 1. Male | 452 (44.3%) | 1.56 | 0.49 |
| 2. Female | 569 (55.7%) | |||
| Age | 1. 20 ~ 29 | 178 (17.4%) | 2.6 | 1.16 |
| 2. 30 ~ 39 | 352 (34.5%) | |||
| 3. 40 ~ 49 | 269 (26.3%) | |||
| 4. 50 ~ 59 | 140 (13.7%) | |||
| 5. Older than 60 | 82 (8.0%) | |||
| Education | 1. Primary school or below | 3 (0.3%) | 3.96 | 0.57 |
| 2. Secondary school | 7 (0.7%) | |||
| 3. High school | 146 (14.3%) | |||
| 4. University | 732 (71.7%) | |||
| 5. Postgraduate or above | 133 (13.0%) | |||
| Employment status | 1. Students | 43 (4.2%) | 2.13 | 1.59 |
| 2. Employed full time | 613 (60.0%) | |||
| 3. Housekeeper | 173 (16.9%) | |||
| 4. Public officer | 67 (6.6%) | |||
| 5. Unemployment | 64 (6.3%) | |||
| 6. Others | 61 (6.0%) | |||
| Monthly income level (in USD) | 1. Below KRW 2,000,000 (USD 1538) | 112 (11.0%) | 3.23 | 1.34 |
| 2. KRW 2,000,000~KRW 2,900,000 (USD 1538~USD 2231) | 225 (22.0%) | |||
| 3. KRW 3,000,000~KRW 3,900,000 (USD 2308~USD 3000) | 265 (26.0%) | |||
| 4. KRW 4,000,000~KRW 4,900,000 (USD 3077~USD 3769) | 155 (15.2%) | |||
| 5. More than KRW 5,000,000 (USD 3846) | 264 (25.9%) |
| Component | Initial Eigenvalues | Extraction Sums of Squared Loadings | Rotation Sums of Squared Loadings | ||||||
|---|---|---|---|---|---|---|---|---|---|
| Total | Percent of Variance | Cumulative Percent | Total | Percent of Variance | Cumulative Percent | Total | Percent of Variance | Cumulative Percent | |
| 1 | 5.13 | 25.66 | 25.66 | 5.13 | 25.66 | 25.66 | 2.75 | 13.75 | 13.75 |
| 2 | 2.83 | 14.17 | 39.84 | 2.83 | 14.17 | 39.84 | 2.69 | 13.47 | 27.23 |
| 3 | 1.40 | 7.03 | 46.87 | 1.40 | 7.03 | 46.87 | 2.32 | 11.61 | 38.84 |
| 4 | 1.24 | 6.21 | 53.09 | 1.24 | 6.21 | 53.09 | 2.20 | 11.01 | 49.86 |
| 5 | 1.03 | 5.16 | 58.26 | 1.03 | 5.16 | 58.25 | 1.67 | 8.39 | 58.25 |
| Attribute | Model I | Model II | Model III | Model IV | Model V | |
|---|---|---|---|---|---|---|
| Latent Class 1 | Forest fire.class1 | KRW 13,431.31 ** (USD 10.3) | KRW 61,933.74 *** (USD 47.4) | KRW 86,045.00 *** (USD 65.9) | KRW 54,939.13 *** (USD 42.1) | KRW −23,576.50 (USD −18.1) |
| Forest pests and diseases.class1 | KRW 9204.96 (USD 7.0) | KRW 20,441.79 (USD 15.7) | KRW 27,981.10 * (USD 21.4) | KRW 33,365.09 (USD 25.6) | KRW 62,244.18 (USD 47.7) | |
| Forest access restrictions.class1 | KRW −66.86 (USD −0.1) | KRW 1126.24 (USD 0.9) | KRW 2144.13 (USD 1.6) | KRW 668.24 (USD 0.5) | KRW 6272.59 (USD 4.8) | |
| Forest Biodiversity loss.class1 | KRW 86.52 (USD 0.1) | KRW 53.87 (USD 0.0) | KRW 487.49 (USD 0.4) | KRW 1855.59 (USD 1.4) | KRW −10,773.68 (USD −8.3) | |
| Latent Class 2 | Forest fire.class2 | - | KRW −4790.48 (USD -3.7) | KRW 171,195.40 (USD 131.1) | KRW −21,250.62 (USD −16.3) | KRW −11,412.56 *** (USD −8.7) |
| Forest pest and disease.class2 | - | KRW 3403.32 (USD 2.6) | KRW 55,180.60 (USD 42.3) | KRW −30,880.53 (USD −23.6) | KRW 1479.51 (USD 1.1) | |
| Forest access restrictions.class2 | - | KRW −723.44 (USD -0.6) | KRW 22,304.35 (USD 17.1) | KRW −4322.33 (USD −3.3) | KRW −311.10 (USD −0.2) | |
| Forest Biodiversity loss.class2 | - | KRW −215.01 (USD −0.2) | KRW −65,910.20 (USD −50.5) | KRW 1956.75 (USD 1.5) | KRW −1859.05 (USD −1.4) | |
| Latent Class 3 | Forest fire.class3 | - | - | KRW −4621.50 (USD −3.5) | KRW 90,643.93 *** (USD 69.4) | KRW 1154.55 (USD 0.9) |
| Forest pests and diseases.class3 | - | - | KRW 4740.00 (USD 3.6) | KRW −13,063.63 (USD −10.0) | KRW 5318.51 (USD 4.1) | |
| Forest access restrictions.class3 | - | - | KRW −632.18 * (USD −0.5) | KRW 2066.44 (USD 1.6) | KRW −871.41 * (USD −0.7) | |
| Forest Biodiversity loss.class3 | - | - | KRW −816.95 (USD −0.6) | KRW 785.07 (USD 0.6) | KRW −670.35 (USD 0.5) | |
| Latent Class 4 | Forest fire.class4 | - | - | - | KRW −7933.60 * (USD −6.1) | KRW 135,919.37 ** (USD 104.1) |
| Forest pests and diseases.class4 | - | - | - | KRW 3497.82 (USD 2.7) | KRW 77,053.85 (USD 59.0) | |
| Forest access restrictions.class4 | - | - | - | KRW −458.98 (USD −0.4) | KRW 2311.65 (USD 1.8) | |
| Forest Biodiversity loss.class4 | - | - | - | KRW −888.75 (USD −0.7) | KRW 7976.62 (USD 6.1) | |
| Latent Class 5 | Forest fire.class5 | - | - | - | - | KRW 119,550.87 *** (USD 91.6) |
| Forest pests and diseases.class5 | - | - | - | - | KRW −22,697.46 (USD −17.4) | |
| Forest access restrictions.class5 | - | - | - | - | KRW 1625.52 (USD 1.2) | |
| Forest Biodiversity loss.class5 | - | - | - | - | KRW 809.03 (USD 0.6) |
Appendix B
| 1. To what extent do you personally agree with the following statements? | ||||
| Items | Mean | Mode | Standard deviation | |
| 1. I am the kind of person who loves spending time in wild, untamed wilderness areas. | 3.55 | 4 | 0.96 | |
| 2. Being out in nature is a great stress reducer for me. | 3.95 | 4 | 0.79 | |
| 3. I have a sense of well-being in the silence of nature. | 3.99 | 4 | 0.78 | |
| 4. I find it more interesting in the forest looking at trees and birds than in a shopping mall. | 3.64 | 4 | 0.96 | |
| 5. Nature is important because of what it can contribute to the pleasure and welfare of humans. | 4.15 | 4 | 0.81 | |
| 6. What concerns me most about deforestation is that there will not be enough lumber for future generations. | 3.72 | 4 | 1.00 | |
| 7. We should protect the environment for the well-being of plants and animals rather than for the welfare of humans. | 3.56 | 4 | 1.01 | |
| 8. Conservation is important even if it lowers peoples’ standard of living. | 3.71 | 4 | 0.92 | |
| 2. To what extent do you personally agree with the following statements? | ||||
| Items | Mean | Mode | Standard deviation | |
| 1. Most environmental problems can be solved by applying more and better technology. | 3.53 | 4 | 0.91 | |
| 2. Science and technology will eventually solve our problems with pollution, overpopulation, and diminishing resources. | 3.54 | 4 | 0.95 | |
| 3. If things continue their present course, we will soon experience a major ecological catastrophe. | 4.08 | 4 | 0.82 | |
| 4. The Earth is like a spaceship with very limited room and resources. | 4.03 | 4 | 0.82 | |
| 5. The balance of nature is very delicate and easily upset. | 3.84 | 4 | 0.89 | |
| 3. To what extent do you personally agree with the following statements? | ||||
| Items | Mean | Mode | Standard deviation | |
| 1. I make sure that during the winter the heating system in my room is not switched on too high. | 3.98 | 4 | 0.77 | |
| 2. In my daily life I try to find ways to conserve water or power. | 3.95 | 4 | 0.81 | |
| 3. Even if public transportation was more efficient than it is, I would prefer to drive my car. | 2.94 | 2 | 1.24 | |
| 4. It is all right for humans to use nature as a resource for economic purposes. | 3.08 | 3 | 1.03 | |
| 5. The question of the environment is secondary to economic growth. | 3.57 | 4 | 1.07 | |
| 6. The benefits of modern consumer products are more important than the pollution that results from their production and use. | 2.97 | 2 | 1.13 | |
| 7. I would like to join and actively participate in an environmentalist group. | 3.20 | 3 | 1.02 | |
| Variables | Components | ||||
|---|---|---|---|---|---|
| 1 | 2 | 3 | 4 | 5 | |
| A3_6 | 0.782 | −0.018 | −0.108 | 0.189 | −0.148 |
| A3_4 | 0.752 | 0.021 | −0.155 | 0.095 | −0.096 |
| A2_2 | 0.656 | 0.130 | 0.017 | −0.074 | 0.457 |
| A2_1 | 0.610 | 0.109 | 0.084 | −0.047 | 0.492 |
| A3_5 | 0.593 | 0.033 | 0.259 | 0.022 | 0.026 |
| A3_3 | 0.545 | 0.085 | −0.195 | 0.360 | −0.203 |
| A1_3 | 0.025 | 0.758 | 0.296 | 0.078 | 0.064 |
| A1_2 | 0.052 | 0.756 | 0.199 | 0.202 | 0.143 |
| A1_4 | 0.087 | 0.727 | 0.033 | 0.188 | 0.004 |
| A1_1 | 0.096 | 0.689 | 0.051 | 0.238 | 0.102 |
| A2_4 | −0.061 | 0.159 | 0.806 | 0.087 | 0.094 |
| A2_3 | −0.073 | 0.188 | 0.724 | 0.167 | 0.143 |
| A2_5 | 0.078 | 0.104 | 0.655 | 0.273 | 0.079 |
| A1_5 | −0.089 | 0.461 | 0.462 | −0.073 | 0.230 |
| A1_7 | 0.098 | 0.164 | 0.168 | 0.725 | 0.090 |
| A3_7 | 0.213 | 0.123 | 0.050 | 0.704 | 0.102 |
| A1_8 | −0.081 | 0.344 | 0.183 | 0.624 | 0.195 |
| A1_6 | 0.092 | 0.170 | 0.330 | 0.485 | 0.113 |
| A3_1 | −0.090 | 0.096 | 0.187 | 0.148 | 0.698 |
| A3_2 | −0.017 | 0.158 | 0.140 | 0.315 | 0.689 |
| Class 1 (n = 150) | Class 2 (n = 138) | Class 3 (n = 206) | Class 4 (n = 281) | Class 5 (n = 246) | ||||||
|---|---|---|---|---|---|---|---|---|---|---|
| Mean | Standard Deviation | Mean | Standard Deviation | Mean | Standard Deviation | Mean | Standard Deviation | Mean | Standard Deviation | |
| Socioeconomic background | ||||||||||
| Gender | 1.52 | 0.50 | 1.51 | 0.50 | 1.46 | 0.49 | 1.58 | 0.49 | 1.67 | 0.47 |
| Age | 37.63 | 8.77 | 41.49 | 12.45 | 36.75 | 11.07 | 42.26 | 12.26 | 42.69 | 11.31 |
| Income | 3.11 | 1.20 | 3.03 | 1.33 | 3.33 | 1.36 | 3.30 | 1.34 | 3.26 | 1.38 |
| Education | 3.95 | 0.41 | 3.75 | 0.62 | 3.99 | 0.56 | 4.01 | 0.58 | 4.02 | 0.58 |
| Environmental attitudes and behaviors | ||||||||||
| A1_1 | 4.26 | 0.54 | 3.12 | 0.70 | 2.85 | 1.16 | 3.58 | 0.67 | 2.39 | 1.73 |
| A1_2 | 4.68 | 0.49 | 3.21 | 0.61 | 3.48 | 0.96 | 3.90 | 0.33 | 3.91 | 0.90 |
| A1_3 | 4.56 | 0.52 | 3.27 | 0.66 | 3.58 | 0.97 | 3.97 | 0.45 | 4.37 | 0.58 |
| A1_4 | 4.36 | 0.67 | 3.17 | 0.70 | 3.05 | 1.17 | 3.65 | 0.65 | 4.40 | 0.58 |
| A1_5 | 4.47 | 0.60 | 3.40 | 0.63 | 3.90 | 1.06 | 4.05 | 0.51 | 3.96 | 0.89 |
| A1_6 | 4.47 | 0.57 | 3.22 | 0.62 | 3.08 | 1.18 | 3.74 | 0.73 | 4.71 | 0.50 |
| A1_7 | 4.49 | 0.55 | 3.03 | 0.71 | 2.97 | 1.16 | 3.63 | 0.76 | 4.04 | 1.04 |
| A1_8 | 4.50 | 0.51 | 3.07 | 0.65 | 3.00 | 1.10 | 3.72 | 0.58 | 3.72 | 0.98 |
| A2_1 | 4.23 | 0.69 | 3.29 | 0.55 | 3.36 | 1.01 | 3.55 | 0.72 | 4.16 | 0.70 |
| A2_2 | 4.37 | 0.83 | 3.31 | 0.60 | 3.45 | 1.03 | 3.52 | 0.71 | 3.35 | 1.07 |
| A2_3 | 4.46 | 0.68 | 3.30 | 0.60 | 3.74 | 1.04 | 4.00 | 0.53 | 3.28 | 1.07 |
| A2_4 | 4.38 | 0.65 | 3.28 | 0.59 | 3.68 | 1.06 | 3.93 | 0.48 | 4.68 | 0.46 |
| A2_5 | 4.50 | 0.57 | 3.19 | 0.57 | 3.34 | 1.05 | 3.82 | 0.53 | 4.62 | 0.54 |
| A3_1 | 4.35 | 0.53 | 3.46 | 0.56 | 3.64 | 1.00 | 3.95 | 0.48 | 4.25 | 0.88 |
| A3_2 | 4.58 | 0.55 | 3.49 | 0.60 | 3.48 | 1.00 | 3.89 | 0.47 | 4.37 | 0.73 |
| A3_3 | 4.44 | 0.78 | 3.22 | 0.68 | 2.74 | 1.25 | 2.89 | 1.00 | 4.28 | 0.75 |
| A3_4 | 4.11 | 0.98 | 3.18 | 0.56 | 3.19 | 0.95 | 3.18 | 0.79 | 2.11 | 1.08 |
| A3_5 | 4.43 | 0.57 | 3.36 | 0.55 | 3.59 | 1.01 | 3.50 | 0.87 | 2.18 | 0.81 |
| A3_6 | 4.36 | 0.71 | 3.21 | 0.54 | 3.04 | 1.09 | 2.98 | 0.88 | 3.24 | 1.44 |
| A3_7 | 4.13 | 1.16 | 2.86 | 0.71 | 2.54 | 1.07 | 3.31 | 0.69 | 1.91 | 0.79 |
| Follow-up questions: WTP resistance, attribute ranking, consequentiality, questionnaire relevant questions, others | ||||||||||
| D1_1 | 3.48 | 1.23 | 3.40 | 0.73 | 3.21 | 1.09 | 3.36 | 0.77 | 3.25 | 0.88 |
| D1 _2 | 3.65 | 1.14 | 3.40 | 0.55 | 3.49 | 0.85 | 3.46 | 0.65 | 3.17 | 1.04 |
| D1_3 | 3.13 | 1.35 | 2.97 | 0.72 | 2.87 | 1.03 | 2.69 | 0.88 | 3.59 | 0.70 |
| D1_4 | 3.13 | 1.33 | 3.04 | 0.66 | 2.67 | 1.12 | 2.63 | 0.92 | 2.39 | 0.91 |
| D1_5 | 3.23 | 1.26 | 3.03 | 0.74 | 3.18 | 1.05 | 2.91 | 0.89 | 2.22 | 0.98 |
| D1_6 | 3.31 | 1.34 | 3.20 | 0.68 | 3.10 | 1.12 | 2.93 | 0.84 | 2.54 | 0.99 |
| D1_7 | 3.50 | 1.17 | 3.40 | 0.73 | 3.54 | 0.99 | 3.43 | 0.84 | 2.74 | 1.08 |
| D1_8 | 3.50 | 1.21 | 3.34 | 0.69 | 3.43 | 0.96 | 3.22 | 0.81 | 3.33 | 1.07 |
| D1_9 | 2.79 | 1.44 | 2.93 | 0.66 | 2.73 | 1.10 | 2.43 | 0.86 | 3.03 | 1.05 |
| D2_1 | 2.00 | 1.16 | 1.70 | 1.13 | 2.05 | 1.29 | 1.91 | 1.36 | 1.78 | 0.70 |
| D2_2 | 2.65 | 1.19 | 2.75 | 1.13 | 2.54 | 1.22 | 2.68 | 1.13 | 1.98 | 1.38 |
| D2_3 | 2.91 | 1.28 | 3.08 | 1.13 | 2.88 | 1.16 | 3.03 | 1.20 | 2.64 | 1.15 |
| D2_4 | 3.44 | 1.19 | 3.30 | 1.20 | 3.30 | 1.19 | 3.30 | 1.13 | 2.91 | 1.21 |
| D2_5 | 4.00 | 1.34 | 4.17 | 1.21 | 4.23 | 1.14 | 4.09 | 1.25 | 3.29 | 1.14 |
| D3_1 | 4.11 | 0.68 | 3.18 | 0.65 | 3.04 | 1.00 | 3.48 | 0.66 | 4.18 | 1.15 |
| D3_2 | 4.19 | 0.72 | 3.10 | 0.62 | 3.08 | 0.99 | 3.36 | 0.73 | 3.35 | 0.89 |
| D4_1 | 4.16 | 0.68 | 3.28 | 0.63 | 3.47 | 0.94 | 3.52 | 0.60 | 3.34 | 0.93 |
| D4_2 | 4.25 | 0.77 | 3.34 | 0.64 | 3.52 | 0.79 | 3.56 | 0.62 | 3.71 | 0.73 |
| D4_3 | 4.24 | 0.77 | 3.30 | 0.63 | 3.42 | 0.86 | 3.63 | 0.65 | 3.79 | 0.69 |
| D4_4 | 4.04 | 0.86 | 3.26 | 0.68 | 3.33 | 0.98 | 3.34 | 0.75 | 3.88 | 0.78 |
| D4_5 | 4.28 | 0.72 | 3.34 | 0.58 | 3.33 | 0.93 | 3.52 | 0.63 | 3.40 | 0.98 |

References
- Jin, S.; Reeb, D.; Bae, K.; Lee, B.K. Integrated Policy for Forests, Food Security and Sustainable Livelihoods: Lessons from the Republic of Korea; FAO: Rome, Italy, 2016. [Google Scholar]
- Brown, L.R. Outgrowing the Earth; Earth Policy Institute: Washington, DC, USA, 2005; Available online: http://www.earth-policy.org/ (accessed on 12 August 2023).
- Korea Forest Service (KFS). 2023 Statistical Yearbook of Forestry; KFS: Daejeon, Republic of Korea, 2023.
- Zenni, R.D.; Essl, F.; Barcia-Berthou, E.; McDermott, S.M. The economic costs of biological invasions around the world. NeoBiota 2021, 67, 1–9. [Google Scholar] [CrossRef]
- Kwon, T.S.; Shin, J.H.; Lim, J.H.; Kim, Y.K.; Lee, E.J. Management of pine wilt disease in Korea through preventative silvicultural control. For. Ecol. Manage. 2011, 261, 562–569. [Google Scholar] [CrossRef]
- World Economic Forum. Successful Pilot Shows How Artificial Intelligence Can Fight Wildfires. 2023. Available online: https://www.weforum.org/press/2023/01/successful-pilot-shows-how-artificial-intelligence-can-fight-wildfires (accessed on 15 August 2023).
- Back, M.A.; Bonifácio, L.; Inácio, M.L.; Mota, M.; Boa, E. Pine wilt disease: A global threat to forestry. Plant Pathol. 2024, 73, 1026–1041. [Google Scholar] [CrossRef]
- American Phytopathological Society. Pine Wilt Disease. Available online: https://www.apsnet.org/edcenter/disandpath/nematode/pdlessons/Pages/PineWilt.aspx (accessed on 18 August 2023).
- FAO Regional Office for Asia and the Pacific. Asia-Pacific Forestry Focus; FAO: Bangkok, Thailand, 2010. [Google Scholar]
- Food and Agriculture Organization of the United Nations (FAO). Global Forest Resources Assessment 2020: Key Findings; FAO: Rome, Italy, 2020. [Google Scholar] [CrossRef]
- Diagne, C.; Leroy, B.; Vaissière, A.-C.; Gozlan, R.E.; Roiz, D.; Jarić, I.; Salles, J.-M.; Bradshaw, C.J.A.; Courchamp, F. High and rising economic costs of biological invasions worldwide. Nature 2021, 592, 571–576. [Google Scholar] [CrossRef]
- National Institute of Forest Science. The Gift of 50 Years of National Reforestation (on 2020 Years); Korea Forest Service: Daejeon, Republic of Korea, 2020.
- Hess, S.; Daly, A. Handbook of Choice Modelling, 2nd ed.; Edward Elgar Publishing: Cheltenham, UK, 2024. [Google Scholar]
- Boxall, P.C.; Adamowicz, W.L. Understanding heterogeneous preferences in random utility models: A latent class approach. Environ. Resour. Econ. 2002, 23, 421–446. [Google Scholar] [CrossRef]
- Yoon, T.K.; Ahn, S. Clustering Koreans’ environmental awareness and attitudes into seven groups: Environmentalists, dissatisfieds, inactivators, bystanders, honeybees, optimists, and moderates. Sustainability 2020, 12, 8370. [Google Scholar] [CrossRef]
- Faccioli, M.; Czajkowski, M.; Glenk, K.; Martin-Ortega, J. Environmental attitudes and place identity as determinants of preferences for ecosystem services. Ecol. Econ. 2020, 174, 106600. [Google Scholar] [CrossRef]
- Mariel, P.; Hoyos, D.; Meyerhoff, J.; Czajkowski, M.; Dekker, T.; Glenk, K.; Jacobsen, J.B.; Liebe, U.; Olsen, S.B.; Sagebiel, J.; et al. Environmental Valuation with Discrete Choice Experiments: Guidance on Design, Implementation and Data Analysis; Springer: Cham, Switzerland, 2021; ISSN 2191-5504. [Google Scholar]
- Broch, S.W.; Vedel, S.E. Using choice experiments to investigate the policy relevance of heterogeneity in farmer agri-environmental contract preferences. Environ. Resour. Econ. 2012, 51, 561–581. [Google Scholar] [CrossRef]
- Masiero, M.; Lesmeister, S.; Smith, P.L. Fire mitigates bark beetle outbreaks in serotinous forests. Theor. Ecol. 2019, 14, 611–621. [Google Scholar] [CrossRef]
- Korea Forest Service. Statistical Yearbook of Forestry and Forest-Related Industries 2021, 51st ed.; Korea Forest Service: Daejeon, Republic of Korea, 2023.
- FAO; UNEP. The State of the World’s Forests 2020: Forests, Biodiversity and People; FAO: Rome, Italy, 2020. [Google Scholar]
- Achille, L.; Rossi, F.; Martín, J.; Wang, Z. A review of segmentation approaches for predicting environmental behavior: Gaps in forest-related applications. Forests 2023, 14, 456. [Google Scholar] [CrossRef]
- Chen, W.Y.; Cho, F. Environmental information disclosure and societal preference for urban river restoration: Latent class modelling of a discrete-choice experiment. J. Clean. Prod. 2019, 231, 1294–1306. [Google Scholar] [CrossRef]
- Greene, W.H.; Hensher, D.A. A latent class model for discrete choice analysis: Contrasts with mixed logit. Transp. Res. Part B 2003, 37, 681–698. [Google Scholar] [CrossRef]
- Landau, S.; Everitt, B.S. A Handbook of Statistical Analyses Using SPSS; Chapman & Hall/CRC: Boca Raton, FL, USA, 2004. [Google Scholar]
- Gherghina, Ş.C. Quantitative Methods in Finance: Exploring the Drivers of Sustainable Economic Growth in the EU; Springer Nature: Cham, Switzerland, 2023. [Google Scholar]
- McFadden, D. Economic choices. Am. Econ. Rev. 2001, 91, 351–378. [Google Scholar] [CrossRef]
- Walker, J.L. Extended Discrete Choice Models: Integrated Framework, Flexible Error Structures, and Latent Variables. Ph.D. Thesis, Massachusetts Institute of Technology, Cambridge, MA, USA, 2001. [Google Scholar]
- Monteiro, M.; de Oliveira, A.; Souza, P. Latent class analysis of environmental behavior and psychological well-being: Insights into sustainable well-being practices. Sustainability 2024, 16, 10205. [Google Scholar] [CrossRef]
- Weller, B.E.; Bowen, N.K.; Faubert, S.J. Latent class analysis: A guide to best practice. J. Black Psychol. 2020, 46, 287–311. [Google Scholar] [CrossRef]
- Larsen, A.; Kolpacoff, V.; McCormack, K.; Seewaldt, V.; Hyslop, T. Using latent class modelling to jointly characterize economic stress and multipollutant exposure. Cancer Epidemiol. Biomark. Prev. 2020, 29, 1940–1948. [Google Scholar] [CrossRef]
- Rhead, R.; Elliot, M.; Upham, P. Using latent class analysis to produce a typology of environmental concern in the UK. Soc. Sci. Res. 2018, 74, 210–222. [Google Scholar] [CrossRef]
- Chen, W.Y.; Liekens, I.; Broekx, S. Identifying societal references for river restoration in a densely populated urban environment: Evidence from a discrete choice experiment in central Brussels. Environ. Manag. 2017, 60, 263–279. [Google Scholar] [CrossRef]
- Campbell, D.; Vedel, S.E.; Thorsen, B.J.; Jacobsen, J.G. Heterogeneity in the WTP for recreational access: Distributional aspects. J. Environ. Plan. Manag. 2014, 57, 1200–1219. [Google Scholar] [CrossRef]
- Diendere, A.A.; Kabore, D. Preferences for a payment for ecosystem services program to control forest fires in Burkina Faso: A choice experiment. For. Policy Econ. 2023, 151, 102973. [Google Scholar] [CrossRef]
- Reynaud, A.; Nguyen, M.H. Valuing flood risk reductions. Environ. Model. Assess. 2016, 21, 603–617. [Google Scholar] [CrossRef]
- Botzen, W.J.W.; van den Bergh, J.C.J.M. Risk attitudes to low-probability climate change risks: WTP for flood insurance. J. Econ. Behav. Organ. 2012, 82, 151–166. [Google Scholar] [CrossRef]
- Broch, S.W.; Vedel, S.E. Preference heterogeneity in payments for environmental services contracts: A latent class approach. Ecol. Econ. 2012, 74, 66–74. [Google Scholar] [CrossRef]
- Lancaster, K.J. A new approach to consumer theory. J. Polit. Econ. 1966, 74, 132–157. Available online: https://EconPapers.repec.org/RePEc:ucp:jpolec:v:74:y:1966:p:132 (accessed on 25 August 2024). [CrossRef]
- Train, K. Discrete Choice Methods with Simulation, 2nd ed.; Cambridge University Press: Cambridge, UK, 2009. [Google Scholar]
- Cameron, A.C.; Trivedi, P.K. Microeconometrics: Methods and Applications; Cambridge University Press: New York, NY, USA, 2005. [Google Scholar]
- Price, M.K. Using latent class models to analyze preference heterogeneity in choice experiments. Sustainability 2016, 8, 1234. [Google Scholar]
- Holmes, W.H.; Finch, W.H.; Marcoulides, G.A. Applying latent class models in environmental preference analysis. Sustainability 2017, 9, 567. [Google Scholar]
- Roach, M.; Crespi, G.; Lee, S. Applications of latent class models in consumer theory, market analysis, and environmental research: A review. Sustainability 2017, 9, 1023. [Google Scholar] [CrossRef]
- Lahoz, L.T.; Pereira, F.C.; Sfeir, G.; Arkoudi, I.; Monteiro, M.M.; Azevedo, C.L. Attitudes and latent class choice models using machine learning. J. Choice Model. 2023, 49, 100452. [Google Scholar] [CrossRef]
- Kotchen, M.J.; Reiling, S.D. Environmental attitudes, motivations, and contingent valuation of nonuse values: A case study involving endangered species. Ecol. Econ. 2000, 32, 93–107. [Google Scholar] [CrossRef]
- Hoedemakers, M.; Karimi, M.; Jonker, M.; Tsiachristas, A.; Rutten-van Molken, M. Heterogeneity in preferences for outcomes of integrated care for persons with multiple chronic diseases: A latent class analysis of a discrete choice experiment. Qual. Life Res. 2022, 31, 2775–2789. [Google Scholar] [CrossRef]
- Lowthian, E.; Page, N.; Melendez-Torres, G.J.; Murphy, S.; Hewitt, G.; Moore, G. Using latent class analysis to explore complex associations between socioeconomic status and adolescent health and well-being. J. Adolesc. Health 2021, 69, 774–781. [Google Scholar] [CrossRef]
- Roberts, K.; Jones, P.; Smith, A. Environmental attitudes and commuting mode choice: Evidence from a national survey. Transp. Res. Part D Transp. Environ. 2018, 63, 298–309. [Google Scholar]
- Roberts, J.; Popli, G.; Harris, R.J. Do Environmental Concerns Affect Commuting Choices? Hybrid Choice Modelling with Household Survey Data; Working Paper No. 2014019; University of Sheffield, Department of Economics: Sheffield, UK, 2014; Available online: https://EconPapers.repec.org/RePEc:shf:wpaper:2014019 (accessed on 28 August 2023).
- Vij, A.; Walker, J.L. How, when and why integrated choice and latent variable models are latently useful. Transp. Res. Part B Methodol. 2016, 90, 192–217. [Google Scholar] [CrossRef]
- Hess, S. Latent class structures: Taste heterogeneity and beyond. In Handbook of Choice Modelling; Hess, S., Daly, A., Eds.; Edward Elgar: Cheltenham, UK, 2014; pp. 311–330. [Google Scholar]
- IBM. What is Principal Component Analysis (PCA)? Available online: https://www.ibm.com/topics/principal-component-analysis (accessed on 5 September 2023).
- Hoyos, D. The state of the art of environmental valuation with discrete choice experiments. Ecol. Econ. 2010, 69, 1595–1603. [Google Scholar] [CrossRef]
- Milfont, T.; Duckitt, J. The environmental attitudes inventory: A valid and reliable measure to assess the structure of environmental attitudes. J. Environ. Psychol. 2010, 30, 80–94. [Google Scholar] [CrossRef]
- Welling, M.; Zawojska, E.; Sagebiel, J. Information, consequentiality and credibility in stated preference surveys: A choice experiment on climate adaptation. Environ. Resour. Econ. 2022, 82, 257–283. [Google Scholar] [CrossRef]
- Johnston, R.; Boyle, K.J.; Adamowicz, W.; Bennett, J.; Brouwer, R.; Cameron, T.A.; Hanemann, W.M.; Hanley, N.; Ryan, M.; Scarpa, R.; et al. Contemporary guidance for stated preference studies. J. Assoc. Environ. Resour. Econ. 2017, 4, 319–405. [Google Scholar] [CrossRef]
- Jeon, C. Understanding environmental decision-making in forest restoration: The role of latent attitudes, attribute non-attendance, and choice behavior. Front. Behav. Econ. 2025, 4, 1596416. [Google Scholar] [CrossRef]
- Prins, K.; Köhl, M.; Linser, S. Is the concept of sustainable forest management still fit for purpose? For. Policy Econ. 2023, 157, 103072. [Google Scholar] [CrossRef]
- Yoo, J.; Kim, M.; Gong, K.; Yoo, B. Economic valuation of forest ecosystem services in the Republic of Korea. J. Rural Econ. 2018, 33, 43–62. [Google Scholar]
- National Institute of Forest Science. Korea Forest Statistics Portal. Available online: https://nifos.forest.go.kr/kfsweb/kfs/subIdx/Index.do?mn=UKFR (accessed on 15 August 2023).
- Korea Forest Service. Statistical Yearbook of Forestry 2022, 52nd ed.; Korea Forest Service: Daejeon, Republic of Korea, 2022.
- Carson, R.T.; Groves, T.; List, J.A. Consequentiality: A theoretical and experimental exploration of a single binary choice. J. Assoc. Environ. Resour. Econ. 2014, 1, 171–207. [Google Scholar] [CrossRef]
- Hensher, D.A.; Rose, J.M.; Greene, W.H. Applied Choice Analysis: A Primer; Cambridge University Press: Cambridge, UK, 2005. [Google Scholar]
- Jolliffe, I.T. Principal Component Analysis, 2nd ed.; Springer: New York, NY, USA, 2002. [Google Scholar]
- Everitt, B.S.; Hothorn, T. A Handbook of Statistical Analyses Using R, 2nd ed.; Chapman & Hall/CRC: Boca Raton, FL, USA, 2010. [Google Scholar]
- Aizaki, H.; Nakatani, T.; Sato, K. Stated Preference Methods Using R; CRC Press: Boca Raton, FL, USA, 2015. [Google Scholar]
- Hess, S.; Palma, D. Apollo: A flexible, powerful and customisable freeware package for choice model estimation and application. J. Choice Model. 2019, 32, 100170. [Google Scholar] [CrossRef]
- Campbell, D.; Hensher, D.A.; Scarpa, R. Non-attendance to attributes in environmental choice analysis: A latent class specification. J. Environ. Plan. Manag. 2011, 54, 1061–1076. [Google Scholar] [CrossRef]
- Ben-Akiva, M. Hybrid Choice Models: Progress and Challenges. Mark. Lett. 2002, 13, 163–175. [Google Scholar] [CrossRef]
- Paulssen, M.; Temme, D.; Vij, A.; Walker, J.L. Values, Attitudes and Travel Behaviour: A Hierarchical Latent Variable Mixed Logit Model of Travel Mode Choice. Transportation 2014, 41, 873–888. [Google Scholar] [CrossRef]
- Mariel, P.; Meyerhoff, J. Hybrid Discrete Choice Models: Gained Insights versus Increasing Effort. Sci. Total Environ. 2016, 568, 433–443. [Google Scholar] [CrossRef]
- Hanley, N.; Wright, R.E.; Adamowicz, V. Using Choice Experiments to Value the Environment. Environ. Resour. Econ. 1998, 11, 413–428. [Google Scholar] [CrossRef]
- Meyerhoff, J.; Liebe, U. Protest beliefs in contingent valuation: Explaining their motivation. Ecol. Econ. 2006, 57, 583–594. [Google Scholar] [CrossRef]
- Loomis, J. What’s to know about hypothetical bias in stated preference valuation studies? J. Econ. Surv. 2011, 25, 363–370. [Google Scholar] [CrossRef]
- Chan, K.M.; Balvanera, P.; Benessaiah, K.; Chapman, M.; Díaz, S.; Gómez-Baggethun, E.; Gould, R.; Hannahs, N.; Jax, K.; Klain, S.; et al. Why protect nature? Rethinking values and the environment. Proc. Natl. Acad. Sci. USA 2016, 113, 1462–1465. [Google Scholar] [CrossRef] [PubMed]
- Stern, P.C. Toward a coherent theory of environmentally significant behavior. J. Soc. Issues 2000, 56, 407–424. [Google Scholar] [CrossRef]
- Birol, E.; Karousakis, K.; Koundouri, P. Using a choice experiment to account for preference heterogeneity in wetland attributes. Ecol. Econ. 2006, 60, 145–156. [Google Scholar] [CrossRef]
- Hensher, D.A.; Shore, N.; Train, K. Household willingness to pay for water service attributes. Environ. Resour. Econ. 2005, 32, 509–531. [Google Scholar] [CrossRef]
- Croson, R.; Treich, N. Behavioral environmental economics: Promises and challenges. Environ. Resour. Econ. 2014, 58, 335–351. [Google Scholar] [CrossRef]
- Schubert, C. Green nudges: Do they work? Are they ethical? Ecol. Econ. 2017, 132, 329–342. [Google Scholar] [CrossRef]
| Levels | Level 1 | Level 2 | Level 3 | Level 4 | |
|---|---|---|---|---|---|
| Attributes | |||||
| Forest fires | Extreme (Red) * | High level (Orange) | Moderate level (Yellow) | Low level (Blue) | |
 (Very high, 85↑) |  (High, 66~85) |  (Moderate, 51~65) |  (Low, 51↓) | ||
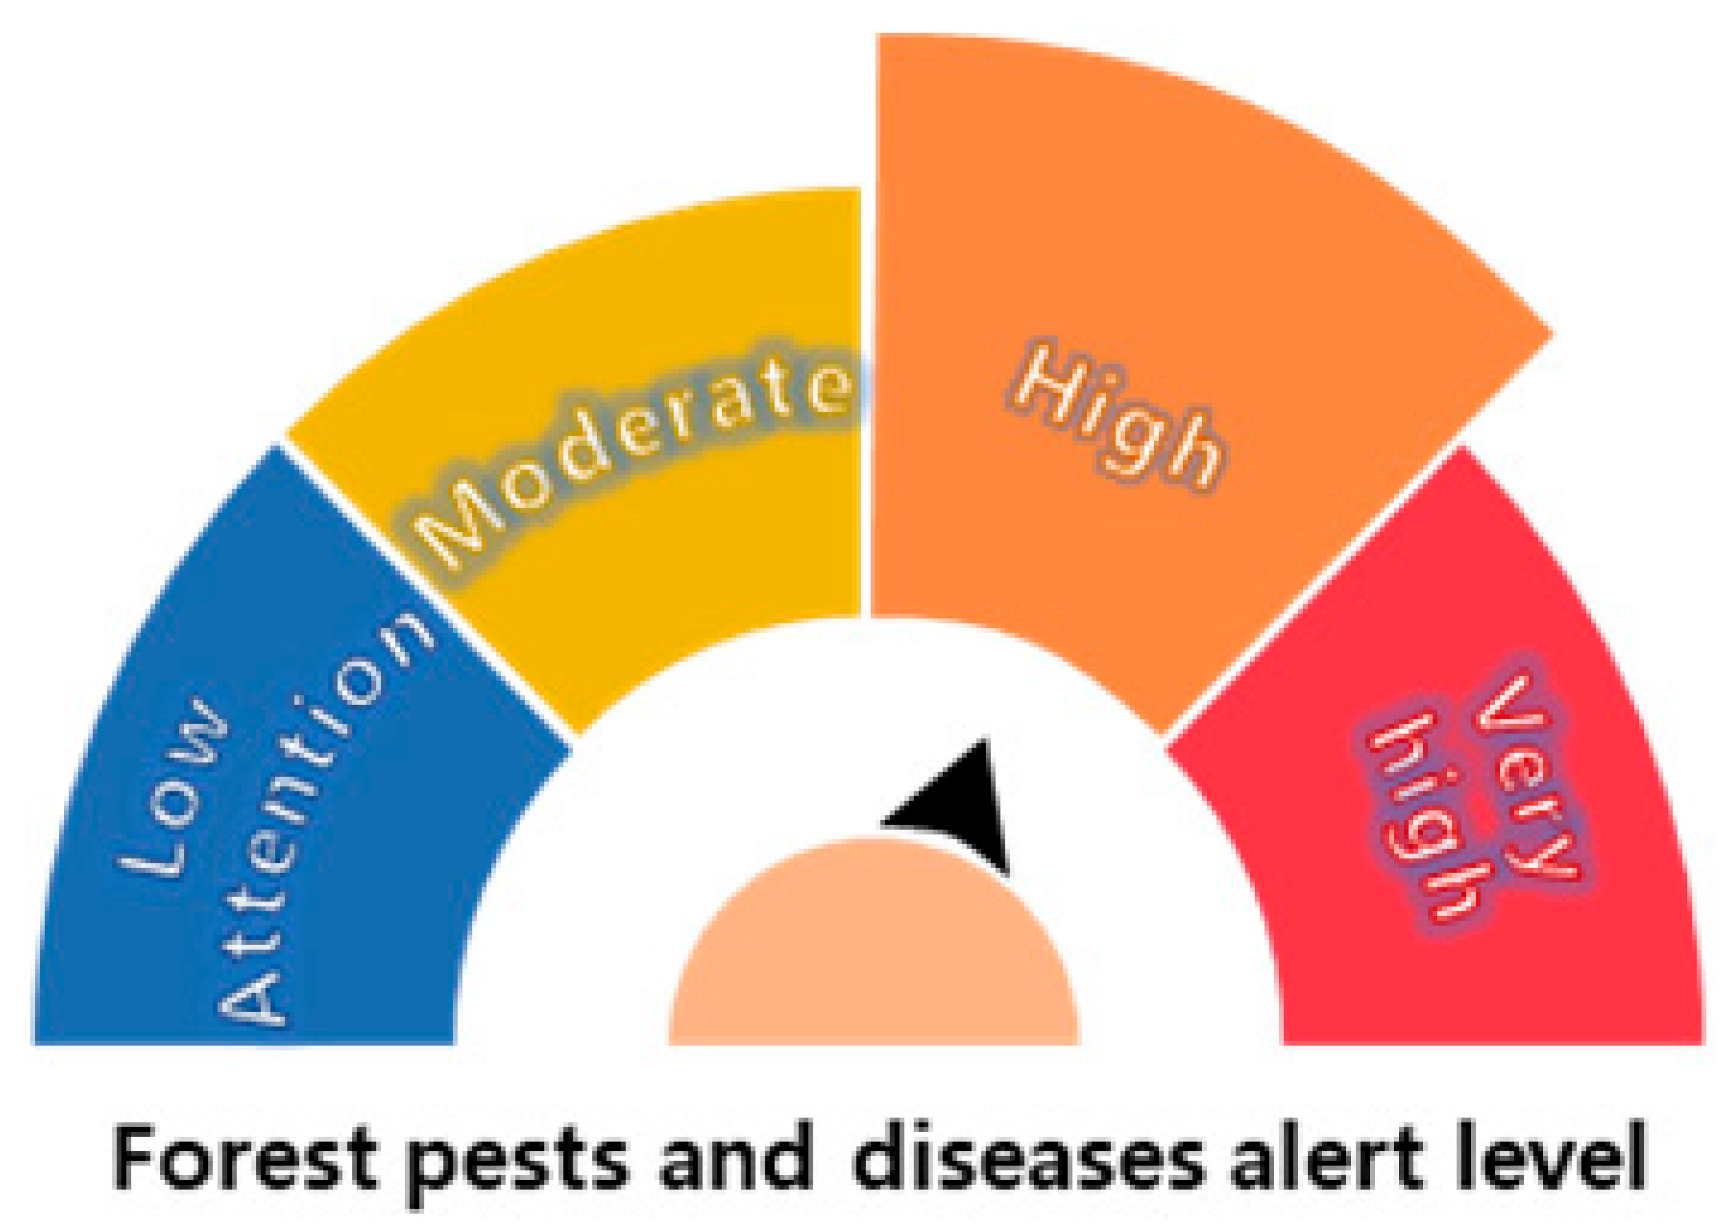
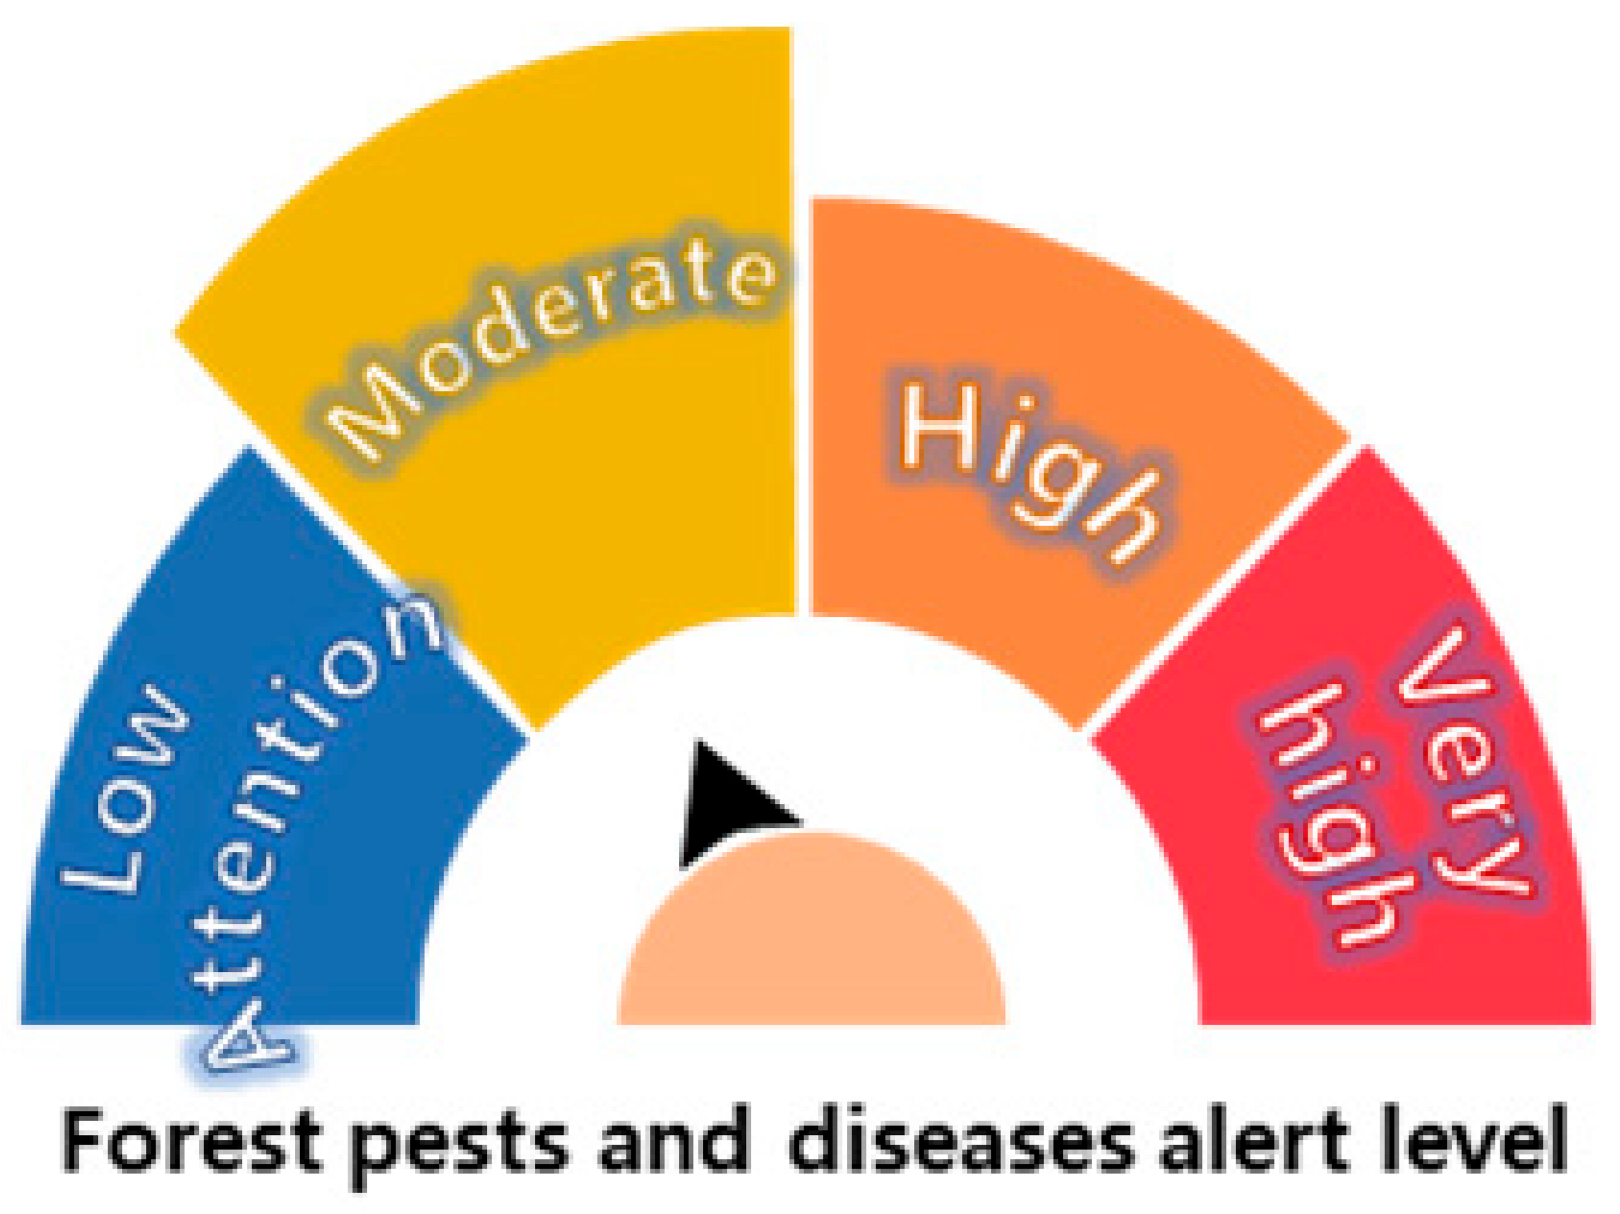
| Forest pests and diseases | Extreme (Red) * | High level (Orange) | Moderate level (Yellow) | Low level (Blue) | |
 |  |  |  | ||
| Restriction on forest-related outdoor activities | No restrictions * | Slight restrictions | Moderate restrictions | Strong restrictions | |
 (zero) |  (0~1 million) |  (1~2 million) |  (2~5 million) | ||
| Biodiversity loss (number of pine trees damaged) | Very large losses * | Large losses | Moderate losses | Slight losses | |
 (−300~−400 k trees) |  (−200~−300 k trees) |  (−100~−200 k trees) | 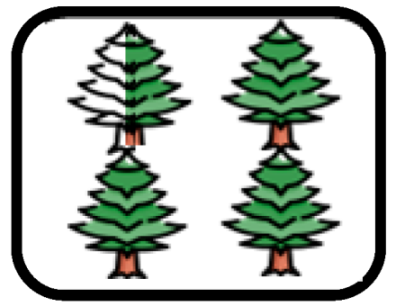 (0~−100 k trees) | ||
| Forest recreation fund | Low * | Slight increase | Moderate increase | Substantial increase | |
| KRW 0~KRW 10,000 | KRW 10,100~KRW 25,000 | KRW 25,100~KRW 35,000 | KRW 35,1000~KRW 50,000 | ||
| Alternatives | Improved Situation | Current Situation | ||
|---|---|---|---|---|
| Attributes and Levels | Alternative 1 | Alternative 2 | Alternative 3 (Status Quo) | |
| Forest fires |  (Blue) |  (Orange) |  (Red) | |
| Forest pest and diseases | 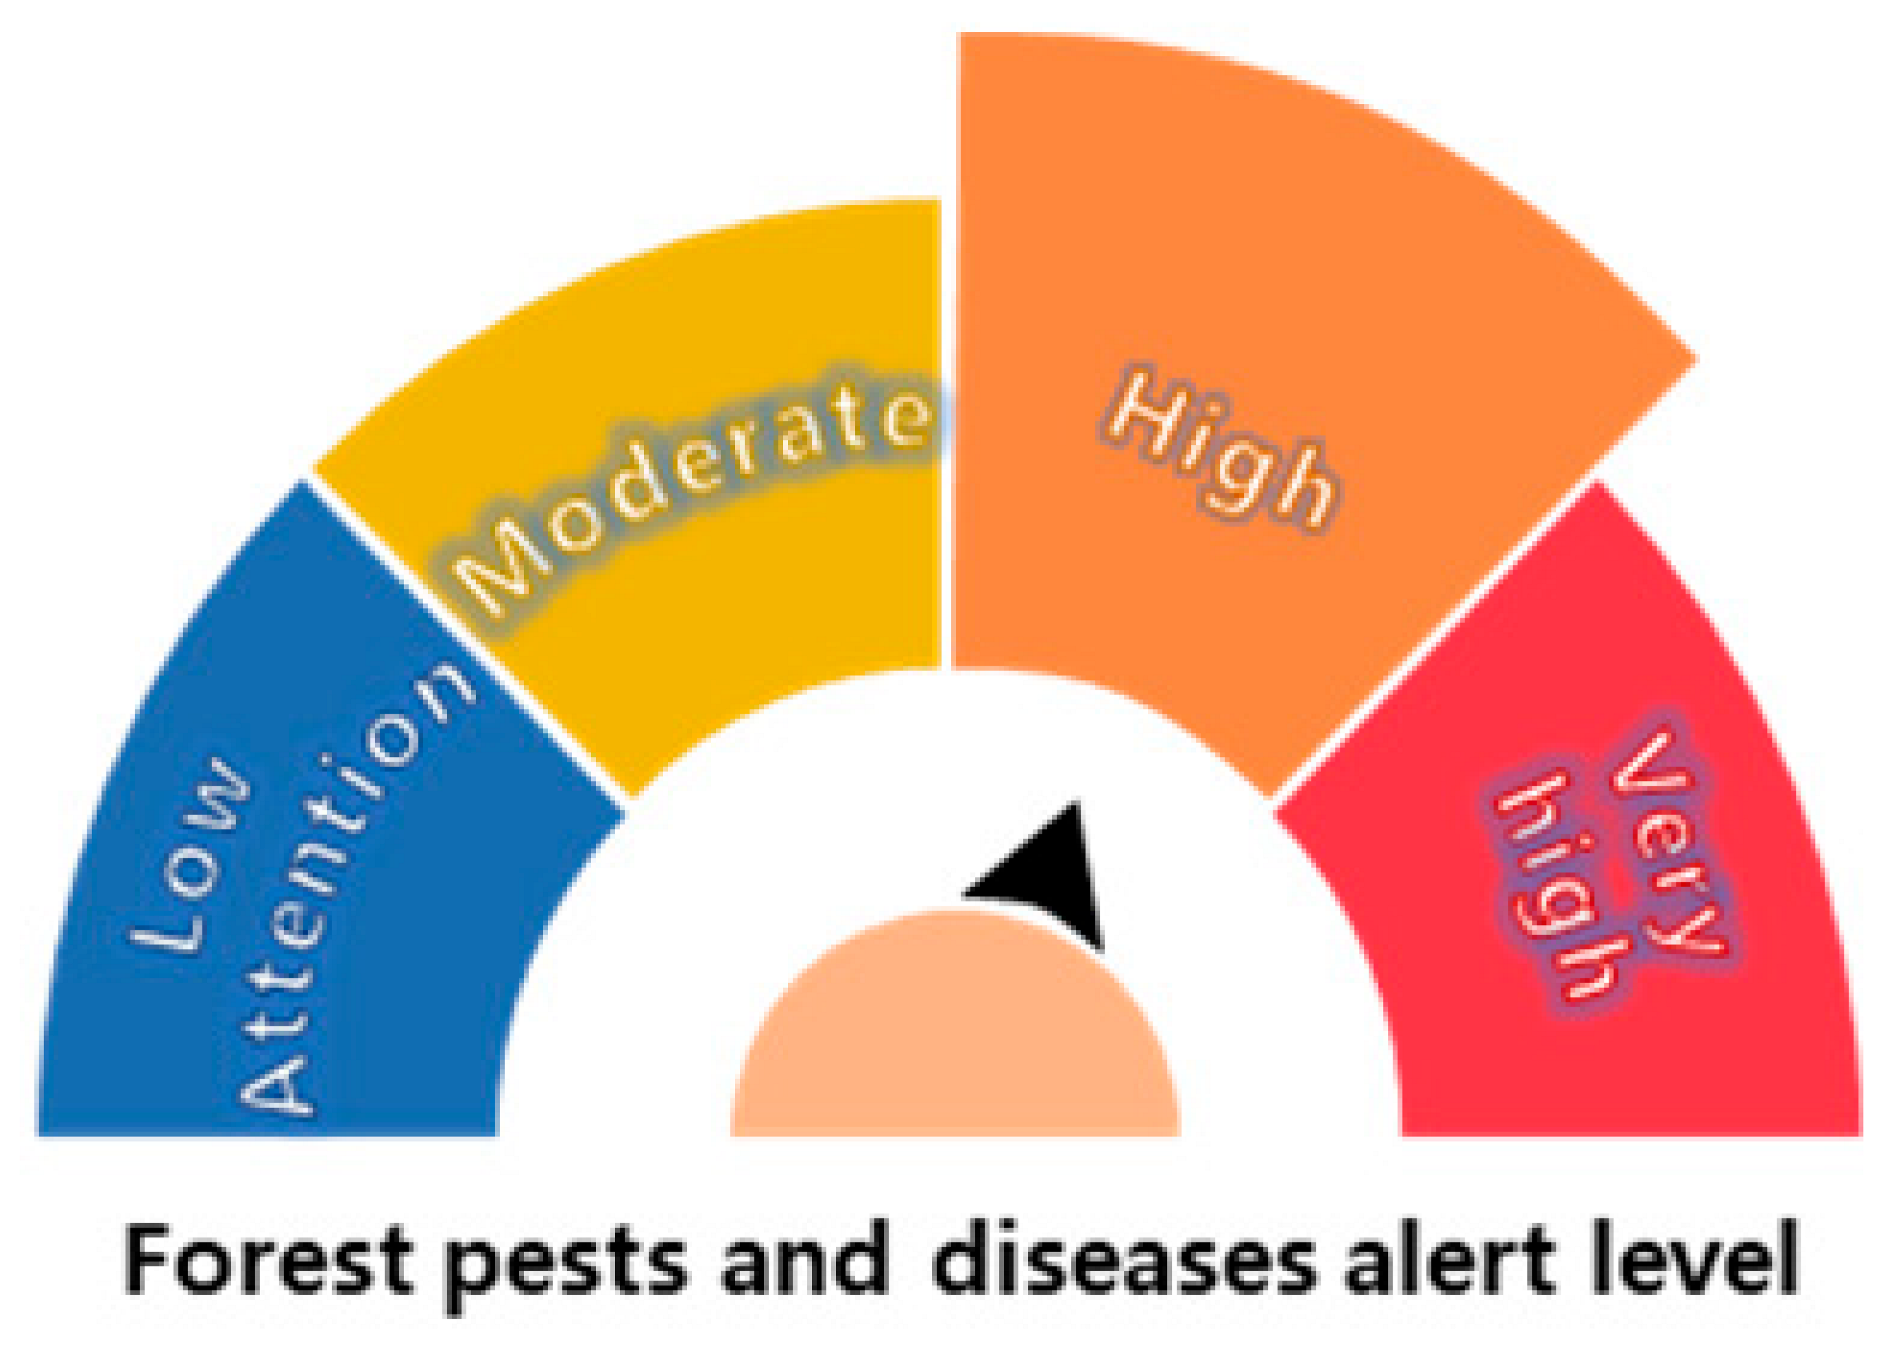 (Orange) | 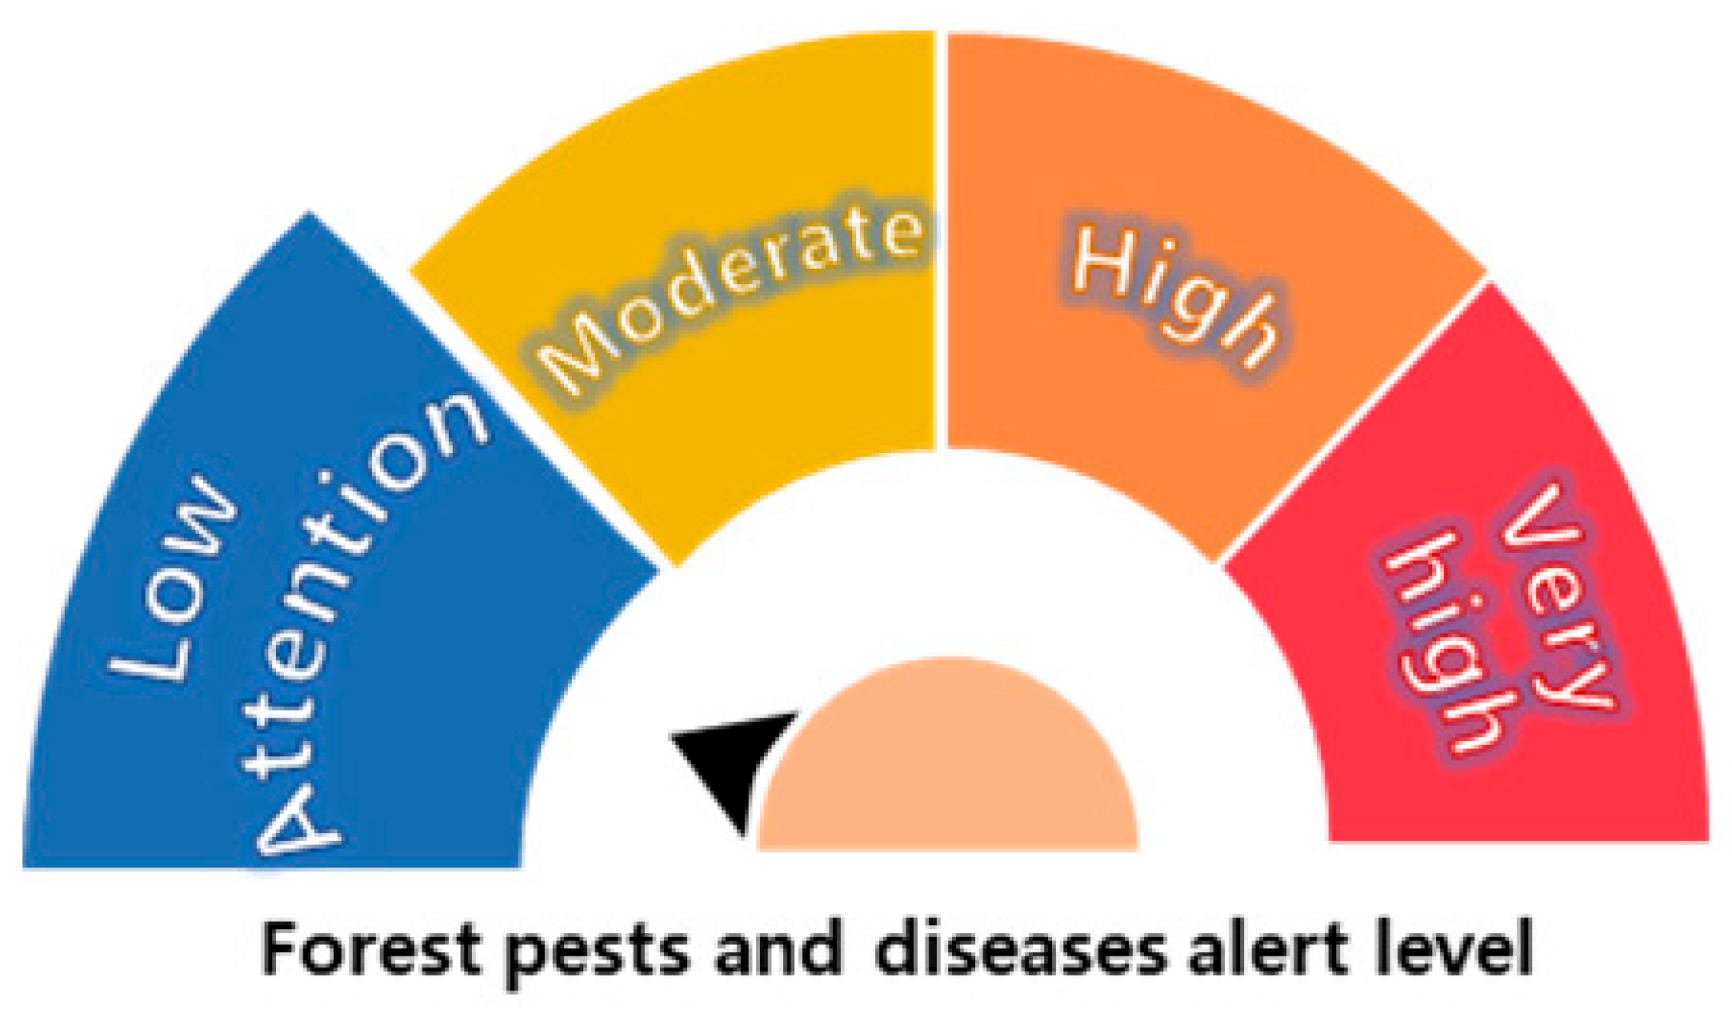 (Blue) |  (Red) | |
| Restrictions on forest-related outdoor activities |  (3~5 million restriction) |  (Under 1 million restriction) |  (No restrictions) | |
| Biodiversity loss (no. of pine trees infected) |  (−100 k~−200 k pine tree loss) |  (−200 k~−300 k pine tree loss) | 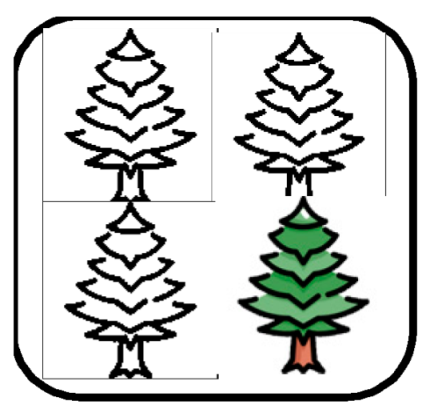 (−300 k~−400 k pine tree loss) | |
| Forest restoration costs | 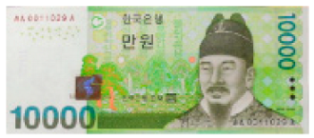 (KRW 10,000) |  (KRW 25,000) | 0 KRW 0 | |
| Component 1 | Component 2 | Component 3 | Component 4 | Component 5 | |
|---|---|---|---|---|---|
| Question items | A3_6, A3_4, A2_2, A2_1, A3_5, A3_3 | A1_3, A1_2, A1_4, A1_1 | A2_4, A2_3, A2_5, A1_5 | A1_7, A3_7, A1_8, A1_6 | A3_1, A3_2 |
| Ratio (N = 1021) | 150 (14.7%) | 138 (13.5%) | 206 (20.2%) | 281 (27.5%) | 246 (24.1%) |
| Group characteristics | Human self-benefit- centered group | Environmental activity preferred group | Ecosystem sensitivity awareness group | Active environmental protection group | Passive environmental protection group |
| Model I | Model II | Model III | Model IV | Model V | |||||||
|---|---|---|---|---|---|---|---|---|---|---|---|
| Attributes | Estimate | t-Value | Estimate | t-Value | Estimate | t-Value | Estimate | t-Value | Estimate | t-Value | |
| Latent Class 1 | Forest fire.class1 | 0.231 | 2.065 ** | 1.756 | 4.887 *** | 1.838 | 6.180 *** | 0.681 | 3.145 *** | 0.049 | 0.245 |
| Forest pests and diseases.class1 | 0.159 | 1.318 | 0.579 | 1.583 | 0.598 | 1.696 * | 0.414 | 1.618 | −0.131 | −0.584 | |
| Forest access restrictions.class1 | −0.001 | -0.100 | 0.032 | 0.986 | 0.046 | 1.356 | 0.008 | 0.327 | −0.013 | −0.640 | |
| Forest Biodiversity Loss.class1 | 0.001 | 0.106 | 0.002 | 0.038 | 0.010 | 0.265 | 0.023 | 0.787 | 0.023 | 0.871 | |
| Cost (forest restoration fund).class1 | −0.017 | −16.371 *** | −0.028 | −8.859 *** | −0.021 | −8.809 *** | −0.012 | −6.347 *** | 0.002 | 0.855 | |
| SQ_asc.class1 | −0.978 | −18.888 *** | 0.337 | 2.288 ** | 0.569 | 4.785 *** | −0.356 | −3.485 *** | −3.323 | −14.693 *** | |
| Latent Class 2 | Forest fire.class2 | - | - | −0.083 | −0.636 | −0.054 | −0.370 | −0.060 | −0.374 | −1.106 | −3.008 *** |
| Forest pest and disseas.class2 | - | - | 0.059 | 0.414 | −0.017 | −0.109 | −0.087 | −0.500 | 0.143 | 0.243 | |
| Forest access restrictions.class2 | - | - | −0.012 | −0.934 | −0.007 | −0.450 | −0.012 | −0.714 | −0.030 | −0.606 | |
| Forest Biodiversity Loss.class2 | - | - | −0.004 | −0.226 | 0.021 | 1.112 | 0.006 | 0.271 | −0.180 | −2.650 *** | |
| Cost (forest restoration fund).class2 | - | - | −0.017 | −13.291 *** | 0.000 | 0.185 | −0.003 | −1.623 | −0.097 | −14.813 *** | |
| SQ_asc.class2 | - | - | −2.195 | −25.873 *** | −1.854 | −24.012 *** | −3.294 | −19.979 *** | −4.859 | −17.722 *** | |
| Latent Class 3 | Forest fire.class3 | - | - | - | - | −0.466 | −1.203 | 4.284 | 4.685 *** | 0.203 | 0.179 |
| Forest pests and diseases.class3 | - | - | - | - | 0.478 | 1.010 | −0.617 | −0.663 | 0.935 | 1.111 | |
| Forest access restrictions.class3 | - | - | - | - | −0.064 | −1.652 * | 0.098 | 1.040 | −0.153 | −1.808 * | |
| Forest Biodiversity Loss.class3 | - | - | - | - | −0.082 | −1.554 | 0.037 | 0.334 | −0.118 | −1.315 | |
| Cost (forest restoration fund).class3 | - | - | - | - | −0.101 | −16.722 *** | −0.047 | −5.525 *** | −0.176 | −7.831 *** | |
| SQ_asc.class3 | - | - | - | - | −4.014 | −18.200 *** | 1.465 | 4.805 *** | −3.822 | −7.772 *** | |
| Latent Class 4 | Forest fire.class4 | - | - | - | - | - | - | −0.949 | −1.949 * | 0.573 | 2.301 ** |
| Forest pests and diseases.class4 | - | - | - | - | - | - | 0.418 | 0.726 | 0.325 | 1.289 | |
| Forest access restrictions.class4 | - | - | - | - | - | - | −0.055 | −1.193 | 0.010 | 0.398 | |
| Forest Biodiversity Loss.class4 | - | - | - | - | - | - | −0.106 | −1.572 | 0.034 | 1.108 | |
| Cost (forest restoration fund).class4 | - | - | - | - | - | - | −0.120 | −13.881 *** | −0.004 | −1.612 | |
| SQ_asc.class4 | - | - | - | - | - | - | −4.729 | −15.728 *** | −0.246 | −1.956 * | |
| Latent Class 5 | Forest fire.class5 | - | - | - | - | - | - | - | - | 4.381 | 4.325 *** |
| Forest pests and diseases.class5 | - | - | - | - | - | - | - | - | -0.832 | −0.955 | |
| Forest access restrictions.class5 | - | - | - | - | - | - | - | - | 0.060 | 0.658 | |
| Forest Biodiversity Loss.class5 | - | - | - | - | - | - | - | - | 0.030 | 0.262 | |
| Cost (forest restoration fund).class5 | - | - | - | - | - | - | - | - | −0.037 | −3.780 *** | |
| SQ_asc.class5 | - | - | - | - | - | - | - | - | 1.688 | 4.466 *** | |
| Class membership probability | Constant.class2 | - | - | 0.975 | 11.071 *** | 0.745 | 8.809 *** | 0.351 | 3.936 *** | −0.865 | −6.101 *** |
| Constant.class3 | - | - | - | - | −0.290 | −2.305 ** | −0.978 | −8.034 *** | −.782 | −9.643 *** | |
| Constant.class4 | - | - | - | - | - | - | −0.729 | −5.025 *** | −0.278 | −2.697 *** | |
| Constant.class5 | - | - | - | - | - | - | - | - | −1.194 | −10.069 *** | |
| Model fit criteria (Log-Likelihood, AIC) | −10,877.06, 21,766.13 | −9580.23, 19,186.46 | −9412.63, 18,865.28 | −9173.36, 18,400.74 | −9079.56, 18,227.13 | ||||||
| Classification | Latent Classes | ||||
|---|---|---|---|---|---|
| LCM 1 | LCM 2 | LCM 3 | LCM 4 | LCM 5 | |
| PCA1 | 0.0 | 1.0 | 41.7 | 53.2 | 4.1 |
| PCA2 | 16.6 | 43.4 | 13.9 | 25.4 | 0.6 |
| PCA3 | 19.9 | 0.1 | 37.4 | 42.7 | 0.0 |
| PCA4 | 0.0 | 94.0 | 0.0 | 4.0 | 2.1 |
| PCA5 | 0.0 | 45.4 | 33.4 | 0.4 | 20.8 |
| Average | 7.3 | 36.8 | 25.3 | 25.1 | 5.5 |
| Attributes | Class 1 | Class 2 | Class 3 | Class 4 | Class 5 | WTP |
|---|---|---|---|---|---|---|
| Forest fire | KRW−23,576.5 (USD −18.06) | KRW−11,412.6 (USD −8.74) | KRW 1154.6 (USD 0.88) | KRW 135,919.4 (USD 104.09) | KRW 119,550.9 (USD 91.55) | KRW 77,529.2 (USD 59.37) |
| Forest pests and diseases | KRW 62,244.2 (USD 47.67) | KRW 1479.5 (USD 1.13) | KRW 5318.5 (USD 4.07) | KRW 77,053.9 (USD 59.01) | KRW −22,697.5 (USD −17.38) | KRW 31,165.0 (USD 23.87) |
| Forest access restrictions | KRW 6272.6 (USD 4.80) | KRW −311.1 (USD -0.24) | KRW −871.4 (USD -0.67) | KRW 2311.7 (USD 1.77) | KRW 1625.5 (USD 1.24) | KRW 1905.7 (USD 1.46) |
| Forest biodiversity loss | KRW −10,773.7 (USD −8.25) | KRW −1859.1 (USD −1.42) | KRW −670.4 (USD −0.51) | KRW 7976.6 (USD 6.11) | KRW 809.0 (USD 0.62) | KRW −1414.5 (USD −1.08) |
| WTP | KRW 34,166.6 (USD 26.17) | KRW −12,103.2 (USD −9.27) | KRW 4931.3 (USD 3.78) | KRW 223,261.5 (USD 170.98) | KRW 99,288.0 (USD 76.04) | KRW 109,185.5 (USD 83.62) |
| Classes | ) | ) | |
|---|---|---|---|
| Class 1 | 37.74% | 3.48% | 1.31% |
| Class 2 | 15.89% | 0.06% | 0.01% |
| Class 3 | 6.35% | 0.01% | ≈0.00% |
| Class 4 | 28.58% | 40.12% | 11.47% |
| Class 5 | 11.44% | 66.66% | 7.62% |
Disclaimer/Publisher’s Note: The statements, opinions and data contained in all publications are solely those of the individual author(s) and contributor(s) and not of MDPI and/or the editor(s). MDPI and/or the editor(s) disclaim responsibility for any injury to people or property resulting from any ideas, methods, instructions or products referred to in the content. |
© 2025 by the authors. Licensee MDPI, Basel, Switzerland. This article is an open access article distributed under the terms and conditions of the Creative Commons Attribution (CC BY) license (https://creativecommons.org/licenses/by/4.0/).
Share and Cite
Jeon, C.; Campbell, D. Exploring Preference Heterogeneity and Acceptability for Forest Restoration Policies: Latent Class Choice Modeling and Principal Component Analysis. Forests 2025, 16, 1507. https://doi.org/10.3390/f16101507
Jeon C, Campbell D. Exploring Preference Heterogeneity and Acceptability for Forest Restoration Policies: Latent Class Choice Modeling and Principal Component Analysis. Forests. 2025; 16(10):1507. https://doi.org/10.3390/f16101507
Chicago/Turabian StyleJeon, Chulhyun, and Danny Campbell. 2025. "Exploring Preference Heterogeneity and Acceptability for Forest Restoration Policies: Latent Class Choice Modeling and Principal Component Analysis" Forests 16, no. 10: 1507. https://doi.org/10.3390/f16101507
APA StyleJeon, C., & Campbell, D. (2025). Exploring Preference Heterogeneity and Acceptability for Forest Restoration Policies: Latent Class Choice Modeling and Principal Component Analysis. Forests, 16(10), 1507. https://doi.org/10.3390/f16101507


