Article

Importance of Patches in Maintaining Forest Landscape Connectivity: A Case Study of Barluk, Xinjiang, China

1
College of Ecology and Environment, Xinjiang University, Urumqi 830017, China
2
Xinjiang Key Laboratory of Oasis Ecological, Ministry of Education, Urumqi 830017, China
3
Xinjiang Jinghe Observation and Research Station of Temperate Desert Ecosystem, Ministry of Education, Xinjiang University, Urumqi 830017, China
4
College of Animal Science and Technology, Henan University of Science and Technology, Luoyang 471023, China
5
Xinjiang Transportation Investment Group Co., Ltd., Urumqi 830099, China
6
School of Business, Henan University of Science and Technology, Luoyang 471023, China
*
Authors to whom correspondence should be addressed.
Forests 2025, 16(1), 74; https://doi.org/10.3390/f16010074
Submission received: 30 November 2024 / Revised: 2 January 2025 / Accepted: 3 January 2025 / Published: 5 January 2025
(This article belongs to the Special Issue Elemental Cycling in Forest Soils)

Abstract

:
Habitat loss and fragmentation are two main threats to biodiversity. Forest landscape connectivity can directly affect many ecological processes, such as plant seed dispersal and animal migration, and is an important framework for determining strategic priorities for biodiversity conservation. This study examines the Barluk Mountain Nature Reserve in Xinjiang as a case study to evaluate changes in connectivity at different diffusion distances based on graph theory. Our results showed that Barluk consists predominantly (62%) of small patches (<1 hm2) and a relatively limited number (7%) of large patches (>10 hm2). By simulating a forest loss scenario and assessing the importance of individual patches, we found that large patches played an important role in maintaining connectivity. Further, by calculating the delta number of components (dNC), we found that not all small patches contribute to maintaining connectivity, and small patches (with dNC < 0 and area < 1 hm2) that act as “stepping stones” within large patches should also be prioritized for protection. Therefore, priority identification of patches that contribute the most to connectivity will provide effective forest management strategies, help enhance the functioning of forest ecosystems, and protect fragmented ecosystems.

1. Introduction

Forests are the most prevalent terrestrial ecosystems on Earth. They support most terrestrial species [1], play a critical role in biodiversity conservation, and maintain the balance of terrestrial ecosystems. Forests also contribute to climate control, water preservation, soil erosion prevention, wind and sand shielding, and the mitigation of drought and flooding [2]. Recent studies have revealed that 31.2% of forests worldwide have experienced human disturbance, and only 40.5% of forests have high landscape-level integrity [3]. The negative effects of forest loss and fragmentation on biodiversity were far greater than those of habitat size reduction, as they hinder the movement or dispersal of organisms between suitable habitats, resulting in decreased species richness and loss of genetic diversity [4,5,6,7]. Therefore, with increasing global forest loss and fragmentation, maximizing forest conservation outcomes with limited financial resources is necessary for biodiversity conservation.
To evaluate connectivity, habitats are typically delineated as discrete patches, and connectivity is often based on emigration and migration between these patches [8]. Landscape connectivity, which primarily consists of structural and functional connectivity [9], is a significant expression of the function of a landscape in aiding or impeding the dispersal of species between habitats [10,11]. Landscape connectivity refers to the degree to which a landscape promotes or inhibits the dispersal of species and ecological flows among habitat patches and reflects the ability of organisms to disperse and survive in a landscape [9,10,11,12,13]. The graph–theoretic approach is one of the most popular and widely used methods for analyzing landscape connectivity. It can be used to assess the significance of patches using several indices that quantitatively analyze each patch’s contribution to preserving landscape connectivity [14]. This offers fresh perspectives for large-scale spatial ecological network modeling and functional connectivity assessment in landscapes and helps increase the scope and efficacy of resource management [15]. Martello et al. [16] investigated the effects of landscape structure on the diversity of functional traits in agricultural landscapes in the Brazilian Cerrado. Laita et al. [17] studied the connectivity of protected areas in forest landscapes of Central Finland. Segurado et al. [18] analyzed the connectivity of the Taho River in Portugal and proposed a restoration scheme. Devi et al. [19] presented a potential connectivity alternative for areas of tropical deciduous forest fragmentation in parts of the Eastern Ghats in India.
Maintaining and enhancing the connectivity of fragmented patches has been proposed as a crucial strategy for reducing extinction and increasing species populations [20]. Identifying priority conservation areas among all patches can maximize landscape connectivity and preserve biodiversity with limited resources [21]. Over the past few decades, conservation-oriented actions have typically focused on large, intact, and well-connected patches, which are critical for key ecological processes. Prioritizing these large, intact, and well-connected patches for conservation would yield a high conservation impact [22,23]. However, the importance of smaller patches is usually overlooked or underestimated because they are more susceptible to environmental and human-induced disturbances [24,25]. Global analysis has shown that many species would be lost if small and isolated remnant habitats are ignored during conservation efforts, demonstrating that these actions are insufficient for long-term biodiversity conservation [26]. The gap between the current knowledge of small patches and their practical management may hinder long-term biodiversity conservation efforts. Small patches that act as important “stepping-stones” and connectors should also be considered. Most studies found that small patches had a disproportionately high contribution to overall connectivity by comparing the changes in overall connectivity that all small patches were hypothesized to have been removed [25,27,28], while others identified important small patches by field sampling in all patches [29,30,31]. To facilitate the dispersal or movement of species between large patches against human disturbance and increase habitat availability [25,32,33], a group of small patches typically harbor more species than one or several large patches of equal total area [34]. Nevertheless, the large number and scattered distribution of small patches, protecting all small patches, dilute limited resources, and field sampling in all patches is expensive and impractical. Therefore, selecting appropriate patches as priority conservation areas is a challenge in the decision-making process.
For a given landscape, species dispersal ability also affects the role of individual patches in connectivity, and thus, priority conservation area selection. Dispersal abilities vary with taxa; for example, the median dispersal distances of some forest understory or canopy birds may be less than 500 m [27], while for some terrestrial mammals, it may be more than 10 km [35]. Numerous studies have found that spatial prioritization maps, calculated from the contribution of individual patches to maintaining the overall landscape, vary with dispersal abilities [36,37]. Therefore, priority area identification for a single species may result in the exclusion of ecological processes at other spatial scales, indicating that multiple dispersal abilities should be considered to identify priority areas.
In recent years, forest fragmentation has become a relatively common phenomenon, resulting in a reduction in species richness within forests and a weakening of the ecological value of forests. We applied graph theory methods (e.g., the Integral Index of Connectivity (IIC) and delta Integral Index of Connectivity (dIIC)) to study the forest connectivity of the Barluk Mountain Nature Reserve in Xinjiang. Three primary questions were addressed: (1) How are the forest patches in the Barluk Mountain Nature Reserve formed?, (2) How does connectivity change under different forest loss simulation scenarios?, and (3) Which patches play a critical role in maintaining forest landscape connectivity? This study provides a basis for the effective identification of important forest patches, thereby enhancing the functions of forest ecosystems and protecting fragmented ecosystems.

2. Materials and Methods
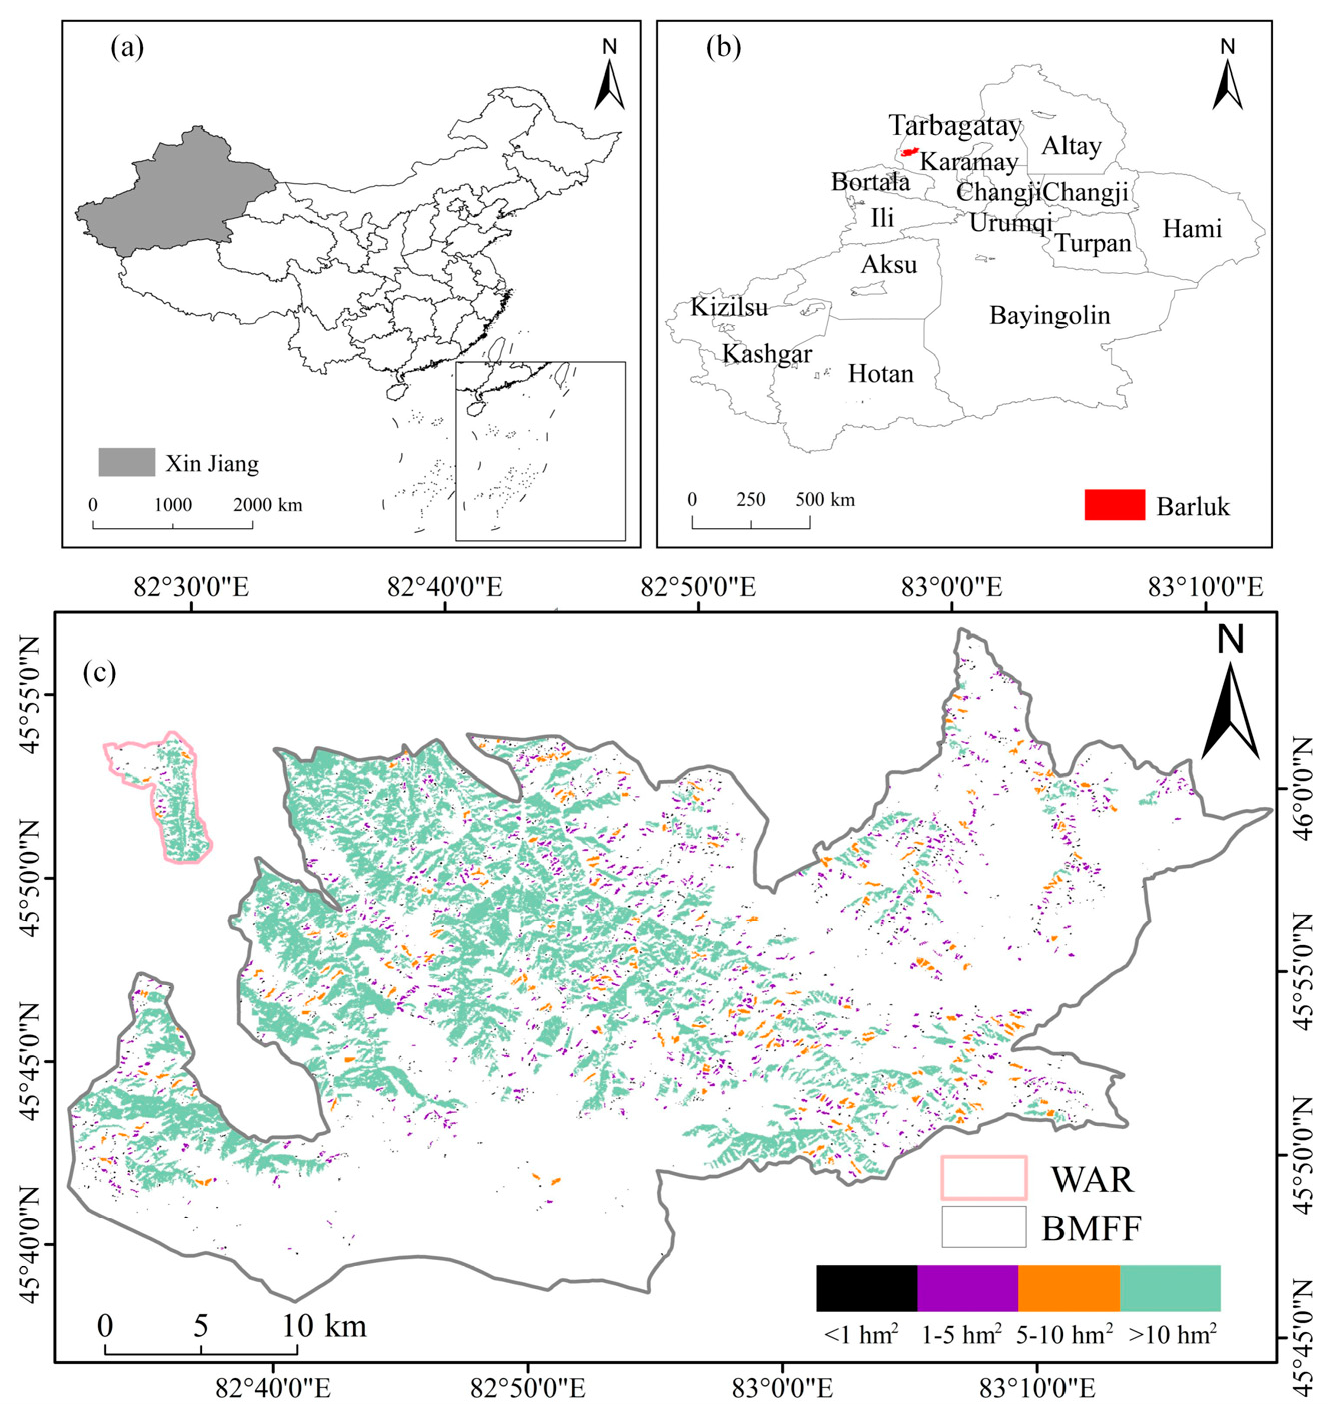
2.1. Study Area

Xinjiang’s Barluk Mountain Nature Reserve was the first nature reserve established in the history of Xinjiang. Barluk Mountains are located at 82°26′–83°13′ E longitude and 45°42′–46°03′ N latitude (Figure 1), with a total area of 11.5 × 10⁴ hm2, with 89.5% of its area located in Yumin County and the remaining 10.5% in Tori County [38]. It is located on the border between China and Kazakhstan. The Barluk Mountain Nature Reserve is the gene bank of plant species in the Tacheng area, the ecological barrier of Northwest China, and a paradise for wild animals. It also has a unique cultural landscape and is known as a garden of ten thousand in Central Asia and Europe. It is currently considered a national nature reserve. The Barluk Mountain Nature Reserve is composed of two blocks: the western block, the wild apricot reserve (WAR), which accounts for 1.6% of the total area of the reserve, and the eastern block, the Barluk Mountain Forest Farm (BMFF). The Barluk Mountain’s coniferous species at different elevations of the forest cover an area of 3499.81 hm2, with Picea schrenkiana as the main species; broad-leaved species at different elevations of the forest cover an area of 3787.03 hm2, with Populus laurifolia and Betula pendula as the predominant species; and shrub covers an area of 15,564.1 hm2, with Rosa multiflora and Lonicera japonica as the main dominant species [28]. The Barluk Mountain National Nature Reserve has a unique geographical environment rich in plant resources and contains many rare and endangered species. There were 1244 species of higher plants, accounting for 29.31% of the total species in Xinjiang. Among them, medicinal plants, foliage plants, and nectar plants are rich in species, have large reserves, a wide distribution, and are very distinctive [39].

2.2. Data Sources and Processing

The remote sensing image data used in this study for 2021 were Landsat images from the United States Geological Survey (http://glovis.usgs.gov) (accessed on 30 May 2023) with a spatial resolution of 30 m × 30 m. Digital elevation model (DEM) data with a spatial resolution of 30 m × 30 m were obtained from the Geospatial Data Cloud (http://www.gscloud.cn) (accessed on 3 June 2023). The original images were preprocessed using ENVl 5.3 (http://www.enviidl.com/) (accessed on 2 July 2023), including radiometric and atmospheric corrections. Random forest has a good ability to resist overfitting through stable samples extracted from the China Land Cover Dataset (CLCD) [40], combined with a field survey of human–machine interpretation conducted in 2021. The redundant features were reduced using principal component analysis. Because this study only required consideration of forest and non-forest areas, 1150 points were randomly generated within the study area to assess the accuracy of distinguishing forest patches, as analyzed in ArcGIS 10.8. The overall accuracy of the final classification accuracy assessment reached 92.97%. Forest patches were extracted and all indices were calculated using Conefor Sensinode 2.2 [41], developed by Duke University in the United States. The results were visualized using Origin 2023 software (https://www.originlab.com/) (accessed on 25 August 2023).

2.3. Selection of Dispersal Distance for Landscape Patches

The scale at which certain ecological processes occur, such as organism movement and diffusion, determines whether the patches are connected. Because the individual diffusion abilities of different species are different, we used seven dispersal distances—100 m, 200 m, 500 m, 1000 m, 2000 m, 5000 m, and 10,000 m to assess the connectivity state of the forest landscape in the Barluk Mountain Nature Reserve in Xinjiang. These distances covered most of the ecological flow and species dispersal distances, following the research of Wang et al. [37] conducted at the Bogda World Natural Heritage Site in Xinjiang.

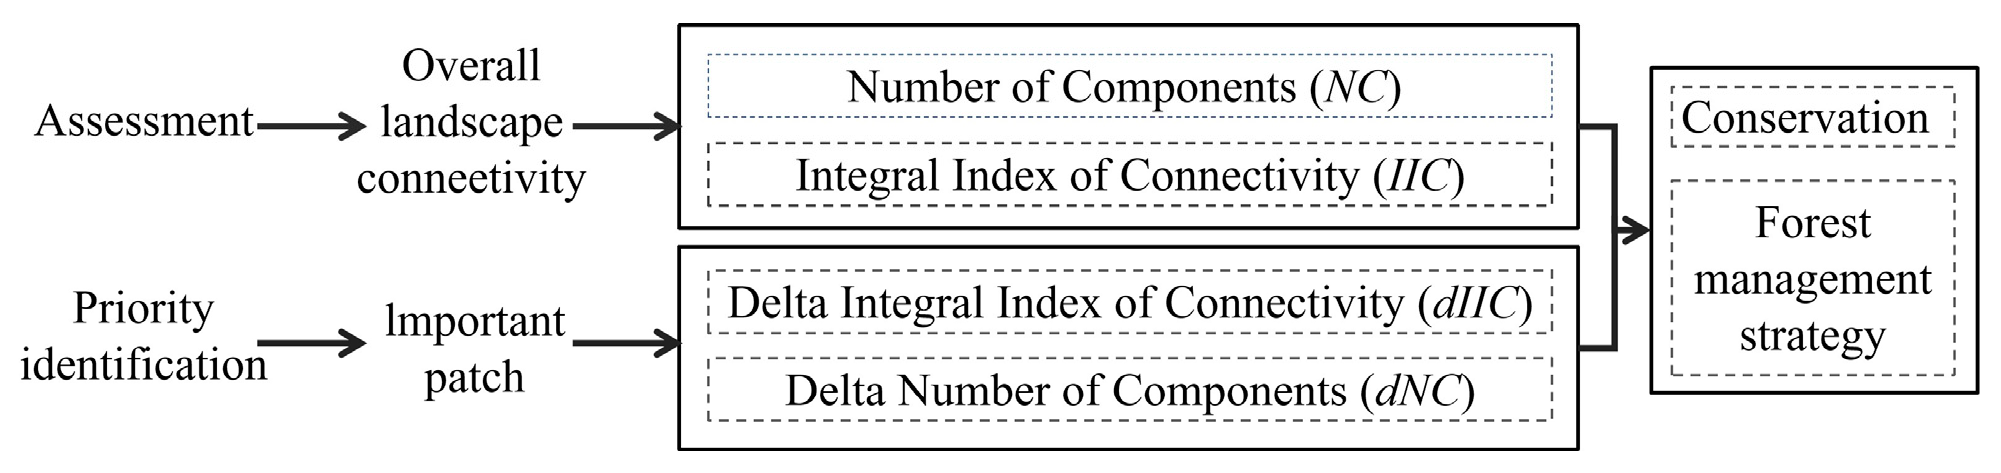
2.4. Selection of the Landscape Connectivity Evaluation Index

In this study, the connectivity index is based on the graph theory method. Graph theory terms and corresponding landscape parameters are as follows: nodes: patches; link: corridor; components: a set of patches for which a path exists between each pair of patches (an isolated patch comprises a component) [42]. The workflow of the main steps is shown in Figure 2.
The number of components (NC) is used to quantify overall landscape connectivity. Different landscape components were isolated from each other and there was no discernible relationship between the ecological processes that occurred within them. A reduction in the number of landscape components resulted in a corresponding decrease in landscape connectivity.
Landscape Shape Index (LSI):
L S I = 0.25 × C A
where A is the area of the patch, and C is the total length of the patch boundary. A larger value indicates a more irregular patch shape; LSI = 1 when the patch is square.
Integral Index of Connectivity (IIC): this is usually used to evaluate the connectivity level of the whole landscape and is considered one of the best indicators for analyzing landscape connectivity [43]. The calculation formula is as follows:
I I C = i = 1 n j = 1 n a i × a j 1 + n l i j A L 2
where n denotes the number of forest patches, ai and aj are the areas of patches i and j, respectively, nlij denotes the number of links in the shortest path (topological distance) between patches i and j, and AL is the total landscape area. 0 ≤ IIC ≤ 1, IIC = 0 indicating that there is no connection between habitat patches, and IIC = 1 indicating that the whole landscape is a habitat patch.

2.5. Selection of Important Patches

Significant patches play an important role in maintaining and improving landscape connectivity. The delta integral index of connectivity (dIIC), which refers to the contribution of each patch to maintaining forest landscape connectivity, was used to identify potential patches for biodiversity conservation and prioritization [43,44]. The formula for calculating this value is as follows:
d I I C = I I C I I C r e m I I C × 100
where IIC is the degree of connectivity of the existing forest landscape and IICrem is the overall connectivity after removing the considered forest patch. The dIIC values were larger, indicating that the patch had a more significant impact on and contributed to the landscape connectivity of the region, and vice versa for smaller impacts and lower contributions.

2.6. The Importance of Small Patches in Maintaining Landscape Connectivity

To explore the role of patches from different areas in maintaining overall connectivity, we constructed four forest loss scenarios and calculated the role of patches from different areas in maintaining connectivity at different dispersal distances. Scenario I: patches with an area < 1 hm2 were hypothesized removed; Scenario II: patches with an area < 5 hm2 were hypothesized removed; Scenario III: patches with an area < 10 hm2 were hypothesized removed; Scenario IV: overall patches, e.g., no patches were hypothesized removed.
For the overall small patch scale, the dIIC was used to explore the changes in overall landscape connectivity in the four forest loss simulation scenarios, when small patches were hypothesized to be removed. The delta number of components (dNC) was used to explore the role of individual small patches in maintaining the overall landscape connectivity. dNC < 0 indicates that the absence of this patch leads to a reduction in NC value; that is, the presence of this patch improves the overall connectivity of the forest landscape. dNC = 0 indicates that the absence of a patch did not affect the NC value. dNC > 0 indicates that the absence of this patch will lead to an increase in NC value; that is, the presence of this patch will reduce the overall connectivity of the forest landscape.

3. Results

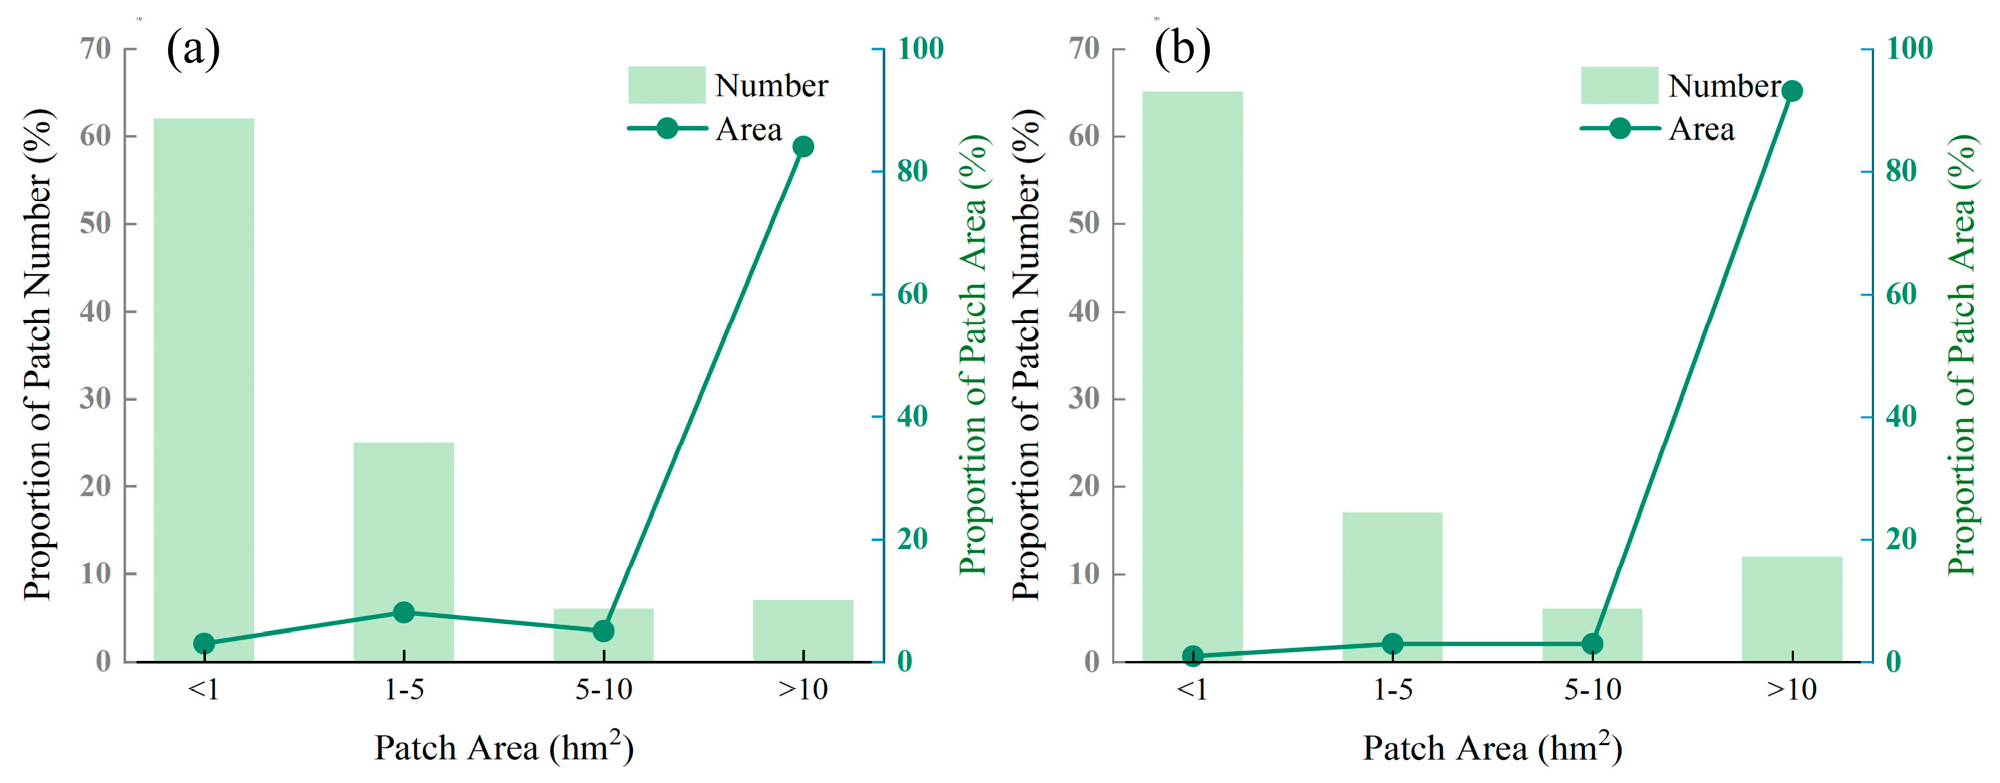
3.1. Patch Composition of Forest Landscapes

The forest landscape is composed of 2915 patches, and the total area of the forest landscape is 22,398 hm2, which is 19.49% of the Barluk Mountain Nature Reserve. There were 2863 and 52 forest patches in the BMFF and WAR, respectively. Most patches had an area of <1 hm2 for both the BMFF and the WAR, followed by patches with an area of 1–5 hm2 and >10 hm2, and patches with an area of 5–10 hm2 had the least amount. However, for the patch area, both BMFF and WAR were dominated by patches with an area > 10 hm2, supplemented by patches with areas of 1–5 hm2 and 5–10 hm2, while patches with areas of <1 hm2 serve as a complementary pattern to the forest landscape (Figure 3). All patches with LSI = 1 had an area of <1 hm2. The maximum value of LSI = 22 in BMFF, the maximum value of LSI = 11 in WAR, and the two were patches with an area of >10 hm2. This suggests that the shapes of the small patches were more regular than those of the large patches in the Barluk Mountain Nature Reserve.

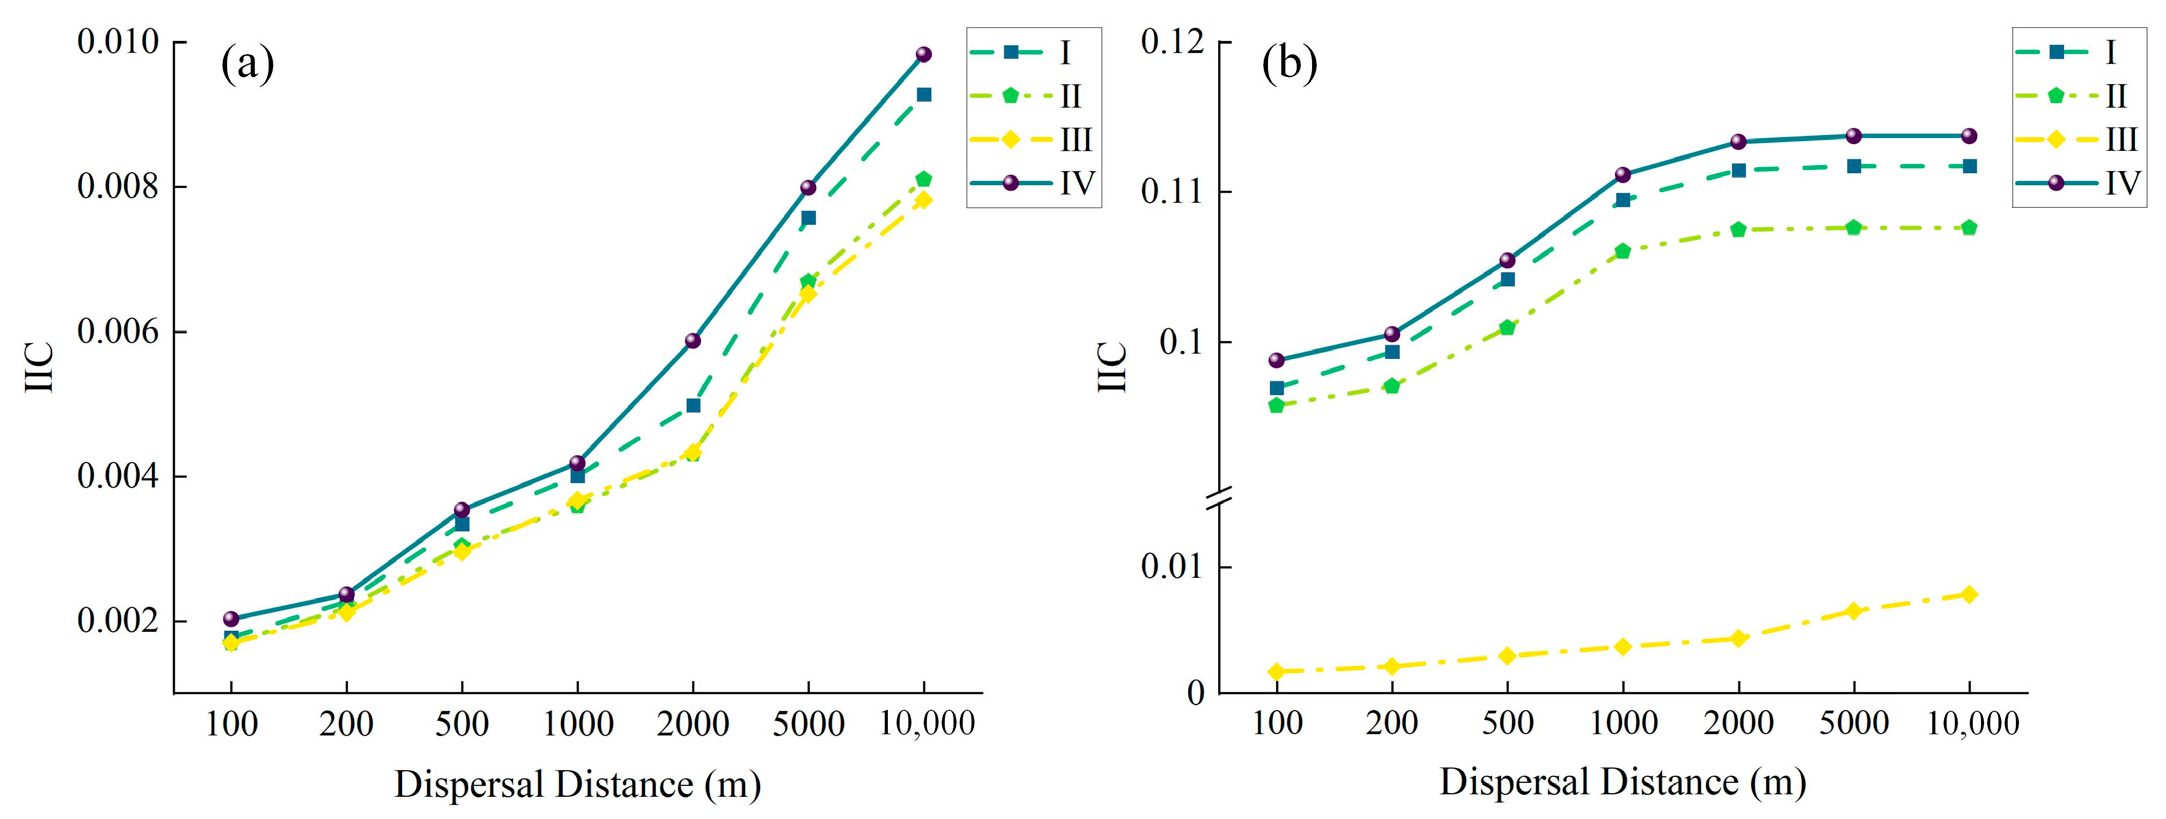
3.2. Overall Forest Landscape Connectivity

In general, the overall landscape connectivity in both BMFF and WAR increased with dispersal distance, as the values of NC and IIC generally showed decreasing and increasing trends, respectively. Notably, the NC value of the BMFF remained unchanged at 60 when the dispersal distance exceeded 5000 m. Additionally, the WAR value was 1 when the dispersal distance was 1000 m (Table 1). This indicates that a reduction in NC will classify forest patches that originally had no connectivity into one category, at which time the aggregation of patches in the landscape is the same. The dispersal distances increased from 100 m to 10,000 m, and the IIC value of the WAR increased more than that of the BMFF. For each dispersal distance, BMFF exhibited a higher value of NC and IIC than WAR, indicating that the overall forest connectivity of BMFF was inferior to that of WAR (Table 1).

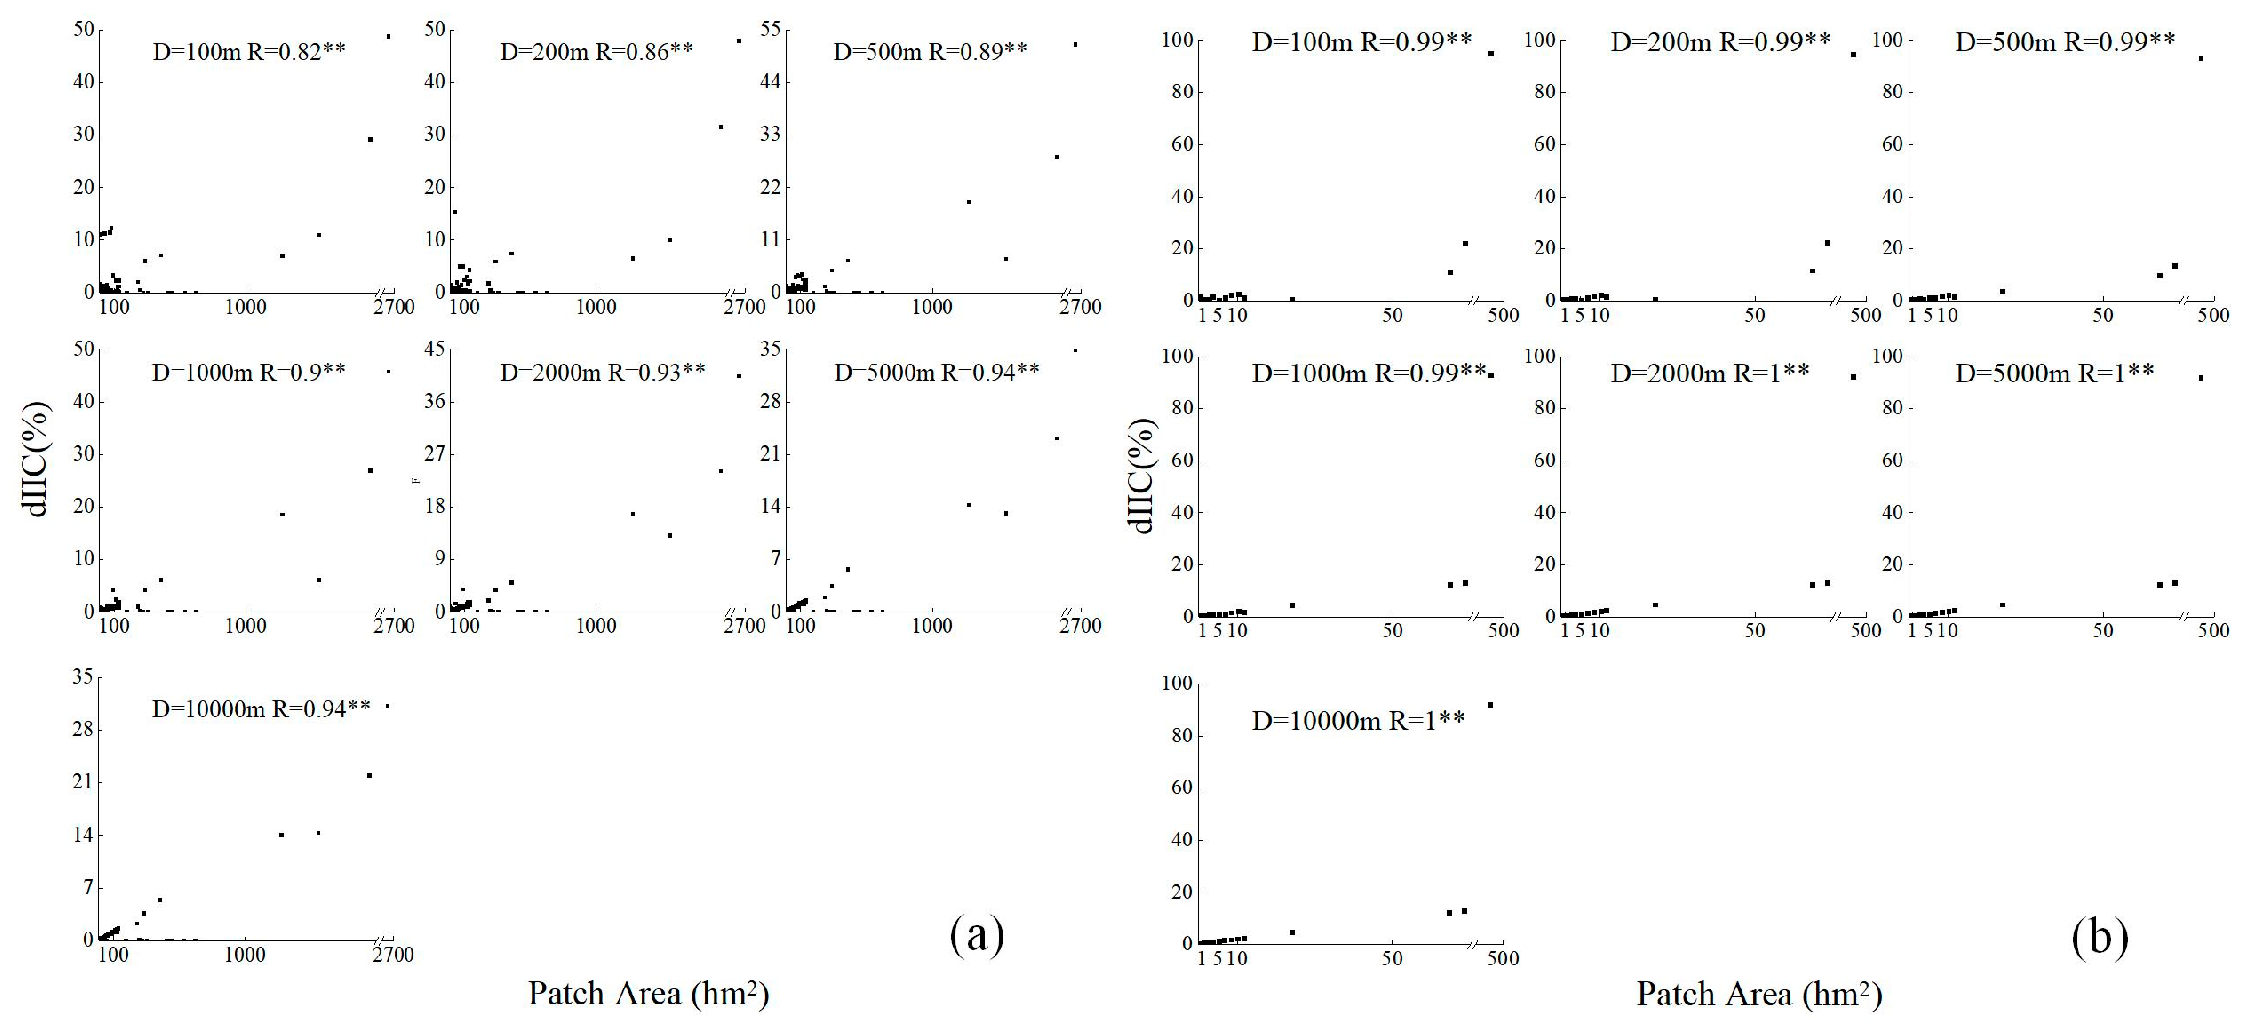
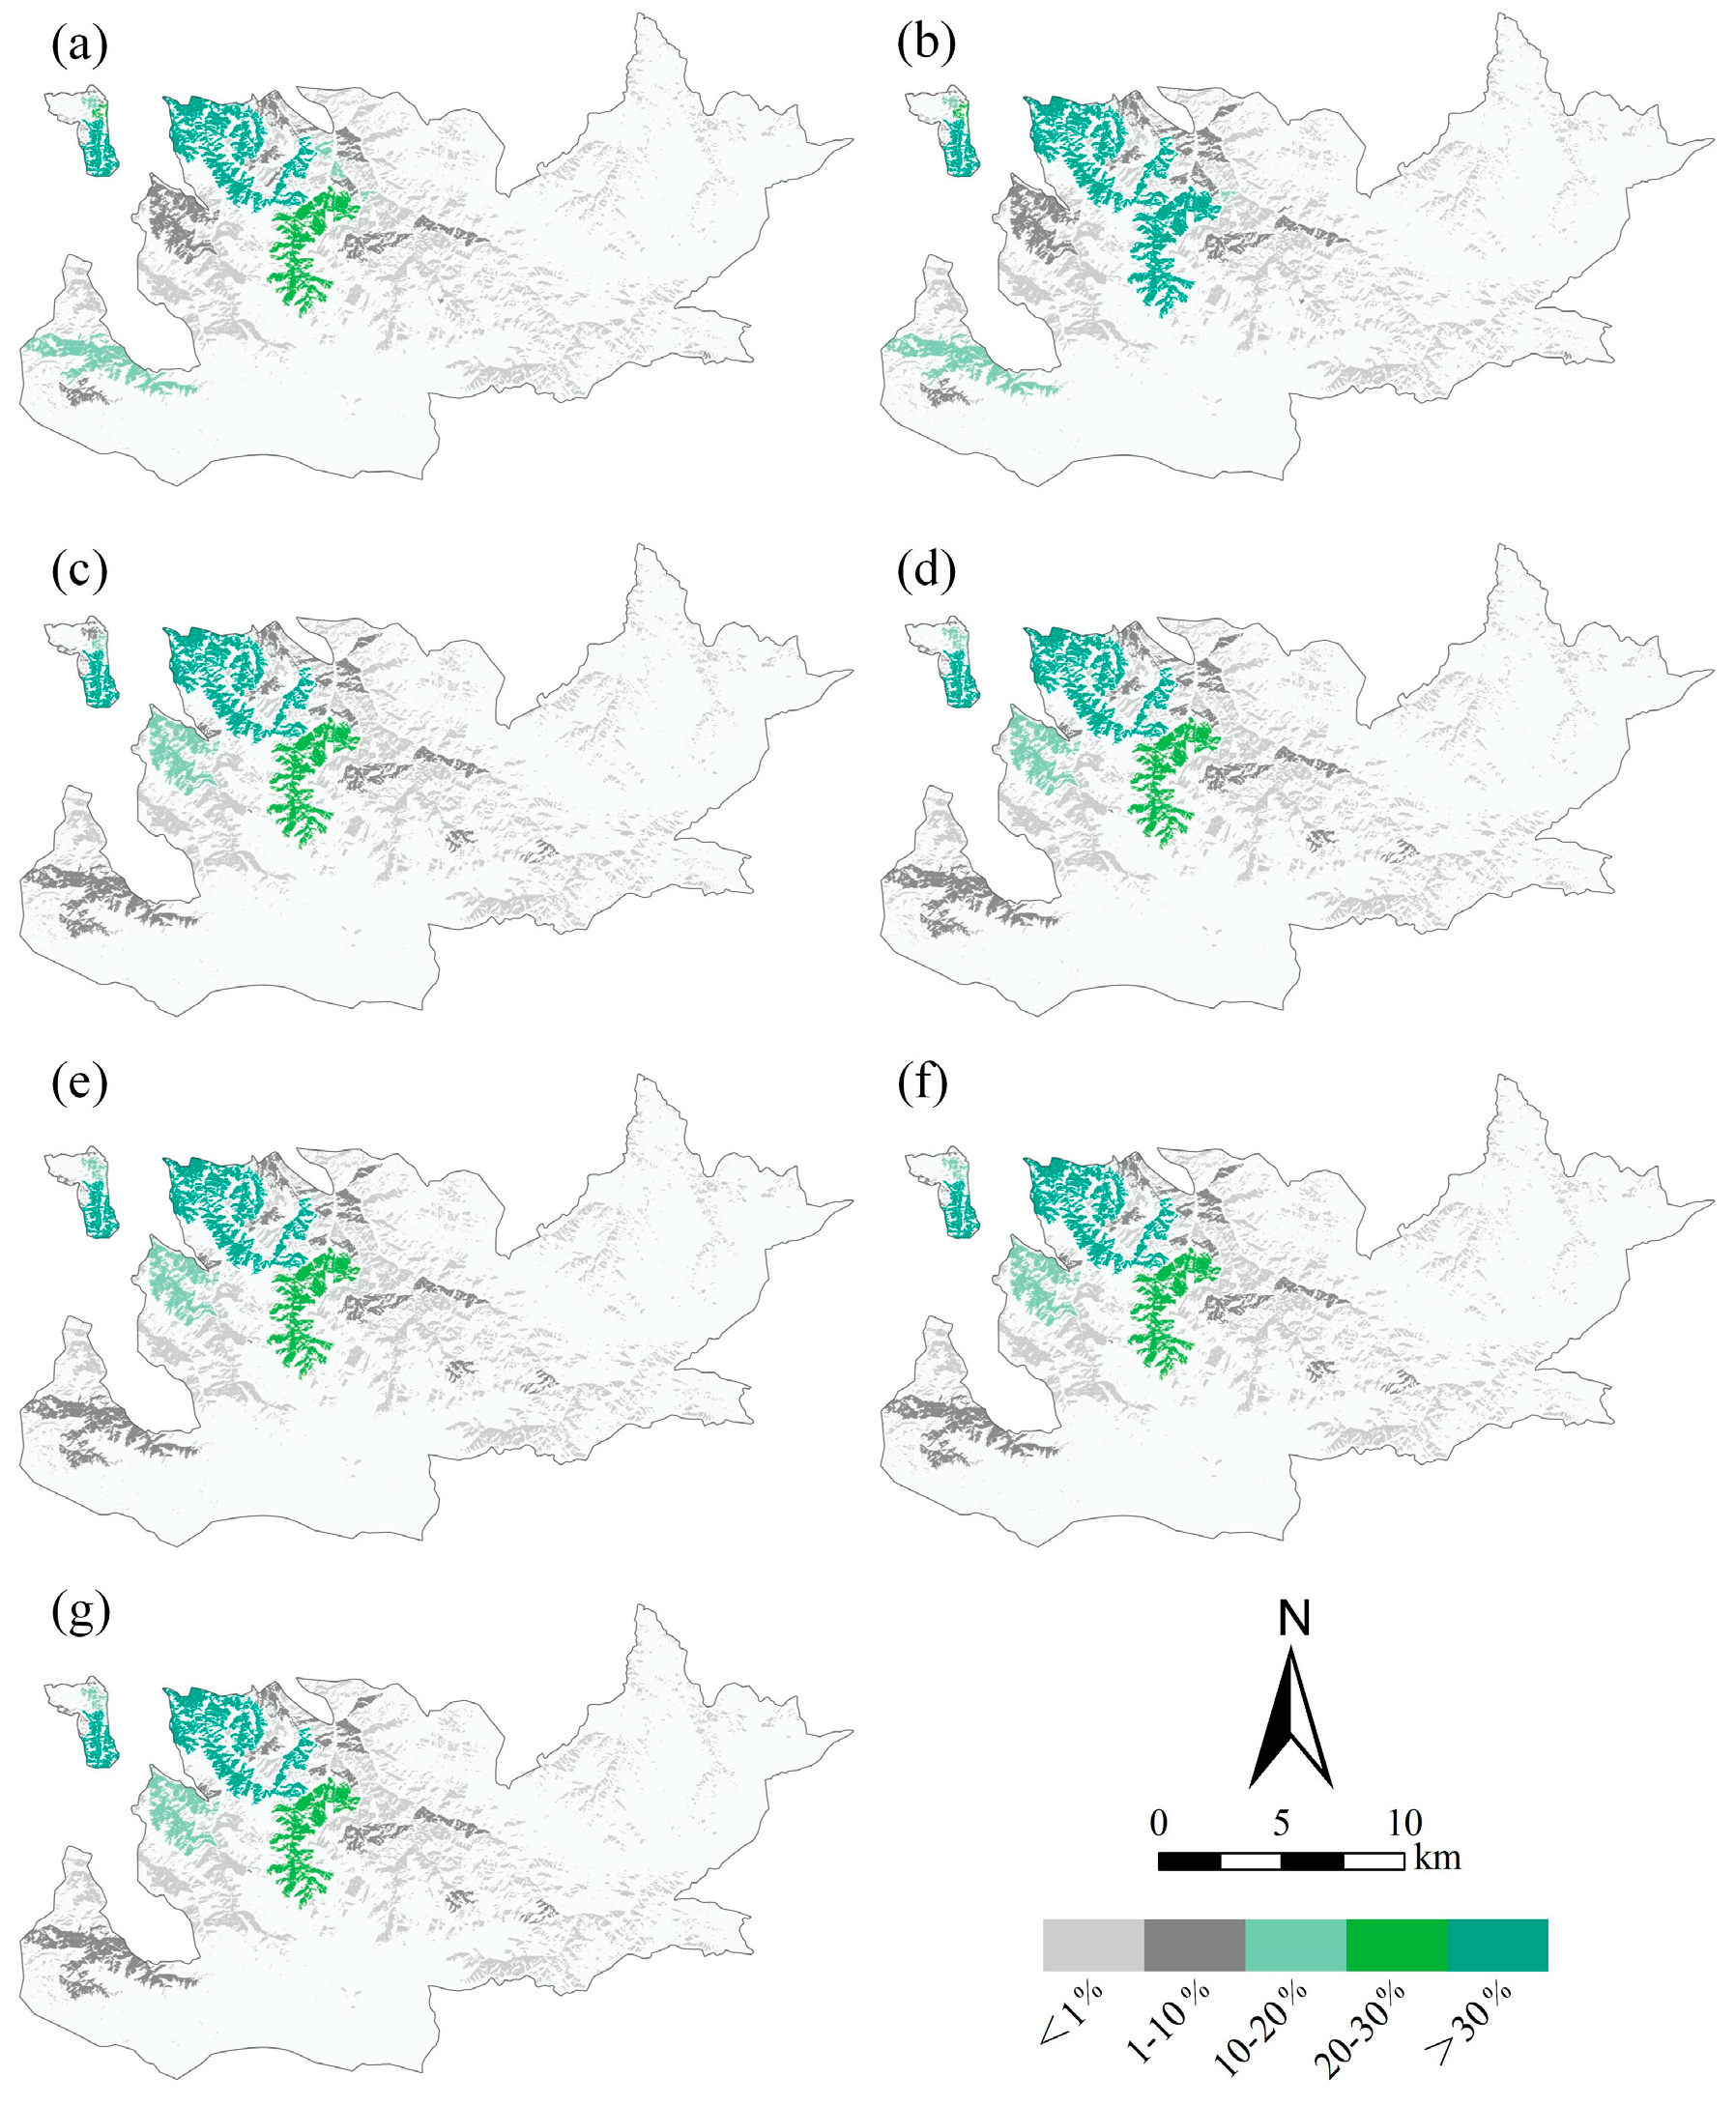
3.3. The Role of Individual Forest Patches on Overall Connectivity

The overall landscape connectivity of each patch was calculated for different dispersal distances. The results showed a relationship between patch area and patch contribution to maintaining overall landscape connectivity at different dispersal distances. This study found that different patches contribute differently to maintaining overall forest connectivity, and for a given patch, their contributions also differ between different dispersal distances. The relationship between dIIC values and patch area was positively proportional for all dispersal distances (p < 0.01) (Figure 4), indicating that large patches were the core patches that maintained the connectivity of the forest landscape, regardless of dispersal distance.
Based on their contributions to the overall connectivity of individual patches (dIIC), all patches were divided into five ranks: >30%, 20%–30%, 10%–20%, 1%–10%, and <1% (Figure 5). In general, the value of dIIC decreased with dispersal distances indicating that the role of individual patches in maintaining overall landscape connectivity decreased with dispersal distance. The highest contribution of individual forest patches to maintaining overall landscape connectivity, as evaluated by dIIC at different dispersal distances, ranged from 31.22% to 51.91% in the BMFF and from 91.85% to 94.94% in the WAR.

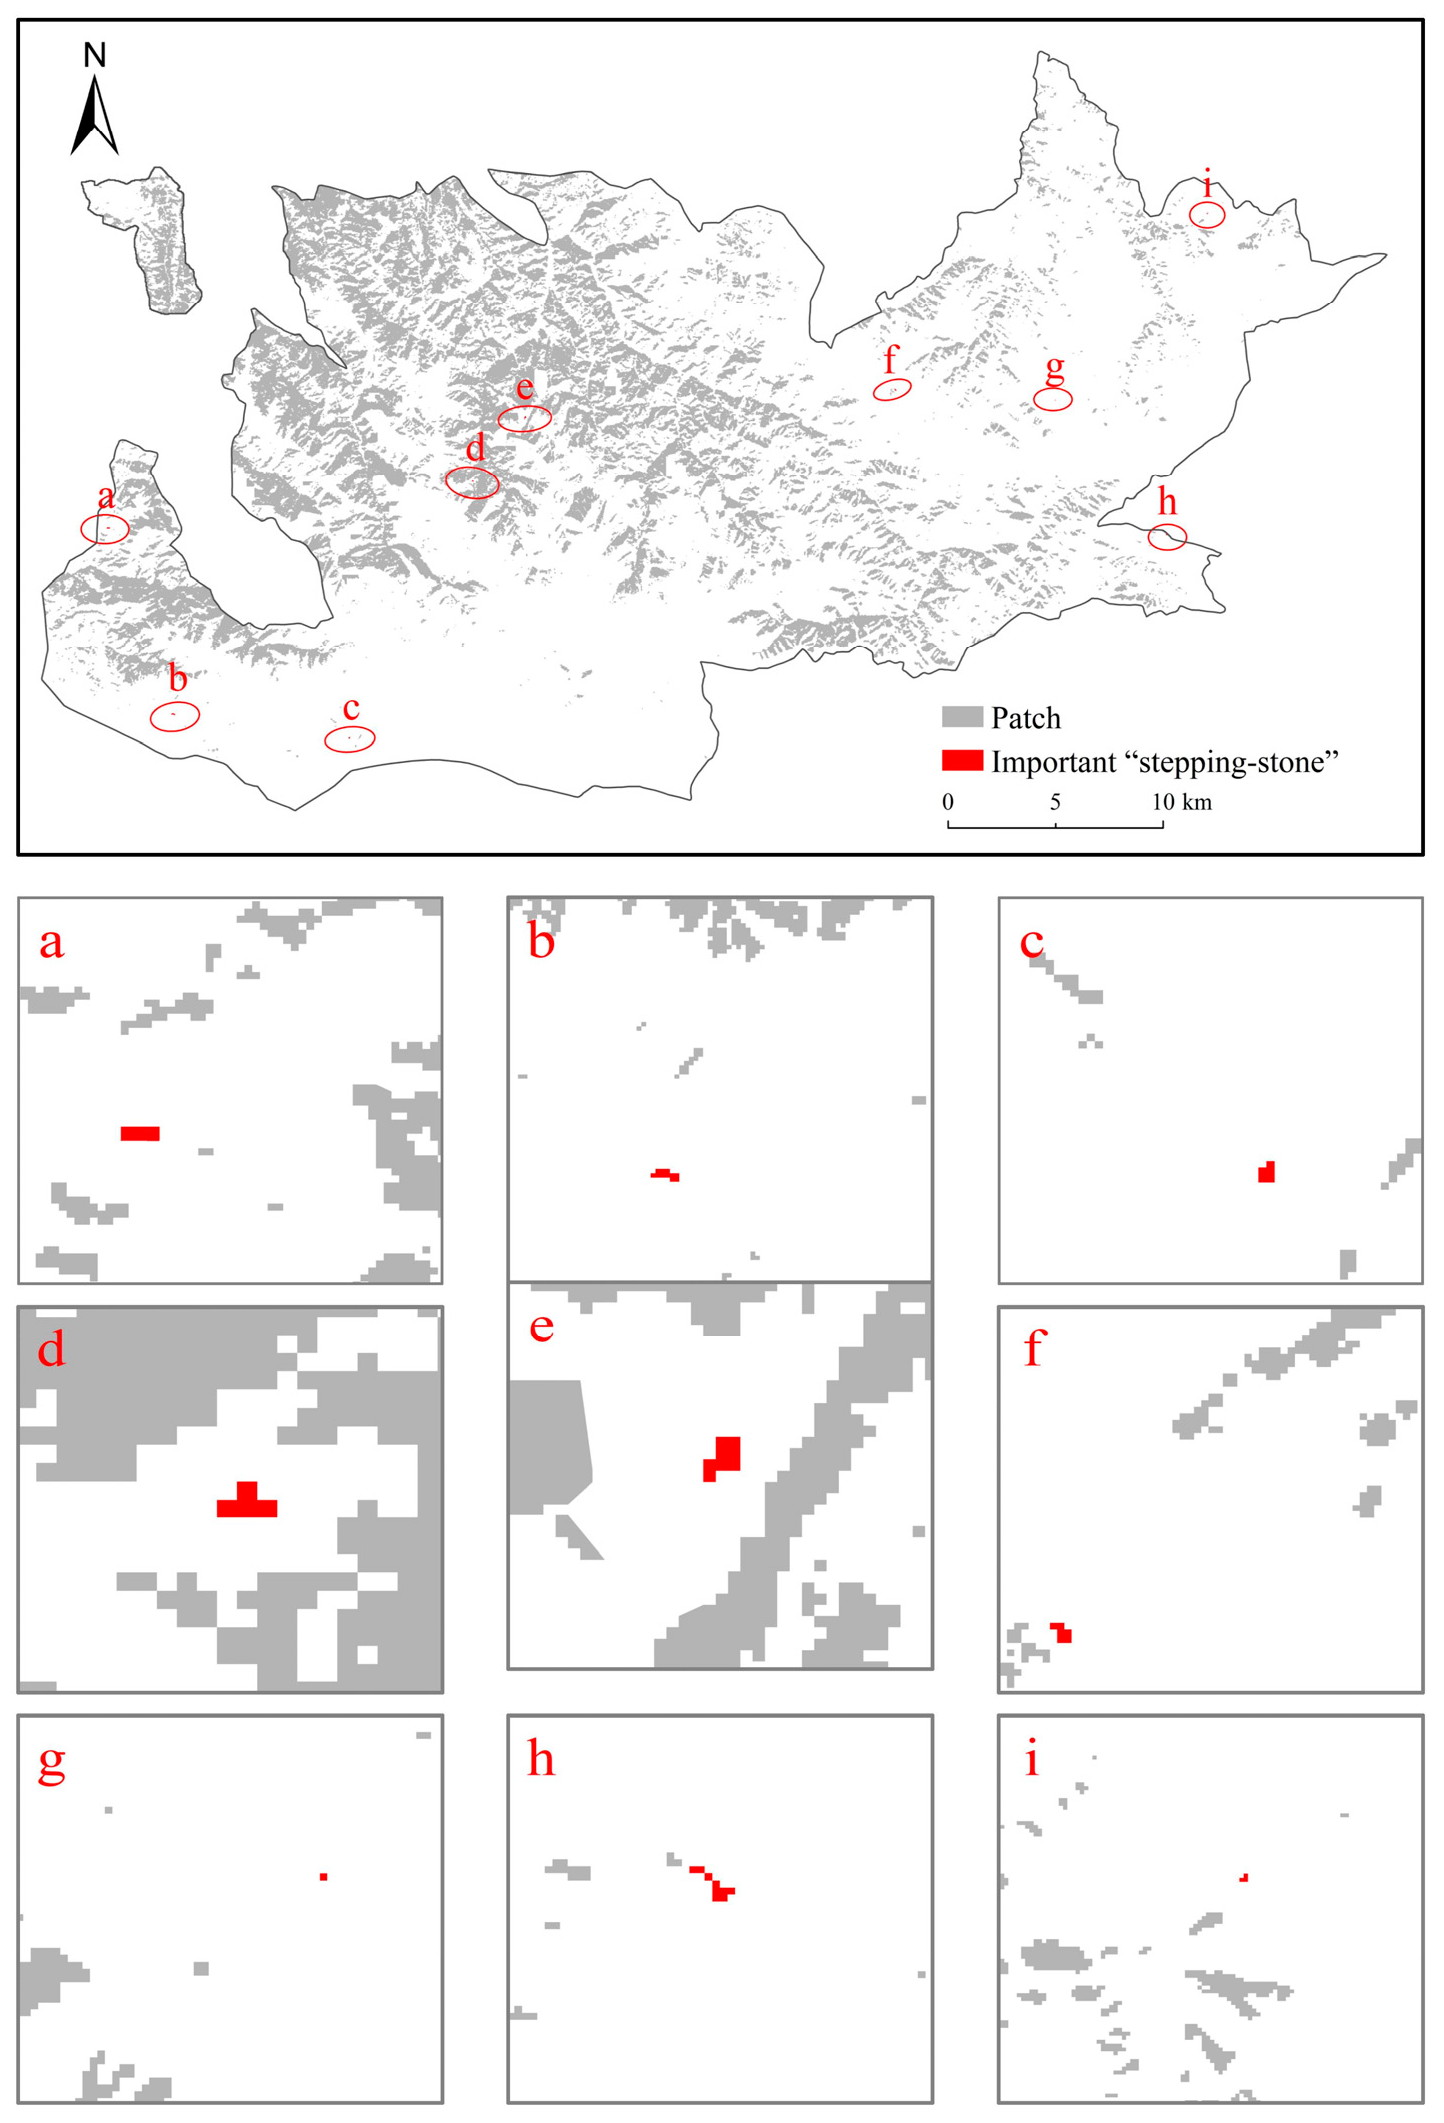
3.4. Identification of Significant Small Patches

Overall landscape connectivity decreased for all dispersal distances after partial patches were hypothetically removed, as shown by the changes in IIC values in Figure 6. The proportion of IIC values that declined was the highest for a dispersal distance of 2000 m (Figure 7), meaning the loss of forest patches had the highest effect on species with 2000 m dispersal distances. In the BMFF, removing patches with <5 hm2 had a greater impact on connectivity than removing patches with <10 hm2 at dispersal distances of 1000 m and 2000 m (Figure 7a). In the WAR, removing patches with <5 hm2 had a greater impact on connectivity than removing patches with <10 hm2 at a dispersal distance of 1000 m (Figure 7b).
Regardless of the dispersion distance, the number of patches with dNC = 0 accounted for the largest proportion, but the number of patches with dNC > 0 and dNC < 0 at the short distance threshold accounted for the largest proportion (Figure 8). This indicates that not all patches contributed to the overall forest landscape and a reduction in the number of components. Additionally, the situation in which dNC = 0 exists in most patches of large areas is relatively rare, whereas it is frequent in small patches. This indicates that when these patches were removed, the number of components of the overall landscape did not change, and this did not completely prevent species from moving freely within the components, which occurred with much less probability in large patches than in small patches.
We also found that the number of patches that reduced the number of components of the entire forest landscape after patch removal was the highest at the short-distance threshold. In the BMFF, when the dispersal distance was 200 m, the number of patches (579) that reduced the number of components of the overall forest landscape after patch removal was the largest. In contrast, in the WAR, at a dispersal distance of 100 m, the number of patches (14) was the largest.
Among them, the number of patches with dNC < 0 and area < 1 hm2 accounted for the largest proportion when the distance from the threshold was 1000 m. These patches were then visualized (Figure 9). We found that these small patches were positioned between the larger patches. Moreover, dNC < 0 indicated that the presence of these patches reduced the number of forest landscape components and increased the structural connectivity between patches. This suggests that these patches act as “stepping stones” for species to cross distant patches, thereby improving the overall connectivity of the landscape.

4. Discussion

When habitats are scarce, dispersed, or widely distributed, they can affect biodiversity reduction; therefore, the study of habitat connectivity becomes even more important [45,46]. Research on landscape connectivity has mainly adopted experimental methods, indices, and models. Experimental research is often conducted on a small range of specific species, which not only takes a long time but also requires considerable effort [47]. Modeling methods are generally used to handle large amounts of data [48]. Index research methods are mainly based on ecological and mathematical theories and are often widely used at the landscape and regional scales [49]. Graph theory methods are important for quantifying network connectivity and can be easily applied to assess fragmented or patch landscapes [50]. This method can identify the most valuable patches in the habitat network (maintaining overall forest landscape connectivity) and is well integrated with planning management practices [51,52,53]. The findings of this study provide feasible and effective solutions for scientific forest landscape protection.

4.1. Forest Fragmentation and Overall Connectivity

Similar to the Atlantic Forest in Brazil [33] and temperate forests in Mexico [54], the patch composition of the Barluk Mountain Nature Reserve consists of larger patches that dominate the total area, while smaller patches dominate the total number of forest patches. The forest is also fragmented in space. This spatial forest structure may be explained by the fact that Barluk suffered little human disturbance; thus, the complicated environmental conditions in the mountainous terrain led to the uneven distribution and fragmentation of suitable places for forests. Although habitat fragmentation per se (independent of habitat loss) may not endanger biodiversity and even several small patches usually support more species than a few large patches of the same total area [34], this does not mean that the forest landscape structure in Barluk is beneficial for all species. The negative relationship between patch size and local extinction probability and higher external disturbance risk in smaller patches make the forest landscape structure suitable for habitat generalists (such as Red deer, Cervus elaphus), but unfriendly to forest specialists (such as Siberian roe deer, Capreolus pygargus) [55,56].
For a fragmented landscape, improving landscape connectivity would increase biodiversity conservation efficiency, which is affected by both landscape structure and organism behavior. The number of components in the BMFF decreased slowly when dispersal distances were larger than 1000 m and remained stable from 5000 m to 10,000 m, indicating that the overall landscape connectivity was poor and that many ecological processes did not ideally operate on both small and large spatial scales. For example, species need to shift 16.9 km towards higher latitudes and 11 m towards higher elevations per decade caused by global warming [57], the landscape structure in BMFF would impede the range shift of forest specialists to adapt to climate change. The overall landscape connection in WAR was much better than that in BMFF, and, thus, was more helpful for the range shift of species. However, the special aim of WAR made the forest face another challenge: WAR was created to protect where the forest Amygdalus ledebouriana grows. Corlett [58] divided the distance of plant seed propagation into five levels, in which the distance of active propagation and ant movement propagation ranged from 0–10 m; the distance of wind-borne rodents and small animals is 10–100 m; the distance of small birds and mammals is 100 m–1 km; for animals with a wide range (most terrestrial herbivores), the distance is 1–10 km; and wind transmission, hydraulic transmission, large mammals, and human activities spread over a distance of more than 10 km. The large seeds (average 0.96 g) of Amygdalus ledebouriana [59], made it difficult for it to disperse to new suitable habitats, and its distribution area has not increased since the reserve was created in 2005. The assessment of landscape connectivity can also limit the spread of harmful insects in all patches on the one hand [60]. Therefore, modeling and analyzing the dynamics of landscape connectivity is of great significance for nature conservation [61].

4.2. Prioritizing Important Patches to Maintain Forest Landscape Connectivity

The role of patches in maintaining overall landscape connectivity is affected by many factors, such as the size, quality, and location in the landscape [62]. Among these, patch size was the primary factor, with its contribution to overall landscape connectivity being positively correlated with the patch size [63]. Our study also demonstrated that larger patches contributed more to the overall landscape connectivity, regardless of the dispersal distance of the species (Figure 4 and Figure 5). This result partially supports the traditional conservation-oriented actions that large patches perform effectively in sustaining forest landscape connectivity [27], which is supported by the study by Cadavid-Florez et al. We ranked the forest patches based on their contribution to maintaining overall connectivity, as shown in Figure 5, where patches with dIIC > 1% were prioritized. In addition, large patches can accommodate more species [64] that provide high-quality interior habitat [65], preserve certain large-scale natural ecosystem processes [66], and have a lower extinction risk of species than small patches [67]; thus, large, well-connected patches should be prioritized for conservation.
A similar opinion, paying more attention to larger patches in biodiversity conservation, has also been proposed in many studies. For example, forest landscape planning depends on large patches to preserve large-scale natural ecosystem processes [66]. According to Hannah et al. [67], the likelihood of species extinction decreases as patch size increases. Therefore, for forest management and conservation, we believe that encouraging the protection of large forest patches in the landscape should be prioritized for optimization.

4.3. Small Patches Can Ensure and Enhance Landscape Connectivity

As it is believed that small patches do not have a significant influence on conservation efforts, they are frequently ignored. However, if management efforts focus only on large habitat patches, many species could be lost because small patches can provide benefits that larger patches do not [26]. We performed forest loss simulations and found that although patches with areas < 1 hm2 are often overlooked in conservation studies, they are crucial for the connectivity of forest landscapes [68]. This is consistent with the findings of a previous study conducted in rural Jamapa, Veracruz, Mexico [27]. Our study also found that, based on the three forest loss scenarios in the BMFF of Barluk, the proportion of IIC values that declined was the highest for a dispersal distance of 2000 m (Figure 7). A possible reason for this is that, at the medium-distance threshold, the loss of individual patches or corridors may be more severe, leading to a significant decrease in the ability of species to reach other high-quality or large habitat patches [69]. In 1000 m and 2000 m dispersal distances, removing patches with an area of <5 hm2 had a greater impact on connectivity than removing patches with an area of <10 hm2. This may be because the dispersal distances are 1000 m and 2000 m, the removal of patches < 5 hm2 is more likely to isolate the remaining patches than the removal of patches < 10 hm2, resulting in a greater reduction in the overall connectivity of the forest landscape.
Patches have a high conservation value and promote the functional connectivity of the landscape, but not all patches contribute to the maintenance of landscape connectivity [70]. In this study, the dNC value was calculated to determine whether patches contributed to the number of components. The three results of dNC values showed that not all patches contributed to the overall forest landscape, and the number of components was reduced. dNC = 0 indicates that the patch does not affect the overall connectivity of the number of components. However, this does not mean that the patch does not affect the connectivity of the forest landscape. dNC > 0 indicates that the patch increases the number of components of the overall forest landscape and decreases the overall forest landscape connectivity. Rocha et al. found that partial patches can become dead ends, leading species into ecological traps and disrupting landscape connectivity [71]. This may seem counterintuitive; however, other studies have shown that small patches have negative effects [72]. dNC < 0 implies that the presence of this patch reduces the number of connections to the overall forest landscape, which is conducive to improving the connectivity of the forest landscape. This indicates that this patch played the role of a “stepping stone” in the overall landscape. Therefore, with habitat loss in fragmented landscapes, there is an increasing need to measure the relative contribution of all patches to overall landscape connectivity [73].
Based on dNC calculations, these small patches (area < 1 hm2) with dNC < 0, located between two large patches, play the role of “stepping stones” when the dispersal distance is 1000 m (Figure 8), which is conducive to improving the overall connectivity of the forest landscape. Patches that act as “stepping stones” can be used to connect larger, more isolated protected areas or patches, transmit to or receive from other patches, and facilitate the spread of species even if they are not the final destination [27]. This allows species with limited dispersal ability to disperse over longer distances, increases habitat availability, and is more effective in protecting biodiversity in ecosystems [74]. This reaffirms that small patches serve as significantly more crucial “stepping stones” than habitats for preserving the overall connection. In addition, small forest patches can enhance many ecological processes within a landscape; for the same area, a large number of small patches are more likely to cover the entire environmental heterogeneity than a small number of large patches and may harbor more species [34,75,76], and the small area of patches has significant benefits in terms of maintenance costs. Consequently, it is critical to dispel the myth that small forest patches are undervalued in management plans. Small-patch conservation should play a greater role in future forest resource management to enhance regional landscape connectivity and maintain regional ecosystem stability.

5. Conclusions

Increased awareness of biodiversity decline in fragmented habitats in recent years may provide new opportunities for such conservation and restoration. Maintaining and improving landscape connectivity between patches will be a key measure for biodiversity conservation. A graph theoretic approach, identifying the role of individual patches in maintaining connectivity, can provide a sequential process to effectively prioritize patches for protection. This can make better use of limited land and financial resources and can inform managers which areas can achieve greater forest landscape connectivity benefits, thereby helping the conservation of regional biodiversity and the improvement of the functioning of the forest ecosystem.
Therefore, it can be proposed that the construction of forest patches between the various components of the BMFF may serve as “stepping stones”, facilitating the maintenance of species migration and diffusion among different patches and promoting gene exchange among different populations. It is recommended to use higher-resolution image data for classification to eliminate the effects of marginalization. It is also hoped that the climate impact can be included in the calculation of connectivity in the future to take into account the climate impact.

Author Contributions

Conceptualization, Y.Z. and Y.L.; Formal analysis, Y.Z., K.C. and Z.W.; Data curation, Y.Z. and Q.Y.; Writing—original draft preparation, Y.Z.; Writing—review & editing, Y.L. and L.H. All authors have read and agreed to the published version of the manuscript.

Funding

This project was funded by the Basic Research Funds for Universities in Xinjiang Uygur Autonomous Region, China (XJEDU2024P017) and the Excellent Postdoctoral Funding Program in Xinjiang Uygur Autonomous Region.

Data Availability Statement

The data presented in this study are available on request from the author; the data are also part of an ongoing study.

Acknowledgments

We would like to thank the editor and anonymous reviewers for their comments, which helped improve the manuscript. We also would like to acknowledge all the other individuals who contributed to this paper.

Conflicts of Interest

The authors declare that this research was conducted in the absence of any commercial or financial relationships that could be construed as a potential conflict of interest. Keyu Chen is employed by Xinjiang Transportation Investment Group Co., Ltd., his employer’s company was not involved in this study, and there is no relevance between this research and their company.

References

  1. Riva, F.; Martion, C.J.; Millard, K.; Fahrig, L. Loss of the world’s smallest forests. Glob. Change Biol. 2022, 28, 7164–7166. [Google Scholar] [CrossRef] [PubMed]
  2. Bao, R.; Li, T.; Zhang, X.; Fu, X.; Zhao, Y.; Tang, M.F.; Deng, H.B. Study on the assessment and management system of forest ecosystem damage. Ecology 2021, 41, 924–933. (In Chinese) [Google Scholar] [CrossRef]
  3. Grantham, H.S.; Duncan, A.; Evans, T.D.; Jones, K.R.; Beyer, H.L.; Schuster, R.; Walston, J.; Ray, J.C.; Robinson, J.G.; Callow, M.; et al. Anthropogenic modification of forests means only 40% of remaining forests have high ecosystem integrity. Nat. Commun. 2020, 11, 5978. [Google Scholar] [CrossRef] [PubMed]
  4. Fischer, J.; Lindenmayer, D.B.; Manning, A.D. Biodiversity, ecosystem function, and resilience: Ten guiding principles for commodity production landscapes. Front. Ecol. Environ. 2006, 4, 80–86. [Google Scholar] [CrossRef]
  5. Fischer, J.; Lindenmayer, D.B. Landscape modification and habitat fragmentation: A synthesis. Glob. Ecol. Biogeogr. 2007, 16, 265–280. [Google Scholar] [CrossRef]
  6. Dixo, M.; Metzger, J.P.; Morgante, J.S.; Zamudio, K.R. Habitat fragmentation reduces genetic diversity and connectivity among toad populations in the Brazilian Atlantic Coastal Forest. Biol. Conserv. 2009, 142, 1560–1569. [Google Scholar] [CrossRef]
  7. van Langevelde, F. Modelling the negative effects of landscape fragmentation on habitat selection. Ecol. Inform. 2015, 30, 271–276. [Google Scholar] [CrossRef]
  8. Spanowicz, A.G.; Jaeger, J.A.G. Measuring landscape connectivity: On the importance of within-patch connectivity. Landsc. Ecol. 2019, 34, 2261–2278. [Google Scholar] [CrossRef]
  9. Liu, S.L.; Yin, Y.J.; Li, J.R.; Cheng, F.Y.; Dong, S.K.; Zhang, Y.Q. Using cross-scale landscape connectivity indices to identify key habitat resource patches for Asian elephants in Xishuangbanna, China. Landsc. Urban Plan. 2018, 171, 80–87. [Google Scholar] [CrossRef]
  10. Taylor, P.D.; Fahrig, L.; Henein, K.; Merriam, G. Connectivity is a vital element of landscape structure. Oikos 1993, 68, 571–573. [Google Scholar] [CrossRef]
  11. Forman, R.T.; Collinge, S.K. Nature conserved in changing landscapes with and without spatial planning. Landsc. Urban Plan. 1997, 37, 129–135. [Google Scholar] [CrossRef]
  12. Calabrese, J.M.; Fagan, W.F. A comparison-shopper’s guide to connectivity metrics. Front. Ecol. Environ. 2004, 2, 529–536. [Google Scholar] [CrossRef]
  13. Hanski, I. Metapopulation Ecology; Oxford University Press: Oxford, UK, 1999. [Google Scholar]
  14. Urban, D.; Minor, E.S.; Treml, E.A.; Schick, R.S. Graph models of habitat mosaics. Ecol. Lett. 2009, 12, 260–273. [Google Scholar] [CrossRef] [PubMed]
  15. Ayram, C.A.C.; Mendoza, M.E.; Salicrup, D.R.P.; Granados, E.L. Identifying potential conservation areas in the Cuitzeo Lake basin, Mexico by multitemporal analysis of landscape connectivity. J. Nat. Conserv. 2014, 22, 424–435. [Google Scholar] [CrossRef]
  16. Martello, F.; dos Santos, J.S.; Silva-Neto, C.M.; Cássia-Silva, C.; Siqueira, K.N.; de Ataide, M.V.R.; Ribeiro, M.C.; Collevatti, R.G. Landscape structure shapes the diversity of plant reproductive traits in agricultural landscapes in the Brazilian Cerrado. Agric. Ecosyst. Environ. 2023, 341, 108216. [Google Scholar] [CrossRef]
  17. Laita, A.; Kotiaho, J.S.; Mönkkönen, M. Graph-theoretic connectivity measures: What do they tell us about connectivity? Landsc. Ecol. 2011, 26, 951–967. [Google Scholar] [CrossRef]
  18. Segurado, P.; Branco, P.; Ferreira, M.T. Prioritizing restoration of structural connectivity in rivers: A graph based approach. Landsc. Ecol. 2013, 28, 1231–1238. [Google Scholar] [CrossRef]
  19. Devi, B.S.S.; Murthy, M.S.R.; Debnath, B.; Jha, C.S. Forest patch connectivity diagnostics and prioritization using graph theory. Ecol. Model. 2013, 251, 279–287. [Google Scholar] [CrossRef]
  20. Thompson, S.E.D.; Chisholm, R.A.; Rosindell, J. Characterising extinction debt following habitat fragmentation using neutral theory. Ecol. Lett. 2019, 22, 2087–2096. [Google Scholar] [CrossRef]
  21. Soares, R.M.V.; Lira, P.K.; Manes, S.; Vale, M.M. A methodological framework for prioritizing habitat patches in urban ecosystems based on landscape functional connectivity. Urban Ecosyst. 2024, 27, 147–157. [Google Scholar] [CrossRef]
  22. Fischer, J.; Peterson, G.D.; Gardner, T.A.; Gordon, L.J.; Fazey, I.; Elmqvist, T.; Felton, A.; Folke, C.; Dovers, S. Integrating resilience thinking and optimisation for conservation. Proc. Natl. Acad. Sci. USA 2009, 24, 549–554. [Google Scholar] [CrossRef] [PubMed]
  23. Lindenmayer, D. Small patches make critical contributions to biodiversity conservation. Proc. Natl. Acad. Sci. USA 2019, 116, 717–719. [Google Scholar] [CrossRef] [PubMed]
  24. Laurance, W.F. Hyperdynamism in fragmented habitats. J. Veg. Sci. 2002, 13, 595–602. [Google Scholar] [CrossRef]
  25. Herrera, L.P.; Sabatino, M.C.; Jaimes, F.R.; Saura, S. Landscape connectivity and the role of small habitat patches as stepping stones: An assessment of the grassland biome in South America. Biodivers. Conserv. 2017, 26, 3465–3479. [Google Scholar] [CrossRef]
  26. Wintle, B.A.; Kujala, H.; Whitehead, A.; Cameron, A.; Veloz, S.; Kukkala, A.; Moilanen, A.; Gordon, A.; Lentini, P.E.; Cadenhead, N.C.R.; et al. Global synthesis of conservation studies reveals the importance of small habitat patches for biodiversity. Proc. Natl. Acad. Sci. USA 2019, 116, 909–914. [Google Scholar] [CrossRef]
  27. Cadavid-Florez, L.; Laborde, J.; Mclean, D.J. Isolated trees and small woody patches greatly contribute to connectivity in highly fragmented tropical landscapes. Landsc. Urban Plan. 2020, 196, 103745. [Google Scholar] [CrossRef]
  28. Wang, P.J.; Liu, Y.Y.; Permanhan, J.; Liang, L.W.; Mamtimin, S. Ecological types and composition of bryophyte communities in the Barluk Mountain National Nature Reserve, Xinjiang. Resour. Environ. Arid Areas 2023, 37, 146–152. (In Chinese) [Google Scholar]
  29. Lander, T.A.; Boshier, D.H.; Harris, S.A. Fragmented but not isolated: Contribution of single trees, small patches and long-distance pollen flow to genetic connectivity for Gomortega keule, an endangered Chilean tree. Biol. Conserv. 2010, 143, 2583–2590. [Google Scholar] [CrossRef]
  30. Valdés, A.; Lenoir, J.; De Frenne, P.; Andrieu, E.; Brunet, J.; Chabrerie, O.; Cousins, S.A.O.; Deconchat, M.; De Smedt, P.; Diekmann, M.; et al. High ecosystem service delivery potential of small woodlands in agricultural landscapes. J. Appl. Ecol. 2020, 57, 4–16. [Google Scholar] [CrossRef]
  31. Yan, Y.Z.; Jarvie, S.; Zhang, Q.; Zhang, S.S.; Han, P.; Liu, Q.F.; Liu, P.T. Small patches are hotspots for biodiversity conservation in fragmented landscapes. Ecol. Indic. 2021, 130, 108086. [Google Scholar] [CrossRef]
  32. Saura, S.; Bodin, Ö.; Fortin, M. Stepping stones are crucial for species’ long-distance dispersal and range expansion through habitat networks. J. Appl. Ecol. 2014, 51, 171–182. [Google Scholar] [CrossRef]
  33. Diniz, M.F.; Coelho, M.T.P.; de Sousa, F.G.; Hasui, É.; Loyola, R. The underestimated role of small fragments for carnivore dispersal in the Atlantic Forest. Perspect. Ecol. Conserv. 2021, 19, 81–89. [Google Scholar] [CrossRef]
  34. Fahrig, L.; Arroyo-Rodrıguez, V.; Bennett, J.R.; Boucher-Lalonde, V.; Cazetta, E.; Currie, D.J.; Eigenbrod, F.; Ford, A.T.; Harrison, S.P.; Jaeger, J.A.G.; et al. Is habitat fragmentation bad for biodiversity? Biol. Conserv. 2019, 230, 179–186. [Google Scholar] [CrossRef]
  35. Sutherland, G.D.; Harestad, A.S.; Price, K.; Lertzman, K.P. Scaling of natal dispersal distances in terrestrial birds and mammals. Conserv. Ecol. 2020, 4, 16. Available online: http://www.consecol.org/vol4/iss1/art16/ (accessed on 25 October 2023). [CrossRef]
  36. Tarabon, S.; Bergès, L.; Dutoit, T.; Isselin-Nondedeu, F. Maximizing habitat connectivity in the mitigation hierarchy. A case study on three terrestrial mammals in an urban environment. J. Environ. Manag. 2019, 243, 340–349. [Google Scholar] [CrossRef]
  37. Wang, Z.; Yang, Z.P.; Shi, H.; Han, L. Effect of forest connectivity on the dispersal of species: A case study in the Bogda World Natural Heritage Site, Xinjiang, China. Ecol. Indic. 2021, 125, 1075–1076. [Google Scholar] [CrossRef]
  38. Liu, S.B.; Wang, X.G.; Zhang, W.F.; Liu, L.B.; Wen, Z.G.; Peng, Z.J. An analysis of the lithofacies sections and establishment of the phase model for the Lower-Middle Devonian Kulumudi Formation in Barluk Mountain area of Xinjiang. Geol. Bull. China 2016, 35, 1427–1440. (In Chinese) [Google Scholar]
  39. Duan, X.B.; Nurbaye, A. Research on Wild Plant Resources in Barluk Mountain Natural Reserve of Xinjiang. J. Anhui Agric. Sci. 2011, 39, 5996–5999. (In Chinese) [Google Scholar]
  40. Yang, J.; Huang, X. The 30 m annual land cover dataset and its dynamics in China from 1990 to 2019. Earth Syst. Sci. Data 2021, 13, 3907–3925. [Google Scholar] [CrossRef]
  41. Saura, S.; Torné, J. Conefor Sensinode 2.2: A software package for quantifying the importance of habitat patches for landscape connectivity. Environ. Model. Softw. 2009, 24, 135–139. [Google Scholar] [CrossRef]
  42. Urban, D.; Keitt, T. Landscape Connectivity: A Graph-Theoretic Perspective. Ecology 2001, 82, 1205–1218. [Google Scholar] [CrossRef]
  43. Pascual-Hortal, L.; Saura, S. Comparison and development of new graph-based landscape connectivity indices: Towards the priorization of habitat patches and corridors for conservation. Landsc. Ecol. 2006, 21, 959–967. [Google Scholar] [CrossRef]
  44. Saura, S.; Pascual-Hortal, L. Conefor Sensinode 2.2 User’s Manual: Software for Quantifying the Importance of Habitat Patches for Maintaining Landscape Connectivity Through Graphs and Habitat Availability Indices; University of Lleida: Lleida, Spain, 2007. [Google Scholar]
  45. Flather, C.H.; Bevers, M. Patchy reaction-diffusion and population abundance: The relative importance of habitat amount and arrangement. Am. Nat. 2002, 159, 40–56. [Google Scholar] [CrossRef] [PubMed]
  46. King, A.W.; With, K.A. Dispersal success on spatially structured landscapes: When do spatial pattern and dispersal behavior really matter? Ecol. Model. 2002, 147, 23–39. [Google Scholar] [CrossRef]
  47. Oliver, T.H.; Powney, G.D.; Baguette, M.; Schtickzelle, N. Synchrony in population counts predicts butterfly movement frequencies. Ecol. Entomol. 2017, 42, 375–378. [Google Scholar] [CrossRef]
  48. Foster, E.; Love, J.; Rader, R.; Reid, N.; Drielsma, M.J. Integrating a generic focal species, metapopulation capacity, and connectivity to identify opportunities to link fragmented habitat. Landsc. Ecol. 2017, 32, 1837–1847. [Google Scholar] [CrossRef]
  49. Pietsch, M. Contribution of connectivity metrics to the assessment of biodiversity-Some methodological considerations to improve landscape planning. Ecol. Indic. 2018, 95, 116–127. [Google Scholar] [CrossRef]
  50. Minor, E.S.; Urban, D.L. A Graph-Theory Framework for Evaluating Landscape Connectivity and Conservation Planning. Conserv. Biol. 2008, 22, 297–307. [Google Scholar] [CrossRef]
  51. Rothley, K.D.; Rae, C. Working backwards to move forwards: Graph-based connectivity metrics for reserve network selection. Environ. Model. Assess. 2005, 10, 107–113. [Google Scholar] [CrossRef]
  52. Pascual-Hortal, L.; Saura, S. Integrating landscape connectivity in broad-scale forest planning through a new graph-based habitat availability methodology: Application to capercaillie (Tetrao urogallus) in Catalonia (NE Spain). Eur. J. For. Res. 2008, 127, 23–31. [Google Scholar] [CrossRef]
  53. Jordán, F.; Báldi, A.; Orci, K.M.; Rácz, I.; Varga, Z. Characterizing the importance of habitat patches and corridors in maintaining the landscape connectivity of a Pholidoptera transsylvanica (Orthoptera) metapopulation. Landsc. Ecol. 2003, 18, 83–92. [Google Scholar] [CrossRef]
  54. Latorre-Cárdenas, M.C.; González-Rodríguez, A.; Godínez-Gómez, O.; Arima, E.Y.; Young, K.R.; Denvir, A.; García-Oliva, F.; Ghilardi, A. Estimating Fragmentation and Connectivity Patterns of the Temperate Forest in an Avocado-Dominated Landscape to Propose Conservation Strategies. Land 2023, 12, 631. [Google Scholar] [CrossRef]
  55. Woodroffe, R.; Ginsberg, J.R. Edge effects and the extinction of populations inside protected areas. Science 1998, 280, 2126–2128. [Google Scholar] [CrossRef] [PubMed]
  56. Han, L.; Wang, Z.; Wei, M.M.; Wang, M.Y.; Shi, H.; Ruckstuhl, K.; Yang, W.K.; Alves, J. Small patches play a critical role in the connectivity of the Western Tianshan landscape, Xinjiang, China. Ecol. Indic. 2022, 144, 109542. [Google Scholar] [CrossRef]
  57. Chen, I.C.; Hill, J.K.; Ohlemüller, R.; Roy, D.B.; Thomas, C.D. Rapid range shifts of species associated with high levels of climate warming. Science 2011, 333, 1024–1026. [Google Scholar] [CrossRef]
  58. Corlett, R.T. Seed dispersal distances and plant migration potential in tropical East Asia. Biotropica 2009, 41, 592–598. [Google Scholar] [CrossRef]
  59. Huang, P.Y.; Pan, W.B.; Li, X.P. Investigation of biological and ecological characteristics on Amygdalus ledebouriana. J. Xinjiang Univ. (Nat. Sci. Ed. Chin. Engl.) 1985, 2, 65–70. (In Chinese) [Google Scholar]
  60. Wang, Z.J.; Jin, K.Y. Analysis of Xinjiang Distribution of Amygdalus ledebouriana and the reason of becoming vulnerable. North. Hortic. 2014, 23, 43–45. (In Chinese) [Google Scholar]
  61. Liu, W.J.; Hughes, A.C.; Bai, Y.; Li, Z.J.; Mei, C.C.; Ma, Y.X. Using landscape connectivity tools to identify conservation priorities in forested areas and potential restoration priorities in rubber plantation in Xishuangbanna, Southwest China. Landsc. Ecol. 2020, 35, 389–402. [Google Scholar] [CrossRef]
  62. Xu, Y.J.; Si, Y.L.; Takekawa, J.; Liu, Q.; Prins, H.H.T.; Yin, S.L.; Prosser, D.J.; Gong, P.; de Boer, W.F. A network approach to prioritize conservation efforts for migratory birds. Conserv. Biol. 2020, 34, 416–426. [Google Scholar] [CrossRef]
  63. Qi, K.; Fan, Z.; Xie, Y. The influences of habitat proportion and patch-level structural factors in the spatial habitat importance ranking for connectivity and implications for habitat conservation. Urban For. Urban Green. 2021, 64, 127239. [Google Scholar] [CrossRef]
  64. Roberts, H.P.; King, D.I. Area requirements and landscape-level factors influencing shrubland birds. J. Wildl. Manag. 2017, 81, 1298–1307. [Google Scholar] [CrossRef]
  65. Laurance, W.F.; Camargo, J.L.C.; Luizão, R.C.C.; Laurance, S.G.; Pimm, S.L.; Bruna, E.M.; Stouffer, P.C.; Williamson, G.B.; Benítez-Malvido, J.; Vasconcelos, H.L.; et al. The fate of Amazonian forest fragments: A 32-year investigation. Biol. Conserv. 2011, 144, 56–67. [Google Scholar] [CrossRef]
  66. Perino, A.; Pereira, H.M.; Navarro, L.M.; Fernández, N.; Bullock, J.M.; Ceausu, S.; Cortés-Avizanda, A.; van Klink, R.; Kuemmerle, T.; Lomba, A.; et al. Rewilding complex ecosystems. Science 2019, 364, eaav5570. [Google Scholar] [CrossRef] [PubMed]
  67. Hannah, L.; Roehrdanz, P.R.; Marquet, P.A.; Enquist, B.J.; Midgley, G.; Foden, W.; Lovett, J.C.; Corlett, R.T.; Corcoran, D.; Butchart, S.H.M.; et al. 30% land conservation and climate action reduces tropical extinction risk by more than 50%. Ecography 2020, 43, 943–953. [Google Scholar] [CrossRef]
  68. Hall, M.; Nimmo, D.; Watson, S.; Bennett, A.F. Linear habitats in rural landscapes have complementary roles in bird conservation. Biodivers. Conserv. 2018, 27, 2605–2623. [Google Scholar] [CrossRef]
  69. Saura, S.; Rubio, L. A common currency for the different ways in which patches and links can contribute to habitat availability and connectivity in the landscape. Ecography 2010, 33, 523–537. [Google Scholar] [CrossRef]
  70. Fahrig, L.; Watling, J.I.; Arnillas, C.A.; Arroyo-Rodríguez, V.; Jörger-Hickfang, T.; Müller, J.; Pereira, H.M.; Riva, F.; Rösch, V.; Seibold, S.; et al. Resolving the SLOSS dilemma for biodiversity conservation: A research agenda. Biol. Rev. 2022, 97, 99–114. [Google Scholar] [CrossRef]
  71. da Rocha, É.G.; Brigatti, E.; Niebuhr, B.B.; Ribeiro, M.C.; Vieira, M.V. Dispersal through fragmented landscapes: The role of stepping stones and perceptual range. Landsc. Ecol. 2021, 36, 3249–3267. [Google Scholar] [CrossRef]
  72. Kramer-Schadt, S.; Kaiser, T.S.; Frank, K.; Wiegand, T. Analyzing the effect of stepping stones on target patch colonisation in structured landscapes for Eurasian lynx. Landsc. Ecol. 2011, 26, 501–513. [Google Scholar] [CrossRef]
  73. Yan, Y.Z.; Jarvie, S.; Liu, Q.F.; Zhang, Q. Effects of fragmentation on grassland plant diversity depend on the habitat specialization of species. Biol. Conserv. 2022, 275, 109773. [Google Scholar] [CrossRef]
  74. Verena, R.; Teja, T.; Christoph, S.; Batáry, P. Biodiversity conservation across taxa and landscapes requires many small as well as single large habitat fragments. Oecologia 2015, 179, 209–222. [Google Scholar] [CrossRef]
  75. Phalan, B.T. What have we learned from the land sparing-sharing model? Sustainability 2018, 10, 1760. [Google Scholar] [CrossRef]
  76. Riva, F.; Fahrig, L. The disproportionately high value of small patches for biodiversity conservation. Conserv. Lett. 2022, 15, e12881. [Google Scholar] [CrossRef]
Figure 1. China map showing Xinjiang highlighted (a), Xinjiang map showing Barluk Mountain Nature Reserve highlighted (b), and the distribution of forest patches in Barluk (c).
Forests 16 00074 g001
Figure 2. Workflow of the main steps.
Forests 16 00074 g002
Figure 3. The number and area proportion of patches. (a) in the BMFF, (b) in the WAR.
Forests 16 00074 g003
Figure 4. Relationship between patch area and patch contribution to maintaining overall landscape connectivity at different dispersal distances in BMFF (a) and WAR (b). D: dispersal distance; R: Pearson correlation coefficient; **: significance at the 0.01 level.
Forests 16 00074 g004
Figure 5. The rank of each patch that contributes to the overall connectivity at 100 m (a), 200 m (b), 500 m (c), 1000 m (d), 2000 m (e), 5000 m (f), and 10,000 m (g) dispersal distance.
Forests 16 00074 g005
Figure 6. Integral index of connectivity changes in forest loss scenarios in BMFF (a) and WAR (b) at seven dispersion distances. I: patches with area < 1 hm2 were hypothetically removed; II: patches with area < 5 hm2 were hypothetically removed; III: patches with area < 10 hm2 were hypothesized removed; IV: overall patches.
Forests 16 00074 g006
Figure 7. The proportion of integral index of connectivity decline in forest loss scenarios at seven dispersion distances in BMFF (a) and WAR (b). I: patches with area < 1 hm2 were removed; II: patches with area < 5 hm2 were removed; III: patches with area < 10 hm2 were removed.
Forests 16 00074 g007
Figure 8. The number of patches with dNC values changed at seven dispersal distances. (a) in the BMFF, (b) in the WAR.
Forests 16 00074 g008
Figure 9. Important “stepping stones” that maintain overall landscape connectivity at dispersal distances is 1000 m.
Forests 16 00074 g009
Table 1. The values of connectivity indices of the study area.
Dispersal Distance (m) 10020050010002000500010,000
NCBMFF116756415782666060
WAR15731111
IICBMFF0.00200.00240.00350.00420.00590.00800.0098
WAR0.09880.10050.10540.11110.11330.11370.1137
Disclaimer/Publisher’s Note: The statements, opinions and data contained in all publications are solely those of the individual author(s) and contributor(s) and not of MDPI and/or the editor(s). MDPI and/or the editor(s) disclaim responsibility for any injury to people or property resulting from any ideas, methods, instructions or products referred to in the content.

