Article

Roughness Evaluation of Bamboo Surfaces Created by Abrasive Belt Sanding

College of Chemistry and Materials Engineering, Zhejiang A&F University, No. 666 Wusu Street, Lin’an District, Hangzhou 311300, China
*
Author to whom correspondence should be addressed.
Forests 2025, 16(1), 66; https://doi.org/10.3390/f16010066
Submission received: 3 December 2024 / Revised: 21 December 2024 / Accepted: 31 December 2024 / Published: 2 January 2025
(This article belongs to the Section Wood Science and Forest Products)

Abstract

:
Mechanical belt sanding is critical in the manufacturing of bamboo and bamboo products, where surface roughness is commonly used to quantitatively evaluate the surface quality. In this study, flattened bamboo workpieces were sanded using P80 and P120 abrasive belts to create different surfaces. The linear roughness parameters, namely Rz, Ra, Rq, Rsk, Rku, and Rmr(c), were measured using both a stylus profilometer and a 3D profilometer. Statistical t-tests were conducted to determine the significance of differences between the two methods. Additionally, roughness profiles were analyzed in the frequency domain using Fast Fourier Transform (FFT) and Power Spectral Density (PSD) methods. A Random Forest (RF) regression model was also developed to predict the roughness values and figure out the dominant factors between granularity and measurement methods. The results revealed that both the stylus and 3D profilometers provided reliable comparisons of Rz, Ra, Rq, and Rmr (50%) for different grit sizes. However, resolution differences between the two methods were found to be critical for accurately interpreting roughness values. Variations in Rsk and Rku highlighted differences in sensitivity and detection range, particularly at finer scales, between the two methods. The stylus profilometer, with its higher spatial resolution and finer sampling density, demonstrated greater sensitivity to finer surface details. This was consistent with the FFT and PSD analyses, which showed that the stylus profilometer captured higher-frequency surface components more effectively. Furthermore, the RF model indicated that the choice of measurement method had negligible impact on the evaluation of the selected roughness parameters, suggesting that standardizing measurement techniques may not be essential for consistent roughness assessments of sanded bamboo surfaces.

1. Introduction

Bamboo, as a renewable and versatile material, has gained significant attention in the furniture and construction industries due to its strength, sustainability, and unique aesthetic qualities [1,2]. Bamboo’s biological structure, composed of vascular bundles embedded in a matrix of parenchyma tissue, presents both opportunities and challenges in manufacturing processes [3,4,5].
Sanding is one of the critical operations in bamboo processing, typically carried out to prepare the surface for subsequent treatments like coating, finishing, or bonding [6]. This mechanical operation removes uneven material, creates a smoother texture, and enhances the overall appearance of bamboo products. During sanding, abrasive belts of varying granularity are used to create distinct surface textures. Coarser belts remove material aggressively, leaving more pronounced surface patterns, while finer belts produce smoother finishes. The resulting surface characteristics depend on the interplay between bamboo’s inherent anatomical features and the mechanics of abrasive interaction [7]. Understanding the sanding process is crucial for achieving desired surface properties, which ultimately impact product performance and aesthetic value in applications such as furniture and decorative panels [8].
Surface roughness evaluation is a critical component in assessing the quality of machined surfaces, as it directly influences finishing, coating adhesion, and bonding performance [9,10,11]. In bamboo-based products, surface quality is particularly significant due to the cellular structure of bamboo, which affects the material’s interaction with adhesives, paints, and coatings. A smooth, uniformly sanded surface ensures consistent adhesion and enhances the visual appeal of bamboo products [12,13]. However, despite the importance of surface roughness in manufacturing processes, research on the surface quality of bamboo-based materials remains limited compared to other natural materials like wood. This gap in knowledge poses challenges for optimizing sanding operations and achieving reliable quality control. Evaluating surface roughness parameters, such as average roughness Ra, maximum height Rz, and root mean square roughness Rq, is essential for establishing standards and improving manufacturing outcomes [14,15]. Moreover, parameters like the material ratio curve Rmr(c) provide deeper insights into surface functionality by describing the distribution of peaks and valleys.
Surface roughness is typically evaluated using profilometric techniques that acquire surface profile data [16,17]. These techniques are broadly categorized into 2D and 3D methods, each with specific advantages and limitations. Stylus profilometers, widely used in 2D roughness measurement, employ a contact-based method where typically a diamond stylus with a small tip radius traverses the surface to record height variations along a single line trace [18,19]. This method is highly accurate for linear roughness measurements and provides standardized roughness parameters, but it is time-consuming and can potentially damage delicate surfaces. In contrast, 3D optical profilometers use non-contact techniques, such as laser or white-light interferometry, to scan the surface and create a three-dimensional map [20,21]. While 3D methods offer broader area sampling and higher measurement speeds, they are sensitive to material reflectivity and require careful calibration to ensure accuracy. For this study, both stylus and 3D profilometers were employed to measure linear roughness parameters. By focusing on line-based roughness measurements, the study avoids the broader spatial considerations of 3D profiling, allowing a direct comparison of the two techniques. This comparison highlights the accessibility and reliability of each method in evaluating the sanding quality of bamboo surfaces.
Numerous studies have explored surface roughness analysis across a range of materials and machining processes. Techniques such as Fast Fourier Transform (FFT) and Power Spectral Density (PSD) analysis are commonly used to examine the frequency content of surface profiles, providing insights into the periodicity and randomness of surface features [22,23]. These methods are particularly useful in distinguishing surface patterns generated by different machining operations. Machine learning approaches, such as the Random Forest (RF) and neural network algorithm, have also been applied in surface roughness studies to assess the relative importance of various roughness parameters and measurement techniques [24,25]. RF models are capable of handling complex datasets and identifying key factors influencing surface quality, making them valuable tools for optimizing manufacturing processes. Neural network models are primarily applied to predict the roughness outcomes under different processing conditions. However, despite their widespread application in materials science, studies focusing on bamboo’s unique structure and sanding processes are scarce. Research on the surface roughness of bamboo-based products has primarily focused on descriptive analyses of roughness parameters, with limited attention to advanced analytical methods like FFT, PSD, and machine learning. This study seeks to address this gap by integrating these techniques into a comprehensive analysis of bamboo surface roughness.
Generally, this paper aims to evaluate the performance and reliability of stylus and 3D profilometers in measuring the surface roughness of bamboo workpieces sanded with different abrasive belt granularities (P80 and P120). By focusing on the linear roughness parameters Ra, Rz, Rq, Rsk, Rku, and Rmr(c), the study provides a detailed comparison of the two measurement methods while accounting for the unique cellular structure of bamboo and the effects of sanding processes. The research also employs FFT and PSD analyses to examine differences in roughness profiles generated by the two measurement techniques, offering a deeper understanding of surface characteristics. Furthermore, an RF model is developed to evaluate the importance of measurement methods and grit sizes in roughness prediction, providing insights into their practical applications in bamboo surface quality assessment. The findings of this study will enhance the understanding of bamboo surface roughness measurement, offering practical recommendations for selecting appropriate techniques and parameters for specific manufacturing requirements.

2. Materials and Methods

2.1. Materials

Flattened bamboo boards were used to conduct the experiments, which were purchased from Sanjian Co., Ltd. (Lishui City, China). The bamboo boards originated from 3- to 4-year-old Moso bamboo (Phyllostachys pubescens) and were manufactured through non-notched-flattening technology [26]. After circular sawing, the bamboo boards were prepared as workpieces with dimensions of 300 × 40 × 6 mm (L × W × H). Average density of the bamboo workpieces was about 0.62 g/cm3, and the oven-dried moisture content was 11.1%. Sanding orientation was generally parallel to the grain. Therefore, longitudinal sanding (with grain) type was performed in an internode area of bamboo skin side in this study. Surface hardness of the prepared bamboo workpieces was measured by portable hardness tester (type shore D, China), and the average hardness is 65.8 ± 5.0 HD.

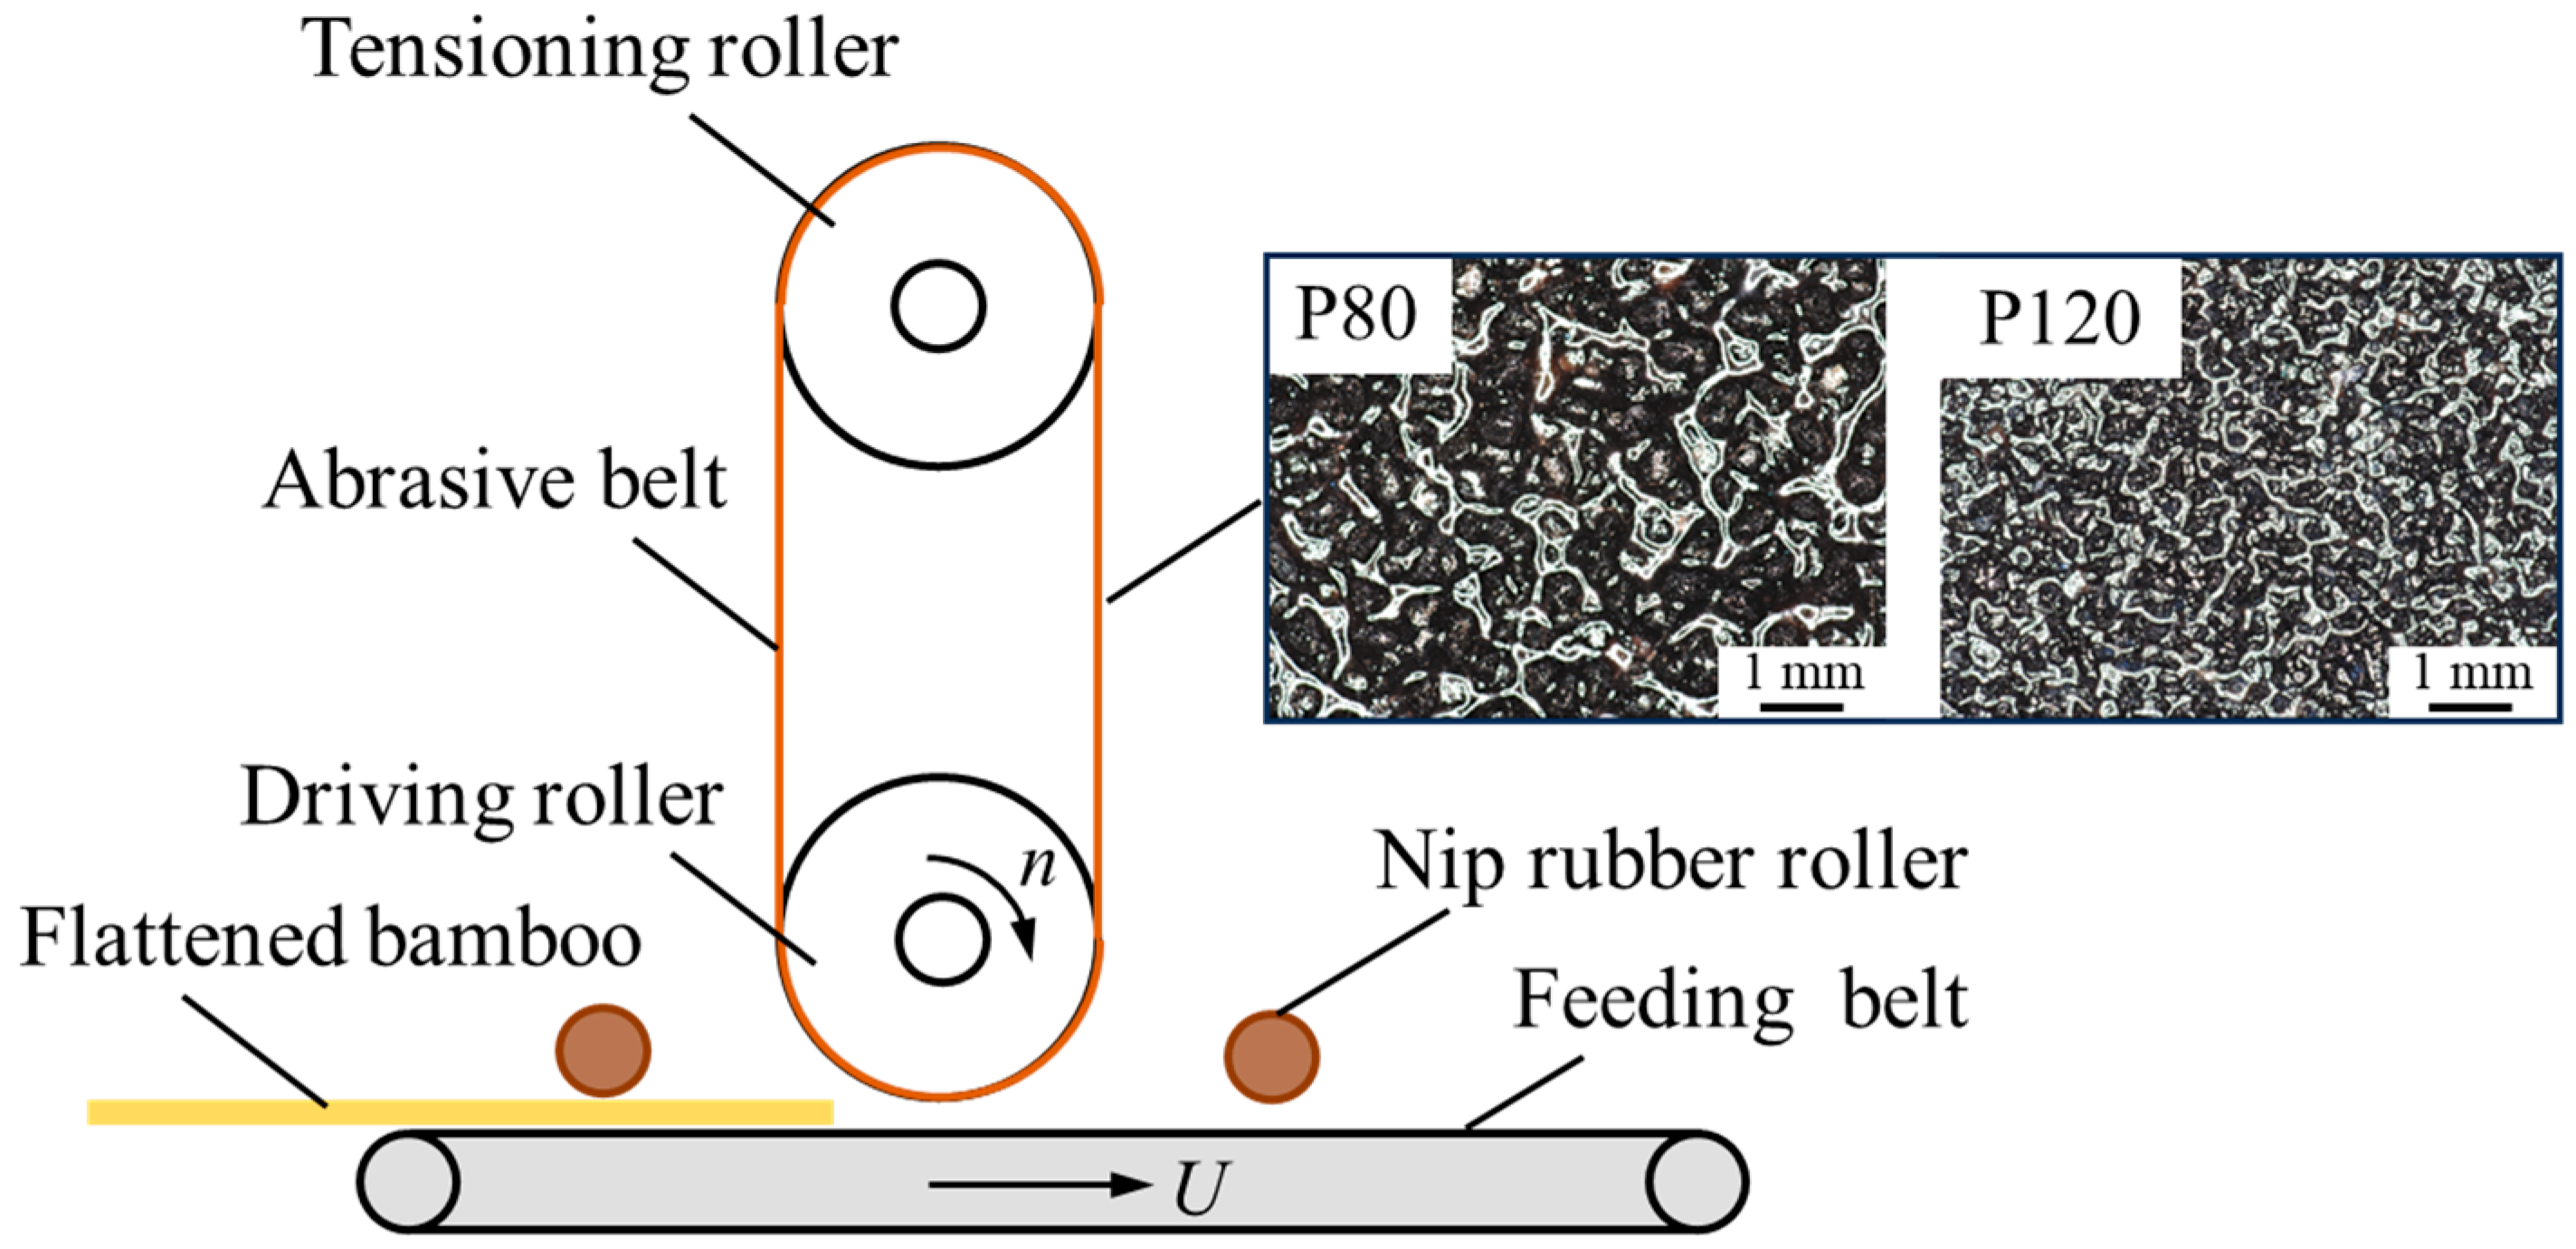
2.2. Experimental Design and Setup

The experiments were conducted using a wide belt sander (R-RP630, Xinerhua, Qingdao, China). A schematic diagram of the experimental setup is shown in Figure 1. The down-roller, made of steel, functioned as the driving roller with a linear velocity of 20 m/s. Bamboo workpieces were fed via a belt conveyor at an infeed rate of 10 m/min. In this study, the sanding direction of the abrasive belt was opposite to the feed direction of the workpiece, a process referred to as reverse sanding. Given the density and hardness of the bamboo workpieces, medium-flexible cloth-based abrasive belts (SCY898, OUBA, Zhengzhou, China) with randomly fractured carborundum grits were selected. The abrasive belt measured 650 mm × 1900 mm, and two grit sizes, P80 and P120, were used to create two distinct sanded surfaces. For each experimental feed, the sanding thickness was set to 0.2 mm.

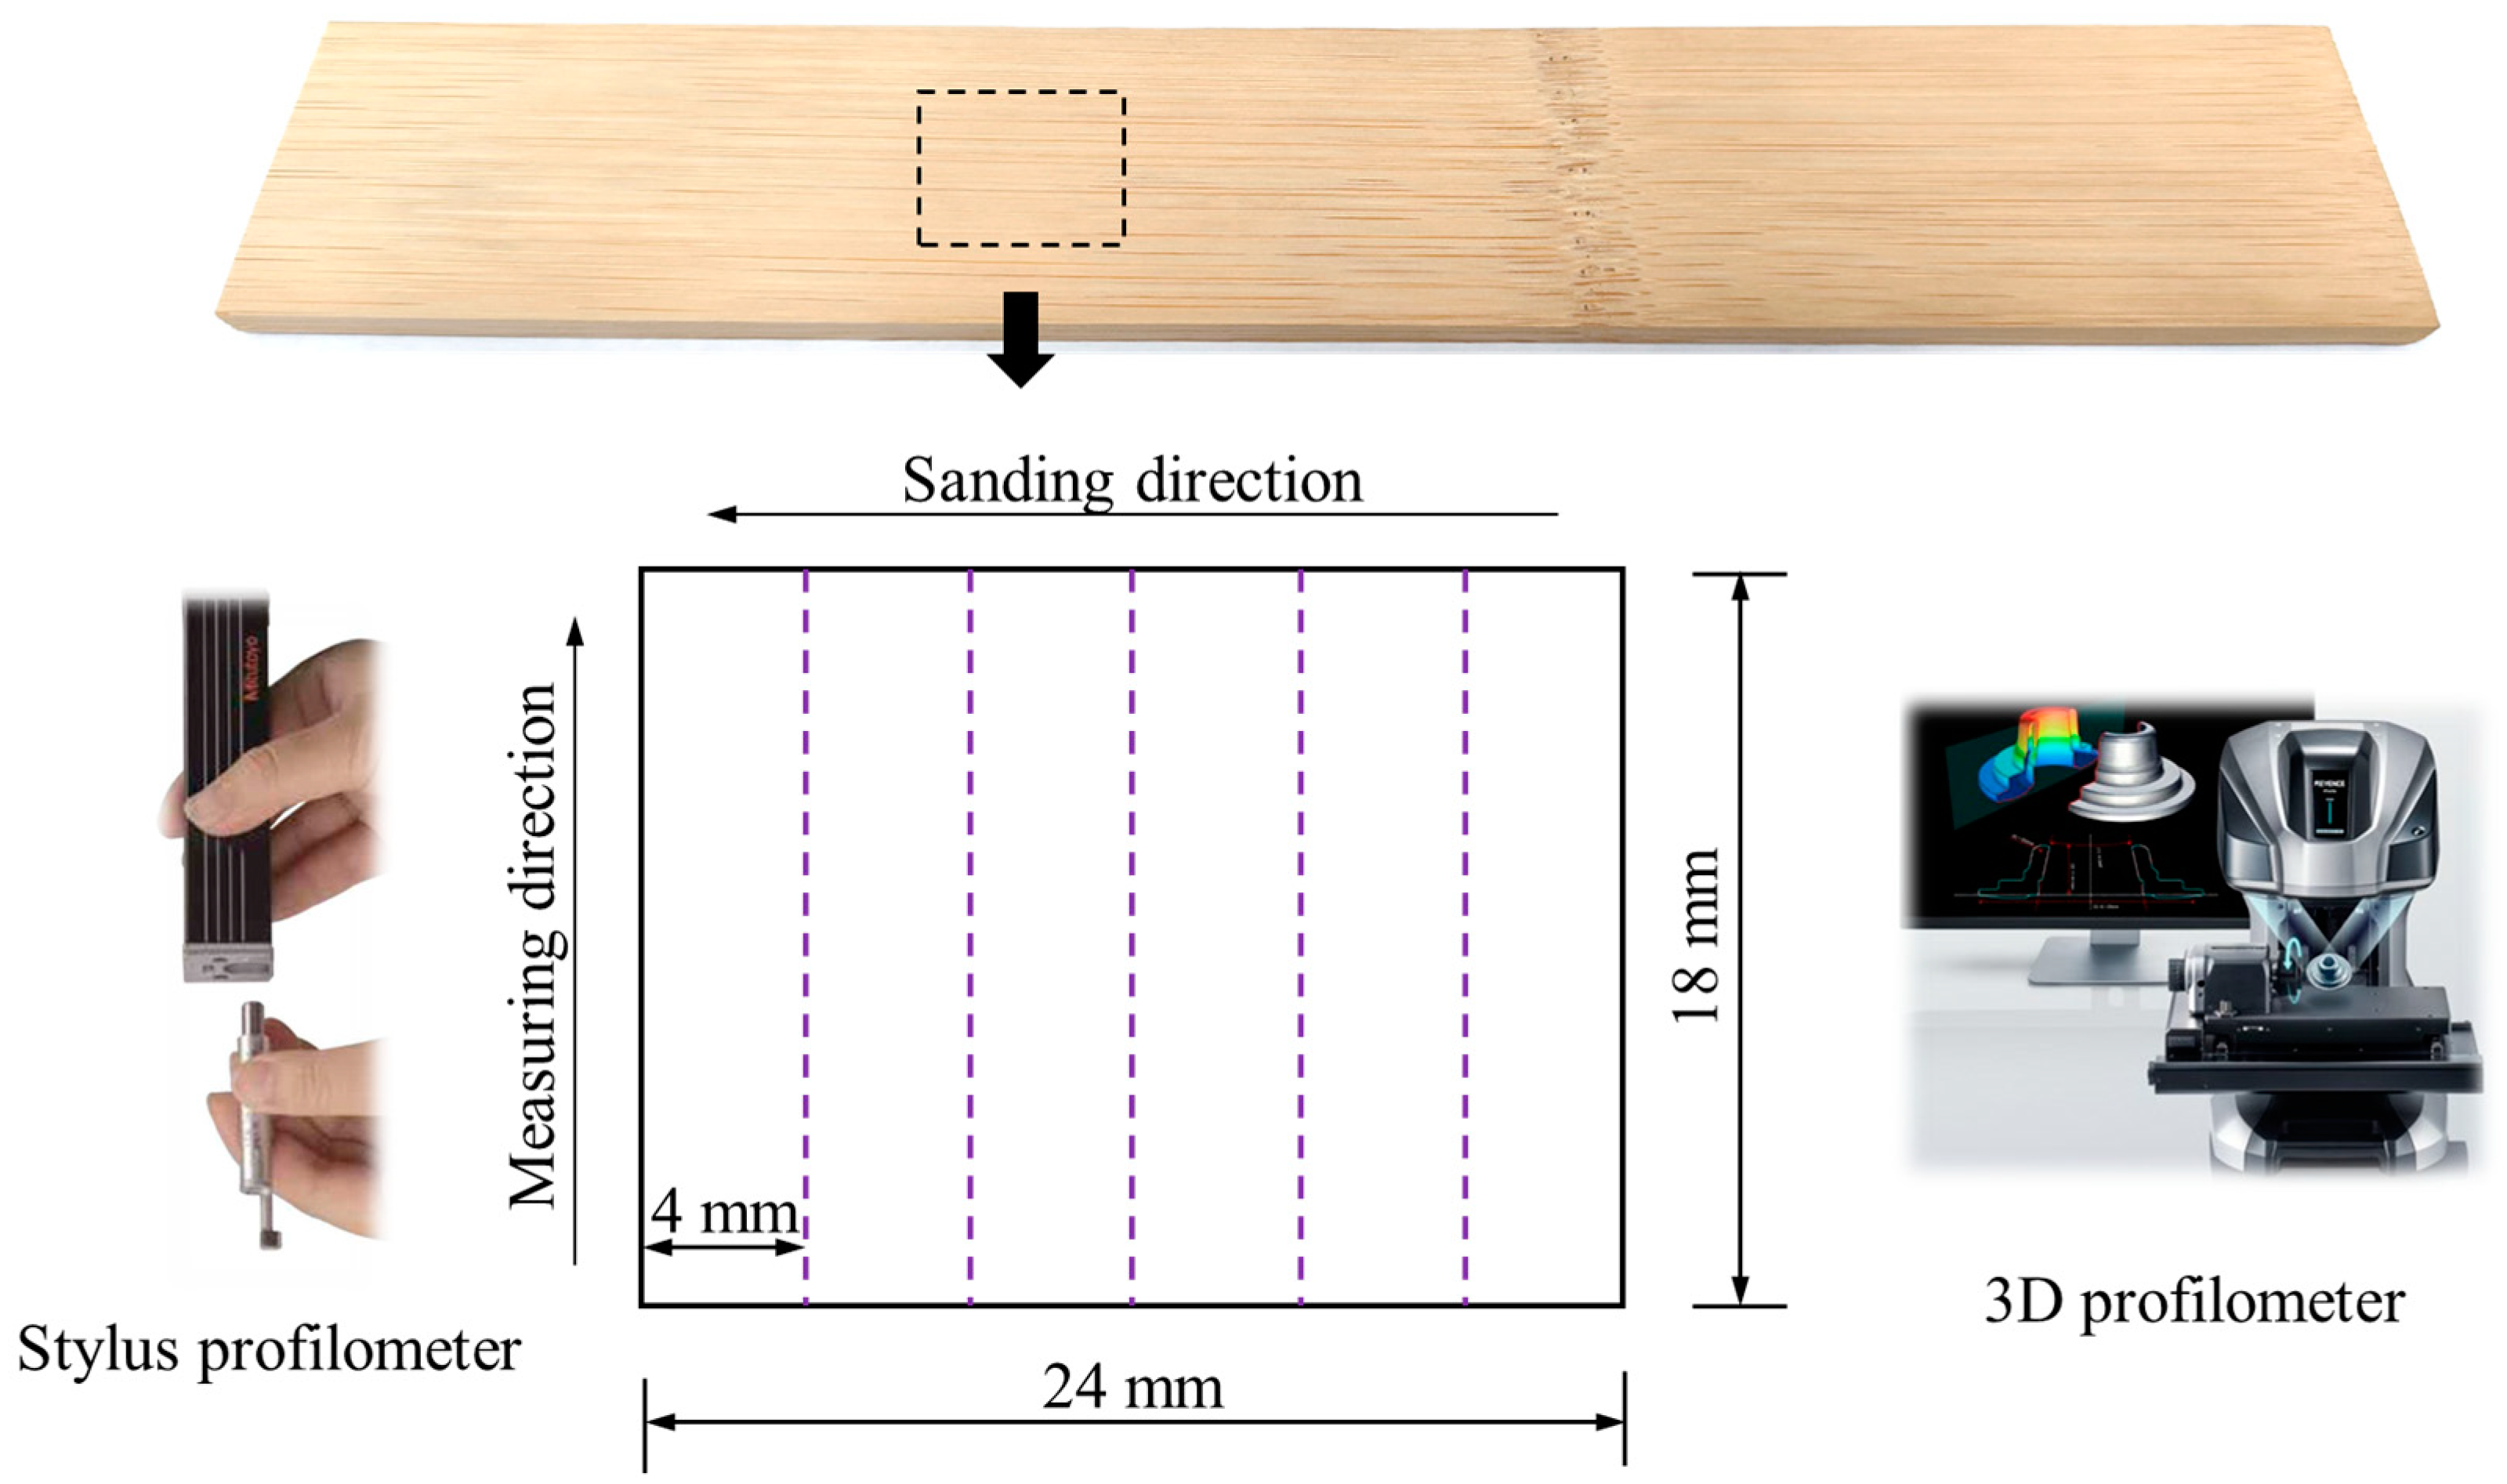
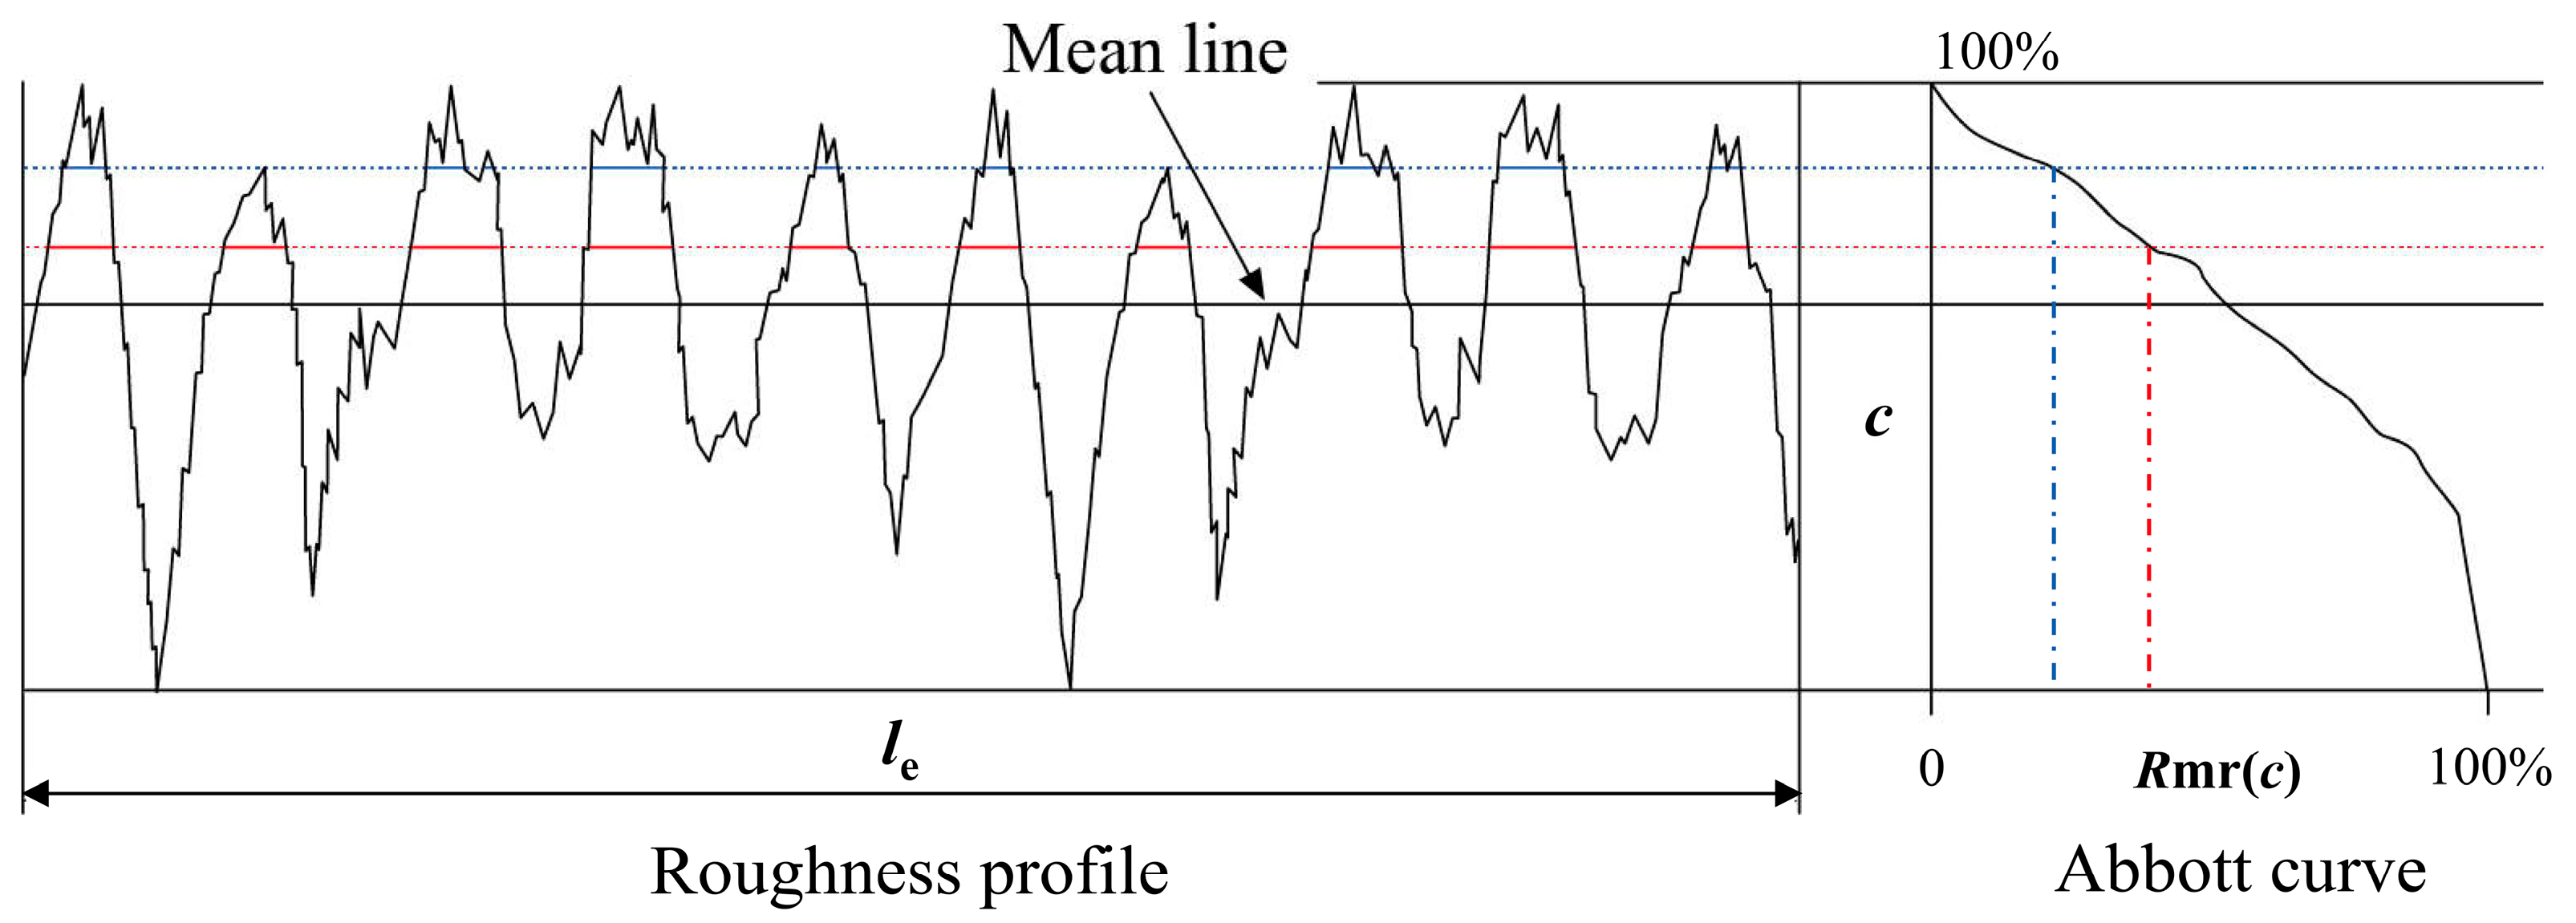
2.3. Surface Roughness Assessment

A stylus profilometer (SJ 310, Mitutoyo, Kawasaki, Japan) was used to measure linear (2D) surface roughness as a contact method. Additionally, a 3D profilometer (VR 6000, Keyence, Osaka, Japan) was applied as an optical non-contact method without destruction. The scanning area was 24 mm × 18 mm under a magnification of 12 times for the 3D profilometer. In the attached analyzing software, 2D surface roughness can be obtained through setting the stylus mode. Five measuring traces in the software were averagely selected along the sanding direction (see Figure 2). Approximately the same five traces were physically measured by the stylus profilometer. For both methods, the measuring direction was perpendicular to the sanding direction, i.e., against bamboo grain. Details of the measuring equipment in this study are shown in Table 1 and Table 2.
According to ISO 21920-3:2021 (Geometrical product specifications (GPS)—Surface texture: Profile—Part 3: Specification operators), the cut-off λ c was set as 2.5 mm for 2 μ m < Ra < 10 μ m, and as 8 mm for Ra > 10 μ m, and the corresponding evaluation length le was determined as 12.5 mm and 16 mm. According to ISO 21920-2:2021 (Geometrical product specifications (GPS)—Surface texture: Profile—Part 2: Terms, definitions and surface texture parameters), Rz represents the sum of the peak height Rp and the valley bottom depth Rv of a profile element, i.e., the average of the absolute heights of the five highest peaks and the depths of the five deepest valleys over the evaluation length. Ra is the arithmetic average of the absolute deviations of the surface profile from the mean line over the evaluation length. Rq is the root mean square average of the surface profile heights relative to the mean line. Rsk is the measure of the asymmetry of the surface profile about the mean line. Rku measures the kurtosis of the surface profile relative to a Gaussian distribution. The above-mentioned 2D parameters were selected to evaluate surface roughness, and the calculation formulas were described as follows:
R z = R p + R v
R a = 1 l e 0 l e z ( x ) d x
R q = 1 l e 0 l e z 2 ( x ) d x
R sk = 1 R q 3 1 l e 0 l e z 3 ( x ) d x
R ku = 1 R q 4 1 l e 0 l e z 4 ( x ) d x
where z(x) means the height of the profile relative to the mean line at position x and le is the total evaluation length.
In surface roughness assessment, the Abbott curve and Rmr(c) are essential for functional characterization, particularly in engineering and tribology [27]. They help quantify load-bearing capacity (peaks) and lubrication efficiency (valleys), offering insights into wear, friction, and surface design optimization. For example, surfaces with moderate Rmr(c) and balanced valleys can ensure optimal functionality for applications requiring both durability and lubrication. Incorporating Abbott curves in surface analysis enables the comparison of surface finishes, compliance with standards like ISO 21920-2:2021, and improved understanding of how surface roughness influences practical performance.
The Abbott curve, or material ratio curve, is a cumulative distribution graph that represents the proportion of a surface’s profile (or area) lying at or below a specific depth [28]. This curve (see Figure 3), plotted with material ratio Rmr(c) on the X-axis and depth (c) or the percentage of c (%) on the Y-axis, characterizes the surface’s bearing properties, wear resistance, and lubrication potential. It is derived by progressively slicing the surface profile from peaks to valleys and calculating the material ratio at each depth. Rmr(c) quantifies the percentage of the profile length or surface area above a given depth (c), which can be expressed as:
R mr ( c ) = l m ( c ) l e × 100 %
where lm(c) is the total material length at depth (c) and le is the total evaluation length. High Rmr(c) at shallow depths indicates prominent peaks, while lower values with deep valleys suggest better lubricant retention and wear resistance.

2.4. Fast Fourier Transform (FFT) Evaluation

The Fast Fourier Transform (FFT) is a powerful analytical tool used to convert spatial domain roughness profiles into the frequency domain, enabling the identification and quantification of periodic and random surface characteristics. In surface roughness analysis, the FFT method provides insight into the spatial frequency components of the measured profile, facilitating a deeper understanding of the surface’s textural features created during manufacturing processes [22].
The roughness profile, z(x), is typically recorded as a function of spatial position x. Applying FFT to this profile decomposes it into a sum of sinusoidal components, each represented by a specific frequency f and amplitude A(f). The mathematical representation of the FFT is given as:
z ( f ) = z ( x ) e 2 π i f x d x
where z(f) is the complex frequency spectrum, z(x) is the spatial signal, and i is the imaginary unit.
By analyzing the FFT spectrum, dominant frequencies and amplitudes can be identified, indicating periodic patterns such as machining marks or irregularities [29]. Furthermore, low-frequency components highlight macro-texture, while high-frequency components reveal micro-texture. This frequency-domain analysis aids in quantifying and optimizing surface quality based on roughness characteristics.

2.5. Power Spectrum Density (PSD) Evaluation

The Power Spectrum Density (PSD) method is a powerful analytical tool for characterizing surface roughness, particularly when examining the frequency content of surface profiles. Unlike conventional single-parameter roughness descriptors such as Ra or Rq, the PSD method provides a comprehensive frequency-domain representation of surface features, enabling the assessment of periodicity, wavelength distributions, and energy contributions of surface irregularities [30].
The PSD is derived from the Fourier Transform (FT) of a surface profile, which decomposes the spatial variation of the profile into its frequency components. By examining the energy distribution over spatial frequencies, the PSD method links surface roughness features to their corresponding spatial wavelengths, providing a robust means of evaluating surface morphology. The surface profile z(x) in the spatial domain can be represented as a Fourier series:
z ( x ) = Z ( f ) e 2 π i f x d f
Here, Z(f) is the Fourier transform of z(x), and f represents the spatial frequency (inverse of the wavelength).
The PSD is then calculated as:
P S D ( f ) = Z ( f ) 2 l e
Here, le is the evaluation length. This equation represents the distribution of power (or energy) of the surface profile as a function of spatial frequency.
According to the above basic theory, steps for PSD calculation of roughness profile are as follows:
(1)
Surface Profile Acquisition: Obtain a surface profile z(x) using a stylus profilometer or equivalent measurement device;
(2)
Fourier Transform: Perform a Fourier transform to convert the spatial data into the frequency domain;
(3)
PSD Calculation: Square the magnitude of the Fourier coefficients to compute the PSD;
(4)
Normalization: Normalize the PSD to the profile length (le) to ensure comparability across profiles of different lengths.
In surface roughness analysis, PSD serves as a valuable tool for identifying wavelengths, with peaks in the PSD curve revealing dominant surface wavelengths that provide insights into the periodicity introduced by manufacturing processes like sanding [31]. Additionally, PSD enables multi-scale analysis by capturing roughness features across a broad range of scales, from micro to macro roughness. By comparing the PSDs of surfaces treated with different sanding parameters, it becomes possible to quantitatively assess the influence of factors such as abrasive grit size, speed, and other variables, thus facilitating a more detailed evaluation of the manufacturing process.

2.6. Random Forest (RF) Evaluation

The Random Forest (RF) method is a powerful and versatile ensemble learning technique commonly used in regression and classification tasks. It builds multiple decision trees during training and combines their predictions for better performance, accuracy, and robustness. By utilizing random sampling of both data (via bootstrapping) and features (at each split), RF reduces overfitting and enhances generalizability, making it well-suited for handling complex, non-linear relationships among variables [32].
In this study, RF was employed to evaluate the influence of mesh number (grit size) and measuring method on surface roughness parameters (Rz, Ra, Rq, Rsk, and Rku) of bamboo surfaces after abrasive belt sanding. The methodology aimed to determine the relative importance of these factors while modeling their effects on roughness metrics.
Key parameter settings and techniques used for the RF model include:
(1)
Number of Trees (n estimators): A total of 100 decision trees were used, balancing computational efficiency and model stability. A higher number of trees can improve performance but with diminishing returns on accuracy;
(2)
Feature Sampling (max features): At each split, a square root of the total number of features was sampled to increase diversity among the trees and reduce the likelihood of overfitting;
(3)
Tree Depth (max depth): Tree depth was set to 10 based on preliminary testing to ensure each tree captures significant patterns without introducing excessive complexity;
(4)
Minimum Samples for Splitting (min samples split): A minimum of 5 samples was required at each split to prevent overfitting on small data subsets and ensure splits are meaningful;
(5)
Categorical Predictors: Both grit size and measuring method were treated as categorical predictors, ensuring the model appropriately captures their discrete nature;
(6)
Out-of-Bag (OOB) Sampling: The OOB error estimate was used to evaluate the model’s generalization accuracy without relying on separate validation data. OOB sampling also enabled feature importance computation;
(7)
Cross-Validation: To validate the model, 5-fold cross-validation was employed, providing robust error estimation and preventing overfitting;
(8)
Feature Importance Metrics: The OOB permuted predictor importance metric was used to quantify the relative influence of mesh number and measuring method on each roughness parameter.
These settings allowed for accurate and interpretable analysis of the relationships between grit size, measuring method, and surface roughness. The results highlighted the dominant factors affecting bamboo surface quality and provided insight into their contributions to roughness variability.

3. Results and Discussion

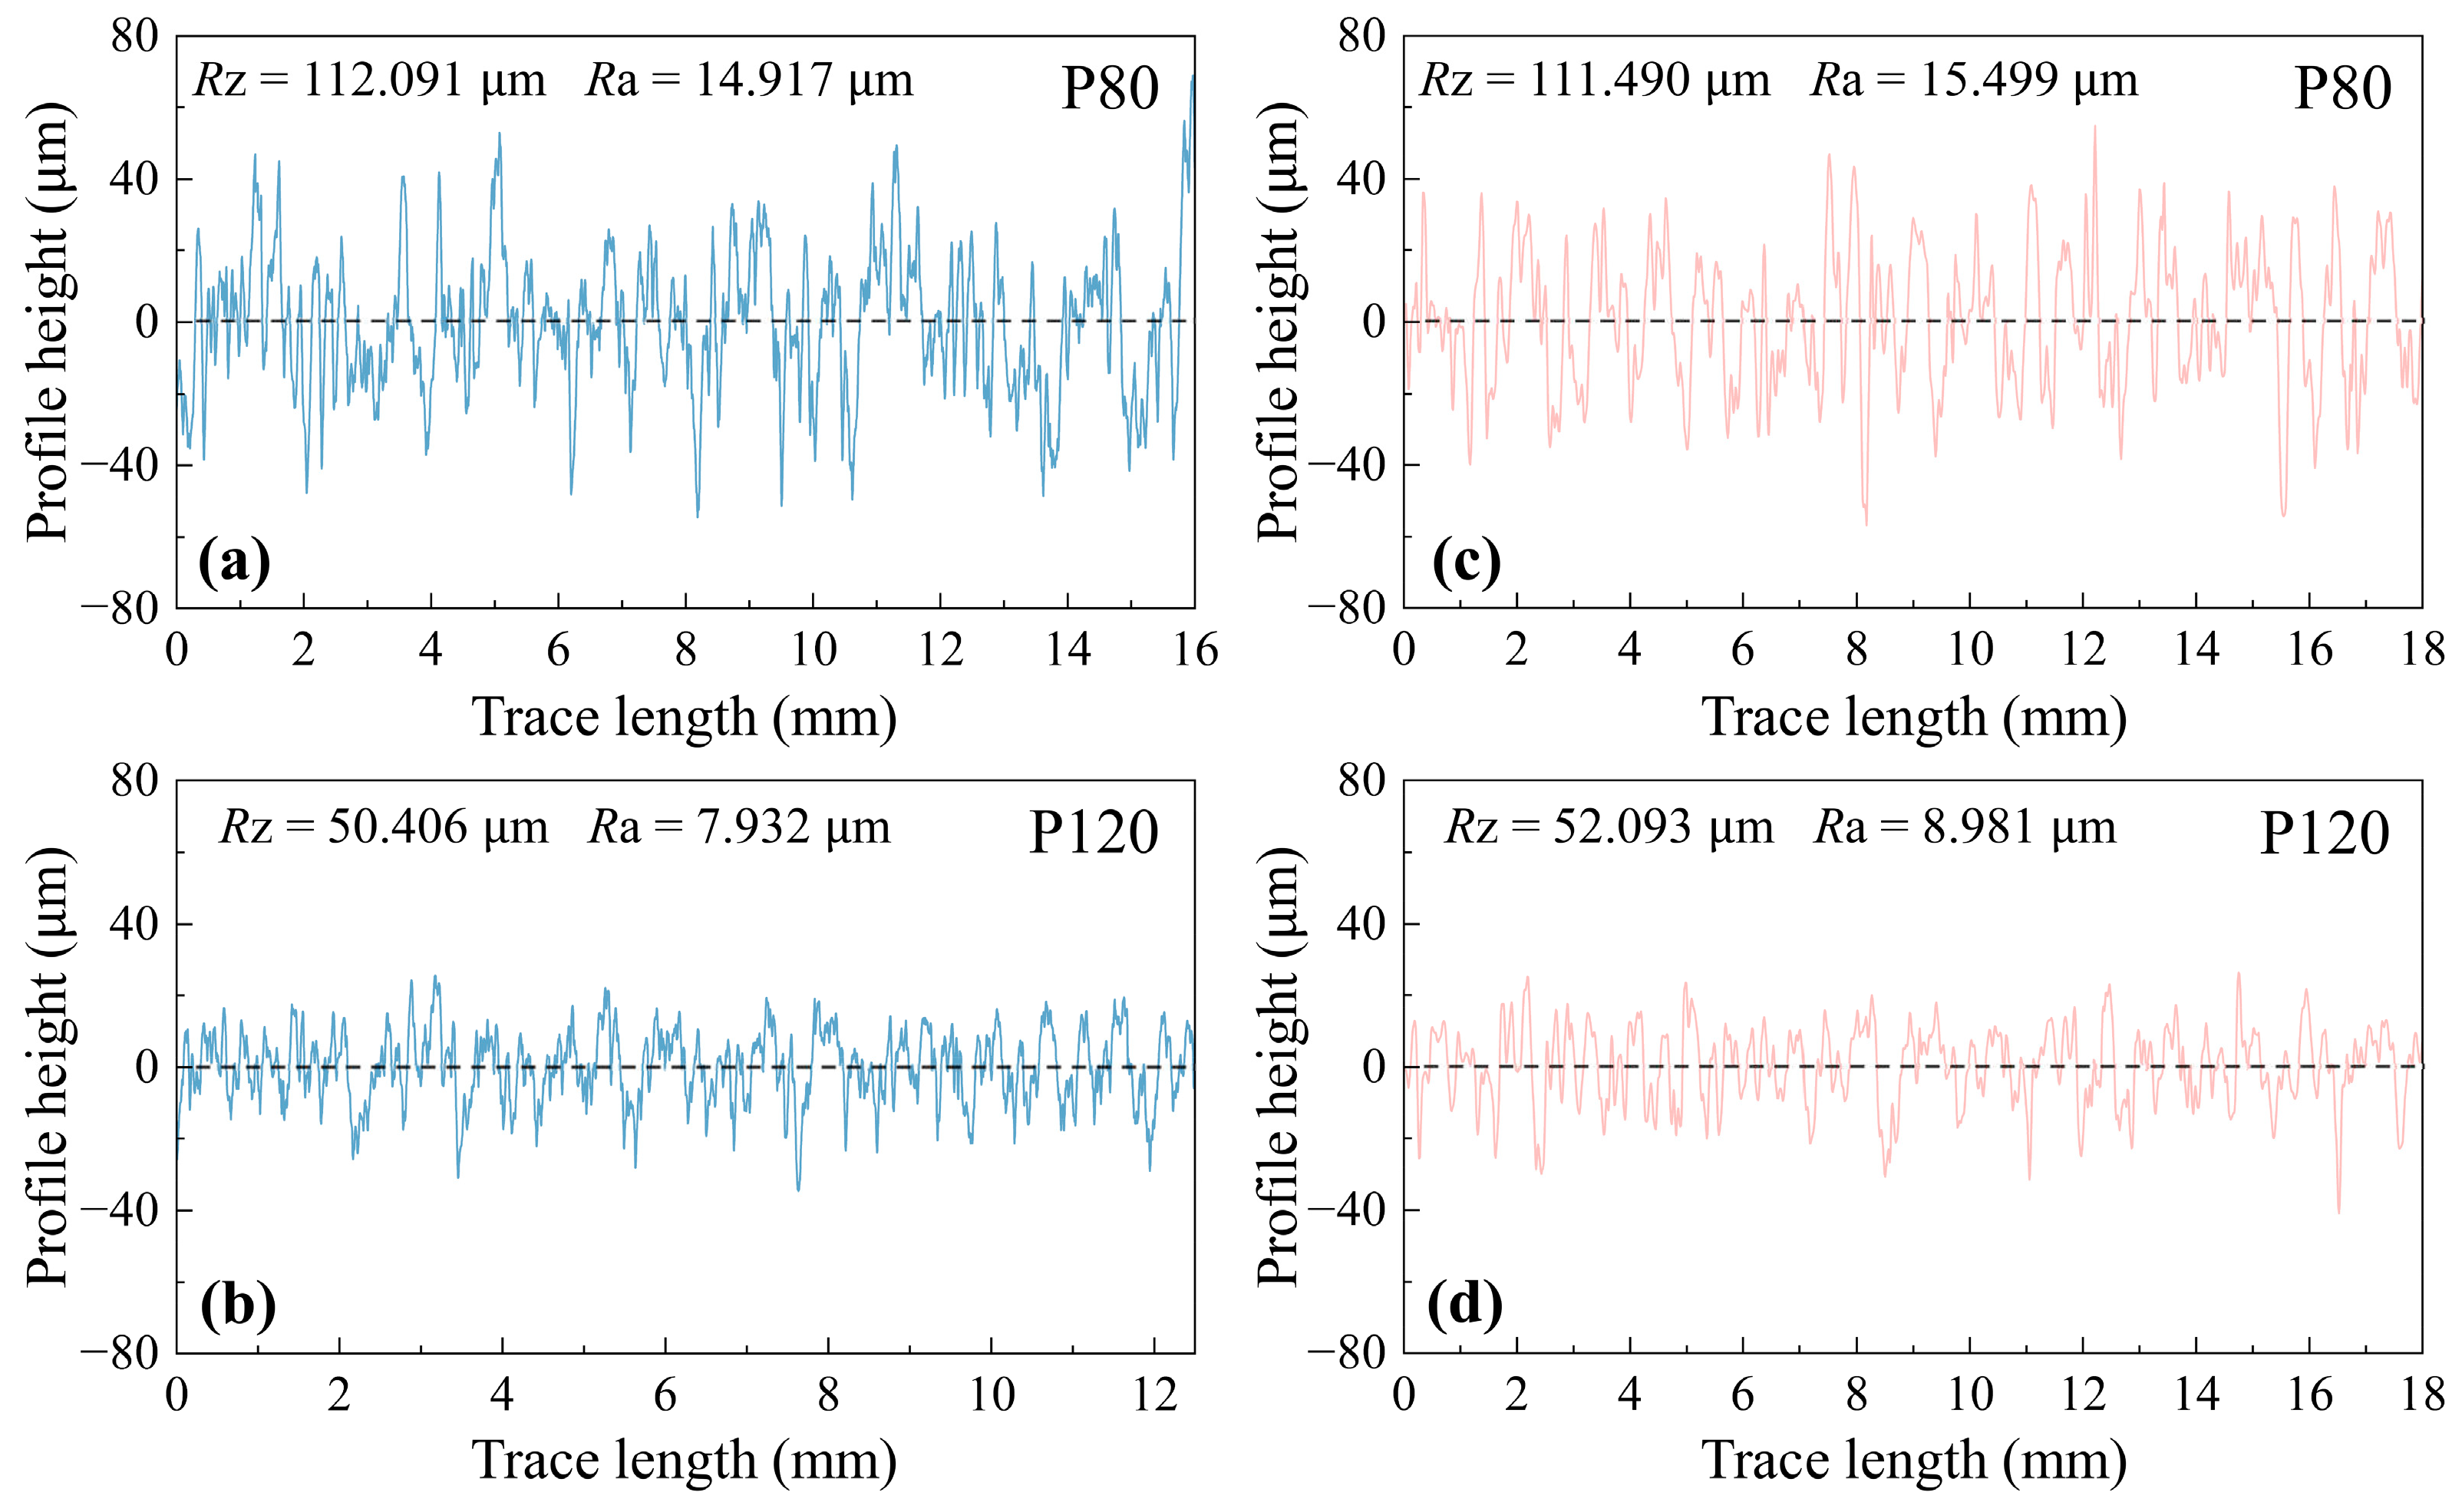
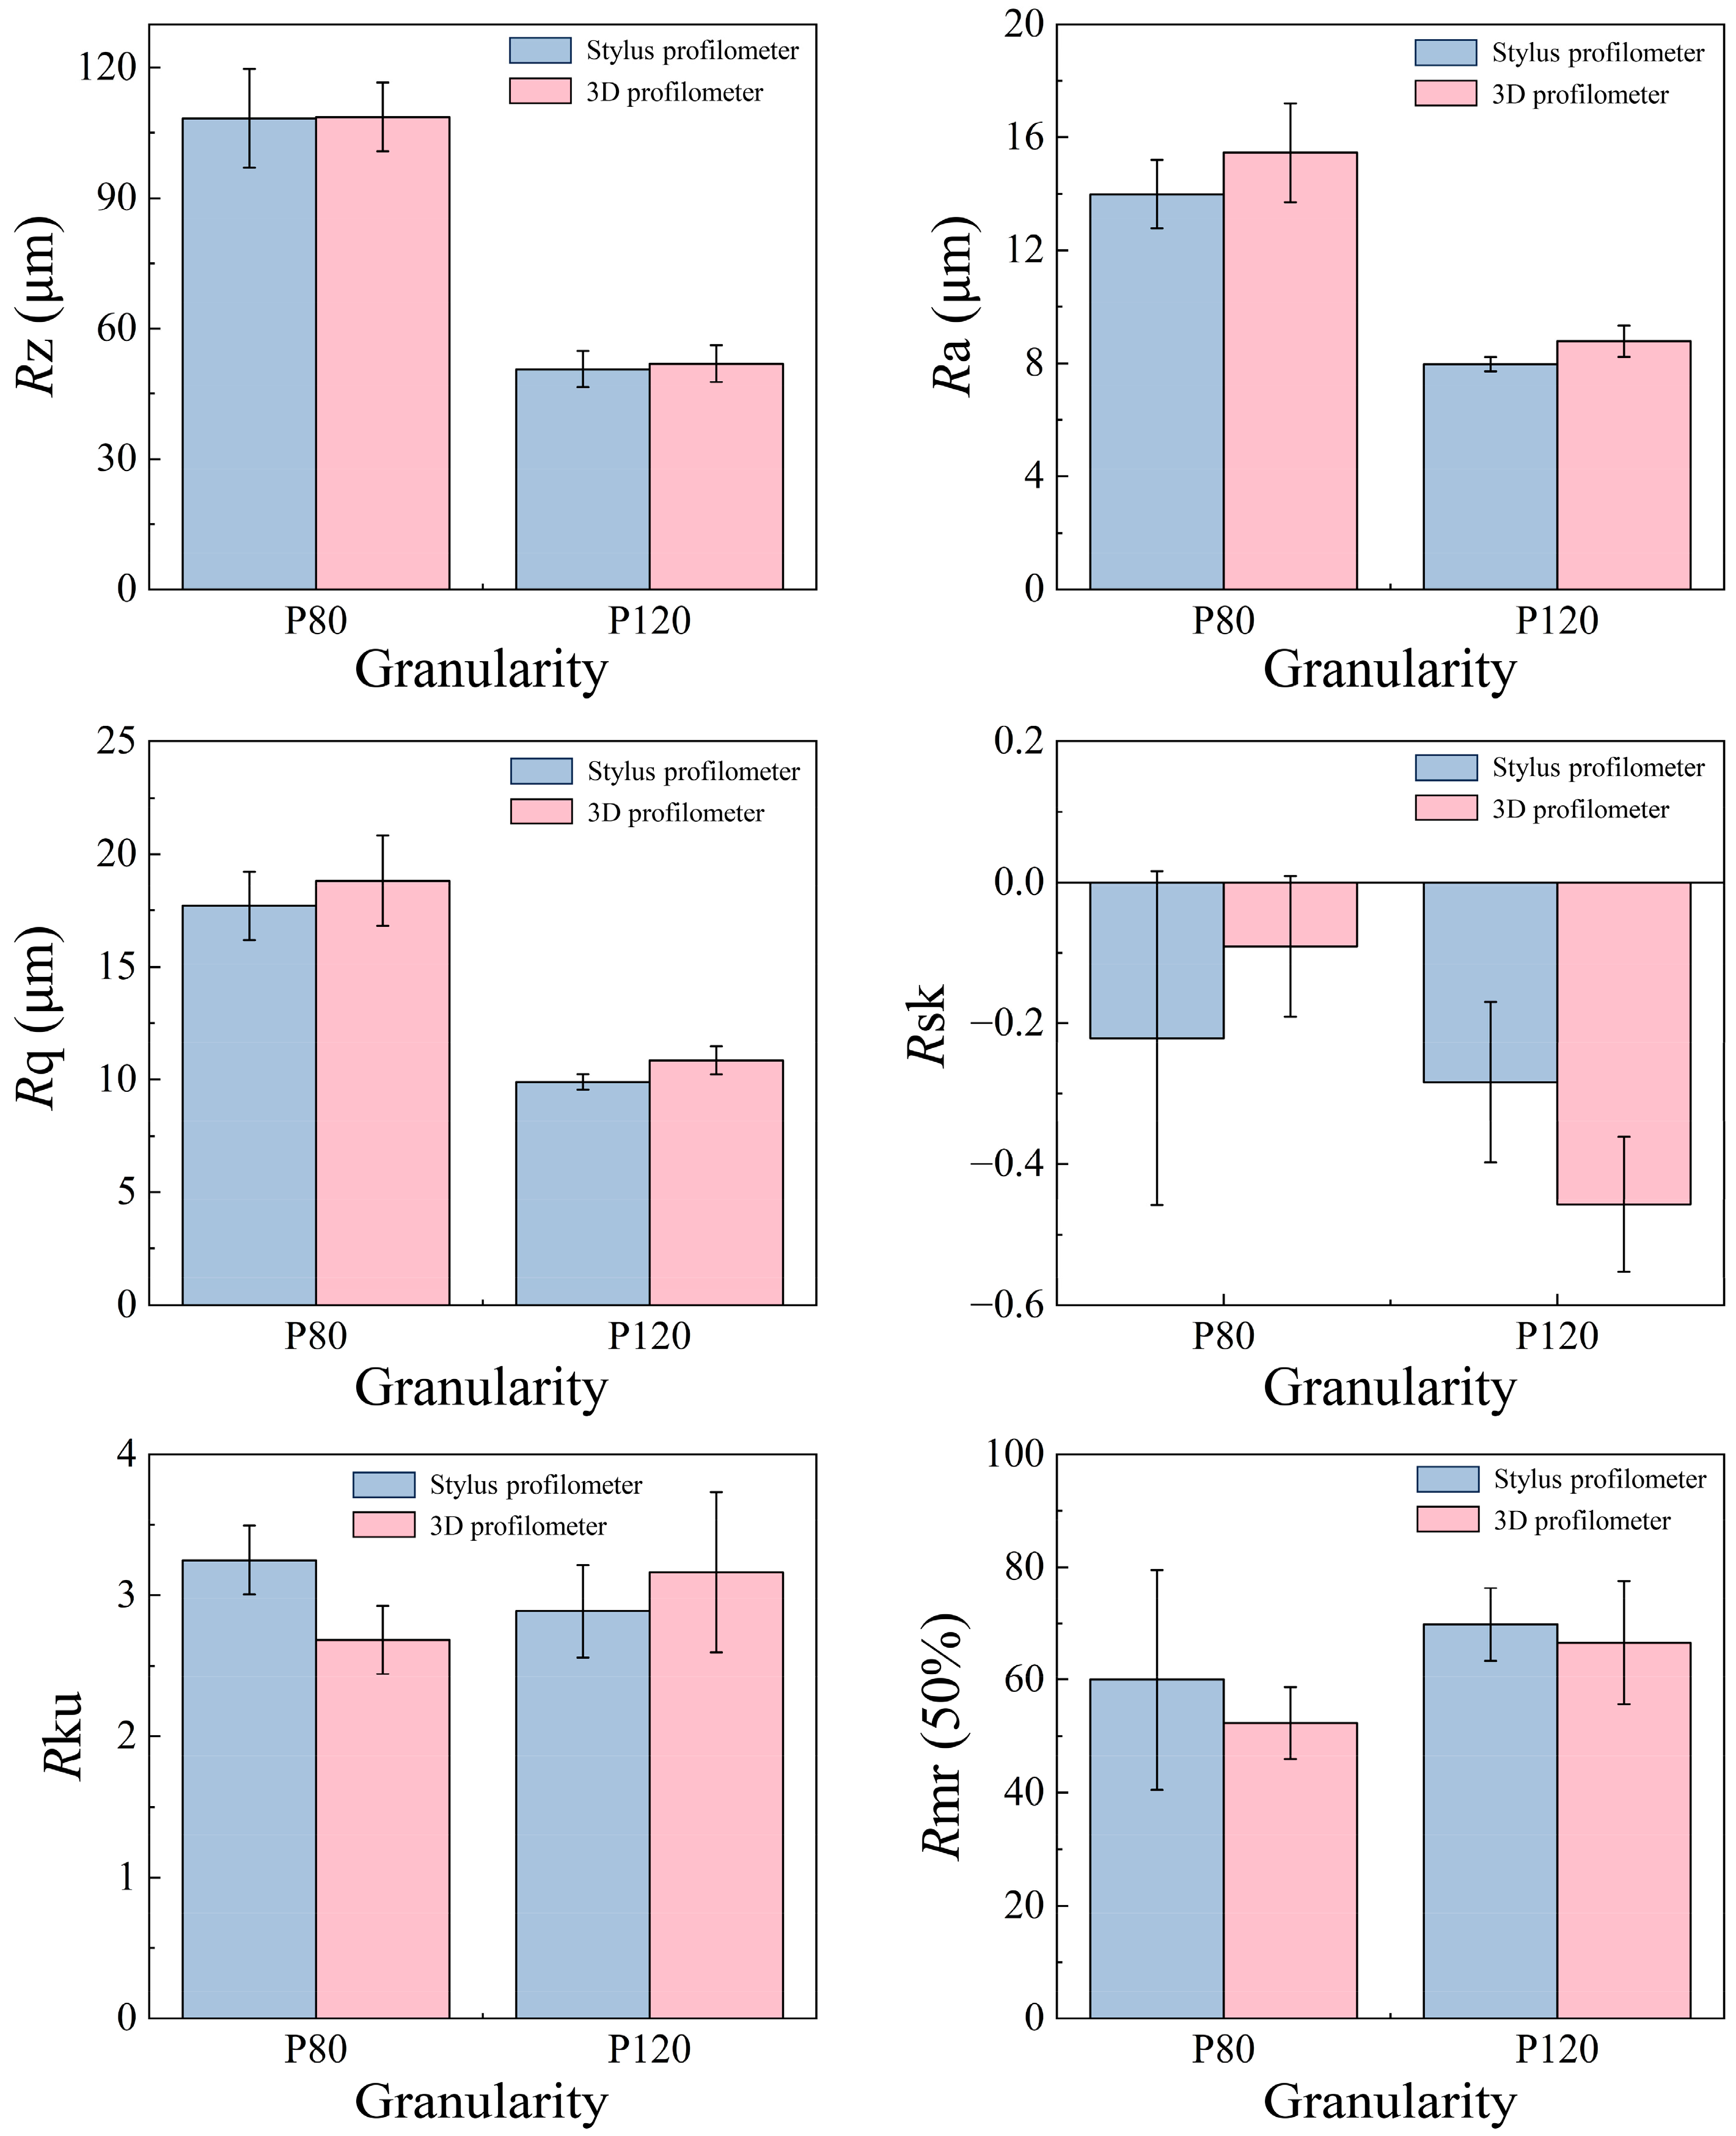
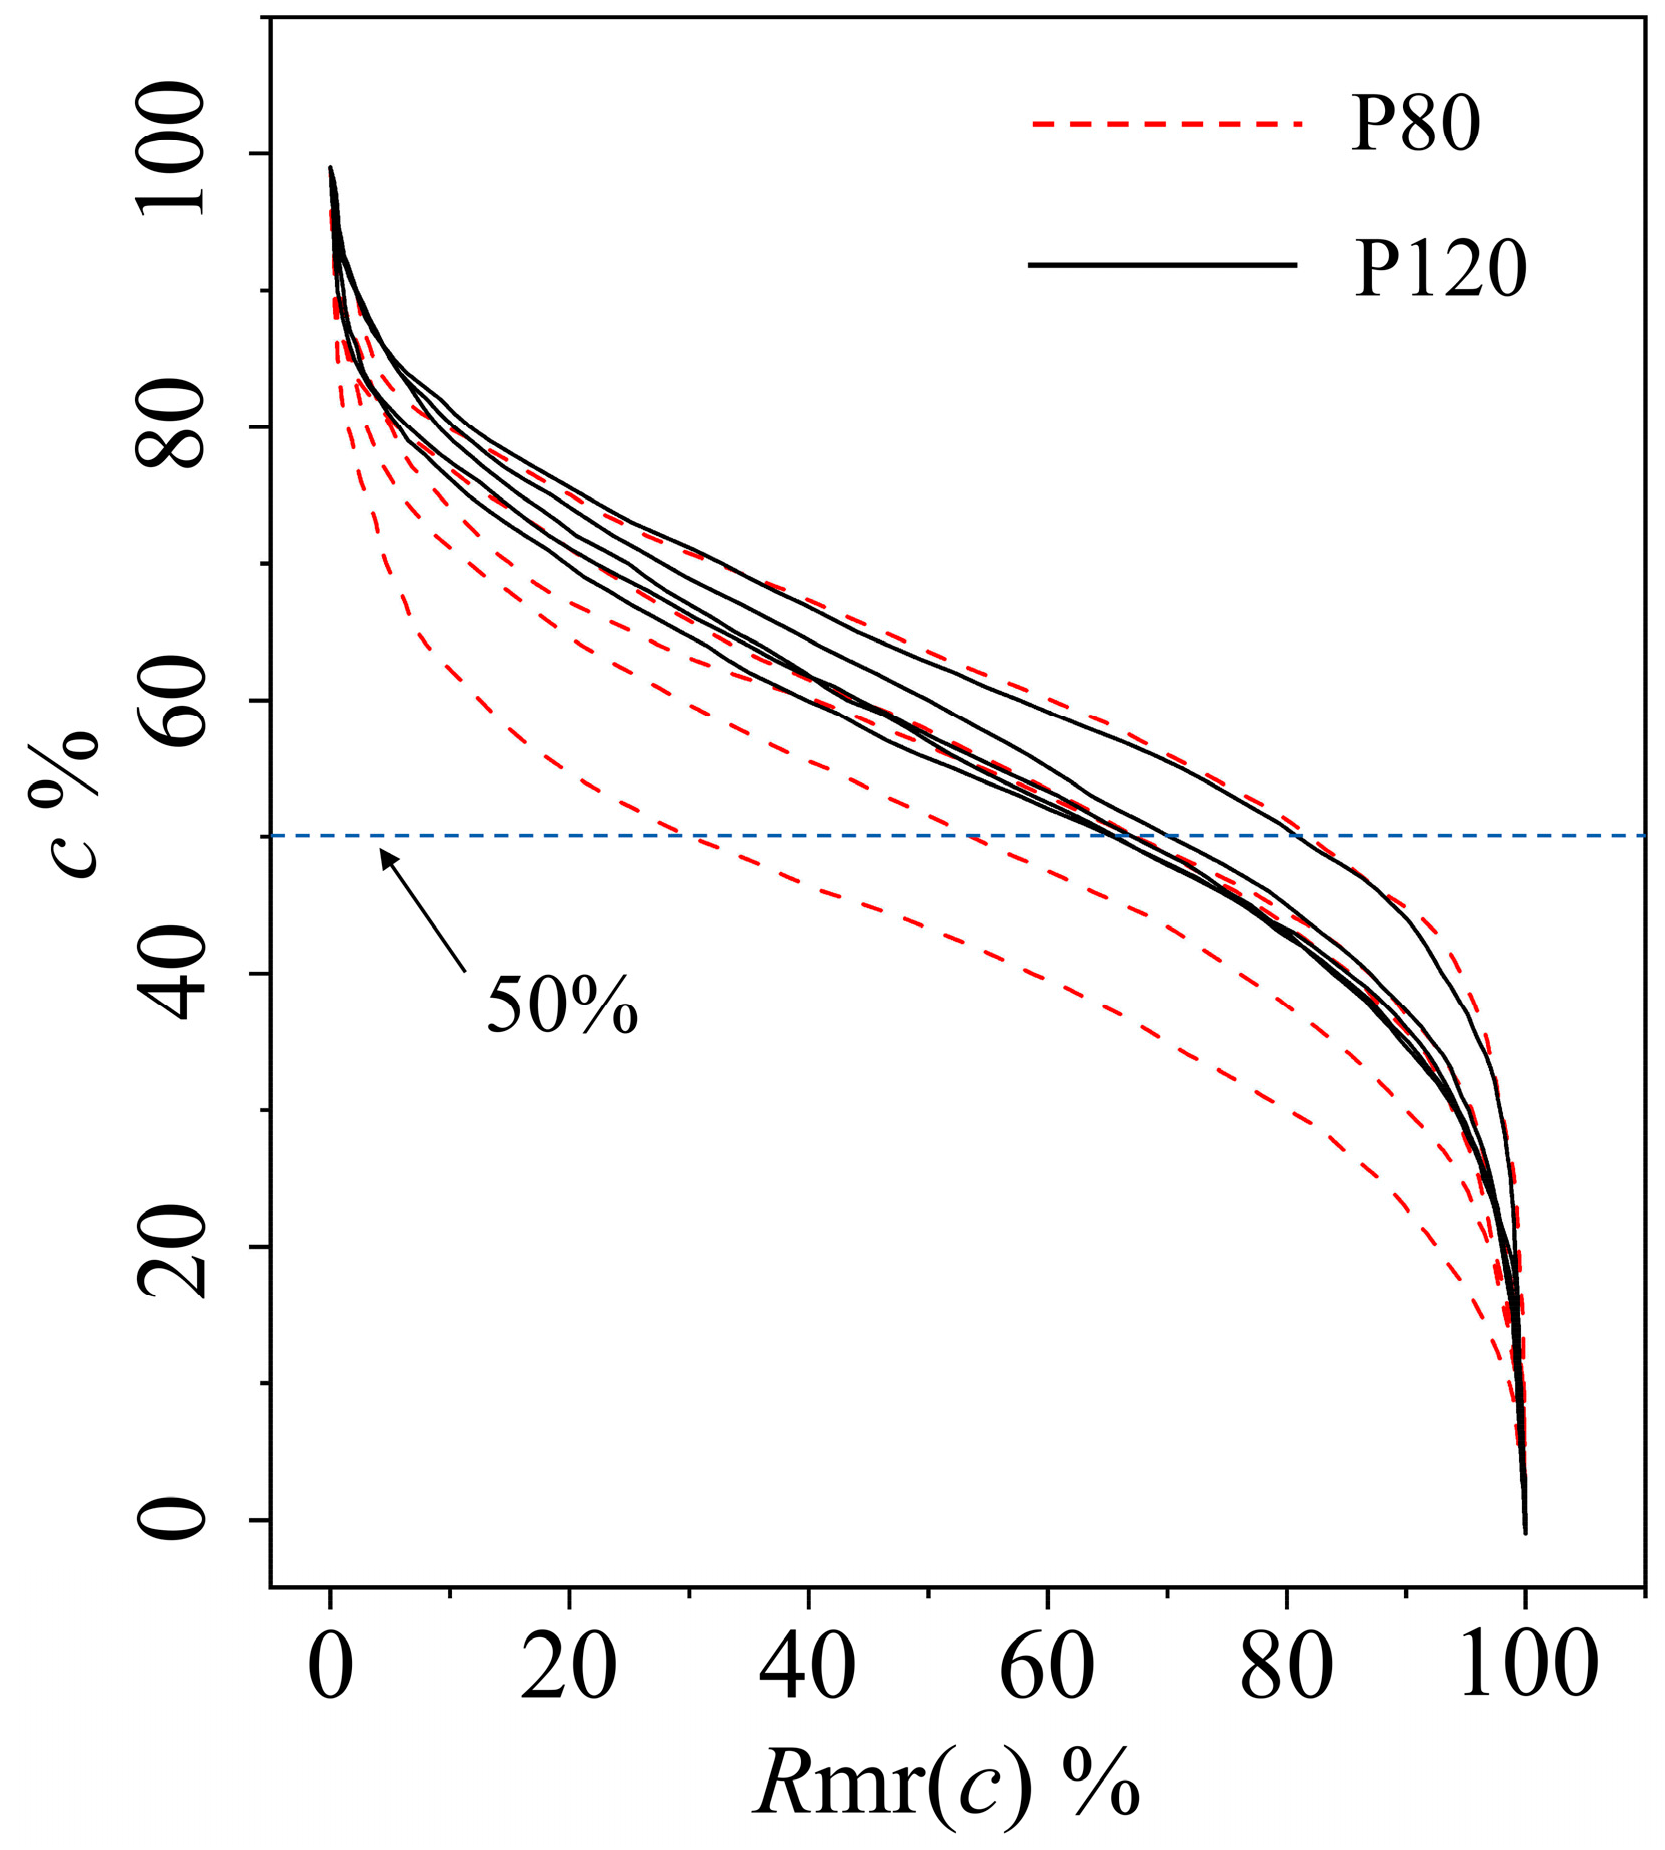
3.1. Comparison of the Tested Surface Roughness

Figure 4 demonstrates the surface roughness profiles of bamboo prepared using different grit sizes (P80 and P120) and measured through stylus and 3D profilometers. Bamboo, as a biological material, exhibits anisotropic and heterogeneous structural features, such as vascular bundles and parenchyma cells, which contribute to its intrinsic variability in surface texture. The use of P80 grit, characterized by coarser abrasive particles, leads to more aggressive material removal, creating pronounced peaks and valleys in the surface profile. This results in higher surface roughness values such as Rz and Ra, as shown in Figure 4a,c. In contrast, P120 grit, with finer abrasive particles, produces smoother surfaces with reduced irregularities, as evident in the lower roughness values seen in Figure 4b,d. These observations highlight the significant influence of grit size on the roughness characteristics of bamboo, aligning with established sanding principles that finer grits create more uniform surfaces [33].
The choice of measurement methods also significantly affects the observed surface roughness profiles. Stylus profilometers, as shown in Figure 4a,b, provide 2D line-based measurements that emphasize localized peaks and valleys, often resulting in higher variability in roughness parameters. On the other hand, 3D profilometers, depicted in Figure 4c,d, offer a less detailed assessment of surface roughness by capturing fewer data across a linear measurement trace. This approach reduces the influence of localized surface anomalies, probably providing a more accurate representation of the bamboo’s texture. The interplay between the biological structure of bamboo, the grit size used during preparation, and the measurement technique underscores the importance of optimizing both finishing and evaluation processes to achieve consistent and high-quality bamboo surface finishes.
Bamboo, a naturally anisotropic material with vascular bundles and parenchyma cells, inherently exhibits variability in its surface properties. These features are further amplified or mitigated by the sanding process [34]. The surface roughness (see Figure 5) of bamboo prepared using different grit sizes highlights the effect of abrasive particle coarseness on surface texture. The Rz values, representing the maximum height of surface roughness, reveal distinct patterns between P80 and P120 grit. For P80 grit, the Rz values from the stylus and 3D methods are comparable, but the 3D method exhibits smaller standard deviation, suggesting it captures surface features more consistently despite P80’s inherent variability. Since bamboo has cell structure and anatomical cavities, the biological valleys created by P80 grit could have more influence on the stylus method. For P120 grit, Rz values are approximately half of those for P80, reflecting the finer grit’s smoother finish. Interestingly, the 3D method produces slightly higher Rz values than the stylus for P120 grit, with similar standard deviations, indicating both methods effectively characterize the more uniform surface. Standard deviations for Rz obtained from the two methods are larger for P80 grit, indicating greater variability in the surface profile, likely caused by bamboo’s inherent structural heterogeneity like porosity [7].
The Ra and Rq parameters, representing average roughness and root mean square roughness, respectively, follow consistent trends in surface characterization for both P80 and P120 grit abrasions [35]. For P120 grit, Ra and Rq values are nearly half of those for P80 grit, indicating the smoother surface created by finer abrasives. The standard deviations for P80 grit are significantly larger than those for P120 grit, reflecting greater variability in surface roughness for coarser abrasions. Across the two grit meshes, Ra and Rq values measured using the 3D method are consistently higher than those obtained with the stylus method, likely due to the 3D method capturing more detailed surface variations. Additionally, the standard deviations for Ra and Rq are statistically larger for the 3D method compared to the stylus method, suggesting greater sensitivity to surface fluctuations in 3D measurements. These observations underline the detailed yet variable nature of the 3D method in roughness evaluation.
The Rsk and Rku results illustrate notable differences between the stylus and 3D measurement methods in assessing surface texture for P80 and P120 grit workpieces. For P80 grit, the stylus method consistently yields greater roughness magnitudes for both Rsk and Rku, indicating a more prominent identification of surface peaks and valleys compared to the 3D method. Conversely, for P120 grit, the stylus method results in smaller roughness magnitudes than the 3D method, suggesting differences in sensitivity or detection range between the two methods at finer scales. The negative Rsk values for both grit sizes indicate a surface texture with predominately valleys over peaks, yet this effect is more pronounced in P120 grit for both measurement techniques. While the 3D method shows an increased Rku for P120 grit, indicating sharper peak and valley features compared to P80, and the stylus method displays the opposite trend. This suggests potential variances in how each method resolves surface features influenced by the measurement resolution, especially at finer grit levels.
In the analysis of Rmr (50%) values for surface roughness, both the stylus and 3D profilometers demonstrate clear distinctions based on grit size. For both methods, P120 grit yields higher Rmr (50%) values than P80 grit, suggesting a smoother surface with less pronounced peaks and valleys. The higher Rmr (50%) values for P120 grit enhanced load-bearing capacity, making it more suitable for applications requiring precise finishes. Specifically, the 3D method shows Rmr (50%) values of 52.328% for P80 and 66.599% for P120, while the stylus method reports slightly higher values of 59.987% and 69.849%, respectively. These results emphasize that although both tools are calibrated for linear roughness assessment, the stylus method tends to indicate a greater material ratio. This discrepancy may arise from the stylus profilometer’s higher resolution, enabling it to detect finer surface details that contribute to a perceived increase in the material ratio. Thus, while both methods provide reliable comparisons between different grit sizes, the resolution differences are pivotal in interpreting the Rmr (50%) values accurately.
The Abbott curve (see Figure 6), or bearing area curve, graphically represents the cumulative distribution of surface heights from stylus profilometer data. For P80 grit, the greater separation among the five curves indicates variability in surface texture, with larger and more uneven features due to coarser abrasion. This suggests less consistency in material removal, leading to distinctive peak and valley distributions. In contrast, the closer clustering of curves for P120 grit suggests a more uniform finish, as finer grit leads to smoother, more consistent surface profiles. The consistency in P120 grit reduces peak prominence, indicating a more even abrasive action. This analysis helps in understanding the surface finish quality, with P120 grit generally providing smoother and more predictable topography than P80 grit.
The t-test results (see Table 3) provide important insights into the effects of the measurement method on various roughness parameters for surfaces created by P80 and P120 grit abrasives. For Rz and Rmr (50%), the statistical analysis indicates no significant differences between the stylus and 3D methods, even at a 90% confidence level, suggesting that both methods provide comparable results for these parameters regardless of grit size. In contrast, for Ra, Rq, and Rsk under P120 grit conditions, the measurement method is statistically significant at the 95% confidence level. This implies that the choice of method influences the results for these parameters, particularly when measuring smoother surfaces (like P120 grit). The increased sensitivity of the 3D method to finer surface variations might accounts for these differences. For Rku under P80 grit conditions, the measurement method is also significant at the 95% confidence level, highlighting a method-dependent effect on surface kurtosis when evaluating coarser textures. This could reflect differences in how each method captures extreme peaks or valleys on rougher surfaces.
The resolution differences between the stylus and 3D methods, along with the disparities in data collection density, provide important context for interpreting the t-test results. The stylus method, with its superior Z-axis resolution (6~25.6 nm compared to the 1.0 μm of the 3D method), is better equipped to capture fine vertical surface details, which can be critical for roughness parameters sensitive to small-scale variations, such as Ra, Rq, and Rsk. This explains why these parameters show significant differences between the methods under P120 grit, where finer surface textures dominate, and higher resolution becomes more impactful. Additionally, the X-axis resolution of the stylus method (1.5 μm) is also much finer than the 3D method (11.719 μm). Combined with the significantly higher number of data points collected, the stylus method provides a more detailed and comprehensive representation of the surface. This high data density likely enhances its sensitivity to subtle surface features, influencing parameters like Ra and Rq, which rely on an accurate representation of average deviations. For P80 grit, the coarser texture diminishes the influence of high-resolution measurements. However, Rku, which is sensitive to extreme peaks and valleys, shows significant differences due to how each method averages or under-samples these extreme features.

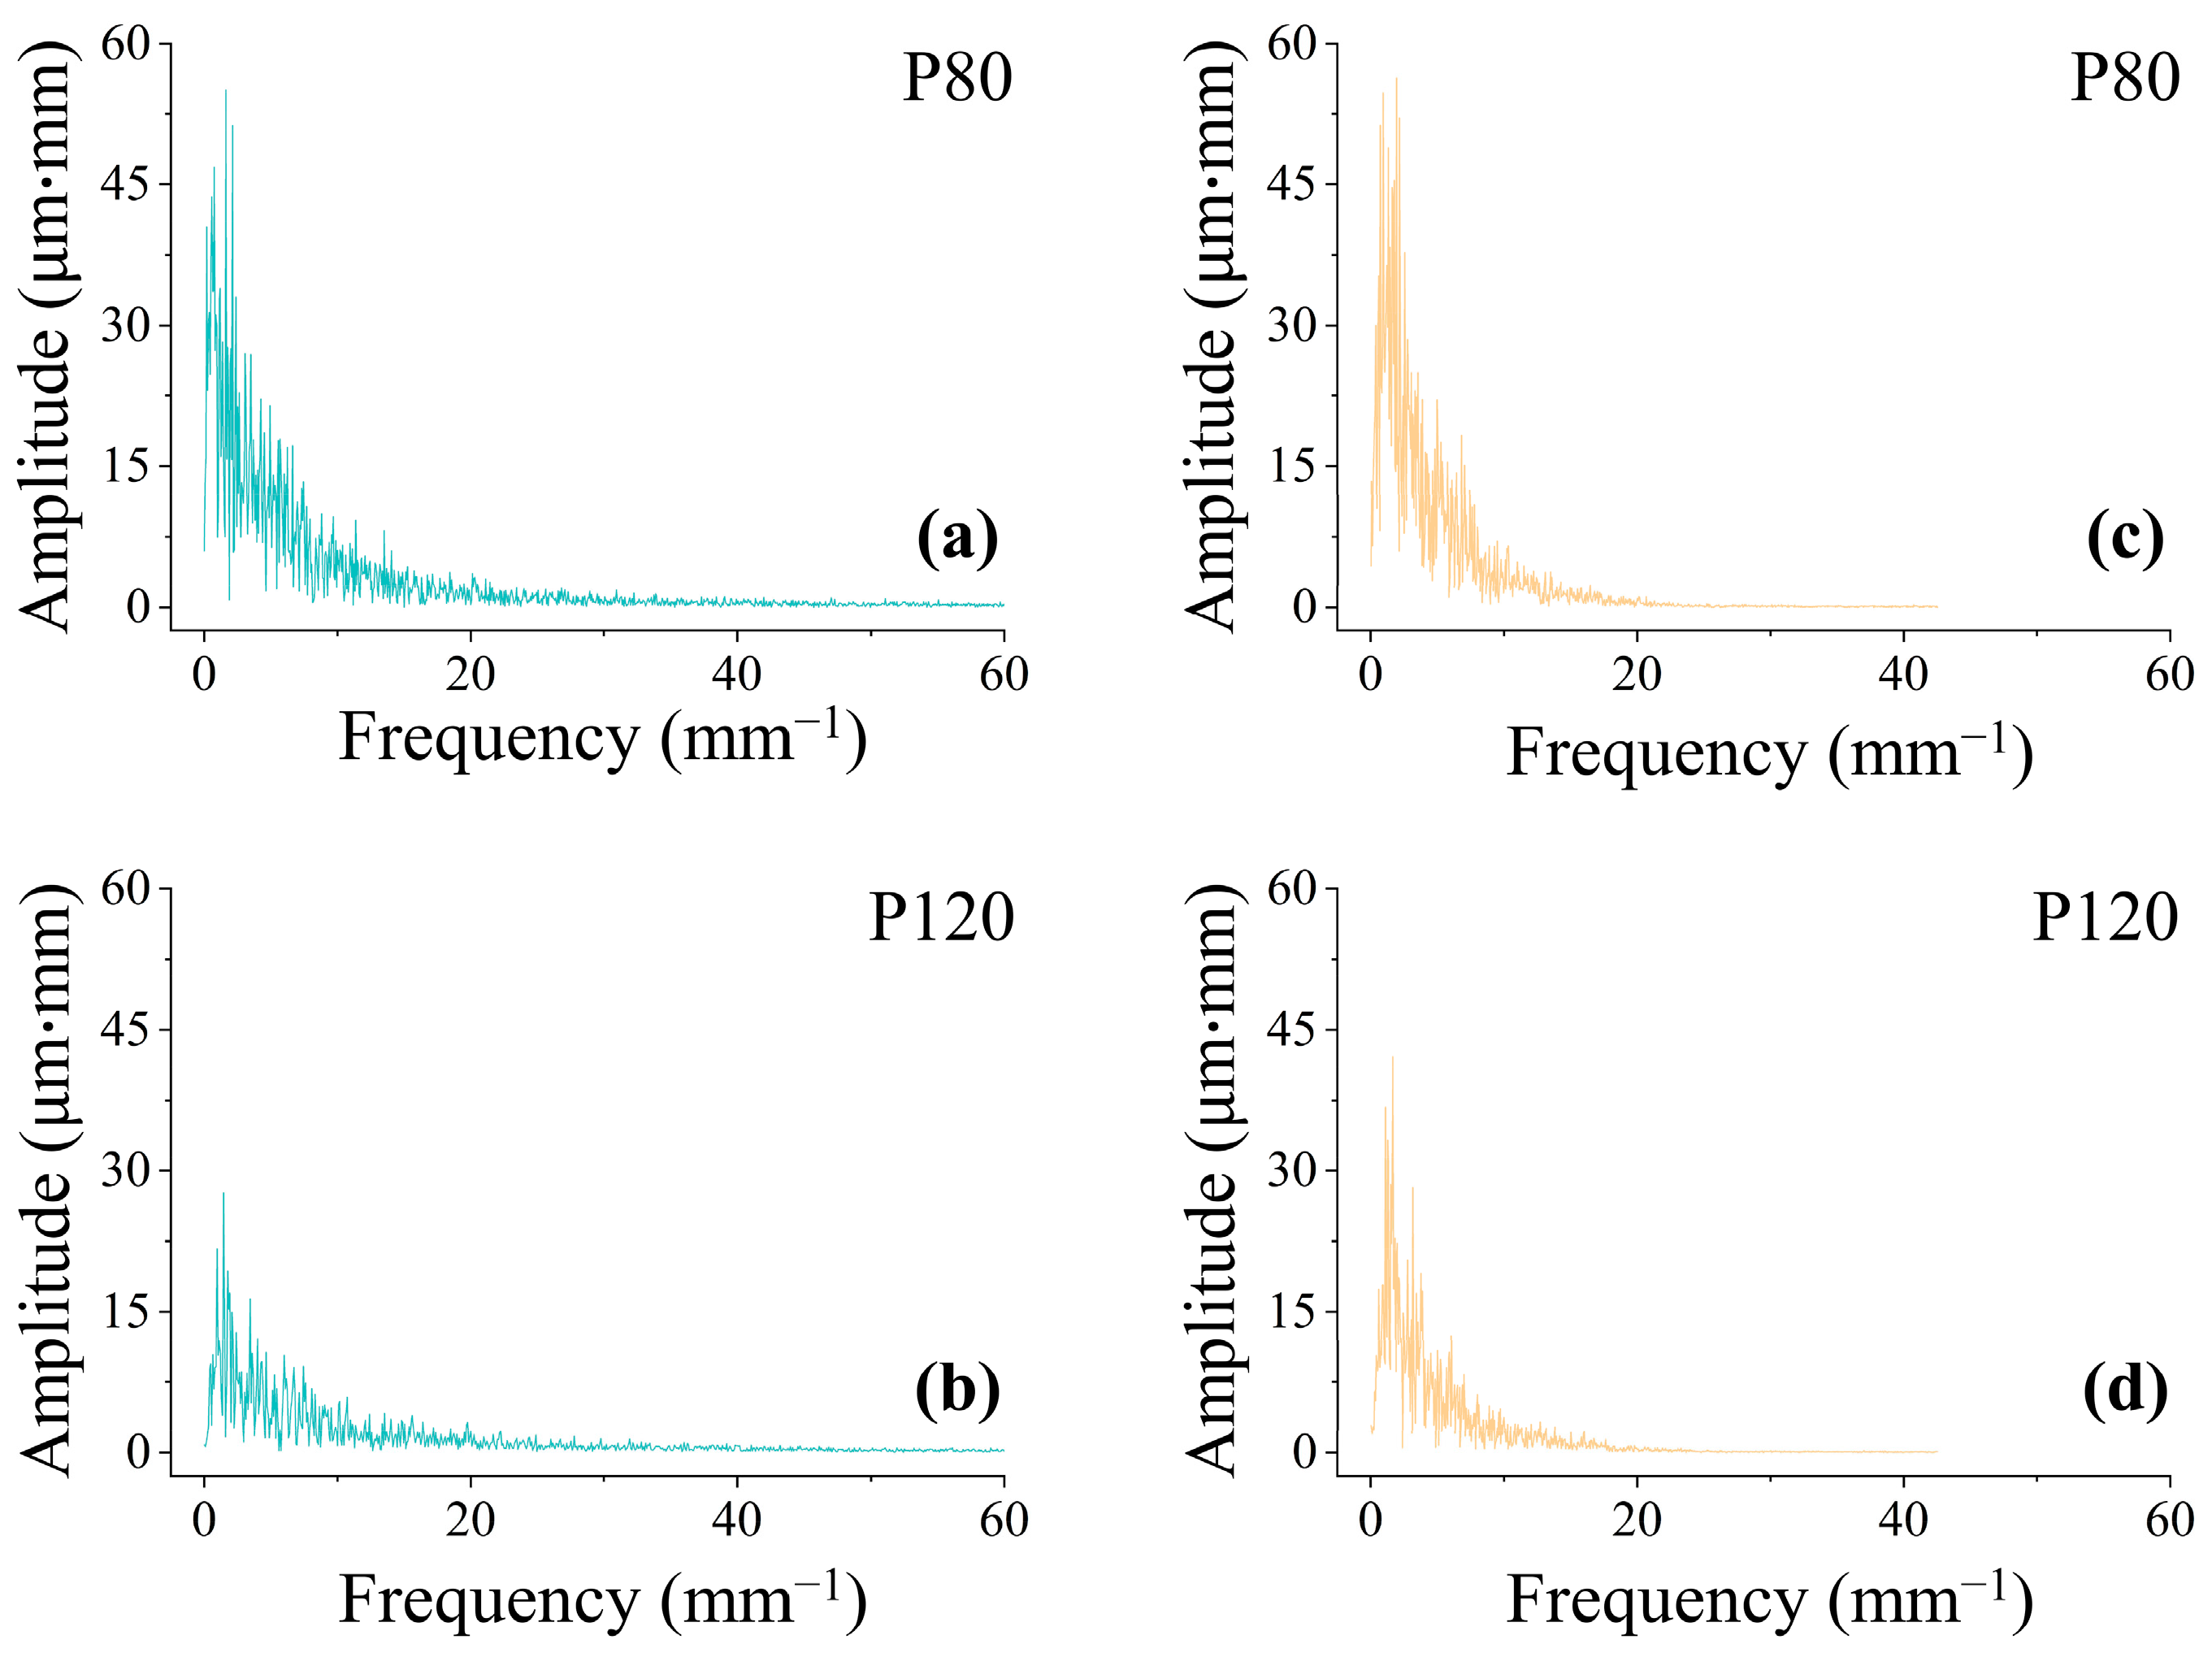
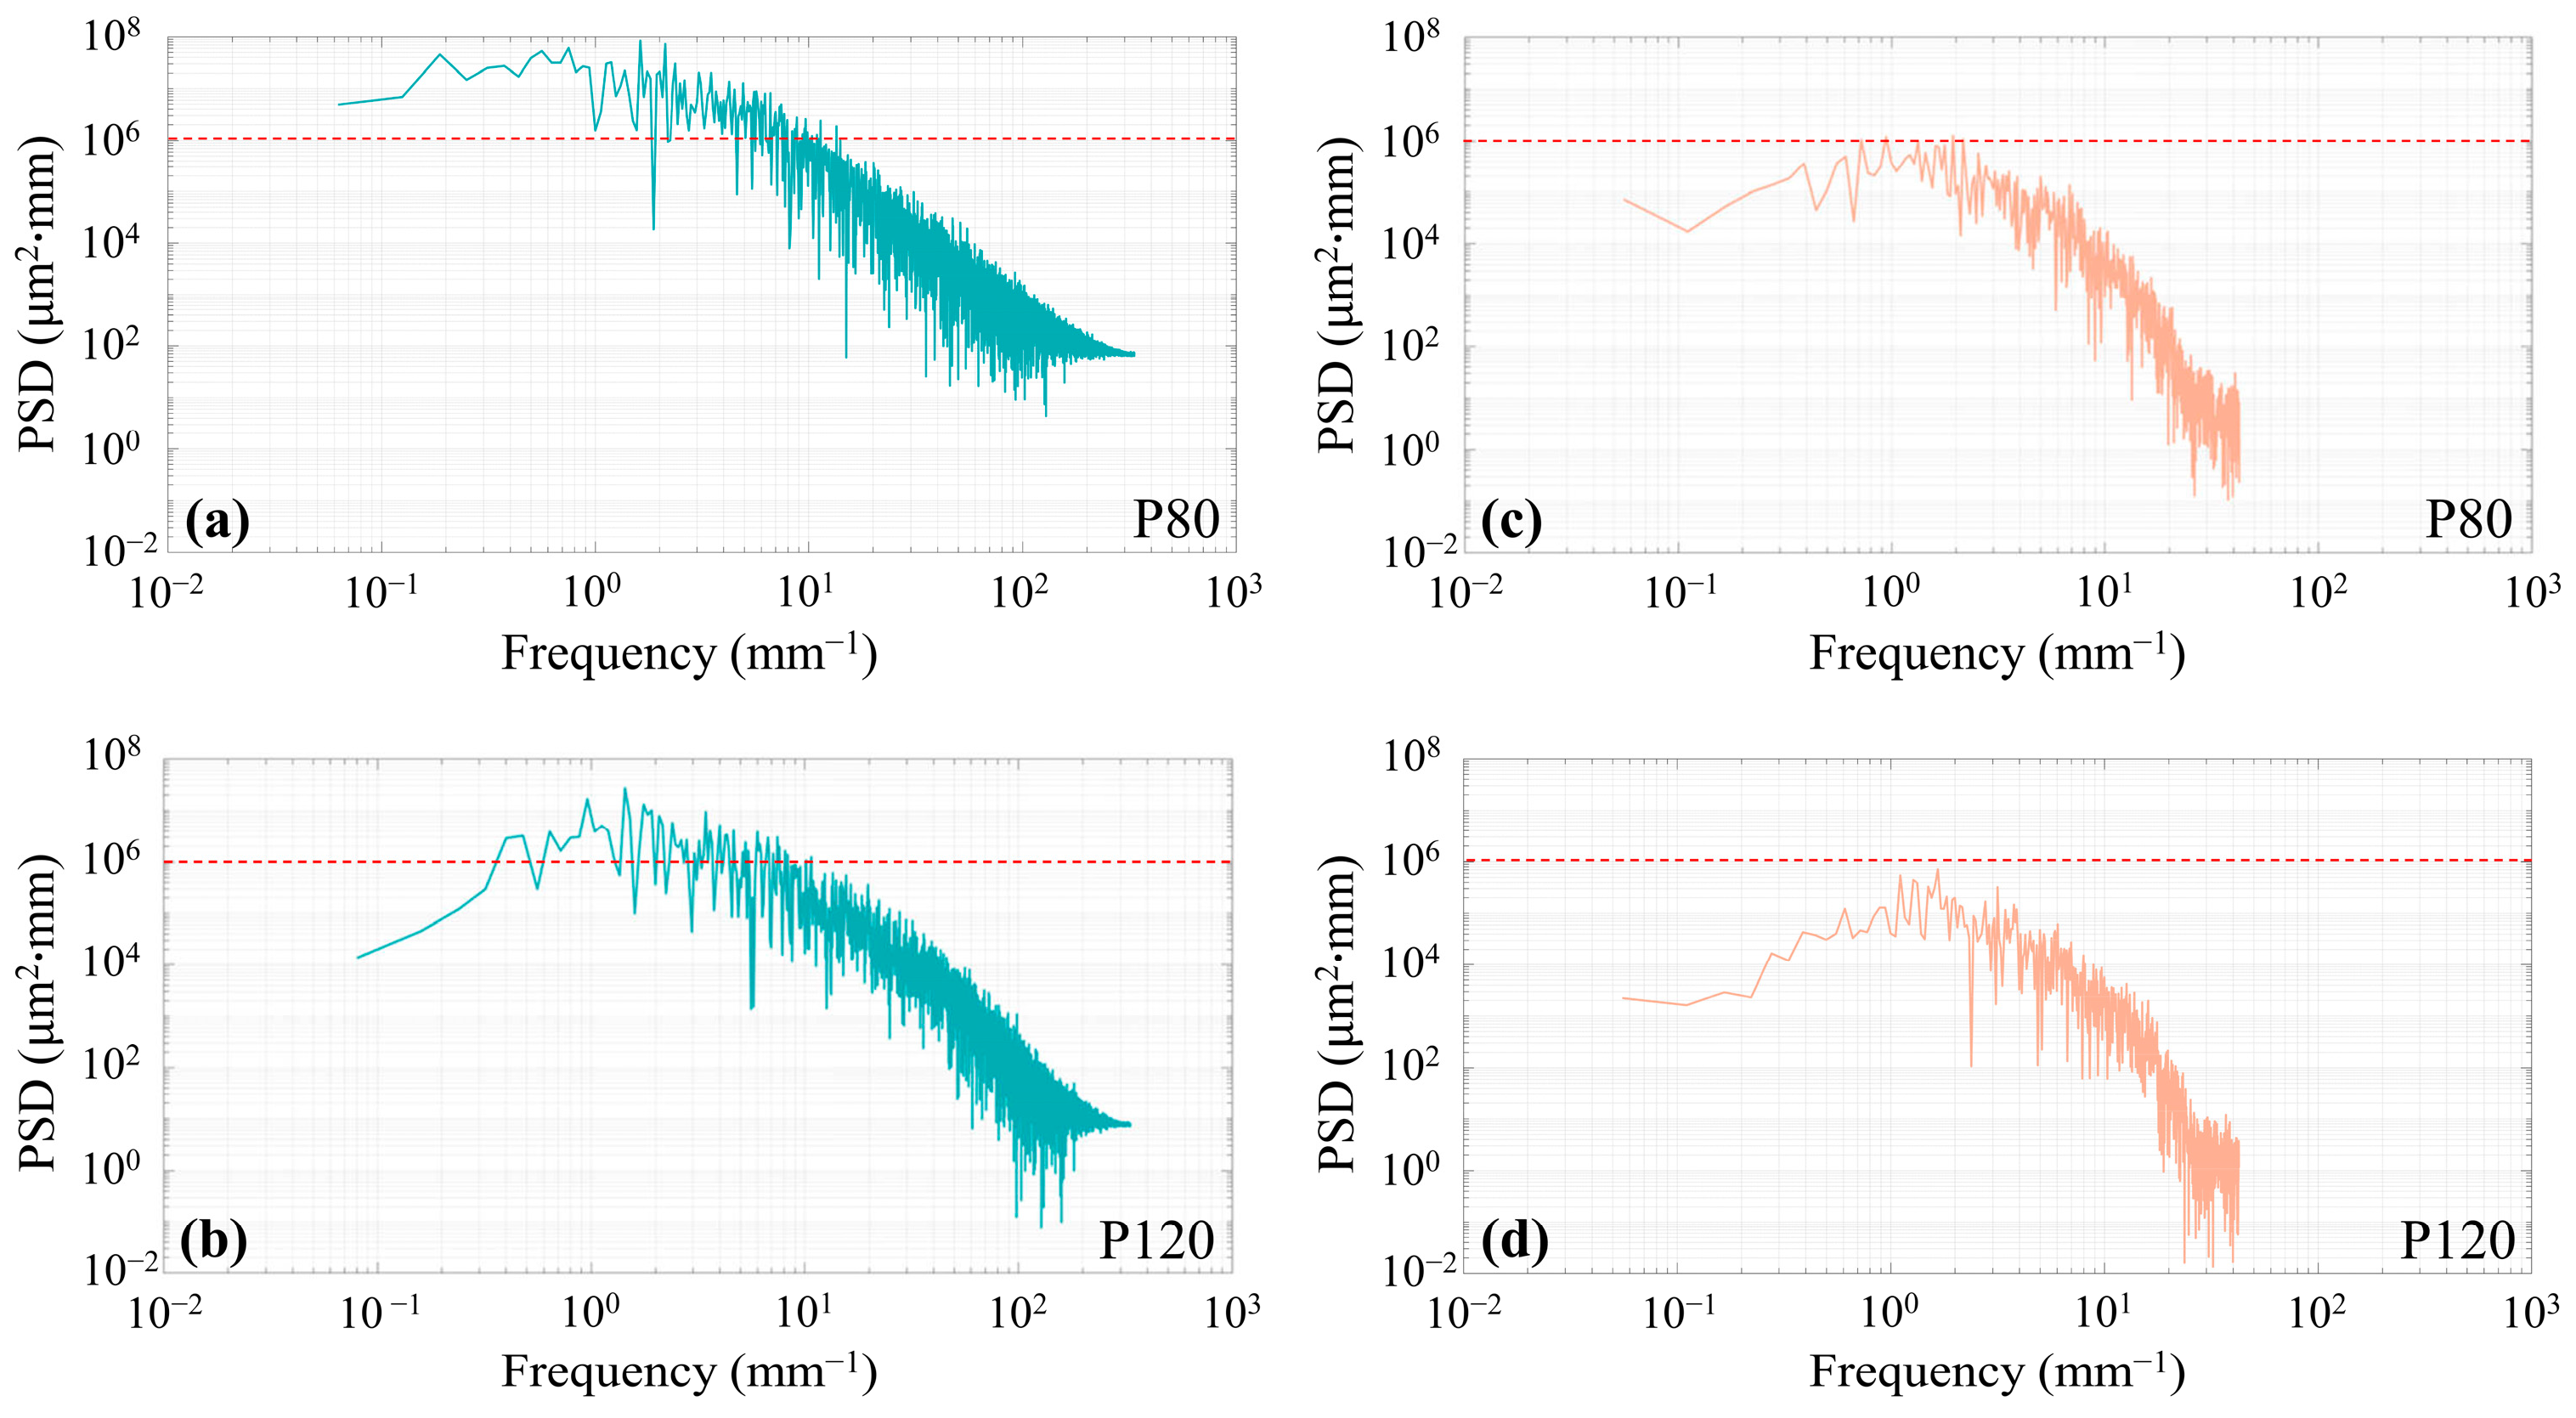
3.2. FFT and PSD Analysis of the Roughness Profile

Frequency domain analysis using the Fast Fourier Transform (FFT) method offers valuable insights into the surface roughness characteristics of bamboo surfaces sanded with two different grit sizes. The FFT results displayed in Figure 7 reveal clear distinctions between the roughness profiles obtained using P80 and P120 abrasive belts, as well as the measurement methods (stylus profilometer and 3D profilometer).
Across all cases, the primary amplitude of the FFT spectra is concentrated in the low-frequency range of 0~20 1/mm, indicating that the predominant surface features are associated with longer spatial wavelengths, characteristic of sanding processes. At higher frequencies, the amplitude diminishes significantly, approaching near-zero values around 60 1/mm for the stylus profilometer and slightly above 40 1/mm for the 3D profilometer. These observations suggest that the stylus method has an evidently greater sensitivity to finer surface details compared to the 3D method, as it captures higher-frequency components more effectively.
The FFT spectra reveal a notable distinction between P80 and P120 grit sizes. For P80 grit, the amplitude is significantly higher in the 0~20 1/mm range compared to P120, indicating the rougher texture and larger surface irregularities characteristic of coarser abrasive particles. Interestingly, for P80 grit, the amplitude values are comparable between the stylus and 3D profilometer methods, suggesting that the pronounced roughness features produced by coarser sanding are consistently detected by both measurement techniques. Notably, the amplitude for P120 grit is higher when measured by the 3D profilometer compared to the stylus profilometer. This difference highlights variations in how the two methods process and characterize surface roughness features during linear measurements, rather than a direct difference in sensitivity. Despite the stylus profilometer collecting a significantly higher number of data points (approximately 10,600 coordinates) compared to the 3D profilometer (approximately 1500 coordinates), the results suggest that the 3D profilometer’s measurement methodology emphasizes certain surface irregularities differently.
Specifically, the 3D profilometer’s signal processing and measurement optics may more effectively accentuate moderate irregularities over the linear path, which could explain the higher amplitude readings for P120 grit. Conversely, the stylus profilometer, with its finer point of contact and denser sampling, captures more localized and subtle variations. However, these fine details may not result in higher amplitude readings due to the smoothing effect when aggregating the data.
This observation underscores that the 3D profilometer, despite having fewer data points, can yield higher amplitude results in linear roughness measurements due to the way it processes and emphasizes certain surface features. Meanwhile, the stylus profilometer remains highly adept at capturing detailed, localized surface variations. This suggests that the two methods offer complementary perspectives on surface characterization, providing nuanced insights into the textural properties of the P120 grit sanded surface.
The PSD analysis provides valuable insights into the frequency-dependent characteristics of surface roughness generated by abrasive belt sanding of bamboo. The results highlight distinct differences between the stylus and 3D profilometer methods, underscoring variations in data acquisition and processing mechanisms that impact the interpretation of linear roughness profiles.
For all cases studied (see Figure 8), the PSD values decrease as the frequency increases, indicating that surface roughness features associated with higher frequencies (smaller wavelengths) contribute progressively less to the overall surface texture. This trend aligns with the general principle that roughness amplitudes diminish at smaller spatial scales, where surface irregularities are less pronounced [36].
Across both grit sizes (P80 and P120), the PSD values derived from the stylus method are significantly higher than those obtained using the 3D profilometer. This difference is attributable to the stylus profilometer’s higher spatial resolution and finer sampling density. With approximately 10,600 data points along a linear path, the stylus method captures more localized surface irregularities and small-scale roughness features, resulting in higher PSD values, particularly at lower frequencies. Conversely, the 3D profilometer, with about 1500 data points, provides coarser sampling that inherently smoothens fine surface details, leading to lower PSD values.
The frequency range where PSD values diminish differs notably between the two methods. For the stylus method, the PSD curve disappears at frequencies between 102 and 103 1/mm, capturing higher-frequency surface details compared to the 3D method, where the PSD curve vanishes between 101 and 102 1/mm. This suggests that the stylus profilometer is more sensitive to fine-scale features, whereas the 3D profilometer emphasizes broader, moderate-scale irregularities over its linear measurement path.
Comparing grit sizes, the PSD for P80 grit is slightly larger than P120 grit across both methods. This outcome reflects the more aggressive material removal and coarser texture imparted by P80 grit, which inherently produces greater roughness amplitudes. Despite this difference, the relative PSD values between P80 and P120 grit remain consistent across both methods, indicating that grit size influences surface texture in a systematic manner.
While the stylus method captures detailed, localized features with higher PSD values, the 3D profilometer offers complementary insights by emphasizing broader irregularities. The apparent differences in PSD values and frequency sensitivity highlight the importance of selecting an appropriate method based on the specific roughness attributes of interest. Together, these methods provide a more comprehensive characterization of bamboo surface roughness, enhancing our understanding of the effects of abrasive belt sanding.

3.3. RF Regression Model Analysis

The RF regression model demonstrated some reliable performance in predicting the linear roughness parameters (Rz, Ra, Rq, Rsk, and Rku) of bamboo surfaces sanded with abrasive belts. The MSE values for the parameters (see Table 4), specifically 438.5100 for Rz, 6.4159 for Ra, 8.5713 for Rq, 0.0379 for Rsk, and 0.1928 for Rku, indicate varied predictive accuracy. Notably, the largest error was observed in Rz, potentially due to its sensitivity to extreme surface peaks and valleys, while Ra and Rq exhibited lower errors, reflecting their robustness in capturing average roughness characteristics. The minimal errors for Rsk and Rku suggest that the RF model successfully captured the statistical distributions underlying surface texture variations.
Feature importance analysis revealed grit size as the dominant factor influencing roughness parameters (see Figure 9). Grit size accounted for importance values of 0.735, 0.720, and 0.747 for Rz, Ra, and Rq, respectively, highlighting its significant role in shaping surface texture. Finer grit sizes consistently resulted in smoother surfaces with reduced roughness values. In contrast, the measurement method exhibited minimal or negative importance across all parameters, suggesting it had negligible impact on surface roughness compared to grit size. The relatively lower importance of grit size for Rsk and Rku, which describe skewness and kurtosis, may be attributed to these parameters being more influenced by finer-scale surface irregularities or localized effects rather than the broader abrasiveness imparted by grit size. The negative importance values for the measurement method imply that its inclusion does not significantly enhance the model’s predictive performance and may introduce noise or redundancy in the modeling process, further affirming grit size as the primary factor in roughness variability in this study.
These findings have practical implications for bamboo surface finishing processes. The strong influence of grit size underscores its critical role in controlling surface quality. By selecting appropriate grit sizes, manufacturers can achieve smoother surfaces, as indicated by reductions in Ra and Rq, while higher-order texture parameters such as Rsk and Rku are likely more dependent on microstructural variations. On the other hand, the negligible effect of the measurement method suggests that standardization of measurement techniques may not be essential for consistent roughness evaluation. Collectively, these insights provide valuable guidance for optimizing sanding protocols, ensuring high-quality bamboo surfaces tailored to specific applications.

4. Conclusions

In this study, granularity of P80 and P120 were selected to create different bamboo surfaces, and their surface characteristics were evaluated using linear roughness parameters such as Rz, Ra, Rq, Rsk, Rku, and Rmr(c). The roughness of bamboo surfaces after abrasive belt sanding was measured using both a stylus profilometer and a 3D profilometer. To analyze the frequency domain characteristics of the roughness profiles, FFT and PSD methods were employed. Additionally, an RF model was developed to determine the importance of grit size and measurement methods in predicting surface roughness. The key findings can be summarized as follows:
(1)
Grit size has a significant influence on the surface roughness of bamboo in mechanical sanding. Finer grits (P120) produce more uniform surfaces compared to coarser grits (P80). For Rz, Ra, Rq, and Rmr (50%), both the stylus and 3D methods provide reliable results for comparing different grit sizes. However, resolution differences between the methods are crucial for accurately interpreting roughness values. Variations of Rsk and Rku highlight differences in sensitivity and detection range, particularly at finer scales;
(2)
t-tests manifested that the choice of measurement method significantly affects parameters such as Ra, Rq, and Rsk, especially for smoother surfaces produced by P120 grit. Despite these variations, both methods deliver comparable results for Rz and Rmr (50%) regardless of grit size. Rku is particularly sensitive to extreme surface features like peaks and valleys, and there would be important differences in how the two methods average or under-sample these extremes;
(3)
The dominant roughness features of sanded bamboo surfaces are associated with longer spatial wavelengths. The stylus method, with its higher spatial resolution and finer sampling density, demonstrates greater sensitivity to finer surface details compared to the 3D method. This sensitivity is evident in the FFT and PSD values, underscoring the importance of selecting the appropriate method based on the specific roughness attributes being studied;
(4)
The Random Forest model identified grit size as the dominant factor affecting roughness values, with Rz exhibiting the largest prediction error. The minimal impact of measurement method on most parameters suggests strict standardization may not be essential for consistent evaluations. However, sensitivity variations in Rsk and Rku underscore the need to refine evaluation criteria to account for differences in resolution and detection capabilities.
These findings offer practical recommendations for improving roughness assessment standards, ensuring robust and reliable evaluation of sanded bamboo surfaces across diverse methods.

Author Contributions

Conceptualization, J.Z.; methodology, J.Z.; software, Y.C.; validation, Y.C. and L.W.; formal analysis, J.Z.; investigation, J.Z.; resources, J.Z.; data curation, L.W. and H.Y.; writing—original draft preparation, J.Z.; writing—review and editing, J.Z.; visualization, H.Y.; supervision, J.Q.; project administration, J.Q.; funding acquisition, J.Z. All authors have read and agreed to the published version of the manuscript.

Funding

This work was supported by the Research Foundation of Talented Scholars of Zhejiang A&F University (No. 2022LFR078).

Data Availability Statement

The data are contained within the article.

Conflicts of Interest

The authors declare that they have no known competing interests or personal relationships that could have appeared to influence the work reported in this paper.

References

  1. He, L.; Chen, L.; Shao, H.; Qi, J.; Jiang, Y.; Xiao, H.; Chen, Y.; Huang, X.; Xie, J. Microstructure and physicochemical properties of the anisotropic moso bamboo (Phyllostachys pubescens) surface. Eur. J. Wood Prod. 2022, 80, 277–288. [Google Scholar] [CrossRef]
  2. Shu, B.; Xiao, Z.; Hong, L.; Zhang, S.; Li, C.; Fu, N.; Lu, X. Review on the Application of Bamboo-Based Materials in Construction Engineering. J. Renew. Mater. 2020, 8, 1215–1242. [Google Scholar] [CrossRef]
  3. Chen, L.; Yuan, J.; Wang, X.; Huang, B.; Ma, X.; Fang, C.; Zhang, X.; Sun, F.; Fei, B. Fine gluing of bamboo skin and bamboo pith ring based on sanding. Ind. Crops Prod. 2022, 188, 115555. [Google Scholar] [CrossRef]
  4. Shi, J.; Liang, Y.; Yu, H.; Ban, Z.; Zhang, Y.; Yang, W.; Yu, W. A new strategy for bamboo ultra-long radial slice preparation and novel composite fabrication. Ind. Crops Prod. 2023, 203, 117232. [Google Scholar] [CrossRef]
  5. Chen, S.-M.; Zhang, S.-C.; Gao, H.-L.; Wang, Q.; Zhou, L.; Zhao, H.-Y.; Li, X.-Y.; Gong, M.; Pan, X.-F.; Cui, C.; et al. Mechanically robust bamboo node and its hierarchically fibrous structural design. Natl. Sci. Rev. 2023, 10, nwac195. [Google Scholar] [CrossRef] [PubMed]
  6. Salca, E.-A.; Krystofiak, T.; Lis, B. Evaluation of Selected Properties of Alder Wood as Functions of Sanding and Coating. Coatings 2017, 7, 176. [Google Scholar] [CrossRef]
  7. Zhang, J.; Jiang, W.; Cui, Y.; Qian, J. Study on surface creation and wettability of bamboo through abrasive belt sanding. Eur. J. Wood Prod. 2024, 232, 117248. [Google Scholar] [CrossRef]
  8. Wu, J.; Zhang, Y.; Ji, Y.; Zhu, R.; Sun, Y.; Yu, Y.; Yu, W. Engineering the surface properties of bamboo scrimber to enhance the gluing properties. Polym. Compos. 2022, 43, 5465–5475. [Google Scholar] [CrossRef]
  9. Hendarto, B.; Shayan, E.; Ozarska, B.; Carr, R. Analysis of roughness of a sanded wood surface. Int. J. Adv. Manuf. Technol. 2006, 28, 775–780. [Google Scholar] [CrossRef]
  10. Kilic, M.; Hiziroglu, S.; Burdurlu, E. Effect of machining on surface roughness of wood. Build. Environ. 2006, 41, 1074–1078. [Google Scholar] [CrossRef]
  11. Luo, B.; Zhang, J.; Bao, X.; Liu, H.; Li, L. The effect of granularity on surface roughness and contact angle in wood sanding process. Measurement 2020, 165, 108133. [Google Scholar] [CrossRef]
  12. Aykac, E. Investigation of the Effect of Machining Parameters on Surface Quality in Bamboo. Teh. Vjesn. 2021, 28, 684–688. [Google Scholar] [CrossRef]
  13. Liu, Y.; Zhou, J.; Fu, W.; Zhang, B.; Chang, F.; Jiang, P. Study on the effect of cutting parameters on bamboo surface quality using response surface methodology. Measurement 2021, 174, 109002. [Google Scholar] [CrossRef]
  14. Jiang, S.; Buck, D.; Tang, Q.; Guan, J.; Wu, Z.; Guo, X.; Zhu, Z.; Wang, X. Cutting Force and Surface Roughness during Straight-Tooth Milling of Walnut Wood. Forests 2022, 13, 2126. [Google Scholar] [CrossRef]
  15. Zhong, Z.W.; Hiziroglu, S.; Chan, C.T.M. Measurement of the surface roughness of wood based materials used in furniture manufacture. Measurement 2013, 46, 1482–1487. [Google Scholar] [CrossRef]
  16. Gurau, L.; Mansfield-Williams, H.; Irle, M. Processing roughness of sanded wood surfaces. Eur. J. Wood Prod. 2005, 63, 43–52. [Google Scholar] [CrossRef]
  17. Lee, D.-H.; Cho, N.-G. Assessment of surface profile data acquired by a stylus profilometer. Meas. Sci. Technol. 2012, 23, 105601. [Google Scholar] [CrossRef]
  18. Chuchala, D.; Orlowski, K.A.; Hiziroglu, S.; Wilmanska, A.; Pradlik, A.; Mietka, K. Analysis of surface roughness of chemically impregnated Scots pine processed using frame-sawing machine. Wood Mater. Sci. Eng. 2023, 18, 1809–1815. [Google Scholar] [CrossRef]
  19. Mínguez-Martínez, A.; Maresca, P.; Caja, J.; Oliva, J.d.V.Y. Results of a Surface Roughness Comparison between Stylus Instruments and Confocal Microscopes. Materials 2022, 15, 5495. [Google Scholar] [CrossRef]
  20. Wei, S.; Zhao, H.; Jing, J. Investigation on three-dimensional surface roughness evaluation of engineering ceramic for rotary ultrasonic grinding machining. Appl. Surf. Sci. 2015, 357, 139–146. [Google Scholar] [CrossRef]
  21. Kang, C.-W.; Hashitsume, K.; Kolya, H. Surface topography analysis of Cedrela sinensis and Korean Paulownia boards using stylus and 3D optical profilometry. Int. J. Adv. Manuf. Technol. 2024, 134, 2431–2437. [Google Scholar] [CrossRef]
  22. Zhou, W.; Tang, J.; Huang, Z. A New Method for Rough Surface Profile Simulation Based on Peak–Valley Mapping. Tribol. Trans. 2015, 58, 971–979. [Google Scholar] [CrossRef]
  23. Bouchama, R.; Bouhalais, M.L.; Cherfia, A. Surface roughness and tool wear monitoring in turning processes through vibration analysis using PSD and GRMS. Int. J. Adv. Manuf. Technol. 2024, 130, 3537–3552. [Google Scholar] [CrossRef]
  24. Bao, X.; Ying, J.; Cheng, F.; Zhang, J.; Luo, B.; Li, L.; Liu, H. Research on neural network model of surface roughness in belt sanding process for Pinus koraiensis. Measurement 2018, 115, 11–18. [Google Scholar] [CrossRef]
  25. Shan, X.; Gao, C.; Rao, J.H.; Wu, M.; Yan, M.; Bi, Y. Experimental Study and Random Forest Machine Learning of Surface Roughness for a Typical Laser Powder Bed Fusion Al Alloy. Metals 2024, 14, 1148. [Google Scholar] [CrossRef]
  26. Yuan, T.; Wang, X.; Liu, X.; Lou, Z.; Mao, S.; Li, Y. Bamboo flattening technology ebables efficient and value-added utilization of bamboo in the manufacture of furniture and engineered composites. Compos. Part B Eng. 2022, 242, 110097. [Google Scholar] [CrossRef]
  27. Chen, H.; Tang, J. Influence of ultrasonic assisted grinding on Abbott-Firestone curve. Int. J. Adv. Manuf. Technol. 2016, 86, 2753–2757. [Google Scholar] [CrossRef]
  28. Tan, P.L.; Sharif, S.; Sudin, I. Roughness models for sanded wood surfaces. Wood Sci. Technol. 2012, 46, 129–142. [Google Scholar] [CrossRef]
  29. Xia, F.; Tang, J.; Li, L.; Yang, D.; Zhao, J. An improved FFT method for shot peening surface reconstruction. Surf. Topogr. Metrol. Prop. 2022, 10, 25028. [Google Scholar] [CrossRef]
  30. Weroński, P. Roughness of surface decorated with randomly distributed pillars. Sci. Rep. 2018, 8, 16045. [Google Scholar] [CrossRef] [PubMed]
  31. Mahboob Kanafi, M.; Tuononen, A.J. Top topography surface roughness power spectrum for pavement friction evaluation. Tribol. Int. 2017, 107, 240–249. [Google Scholar] [CrossRef]
  32. Barrios, J.M.; Romero, P.E. Decision Tree Methods for Predicting Surface Roughness in Fused Deposition Modeling Parts. Materials 2019, 12, 2574. [Google Scholar] [CrossRef] [PubMed]
  33. Cool, J.; Hernández, R.E. Improving the Sanding Process of Black Spruce Wood for Surface Quality and Water-Based Coating Adhesion. For. Prod. J. 2011, 61, 372–380. [Google Scholar] [CrossRef]
  34. Gurau, L. Testing the Processing-Induced Roughness of Sanded Wood Surfaces Separated from Wood Anatomical Structure. Forests 2022, 13, 331. [Google Scholar] [CrossRef]
  35. Kamperidou, V.; Aidinidis, E.; Barboutis, I. Impact of Structural Defects on the Surface Quality of Hardwood Species Sliced Veneers. Appl. Sci. 2020, 10, 6265. [Google Scholar] [CrossRef]
  36. Huan, J.; He, M.; Wan, Z.; Li, M.; Pan, H.; Hu, M. Scale effects and spatial distribution characteristics of 3D roughness of natural rock fracture surfaces: Statistical analysis. Acta Geophys. 2024, 181, 212. [Google Scholar] [CrossRef]
Figure 1. Schematic diagram of the experimental setup.
Forests 16 00066 g001
Figure 2. Illustration of surface roughness measurement by stylus profilometer and 3D profilometer.
Forests 16 00066 g002
Figure 3. Illustration of the Abbott curve. Note: the dashed lines colored in blue and red refer to different profile heights between the the peak height and the valley bottom depth.
Forests 16 00066 g003
Figure 4. Typical roughness profiles obtained from: (a,b) stylus profilometer; (c,d) 3D profilometer.
Forests 16 00066 g004
Figure 5. Results of surface roughness parameters selected in this study.
Forests 16 00066 g005
Figure 6. Abbott curve for roughness profiles obtained from stylus profilometer.
Forests 16 00066 g006
Figure 7. FFT spectra of typical roughness profiles obtained from: (a,b) stylus profilometer; (c,d) 3D profilometer.
Forests 16 00066 g007
Figure 8. FFT spectra of typical roughness profiles obtained from: (a,b) stylus profilometer; (c,d) 3D profilometer. Note: the red dashed lines refer to the position of 106  μ m2·mm, which aims to enhance comparability.
Forests 16 00066 g008
Figure 9. Feature importances of grit size and measuring method on surface roughness.
Forests 16 00066 g009
Table 1. Detailed information on the stylus profilometer.
ParametersDescription
Stylus radius 5   μ m
Stylus tip angle90°
Measuring speed0.5 mm/s
Measuring range 360   μ m (− 200   μ m to +160 μ m)
Sampling length (λc)2.5 mm for 2 μ m < R a     10   μ m;
8   mm   for   R a   >   10   μ m
Evaluation length (le) 12.5   mm   for   2   μ m   <   R a     10   μ m ;
16   mm   for   R a   >   10   μ m
Resolution1.6~25.6 nm in Z-axis;
1.5   μ m in X-axis
Filter typeGauss
Table 2. Detailed information on the 3D profilometer.
ParametersDescription
Stylus radius 5   μ m (stylus mode setting)
Stylus tip angle90° (stylus mode setting)
Scanning area24 mm × 18 mm (12×)
Sampling length (λc) 2.5   mm   for   2   μ m   <   R a     10   μ m ;
8   mm   for   R a   >   10   μ m
Evaluation length (le) 12.5   mm   for   2   μ m   <   R a     10   μ m ;
16   mm   for   R a   >   10   μ m
Resolution 1.0   μ m in Z-axis;
11.719   μ m in X-axis
Filter typeGauss
Table 3. Significance results (t-test) of the roughness parameters obtained through the stylus and 3D measuring methods.
ParameterGranularityMean
Value
( μ m)
Standard Deviation
SD
Degree of Freedom
df
Statistical Value
ts
Probability Value
p
Significance
RzP80108.3911.338−0.0430.966-
108.667.91
P12050.644.218−0.4750.647-
51.924.28
RaP8013.981.218−1.5530.159-
15.461.75
P1207.980.258−2.9860.017**
8.780.55
RqP8017.711.528−0.9890.352-
18.822.01
P1209.880.348−3.0070.017**
10.850.63
RskP80−0.220.248−1.1300.291-
−0.090.10
P120−0.280.1182.5850.032**
−0.460.10
RkuP803.250.2483.6800.006**
2.680.24
P1202.890.338−0.9440.373-
3.170.57
Rmr (50%)P8059.9919.5480.8340.429-
52.336.32
P12069.856.4480.5710.584-
66.6010.99
Note: ** for p < 0.05.
Table 4. The results of MSE on the roughness prediction by RF model.
RoughnessRzRaRqRskRku
MSE438.51006.41598.57130.03790.1928
Disclaimer/Publisher’s Note: The statements, opinions and data contained in all publications are solely those of the individual author(s) and contributor(s) and not of MDPI and/or the editor(s). MDPI and/or the editor(s) disclaim responsibility for any injury to people or property resulting from any ideas, methods, instructions or products referred to in the content.

