Abstract
Increased water limitations due to climate change will pose severe challenges to forest ecosystems in Europe. We investigated the response of potted saplings of Fagus sylvatica L., one of the major European tree species, to a spring and a summer water-withholding period with control–control (C-C), control–drought (C-D), drought–control (D-C) and drought–drought (D-D) treatments. We focused on recovery capacity and phenological and growth traits and questioned the extent to which an earlier drought influenced the response to a second drought in the same growing season. To examine the impact of the level of drought stress, a distinction was made between saplings with less or more than half of their leaves desiccated due to the spring drought (D<50 and D>50). The timing of the drought influenced the immediate post-drought response: saplings severely affected by the spring drought (D>50) resprouted, whereas saplings severely affected by the summer drought (C-D and D<50-D) did not. The spring treatment influenced the onset of visual symptoms in the summer drought, with saplings less affected in the spring drought (D<50-D) developing symptoms three days later than the saplings not subjected to drought in the spring (C-D), whereas severely affected saplings (D>50-D) had not yet display symptoms seventeen days after the first visual symptoms in the spring control saplings (C-D). The timing of autumnal leaf senescence displayed the legacies of the spring treatment. The saplings heavily affected by the spring drought showed a slower decrease in relative chlorophyll content and delayed leaf senescence (D>50-C and D>50-D), which may enable the repair of damaged tissues. The saplings that were less affected by the spring drought (D<50-C) showed earlier autumnal leaf senescence, which is likely an acclimation response. Interestingly, a larger diameter increment in autumn for all of the saplings that experienced the summer drought (C-D, D<50-D and D>50-D) may indicate the recovery of hydraulic capacity by new xylem growth. Our results underline the plasticity of young F. sylvatica saplings in response to (repeated) drought.
1. Introduction
Forests play a key role in water and nutrient cycles, provide a diverse range of ecosystem services and are essential for the preservation and sustenance of biodiversity [1,2]. Increasing severe weather phenomena such as heat waves, droughts and storms, occurring due to climate change, can lead to increased tree mortality and result in the release of net atmospheric CO2. Forests face vulnerability to various extreme climate events, with drought and its related disturbances globally exerting the most significant impact [3,4]. It is assumed that trees will probably not be able to adapt to abrupt increases in aridity through evolutionary mechanisms due to their extended generation cycles and the incapacity to migrate away from stressful conditions. The prospect of global warming causing extended and intensified droughts underscores the importance of investigating the impacts of drought on woody plants [4,5].
Trees shedding leaves is a common phenomenon during drought as a life-saving strategy [6]. Leaf shedding typically occurs after stomatal closure [7], and xylem embolisms in the leaves may be the main driver of leaf mortality during drought [8,9,10]. The shedding of leaves in response to drought diminishes the evaporative leaf surface area, thereby assisting woody perennials in postponing the initiation of cavitation in the conductive tissues of the stem [11,12]. Leaf shedding alleviates water stress on the remaining foliage of woody plants, effectively slowing down the rate of desiccation [13,14]. Yet, shedding leaves without complete nutrient resorption results in net nutrient losses, which may limit post-drought resprouting and photosynthesis and have long-term implications for tree performance [15]. Defoliation due to severe drought can lead to partial crown dieback and eventually result in tree mortality in the following years [16]. Rebuilding an affected crown after a severe drought demands additional carbon investment, sourced from non-structural carbohydrate reserves or from the assimilation of remaining or newly grown leaves once drought stress subsides [17].
While considerable focus has been dedicated to identifying the physiological factors leading to tree mortality during drought, it is equally crucial to comprehend the mechanisms involved in the recovery of trees that withstand dry periods [18]. Drought resilience can be quantified by evaluating both the disturbance impact and the rate of recovery following the disturbance [19]. The pace of post-drought hydraulic recovery is primarily determined by the magnitude of the negative water potential reached and the time spent at this extreme [4]. When little or no cavitation (i.e., formation of vapor-filled cavities or air bubbles in the xylem network) has occurred, recovery from drought after rainfall occurs rapidly and stomata open to assimilate new carbon from the atmosphere as plants rehydrate. When cavitation thresholds have been surpassed, the recovery of photosynthesis is considerably slower and proceeds in coordination with the gradual restoration of hydraulic conductance from the roots to the tree crown [20]. When extensive aboveground biomass loss occurs due to drought, the recovery process may be accelerated through resprouting from epicormic buds [20]. A reduction in growth or physiological processes can be compensated for by investment in other processes or tissues and, a process called compensatory recovery [17]. For instance, after drought stress, Fagus sylvatica saplings can delay autumnal leaf senescence, maintaining photosynthesis at a higher level for a longer time [21,22].
In this study, we conducted a controlled recurrent drought experiment on F. sylvatica saplings. We withheld water from potted saplings in the spring and summer of the same growing season, followed by rewatering. In the experiment, we aimed to subject saplings to varying levels of drought stress, ranging from mild to severe, which was assessed based on the visual symptoms that developed during the drought periods. The factorial design allowed the study of the potential influence of former drought exposure. We hypothesized that the responses to the imposed droughts would depend on (i) the timing of the drought in the growing season, (ii) the severity of the drought effects and (iii) whether saplings had already experienced a drought. We were particularly interested in the recovery process and focused on the timing of autumnal leaf senescence and the influence on growth traits.
2. Materials and Methods
2.1. Source Material
We used 288 Fagus sylvatica saplings belonging to ten provenances (Table S1). The ten genetic backgrounds were evenly distributed between the different treatments (see Section 2.2), but no provenance-dependent analyses were performed because of the low number of saplings for each provenance in each treatment group. Vander Mijnsbrugge et al. [23] described the seed collection in 2016, the germination in 2017, the establishment of a common garden of potted seedlings in 2017, and a temperature manipulation experiment with the potted seedlings in 2018. After the temperature treatment in 2018, we moved the potted seedlings to an outdoor container field at the Research Institute for Agriculture and Fisheries in Melle (Belgium), where the saplings were watered using automatic sprinklers. In the winter of 2019–2020, we transferred the saplings to 4 L pots (height 17 cm, diameter 21 cm). All pots were filled with standard nursery potting soil (1.5 kg/m3 NPK 12 + 14 + 24, organic matter 20%, pH 5.0–6.5, E.C. 450 µS/cm and dry matter 25%) without additional fertilizer. The organic matter content and the pH range promote the water-holding capacity of the potting soil, while a dry matter content of 25% indicates a relatively aerated mixture. All saplings remained in the pots during the experiment and had access to the same type and amount of potting soil.
2.2. Drought Treatments
In the middle of May 2022, we moved all potted saplings to a greenhouse, in which an automatic grey shade net protected the saplings from heavy solar radiation. We performed spring and summer drought treatments following a full-factorial design in the growing season of 2022 (Figure 1). At the start and end of both treatments, we brought all saplings to full water saturation: we placed the pots overnight in a water basin with the water level reaching 5 cm above the base of the pots. At the start of the two treatments, we took the pots out of the basin and let any excess water drain naturally over the course of a few hours. During the first treatment (spring), half of the pots—the drought group—did not receive any watering (n = 144), while the other half—the control group—were watered on a regular basis by experienced technical staff, keeping the saplings well-moisturized (n = 144). The ten provenances were evenly (and randomly within each provenance) distributed among the control and drought groups (Table S2). For the second treatment (summer), we split both the control and drought groups of the spring treatment in half, with each half then being the control or drought group in the summer treatment (Figure 1). In addition, the ten provenances were equally (and randomly within each provenance) distributed over the control and drought groups (Table S3). The four treatment groups of the experiment are hereafter called control–control (C-C), control–drought (C-D), drought–control (D-C) and drought–drought (D-D), indicating the combination of the groups in the spring and summer treatments.

Figure 1.
Schematic representation of the two succeeding droughts in the growing season of 2022. For a potted sapling, the two consecutive treatments were either C-C (control–control), i.e., the control group during the spring treatment and the control group during the summer treatment, C-D (control–drought), D-C (drought–control) or D-D (drought–drought). The severity of the spring drought was categorized according to the proportion of desiccated leaves, with D<50 representing less than half of the leaves desiccated, and D>50 representing more than half.
The spring treatment lasted from May 23 until June 15, and the summer treatment took place from August 8 until September 12. The spring treatment was ended when there was a distribution of saplings across the different visual drought stress groups (see results), from saplings displaying up to 100% desiccated leaves, as well as saplings without any desiccated leaves. A small number of saplings, for which all leaves were desiccating during the spring drought treatment (15 from a total of 144 saplings), were placed overnight in a water basin on June 13 (n = 7) and June 14 (n = 8) to keep mortality to a minimum and to have a reasonable amount of saplings in all visual drought stress groups (Table S2). To reduce sapling mortality to a minimum during the summer drought treatment, we again placed the saplings that were severely desiccated early on during the treatment in a water basin before the end of the summer drought treatment (Table S4, Figure S1). After the two subsequent treatments, we kept the saplings in the greenhouse until December 2022, ensuring they were consistently maintained under well-watered conditions, as assessed by knowledgeable technical staff. Seven saplings were not alive anymore in the spring of 2023.
2.3. Measurements and Observations
We weighed all the pots at the start of each of the two drought treatments (i.e., after the overnight water basin) and on a weekly basis throughout the treatments. The weight reduction of the pots served as an indicator of water scarcity. For the summer treatment, we calculated the relative weight loss as the difference in weight of a pot between the initial water-saturated condition (on August 8) and its weight on August 22, divided by the initial weight at the saturated condition.
For all the saplings, we measured stem diameter with a measuring rod at 1 cm above the soil level and sapling height up to the place on the stem that was still alive. We performed the measurements at the beginning of the spring drought treatment (May 23), in-between the two drought treatments (August 1) and at the end of 2022 (December 26 for diameters) or the start of the growing season in 2023 (April 25 for heights). Height measurements in December 2022 were not reliable as it only became clear at the time of the spring budburst in 2023 which part of the stem had died off.
To identify the onset of visual drought stress symptoms on the saplings in the spring and summer drought treatments and to track the progress of desiccation, we scored the saplings of the drought groups phenotypically (protocol: see Table 1). During the spring treatment, visual drought symptoms became evident on June 10, and we scored all saplings on June 13–15. For the summer drought treatment, we scored the saplings 3 times a week from August 20 until September 12.

Table 1.
Four scoring protocols used to visually assess the effects of: drought stress on the saplings during the water withholding period [9,24], final leaf desiccation after drought, post-drought recovery and autumnal leaf senescence.
Following the first (spring) drought treatment, when it became visually evident which leaves had dried up and which ones had regained turgor, we assessed the proportion of desiccated leaves on the saplings of the drought group on June 21 using a scoring protocol (Table 1). The distribution of the saplings among the different categories of desiccated leaves and their further division among the control and drought groups in the summer treatment are shown in Table 2. The first results indicated that distinguishing saplings with less than 50% desiccated leaves (D<50, consisting of the groups with 0% and 1%–50% leaf desiccation) and saplings with more than 50% desiccated leaves (D>50, consisting of the groups with 51%–75%, 76%–95% and 96%–100% leaf desiccation) was justified (see Figure 2b). On July 14, we evaluated the post-drought recovery of the saplings in the drought group, focusing on buds that initiated new growth (i.e., resprouting). Budburst in woody saplings is normally observed in spring. We adapted a spring protocol for the post-drought new leaf phenology (Table 1). After the second (summer) drought treatment, only a few of the desiccated saplings displayed bud swelling, with a minor number of small leaves that hardly protruded from the buds and did not properly unfold. Therefore, no recovery was scored after the summer drought treatment.
Table 2.
Number of saplings in the different categories of desiccated leaves after the spring drought period (nD) and their further division among the D-C and D-D treatment groups (nD-C/nD-D).
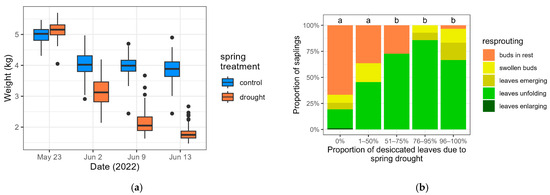
Figure 2.
Weight of the pots during the spring treatment for the control saplings and the saplings subjected to drought (a) and proportion of the saplings that had experienced drought in the different resprouting categories after the spring drought, according to the proportion of desiccated leaves (b). The lowercase b denotes a significant difference with the saplings that had zero desiccated leaves.
We used a chlorophyll content meter (CCM-200, Edaphic Scientific, Melbourne, Australia) that determines the relative chlorophyll content as the ratio of optical transmission at 931 nm (near-infra-red) to optical transmission at 653 nm (green). We measured the relative chlorophyll content on one representative damage-free and mature leaf on a short shoot at the middle of each sapling during the growing season: May 31, July 4 and 18 (beginning of the spring drought, and two times after the end of the spring drought), as well as on August 1, September 26 and October 24 (before the summer drought, and two times after the end of the summer drought). Saplings that were totally desiccated due to the drought treatments were, quite evidently, not measured.
In the autumn of 2022, we scored leaf senescence in all groups of saplings twice a week from October 26 to November 28, observing the entire sapling and giving a mean score (Table 1). Leaves desiccated due to the previous drought treatments were omitted from the scoring.
2.4. Statistical Analysis
We analyzed all data using the open-source statistical software R, version 4.4.2. [25]. We applied linear and general linear mixed models using the lme4 package [26] and addressed ordinal data with cumulative logistic regression using the ordinal package [27]. Figures were made with ggplot2 [28]. Mixed-effects modeling proved advantageous for the analysis of ecological data due to its ability to accommodate nested data, handle unbalanced datasets, and incorporate random effects [29]. In the context of experimental studies on tree seedlings and saplings, growth traits are often analyzed using (general) linear mixed models, whereas phenological data can be effectively processed with cumulative logistic regression (e.g., [30,31]). The independent variables applied in the fixed parts of the mixed models are explained in Table 3. In the presented model formulas, each β is an indication of the effect of each independent variable on the response variable. A unique plant identifier was added as a random effect to account for repeated measures on the same saplings when applicable.
Table 3.
Variables used as fixed effects in the mixed models. Abbreviations of the variables are explained in the description using bold text.
2.4.1. Recovery After the Spring Drought Period
We examined the relationship between the occurrence of post-drought resprouting after the spring treatment and the severity of the experienced drought stress. For this, we looked at the saplings in the drought group and studied the effect of the level of leaf desiccation and initial sapling height on the recovery by resprouting (RES). We used cumulative logistic regression to model the probability of having resprouted up to a given resprouting level (pR), i.e., having reached a certain resprouting level or a lower level:
log(pRES/(1 − pRES)) = β0 − β1DES − β2Hspring
2.4.2. Onset of Visual Drought Symptoms in the Summer Treatment
We examined whether the onset of visual drought symptoms in the summer treatment (ODRsummer) was dependent on the effects of the spring treatment. During the summer treatment, none of the saplings in the drought group that had more than half of their leaves desiccated due to the spring drought (D>50-D) showed visual drought symptoms before the end of the treatment. Hence, we used only part of the drought group, i.e., the saplings with less than half of their leaves desiccated after the spring treatment (D<50-D), and all controls from the spring treatment (C-D) for the modeling. We first transformed the scores of visual symptoms into binary data. All saplings without visual drought symptoms were given a score of 0, and all others scored 1. We fit a logistic regression with pODRsummer, showing the probability of displaying drought symptoms on a given day during the summer drought treatment:
log(pODRsummer/1 − pODRsummer) = β0 + β1Hsummer + β2TRfull + β3DAY
The difference in time between the onset of the visual drought symptoms in the C-D and D<50-D groups was calculated based on the coefficients of the model above and using the mean summer sapling height.
2.4.3. Relative Chlorophyll Content
We used the measurements of the relative chlorophyll content (RCC) in the leaves for two purposes. Firstly, we quantified the experienced drought stress caused by the spring drought, by comparing the relative chlorophyll content of the spring drought group with the controls. Secondly, the relative chlorophyll content measurements in summer and autumn completed the picture of the autumnal leaf senescence process together with the visual observations.
The RCCspring model accounted for the measurements in the first week of the spring drought treatment (May 31) and the two measurements after the treatment (July 4 and 18):
RCCspring = β0 + β1 Hspring + β2TRspring + β3DAYcat + β4TRspringDAYcat
By including the interaction term between DAYcat and TRspring, the model allowed for the possibility that the change in RCCspring over time (DAYcat) differed among the treatment groups (TRspring).
The relative chlorophyll content at the beginning of (August 1) and after (September 26 and October 24) the summer treatment (RCCsummer) was modeled with the same model structure as above but with Hsummer and TRfull.
2.4.4. Autumnal Leaf Senescence
To examine the effect of the treatments on autumnal leaf senescence (SEN), the probability of having attained—on a given day—a given leaf senescence score or a lower score (pSEN) was modeled by employing a generalized linear mixed model (cumulative logistic regression):
log(pSEN/(1 − pSEN)) = β0 − β1TRfull − β2DAY
The timelapse between autumnal leaf senescence for the control–control group and the different spring and summer treatments was calculated based on the coefficients of the fitted model.
2.4.5. Change in Sapling Heights and Diameters
To evaluate the effects of the drought in each treatment on sapling growth, we modeled the change in sapling height and diameter for all the saplings, taking into account the initial height and diameter. We calculated the height and diameter increment by subtracting the height and diameter on May 23 from those on August 1 for the spring treatment (HIspring and DIspring), and by subtracting the height and diameter on August 1 from those on April 25, 2023 (height) or December 26, 2022 (diameter) for the summer treatment (HIsummer and DIsummer). We applied a linear model for the change in height caused by the spring treatment:
IHspring = β0 + β1 Hspring + β2TRspring
For the modeling of the change in height caused by the summer treatment (IHsummer), the same model structure was applied with Hsummer and TRfull. For the changes in diameter (DIspring and DIsummer), the initial heights were replaced by initial diameters (Dspring and Dsummer).
3. Results
3.1. Spring Treatment: Drought Symptoms, Recovery and Relative Chlorophyll Content
In the spring treatment, the reduction in weight of the pots demonstrated the water scarcity experienced by the saplings (Figure 2a). In the group of saplings that had experienced drought, saplings for which more than half of the leaves had desiccated (categories 51%–75%, 76%–95% and 96%–100%) resprouted significantly more after the drought in comparison to the saplings without leaf desiccation due to the drought (Figure 2b, Table S5). The categories of 51%–75%, 76%–95% and 96%–100% post-drought desiccated leaves are grouped and designated as D>50, whereas the categories of 0% and 1%–50% desiccated leaves are grouped and designated as D<50.
The relative chlorophyll content increased less or diminished in the saplings of the drought group of the spring treatment when compared to the controls (significant interaction terms between the date, i.e., July 4, and treatment groups are shown in Table S6, Figure 3). Later on in July, the relative chlorophyll content in the saplings with more than half of their leaves desiccated due to the drought (D>50) diminished relatively quickly (significant interaction terms between the date, i.e., July 18, and treatment groups are shown in Table S6, Figure 3). The noticeably different reaction of the relative chlorophyll content in the leaves of the D<50 and D>50 groups further justified the division of the group that experienced spring drought in the two subgroups, i.e., with more or less than half of their leaves desiccated due to the drought.
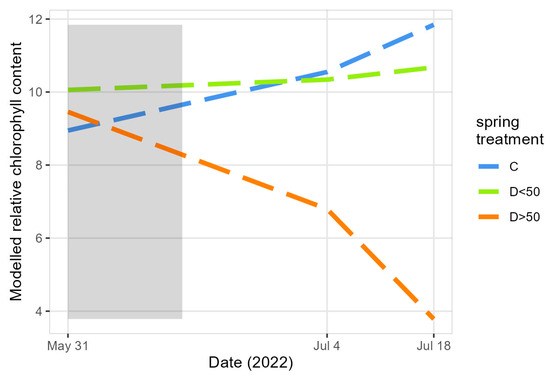
Figure 3.
The modeled relative chlorophyll content in the leaves of the saplings at the beginning (May 31) and after (July 4 and 18) the spring treatment. C: controls and D: drought group with less (D<50) or more (D>50) than half of their leaves desiccated due to the spring drought. The spring drought treatment period is indicated in grey.
3.2. Summer Treatment: Drought Symptoms, Recovery and Relative Chlorophyll Content
The weight loss of the pots during the summer treatment demonstrated the water scarcity experienced by the saplings (Figure 4). The pot’s weight showed variability that could be related to the spring treatment. The pots of saplings with more than half of their leaves desiccated due to the spring drought (D>50-D) lost weight less quickly than the pots of saplings with less than half of their leaves desiccated (D<50-D) and the control plots of the spring treatment (C-D). On August 22 (the first saplings were taken out of the drought to avoid mortality on August 24), the mean relative weight loss of the pots in the D>50-D treatment was 30.8% ± 5.3%, which was significantly higher than the relative weight loss of the pots in the D<50-D (53.9% ± 5.4%) or C-D (60.5% ± 5.6%) treatment groups.
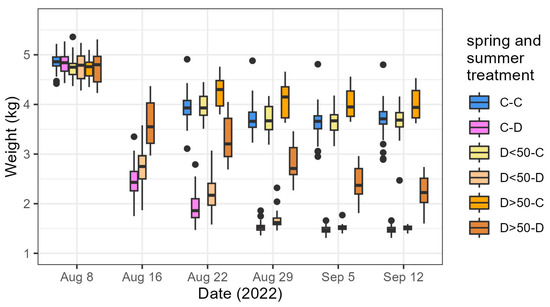
Figure 4.
Box plot presenting weight of the pots during the summer drought treatment for the six different combinations of the two consecutive treatments, i.e., C-C: control–control, C-D: control–drought, D<50-C and D<50-D: less than half of leaves desiccated due to the spring drought followed by control or drought, D>50-C and D>50-D: more than half of leaves desiccated due to the spring drought followed by control or drought.
The control–drought saplings (C-D) and the drought–drought saplings with less than half of their leaves desiccated due to the spring drought (D<50-D) developed symptoms before the end of the summer treatment (Figure S1 and Figure 5). The difference in the onset of visual drought symptoms between C-D and D<50-D was significant (Table S7), with the D<50-D group displaying visual drought symptoms 3.3 days later. The saplings on which more than half of the leaves had desiccated due to the spring drought, as well as those in the drought group of the summer treatment, did not display any drought symptoms by the end of the summer treatment (D>50-D in Figure 5). Therefore, it could be deduced that the onset of visual drought symptoms in this group would have taken place more than 17 days later than in the C-D group.

Figure 5.
Development of visual drought symptoms during the summer drought treatment for the saplings that were in the control group (C-D) during the spring treatment and in the drought group with less (D<50-D) or more (D>50-D) than half of their leaves desiccated due to the spring drought.
3.3. Timing of Autumnal Leaf Senescence
The timing of leaf senescence was studied based on two methods: measurements of relative chlorophyll content in the leaves and visual observations of leaf decoloration. When comparing the relative chlorophyll content before and after the summer drought period, the two groups of saplings with more than half of their leaves desiccated due to the spring drought (D>50-C and D>50-D) showed a rise in relative chlorophyll content whereas the control–control group showed a decline (significant interaction terms between the date, i.e., September 26, and treatment groups are shown in Table S6, Figure 6). When looking at the change in relative chlorophyll content after the summer treatment, the saplings that had more than half of their leaves desiccated due to the spring drought (D>50-C and D>50-D) displayed a diminishment that was less steep in comparison to the C-C group (significant interaction terms between the date, i.e., October 24, and treatment groups are shown in Table S6, Figure 6).
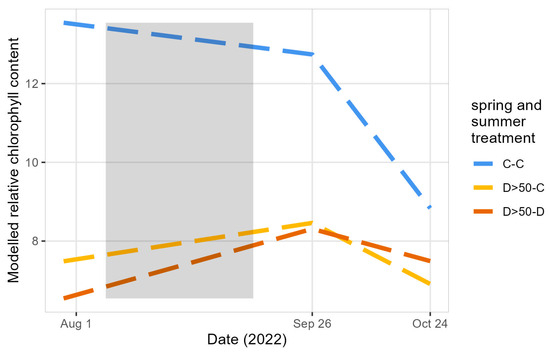
Figure 6.
The modeled relative chlorophyll content in the leaves of the saplings before (August 1) and after (September 26 and October 24) the summer treatment. C: control and D: drought group with D>50: more than half of their leaves desiccated due to the spring drought. The summer drought period is indicated in grey. Only treatment groups significantly differing from C-C are shown.
Among the drought–control saplings, the group with less than half of their leaves desiccated due to the spring drought (D<50-C) decolored 3.3 days earlier than the control–control (C-C) group, while the saplings on which more than half of the leaves had desiccated due to the spring drought decolored 7.6 (D>50-C) and 9.3 (D>50-D) days later (Table S8, Figure 7). It should be noted that the D<50-D group lost the majority or all of their leaves due to the summer drought and did not resprout afterwards, and no relative chlorophyll content measurements nor leaf decoloration observations could be performed on this group of saplings.
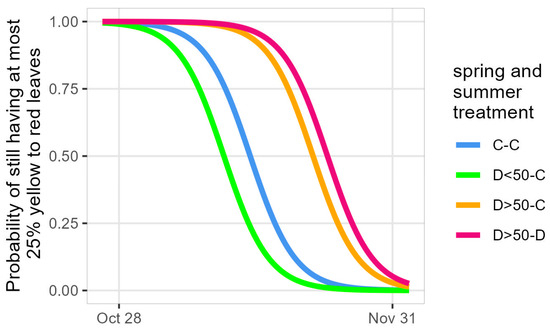
Figure 7.
Modeled timing of autumnal leaf decoloration. C: control and D: drought groups with D<50 and D>50: less and more than half of their leaves desiccated due to the spring drought. Only treatment groups significantly differing from C-C are shown.
3.4. Changes in Height and Diameter
The spring drought caused a smaller height increment between May 23 and August 1 in the group of saplings with less than half of their leaves desiccated due to the spring drought (D<50) compared to the controls (C), while the height of saplings with more than half of their leaves desiccated (D>50) was reduced due of the top parts dying off (Figure 8a, significant treatment groups are shown in Table S9). During the summer drought, we observed no change in height between August 1 and April 25, 2023 in the control–control group (C-C) and several treatment groups (D<50-C, D>50-C and D>50-D) (no significant treatment groups in Table S9), while sapling height decreased in the control–drought group (C-D) and in the drought–drought group with less than half of their leaves desiccated due to the spring drought (D<50-D) due to the top parts dying off (Figure 8b, significant treatment groups are shown in Table S9).
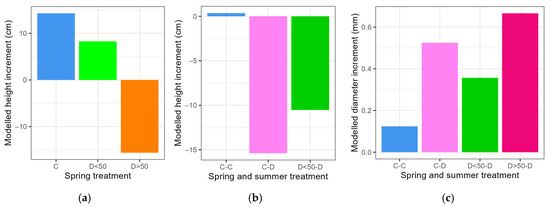
Figure 8.
Modeled sapling height increment for the spring treatment (between May 23 and August 1) (a), for the summer treatment (between August 1 and April 25, 2023) (b) and modeled diameter increment for the summer treatment (between August 1 and December 26) (c). The saplings are in a control (C) or drought (D) group in the spring or spring and summer treatments (separated by a hyphen) and have less or more than half of their leaves desiccated due to the spring drought (D<50 or D>50). Only groups that differed significantly from the control (a) or control–control group (b,c) are shown.
The spring drought did not cause significantly larger or smaller diameter increments (between May 23 and August 1) for the different treatment groups in comparison to the control (no significant treatment groups in Table S9). Interestingly, all the sapling groups that experienced drought in the summer treatment (C-D, D<50-D and D>50-D) displayed a larger diameter increment (between August 1 and December 26) in comparison to the C-C group (Figure 8c, significant treatment groups are shown in Table S9). The modeled diameter increment during the second part of the growing season, i.e., after August 1, was 17% of the diameter increment of the entire growing season for the control saplings (group C-C), 47% for the saplings that only experienced the summer drought (group C-D), 31% for the saplings with less than half of their leaves desiccated after the spring drought and subjected to the summer drought (group D<50-D) and 65% for the saplings that were deeply affected by the spring drought and subjected to the summer drought (D>50-D).
Six out of the seven saplings that were not alive anymore in the spring of 2023 belonged to the control–drought group (C-D). The deceased saplings displayed a larger diameter increment than the C-C group between August 1 and December 26 (Figure S2, significant treatment group in Table S10), similar to the surviving saplings in the C-D group.
3.5. Summary Modeling Results
The extent of leaf desiccation following the spring drought treatment (D<50 vs. D>50) significantly affected subsequent processes, including the likelihood of new shoot formation during the recovery phase, the onset of visual drought symptoms in the summer treatment, changes in relative chlorophyll content throughout the growing season, the timing of autumnal leaf senescence and the occurrence of partial stem dieback and growth reduction (Figure 9). Notably, diameter growth was stimulated by the summer drought treatment, regardless of whether saplings had experienced drought in the spring treatment (Figure 9).
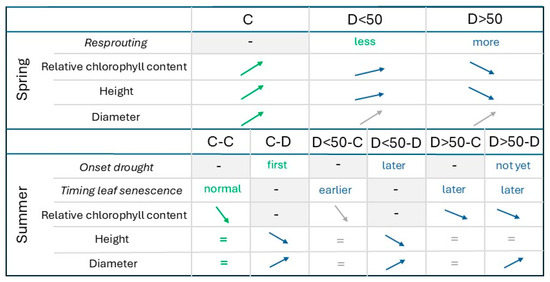
Figure 9.
Schematic representation of the results from the modeling of the response variables for the spring and summer treatments. The saplings were in a control (C) or drought group (D) in the spring treatment or in the combined spring and summer treatment (separated by a hyphen). The spring drought caused less than half or more than half of the leaves to desiccate (D<50 or D>50). Italic: response variable specific to either the spring or summer treatment; grey background: not measured; arrows: increase or decrease; equality sign: no change; green: standard group to which the others are compared; blue: significantly different from the standard group; grey: no significant difference with regard to the standard group.
4. Discussion
Leaf wilting and shedding are commonly observed responses of F. sylvatica to water shortage during the growing season [16,32]. In our experiment, the wilting and curling of the first leaves indicated the onset of a rapid progression towards wilting in the majority of sapling leaves, as evident in the spring and summer drought treatments.
4.1. Post-Drought Resprouting
The phenomenon of post-drought resprouting has been well-documented across various woody species [20,24]. Resprouting, whether after drought or fire, appears to be influenced more by the severity of the stress rather than by the type of stress [17,18,20]. In our experiment, we observed a correlation between the formation of new shoots in saplings following the spring drought and the degree of leaf loss due to desiccation. Saplings with more than half of their leaves desiccated exhibited significantly higher rates of resprouting. Interestingly, in the recovery phase after the summer drought treatment, we observed no resprouting. This underscores that a sapling’s resprouting capability not only hinges on the severity of drought stress but also on the timing of the drought within the growing season.
Priming, i.e., the process by which a phenotype adapts to environmental pressures, instigates stress memory, which enhances a plant’s response to future stress [33,34]. Mild drought stress typically prompts reversible stomatal closure and osmotic regulation without significantly impacting growth or other essential processes [18], whereas intense drought stress, triggering active repair mechanisms and profound metabolic changes, can serve as a priming event, leading to stress memory [17,18]. In our experiment, losing less than half of their foliage to desiccation due to the spring drought may be categorized as mild stress, although it still resulted in a few days’ delay in the onset of visual drought symptoms during the summer drought compared to the control–drought group (i.e., D<50-D vs. C-D). Losing more than half of their foliage due to the spring drought caused a delay in symptom onset that was at least five times longer during the summer drought (D>50-D vs. C-D). The ability to withstand the summer drought hence depended on the level of stress experienced in the spring drought. It can be hypothesized that saplings with extensive post-drought leaf desiccation in spring (D>50) achieved stomatal closure during the summer drought earlier than the saplings that were in the control group during the spring treatment (C-D). Previous studies on beech saplings have indicated that stomatal conductance remains reduced following severe drought, thereby enhancing intrinsic water use efficiency [35].
4.2. Timing of Autumnal Leaf Senescence
Following the summer treatment, the relative chlorophyll content in saplings with more than half of their leaves desiccated due to the spring drought (D>50-C and D>50-D) remained lower than in the double control group (C-C). As these saplings resprouted, newly formed leaves most probably did not have sufficient time to develop higher levels of chlorophyll content. However, the rate of decrease in chlorophyll content was significantly slower in these saplings compared to the double control group. This trend continued in autumnal leaf decoloration. Saplings heavily impacted by the spring drought (D>50-C and D>50-D) exhibited delayed autumnal leaf senescence. This post-drought delay in leaf senescence has already been documented in F. sylvatica [21,22], as well as in other species such as Quercus petraea (Matt.) Liebl. and Frangula alnus Mill. [30,36]. Delayed leaf senescence may prolong photosynthesis, potentially compensating for carbon losses caused by drought and aiding in a plant’s recovery [22]. In contrast, saplings in which less than half of the leaves desiccated due to the spring drought and which were in the control group during the summer treatment (D<50-C) exhibited significantly earlier leaf decoloration compared to saplings that experienced no drought (C-C). Both earlier and later timing of autumnal leaf senescence in the same experiment has already been documented in a controlled drought experiment on Cornus sanguinea L. [24]. In the study, C. sanguinea saplings with minimal to no visual drought symptoms exhibited earlier senescence compared to control saplings. Conversely, saplings displaying pronounced visual symptoms experienced a delayed senescence, while those with intermediate symptoms did not show any significant deviation from the control group. These contrasting trajectories of post-drought leaf senescence, observed in our experiment with F. sylvatica, corroborate the findings in the C. sanguinea study. It was already hypothesized that these observations may concern a trade-off between risk-minimizing acclimation (resulting in earlier senescence) and life-saving repair of drought-induced injuries (leading to later senescence) [18].
4.3. Drought Affects Sapling Size
The extent of leaf desiccation resulting from the spring drought had a significant impact on sapling height. Those with more than half of their leaves desiccated (D>50) were shorter after the spring drought due to the loss of the upper parts of their stems. The summer treatment impacted the height of the saplings in the D<50-D and C-D groups, similarly resulting in reduced height. Partial crown dieback following drought is common in adult F. sylvatica trees [16]. More interestingly, all saplings subjected to drought during the summer treatment (C-D, D<50-D and D>50-D) displayed a higher diameter increment in the later part of the growing season, from before the summer treatment until the season’s end, compared to the control group (C-C). In climatologically normal years, adult F. sylvatica tress typically exhibit peak radial growth around the end of May or the beginning of June [37]. By the end of June, these trees have completed approximately three-quarters of their annual radial growth [38]. Cambial cell divisions typically cease by the end of July or mid-August [38,39]. It can be hypothesized that in our experiment, the late-season radial growth represented a specific response to hydraulic impairment. Research has suggested that the primary response to hydraulic impairment in trees is the regeneration of the xylem through active vascular cambium [40] and not the refilling of embolized conduits [4]. Interestingly, the six saplings from the C-D group that did not survive the experiment also exhibited late-season radial growth, suggesting that they did not die from hydraulic impairment caused by the summer drought but rather from carbon starvation resulting from the demands of the post-drought radial growth repair [41].
5. Conclusions
The timing of the drought events within the growing season significantly influenced the recovery through resprouting, growth and the timing of autumnal leaf senescence in F. sylvatica saplings. Our results suggest stress memory, particularly when saplings experienced significant foliage loss due to spring drought. Earlier leaf senescence (e.g., 3 days earlier for a group of saplings that experienced spring drought) can be viewed as an acclimation strategy aimed at preventing impairments from putative new drought events. Delayed leaf senescence (e.g., 7 days later and longer for different groups of drought-treated saplings) likely provided essential time for recovery from drought-induced damage. This result likely reflects a trade-off between minimizing risks and prioritizing necessary life-saving repair processes. Saplings subjected to summer drought did not resprout but formed additional secondary xylem: they performed up to 65% of their diameter increment in the second part of the growing season compared to 17% for the control plants. Our findings contribute to a deeper understanding of forest responses to the anticipated increase in drought frequency.
Supplementary Materials
The following supporting information can be downloaded at: https://www.mdpi.com/article/10.3390/f16010005/s1, Figure S1: Timing and number of saplings that were taken out of the summer drought treatment and were rewatered, according to the spring and summer treatments. C-D: control–drought; D<50-D and D>50-D: drought–drought with plants with less and more than half of their leaves desiccated due to the spring drought; Figure S2: Boxplot for the diameter increment between August 1 and December 26, according to both treatments and whether plants survived the subsequent winter or not. C-C: control–control; C-D: control–drought; D-C: drought–control; D-D: drought–drought; Table S1: The ten provenances of Fagus sylvatica (l = local, nl = non-local) with the number of saplings (n); Table S2: Spring treatment. Number of saplings in the treatment groups (control and drought) and only for the droughted saplings: rewatered two days early (June 13), one day early (June 14) and on the last day of the treatment. Provenance codes in Table S1; Table S3: Summer treatment. Number of saplings in the treatment groups, with C control and D drought during the spring and summer drought treatments. Provenance codes in Table S1; Table S4: Summer treatment. Number of saplings rewatered two to nineteen days before the end of the treatment (September 12) in the control–drought group (C-D) and in the drought–drought group, in which the saplings showed less than 50% leaf desiccation due to the spring drought (D<50-D). All saplings of the drought–drought group with more than 50% leaf desiccation were rewatered on September 12. Provenance codes in Table S1; Table S5: Test statistics for the modeling of resprouting after the spring treatment (only droughted plants). A leaf desiccation (DES) score of 1 (no leaves desiccated) is the standard to which the other scores are compared. Hspring is the initial height on May 23; Table S6: Test statistics for the modeling of the relative chlorophyll content at the spring and summer treatments. The controls in the spring (C) and summer (C-C) treatments are the standard to which the other groups are compared, with D<50 being the droughted plants with less than half of their leaves desiccated due to the spring drought and D>50 being those with more than half. Hspring and Hsummer are the initial heights for the spring and summer treatments. For the time variable in the spring treatment, May 23 is the standard to which July 4 and July 18 are compared. For the time variable in the summer treatment, August 1 is the standard to which September 26 and October 24 are compared; Table S7: Test statistics for the modeling of the onset of visual drought symptoms in the summer treatment. Control–drought (C-D) is the standard to which the group of saplings with less than half of their leaves desiccated due to the spring drought (D<50-D) is compared. DAY is the day of observation, Hsummer is the initial height on August 1; Table S8: Test statistics for the modeling of the timing of autumnal leaf decoloration. The control–control group is the standard to which the other treatment groups are compared. The two succeeding treatments are coded with C as control, D as drought, D<50 as drought with less than half of the leaves desiccated due to the spring drought and D>50 as more than half. DAY is the day of observation; Table S9: Test statistics for the modeling of height and diameter increments for the spring and summer treatments. The controls in the spring (C) and summer (C-C) treatments are the standard to which the other treatment groups are compared, with D<50 being the droughted saplings with less than half of their leaves desiccated due to the spring drought and D>50 being those with more than half. Hspring and Hsummer are the initial heights on May 23 and August 1, respectively, in the height increment models, and Dspring and Dsummer are the initial diameters on May 23 and August 1, respectively, in the diameter increment models; Table S10: Test statistics for the modeling of the diameter increment for the summer treatment. Included are the control–control (C-C), surviving saplings in the control–drought (C-Ds) and deceased saplings in the control–drought (C-Dd) groups. The C-C group is the standard to which the other groups are compared. Dsummer is the initial diameter on August 1.
Author Contributions
Conceptualization, K.V.M., S.M., L.D.K., A.T. and M.V.; methodology, K.V.M., M.B., S.M., E.N.P., K.V., L.D.K., A.T., S.V. and M.V.; formal analysis, K.V.M., M.B. and M.V.; investigation, K.V.M., M.B., S.M., E.N.P., K.V. and S.V.; data curation, K.V.M. and M.B.; writing—original draft preparation, K.V.M. and M.B.; writing—review and editing, K.V.M., M.B., E.N.P., K.V., L.D.K., A.T., S.V. and M.V.; supervision, K.V.M. and M.V. All authors have read and agreed to the published version of the manuscript.
Funding
This research received no external funding.
Data Availability Statement
The dataset for this study is available at https://doi.org/10.5281/zenodo.10912281 (accessed on 3 April 2024).
Acknowledgments
We extend our gratitude to Marc Schouppe and Nico De Regge for their diligent care of the saplings, as well as to the Research Institute for Agriculture and Fisheries in Melle (Belgium) for providing essential infrastructure support. Special thanks also for Samuel Van de Walle for his invaluable assistance with data collection during the spring drought treatment, Tom Huysmans for his support during the summer drought treatment and Milan Van Reybrouck and Joren Dierckxsens for helping with the measurements.
Conflicts of Interest
The authors declare no conflicts of interest.
References
- Pan, Y.; Birdsey, R.A.; Fang, J.; Houghton, R.; Kauppi, P.E.; Kurz, W.A.; Phillips, O.L.; Shvidenko, A.; Lewis, S.L.; Canadell, J.G.; et al. A Large and Persistent Carbon Sink in the World’s Forests. Science 2011, 333, 988–993. [Google Scholar] [CrossRef] [PubMed]
- Bonan, G.B. Forests and climate change: Forcings, feedbacks, and the climate benefits of forests. Science 2008, 320, 1444–1449. [Google Scholar] [CrossRef]
- Reichstein, M.; Bahn, M.; Ciais, P.; Frank, D.; Mahecha, M.D.; Seneviratne, S.I.; Zscheischler, J.; Beer, C.; Buchmann, N.; Frank, D.C.; et al. Climate extremes and the carbon cycle. Nature 2013, 500, 287–295. [Google Scholar] [CrossRef] [PubMed]
- Choat, B.; Brodribb, T.J.; Brodersen, C.R.; Duursma, R.A.; López, R.; Medlyn, B.E. Triggers of tree mortality under drought. Nature 2018, 558, 531–539. [Google Scholar] [CrossRef]
- Trenberth, K.E.; Dai, A.; van der Schrier, G.; Jones, P.D.; Barichivich, J.; Briffa, K.R.; Sheffield, J. Global warming and changes in drought. Nat. Clim. Change 2014, 4, 17–22. [Google Scholar] [CrossRef]
- Munne-Bosch, S.; Alegre, L. Die and let live: Leaf senescence contributes to plant survival under drought stress. Funct. Plant Biol. 2004, 31, 203–216. [Google Scholar] [CrossRef] [PubMed]
- Martin-StPaul, N.; Delzon, S.; Cochard, H. Plant resistance to drought depends on timely stomatal closure. Ecol. Lett. 2017, 20, 1437–1447. [Google Scholar] [CrossRef] [PubMed]
- Blackman, C.J.; Creek, D.; Maier, C.; Aspinwall, M.J.; Drake, J.E.; Pfautsch, S.; O’Grady, A.; Delzon, S.; Medlyn, B.E.; Tissue, D.T.; et al. Drought response strategies and hydraulic traits contribute to mechanistic understanding of plant dry-down to hydraulic failure. Tree Physiol. 2019, 39, 910–924. [Google Scholar] [CrossRef] [PubMed]
- Blackman, C.J.; Brodribb, T.J.; Jordan, G.J. Leaf hydraulics and drought stress: Response, recovery and survivorship in four woody temperate plant species. Plant Cell Environ. 2009, 32, 1584–1595. [Google Scholar] [CrossRef]
- Cardoso, A.A.; Batz, T.A.; McAdam, S.A.M. Xylem Embolism Resistance Determines Leaf Mortality during Drought in Persea americana. Plant Physiol. 2020, 182, 547–554. [Google Scholar] [CrossRef]
- Hochberg, U.; Windt, C.W.; Ponomarenko, A.; Zhang, Y.-J.; Gersony, J.; Rockwell, F.E.; Holbrook, N.M. Stomatal Closure, Basal Leaf Embolism, and Shedding Protect the Hydraulic Integrity of Grape Stems. Plant Physiol. 2017, 174, 764–775. [Google Scholar] [CrossRef] [PubMed]
- Wolfe, B.T.; Sperry, J.S.; Kursar, T.A. Does leaf shedding protect stems from cavitation during seasonal droughts? A test of the hydraulic fuse hypothesis. New Phytol. 2016, 212, 1007–1018. [Google Scholar] [CrossRef] [PubMed]
- Vilagrosa, A.; Bellot, J.; Vallejo, V.R.; Gil-Pelegrin, E. Cavitation, stomatal conductance, and leaf dieback in seedlings of two co-occurring Mediterranean shrubs during an intense drought. J. Exp. Bot. 2003, 54, 2015–2024. [Google Scholar] [CrossRef] [PubMed]
- Schuldt, B.; Buras, A.; Arend, M.; Vitasse, Y.; Beierkuhnlein, C.; Damm, A.; Gharun, M.; Grams, T.E.E.; Hauck, M.; Hajek, P.; et al. A first assessment of the impact of the extreme 2018 summer drought on Central European forests. Basic Appl. Ecol. 2020, 45, 86–103. [Google Scholar] [CrossRef]
- Marchin, R.; Zeng, H.; Hoffmann, W. Drought-deciduous behavior reduces nutrient losses from temperate deciduous trees under severe drought. Oecologia 2010, 163, 845–854. [Google Scholar] [CrossRef] [PubMed]
- Walthert, L.; Ganthaler, A.; Mayr, S.; Saurer, M.; Waldner, P.; Walser, M.; Zweifel, R.; von Arx, G. From the comfort zone to crown dieback: Sequence of physiological stress thresholds in mature European beech trees across progressive drought. Sci. Total Environ. 2021, 753, 141792. [Google Scholar] [CrossRef] [PubMed]
- Ruehr, N.K.; Grote, R.; Mayr, S.; Arneth, A. Beyond the extreme: Recovery of carbon and water relations in woody plants following heat and drought stress. Tree Physiol 2019, 39, 1285–1299. [Google Scholar] [CrossRef] [PubMed]
- Gessler, A.; Bottero, A.; Marshall, J.; Arend, M. The way back: Recovery of trees from drought and its implication for acclimation. New Phytol. 2020, 228, 1704–1709. [Google Scholar] [CrossRef] [PubMed]
- Ingrisch, J.; Bahn, M. Towards a Comparable Quantification of Resilience. Trends Ecol. Evol. 2018, 33, 251–259. [Google Scholar] [CrossRef]
- Zeppel, M.J.B.; Harrison, S.P.; Adams, H.D.; Kelley, D.I.; Li, G.; Tissue, D.T.; Dawson, T.E.; Fensham, R.; Medlyn, B.E.; Palmer, A.; et al. Drought and resprouting plants. New Phytol. 2015, 206, 583–589. [Google Scholar] [CrossRef] [PubMed]
- Arend, M.; Sever, K.; Pflug, E.; Gessler, A.; Schaub, M. Seasonal photosynthetic response of European beech to severe summer drought: Limitation, recovery and post-drought stimulation. Agric. For. Meteorol. 2016, 220, 83–89. [Google Scholar] [CrossRef]
- Pflug, E.E.; Buchmann, N.; Siegwolf, R.T.W.; Schaub, M.; Rigling, A.; Arend, M. Resilient Leaf Physiological Response of European Beech (Fagus sylvatica L.) to Summer Drought and Drought Release. Front. Plant Sci. 2018, 9, 187. [Google Scholar] [CrossRef] [PubMed]
- Vander Mijnsbrugge, K.; Malanguis, J.M.; Moreels, S.; Lauwers, A.; Thomaes, A.; De Keersmaeker, L.; Vandekerkhove, K. Growth Recovery and Phenological Responses of Juvenile Beech (Fagus sylvatica L.) Exposed to Spring Warming and Late Spring Frost. Forests 2021, 12, 1604. [Google Scholar] [CrossRef]
- Vander Mijnsbrugge, K.; Vandepitte, J.; Moreels, S.; Mihaila, V.-V.; De Ligne, L.; Notivol, E.; Van Acker, J.; Van den Bulcke, J. Timing of autumnal leaf senescence in a common shrub species depends on the level of preceding summer drought symptoms. Environ. Exp. Bot. 2023, 216, 105539. [Google Scholar] [CrossRef]
- R_Core_Team. R: A Language and Environment for Statistical Computing; R Foundation for Statistical Computing: Vienna, Austria, 2022. [Google Scholar]
- Bates, D.; Machler, M.; Bolker, B.M.; Walker, S.C. Fitting Linear Mixed-Effects Models Using lme4. J. Stat. Softw. 2015, 67, 1–48. [Google Scholar] [CrossRef]
- Christensen, R.H.B. Ordinal: Regression Models for Ordinal Data. R Package Version 2015.6-28. 2015. Available online: http://www.cran.r-project.org/package=ordinal/ (accessed on 12 April 2018).
- Wickham, H. ggplot2: Elegant Graphics for Data Analysis; Springer: New York, NY, USA, 2016. [Google Scholar]
- Zuur, A.; Ieno, E.; Walker, N.; Saveliev, A.; Smith, G. Mixed Effects Models and Extensions in Ecology with R; Springer: New York, NY, USA, 2009. [Google Scholar]
- Vander Mijnsbrugge, K.; Turcsan, A.; Maes, J.; Duchene, N.; Meeus, S.; Steppe, K.; Steenackers, M. Repeated Summer Drought and Re-watering during the First Growing Year of Oak (Quercus petraea) Delay Autumn Senescence and Bud Burst in the Following Spring. Front. Plant Sci. 2016, 7, 419. [Google Scholar] [CrossRef] [PubMed]
- Mariën, B.; Dox, I.; De Boeck, H.J.; Willems, P.; Leys, S.; Papadimitriou, D.; Campioli, M. Does drought advance the onset of autumn leaf senescence in temperate deciduous forest trees? Biogeosciences 2021, 18, 3309–3330. [Google Scholar] [CrossRef]
- Leuschner, C. Drought response of European beech (Fagus sylvatica L.)—A review. Perspect. Plant Ecol. Evol. Syst. 2020, 47, 125576. [Google Scholar] [CrossRef]
- Hilker, M.; Schmülling, T. Stress priming, memory, and signalling in plants. Plant Cell Environ. 2019, 42, 753–761. [Google Scholar] [CrossRef]
- Walter, J.; Jentsch, A.; Beierkuhnlein, C.; Kreyling, J. Ecological stress memory and cross stress tolerance in plants in the face of climate extremes. Environ. Exp. Bot. 2013, 94, 3–8. [Google Scholar] [CrossRef]
- Gallé, A.; Feller, U. Changes of photosynthetic traits in beech saplings (Fagus sylvatica) under severe drought stress and during recovery. Physiol. Plant. 2007, 131, 412–421. [Google Scholar] [CrossRef] [PubMed]
- Vander Mijnsbrugge, K.; De Clerck, L.; Van der Schueren, N.; Moreels, S.; Lauwers, A.; Steppe, K.; De Ligne, L.; Campioli, M.; Van den Bulcke, J. Counter-Intuitive Response to Water Limitation in a Southern European Provenance of Frangula alnus Mill. in a Common Garden Experiment. Forests 2020, 11, 1186. [Google Scholar] [CrossRef]
- Puchalka, R.; Prislan, P.; Klisz, M.; Koprowski, M.; Gricar, J. Tree-ring formation dynamics in Fagus sylvatica and Quercus petraea in a dry and a wet year. Dendrobiology 2024, 91, 1–15. [Google Scholar] [CrossRef]
- Čufar, K.; Prislan, P.; de Luis, M.; Gričar, J. Tree-ring variation, wood formation and phenology of beech (Fagus sylvatica) from a representative site in Slovenia, SE Central Europe. Trees 2008, 22, 749–758. [Google Scholar] [CrossRef]
- Martinez del Castillo, E.; Longares, L.A.; Gričar, J.; Prislan, P.; Gil-Pelegrín, E.; Čufar, K.; de Luis, M. Living on the Edge: Contrasted Wood-Formation Dynamics in Fagus sylvatica and Pinus sylvestris under Mediterranean Conditions. Front. Plant Sci. 2016, 7, 370. [Google Scholar] [CrossRef] [PubMed]
- Brodribb, T.J.; Bowman, D.J.; Nichols, S.; Delzon, S.; Burlett, R. Xylem function and growth rate interact to determine recovery rates after exposure to extreme water deficit. New Phytol. 2010, 188, 533–542. [Google Scholar] [CrossRef]
- Trugman, A.T.; Detto, M.; Bartlett, M.K.; Medvigy, D.; Anderegg, W.R.L.; Schwalm, C.; Schaffer, B.; Pacala, S.W. Tree carbon allocation explains forest drought-kill and recovery patterns. Ecol. Lett. 2018, 21, 1552–1560. [Google Scholar] [CrossRef]
Disclaimer/Publisher’s Note: The statements, opinions and data contained in all publications are solely those of the individual author(s) and contributor(s) and not of MDPI and/or the editor(s). MDPI and/or the editor(s) disclaim responsibility for any injury to people or property resulting from any ideas, methods, instructions or products referred to in the content. |
© 2024 by the authors. Licensee MDPI, Basel, Switzerland. This article is an open access article distributed under the terms and conditions of the Creative Commons Attribution (CC BY) license (https://creativecommons.org/licenses/by/4.0/).