Article

Quantitative Impacts of Socio-Economic Changes on REDD+ Benefits in Xishuangbanna Rainforests

1
Department of Geography, Sustainability, Community, and Urban Studies, University of Connecticut, Storrs, CT 06269-4148, USA
2
Faculty of Geographical Science and Engineering, College of Geographical Sciences, Henan University, Zhengzhou 450046, China
3
Laboratory of Climate Change Mitigation and Carbon Neutrality, Henan University, Zhengzhou 450046, China
4
Henan Dabieshan National Field Observation and Research Station of Forest Ecosystem, Zhengzhou 450046, China
5
Xinyang Academy of Ecological Research, Xinyang 464000, China
6
Henan Key Laboratory of Earth System Observation and Modeling, Kaifeng 475004, China
7
Department of Geography, University of the Aegean, 81132 Mytilene, Greece
*
Author to whom correspondence should be addressed.
Forests 2025, 16(1), 120; https://doi.org/10.3390/f16010120
Submission received: 27 November 2024 / Revised: 7 January 2025 / Accepted: 9 January 2025 / Published: 10 January 2025

Abstract

:
REDD+ is a UN-backed framework aimed at reducing carbon emissions in developing countries through sustainable forest management and the protection and enhancement of forest carbon stocks. These are key goals for the international community to achieve climate change mitigation through forestry. REDD+ programs deliver carbon, environmentally based, and social benefits through incentives provided to local societies. This study focuses on a quantitative assessment of the REDD+ framework from the perspective of localized socio-economic shifts. The drivers–pressures–state–impact and partial least squares–structural equation models were employed to evaluate impacts of socio-economic change on multiple REDD+ benefits and their influential factors in the tropical rainforests of Xishuangbanna, China. The results revealed that land-use changes form essential and complex links between socio-economic and eco-environmental changes. Socio-economic shifts in the recent twenty years in Xishuangbanna impacted carbon emissions mainly through land-use change (impact coefficient = 0.909), which was nearly three times the impact of land-use change on environmental degradation (0.322) and more than twice its impact on social benefits (0.363). Such unbalanced impacts suggest a need to optimize local policies through contextualized measures in a way that effectively addresses livelihood improvements, enhancing carbon storage and environmental services to achieve REDD+ targets in the tropical rainforests of China.

1. Introduction

Forest carbon sinks are not only effective in reducing CO2 emissions but are also less costly to maintain compared to implementing carbon reduction strategies [1,2]. Among the various forest ecosystems, tropical rainforests are undoubtedly the most important ecosystems for carbon sequestration. However, severe deforestation and forest degradation can result in carbon loss far exceeding carbon gain in these rainforests, resulting in them gradually becoming a source of net carbon loss [3,4,5]. This dynamic is particularly evident in tropical forests like the Amazon, where forest fires play a critical role in exacerbating carbon stock depletion. Fires not only consume aboveground biomass but also significantly reduce belowground carbon stocks, contributing to increased carbon emissions. Studies have shown that human activities, such as logging, can amplify the severity and spread of forest fires. For instance, Barni et al. highlighted that during the 2015–2016 El Niño, selective logging in the Amazon significantly increased the likelihood of severe fires, leading to substantial carbon stock losses and emissions [6]. Comparative data from such studies underline the interconnectedness of logging, fire dynamics, and carbon emissions, emphasizing the urgent need for integrated land management strategies to mitigate these impacts. Without effective intervention, these processes could undermine the global carbon balance and accelerate climate change [7,8].
Reducing Emissions from Deforestation and forest Degradation (REDD) in developing countries is a program of the United Nations Framework Convention on Climate Change (UNFCCC) that was first discussed in 2005, at the Conference of the Parties 11 (COP 11) in Montreal, and 2007, at the COP 13 in Bali [9,10,11]. The 2009 Copenhagen Climate Conference proposed strengthening sustainable forest management and conservation to enhance forest carbon stocks based on REDD, introducing the REDD+ mechanism [12,13], which was recognized as a key component of the Paris Agreement by the Intergovernmental Panel on Climate Change (IPCC) in Paris in 2015 [14,15]. As a result, REDD+ mechanisms are systematically being developed to protect forests and reduce carbon emissions. REDD+ mitigation policies are based on developed countries providing forest conservation funds as positive incentives to developing countries to cover their opportunity costs and reward their environmental performance; this reduces the deforestation and forest degradation rates and increases forest carbon stocks in developing countries, thereby offsetting the carbon emissions of developed countries [16,17].
REDD+ represents a three-win strategy in terms of the climate, ecology, and economy, with current research on its carbon benefits being prevalent [18,19,20]. In Southeast Asia alone, protecting 58% of the more severely affected forests would prevent 835 million tons of carbon dioxide from being released into the atmosphere annually due to deforestation [21]. Indeed, for three consecutive years, forest carbon storage rose at various elevations and canopy types in Nepal through numerous REDD+ pilot programs [22]. Some scholars believe that non-carbon benefits, such as biodiversity conservation and livelihoods, have a significant impact on the effectiveness of the REDD+ framework, and that planning should consider both carbon and non-carbon benefits [23,24,25]. In terms of ecological benefits, an analysis of remote sensing images of the Indonesian region revealed synergistic effects between carbon loss and forest fragmentation and soil erosion [26], with related studies demonstrating similar scenarios in Africa, southern Brazil, and southwestern China [27,28,29]. Benefits gained from forest ecosystem services are consistently greater in REDD countries [30]. In terms of socio-economic benefits, carbon emission reduction can promote economic development and increase employment and productivity [31]. For instance, REDD+ mechanisms can improve rural livelihoods and employment by paying opportunity costs to landholders that implement sustainable forest management measures [32].
China, as a party to the Kyoto Protocol and the UNFCCC, has committed to achieving peak carbon dioxide emissions by 2030 and reducing emissions to gain carbon neutrality by 2060 [33,34,35], which requires the guidance and support of the REDD+ framework. The Xishuangbanna region contains the most complete tropical rainforest ecosystem in the country, with 16% of its total plant species [36]. Rubber trees were introduced to the Xishuangbanna region in the 1950s and their harvesting reached a commercial scale by the 1980s; such direct economic benefits prompted a massive expansion of rubber plantations, which led to the severe destruction of tropical rainforests [37,38,39]. This expansion was driven not only by economic incentives but also by national policies encouraging cash crop production to boost economic growth and address rural poverty, as well as international market demands for natural rubber [40,41]. The booming global automotive and manufacturing industries significantly increased the demand for natural rubber, further accelerating its cultivation in tropical regions like Xishuangbanna. The cultivation of a single cash crop not only causes ecological issues like severe water and soil loss, reduced rainfall and drought, and reduced river flows [42,43,44,45], but it also poses a serious threat to biodiversity and has a significant impact on carbon emissions [46,47]. Additionally, community-level land-use decisions, influenced by the household responsibility system and farmers’ pursuit of economic gains, further accelerated the expansion of rubber plantations into ecologically sensitive areas, including high-altitude regions and former paddy fields [48]. The Xishuangbanna region has opened the way for the smooth implementation of the REDD+ program in China to serve as a reference for other national regions. By addressing these socio-economic drivers through REDD+ initiatives, the program can mitigate the adverse impacts of land-use changes while promoting sustainable development practices. The multiple benefits of the REDD+ program can also provide a new solution to the human–land conflict in Xishuangbanna, helping the region achieve a win–win situation in terms of climate, ecology, and economy.
The objective of this study was to quantitatively assess the REDD+ framework from the perspective of socio-economic shifts, using the Xishuangbanna tropical rainforest region as the study area and applying the driver–pressure–state–impact (DPSI) model. Socio-economic factors were used as drivers, and REDD+ benefits as influences, and the two were connected through land-use change (state), allowing an analysis of the causal relationship between these three elements in an integrated manner. We applied partial least squares structural equation modeling (PLS-SEM) to quantify the components of the theoretical model, test its applicability, and explore the quantitative links between its different components. Specifically, we attempted to answer the following three questions: (1) How are the driver–pressure–state–impact elements interconnected in the Xishuangbanna region? (2) What role does land use play between socio-economic shifts and REDD+ benefits? (3) What is the quantitative link between socio-economic shifts and REDD+ benefits?

2. Materials and Methods

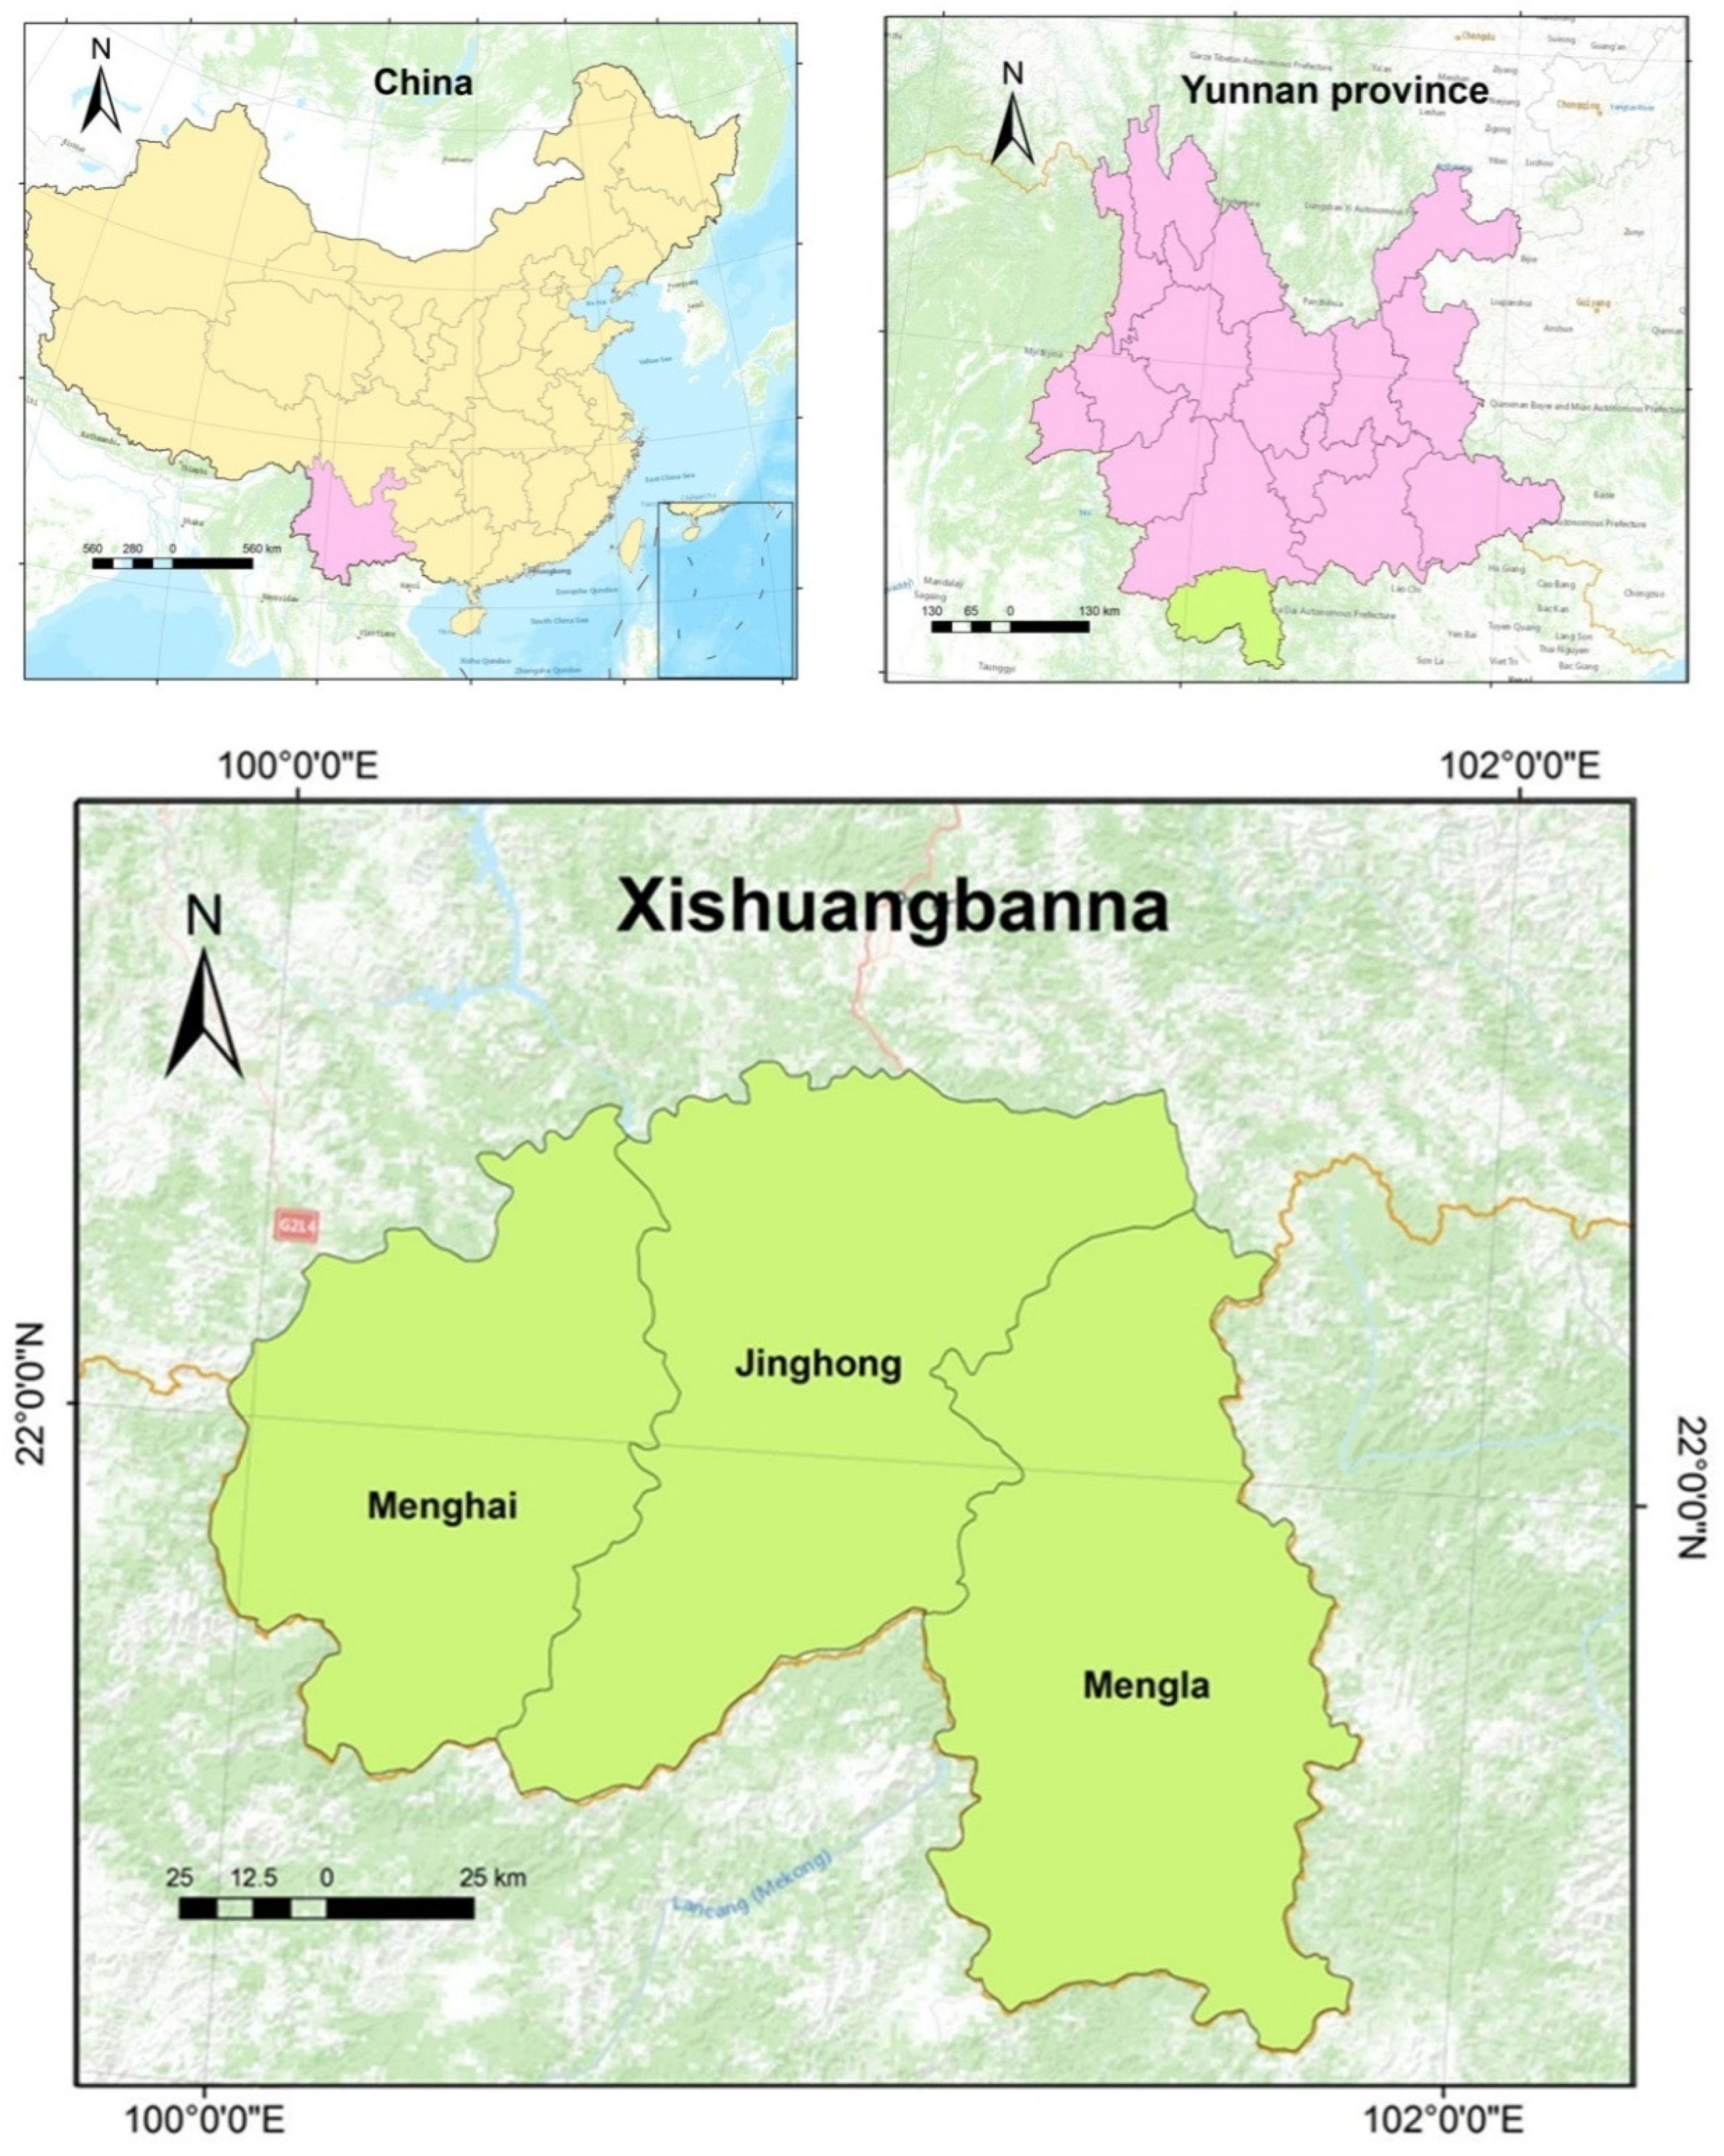
2.1. Study Area and Period

Figure 1 shows the location of the Xishuangbanna Prefecture in the southwestern Yunnan Province of China. The expansion of rubber plantations was very rapid in Xishuangbanna, with the area of rubber land increasing from only 1.25% of the total land area in 1976 to 11.30% by 2003 [49]. Therefore, this study analyzed the 1976–2007 period as the REDD+ baseline, as deforestation and land-use change were at their most severe in the region [38,50]. The plantations established during this period were primarily driven by national policies promoting agricultural expansion and economic crops like rubber. Currently, many of these plantations have reached maturity, with some being actively harvested, while others have undergone cycles of regeneration or have been replaced by secondary forests due to shifts in land-use priorities. The selection of this specific time interval is based on its significance in capturing the peak of deforestation and land conversion activities, which set the stage for current land-use patterns and their associated carbon dynamics. This period provides a critical historical benchmark for understanding the long-term impacts of land-use change and for assessing the potential of REDD+ interventions to mitigate similar challenges in the future.
Land-use changes and the resulting carbon budget in Xishuangbanna were analyzed according to three periods that reflected different national policies. (1) The 1976–1992 stage allowed the uncontrolled development of traditional agriculture during the early years of national reform. Traditional rice culture and farming practices prevailed from a viewpoint of “deforestation to grow food” [51], rubber cultivation was in its infancy, and land use began to change. (2) The 1992–1999 stage introduced a series of rubber planting subsidy policies to meet material and cultural needs and improve social productivity. This resulted in the disorderly and dramatic development of private rubber plantations and concomitant land-use change [52,53]. (3) The 1999–2007 stage represented the construction of ecological and environmental protection policies after the unbridled expansion of rubber caused damage to local ecosystems [54,55]. However, driven by the price of natural rubber, rubber cultivation continued in this period, which exhibited more complex land-use changes.

2.2. Geographical and Land-Use Data

Landsat data were downloaded from the United States Geological Survey website http://www.usgs.gov/ (accessed on 1 November 2023), pre-processed with radiation and atmospheric correction, and then cropped using the Xishuangbanna Administrative Vector Map to obtain a Xishuangbanna image.
Nine land-use types were identified for the Xishuangbanna region and were divided into four land-use zones—(1) natural eco-region zone: forested, shrub, and barren grass land-use types; (2) economic crop zone: rubber and tea land-use types; (3) food crop zone: dry land and paddy field land-use types; and (4) human living zone: construction and other land-use types. Socio-economic data were obtained from the Yunnan Statistical Yearbook and the Xishuangbanna Statistical Yearbook.

2.3. Research Methodology

2.3.1. Land-Use Carbon Budget

The 2019 Refinement to the 2006 IPCC Guidelines for National Greenhouse Gas Inventory states that carbon accounting in ecosystems should include carbon storage in the living biomass (LB) [56], dead organic matter (DOM), and soil organic matter (SOM) carbon storage. The LB consists of aboveground biomass (AB) and belowground biomass (BB); the DOM comprises dead wood (DW) and leaf litter (LI) [57]. This provides a reference for accounting for changes in carbon storage due to land-use changes:
C T = C L B + C D O M + C S O M
where C T (tC) is the total carbon storage in land ecosystems; C L B (tC) is the living biomass carbon storage; C D O M (tC) is the dead organic matter carbon storage; and C S O M (tC) is the soil organic matter carbon storage. We calculated C D O M as follows:
C D O M = C D W + C L I
where C D W (tC) is the dead wood carbon storage; and C L I (tC) is the leaf-litter carbon storage, which has been accounted for by many scholars for carbon density in the Xishuangbanna region [58,59,60].

2.3.2. DPSI Framework and PLS-SEM

Our study uses the DPSI model as a theoretical framework to construct a system of indicators and uses PLE-SEM to reflect the interrelationship between the various components of the DPSI model [61]. Thereby, we can analyze the pathways and mechanisms linking socio-economic shifts, land-use changes, and the multiple benefits of REDD+. As an environmental valuation model, the DPSI framework is based on causality [62,63]. It connotes socio-economic factors as a driving force, of which the development increases pressure on the environmental system, which in turn changes the state of the environmental system itself, which in turn impacts the ecosystems, socio-economic development, and resources. In the DPSI framework, drivers represent the socio-economic factors, such as agricultural expansion, population growth, and international market demand, that instigate pressures on the ecosystem. Pressures refer to the immediate consequences of these drivers, such as deforestation, rubber plantation expansion, and land degradation. The state describes the condition of the ecosystem, including carbon stock reductions and biodiversity losses. Impacts encompass the broader ecological and socio-economic consequences, such as heightened carbon emissions, reduced ecosystem services, and social inequality. REDD+ is designed to address the drivers by incentivizing sustainable land-use practices and reducing pressures through forest protection initiatives. This contributes to improving the ecosystem state by stabilizing carbon stocks and minimizing impacts through enhanced socio-economic resilience. Table 1 aligns the DPSI components with study variables and explains the significance of the indexes. The framework has been widely applied.
PLS-SEM combines a principal component analysis with ordinary least squares regression to construct, estimate, and test causality [64,65]. It is an important tool for analyzing multivariate data and is attractive to many researchers because it has a small sample requirement and does not require data to be normally distributed. PLS-SEM mainly consists of a measurement (Equation (3)) and a structural model (Equation (4)). The measurement model describes the relationship between latent variables and observed variables, and the structural model describes the interrelationships within latent variables:
  X = Λ x ξ + σ Y = Λ y η + ε
where X is an exogenous observed variable; Y is an endogenous observed variable; Λ x is the factor load matrix of exogenous observed variables on exogenous latent variables; Λ y is the factor load matrix of endogenous observed variables on endogenous latent variables; σ is the exogenous latent variable error; ε is the endogenous latent variable error; and η and ξ correspond to endogenous latent variables and exogenous latent variables, respectively, as calculated using
η = B η + r ξ + ζ
where B and r are path coefficients, with B representing the relationship between endogenous latent variables and r representing the influence of exogenous latent variables on endogenous latent variables; ζ is the residual.
Cronbach’s α coefficient is the most commonly used reliability coefficient, mainly used to measure the stability and reliability of experimental results. Usually, this coefficient is between 0 and 1; a value >0.6 indicates that the experiment has an acceptable degree of reliability. The coefficient is calculated as follows:
α = k k 1 1 i = 1 k S i 2 S X 2
where k is the number of indicators; S i corresponds to the variance of the i-th indicator; and S x is the variance of all indicators tested.
The reliability is the proportion of the real score, and the path coefficient that cannot reflect the real score in the observation score is the variation in the measurement error. The observed variable scores for some indicators are affected by potential factors and measurement error, which in turn affects the true score, so Fornell and Larker proposed a composite reliability (CR) coefficient to reduce the error [66]:
C R = λ i 2 λ i 2 + Θ i i
where λ i 2 is the square of the sum of the factor loadings λ; and   Θ i i is the sum of the residual variances of each observed variable Θ . Since the measurement model with residual correlation has an impact on the path coefficient, it is necessary to include the residual correlation in the calculation of CR as follows:
C R = λ i 2 λ i 2 + Θ i i + 2 Θ i j
where Θ i j is the sum of the residual covariances of the i-th and j-th indicators.
The higher the factor loading of the indicator of interest, the higher the ability of the indicator to reflect latent variables and the greater the degree of variation in the observed variables it explains. The average variance extracted (AVE) is then used to indicate the degree of convergence of the indicator, i.e., to determine whether a set of observed variables can effectively estimate latent variables:
A V E = λ i 2 λ i 2 + Θ i i
where λ i 2 is the sum of the squared factor loadings.

3. Results and Analysis

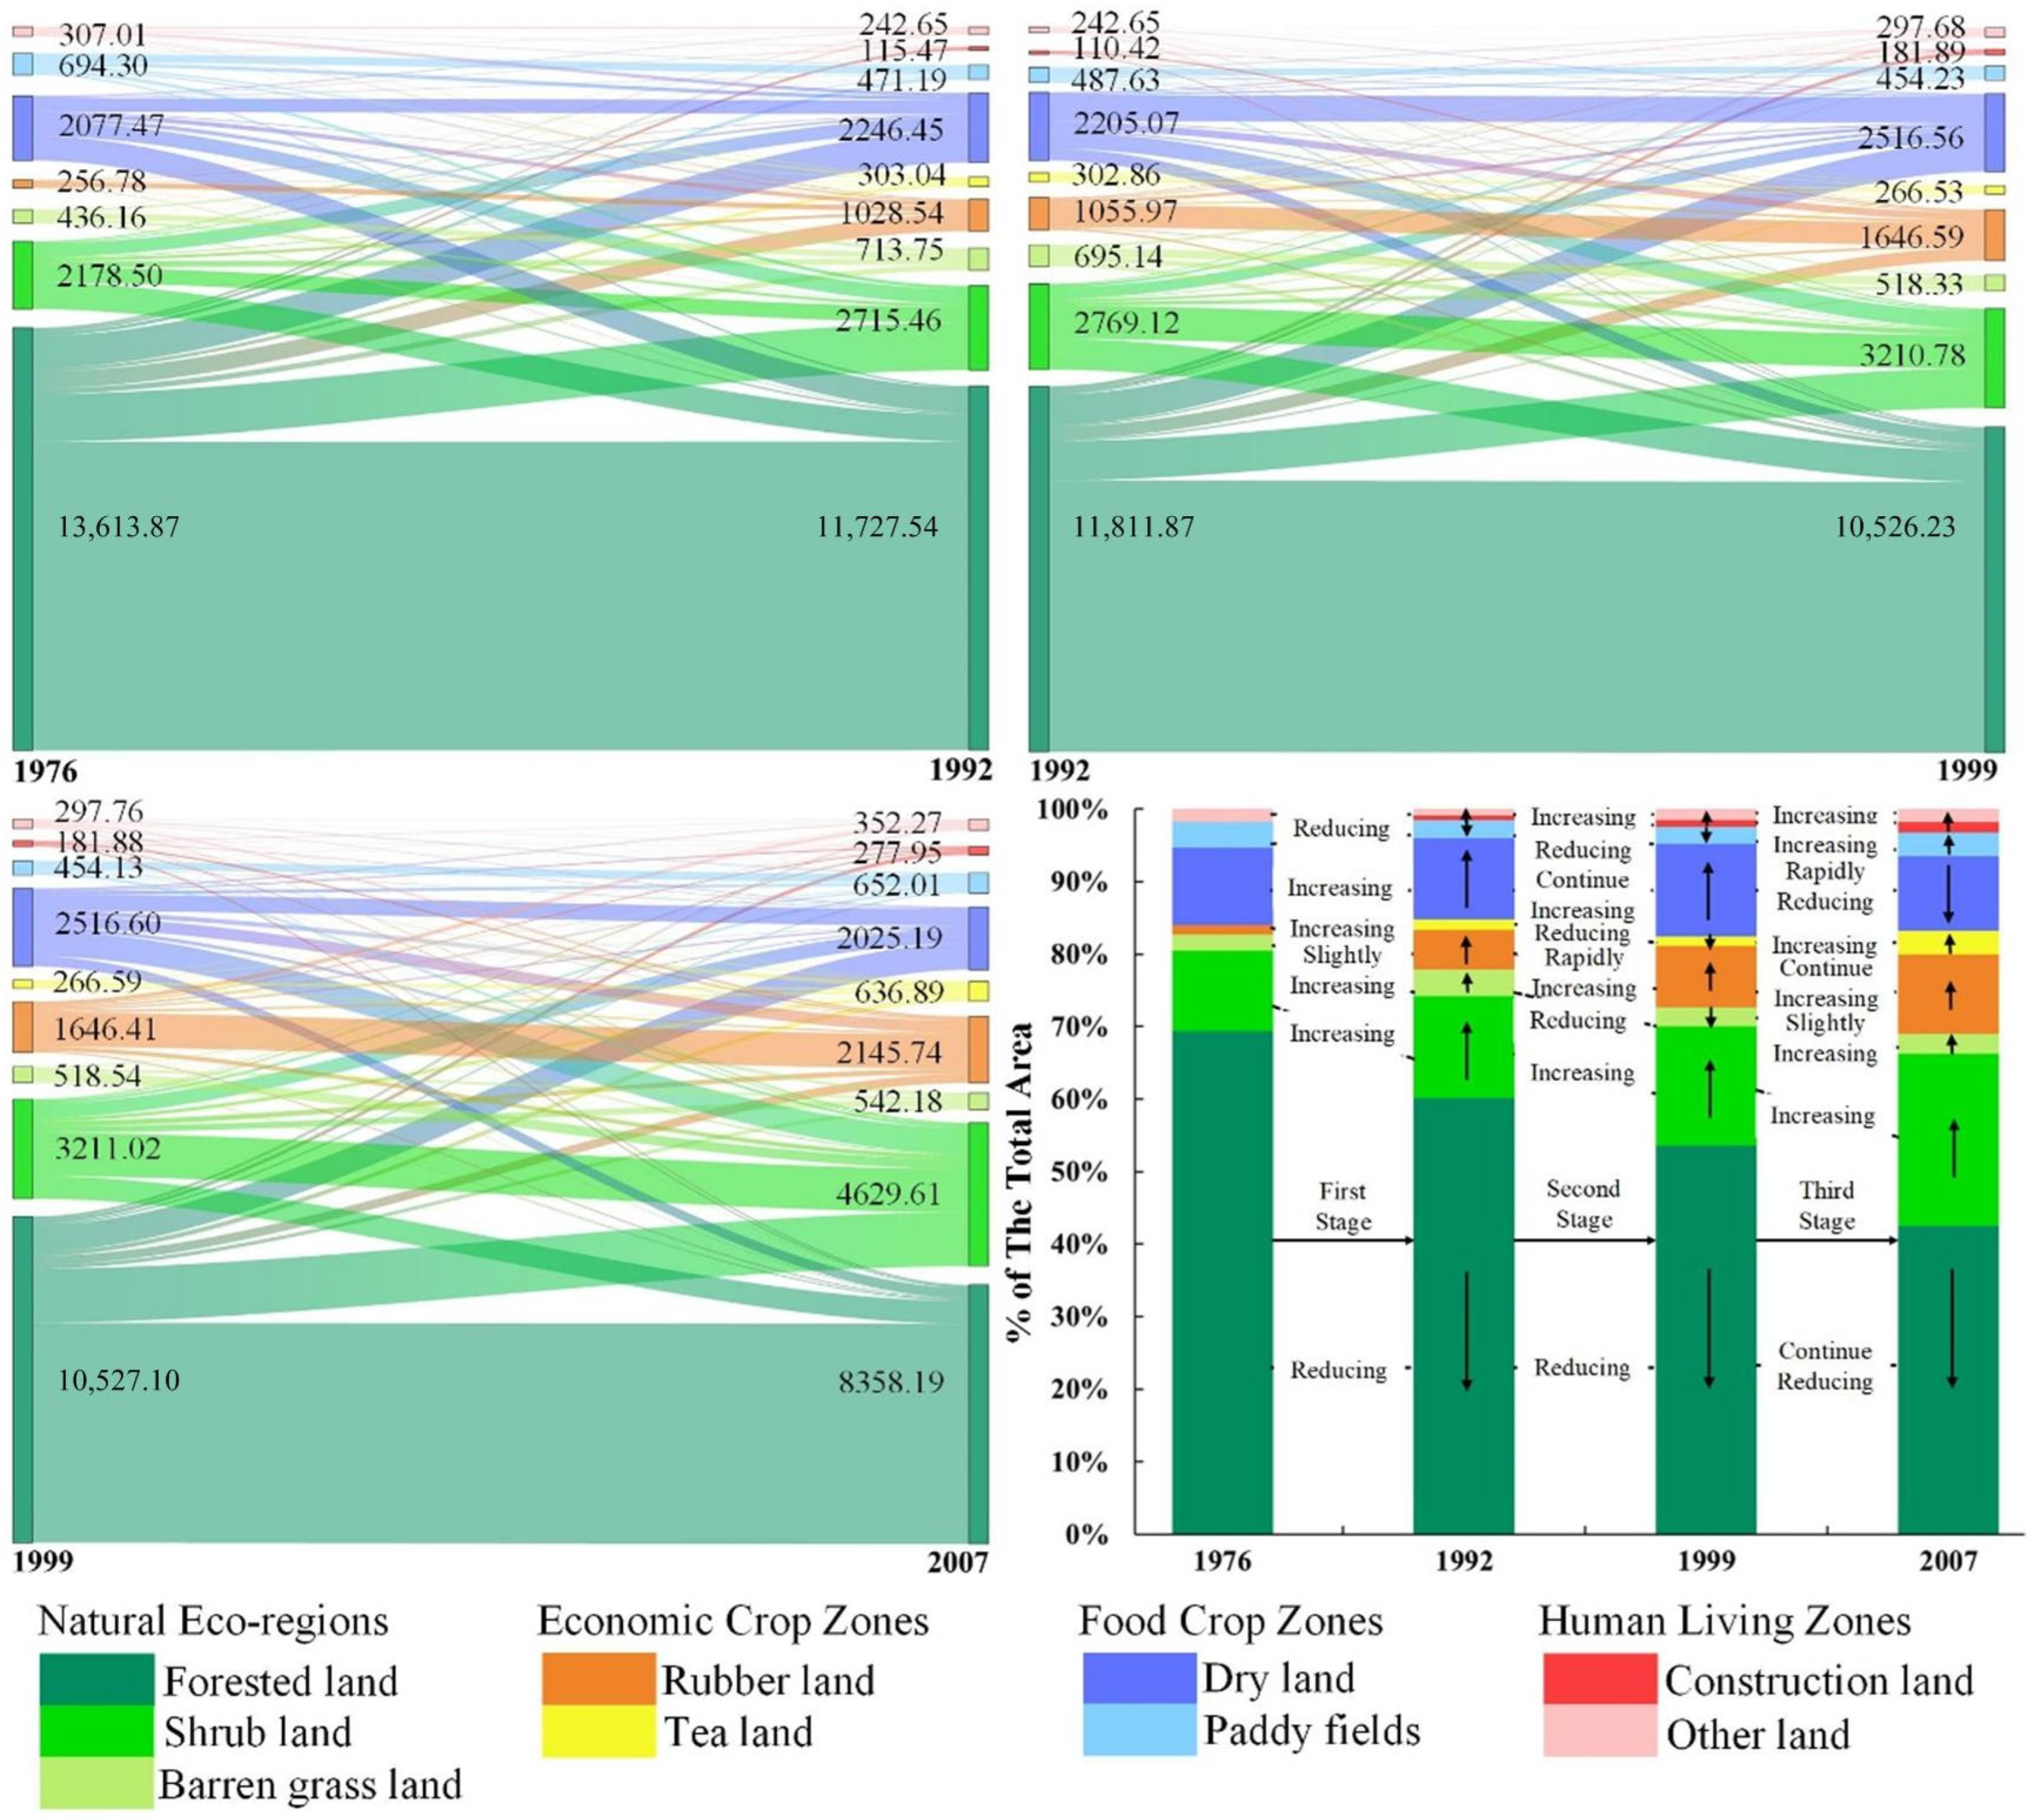
3.1. Land-Use Change

In general, during the entire study period of 1976–2007, the area of natural eco-regions in Xishuangbanna decreased, the areas of economic crop and human living zones increased, and the area of food crop zones decreased slightly (Figure 2). The region was mainly characterized by decreases in forested, dry, and other land, and by increases in shrub, rubber, barren, construction, and tea land; appreciable differences were observed in the changes in each land type.
The area of forested land decreased continuously from 1976 to 2007. This comprised a total decrease of 5260.18 km2, of which the largest decrease was 2173.30 km2 from 1999 to 2007, during which forests were mainly transformed into rubber and shrubland. The dry land area also decreased during the 31 years but showed an increase of 441.12 km2 in 1999 and a subsequent decrease of 495.27 km2 between 1999 and 2007, resulting in little overall change. The area of other land reduced only slightly, mainly by 184.33 km2 between 1976 and 1992, most of which comprised a conversion into forested, shrub, and rubber land.
The most appreciable increase in land use in Xishuangbanna across the study period was in shrubland, which showed a total increase of 2473.12 km2 mainly due to the degradation of forested land. This was followed by rubber land area, which increased continuously from 1976 to 2007 by a total of 1889.72 km2. Its area increase from 1999 to 2007 was almost the same as that in the 23 years preceding 1999, and it was mostly the result of the conversion of forested and dry land. The area of barren grass and construction land increased by 95.21 km2 and 278.09 km2, respectively. The tea land area only showed a small decrease from 1992 to 1999, with an overall upward trend.

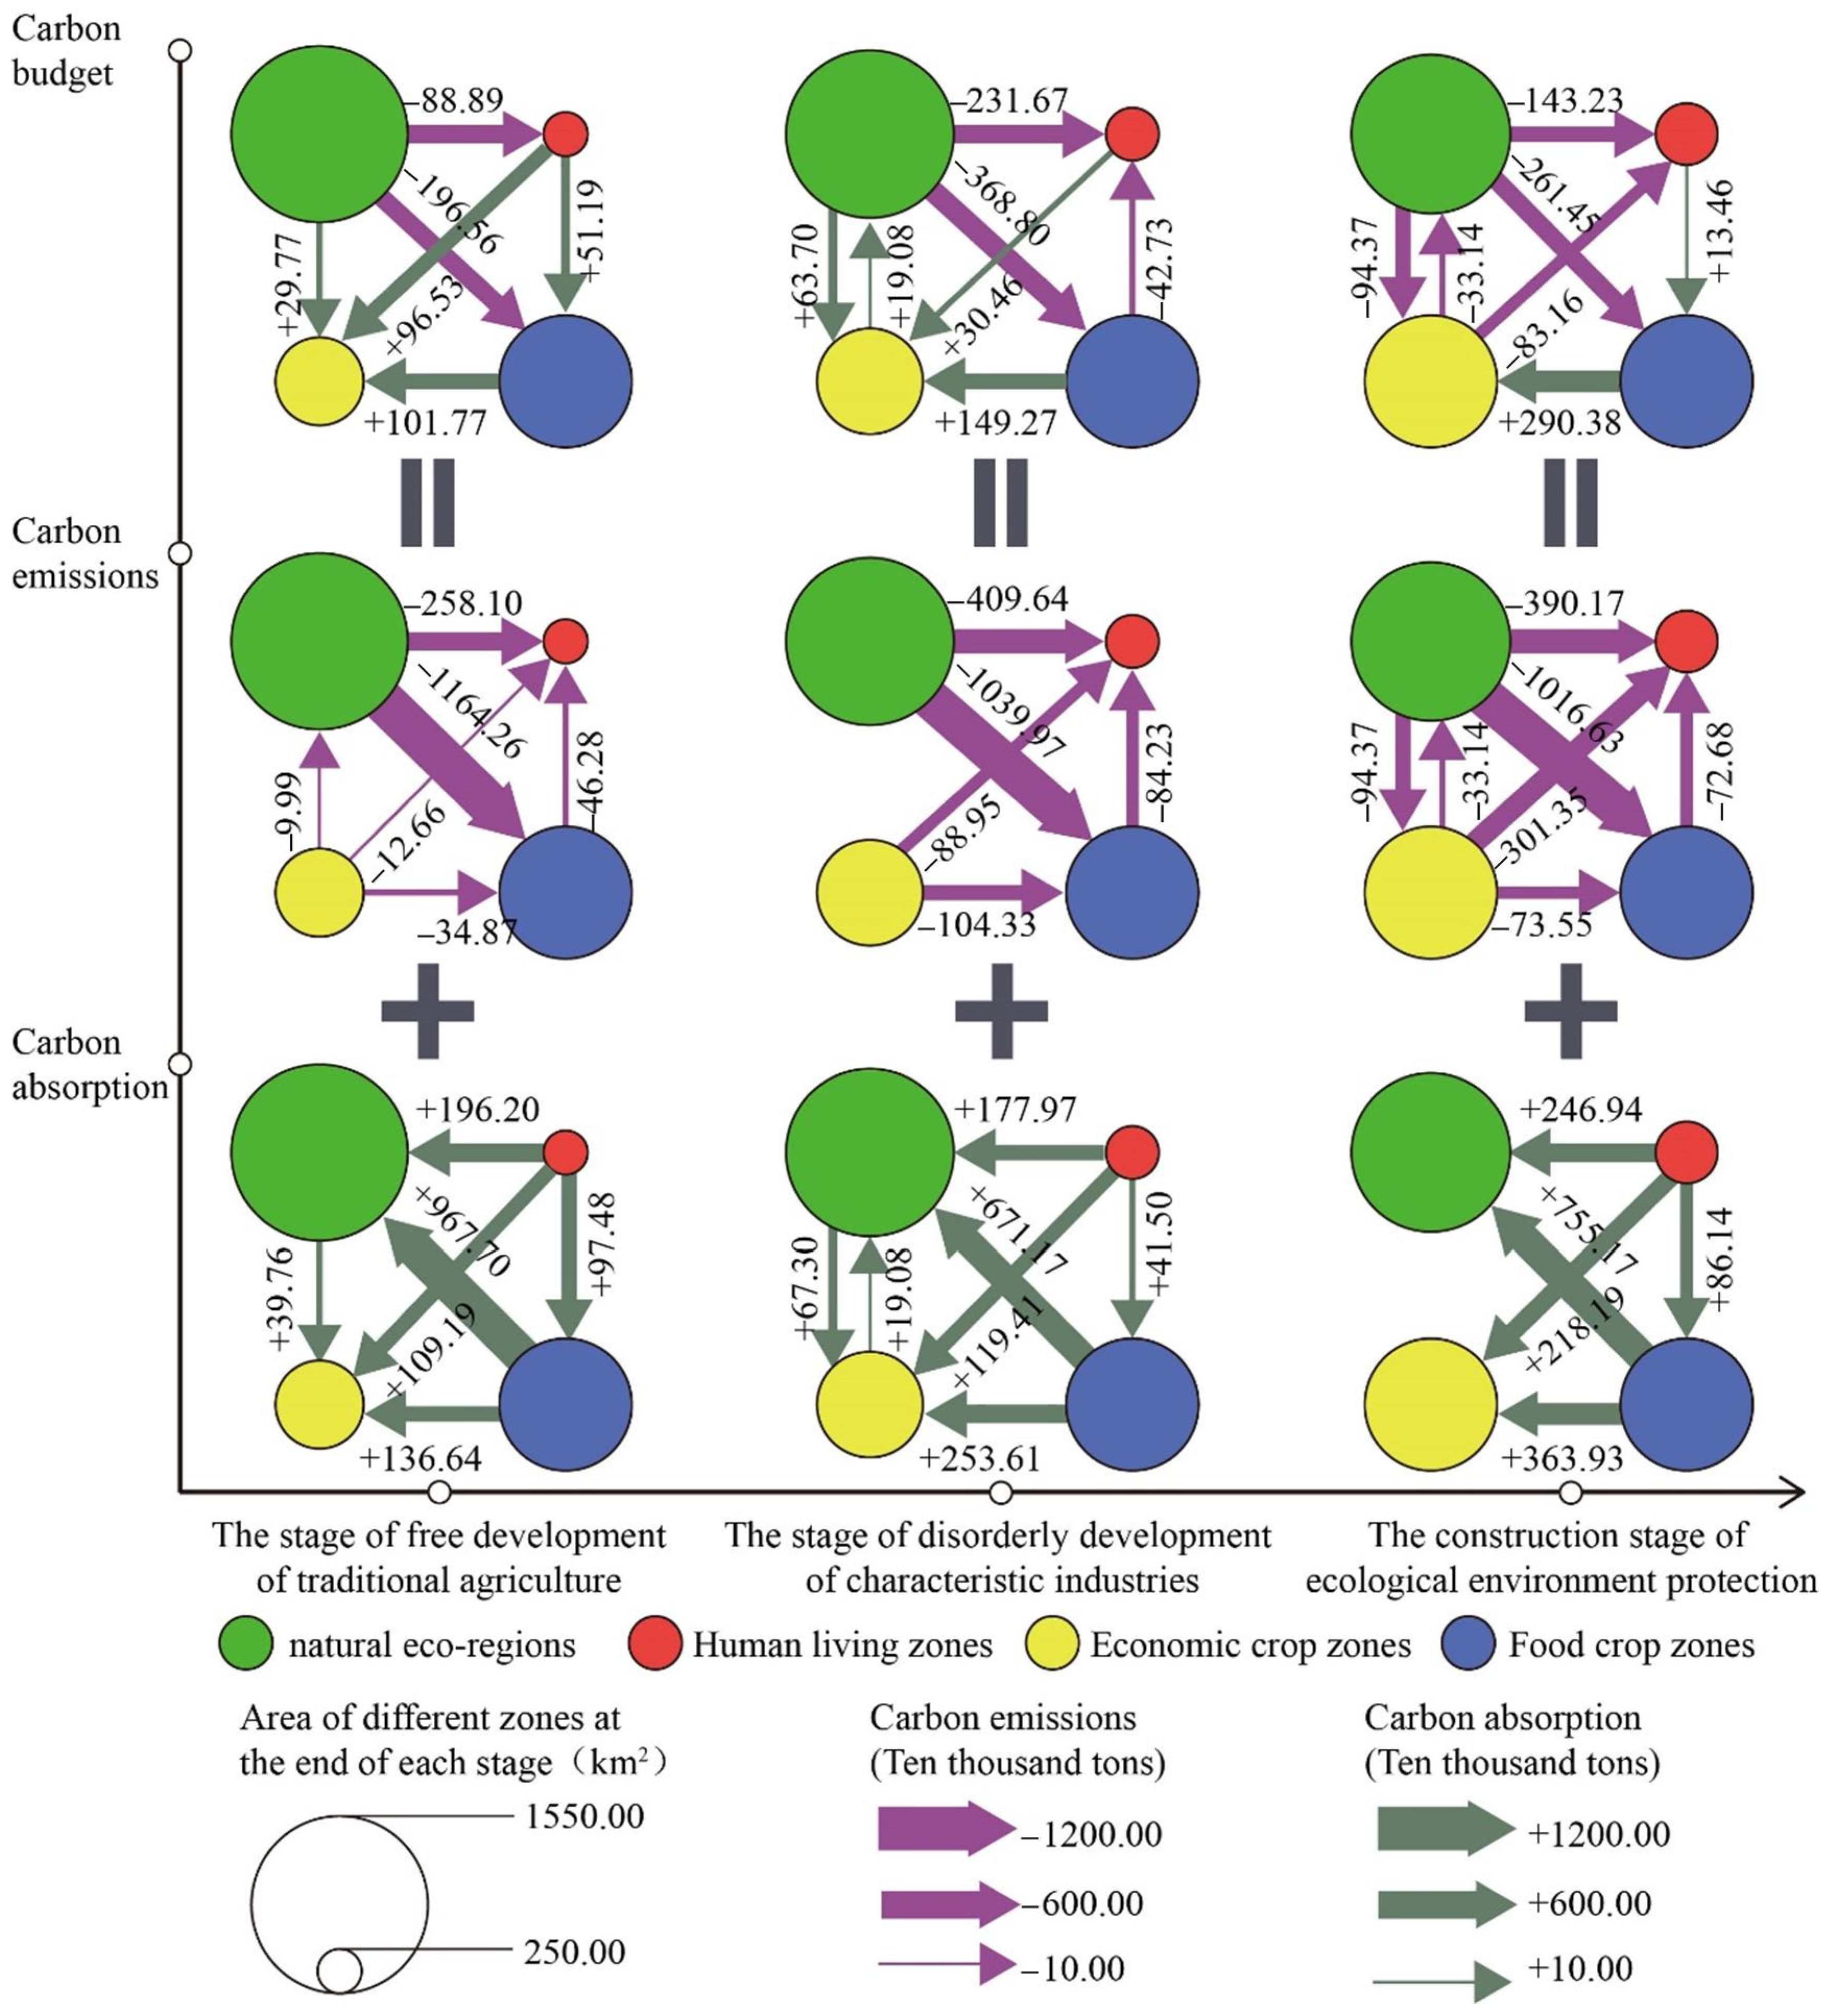
3.2. Carbon Budget Change Pathways

The land-use changes among the four zones we identified can be expected to have an impact on carbon adsorption and emission in the Xishuangbanna region. Therefore, we systematically analyzed the carbon budget under different land-use change paths (Figure 3).
Overall, land-use change resulted in more carbon emissions than carbon absorption. The amount of carbon absorption first decreased after 1976 to reach its lowest values in 1992–1999, but then increased again until 2007. In contrast, the carbon emissions showed a relatively large increase from 15,182.90 thousand tons of carbon in 1976 to 18,420.00 thousand tons in 2007.
In terms of the carbon budget, carbon emission pathways kept increasing (from two to five), while those of carbon absorption kept decreasing (until only two remained). The main paths of carbon emission in the 1976–1992 stage, encompassing the free development of traditional agriculture, were linked with the conversion of natural eco-regions to food crop and human living zones. Before 1992, there were many paths for carbon absorption, which were dominated by the conversion of human living zones to economic crop zones and food crop zones; this is likely to be related to the national policy of rubber expansion and household responsibility system implemented at the beginning of the economic reform period in 1978. The increase in carbon emission pathways during the 1992–1999 stage of disorderly industrial development was mainly caused by the transformation of natural eco-regions to food crop and human living zones, as the demands of an exploding population led to the large-scale development of natural eco-regions. All the paths during the 1999–2007 stage of establishing environmental protection represented increasing carbon emissions, except for the conversion of human living zones into food crop zones and food crop zones into economic crop zones (which constitute carbon absorption). Mainly because of the influence of market speculation, the price of Pu’er tea soared in 2007 and tea was widely planted at the time, serving as a relatively large source of carbon emissions. The rubber industry was expanding simultaneously, and large natural eco-regions are still being transformed into economic crop zones. Although carbon absorption has increased since the implementation of national policies for natural forest conservation and the “grain for green project”, the carbon budget is still mainly negative in the short term.

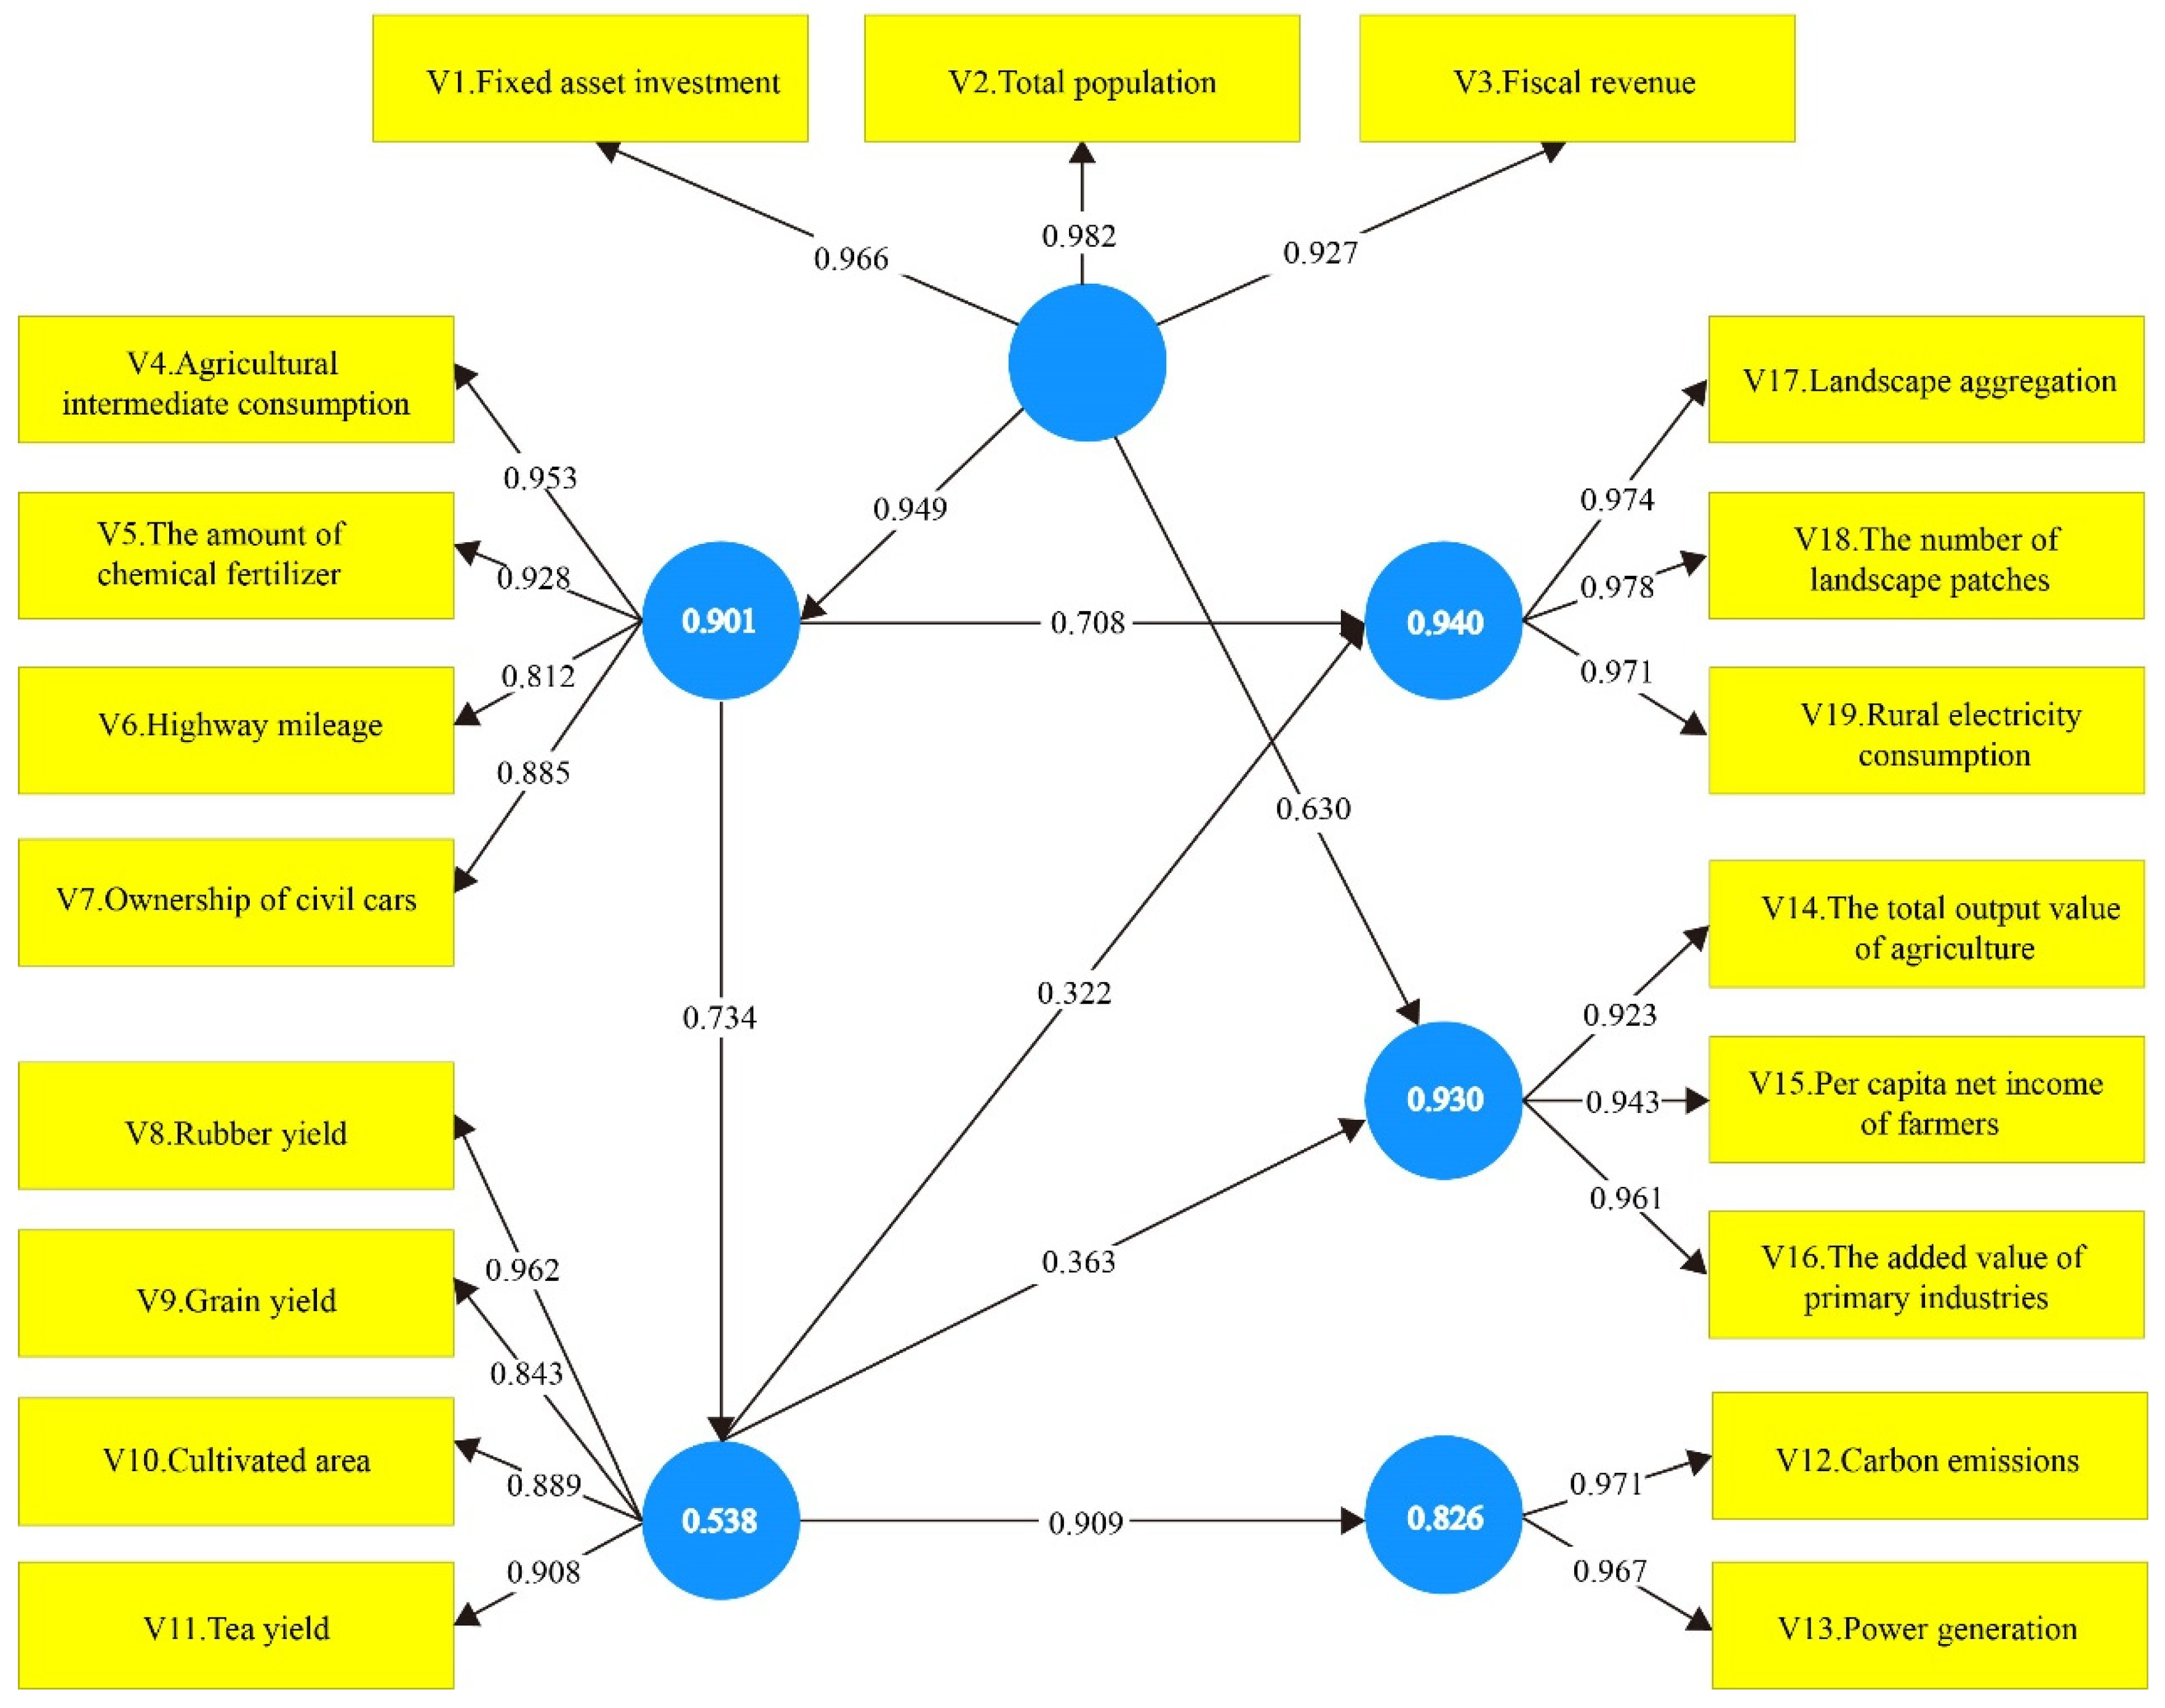
3.3. Path Analysis of Role of Socio-Economic Shifts in REDD+ Benefits

A REDD+ benefit evaluation system was established for the Xishuangbanna region, with socio-economic shifts as the driver (D), production factor inputs as the main pressure (P), land-use change as the main state (S), and REDD+ carbon benefits (I1), social benefits (I2), and environment-based benefits (I3) as the impacts in a DPSI model. The model was assembled using 19 specific observed variables (Table 1). All indexes passed the significance test and reflected the basic characteristics of latent variables. Based on the requirements of the reliability and validity tests (Cronbach’s α value > 0.6; CR > 0.7; AVE > 0.5), the relevant indexes met all standards (Table 2) and could explain approximately 90% of the total number of variances; therefore, the overall measurement model was determined to be credible and valid.
As shown in Table 3, except for D and P and P and I3, the square roots of all AVEs on the diagonal were greater than the coefficients in corresponding rows and columns. To further discern the discriminant validity among the latent variables, the confidence interval method was used (Table 3). The 95% confidence interval of the correlation coefficients of any two latent variables did not contain 1, supporting the significance of the structure and confirming the discriminant validity of our model [67,68,69].
Figure 4 indicates that the R2 values corresponding to P, S, I1, I2, and I3 were 0.901, 0.538, 0.826, 0.930, and 0.940, respectively. Being >0.5, these values indicate that the observed variables in our model possessed a high explanatory power for the latent variables. The path coefficients between each criterion layer met the requirements (p < 0.05), and all hypotheses were supported (Table 4).
The results showed that the components of D, P, S, I1, I2, and I3 in the model were interlinked and closely related. Socio-economic shifts were the main driving factor acting on the land-use status in Xishuangbanna through production factors, which promoted the expansion of economic and food crop zones to impact the REDD+ benefits. Simultaneously, socio-economic shifts and production factor inputs themselves also had an impact on some of the benefits of REDD+. This confirms that a network of relationships exists among the socio-economic shifts, land-use changes, and REDD+ benefits in Xishuangbanna, consistent with the complex linkages between human society and the environment.
This study employed the Bootstrapping method to test the significance of path coefficients in the PLS-SEM model to calculate t-values and confidence intervals. The analysis of the result refers to Silva et al. [70]. The results confirmed that all hypothesized paths were statistically significant, demonstrating robust and rational causal relationships between latent variables. For the path from drivers (D) to pressures (P), the path coefficient was 0.949 with a 95% confidence interval of [0.906, 0.976], indicating a strong and significant impact of drivers (e.g., fixed asset investment, fiscal revenue, and total population) on production factor inputs. Similarly, the path from pressures to land-use state (P → S) had a path coefficient of 0.734, validating the significant influence of production factors (e.g., fertilizer use and highway mileage) on land-use changes.
The paths from land-use state to REDD+’s multiple benefits (S → I1, I2, I3) revealed significant yet imbalanced effects. The path to carbon benefits (I1) showed the highest impact with a coefficient of 0.909, indicating that land-use changes significantly influence carbon emissions. The path to social benefits (I2) had a coefficient of 0.363, suggesting a relatively smaller but still significant effect on social outcomes such as farmers’ income and agricultural output. The path to environmental benefits (I3) showed the lowest impact, with a coefficient of 0.322, indicating that while land-use changes affect ecological conditions (e.g., landscape aggregation and fragmentation), the effect is less pronounced.
Furthermore, drivers (D) indirectly influenced REDD+ benefits through pressures (P) and land-use state (S), with high explanatory power demonstrated by R² values of 0.901 (pressures), 0.538 (land-use state), 0.826 (carbon benefits), 0.930 (social benefits), and 0.940 (environmental benefits). The Bootstrapping method not only validated the significance of these paths but also confirmed their directional rationality through confidence intervals. These findings illustrate the complex causal relationships among drivers, pressures, land-use state, and REDD+ benefits, providing robust quantitative support for the study’s hypotheses and offering critical insights for optimizing policies to achieve balanced REDD+ objectives.

3.3.1. Analysis of Impact of Socio-Economic Shifts on Land-Use Change

Socio-economic shifts (D) had a significant positive impact on production factor inputs with an impact coefficient of 0.949. In other words, when the driver changes by 1 unit, the input of production factors changes by 0.949 units in the same direction. Compared with fiscal revenue, both the total population and fixed asset investment variables exerted a greater influence on production factor input. Socio-economic growth promoted an upgrading of industrial structures to develop the industrial sector to a certain extent. In terms of agricultural production, large-scale investment into more agricultural instruments and fertilizers and the promotion of private car ownership have increased agricultural intermediate consumption. Simultaneously, the growing economy has driven the development of transportation, radiating outward from urban centers and penetrating urban and rural areas to promote the flow of production factors, thereby improving labor productivity and land production efficiency to a great extent.
Production factor inputs had a positive influence on land-use change state with a significant influence coefficient of 0.734. Xishuangbanna has a unique natural environment that is suitable for the growth of rubber plantations. Therefore, an input of production factors allowed a continuous increase in the production of natural rubber. As early as 2007, the natural rubber planting area had reached 24.87 km2, and the output of dry rubber exceeded 200 thousand tons. The planting area also gradually expanded from low- to high-altitude areas. Increased global demand for tea, along with transportation developments, resulted in tea plantations in the Yunnan state exceeding 600,000 mu in 2007, with economic crop zones continuing to occupy the natural eco-regions. At the same time, the conflict between human needs and land availability has gradually intensified with population growth. Developments in farming technology and transportation have allowed local residents to cut down and burn forested areas, transforming large areas of natural eco-regions into food crop zones to meet the growing demand for food. Due to the massive input of production factors, the speed of the human conquest of nature has accelerated with economic and food crop zones gradually replacing the natural eco-regions.

3.3.2. Analysis of Unbalanced Impacts of Land-Use Change on REDD+’s Multiple Benefits

Land-use change state had a positive influence on REDD+ social benefits with an influence coefficient of 0.363. In other words, when the land-use state changes by 1 unit, REDD+ social benefits will change by 0.363 units in the same direction. Since the indexes characterizing REDD+ carbon benefits and environment-based benefits are negative indexes, the land-use change state had a negative effect on REDD+ carbon benefits and environment-based benefits in Xishuangbanna, with their degrees of influence being 0.909 and 0.322, respectively. Every 1 unit of land-use state change resulted in a change of 0.909 units of carbon emission and 0.322 units of burden to the environment.
These results emphasized that land-use change has had an unbalanced impact on the multiple benefits of REDD+, with the negative impact on carbon benefits far outweighing environmental and social benefits. In the 1990s, economic development was the key focal point in the country. A national policy of rubber expansion and the household responsibility system were in effect, the prices of natural rubber and tea were rising, and Xishuangbanna residents switched to planting economic and food crops, destroying the natural eco-regions at a large scale. The unplanned spread of plantations combined with the considerable area planted with economic crops led to the exploitation of many forests that functioned as water sources, causing serious water and soil losses. In addition, the construction of the Xishuangbanna Hydropower Station destroyed habitats and changed the local climate, further resulting in the conversion of vast tracts of forested land into shrub and agricultural lands. With these forests representing the largest carbon sink on land, the continued destruction and degradation of natural eco-regions will inevitably lead to a decrease in carbon storage and an increase in carbon emissions, which will have a significant negative impact on the REDD+ carbon benefits with a 0.909 degree of influence.
Compared to carbon emissions, the impact of land-use change on the social and environmentally based benefits of REDD+ is smaller. This is mainly because the economic crop zones occupied the food crop zones, leading to less space being available for the development of primary industries and to farmers earning relatively less profit. Meanwhile, rubber plantations rapidly expanded to high-altitude areas, which are not particularly suitable for their growth and do not offer higher economic benefits. This explains why the degree of impact that land-use change had on REDD+ social benefits was only 0.363. Due to the excessive application of chemical fertilizers during cultivation, the soil structure composition has been damaged. Simultaneously, large-scale agricultural activities have increased rural electricity consumption, which has had a series of influences on the land-use pattern. As a result, the landscape aggregation decreased significantly in Xishuangbanna, and the landscape pattern tended to be fragmented into different land-use patches. Although the overall environmental benefits were negative, the national grain and afforestation project gradually played their role. Moreover, both economic and food crops provide certain ecological functions, reducing the negative impact of land-use change on environmentally based benefits of REDD+.

3.3.3. Analysis of Other Effects of Socio-Economic Shifts and Production Factor Inputs

The positive impact coefficient of socio-economic shifts on the REDD+ social benefits was a significant 0.630. The early development of Xishuangbanna mainly depended on agriculture. Socio-economic growth strengthened agricultural technology and its financial support, improving production conditions and increasing land-use efficiency and agricultural productivity. Thus, the added value of the primary industry and the total output value of agriculture have increased, and the per capita net income of farmers also increased.
The negative impact of production factor input on the ecological environment reached 0.708, indicating that the burden on the ecological environment increases by 0.708 units for each unit change in production factor input. A higher input of production factors led to greater agricultural intermediate consumption. Xishuangbanna generally exhibits a low level of agricultural development, utilizing traditional and extensive farming methods. The excessive application of chemical fertilizers and pesticides leaves a large amount of soil residues that can lead to agricultural non-point source pollution. These toxic substances cannot be degraded, which will further affect the local ecological environment. The increased use of agricultural machinery has furthermore led to the continuous exploitation of land resources in Xishuangbanna, resulting in the landscape fragmentation mentioned in Section 3.3.2. Oil leaks and exhaust emissions from agricultural machinery also pollute the soil and atmosphere. Meanwhile, the use of electrified farming equipment has increased the demand for electricity in rural areas, necessitating an increase in power generation that has had a considerable negative impact on environmental benefits.

4. Discussion

The main purpose of this study was to empirically quantify the impact of socio-economic changes on the REDD+ benefits and to quantitatively assess the relationship between the components in a DPSI model. The linkages between socio-economic development and eco-environmental changes in Xishuangbanna are complex. The DPSI model helps to accurately identify the driver, pressure, and other elements in the dynamic human–environment interaction system [71,72], and a set of indexes was established based on this framework. The results demonstrated that the impact of production factor input on land-use change reached 0.734 and had different effects on various REDD+ benefits. Such a quantitative assessment translated complex conceptual relationships into operational guidelines that can help policymakers to assess the effectiveness of current ecological conservation policies, provide direction for future policymaking [73,74], and answer the three questions posed in our Introduction.

4.1. Drivers and Impacts of Land-Use Change on the Eco-Environment and Carbon Dynamics in Xishuangbanna

Land-use change is the result of a combination of direct and indirect drivers and has exerted a significant impact on the ecological environment of Xishuangbanna. Relevant studies have shown that human activity factors such as population growth, socio-economic development, and agricultural expansion have been direct drivers of an appreciable change in land-use patterns, while national policies and market economic factors have been the main indirect drivers thereof [75,76,77,78]. Our study shows that, in the 32 years from a stage of free development of traditional agriculture to the construction of eco-environmental protection, the natural eco-regions in Xishuangbanna have reduced by 5260.179 km2, being mainly transformed into economic crop and human living zones. In the DPSI framework analysis, we also found that socio-economic shifts acted on production factor inputs and influenced land-use change by a degree of 0.734. This result is consistent with other studies in which human socio-economic development and the demand for agricultural land were shown to affect a dramatic shrinkage of tropical forests [79,80]. This direct effect can be explained by the fact, since the years of national economic reform, the continuous socio-economic development of Xishuangbanna has led to a rapid expansion of urban land, from about 15 km2 in 1976 to 97 km2 in 2005 [81]. Population growth has increased the demand for food, and socio-technical development has reduced the difficulty of land reclamation, resulting in a continuous expansion of agricultural land and dramatic land-use changes. A distinctive feature of land-use change in Xishuangbanna is that the area of natural eco-regions is decreasing while the area of economic crop zones is increasing significantly as a result of the indirect influence of national policies and the market economy. Rubber was brought to Xishuangbanna in 1940, and after the land system reform in the 1980s, individual farmers began to plant rubber under rubber expansion policies [82]. After 1999, the state launched countering policies such as the “grain for green” and “natural forests conservation” projects, which have been slightly effective. However, the economic crop zones are still expanding due to export requirements and the price of natural rubber. Land-use change will lead to a structural imbalance in ecosystems, decreasing the value of their services in soil and water conservation, climate regulation, and biodiversity conservation, and generating environmental problems such as environmental degradation and excessive carbon emissions [83].
We calculated the carbon absorption and emissions under different land-use transfer paths, analyzing the carbon budget in Xishuangbanna at different stages. The total carbon budget in Xishuangbanna was negative at all stages, and the carbon emission paths are increasing. This result is similar to the findings of Min et al., who concluded that about 21 Mg/ha of annual carbon emissions in Xishuangbanna was related to the expansion of the rubber industry [84]. Although rubber forests display a higher carbon density and may sequester slightly more carbon than natural ecological zones in the short term, their monoculture structure and long-term planting will eventually lead to forest degradation and generate more carbon emissions [85,86,87]. Dramatic land-use changes reduce the connectivity and stability of the landscape pattern, and the fragmented pattern in turn leads to a series of problems such as environmental degradation [88]. This was verified in our DPSI framework analysis, where the effect of land-use change on the eco-environment reached 0.909 and 0.322 for carbon emissions and environmental degradation, respectively. How to coordinate the interrelationship between nature, society, and the economy in the later stages of the development of a country is an urgent issue that needs to be resolved.

4.2. The Role of REDD+ in Balancing Carbon, Ecological, and Social Benefits Amid Socio-Economic Shifts

REDD+ programs aim to help developing countries reduce their carbon emissions while also benefiting socio-economic development and ecological conservation [89,90]. Socio-economic shifts drive changes in land-use patterns and thus have an unbalanced impact on the multiple benefits of REDD+. While carbon benefits are central to REDD+ programs, non-carbon benefits also enable the sustainability of REDD+ action effects [91,92,93], and the assessment of both is equally important. A study of Malaysian forest reserves revealed that the intensity, nature, and extent of REDD+ ecological benefits depended on the carbon storage distribution characteristics, with higher species richness in areas with higher carbon storage and lower species richness in areas with lower carbon storage [94]. Our study analyzed the REDD+ carbon benefits, ecological benefits, and social benefits as independent research objects. A quantitative analysis showed that changes in land use brought on by socio-economic shifts in the Xishuangbanna region had an unbalanced impact on multiple benefits of REDD+, with the greatest impact being on carbon emissions, which was nearly three times higher than the impact on ecological degradation and more than twice the impact on social benefits.
One plausible explanation for this result is that rising material and cultural needs have increased human living zone coverage, and national policies such as “take grain as the key link”, “deforestation to grow food”, and blind “rubber expansion” have resulted in the disorderly expansion of food crops and economic crop zones. These effects have severely damaged natural eco-regions and increased carbon emissions, which exert a detrimental effect on carbon efficiency. The household responsibility system has provided Chinese farmers with autonomous land-use and crop selection rights [95,96], and the unique climatic conditions in the Xishuangbanna region along with the stimulation of rubber prices internationally set off a wave of rubber cultivation. In pursuit of maximizing their financial benefits, farmers have planted rubber at higher altitudes, in low-relief canyon areas, and even in cultivated paddy fields [97,98]. Too low or too high an altitude renders rubber trees susceptible to chilling, which affects the quality of their dried rubber. Past experiences have also indicated that planting rubber in field dams (which cannot reach the exploitation standard for many years) reduces the economic return for farmers and lowers the impact of land-use changes on social benefits. From a different perspective, the substitution of extensive economic crop zones for natural eco-regions is not an equivalent exchange. Nevertheless, adopting the “Land Maxing” concept could offer a sustainable solution to these challenges. “Land Maxing” is a sustainable land-use approach that integrates multifunctional agroforestry systems to maximize ecological, social, and economic benefits while restoring degraded landscapes [99,100]. By integrating rubber-based agroforestry systems into conventional farming practices, “Land Maxing” maximizes the ecological, social, and carbon benefits of land use [101]. This approach emphasizes restoring degraded land, conserving biodiversity, and improving soil fertility while enabling farmers to achieve financial stability. Many researchers are currently promoting rubber-based agroforestry systems to reduce land degradation [102,103,104], and the Xishuangbanna region has also shifted its focus to ecological environmental protection by enacting policies like the “natural forest protection” and “grain for green” projects. Hence, the effect of land-use change on ecological degradation is curtailed. In short, it is necessary to implement REDD+ programs in the Xishuangbanna region to reap the combination of carbon, ecological, and social benefits.

4.3. Effectiveness of REDD+ Programs in Reducing Deforestation and Promoting a Climate–Ecology–Economy Win-Win Solution

REDD+ programs promote sustainable forest development and climate change mitigation through financial and institutional incentives for developing countries to reduce their levels of deforestation and forest degradation. To date, more than 350 REDD+ programs have been implemented effectively in over 50 countries [105,106,107]. Jayachandran et al. evaluated a program employing payment for ecosystem services under the REDD+ mechanism in Uganda, conducting a randomized controlled trial across 121 villages. They found that the forest cover reduction rate was significantly lower in the experimental group under the REDD+ program (4.2%) than in the control group (9.1%); by assessing CO2 emissions, the authors furthermore concluded that the benefits of the scheme were 2.4 times its costs, providing ample evidence of its effectiveness [108]. A counterfactual time series trajectory of annual forest cover loss in Guyana similarly showed that the implementation of REDD+ programs in this country (2010–2015) reduced forest cover loss significantly by 35%, which is equivalent to a reduction of 12.8 million tons in CO2 emissions [109]. Guizar-Coutiño et al. quantified the performance of 40 REDD+ programs in nine countries using tropical rainforest datasets and standardized assessment methods, revealing that deforestation rates decreased by 47% and forest degradation rates decreased by 58% in the first five years of project implementation, especially in areas where deforestation was more severe [110]. The above findings support the implementation of REDD+ programs in the Xishuangbanna region, which possesses the only tropical rainforests in China. Solving the problem of carbon emissions caused by deforestation and forest degradation in this area and giving full play to its carbon sink function may be key to allowing China to achieve its projected carbon targets in 2030 and 2060.
We calculated the impact of deforestation in Xishuangbanna on social benefits to be 0.363, with the corresponding impacts on carbon emissions being 2.50 times and on environmental degradation being 0.88 times. The implementation of REDD+ programs attracts developed countries to provide funds that bestow localized social benefits. Such a program could reduce carbon emissions by 2.50 times and have a 0.88-fold positive impact on ecosystems. This not only proposes an effective carbon reduction scheme, but also takes into account the livelihood concerns of local residents as well as providing environmental protection, i.e., a three-win situation for the climate, ecology, and economy. It is important that the government takes a firm stance when implementing REDD+ programs and shows that developed countries fully assist developing countries in their emission reduction efforts by addressing the potential conflict between sustaining the livelihoods of farmers and protecting the environment, and serving the fundamental interests of farmers. Incorporating the “Land Maxing” concept can help bridge this conflict by promoting agroforestry systems and multifunctional land-use strategies that both support farmer livelihoods and enhance ecological conservation [99]. By integrating socially modified tree species and sustainable agricultural practices, “Land Maxing” enables the restoration of degraded lands while maintaining economic productivity, thus aligning environmental protection with the socio-economic needs of farmers. At the same time, considering that leakage may occur during the implementation of REDD+ programs, local governments should find a balance between economic development and REDD+ programs to create ideal conditions for the program implementation. To achieve this, local governments can leverage “Land Maxing” principles to design land-use policies that prioritize biodiversity, carbon sequestration, and local economic benefits [101]. This approach minimizes leakage risks by ensuring that land conversion is economically viable and environmentally sustainable, creating a holistic framework for REDD+ success.

4.4. Limitations of the Models and Data

Despite the robustness and utility of the DPSI framework and PLS-SEM model employed in this study, there are certain limitations that need to be acknowledged. First, the DPSI framework simplifies the complex interactions between socio-economic factors and environmental changes, which may overlook non-linear and dynamic relationships (Gari et al., 2015; Mohibul et al., 2023) [111,112]. Real-world interactions often involve feedback loops and time delays that are not captured by the linear cause–effect relationships assumed in the DPSI model. Addressing this limitation requires integrating the DPSI framework with dynamic system models or agent-based models to capture these complex interactions [111,113]. Second, the reliability of the PLS-SEM results is heavily dependent on the quality and comprehensiveness of the input data [114]. Socio-economic data used in this study may not fully account for informal economic activities or localized land-use practices, particularly in rural areas. Furthermore, while remote sensing data such as satellite imagery provide valuable insights into land-use changes, it has limitations in distinguishing between different forest types and successional stages, which can significantly affect biomass and carbon stock estimates [115]. To mitigate these limitations, future studies could combine remote sensing data with ground-based forest inventory data to improve the accuracy of carbon flux estimates [49,116]. Third, PLS-SEM, as a composite-based approach, has its own methodological limitations. While it is well suited for exploratory and predictive research, it may lack the rigor of covariance-based SEM in confirmatory settings [117,118]. This limitation can be addressed by employing hybrid approaches that combine PLS-SEM for an exploratory analysis with CB-SEM for confirmatory testing, thereby leveraging the strengths of both methods [119,120]. Finally, the study focuses on a specific region, Xishuangbanna, which has unique socio-economic and environmental conditions. The findings may not be entirely generalizable to other tropical forest regions with different economic drivers, policy frameworks, and ecological contexts. To enhance the generalizability of the findings, future studies could test the DPSI and PLS-SEM approaches across different geographic regions and incorporate a wider range of socio-economic variables. Future research will focus on improving the robustness and applicability of the DPSI framework and PLS-SEM models in assessing REDD+ benefits and informing sustainable land-use policies.

5. Conclusions

This study utilized the DPSI and PLS-SEM models to empirically quantify the impact of socio-economic shifts on the carbon, ecological, and social benefits of REDD+ in the Xishuangbanna region. Our analysis revealed a close relationship between the driving, pressure, state, and impact factors in the dynamic human–environment interaction system. Socio-economic shifts significantly increased the input of production factors, driving substantial changes in land use and causing unbalanced impacts across different REDD+ benefits. The impact coefficients reached 0.909 for carbon emissions, 0.322 for ecological degradation, and 0.363 for social benefits, highlighting the disproportionate effect on carbon dynamics. To address these challenges, the concept of “Land Maxing” provides a valuable framework for balancing carbon reduction, ecological restoration, and socio-economic development. By integrating multifunctional land-use strategies such as agroforestry systems and mixed-use farming, policymakers can optimize land productivity while mitigating the adverse effects of monoculture plantations. These strategies align with the goals of REDD+ by promoting sustainable practices that enhance carbon sinks, conserve biodiversity, and support local livelihoods. The intricate causality network identified within the DPSI model underscores the need for targeted policy interventions that address the complexity of local socio-economic and ecological interactions. To achieve REDD+ targets in Xishuangbanna, policymakers should prioritize carbon reduction strategies while incorporating “Land Maxing” principles to ensure that ecological and social benefits are equitably distributed. This can include land-use zoning to protect natural eco-regions, incentive-based mechanisms such as payments for ecosystem services, and support for diversified agricultural systems. While climate change mitigation remains a long-term goal, our findings emphasize the importance of adaptive and region-specific policies that align land-use practices with the overarching goals of REDD+. Future research should focus on evaluating the long-term effectiveness of these policies, exploring the integration of “Land Maxing” principles, and developing innovative approaches to balance socio-economic development with ecological sustainability.

Author Contributions

Conceptualization, H.L., S.L. and C.Z.; Data curation, H.L. and S.L.; Formal analysis, H.L. and S.L.; Methodology, H.L., S.L. and C.Z.; Resources, H.L., S.L., T.K. and C.M.; Writing—original draft, H.L. and S.L.; Writing—review and editing, H.L. and S.L. All authors have read and agreed to the published version of the manuscript.

Funding

This research was funded by the National Natural Science Foundation of China, grant number 42071267; the Xinyang Academy of Ecological Research Open Foundation, grant number 2023XYMS02; and the Central Plain Scholar Workstation Project, grant number 234400510026.

Data Availability Statement

Data are contained within the article.

Acknowledgments

We are grateful to Xiaojing Wu’s contribution to the research.

Conflicts of Interest

The authors declare no conflicts of interest.

References

  1. Busch, J.; Engelmann, J.; Cook-Patton, S.C.; Griscom, B.W.; Kroeger, T.; Possingham, H.; Shyamsundar, P. Potential for low-cost carbon dioxide removal through tropical reforestation. Nat. Clim. Chang. 2019, 9, 463–466. [Google Scholar] [CrossRef]
  2. Lin, B.; Ge, J. Valued forest carbon sinks: How much emissions abatement costs could be reduced in China. J. Clean. Prod. 2019, 224, 455–464. [Google Scholar] [CrossRef]
  3. Baccini, A.; Walker, W.; Carvalho, L.; Farina, M.; Sulla-Menashe, D.; Houghton, R.A. Tropical forests are a net carbon source based on aboveground measurements of gain and loss. Science 2017, 358, 230–234. [Google Scholar] [CrossRef] [PubMed]
  4. Boulton, C.A.; Lenton, T.M.; Boers, N. Pronounced loss of Amazon rainforest resilience since the early 2000s. Nat. Clim. Chang. 2022, 12, 271–278. [Google Scholar] [CrossRef]
  5. Gatti, L.V.; Basso, L.S.; Miller, J.B.; Gloor, M.; Gatti Domingues, L.; Cassol, H.L.G.; Tejada, G.; Aragão, L.E.O.C.; Nobre, C.; Peters, W.; et al. Amazonia as a carbon source linked to deforestation and climate change. Nature 2021, 595, 388–393. [Google Scholar] [CrossRef]
  6. Barni, P.E.; Rego, A.C.M.; Silva, F.D.C.F.; Lopes, R.A.S.; Xaud, H.A.M.; Xaud, M.R.; Barbosa, R.I.; Fearnside, P.M. Logging Amazon forest increased the severity and spread of fires during the 2015–2016 El Niño. For. Ecol. Manag. 2021, 500, 119652. [Google Scholar] [CrossRef]
  7. Friedlingstein, P.; O’Sullivan, M.; Jones, M.W.; Andrew, R.M.; Hauck, J.; Olsen, A.; Peters, G.P.; Peters, W.; Pongratz, J.; Sitch, S.; et al. Global carbon budget 2020. Earth Syst. Sci. Data 2020, 12, 3269–3340. [Google Scholar] [CrossRef]
  8. Griscom, B.W.; Adams, J.; Ellis, P.W.; Houghton, R.A.; Lomax, G.; Miteva, D.A.; Schlesinger, W.H.; Shoch, D.; Siikamäki, J.V.; Smith, P.; et al. Natural climate solutions. Proc. Natl. Acad. Sci. USA 2017, 114, 11645–11650. [Google Scholar] [CrossRef]
  9. Duchelle, A.E.; Simonet, G.; Sunderlin, W.D.; Wunder, S. What is REDD+ achieving on the ground? Curr. Opin. Environ. Sustain. 2018, 32, 134–140. [Google Scholar] [CrossRef]
  10. Satyal, P.; Corbera, E.; Dawson, N.; Dhungana, H.; Maskey, G. Justice-related impacts and social differentiation dynamics in Nepal’s REDD+ projects. For. Policy Econ. 2020, 117, 102203. [Google Scholar] [CrossRef]
  11. Vatn, A.; Kajembe, G.; Mosi, E.; Nantongo, M.; Silayo, D.S. What does it take to institute REDD +? An analysis of the Kilosa REDD + pilot, Tanzania. For. Policy Econ. 2017, 83, 1–9. [Google Scholar] [CrossRef]
  12. Maraseni, T.N.; Poudyal, B.H.; Rana, E.; Chandra Khanal, S.; Ghimire, P.L.; Subedi, B.P. Mapping national REDD+ initiatives in the Asia-Pacific region. J. Environ. Manag. 2020, 269, 110763. [Google Scholar] [CrossRef] [PubMed]
  13. Muttaqin, M.Z.; Alviya, I.; Lugina, M.; Hamdani, F.A.U.; Indartik. Developing community-based forest ecosystem service management to reduce emissions from deforestation and forest degradation. For. Policy Econ. 2019, 108, 101938. [Google Scholar] [CrossRef]
  14. Arévalo, P.; Olofsson, P.; Woodcock, C.E. Continuous monitoring of land chan-ge activities and post-disturbance dynamics from Landsat time series: A test methodology for REDD+ reporting. Remote Sens. Environ. 2020, 238, 111051. [Google Scholar] [CrossRef]
  15. Pasgaard, M.; Sun, Z.; Müller, D.; Mertz, O. Challenges and opportunities for REDD+: A reality check from perspectives of effectiveness, efficiency and equity. Environ. Sci. Policy 2016, 63, 161–169. [Google Scholar] [CrossRef]
  16. Busch, J. Monitoring and evaluating the payment-for-performance premise of REDD+: The case of India’s ecological fiscal transfers. Ecosyst. Health Sustain. 2018, 4, 169–175. [Google Scholar] [CrossRef]
  17. Sheng, J.; Qiu, H. Governmentality within REDD+: Optimizing incentives and efforts to reduce emissions from deforestation and degradation. Land Use Policy 2018, 76, 611–622. [Google Scholar] [CrossRef]
  18. Jackson, B.; Decker Sparks, J.L. Ending slavery by decarbonisation? Exploring the nexus of modern slavery, deforestation, and climate change action via REDD+. Energy Res. Soc. Sci. 2020, 69, 101610. [Google Scholar] [CrossRef]
  19. Nantongo, M.; Vatn, A. Estimating Transaction Costs of REDD+. Ecol. Econ. 2019, 156, 1–11. [Google Scholar] [CrossRef]
  20. Sharma, B.P.; Karky, B.S.; Nepal, M.; Pattanayak, S.K.; Sills, E.O.; Shyamsundar, P. Making incremental progress: Impacts of a REDD+ pilot initiative in Nepal. Environ. Res. Lett. 2020, 15, 105004. [Google Scholar] [CrossRef]
  21. Sarira, T.V.; Zeng, Y.; Neugarten, R.; Chaplin-Kramer, R.; Koh, L.P. Co-benefits of forest carbon projects in Southeast Asia. Nat. Sustain. 2022, 5, 5. [Google Scholar] [CrossRef]
  22. Pandey, S.S.; Cockfield, G.; Maraseni, T.N. Dynamics of carbon and biodiversity under REDD+ regime: A case from Nepal. Environ. Sci. Policy 2014, 38, 272–281. [Google Scholar] [CrossRef]
  23. Beaudrot, L.; Kroetz, K.; Alvarez-Loayza, P.; Amaral, I.; Breuer, T.; Fletcher, C.; Jansen, P.A.; Kenfack, D.; Lima, M.G.M.; Marshall, A.R.; et al. Limited carbon and biodiversity co-benefits for tropical forest mammals and birds. Ecol. Appl. 2016, 26, 1098–1111. [Google Scholar] [CrossRef] [PubMed]
  24. Collins, A.C.; Grote, M.N.; Caro, T.; Ghosh, A.; Thorne, J.; Salerno, J.; Mulder, M.B. How community forest management performs when REDD+ payments fail. Environ. Res. Lett. 2022, 17, 034019. [Google Scholar] [CrossRef]
  25. Graham, V.; Laurance, S.G.; Grech, A.; Venter, O. Spatially explicit estimates of forest carbon emissions, mitigation costs and REDD+ opportunities in Indonesia. Environ. Res. Lett. 2017, 12, 044017. [Google Scholar] [CrossRef]
  26. Lu, H.; Yan, W.; Qin, Y.; Liu, G. More than carbon stocks: A case study of ecosystem-based benefits of REDD+ in Indonesia. Chin. Geogr. Sci. 2012, 22, 390–401. [Google Scholar] [CrossRef]
  27. Fischer, R.; Taubert, F.; Müller, M.S.; Groeneveld, J.; Lehmann, S.; Wiegand, T.; Huth, A. Accelerated forest fragmentation leads to critical increase in tropical forest edge area. Sci. Adv. 2021, 7, eabg7012. [Google Scholar] [CrossRef]
  28. Li, Q.; Jin, T.; Peng, Q.; Lin, J.; Zhang, D.; Huang, J.; Liu, B. Identifying the extent of the spatial expression of landscape fragmentation based on scale effect analysis in Southwest China. Ecol. Indic. 2022, 141, 109120. [Google Scholar] [CrossRef]
  29. Salete Capellesso, E.; Cequinel, A.; Marques, R.; Luisa Sausen, T.; Bayer, C.; Marques, M.C.M. Co-benefits in biodiversity conservation and carbon stock during forest regeneration in a preserved tropical landscape. For. Ecol. Manag. 2021, 492, 119222. [Google Scholar] [CrossRef]
  30. Ojea, E.; Loureiro, M.L.; Alló, M.; Barrio, M. Ecosystem Services and REDD: Estimating the Benefits of Non-Carbon Services in Worldwide Forests. World Dev. 2016, 78, 246–261. [Google Scholar] [CrossRef]
  31. Deng, H.M.; Liang, Q.M.; Liu, L.J.; Anadon, L.D. Co-benefits of greenhouse gas mitigation: A review and classification by type, mitigation sector, and geography. Environ. Res. Lett. 2017, 12, 123001. [Google Scholar] [CrossRef]
  32. Groom, B.; Palmer, C. REDD+ and rural livelihoods. Biol. Conserv. 2012, 154, 42–52. [Google Scholar] [CrossRef]
  33. Huang, M.T.; Zhai, P.M. Achieving Paris Agreement temperature goals requires carbon neutrality by middle century with far-reaching transitions in the whole society. Adv. Clim. Chang. Res. 2021, 12, 281–286. [Google Scholar] [CrossRef]
  34. Liu, Z.; Deng, Z.; He, G.; Wang, H.; Zhang, X.; Lin, J.; Qi, Y.; Liang, X. Challenges and opportunities for carbon neutrality in China. Nat. Rev. Earth Environ. 2021, 3, 141–155. [Google Scholar] [CrossRef]
  35. Sun, L.L.; Cui, H.J.; Ge, Q.S. Will China achieve its 2060 carbon neutral commitment from the provincial perspective? Adv. Clim. Chang. Res. 2022, 13, 169–178. [Google Scholar] [CrossRef]
  36. Zhu, X.; Liu, W.; Chen, H.; Deng, Y.; Chen, C.; Zeng, H. Effects of forest transition on litterfall, standing litter and related nutrient returns: Implications for forest management in tropical China. Geoderma 2019, 333, 123–134. [Google Scholar] [CrossRef]
  37. Cicuzza, D.; Mammides, C. Soil, Topography and Forest Structure Shape the Abundance, Richness and Composition of Fern Species in the Fragmented Tropical Landscape of Xishuangbanna, Yunnan, China. Forests 2022, 13, 1453. [Google Scholar] [CrossRef]
  38. Xiao, C.; Li, P.; Feng, Z.; Liu, X. An updated delineation of stand ages of deciduous rubber plantations during 1987–2018 using Landsat-derived bi-temporal thresholds method in an anti-chronological strategy. Int. J. Appl. Earth Obs. 2019, 76, 40–50. [Google Scholar] [CrossRef]
  39. Yi, Z.F.; Cannon, C.H.; Chen, J.; Ye, C.X.; Swetnam, R.D. Developing indicators of economic value and biodiversity loss for rubber plantations in Xishuangbanna, southwest China: A case study from Menglun township. Ecol. Indic. 2014, 36, 788–797. [Google Scholar] [CrossRef]
  40. Yan, M.; Duan, J.; Li, Y.; Yu, Y.; Wang, Y.; Zhang, J.; Qiu, Y. Construction of the Ecological Security Pattern in Xishuangbanna Tropical Rainforest Based on Circuit Theory. Sustainability 2024, 16, 3290. [Google Scholar] [CrossRef]
  41. Zhai, J.; Xiao, C.; Liu, X.; Liu, Y. Analysis of 10-m Sentinel-2 imagery and a re-normalization approach reveals a declining trend in the latest rubber plantations in Xishuangbanna. Adv. Space Res. 2024, 73, 5910–5924. [Google Scholar] [CrossRef]
  42. Liu, C.A.; Liang, M.Y.; Nie, Y.; Tang, J.W.; Siddique, K.H.M. The conversion of tropical forests to rubber plantations accelerates soil acidification and changes the distribution of soil metal ions in topsoil layers. Sci. Total Environ. 2019, 696, 134082. [Google Scholar] [CrossRef]
  43. Singh, A.K.; Liu, W.; Zakari, S.; Wu, J.; Yang, B.; Jiang, X.J.; Zhu, X.; Zou, X.; Zhang, W.; Chen, C.; et al. A global review of rubber plantati-ons: Impacts on ecosystem functions, mitigations, future directions, and policies for su-stainable cultivation. Sci. Total Environ. 2021, 796, 148948. [Google Scholar] [CrossRef]
  44. Wigboldus, S.; Hammond, J.; Xu, J.; Yi, Z.F.; He, J.; Klerkx, L.; Leeuwis, C. Scaling green rubber cultivation in Southwest China—An integrative analysis of stakeholder perspectives. Sci. Total Environ. 2017, 580, 1475–1482. [Google Scholar] [CrossRef]
  45. Zou, X.; Zhu, X.; Zhu, P.; Singh, A.K.; Zakari, S.; Yang, B.; Chen, C.; Liu, W. Soil quality assessment of different Hevea brasiliensis plantations in tropical China. J. Environ. Manag. 2021, 285, 112147. [Google Scholar] [CrossRef]
  46. Monkai, J.; Hyde, K.D.; Xu, J.; Mortimer, P.E. Diversity and ecology of soil fungal communities in rubber plantations. Fungal Biol. Rev. 2017, 31, 1–11. [Google Scholar] [CrossRef]
  47. Toriyama, J.; Imaya, A.; Hirai, K.; Lim, T.K.; Hak, M.; Kiyono, Y. Effects of forest conversion to rubber plantation and of replanting rubber trees on soil organic carbon pools in a tropical moist climate zone. Agric. Ecosyst. Environ. 2022, 323, 107699. [Google Scholar] [CrossRef]
  48. Tang, H.; Li, L.; Pang, C.; Slate, T.J.; Giraudoux, P.; Afonso, E.; Guo, H.; Wu, G.; Zhang, L. Conservation Strategies for Xishuangbanna: Assessing Habitat Quality Using the InVEST Model and Human–Elephant Conflict Risk with Geographic Information System. Diversity 2024, 16, 761. [Google Scholar] [CrossRef]
  49. Li, H.; Ma, Y.; Aide, T.M.; Liu, W. Past, present and future land-use in Xishuangbanna, China and the implications for carbon dynamics. For. Ecol. Manag. 2008, 255, 16–24. [Google Scholar] [CrossRef]
  50. Li, Y.; Liu, C.; Zhang, J.; Zhang, P.; Xue, Y. Monitoring Spatial and Temporal Patterns of Rubber Plantation Dynamics Using Time-Series Landsat Images and Google Earth Engine. IEEE J. Sel. Top. Appl. Earth Obs. Remote Sens. 2021, 14, 9450–9461. [Google Scholar] [CrossRef]
  51. Lai, Z.; Chen, M.; Liu, T. Changes in and prospects for cultivated land use since the reform and opening up in China. Land Use Policy 2020, 97, 104781. [Google Scholar] [CrossRef]
  52. Ling, Z.; Shi, Z.; Gu, S.; Wang, T.; Zhu, W.; Feng, G. Impact of Climate Change and Rubber (Hevea brasiliensis) Plantation Expansion on Reference Evapotranspiration in Xishuangbanna, Southwest China. Front. Plant Sci. 2022, 13, 830519. [Google Scholar] [CrossRef]
  53. Yang, J.; Xu, J.; Zhai, D.L. Integrating Phenological and Geographical Information with Artificial Intelligence Algorithm to Map Rubber Plantations in Xishuangbanna. Remote Sens. 2021, 13, 2793. [Google Scholar] [CrossRef]
  54. Min, S.; Bai, J.; Huang, J.; Waibel, H. Willingness of smallholder rubber farmers to participate in ecosystem protection: Effects of household wealth and environmental awareness. For. Policy Econ. 2018, 87, 70–84. [Google Scholar] [CrossRef]
  55. Sarathchandra, C.; Dossa, G.G.O.; Ranjitkar, N.B.; Chen, H.; Deli, Z.; Ranjitkar, S.; de Silva, K.H.W.L.; Wickramasinghe, S.; Xu, J.; Harrison, R.D. Effectiveness of protected areas in preventing rubber expansion and deforestation in Xishuangbanna, Southwest China. Land Degrad. Dev. 2018, 29, 2417–2427. [Google Scholar] [CrossRef]
  56. Zhongming, Z.; Linong, L.; Xiaona, Y.; Wangqiang, Z.; Wei, L. 2019 Refinement to the 2006 IPCC Guidelines for National Greenhouse Gas Inventories. 2019. Available online: https://www.ipcc.ch/report/2019-refinement-to-the-2006-ipcc-guidelines-for-national-greenhouse-gas-inventories/ (accessed on 20 February 2023).
  57. Eggleston, H.S.; Buendia, L.; Miwa, K.; Ngara, T.; Tanabe, K. 2006 IPCC Guidelines for National Greenhouse Gas Inventories. 2006. Available online: https://www.osti.gov/etdeweb/biblio/20880391 (accessed on 10 January 2023).
  58. Di, S.; Zong, M.; Li, S.; Li, H.; Duan, C.; Peng, C.; Zhao, Y.; Bai, J.; Lin, C.; Feng, Y.; et al. The effects of the soil environment on soil organic carbon in tea plantations in Xishuangbanna, southwestern China. Agric. Ecosyst. Environ. 2020, 297, 106951. [Google Scholar] [CrossRef]
  59. Sun, Y.; Ma, Y.; Cao, K.; Li, H.; Shen, J.; Liu, W.; Di, L.; Mei, C. Temporal Changes of Ecosystem Carbon Stocks in Rubber Plantations in Xishuangbanna, Southwest China. Pedosphere 2017, 27, 737–746. [Google Scholar] [CrossRef]
  60. Yang, X.; Blagodatsky, S.; Liu, F.; Beckschäfer, P.; Xu, J.; Cadisch, G. Rubber tree allometry, biomass partitioning and carbon stocks in mountainous landscapes of sub-tropical China. For. Ecol. Manag. 2017, 404, 84–99. [Google Scholar] [CrossRef]
  61. Hafezi, M.; Sahin, O.; Stewart, R.A.; Connolly, R.M.; Mackey, B.; Ware, D. Adaptation strategies for coral reef ecosystems in Small Island Developing States: Integrated modelling of local pressures and long-term climate changes. J. Clean. Prod. 2020, 253, 119864. [Google Scholar] [CrossRef]
  62. Kaur, M.; Hewage, K.; Sadiq, R. Investigating the impacts of urban densification on buried water infrastructure through DPSIR framework. J. Clean. Prod. 2020, 259, 120897. [Google Scholar] [CrossRef]
  63. Tesfaldet, Y.T.; Ndeh, N.T. Assessing face masks in the environment by means of the DPSIR framework. Sci. Total Environ. 2022, 814, 152859. [Google Scholar] [CrossRef]
  64. Wold, H. 11—Path Models with Latent Variables: The NIPALS Approach. In Quant-Itative Sociology; Blalock, H.M., Aganbegian, A., Borodkin, F.M., Boudon, R., Capecchi, V., Eds.; Academic Press: Cambridge, MA, USA, 1975; pp. 307–357. [Google Scholar] [CrossRef]
  65. Wold, H. Soft modelling: The Basic Design and Some Extensions. In Systems Under Indirect Observation, Part II; North-Holland: Amsterdam, The Netherlands, 1982; pp. 36–37. [Google Scholar]
  66. Fornell, C.; Larcker, D.F. Evaluating Structural Equation Models with Unobservable Variables and Measurement Error. J. Mark. Res. 1981, 18, 39–50. [Google Scholar] [CrossRef]
  67. Anderson, J.C.; Gerbing, D.W. Structural equation modeling in practice: A re-view and recommended two-step approach. Psychol. Bull. 1988, 103, 411–423. [Google Scholar] [CrossRef]
  68. Koufteros, X.A. Testing a model of pull production: A paradigm for manufacturing research using structural equation modeling. J. Oper. Manag. 1999, 17, 467–488. [Google Scholar] [CrossRef]
  69. Zhang, H.; Xu, H. A structural model of liminal experience in tourism. Tour. Manag. 2019, 71, 84–98. [Google Scholar] [CrossRef]
  70. da Silva, E.T.; Martins, M.A.F.; Rodríguez, J.L.M.; Ferreira, A.S. Evaluation of the influence of distributed generation on the well-being of the rural community using PLS-SEM. J. Clean. Prod. 2024, 442, 141023. [Google Scholar] [CrossRef]
  71. Ramos-Quintana, F.; Ortíz-Hernández, M.L.; Sánchez-Salinas, E.; Úrsula-Vázquez, E.; Guerrero, J.A.; Zamorano, M. Quantitative-qualitative assessments of environmental causal networks to support the DPSIR framework in the decision-making process. Environ. Impact Assess. Reviron. 2018, 69, 42–60. [Google Scholar] [CrossRef]
  72. Zhou, G.; Singh, J.; Wu, J.; Sinha, R.; Laurenti, R.; Frostell, B. Evaluating low-carbon city initiatives from the DPSIR framework perspective. Habitat Int. 2015, 50, 289–299. [Google Scholar] [CrossRef]
  73. Hou, Y.; Zhou, S.; Burkhard, B.; Müller, F. Socioeconomic influences on biodiversity, ecosystem services and human well-being: A quantitative application of the DPSIR model in Jiangsu, China. Sci. Total Environ. 2014, 490, 1012–1028. [Google Scholar] [CrossRef]
  74. Mosaffaie, J.; Salehpour Jam, A.; Tabatabaei, M.R.; Kousari, M.R. Trend assessment of the watershed health based on DPSIR framework. Land Use Policy 2021, 100, 104911. [Google Scholar] [CrossRef]
  75. Belay, T.; Mengistu, D.A. Land use and land cover dynamics and drivers in the Muga watershed, Upper Blue Nile basin, Ethiopia. Remote Sens. Appl. Soc. Environ. 2019, 15, 100249. [Google Scholar] [CrossRef]
  76. Chen, C.; Park, T.; Wang, X.; Piao, S.; Xu, B.; Chaturvedi, R.K.; Fuchs, R.; Brovkin, V.; Ciais, P.; Fensholt, R.; et al. China and India lead in greening of the world through land-use management. Nat. Sustain. 2019, 2, 2. [Google Scholar] [CrossRef]
  77. Wang, X.; Dong, X.; Liu, H.; Wei, H.; Fan, W.; Lu, N.; Xu, Z.; Ren, J.; Xing, K. Linking land use change, ecosystem services and human well-being: A case study of the Manas River Basin of Xinjiang, China. Ecosyst. Serv. 2017, 27, 113–123. [Google Scholar] [CrossRef]
  78. Wang, Y.; Dai, E.; Yin, L.; Ma, L. Land use/land cover change and the effects on ecosystem services in the Hengduan Mountain region, China. Ecosyst. Serv. 2018, 34, 55–67. [Google Scholar] [CrossRef]
  79. Wehner, S.; Herrmann, S.; Berkhoff, K. CLUENaban—A land use change model combining social factors with physical landscape factors for a mountainous area in Southwest China. Ecol. Indic. 2014, 36, 757–765. [Google Scholar] [CrossRef]
  80. Yu, J.; Li, F.; Wang, Y.; Lin, Y.; Peng, Z.; Cheng, K. Spatiotemporal evolution of tropical forest degradation and its impact on ecological sensitivity: A case study in Jinghong, Xishuangbanna, China. Sci. Total Environ. 2020, 727, 138678. [Google Scholar] [CrossRef]
  81. Cao, H.; Liu, J.; Fu, C.; Zhang, W.; Wang, G.; Yang, G.; Luo, L. Urban Expansion and Its Impact on the Land Use Pattern in Xishuangbanna since the Reform and Opening up of China. Remote Sens. 2017, 9, 137. [Google Scholar] [CrossRef]
  82. Zhang, L.; Kono, Y.; Kobayashi, S.; Hu, H.; Zhou, R.; Qin, Y. The expansion of smallholder rubber farming in Xishuangbanna, China: A case study of two Dai villages. Land Use Policy 2015, 42, 628–634. [Google Scholar] [CrossRef]
  83. Mbow, H.O.P.; Reisinger, A.; Canadell, J.; O’Brien, P. Special Report on Climate Change, Desertification, Land Degradation, Sustainable Land Management, Food Security, and Greenhouse Gas Fluxes in Terrestrial Ecosystems (SR2); IPCC: Geneva, Switzerland, 2017; p. 650. [Google Scholar]
  84. Min, S.; Huang, J.; Waibel, H.; Yang, X.; Cadisch, G. Rubber Boom, Land Use Change and the Implications for Carbon Balances in Xishuangbanna, Southwest China. Ecol. Econ. 2019, 156, 57–67. [Google Scholar] [CrossRef]
  85. Fang, Z.; Bai, Y.; Jiang, B.; Alatalo, J.M.; Liu, G.; Wang, H. Quantifying var-iations in ecosystem services in altitude-associated vegetation types in a tropical region of China. Sci. Total Environ. 2020, 726, 138565. [Google Scholar] [CrossRef]
  86. Wang, M.M.H.; Carrasco, L.R.; Edwards, D.P. Reconciling Rubber Expansi-on with Biodiversity Conservation. Curr. Biol. 2020, 30, 3825–3832.e4. [Google Scholar] [CrossRef]
  87. Yang, X.; Blagodatsky, S.; Lippe, M.; Liu, F.; Hammond, J.; Xu, J.; Cadisch, G. Land-use change impact on time-averaged carbon balances: Rubber expansion and reforestation in a biosphere reserve, South-West China. For. Ecol. Manag. 2016, 372, 149–163. [Google Scholar] [CrossRef]
  88. Hu, Z.; Yang, X.; Yang, J.; Yuan, J.; Zhang, Z. Linking landscape pattern, ecosystem service value, and human well-being in Xishuangbanna, southwest China: Insights from a coupling coordination model. Glob. Ecol. Conserv. 2021, 27, e01583. [Google Scholar] [CrossRef]
  89. Cadman, T.; Maraseni, T.; Ma, H.O.; Lopez-Casero, F. Five years of REDD+ governance: The use of market mechanisms as a response to anthropogenic climate change. For. Policy Econ. 2017, 79, 8–16. [Google Scholar] [CrossRef]
  90. Turnhout, E.; Gupta, A.; Weatherley-Singh, J.; Vijge, M.J.; de Koning, J.; Visseren-Hamakers, I.J.; Herold, M.; Lederer, M. Envisioning REDD+ in a post-Paris era: Between evolving expectations and current practice. WIREs Clim. Chang. 2017, 8, e425. [Google Scholar] [CrossRef]
  91. Ken, S.; Entani, T.; Tsusaka, T.W.; Sasaki, N. Effect of REDD+ projects on local livelihood assets in Keo Seima and Oddar Meanchey, Cambodia. Heliyon 2020, 6, e03802. [Google Scholar] [CrossRef]
  92. Soliev, I.; Theesfeld, I.; Abert, E.; Schramm, W. Benefit sharing and conflict transformation: Insights for and from REDD+ forest governance in sub-Saharan Africa. For. Policy Econ. 2021, 133, 102623. [Google Scholar] [CrossRef]
  93. Tegegne, Y.T.; Ramcilovic-Suominen, S.; Fobissie, K.; Visseren-Hamakers, I.J.; Lindner, M.; Kanninen, M. Synergies among social safeguards in FLEGT and REDD+ in Cameroon. For. Policy Econ. 2017, 75, 1–11. [Google Scholar] [CrossRef]
  94. Deere, N.J.; Guillera-Arroita, G.; Baking, E.L.; Bernard, H.; Pfeifer, M.; Reynolds, G.; Wearn, O.R.; Davies, Z.G.; Struebig, M.J. High Carbon Stock forests provide co-benefits for tropical biodiversity. J. Appl. Ecol. 2018, 55, 997–1008. [Google Scholar] [CrossRef]
  95. Li, Q.; Liu, G. Is land nationalization more conducive to sustainable development of cultivated land and food security than land privatization in post-socialist Central Asia? Glob. Food Secur. 2021, 30, 100560. [Google Scholar] [CrossRef]
  96. Su, S.; Wan, C.; Li, J.; Jin, X.; Pi, J.; Zhang, Q.; Weng, M. Economic benefit and ecological cost of enlarging tea cultivation in subtropical China: Characterizing the trade-off for policy implications. Land Use Policy 2017, 66, 183–195. [Google Scholar] [CrossRef]
  97. Kou, W.; Dong, J.; Xiao, X.; Hernandez, A.J.; Qin, Y.; Zhang, G.; Chen, B.; Lu, N.; Doughty, R. Expansion dynamics of deciduous rubber plantations in Xishuangb-anna, China during 2000–2010. GISci. Remote Sens. 2018, 55, 905–925. [Google Scholar] [CrossRef]
  98. Smajgl, A.; Xu, J.; Egan, S.; Yi, Z.-F.; Ward, J.; Su, Y. Assessing the effectiveness of payments for ecosystem services for diversifying rubber in Yunnan, China. Environ. Modell. Softw. 2015, 69, 187–195. [Google Scholar] [CrossRef]
  99. Leakey, R.R.B. A re-boot of tropical agriculture benefits food production, rural economies, health, social justice and the environment. Nat. Food 2020, 1, 260–265. [Google Scholar] [CrossRef]
  100. Leakey, R.R.B. A multifunctional future for tropical agriculture: Scoring multiple Sustainable Development Goals simultaneously? Agric. Dev. 2023, 47, 22–46. [Google Scholar]
  101. Leakey, R.R.B. From ethnobotany to mainstream agriculture: Socially modified Cinderella species capturing ‘trade-ons’ for ‘land maxing’. Planta 2019, 250, 949–970. [Google Scholar] [CrossRef]
  102. Chen, C.; Liu, W.; Jiang, X.; Wu, J. Effects of rubber-based agroforestry systems on soil aggregation and associated soil organic carbon: Implications for land use. Geoderma 2017, 299, 13–24. [Google Scholar] [CrossRef]
  103. Jiang, X.J.; Liu, W.; Wu, J.; Wang, P.; Liu, C.; Yuan, Z.-Q. Land Degradation Controlled and Mitigated by Rubber-based Agroforestry Systems through Optimizing Soil Physical Conditions and Water Supply Mechanisms: A Case Study in Xishuangbanna, China. Land Degrad. Dev. 2017, 28, 2277–2289. [Google Scholar] [CrossRef]
  104. Yang, B.; Meng, X.; Singh, A.K.; Wang, P.; Song, L.; Zakari, S.; Liu, W. Intercrops improve surface water availability in rubber-based agroforestry systems. Agric. Ecosyst. Environ. 2020, 298, 106937. [Google Scholar] [CrossRef]
  105. Schroeder, H.; Di Gregorio, M.; Brockhaus, M.; Pham, T.T. Policy learning in REDD+ Donor Countries: Norway, Germany and the UK. Glob. Environ. Chang. 2020, 63, 102106. [Google Scholar] [CrossRef]
  106. Shin, S.; Park, M.S.; Lee, H.; Baral, H. The structure and pattern of global partnerships in the REDD+ mechanism. For. Policy Econ. 2022, 135, 102640. [Google Scholar] [CrossRef]
  107. Simonet, G.; Agrawal, A.; Atmadja, S.; Bénédet, F.; Cromberg, M.; de Perthuis, C.; Haggard, D.; Jansen, N.; Karsenty, A.; Liang, W. ID-RECCO, International Database on REDD+ Projects and Programs: Linking Economics, Carbon and Communities; Center for International Forestry Research (CIFOR): Bogor, Indonesia, 2020; Available online: https://www.reddprojectsdatabase.org (accessed on 20 February 2023).
  108. Jayachandran, S.; de Laat, J.; Lambin, E.F.; Stanton, C.Y.; Audy, R.; Thomas, N.E. Cash for carbon: A randomized trial of payments for ecosystem services to reduce deforestation. Science 2017, 357, 267–273. [Google Scholar] [CrossRef]
  109. Roopsind, A.; Sohngen, B.; Brandt, J. Evidence that a national REDD+ program reduces tree cover loss and carbon emissions in a high forest cover, low deforestation country. Proceedings of the National Academy of Sciences of the United States of America. Proc. Natl. Acad. Sci. USA 2019, 116, 24492–24499. [Google Scholar] [CrossRef]
  110. Guizar-Coutiño, A.; Jones, J.P.G.; Balmford, A.; Carmenta, R.; Coomes, D.A. A global evaluation of the effectiveness of voluntary REDD+ projects at reducing deforestation and degradation in the moist tropics. Conserv. Biol. 2022, 36, e13970. [Google Scholar] [CrossRef]
  111. Gari, S.R.; Newton, A.; Icely, J.D. A review of the application and evolution of the DPSIR framework with an emphasis on coastal social-ecological systems. Ocean Coast. Manag. 2015, 103, 63–77. [Google Scholar] [CrossRef]
  112. Mohibul, S.; Sarif, M.N.; Parveen, N.; Khanam, N.; Siddiqui, M.A.; Naqvi, H.R.; Nasrin, T.; Siddiqui, L. Wetland health assessment using DPSI framework: A case study in Kolkata Metropolitan Area. Environ. Sci. Pollut. Res. 2023, 30, 107158–107178. [Google Scholar] [CrossRef]
  113. Liu, W.X.; Sun, C.Z.; Zhao, M.J.; Wu, Y.J. Application of a DPSIR modeling framework to assess spatial–temporal differences of water poverty in China. JAWRA J. Am. Water Resour. Assoc. 2019, 55, 259–273. [Google Scholar] [CrossRef]
  114. Afthanorhan, A.; Awang, Z.; Aimran, N. An extensive comparison of CB-SEM and PLS-SEM for reliability and validity. Int. J. Data Netw. Sci. 2020, 4, 357–364. [Google Scholar] [CrossRef]
  115. Duan, M.; Bax, C.; Laakso, K.; Mashhadi, N.; Mattie, N.; Sanchez-Azofeifa, A. Characterizing transitions between successional stages in a tropical dry forest using LiDAR techniques. Remote Sens. 2023, 15, 479. [Google Scholar] [CrossRef]
  116. Vibrans, A.C.; McRoberts, R.E.; Moser, P.; Nicoletti, A.L. Using satellite image-based maps and ground inventory data to estimate the area of the remaining Atlantic forest in the Brazilian state of Santa Catarina. Remote Sens. Environ. 2013, 130, 87–95. [Google Scholar] [CrossRef]
  117. Hair, J.F.; Ringle, C.M.; Sarstedt, M. PLS-SEM: Indeed a silver bullet. J. Mark. Theory Pract. 2011, 19, 139–152. [Google Scholar] [CrossRef]
  118. Hair, J.F., Jr.; Sarstedt, M.; Hopkins, L.; Kuppelwieser, V.G. Partial least squares structural equation modeling (PLS-SEM): An emerging tool in business research. Eur. Bus. Rev. 2014, 26, 106–121. [Google Scholar] [CrossRef]
  119. Astrachan, C.B.; Patel, V.K.; Wanzenried, G. A comparative study of CB-SEM and PLS-SEM for theory development in family firm research. J. Fam. Bus. Strateg. 2014, 5, 116–128. [Google Scholar] [CrossRef]
  120. Sarstedt, M.; Ringle, C.M.; Smith, D.; Reams, R.; Hair, J.F., Jr. Partial least squares structural equation modeling (PLS-SEM): A useful tool for family business researchers. J. Fam. Bus. Strateg. 2014, 5, 105–115. [Google Scholar] [CrossRef]
Figure 1. The location of the Xishuangbanna Prefecture in the southwestern Yunnan Province of China.
Forests 16 00120 g001
Figure 2. Magnitude and transfer of land-use change during entire study period of 1976–2007.
Forests 16 00120 g002
Figure 3. Net carbon budget as function of carbon absorption and emissions among natural eco-regions, human living zones, economic crop zones, and food crop zones.
Forests 16 00120 g003
Figure 4. Results of the model runs.
Forests 16 00120 g004
Table 1. The DPSI index system.
Latent VariablesObserved VariablesThe Significance of the Indexes
DriverSocio-economic changesV1. Fixed asset investmentThe amount of fixed asset investments under socio-economic development
V2. Total populationThe total population resource
V3. Fiscal revenueThe financial position of the government
PressureProduction factor supplyV4. Agricultural intermediate consumptionThe size of intermediate inputs for agricultural development
V5. The amount of chemical fertilizerThe demand for fertilizer for regional agricultural development
TransportationV6. Highway mileageThe scale of road construction
V7. Ownership of civil carsThe level of transportation development
StateLand-use changeV8. Rubber yieldThe change in rubber land area
V9. Grain yieldChanges in agricultural land area
V10. Cultivated areaChanges in cultivated land area
V11. Tea yieldChanges in tea land area
ImpactCarbon benefitsV12. Carbon emissionsChanges in carbon emissions
V13. Power generationRegional power generation
Social benefitsV14. The total output value of agricultureThe scale and results of agricultural production over time
V15. Per capita net income of farmersThe standard of living of farmers
V16. The added value of primary industriesThe total value added by primary industries (such as agriculture and forestry)
Environment-based benefitsV17. Landscape aggregationThe degree of aggregation of the landscape
V18. The number of landscape patchesThe fragmentation of the landscape
V19. Rural electricity consumptionRural energy use
Table 2. The significance of test results and reliability and validity test indexes of the measurement model and results.
Latent VariablesCronbach’s αComposite Reliability (CR)Average Variance Extracted (AVE)Observed VariablesPath Coefficient
Driver (D)0.9550.9710.918V1 0.966 ***
V20.982 ***
V30.927 ***
Pressure (P)0.9170.9420.803V40.953 ***
V50.928 ***
V60.812 ***
V70.885 ***
State (S)0.9260.9450.812V80.962 ***
V90.843 ***
V100.889 ***
V110.908 ***
Impact 1 (I1)0.9340.9680.938V120.971 ***
V130.967 ***
V140.923 ***
Impact 2 (I2)0.9370.960.888V150.943 ***
V160.961 ***
Impact 3 (I3)0.9730.9820.949V170.974 ***
V180.978 ***
V190.971 ***
Note: *** indicates statistical significance at the level of 0.001.
Table 3. Discriminant validity test of measurement model (AVE test and confidence interval test).
Variable PairsAVE Test95% Confidence Interval of Correlates
Lower BoundUpper Bound
DD0.958NA *NA
DP0.9470.9060.976
DS0.8770.8580.924
DI10.9290.8740.971
DI20.9390.9180.985
DI30.9550.9120.982
PP0.896NANA
PS0.7340.6580.832
PI10.8770.7930.940
PI20.8910.8320.946
PI30.9440.9150.972
SS0.901NANA
SI10.8920.8650.956
SI20.8990.8740.960
SI30.8420.7640.915
I1I10.969NANA
I1I20.9400.8980.977
I1I30.9420.8870.972
I2I20.942NANA
I2I30.9360.8910.970
I3I30.974NANA
Note: The diagonal element is the square roots of AVE and the other elements are the correlation coefficients of each latent variable. * NA for Not Applicable.
Table 4. Results of research hypothesis testing.
Research HypothesisPath Coefficientp-ValueResults of Hypothesis Testing
H1:D→P0.949 0.000 Acceptance
H2:D→I20.630 0.001Acceptance
H3:P→S0.734 0.000 Acceptance
H4:P→I30.708 0.000Acceptance
H5:S→I10.909 0.000Acceptance
H6:S→I20.363 0.002 Acceptance
H7:S→I30.322 0.001Acceptance
Disclaimer/Publisher’s Note: The statements, opinions and data contained in all publications are solely those of the individual author(s) and contributor(s) and not of MDPI and/or the editor(s). MDPI and/or the editor(s) disclaim responsibility for any injury to people or property resulting from any ideas, methods, instructions or products referred to in the content.

