Abstract
The rheology of wood thermoplastics is a crucial factor in enhancing wood utilization efficiency, significantly impacting the various applications of wood. The rheological properties of these thermoplastics are influenced by several variables, including moisture content, temperature, and fiber morphology. This study aims to investigate the rheological characteristics of wood under differing moisture levels (from absolute drying to water-impregnated states), thicknesses (ranging from 3 to 15 mm), compression methods, and compression conditions through a series of compression tests. The results show that moisture content and thickness substantially affect the rheological properties of wood thermoplastics, whereas thermal compression conditions exert a comparatively minor influence. Additionally, analysis of the content of the three primary elements in wood, alongside microscopic morphological examination, reveals that increased fiber length and higher length–diameter ratio are associated with enhanced rheological properties of wood thermoplastics. Notably, the influence of cellulose content (ranging from 40%–50%) on these rheological characteristics appears to be limited.
1. Introduction
With the rapid development of the national economy, the increasing demand for wood resources across society is becoming more pronounced. Presently, China is the largest consumer, processor, and trader of wood globally with an annual wood consumption exceeding 600 million m3 [1,2]. Despite the presence of artificial fast-growing forests in China, the demand for large-diameter, high-quality timber still heavily relies on imports, with the external dependence for commercial timber reaching nearly 60% [3]. To alleviate the pressures on wood supply and promote sustainability and stability, the exploration of efficient wood utilization methods has emerged as a crucial topic in the wood processing industry. In recent years, wood thermoplastic compression-molding technology has garnered attention [4]. This technology entails subjecting wood to compression under controlled moisture and heating conditions, inducing significant internal shear stress in the material, resulting in the deformation and slippage of wood cells [5]. By integrating wood into various plastic-forming processes within industries such as metals and plastics, this technology not only enhances traditional wood processing methods in terms of performance and waste reduction, but also preserves the natural texture and strength of wood [6]. It allows for the rapid production of intricately shaped wooden products, presenting a novel approach to expanding wood utilization.
In current research on wood thermoplastic molding technology, studies typically focus on wood-based composite materials [7,8], adhesive selection and modification [9,10], and optimization of molding processes [11]. However, due to wood being a porous, non-uniform, and anisotropic material, significant differences in thermoplastic rheological properties exist among different wood species. Scholars have made certain progress in studying the thermoplastic rheological properties of wood under specific environmental conditions, such as constant temperature and humidity [12,13,14]. Moreover, the thermoplastic rheological properties of wood are closely related to its intrinsic characteristics (density, tissue structure, chemical composition) [15]. However, research has not yet explored the differences in thermoplastic rheological properties among various tree species, nor conducted a fundamental study that integrates this analysis with a micro-level perspective.
This study aims to investigate the factors that influence the thermoplastic rheological properties of wood. Compression tests will be performed to measure the load–stroke curves during the compression of various tree species. The research will analyze variations in thermoplastic rheological properties according to different moisture contents, thicknesses, fiber orientations, and compression conditions. Furthermore, by integrating analyses of wood cell tissue proportions, fiber morphology, and chemical composition, this study seeks to elucidate the distinctions in thermoplastic rheological properties among different tree species. This comprehensive analysis will provide theoretical guidance for optimizing processing conditions and material selection, thereby laying the groundwork for advancing both theoretical and practical research in wood thermoplastic molding technology.
2. Materials and Methods
2.1. Materials
In accordance with the gradient of tree species density, we selected five tree species for our study. Wood density was assessed using the Chinese Standard: Method for determination of the density of wood (GB/T 1933-2009) [16]. Among these species, three were broadleaf trees with air-dry densities of 0.5, 0.6, and 0.7 g/cm3, while the remaining two were coniferous trees with air-dry densities of 0.4 and 0.7 g/cm3. The specific tree species, Populus ussuriensis Kom., Fraxinus chinensis Roxb., Swietenia macrophylla, Cunninghamia konishii, and Larix gmelinii (Rupr.) Kuzen, were sourced from the Longjiang Building Materials Market in Nanjing, China, as detailed in Table 1. Notably, the wood samples underwent no specialized treatments.

Table 1.
Wood density.
Moisture content adjustments involved the use of Lithium chloride and Sodium chloride solutions. For wood microsection preparation, we utilized Safranine, absolute ethanol, and a biological transparentizing agent. Additionally, fiber morphology determination was facilitated by employing 30% hydrogen peroxide (H2O2), 95% acetic acid (CH3COOH), and safranine. Furthermore, wood chemical composition measurements were conducted using 98% sulfuric acid (H2SO4) and 50% sodium hydroxide (NaOH), with all chemical reagents sourced from Sinopharm Chemical Reagent Co., Ltd., Shanghai, China.
2.2. Preparation of Specimens
First, the lumber was cut into wooden blocks with dimensions of 15 mm (L) × 30 mm (T) × 15 mm (R) using the circular saw (MJ2236, Shunde Xinma woodworking machinery Equipment Co., Ltd., Foshan, China). These blocks were then processed into circular specimens with a diameter of 15 mm using a three-dimensional CNC machine tool (Xunchuan electromechanical equipment Co., Ltd., Shanghai, China). The parameters of each specimen in the test group are detailed in Table 2, with five parallel samples set for each condition. All specimens were free of defects and knots.
Table 2.
Basic information of compression test.
2.3. Wood Moisture Content Adjustment
Moisture content levels ranging from dry to water-impregnated states were established. Samples were oven-dried at 105 °C for 72 h, then adjusted to 10% moisture content, and subsequently to 20% and 30% using the saturated salt solution method [17,18]. Water-impregnated samples were prepared through vacuum impregnation, undergoing a 2 h vacuum treatment followed by a 2.5 h immersion under pressure. The calculation of moisture content is based on the absolute moisture content formula, which involves subtracting the mass of the absolute dry sample from the mass of the sample after it has absorbed moisture. The resulting mass of moisture is then divided by the absolute dry mass of the sample, and the calculation formula is shown as (1). The moisture content of the impregnated samples is presented in Table 3.
Table 3.
The average wood moisture content of water impregnation.
2.4. Compression Test Method
This method refers to the free compression test conducted by Tsunehisa Miki [19]. The thermoplastic rheological behavior of the samples was evaluated by a universal mechanical testing machine (AG-1C, Yinzhou Jinrui Instrument Equipment Co., Ltd., Ningbo, China). A uniaxial compression metal tool with constant temperature heating was designed to ensure a consistent contact surface area between the tool and the sample, thereby preventing lateral deformation of the specimen. The thermoplastic rheological behavior of the specimen was assessed through the load–stroke curve, revealing a distinct inflection point where wood begins to undergo tangential deformation, indicating the onset of flow under this load.
In the compression tests, the preheating temperature, pressure rate, and heating time for each experimental group are detailed in Table 2. The metal tool was preheated to the desired temperature, and then the device was adjusted to lightly contact the top and bottom of the sample for a specified heating period. Subsequently, a load of up to 50 KN was applied (as shown in Figure 1) to obtain the load–stroke curve of the sample compression process. From left to right, the scanned images of the samples after compression tests under the 3–15 mm conditions for Table 1, Group 2 Populus ussuriensis are shown. Each column represents the five parallel samples for each condition.
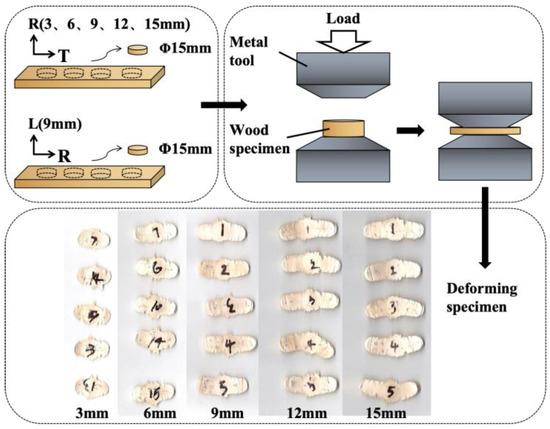
Figure 1.
Compression tests schematic diagram.
2.5. Method for Measuring the Proportion of Wood Cell Tissue
Wood samples were cut into 20 μm-thick cross and tangential sections using a rotary microtome (YAMATO REM-710, Shanghai Verde Instrument Technology Co., Ltd., Shanghai, China), and the section diagram is shown in Figure 2. These sections were stained with Safranin, dehydrated in anhydrous ethanol, and permanently mounted. The prepared slides were examined and photographed using an optical microscope (OLYMPUS-BX51, Beijing Precise Instrument Co., Ltd., Beijing, China) to capture images of the wood cross and tangential sections. ImageJ 1.53 software was employed to calculate the area percentage of various cellular structures in the cross-section, determining the proportions of vessels, wood fibers, axial parenchyma, and ray cells in hardwoods, as well as the proportions of axial tracheids, axial parenchyma, ray cells, and resin canals in coniferous wood.
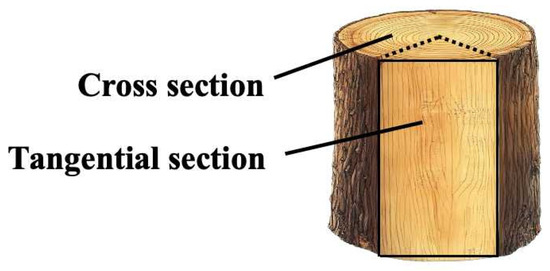
Figure 2.
Sectional diagram.
2.6. Method for Measuring the Morphological Characteristics of Wood Fiber
To prepare wood samples for analysis, small wood strips were arranged in a glass test tube, aligning with the fiber direction. A dissociation solution was prepared by mixing 30% hydrogen peroxide (H2O2) and 95% acetic acid (CH3COOH) in a 1:1 volume ratio. The test tube was then submerged in a water bath at 70 °C for 8 h, until the strips became white and fluffy. Subsequently, the strips were rinsed with deionized water to eliminate any residual odor, stained with safranin, and mounted on temporary slides. Finally, the samples were examined under an OLYMPUS-BX51 optical microscope, and the morphological characteristics of the wood fibers were analyzed using Motic Images Plus 2.0 software.
2.7. Method for Measuring the Content of Chemical Components of Wood
An appropriate quantity of wood was ground into a fine powder and subsequently dried. Three replicate samples were prepared for each tree species, which were then passed through a 60–80 mesh screen. Following the standard protocol established by the National Renewable Energy Laboratory (NREL), high-performance liquid chromatography (HPLC) was employed to quantify the contents of cellulose and hemicellulose. The acid-soluble lignin content was measured using an ultraviolet spectrophotometer (UV-1800, Shanghai Musen Biotechnology Co., Ltd., Shanghai, China). To determine the acid-insoluble lignin content, the residue from acid hydrolysis is incinerated in a muffle furnace (DR2, Derui Testing Equipment Co., Ltd., Dongguan, China). The total lignin content is calculated by summing the acid-soluble and acid-insoluble lignin fractions.
3. Results and Discussion
3.1. Compression Test
3.1.1. The Effect of Moisture Content on the Thermoplastic Rheological Properties of Wood
Compression tests were conducted on five tree species under different moisture content conditions, specifically at moisture contents of 0, 10, 20, and 30%, as well as in water-impregnation conditions. The results are shown in Figure 3, and the remaining testing conditions are detailed in Table 2, Group 1. As seen in Figure 3a, with the increase in moisture content, the yield load of all specimens shows a decreasing trend. There is a positive correlation between specimen moisture content and rheological properties, indicating that higher specimen moisture content results in better wood rheological properties. This occurs because water molecules entering the wood enhance the extensibility of lignin molecules, resulting in a looser microstructure of the wood that is more susceptible to rheological behavior [20].
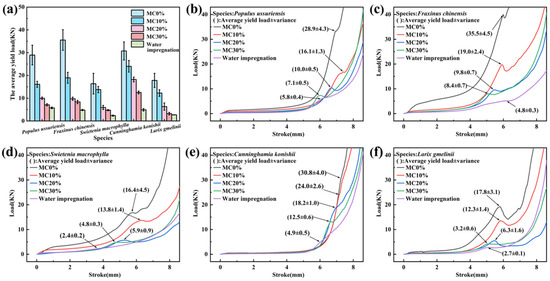
Figure 3.
Compression tests under different moisture contents. (a) The average yield load; (b) Populus ussuriensis; (c) Fraxinus chinensis; (d) Swietenia macrophylla; (e) Cunninghamia konishii; (f) Larix gmelinii.
Five tree species exhibited a substantial decrease in yield load when impregnated with water, compared to their dry state. Populus ussuriensis (Figure 3b) decreased by 80%, Fraxinus chinensis (Figure 3c) by 86.5%, Swietenia macrophylla (Figure 3d) by 85.4%, Cunninghamia konishii (Figure 3e) by 84.1%, and Larix gmelinii (Figure 3f) by 84.8%. Fraxinus chinensis displayed the most pronounced decrease, while Populus ussuriensis showed the least change. Swietenia macrophylla presented a notable advantage in rheological properties compared to other wood species, likely due to its higher density. Increased wood density may provide a greater number of thermoplastic rheological components.
3.1.2. The Effect of Thickness on the Thermoplastic Rheological Properties of Wood
Compression tests were performed on five tree species under varying thickness conditions, specifically at thicknesses of 3, 6, 9, 12 and 15 mm. The results are illustrated in Figure 3, while additional testing conditions are provided in Table 2, Group 2. Populus ussuriensis (Figure 4b) had a yield load of 30.0 KN at 3 mm and 5.5 KN at 15 mm, a decrease of 81.7%; Fraxinus chinensis (Figure 4c) had a yield load of 17.4 KN at 3 mm and 5.0 KN at 15 mm, a decrease of 71.3%; Swietenia macrophylla (Figure 4d) had a yield load of 8.2 KN at 3 mm and 3.2 KN at 15 mm, a decrease of 70.0%; Cunninghamia konishii (Figure 4e) did not exhibit yielding at 3 mm, had a yield load of 22.7 KN at 6 mm, and 7.1 KN at 15 mm, a decrease of 68.7%; Larix gmelinai (Figure 4f) had a yield load of 7.7 KN at 3 mm and 3.1 KN at 15 mm, a decrease of 59.7%. It can be observed that as the thickness increases, the yield load of all tree species decreases. This is due to the increase in wood thickness leading to an increase in sample mass, providing more viscous rheological material. Among them, the most significant decrease was observed in Populus ussuriensis, while the least change was observed in Larix gmelinii. It is noteworthy that Larix gmelinii exhibited thermoplastic rheological behavior under all thickness conditions, with its yield load consistently lower than other tree species, demonstrating good thermoplastic rheological properties.
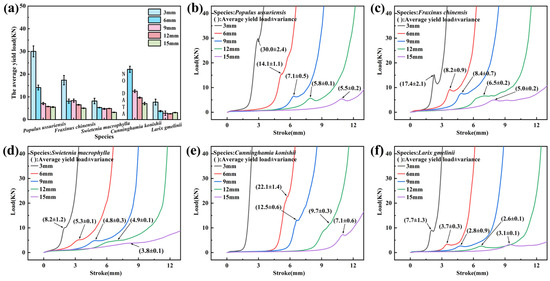
Figure 4.
Compression tests under different thicknesses. (a) The average yield load; (b) Populus ussuriensis; (c) Fraxinus chinensis; (d) Swietenia macrophylla; (e) Cunninghamia konishii; (f) Larix gmelinii.
3.1.3. The Effect of Fiber Direction on the Thermoplastic Rheological Properties of Wood
The differences in the multi-scale structural composition of wood result in different mechanical responses in different fiber directions. The compression test results of five tree species in the parallel fiber direction and perpendicular to the fiber direction are shown in Figure 5, while additional testing conditions are provided in Table 2, Group 3. From Figure 5a, only Fraxinus chinensis exhibited rheological behavior when compressed in the parallel fiber direction, with a yield load of 6.7 KN, lower than that of the perpendicular fiber direction. The fiber direction of wood determines its strength, and this may be because Fraxinus chinensis has higher flexibility, making it more prone to bending and rheological behavior under compression along the fiber. Due to the load limit of the universal mechanical testing machine used in this experiment being 50 KN, rheological behavior was not observed in the other four tree species within this load range. In the test perpendicular to the fiber direction, the Larix gmelinii and Swietenia macrophylla exhibited better thermoplastic rheological properties.
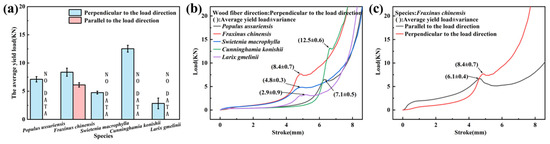
Figure 5.
Compression tests under different fiber directions. (a) The average yield load; (b) Perpendicular to the load direction; (c) Fraxinus chinensis.
3.1.4. Thermal Analysis of the Effect of Temperature on the Thermoplastic Rheological Properties of Wood
To investigate the effect of temperature on the thermoplastic rheological properties of wood, compression tests were conducted on five tree species at different temperatures, specifically at 100, 120, 140, and 160 °C. The results are shown in Figure 6, while the remaining conditions are detailed in Table 2, Group 4. From Figure 6a, Cunninghamia konishii undergoes rheological behavior only at 120 °C, while the yield load values of the other specimens decrease with increasing temperature. There is a positive correlation between temperature and thermoplastic rheological properties, indicating that the higher the temperature, the better the thermoplastic rheological properties of wood. As the temperature rises, the amorphous substance lignin in wood transitions to a viscous flow state, thereby increasing the plasticity of wood. As the temperature increases from 100 °C to 160 °C, the yield load of the other four tree species decreases. Populus ussuriensis (Figure 6b) decreases by 30.6%, Fraxinus chinensis (Figure 6c) decreases by 28.4%, Swietenia macrophylla (Figure 6d) decreases by 28.6%, and Larix gmelinii (Figure 6f) decreases by 21.9%, with Populus ussuriensis showing the most significant decrease and Larix gmelinii showing the smallest change.
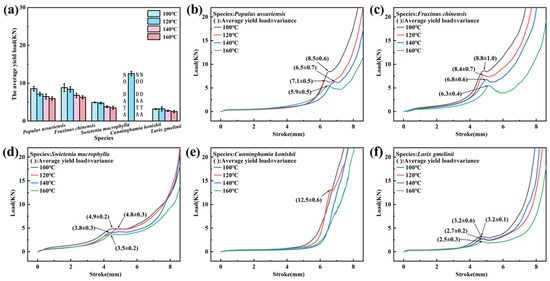
Figure 6.
Compression tests under different temperatures. (a) The average yield load; (b) Populus ussuriensis; (c) Fraxinus chinensis; (d) Swietenia macrophylla; (e) Cunninghamia konishii; (f) Larix gmelinii.
3.1.5. The Effect of Compression Rate on the Thermoplastic Rheological Properties of Wood
The results of compression tests on five tree species at different compression rates of 1, 2, 3, 4, and 5 mm/min are shown in Figure 7. The remaining conditions are detailed in Table 2, Group 5. Under different loading rates, Cunninghamia konishii shows the most significant variation. In Figure 7e, the yield load of Cunninghamia konishii is 25.1 KN at 1 mm/min and the yield load is 8.6 KN at 5 mm/min, representing a decrease of 65.7%. Additionally, one-way analysis of variance of the yield load of the five tree species at different rates shows no significant difference between Swietenia macrophylla and Larix gmelinii at a 5% significance level, indicating that the compression rate has little impact on the thermoplastic rheological properties of tree species with higher density. Populus ussuriensis (Figure 7b) had a yield load of 9.1 KN at 1 mm/min and 6.9 KN at 5 mm/min, marking a decrease of 24.2%. Fraxinus chinensis (Figure 7c) had a yield load of 8.6 KN at 1 mm/min and 7.7 KN at 5 mm/min, showing a decrease of 10.5%. Moreover, as the density of Fraxinus chinensis is higher than that of Populus ussuriensis, this also confirms that tree species with higher density are less affected by compression rates.
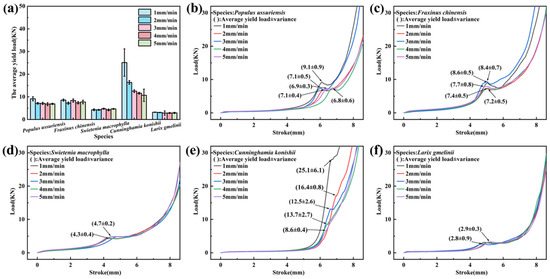
Figure 7.
Compression tests under different compression rates. (a) The average yield load; (b) Populus ussuriensis; (c) Fraxinus chinensis; (d) Swietenia macrophylla; (e) Cunninghamia konishii; (f) Larix gmelinii.
3.1.6. The Effect of Preheating Time on the Thermoplastic Rheological Properties of Wood
The impact of heating time on the thermoplastic rheological properties of wood was examined through compression tests on wood specimens from five tree species at varying preheating times of 1, 2, 3, 4, and 5 min. The results are depicted in Figure 8, while the remaining conditions are detailed in Table 2, Group 6. As evidenced in Figure 8a, a trend of increasing yield loads across all tree species is observed with longer preheating times. This trend suggests that prolonged preheating duration reduces the thermoplastic rheological properties of wood, possibly attributed to a decrease in moisture content during preheating. Results based on moisture content indicate a notable correlation between wood’s thermoplastic rheological properties and moisture levels: higher moisture content corresponds to improved properties, and vice versa. Upon extending the preheating time from 1 min to 5 min, the yield load increased by 19.7% for Populus ussuriensis (Figure 8b), 25% for Fraxinus chinensis (Figure 8c), 20.8% for Swietenia macrophylla (Figure 8d), 116.8% for Cunninghamia konishii (Figure 8e), and 31.3% for Larix gmelinii (Figure 8f). Cunninghamia konishii exhibited the most significant change, while Populus ussuriensis displayed the least variation.
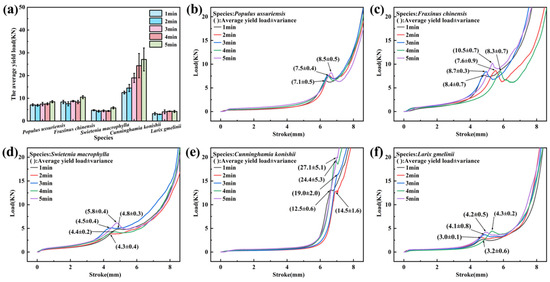
Figure 8.
Compression tests under different preheating times. (a) The average yield load; (b) Populus ussuriensis; (c) Fraxinus chinensis; (d) Swietenia macrophylla; (e) Cunninghamia konishii; (f) Larix gmelinii.
3.2. Microcosmic Analysis
3.2.1. Wood Cell Tissue Proportion Analysis
The cross-sectional microsections of the five tree species are illustrated in Figure 9. Populus ussuriensis is characterized by predominantly radial compound pores, while Fraxinus chinensis mainly features single pores. Swietenia macrophylla exhibits a combination of single pores and radial complex pores, often containing dark brown resin. The tracheids of Cunninghamia konishii are mostly quadrilateral and uniformly distributed, while those of Larix gmelinii are predominantly irregularly shaped. The microsection of the tangential plane is displayed in Figure 10. Populus ussuriensis displays uniseriate wood rays, whereas Fraxinus chinensis mainly presents multiseriate wood rays, typically two rows wide. Swietenia macrophylla shows fusiform wood rays, generally 2–3 rows wide. Cunninghamia konishii is primarily composed of uniseriate wood rays, while Larix gmelinii contains a mixture of uniseriate and fusiform wood rays.
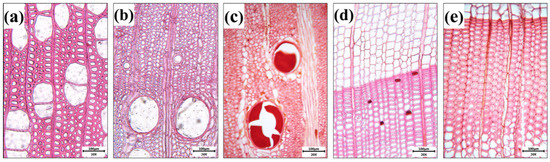
Figure 9.
Cross-sections of five species of wood. (a) Populus ussuriensis; (b) Fraxinus chinensis; (c) Swietenia macrophylla; (d) Cunninghamia konishii; (e) Larix gmelinii. Scale bars: (a–e) = 100 μm.
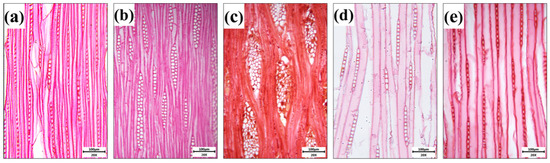
Figure 10.
Tangential sections of five species of wood. (a) Populus ussuriensis; (b) Fraxinus chinensis; (c) Swietenia macrophylla; (d) Cunninghamia konishii; (e) Larix gmelinii. Scale bars: (a–e) = 100 μm.
The tissue ratio of tree species is shown in Table 4 and Table 5. Through one-way analysis of variance, significant differences were found among the proportions of each cell tissue at a 5% significance level. Populus ussuriensis has the highest proportion of wood fibers, which provide strength to hardwood. Among them, the tough fibers play a certain supportive role in the thermoplastic rheology process, leading to better thermoplastic rheological properties of the wood. In coniferous wood, the mechanical support function is carried out by tracheids, which lack tough fibers. This is likely the reason for the weaker thermoplastic rheological properties of Cunninghamia konishii. However, due to the higher density of Larix gmelinii, it can provide more rheological components, resulting in its thermoplastic rheological properties not being weak. Populus ussuriensis has the highest proportion of vessels, while Swietenia macrophylla has the lowest proportion of vessels. Vessels in wood mainly play a role in water transportation, which can partly explain why Swietenia macrophylla has the lowest moisture content when impregnated with water. Furthermore, Fraxinus chinensis has the highest proportion of axial parenchyma, which may be the reason why Fraxinus chinensis can undergo rheological changes in the longitudinal fiber direction.
Table 4.
Tissue ratio of hardwood.
Table 5.
Tissue ratio of coniferous wood.
3.2.2. Wood Tissue Proportion Analysis
The morphological characteristics of wood fibers serve as critical indicators of their performance. This study presents measurements and analyses of the fiber morphological traits across five tree species, with data summarized in Table 6. A one-way analysis of variance (ANOVA) conducted at a 5% significance level reveals significant differences in fiber morphological characteristics among the species examined.
Table 6.
Wood fiber properties of tree species.
In the hardwood, Swietenia macrophylla exhibits the highest values for fiber length, fiber length–diameter ratio, and wall–cavity ratio. Conversely, Fraxinus chinensis displays the shortest fiber length and the smallest wall–cavity ratio, although its fiber diameter is considerably smaller than that of Populus ussuriensis, with a slightly larger length–diameter ratio compared to the latter.
Within the coniferous species, Larix gmelinii demonstrates superior fiber length, length–diameter ratio, and wall–cavity ratio compared to Cunninghamia konishii. Experimental results across varying moisture contents indicate that, under identical moisture conditions, hardwoods such as Swietenia macrophylla exhibit the most favorable thermoplastic rheological properties, followed by Populus ussuriensis and Fraxinus chinensis. Among coniferous woods, Larix gmelinii outperforms Cunninghamia konishii in thermoplastic rheological characteristics.
Therefore, it can be inferred that greater fiber length, along with an increased length–diameter ratio and wall–cavity ratio, correlates positively with enhanced thermoplastic rheological properties of wood.
3.2.3. Analysis of the Content of Chemical Components in Wood
The lignin, cellulose, and hemicellulose contents of each tree species are shown in Table 7. The results of one-way analysis of variance (ANOVA) indicate significant differences in the content of each component among the tree species at a 5% significance level. Among hardwood species, Swietenia macrophylla has the highest lignin content, while Fraxinus chinensis has the lowest lignin content. In coniferous species, Larix gmelinii has the highest lignin content. Since the glass transition temperature is positively correlated with the relative molecular weight of lignin, a higher lignin content in wood leads to better stability of the wood at high temperatures. This was also confirmed in the conclusion of experimental results in different temperatures, where it was found that the yield load of Swietenia macrophylla and Larix gmelinii is less affected by temperature. Furthermore, the hemicellulose content of Larix gmelinii is significantly higher than the other four tree species. The strength of wood mainly comes from wood fibers, while hemicellulose acts together with cellulose in the wood cell walls, increasing the elasticity and volume of the cell wall. A high content of hemicellulose can enhance the flexibility of wood, which may be the reason for the lowest yield load of Larix gmelinii.
Table 7.
Wood chemical composition content of tree species.
4. Conclusions
Under the specified conditions of this study, and while controlling for individual variables, it was observed that the compressive yield load of wood decreases with increasing moisture content and wood thickness. Both higher moisture content and greater wood thickness correlate with enhanced rheological properties of wood thermoplastics. Additionally, tree species with higher density exhibit reduced sensitivity to variables such as heating temperature, preheating duration, and compression rate. Furthermore, an increase in fiber length and length–diameter ratio is associated with improved rheological properties of wood thermoplastics. Notably, hardwood species with elevated lignin content (35.56%) and coniferous species with higher hemicellulose content (25.27%) demonstrate superior rheological performance in thermoplastics.
Author Contributions
Conceptualization, investigation, data curation and draft writing, Y.W.; investigation and data curation, Y.Q.; review, supervision and editing of the manuscript, Z.Z. All authors have read and agreed to the published version of the manuscript.
Funding
This work was supported by the National Natural Science Foundation of China (32271785), China Postdoctoral Science Foundation (2019M661853) and Qing Lan Project of Jiangsu Province.
Data Availability Statement
The original contributions presented in this study are included in the article. Further inquiries can be directed to the corresponding author.
Conflicts of Interest
No potential conflicts of interest were reported by the authors.
References
- Wang, Y.; Zhu, Z.; Zhang, X. A new species of the genus Pseudourostyla (Hymenoptera, Staphylinidae) from China. Macro layout and utilization of China’s timber resources--Based on Lorentz coefficient analysis. For. Ind. 2023, 60, 82–87. [Google Scholar] [CrossRef]
- Zeng, W.; Yang, X. Analysis of timber forest resources and timber safety in China. For. Resour. Manag. 2023, 1, 17–24. [Google Scholar] [CrossRef]
- Tian, M.; Du, L.; Wang, F.; Ma, S.; Liu, D. Forecast and Analysis of Timber Production Capacity of China ‘s Forest Resources. China For. Prod. Ind. 2022, 59, 57–63. [Google Scholar] [CrossRef]
- Sugino, H.; Tanaka, S.; Kasamatsu, Y.; Okubayashi, S.; Seki, M.; Miki, T.; Umemura, K.; Kanayama, K. Flow forming of wood irradiated with electron beam―Molding load of irradiated wood and mechanical properties of the molded material. BioResources 2021, 16, 3895–3906. [Google Scholar] [CrossRef]
- Seki, M.; Tanaka, S.; Miki, T.; Shigematsu, I.; Kanayama, K. Forward extrusion of bulk wood containing polymethylmethacrylate: Effect of polymer content and die angle on the flow characteristics. J. Mater. Process. Technol. 2017, 239, 140–146. [Google Scholar] [CrossRef]
- Kajikawa, S.; Horikoshi, M.; Tanaka, S.; Umemura, K.; Kanayama, K. Molding of wood powder with a natural binder. Procedia Eng. 2017, 207, 113–118. [Google Scholar] [CrossRef]
- Lian, M.; Huang, Y.; Liu, Y.; Jiang, D.; Wu, Z.; Li, B.; Xu, Q.; Murugadoss, V.; Jiang, Q.; Huang, M.; et al. An overview of regenerable wood-based composites: Preparation and applications for flame retardancy, enhanced mechanical properties, biomimicry, and transparency energy saving. Adv. Compos. Hybrid Mater. 2022, 5, 1612–1657. [Google Scholar] [CrossRef]
- Yang, Y.; Kang, X.; Yang, Y.; Ye, H.; Jiang, J.; Zheng, G.; Wei, K.; Ge, S.; Lam, S.S.; Ouyang, H.; et al. Research progress in green preparation of advanced wood-based composites. Adv. Compos. Hybrid Mater. 2023, 6, 202. [Google Scholar] [CrossRef]
- Peng, Z.; Jiang, X.; Si, C.; Joao Cárdenas-Oscanoa, A.; Huang, C. Advances of Modified Lignin as Substitute to Develop Lignin-Based Phenol-Formaldehyde Resin Adhesives. ChemSusChem 2023, 16, e202300174. [Google Scholar] [CrossRef]
- Seki, M.; Kiryu, T.; Miki, T.; Tanaka, S.; Shigematsu, I.; Kanayama, K. Extrusion of Solid Wood Impregnated with Phenol Formaldehyde (PF) Resin: Effect of Resin Content and Moisture Content on Extrudability and Mechanical Properties of Extrudate. BioResources 2016, 11, 7697–7709. [Google Scholar] [CrossRef]
- Zade, A.; Kuppusamy, R.R.P. A Comprehensive Review on Single- and Multi-Objective Optimization of Liquid Composite Moulding Process. In Recent Advances in Smart Manufacturing and Materials; Agrawal, R., Jain, J.K., Yadav, V.S., Manupati, V.K., Varela, L., Eds.; Springer: Berlin/Heidelberg, Germany, 2021; pp. 57–66. [Google Scholar] [CrossRef]
- Nakai, K.; Tanaka, S.; Kanayama, K.; Yoshimura, T. Flow deformation characteristics of African blackwood, Dalbergia melanoxylon. J. Wood Sci. 2020, 66, 67. [Google Scholar] [CrossRef]
- Tanaka, S.; Seki, M.; Miki, T.; Shigematsu, I.; Kanayama, K. Solute diffusion into cell walls in solution-impregnated wood under conditioning process I: Effect of relative humidity on solute diffusivity. J. Wood Sci. 2015, 61, 543–551. [Google Scholar] [CrossRef]
- Tanaka, S.; Seki, M.; Miki, T.; Umemura, K.; Kanayama, K. Solute diffusion into cell walls in solution-impregnated wood under conditioning process IV: Effect of temperature on solute diffusivity. J. Wood Sci. 2017, 63, 644–651. [Google Scholar] [CrossRef]
- Li, C. Study on the Key Factors Affecting the Microstructure of Chinese Fir Plantation on Physical and Mechanical Properties. Master’s Thesis, Inner Mongolia Agricultural University, Hohhot, China, 2021. [Google Scholar] [CrossRef]
- GB/T 1933-2009; Method for Determination of the Density of Wood. National Technical Committee for Wood Standardization: Beijing, China; General Administration of Quality Supervision, Inspection and Quarantine of the People’s Republic of China: Beijing, China; Standardization Administration of China: Beijing, China, 2009.
- Hao, G.; Xing, L.; Liang, Q. Moisture fixed point of saturated saline solution (1)—Principle and preparation. Sens. World 1999, 11, 1–4. [Google Scholar] [CrossRef]
- Hao, G.; Xing, L.; Liang, Q. Moisture fixed point of saturated salt solution (2)—Data source and salt solution selection. Sens. World 1999, 12, 10–14. [Google Scholar] [CrossRef]
- Miki, T.; Seki, M.; Shigematsu, I.; Kanayama, K. Preparation of Three Dimensional Products Using Flow Deformability of Wood Treated by Small Molecular Resins. Adv. Mater. Res. 2013, 856, 79–86. [Google Scholar] [CrossRef]
- Abe, M.; Enomoto, Y.; Seki, M.; Miki, T. Esterification of solid wood for plastic forming. BioResources 2020, 15, 6282–6298. [Google Scholar] [CrossRef]
Disclaimer/Publisher’s Note: The statements, opinions and data contained in all publications are solely those of the individual author(s) and contributor(s) and not of MDPI and/or the editor(s). MDPI and/or the editor(s) disclaim responsibility for any injury to people or property resulting from any ideas, methods, instructions or products referred to in the content. |
© 2025 by the authors. Licensee MDPI, Basel, Switzerland. This article is an open access article distributed under the terms and conditions of the Creative Commons Attribution (CC BY) license (https://creativecommons.org/licenses/by/4.0/).