Article

Evaluation of Spatial Structure and Homogeneity of Bamboo and Broad-Leaved Mixed Forest

1
Institute of Karst Research, Guizhou Normal University, Guiyang 550001, China
2
National Engineering Research Center for Karst Rocky Desertification Control, Guiyang 550001, China
3
Chishui Bamboo Forest Ecosystem National Observation and Research Station, Chishui 564700, China
4
State Key Laboratory for Bamboo and Rattan Science, International Center for Bamboo and Rattan, Beijing 100102, China
5
Teaching and Research Department, Guizhou Normal University, Guiyang 550001, China
*
Author to whom correspondence should be addressed.
These authors contributed equally to this work.
Forests 2025, 16(1), 100; https://doi.org/10.3390/f16010100
Submission received: 4 December 2024 / Revised: 30 December 2024 / Accepted: 7 January 2025 / Published: 9 January 2025
(This article belongs to the Special Issue Suitable Ecological Management of Forest Dynamics)

Abstract

:
Bamboo and broad-leaved mixed forest is a kind of forestry management that can effectively improve the ecology of bamboo forests. The aerial structure of the stand can reflect the growth status of the stand, as well as the spatial structure of the stand with respect to maintaining and improving the basis of the stand structure. However, the lack of quantitative studies on how different mixing ratios affect the stand spatial structure of bamboo and broad hybrid forests has further disturbed the development of bamboo and broad-leaved mixed-forest management. In this study, we used 10 bamboo and broad mixed forests with different ratios as the research object, determined the stand spatial structure unit by using the weighted Delaunay triangular network, calculated the stand spatial-homogeneity index from the vertical spatial structure of the stand, horizontal spatial structure, and competition, and constructed the stand spatial-homogeneity evaluation system by combining it with the forest health grading system and the rank classification method of the near-natural forest management, dividing it into five evaluation classes. It was divided into five evaluation levels. Finally, a regression model was used to elucidate the effects of stand spatial homogeneity on moso bamboo (Phyllostachys pubescens) biomass. The results showed that the spatial homogeneity of No. 1 (5%–10% mixed) and No. 3 (15%–20%) samples was classified into five grades; No. 2 (10%–15%) samples were classified into four grades; No. 4 (20%–25%) and No. 6 (30%–35%) samples were classified into three grades; No. 5 (25%–30%) samples were classified into two grades; and Nos. 7–10 (more than 35%) samples were all classified into one grade. It was also found that both the degree of hybridization and the competition index in the bamboo and broad-leaved mixed forest showed highly significant negative correlation with the spatial homogeneity index of the stand and the moso bamboo biomass, while the spatial density index showed highly significant positive correlation with the spatial homogeneity index of the stand and the moso bamboo biomass. From the viewpoint of management purpose, for the management of bamboo and broad-leaved mixed forest with economic benefits, the mixing ratio should be 5%–10% and 25%–35%; for the management of bamboo and broad-leaved mixed forest with ecological benefits, the mixing ratio should be more than 35%; and for the management purpose of balancing ecological benefits and economic benefits, the mixing ratio should be 10%–25%.

1. Introduction

The FAO Global Forest Resources Assessment (2020) reports that the global area of bamboo forests has increased by nearly 50% from 1990 to 2020 [1]. According to the ninth national forest resources inventory in China, the bamboo forest area was 6,411,600 ha, representing a 52% increase over the fifth [2]. Consequently, the scientific management of bamboo forests is of particular importance. Maozhu (Phyllostachys pubescens) is the bamboo species with the highest abundance and the largest cultivation area in China’s bamboo resources. It is a superior choice for the production of both bamboo shoots and timber, with its applications being extensive, currently encompassing an area of 5,272,600 ha. Maozhu is extensively distributed throughout southern China and has emerged as a crucial economic and ecological bamboo species due to its rapid growth, early maturity for timber, high yield, diverse applications, and significant value. In the management process, bamboo farmers are predominantly focused on yield, adopting a lax management approach and neglecting bamboo and broad-leaved mixed-forest management strategies. This has led to an unstable structure within Maozhu forest stands, consequently causing a gradual decline in productivity over time [3,4,5]. Concurrently, prolonged use of pesticides and other chemicals has contributed to a decline in soil fertility within the forest stand and has degraded the ecological environment [6]. The bamboo and broad-leaved mixed-forest management approach effectively enhances the ecological integrity of bamboo forests, optimizing the trade-offs between economic, ecological, and social benefits [7]. The spatial structure of a forest stand pertains to the arrangement of trees within it, encompassing their relative positions and the spatial distribution of their attributes. This structure illustrates the positional distribution and inter-relationships among trees, thereby reflecting the developmental stage of the forest stand [8]. The spatial structure of forest stands serves not only as the foundation for maintaining and enhancing forest quality, but is also a pivotal factor for effective regulation [9]. Consequently, an objective and precise comprehension of the spatial structure of forest stands, along with an unbiased evaluation, is essential for providing a theoretical underpinning for the scientific management of bamboo and broad-leaved mixed forests. Presently, research on bamboo and broad-leaved mixed forests predominantly concentrates on the variations in growth conditions, productivity, and the morphological quality of bamboo timber within these forests [10,11,12,13], as well as their ecological benefits and applications, including soil and water conservation, biodiversity preservation, land reclamation, and carbon sequestration [14,15,16,17]. Nonetheless, compared to these areas of study, research into the spatial structure of bamboo and broad-leaved mixed forest stands is relatively limited. It is imperative to intensify in-depth exploration in this domain to fully grasp the ecological functions and economic advantages of bamboo and broad-leaved mixed forests.
Currently, the spatial structure of forest stands has emerged as a focal point of research for scholars worldwide, with the primary focus on determining spatial structure units [18,19,20,21], quantifying and analyzing stand spatial-structure parameters [22,23,24,25], characterizing stand spatial structure [26,27,28], and implementing structured forest management [29,30]. Despite the lack of a systematic standard for evaluating forest stand spatial structure, some scholars have applied microeconomic concepts to construct the production function of forest stand spatial structure for evaluation purposes [31]. Additionally, studies have explored the evaluation of spatial structure irrationality through the establishment of urgency indices [32]. Furthermore, research has employed various methods, such as the unit circle [33] and the modified unit circle [34], to assess the spatial structure of forest stands. While current research has accumulated knowledge in tree-pure and tree-mixed forests, scientific management and adjustment of bamboo and broad-leaved mixed forests remain underexplored. Given the significant ecological and economic potential of bamboo and broad-leaved mixed forests, there is an urgent need for scientific and effective guidance on their management. Studies indicate that a well-structured spatial arrangement is crucial for enhancing the stability and functional efficiency of forest stands [35,36]. Therefore, a scientific assessment of the spatial structure of bamboo and broad-leaved mixed-forest stands will provide robust theoretical support for the development and application of management strategies aimed at improving the quality of these forests and maximizing their multifunctionality. The objectives of this study are: (1) to comprehensively evaluate the spatial structure of bamboo and broad-leaved mixed forests with varying mixing ratios; (2) to describe the impact of stand spatial-structure parameters on the spatial homogeneity index of the stand; and (3) to suggest optimal mixing ratios and optimization measures for different management objectives of bamboo and broad-leaved mixed forests. This study aims to deeply analyze the interplay between the spatial structure of bamboo and broad-leaved mixed-forest stands and yield, providing a scientific foundation for their adaptive management and utilization.

2. Materials and Methods

2.1. Study Area

The study area is located within the Tianbaoyan Nature Reserve (117°28′03″ E to 117°35′28″ E, 25°50′51″ N to 26°01′20″ N) in the eastern part of Yong’an City, Fujian Province, China. This region features a typical middle–low mountainous landscape and is part of the remnants of Daiyun Mountain (Figure 1). The predominant soil type is red soil, with altitudes ranging from 580 to 1604.8 m. The reserve falls under the middle-subtropical southeastern monsoon climate type, characterized by an annual average temperature of 15 °C, with recorded absolute minimum and maximum temperatures of −11 °C and 40 °C, respectively. The annual average relative humidity exceeds 80%, and the frost-free period averages about 290 days. Bamboo forests cover 96.8% of the reserve, primarily occurring at elevations below 800 m. The dominant bamboo species is moso bamboo (Phyllostachys edulis). The mixed forest also includes various broad-leaved tree species such as rice cone (Castanopsis carlesii), quebracho (Castanopsis fargesii), alder (Alniphyllum fortunei), camphor (Cinnamomum camphora), maple (Liquidambar formosana), sassafras (Sassafras tzumu), heather (Phoebe zhennan), woodhoek (Schima superba), small-leaved oak (Quercus chenii), poplar (Myrica rubra), and sour date (Choerospondias).

2.2. Data Sources and Survey Method

In the Tianbaoyan Nature Reserve, a total of 10 sample plots with varying mixed proportions were established (Table 1), each consisting of three replicate subplots measuring 20 m × 20 m, amounting to 30 subplots in total. The mixed proportions were determined by classifying the ratio of the combined canopy area of broad-leaved trees within each sample plot to the total sample plot area. For each subplot, the following attributes were documented: slope position, slope aspect, slope gradient, elevation, stand density, and species composition. Both bamboo and broad-leaved trees (with a height greater than 1.3 m) were numbered and located using a total station. For each individual tree, the species name, XY coordinates, height, diameter at breast height (Dbh), and crown dimensions were meticulously recorded.

2.3. Research Methodology

2.3.1. Determination of Stand Structure Units for Weighted Delaunay Triangular-Mesh Forest Stands

The structural unit serves as the fundamental unit for analyzing forest spatial structure, comprising the target tree and its surrounding neighbor trees. In this study, we employed the weighted triangular-network method to delineate the structural units [37]. This approach effectively rectifies the competitive interactions between the target tree and its neighboring trees, enhancing the precision with which the target tree can identify competing trees. Consequently, this method renders the calculation of forest stand spatial-structure parameters more accurate. In the methodology, we initially utilized the TIN tool in ArcGIS 10.2 software to create a standard triangular network, thereby establishing the forest stand structural units based on the locations of forest tree points. Subsequently, Equation (1) was applied to compute the attribute weights, ωi, for each stand tree.
ω i = D i D ¯ × W d + H i H ¯ × W h B H i B H ¯ × W b h
In Equation (1), the variables Di, Hi, and BHi denote the diameter at breast height (DBH), tree height (TH), and height under branch (HUB) for the i tree in the stand, respectively. Correspondingly, D, H, and BH represent the average DBH, average TH, and average HUB of the trees within the sample plot, respectively. The weights Wd, Wh, and Wbh are determined through gray correlation analysis following the establishment of structural units via the conventional Delaunay triangulation network, as described in Reference [38].
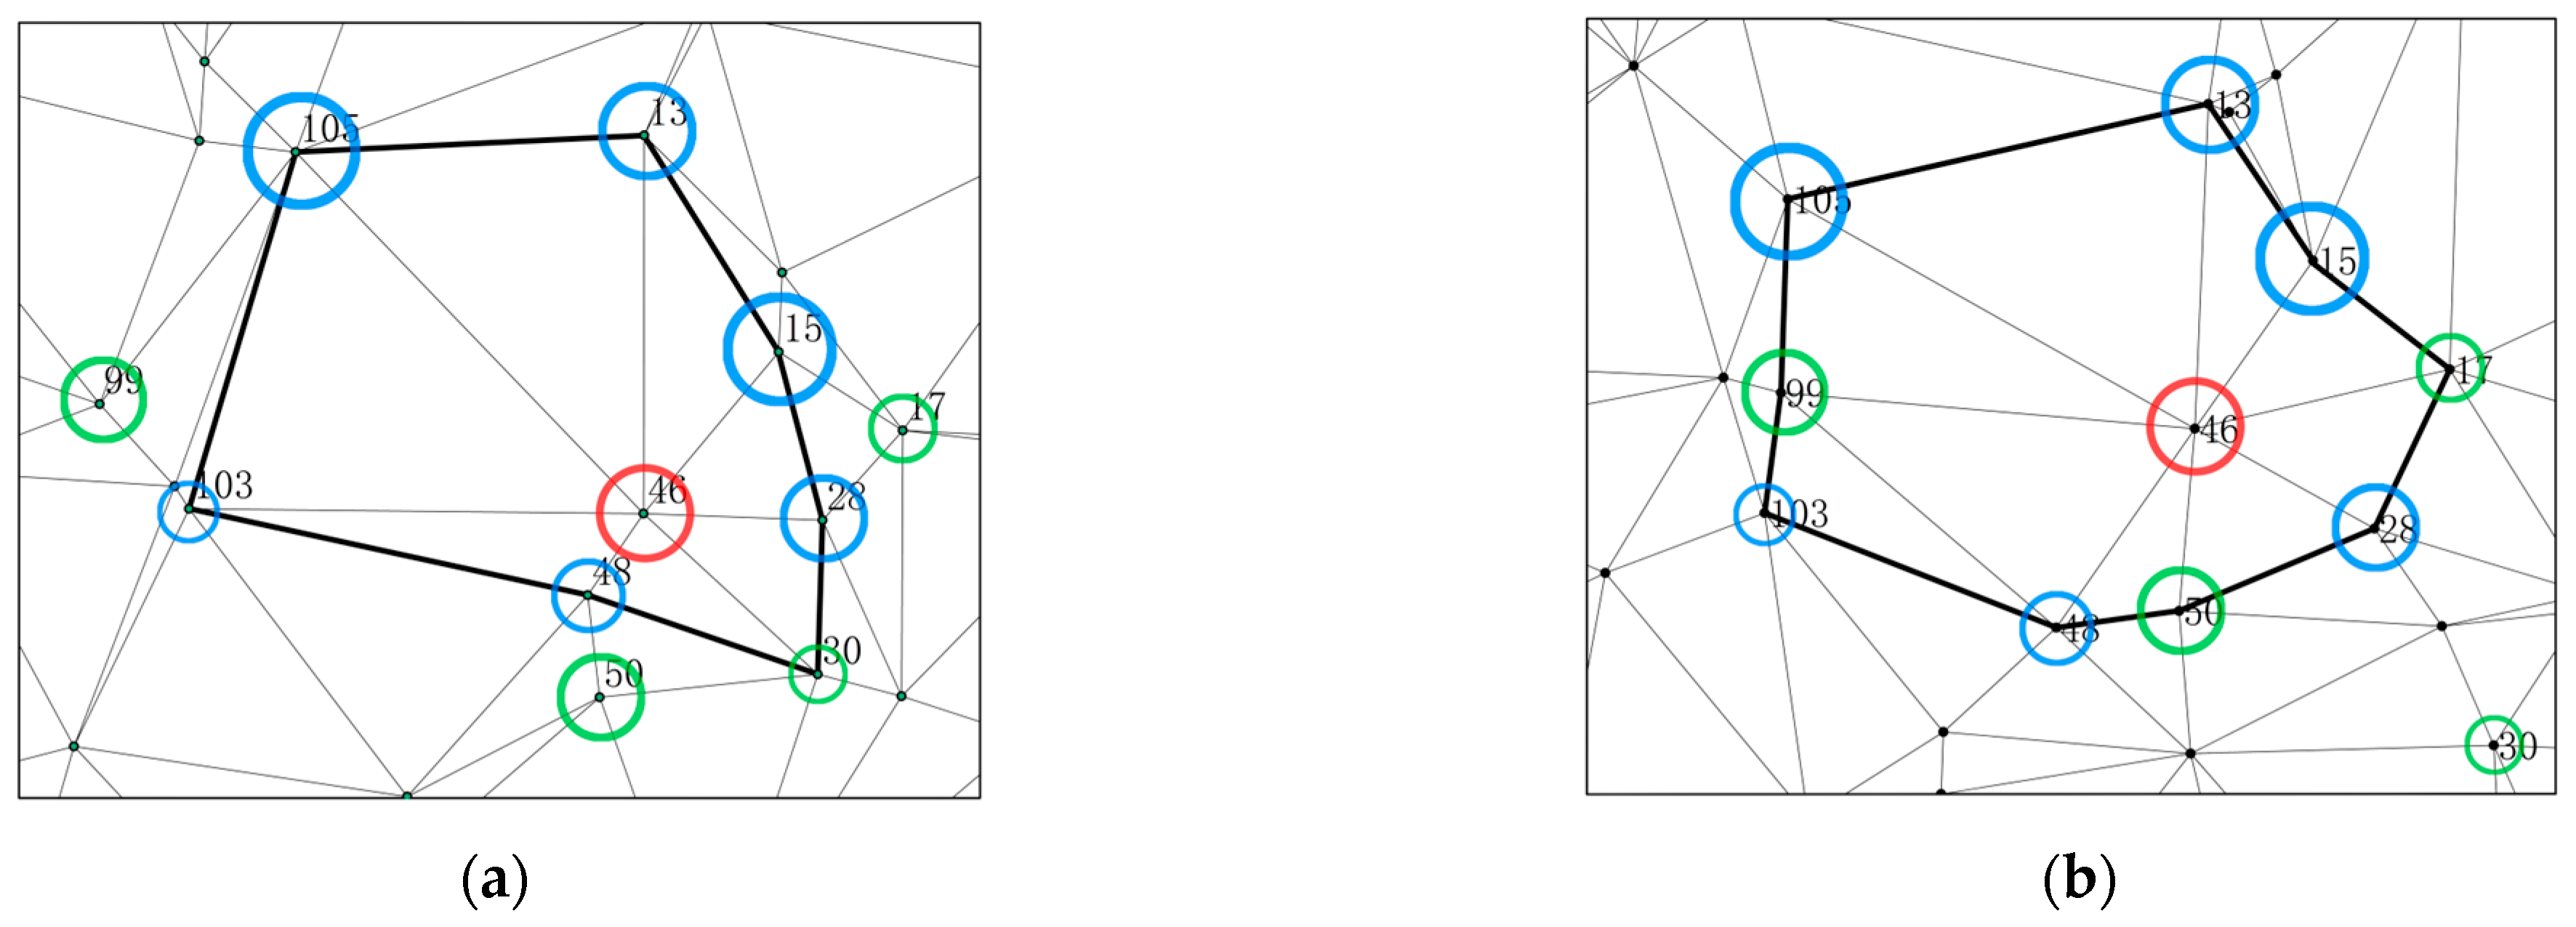
The weights for the target tree i and the competing tree j are calculated independently, denoted as ωi and ωj, respectively. The combined weight ωij is obtained by summing these weights and then dividing by 2. If ωij exceeds 1, it indicates a higher intensity of competition between the target and competing trees. Conversely, if ωij is less than 1, the competitive pressure between the target tree and the competing tree is relatively low. Subsequently, these weights are integrated into the Delaunay triangular network in the form of distance, according to Formula (3). By substituting these values into Equation (4), the final distance γi that the target tree i moves is ascertained. A new coordinate position is then established at the endpoint, thereby completing the weighting of the Delaunay triangular network (Figure 2).
ω i j = ω i + ω j 2
β r = α r × 1 1 ω i j , r = 1 ,   2 ,   3 ,   ,   r , ω i j 1 β r = α r × 1 ω i j ,   r = 1 ,   2 ,   3 , , r , ω i j 1
γ r = β r
where r is the number of neighboring tree individuals of object wood i; α r is the vector from the object wood to the neighbouring wood; β r is the distance moved between both object wood and neighboring wood; and γ r   is the total vector of weighted movement of the object wood.

2.3.2. Edge Correction

At the edge of the sample plot, a common issue is that the neighboring trees of certain target trees are positioned beyond the plot’s boundaries. This can introduce bias into the calculation of forest stand parameters. To address this, we utilized the distance buffer method to establish a 5 m wide buffer strip around the perimeter of the original sample plot. Within this buffer, trees were designated as potential neighboring trees for the analysis, thereby reducing the edge effect on the calculated parameters [39].

2.3.3. Parameter Selection for the Spatial Homogeneity Index of Stands

Analysis of the spatial structure of forest landscapes is grounded in the theoretical frameworks of landscape ecology. Consistent with the tenets of landscape ecology, forest stand patches are regarded as the essential building blocks of the forest landscape. These patches are defined by their unique characteristics or visual distinctiveness from the surrounding environment, exhibiting a spatially coherent internal homogeneity. This homogeneity is key to reflecting the spatial structural attributes of the forest stand and the cumulative effects of management interventions [40,41,42,43]. In this research, we adhered to the concept of patch homogeneity and utilized a weighted triangular network to refine the precision of the spatial structural unit, which includes the target tree and its adjacent trees. We delineated the quantitative indices for both individual trees and the forest stand as the spatial homogeneity index, taking into account both the horizontal and vertical dimensions within a three-dimensional space [44]. When assessing the spatial homogeneity index of a stand, the selection of suitable parameters for developing the spatial homogeneity index of the stand is of paramount importance.
To accurately capture the spatial structural characteristics of individual forest stands within the ecosystem, this study selects seven spatial structure parameters known for their precision in describing stand structure, sensitivity, interpretability, and broad applicability. These parameters are employed to construct the spatial homogeneity index of the stand (L) [45,46]. The selected parameters are as follows: Neighborhood Comparison (U): reflects the differentiation of trees by height. Complete Mixing Degree (M): describes the isolation and diversity among trees [47]. Uniform Angle (W): indicates the horizontal distribution pattern of trees. Competition Index (CI): measures the intensity of competition among trees. Forest Layer Index (S): depicts the diversity of the forest stand’s vertical structure and its distribution pattern [48]. Openness ratio (OP): quantifies the degree of shading within the forest stand [49]. Spatial Density Index (D): reflects the spatial distribution density of forest trees [50]. The specific calculation equations for these parameters are detailed in Equations (5)–(15).
  • Neighborhood comparison
U i = 1 n j = 1 n v i j , v i j = 1 , i > j 0 , o r
In the equation, Ui represents the number of trees in the first i size ratios of the trees; n is the total number of neighboring trees within the structural unit; i denotes the diameter at breast height (DBH) of the object tree, while j refers to the DBH of the neighboring trees. The variable Ui ranges from 0 to 1, and its values are categorized into five intervals: [0, 0.25), [0.25, 0.5), [0.5, 0.75), [0.75, 1), and 1. These intervals correspond to the following states of forest trees within the stand: dominant, sub-dominant, intermediate, disadvantageous, and absolute disadvantageous, respectively.
  • Complete mixing degree
M c i = 1 2 D i + n i n M i
M i = 1 n j = 1 n q i j   ,   q i j = 1 , i j 0 , o r
In the equation, Mci is the degree of complete mixing of the first tree’s degree of complete hybridization; Mi is the degree of hybridization of the first tree’s degree of admixture; n is the number of neighboring trees within the structural unit; ni is the number of tree species types within the structural unit; Di is the diversity value of tree species within the structural unit.   D i = 1 j = 1 r i p j 2 , D i [ 0 ,   1 ] when there is only 1 tree species Di = 0, there are an infinite number of tree species with equal plant–tree proportions, and Di = 1 is the number of tree species within the structural unit; pi is the ratio of the first tree species in the structural unit j plant–tree ratio of the tree species; ri is the number of tree species in the structural unit; i is the object wood and j is the neighboring wood; M c i 0 ,   1 . In this case, the values of   M c i values are divided into five intervals: [0, 0.25), [0.25, 0.5), [0.5, 0.75), [0.75, 1), 1, which correspond to weak mixing, moderate mixing, strong mixing, very strong mixing, and full mixing, respectively.
  • Uniform angle
W i = 1 n j = 1 n t i j
t i j =   1 ,     α i j > β 0 ,                   o r ,   β = 360 ° n + 1
In the equation, Wi is the first angular scale of the tree; n is the number of neighboring woods in the structural unit; t i j   is a discrete variable, representing the angle formed between the object tree i and the neighboring tree j, and β is the standard angle, W i [ 0 ,   1 ] , which divides the values of the angular scale into three intervals: [0, 0.327), [0.327, 0.357), [0.357, 1), denoting uniform, random, and clustered distributions, respectively [51].
  • Competition index
C I i = 1 n j = 1 n d j l D d i l i j
In the equation, CIi is the competition index of the ith tree; n is the number of neighboring trees in the structural unit; di is the DBH of object wood i; dj is the DBH of neighboring wood j; lij is the distance between the object wood i and the neighboring wood j; lD is the average distance between n neighboring trees and object trees in the spatial structure unit of the stand.
  • Forest layer index
S i = z i 3 1 n j = 1 n s i j
s i j = 1 , W h e n   i   a n d   j   d o   n o t   b e l o n g   t o   t h e   s a m e   f o r e s t   l a y e r 0 , o r
In the equation, Si is the first tree’s forest layer index, n is the number of neighboring trees in the structural unit; zi is the number of species in the forest layer in the structural unit of the object wood i; and sij is the similarity and difference between the forest layer of object tree i and that of neighboring tree j. In this study, we applied the International Union of Forestry (IUFRO) criteria for vertical stratification of forest stands: forests were divided into three vertical strata based on the dominant height of the forest stand, namely: upper forest (≥2/3 dominant height); middle forest (between 1/3 and 2/3 dominant height) and lower forest (≤1/3 dominant height). The dominant height was determined by selecting the average of the heights of the 10 tallest trees in the stand.
  • Openness ratio
O P i = 1 n j = 1 n x i j
x i j =   1 ,     l i j h i j 0 ,                   o r
In the equation, OPi is the first number of tree size ratios; n is the number of neighboring woods within the structural unit; hij is the height difference between object wood i and neighboring wood j (the latter minus the former); and lij is the horizontal distance between object wood i and neighboring wood j. In this case, we will use the following formula: O P i 0 ,   1 . In this case, the OPi values are divided into five intervals: [0, 0.25), [0.25, 0.5), [0.5, 0.75), [0.75, 1), and 1, and are fully shaded, shaded, moderately open, open and very open.
  • Spatial density index
D i = 1 r i r m a x
In the equation,   D i is the first spatial density index of the plant, and     r i is the target wood   i containing the neighboring n; the minimum radius of the stand when it contains neighboring trees   r m a x is the maximum distance between two neighbouring trees in the stand; D i [ 0 ,   1 ] , where the values of   D i values are divided into three intervals: [0, 0.5), [0.5, 0.75), and [0.75, 1], which denote uniform, random and clustered distributions, respectively.

2.3.4. Calculation and Evaluation of Spatial Homogeneity Index of Forest Stands

Spatial Homogeneity Index of Stands

To objectively evaluate the homogeneity of the forest, an analysis was conducted focusing on three aspects of the forest’s spatial structure: horizontal, vertical and competitive. Utilizing the basic principles of multiplication and division [52], a comprehensive approach was developed that incorporates seven parameters for multi-objective planning. These parameters are now referred to as the neighborhood comparison, the complete mixing degree, the uniform angle, the competition index, the forest layer index, the openness ratio, and the spatial density index. The objective is to quantify the spatial homogeneity of the forest, resulting in the formulation of the spatial homogeneity index Li which is defined as follows:
  L i = 1 + M i σ M i · 1 + S i σ S i · 1 + O P i σ O P i 1 + U i · σ U i · 1 + C I i · σ C I i · 1 + D i · σ D i · 1 + W i · σ W i
In the equation, M i , S i , O P i , U i , C I i , W i , D i are the degree of complete mixing of single trees, the stand index, the openness ratio, the size ratio, the competition index, the angular scale and the spatial density index, respectively. σ M i   is the standard deviation of the degree of complete hybridization, the   σ S i   is the standard deviation of stratum index,   σ O P i   is the standard deviation of openness ratio,   σ U i   is the standard deviation of size ratio, the   σ C I i   is the standard deviation of the competition index, the   σ W i   is the standard deviation of angular scale, and   σ D i   is the standard deviation of spatial density index.
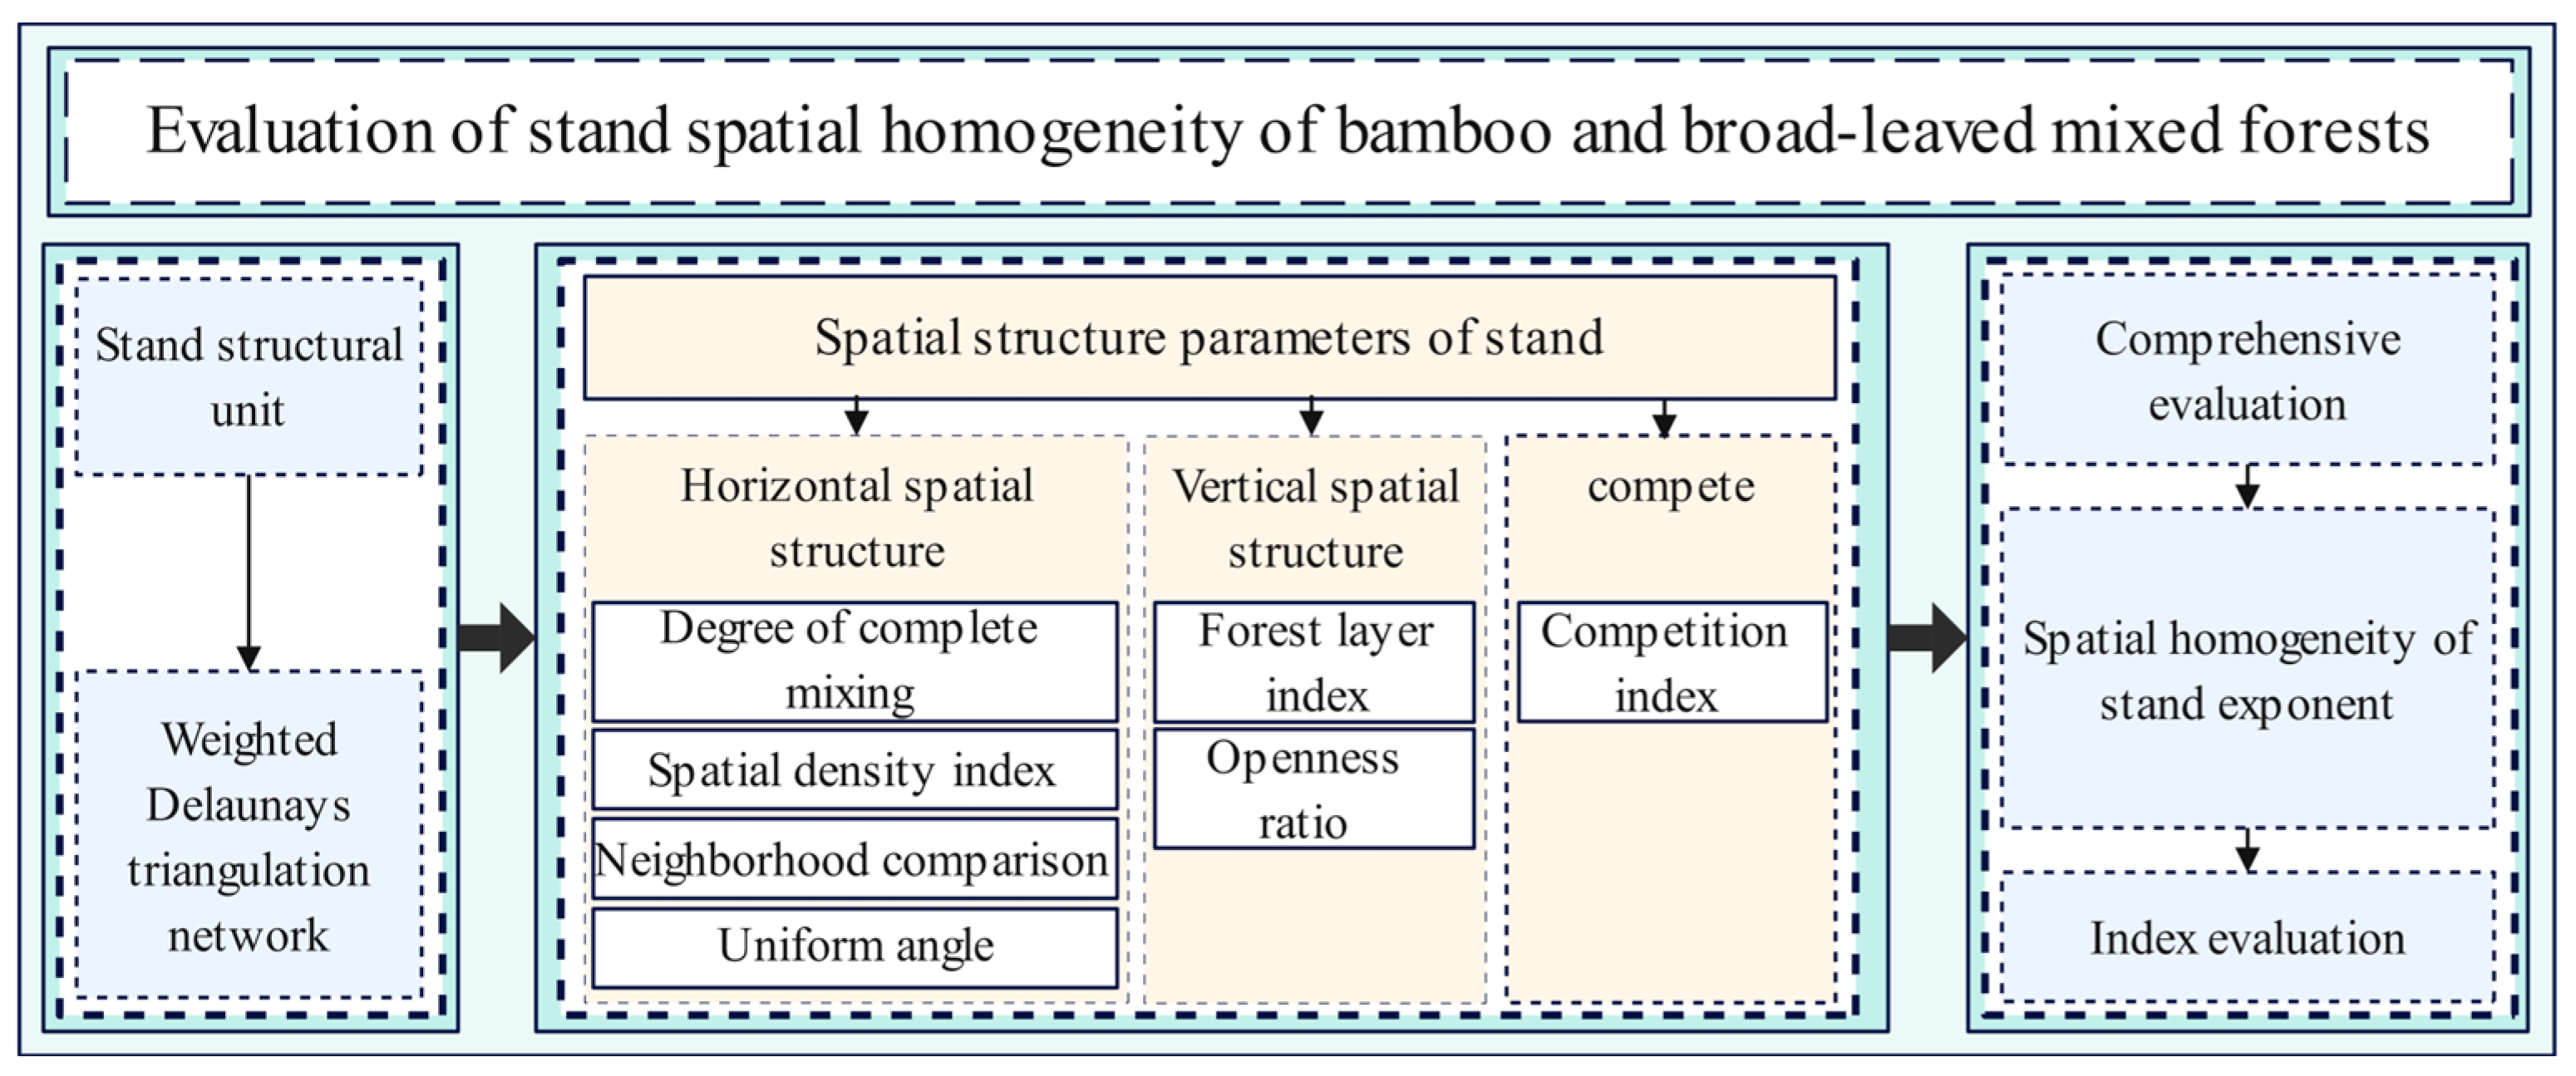
In light of the forestry and ecological significance of the seven selected parameters, and adhering to their general laws, the spatial homogeneity evaluation model for bamboo and broad-leaved mixed forest stands (Figure 3) employs the average value of the spatial homogeneity index for all trees within the stand. This approach is designed to reflect the overall homogeneity characteristics of the stand. The formula for calculating this average spatial homogeneity index is as follows:
L = 1 N i = 1 N L i
In the equation, L is the spatial homogeneity index of the stand, and Li is the spatial homogeneity index of the forest.

Evaluation Criteria

The criteria for evaluating the spatial homogeneity of bamboo and broad-leaved mixed forest stands were established based on the ecological significance of the selected parameters. To streamline the analysis of the index values used in assessing the spatial homogeneity of these stands, a normalization process was applied. Equation (18) was utilized to transform the L values, ensuring they were scaled uniformly into the range [0, 1]. This normalization step facilitates comparison and interpretation of the spatial homogeneity indices across different stands.
x i = x i x m i n x m a x x m i n
In the equation, x i , x i represent the values of the stand spatial-homogeneity index before and after normalization, respectively; x m i n , x m a x denote the minimum and maximum values in the sample data, respectively.
Drawing on the forest health rating system and the classification methodology employed in near-natural forest management, this study conducted both quantitative and qualitative assessments of bamboo and broad-leaved mixed forests. These forests were categorized into five distinct classes based on the stand spatial-homogeneity index evaluation (Table 2).

2.3.5. Calculation of Moso Bamboo Biomass

The aboveground biomass (AGB) of moso bamboo in bamboo and broad-leaved mixed forests with different mixing ratios was calculated using the formula [53]:
A G B = 747.784 × D B H 2.771 × 0.148 × A / 0.028 + A 5.555 + 3.772
where DBH is the diameter at breast height of the moso bamboo; and A is the age of the moso bamboo, divided into 1, 2, 3 and 4 degrees.
The raw data were processed using Microsoft Excel 2016 and SPSS 27.0. R software (version 4.3.0) was employed to analyze the relationship between stand spatial-structure parameters and the spatial homogeneity index of the stand using a linear regression model. The ggplot2 and dplyr software packages were utilized for data visualization and manipulation, respectively. To assess the correlation between stand spatial-structure parameters and bamboo biomass, the Pearson correlation coefficient was calculated, and the corrplot package was used to visualize these correlations.

3. Results

3.1. Evaluation of the Spatial Homogeneity in Bamboo and Broad-Leaved Mixed-Forest Stands

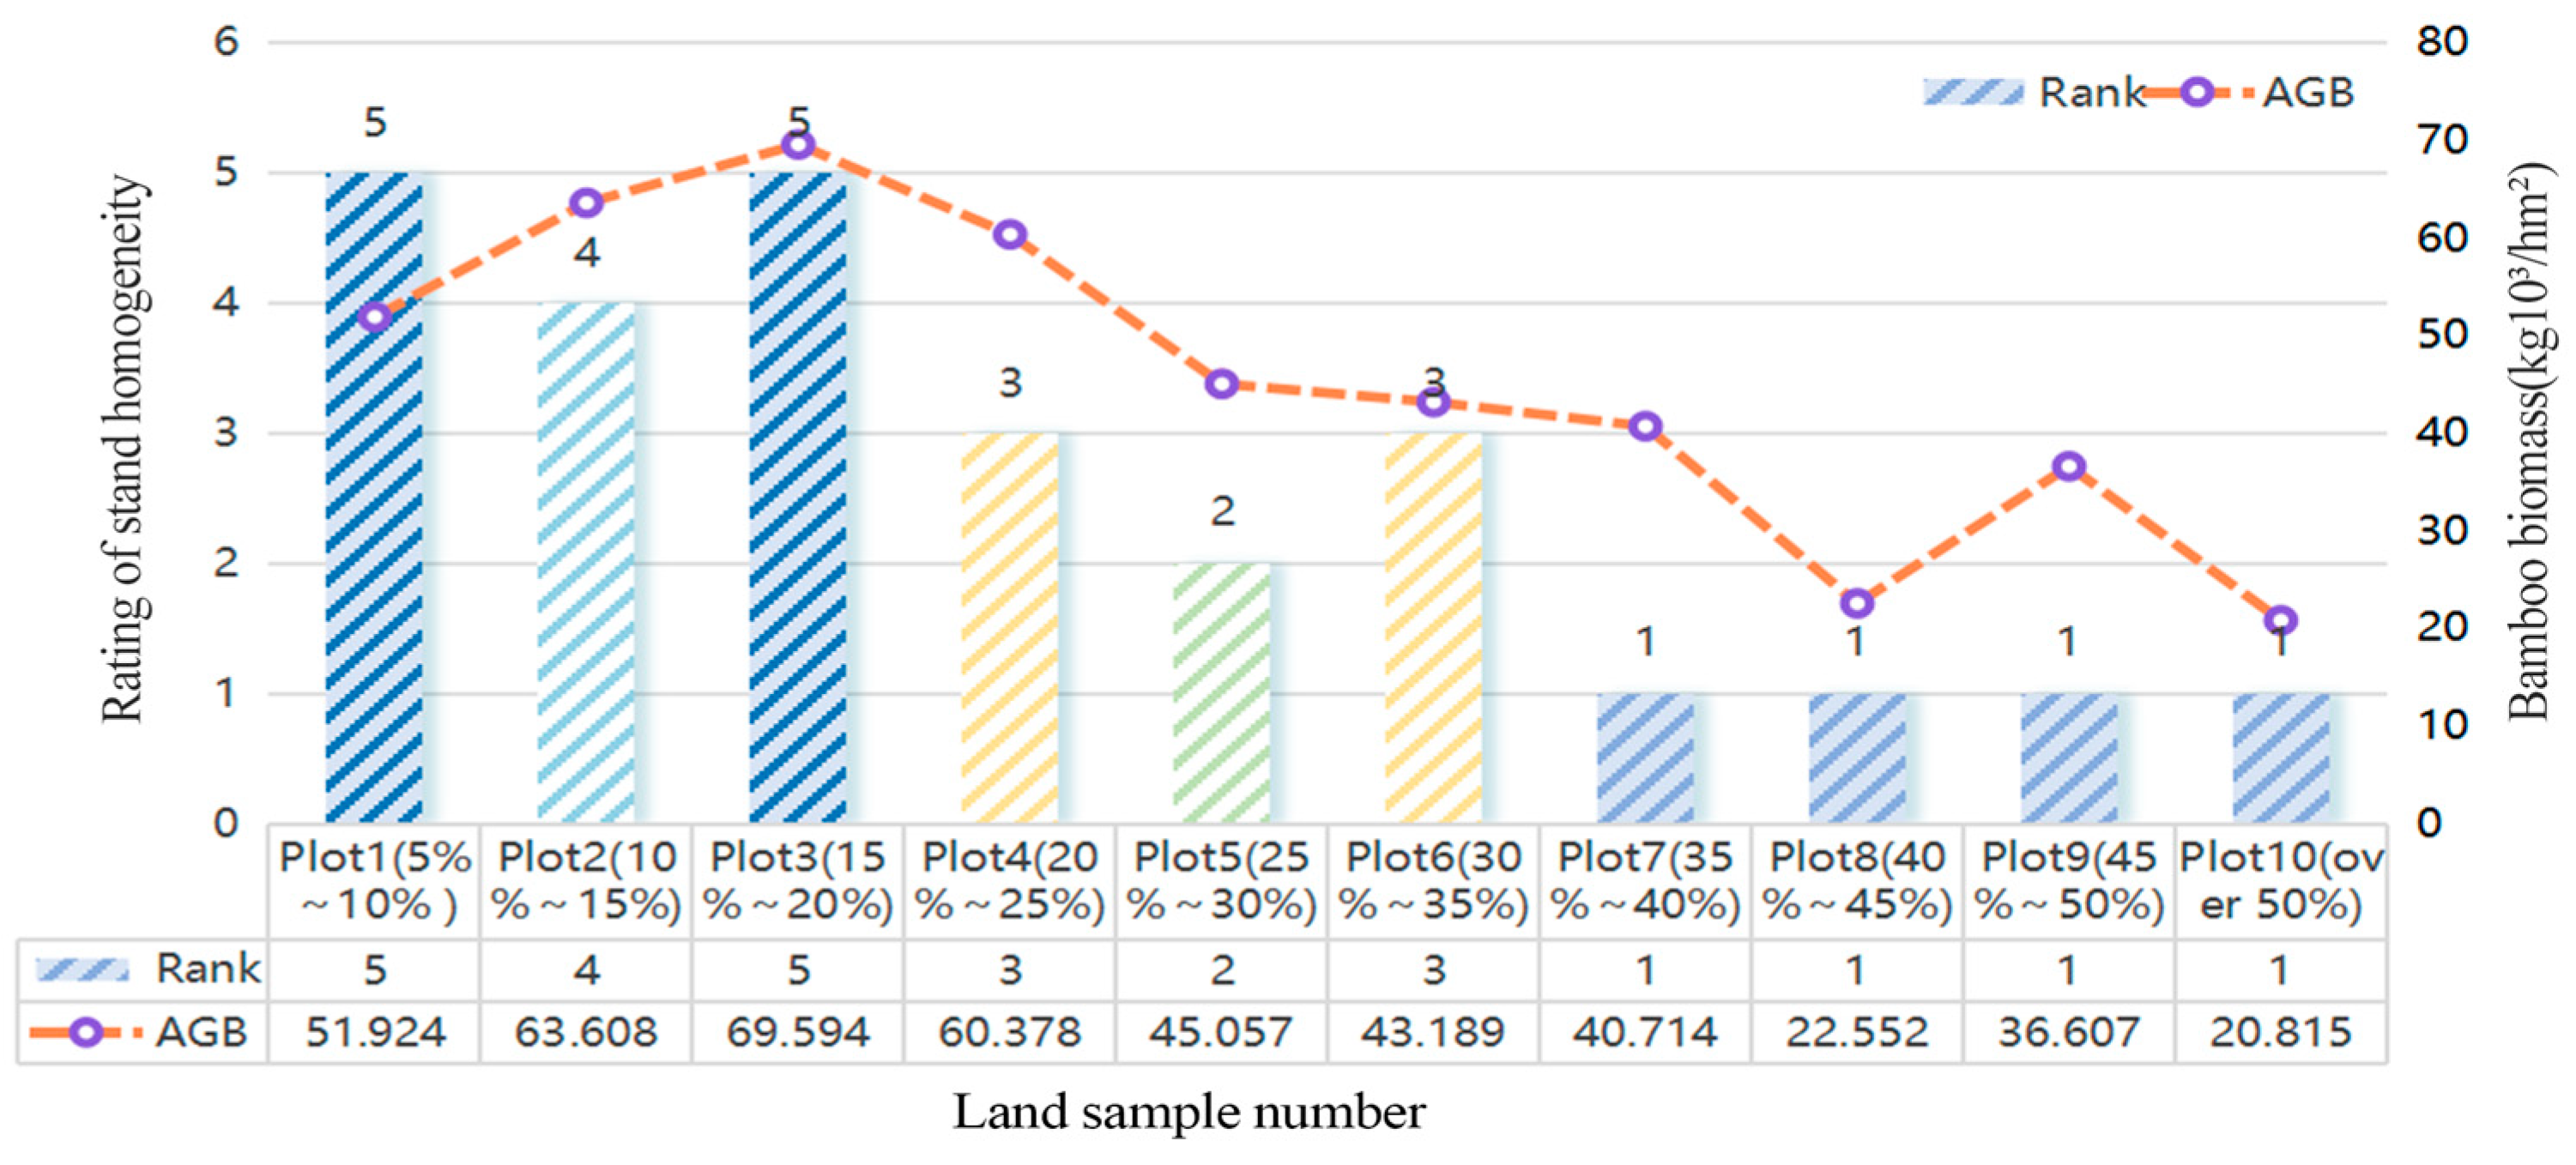
The study categorized the spatial homogeneity of bamboo and broad-leaved mixed forests with varying mixing proportions into five grades (Table 3), and the findings are indicated (Figure 4): sample plot Nos. 1 and 3 were classified as grade 5; sample plot No. 2 as grade 4; sample plot Nos. 4 and 6 as grade 3; sample plot No. 5 as grade 2; and sample plot Nos. 7–10 as grade 1. In sample plots Nos. 1–6 (comprising 5%–35% mixing ratio), owing to a lower number of broad-leaved trees, incomplete mixing, which resulted in a high degree of stand isolation, reduced competition between moso bamboo and broad-leaved species, and their mutual facilitation; the stands exhibited minimal depression, effective light capture, and increased spatial density index, resulting in a higher L value for the spatial homogeneity index of the stand and greater moso bamboo biomass compared to sample plots Nos. 7–10 (with over 35% mixing ratio). The sample plots Nos. 7–10, due to a higher number of broad-leaved trees, have a simpler forest layer structure and an increased canopy closure. As the proportion of mixed species increases, the percentage of moso bamboo, the degree of tree isolation, and the forest spatial density index gradually decrease. The intensity of interspecific competition gradually intensifies, resulting in lower L values for spatial uniformity, and correspondingly, the biomass of moso bamboo (AGB: above-ground biomass) also decreases. Notably, the spatial density index of sample plot No. 9 is greater than that of sample plots Nos. 8 and 10, and accordingly, its moso bamboo biomass (AGB) is higher than the latter two. Although sample plots Nos. 4 and 6 both received an evaluation grade of Grade 3, their conditions exhibit subtle differences. In sample plot No. 4, the number of broad-leaved trees is lower, and the Phyllostachys bamboo is more abundant, characterized by a uniform spatial distribution and reduced interspecific competition. This results in a higher biomass of Phyllostachys bamboo compared to sample plot No. 6. Conversely, sample plot No. 6 has a higher species mixing ratio than sample plot No. 4, and a lower spatial density index, which leads to a lower stand homogeneity index and, subsequently, a decrease in the biomass of Phyllostachys bamboo. For sample plot No. 2, which is classified as 4, the small mixing ratio, moderate tree isolation, and weak interspecific competition allow for the bamboo and the broad-leaved trees to still enhance each other’s growth. Consequently, the stand’s spatial homogeneity index is relatively high. Sample plots Nos. 1 and 3 both achieved the highest homogeneity index, of 5. Sample plot No. 1 exhibited the highest spatial homogeneity within the stand compared to plot No. 3. This was because sample plot No.1 had fewer broad-leaved trees, resembling a pure forest, with the greatest degree of tree isolation and the strongest interspecific competition. In contrast, sample plot No. 3 had the lowest stand competition index. Most of these forest stands were multilayered forests with favorable light conditions, resulting in the highest biomass and homogeneity index for bamboo.

3.2. Coupling of Stand Spatial-Structure Parameters with the Spatial Homogeneity Index of the Stand

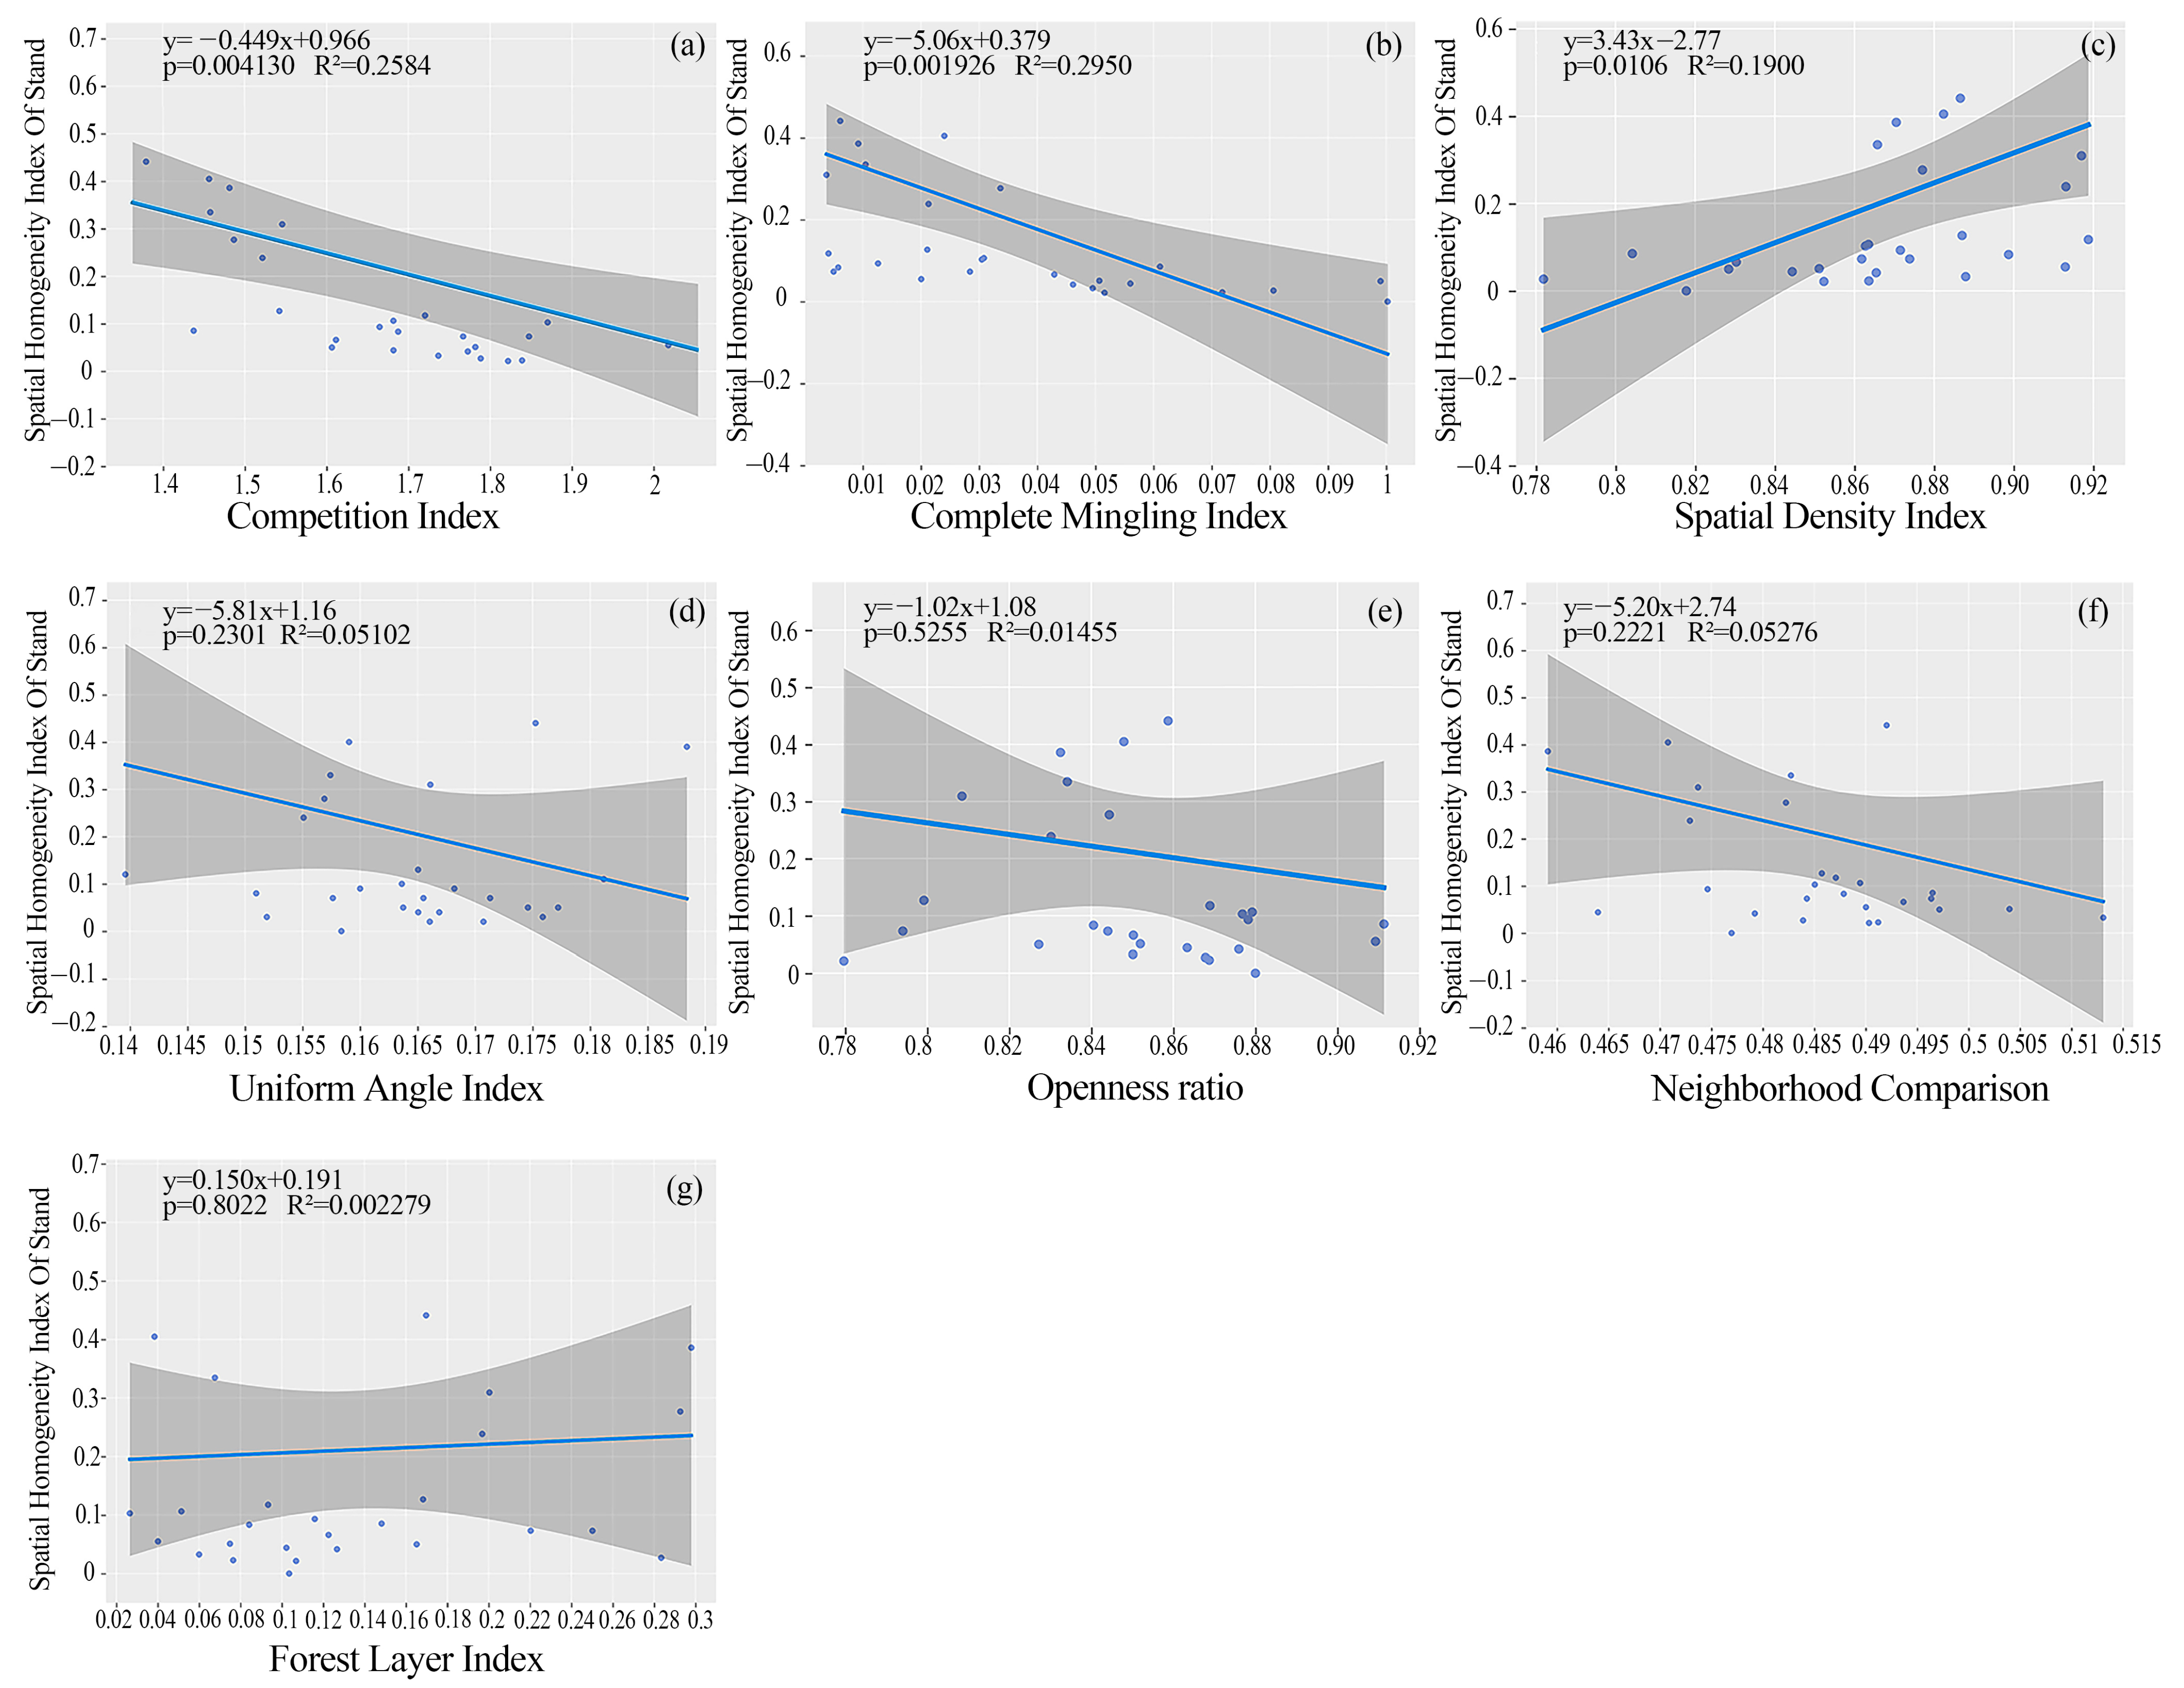
The findings revealed that all spatial structure parameters for the seven stands exhibited a linear coupling relationship with the spatial homogeneity index of the stands (Figure 5). The regression model for the complete mixing degree (R2 = 0.2950, p < 0.05) outperformed the competition index CI (R2 = 0.2584, p < 0.05) and the spatial density index (R2 = 0.1990, p < 0.05), indicating that the level of stand segregation and diversity has a pronounced impact on the spatial structure of the stand. Our analysis showed that the spatial density index (Figure 5c), the complete mixing degree (Figure 5b), and the competition index (Figure 5a) all exhibited significant linear correlations with the spatial homogeneity index of the stand. Specifically, the spatial homogeneity index of the stand was found to have a significant positive correlation with the spatial density index and significant negative correlations with both the complete mixing degree and the competition index. The seven stand spatial-structure parameters influenced the stand homogeneity index in the following order of importance: complete mixing degree, spatial density index, competition index, neighborhood comparison, uniform angle, openness ratio, and forest layer index. This ranking suggests that the degree of mixing within the stand and the overall density are the primary factors shaping the homogeneity of the spatial structure, followed by competition and other structural indices.

3.3. Effects of Spatial Structure of Bamboo and Broad-Leaved Mixed Forests and Moso Bamboo Biomass

The results of Spearman’s correlation analysis indicated a strong association between the aboveground biomass of moso bamboo and the spatial structure of the forest stand (Figure 6). Notably, the spatial density index exhibited a highly significant positive correlation with moso bamboo biomass (p < 0.01), suggesting that an increase in forest stand density could potentially enhance the biomass of moso bamboo. Conversely, there was a highly significant negative correlation between moso bamboo biomass and both the complete mixing degree (p = 0.01) and the competition index (p < 0.05). This indicates that elevated levels of competitive pressure and hybridization may negatively impact the biomass increment of moso bamboo. The cluster analysis results revealed that mixed forests of bamboo and broad-leaved trees with varying mixing ratios could be categorized into three distinct groups, based on differing management objectives (Figure 7). For mixed forests aimed at maximizing economic benefits, sample plots 5 and 6, with mixing ratios of 25%~35%, are recommended. For those focused on ecological benefits, sample plots 7–10, with mixing ratios exceeding 35%, are more suitable. Finally, for a balanced approach between economic and ecological benefits, sample plots 2, 3, and 4, with mixing ratios ranging from 10% to about 25%, are the preferred choice.

4. Discussion

4.1. Appropriate Mixing Ratios of Bamboo and Broad-Leaved Mixed Forests from Different Research Perspectives

Traditional forest management strategies predominantly concentrate on enhancing the economic returns of pure stands, encompassing practices such as fertilization, irrigation, rhizome division, and selective harvesting. While these measures can substantially elevate bamboo yields and optimize forest structure in the short term, they may not promote the sustainable management of bamboo forests [54]. In contrast, the management of bamboo and broad-leaved mixed forests confers ecological benefits, including the continual enhancement of soil structure, the maintenance of stand stability, the increase in moso bamboo productivity, and the augmentation of the stand’s carbon sequestration capacity. Nevertheless, the ecological impacts of the stand are influenced by varying hybrid ratios. Research indicates that the productivity of moso bamboo is maximized when the projected area of broadleaf trees constitutes 32% in a mixed stand with an upper layer of broadleaf trees and a lower layer of bamboo [55]. Additional studies suggest that the optimal ratio for maintaining soil fertility in bamboo and broad-leaved mixed forests is 2100 bamboo plants per hectare, with an 8:2 bamboo-to-broadleaf tree mix [56]. However, these findings pertain to adaptive mixing ratios derived from diverse forest management objectives, rather than being grounded in the spatial structure of the forest stand. Consequently, they may not fundamentally enhance the spatial pattern of bamboo and broad-leaved mixed forests, complicating the achievement of sustainable management goals. This study employs a spatial homogeneity index of the stand evaluation method, rooted in landscape patch theory, to construct a stand homogeneity index by integrating various indicators of stand spatial structure. This approach, which diverges from traditional bivariate analysis of spatial structure, utilizes the principles of multiplication and division inherent in multi-objective planning [57]. The stand homogeneity-index evaluation method offers an accurate and comprehensive description of the overall spatial structure of the stand, providing a viable foundation for the subsequent development of a multi-objective management model for bamboo and broad-leaved mixed forests.

4.2. Effects of Different Mixing Ratios on the Spatial Structure of Forest Stands

The spatial homogeneity index of the forest stand reached its maximum at the evaluation levels of sample plots No. 1 (5%–10%) and No. 3 (15%–20%), both of which were classified as level 5. Sample plots No. 4 (20%–25%) and No. 6 (30%–35%) were assigned to level 3, while sample plots Nos. 7–10 (comprising more than 35%) were categorized as level 1. This finding differs from previous research suggesting that a higher proportion of mixed stands [58] typically results in better spatial structure, which may be due to the focus on mixed-tree forests in those studies. In this study, the clonal nature of moso bamboo and its unregulated expansion lead to variations in mixed tree species, thereby altering the spatial density and competition dynamics within the mixed forest. The spatial structure of bamboo and broad-leaved mixed forests with a mixing ratio of 15% to 20% was superior to other proportions, exhibiting greater stability and ecological function. These forests displayed a subdominant growth state, a high degree of forest isolation, low competition intensity between bamboo and broad-leaved trees, and the highest biomass of moso bamboo. In contrast, some scholars have reported that forest trees under this mixing ratio were in a moderate growth state [59], which could be attributed to differences in tree species and the varying effects of different broad-leaved tree species on promoting the growth and development of moso bamboo. Given the high demand of broad-leaved trees for water, nutrients, and light, an increase in the mixing ratio led to a higher number of broad-leaved trees within the stand, reducing the degree of isolation and intensifying inter-species competition. This had a pronounced effect on the spatial homogeneity index of the stand, with the L-value showing a decreasing trend as the competition index increased overall. Studies have shown that broad-leaved trees inhibit the growth of moso bamboo within 3 m but promote its growth and development beyond this distance.

4.3. Effects of Forest Stand Spatial Structure on the Productivity of Moso Bamboo at Various Mixing Ratios

The spatial structure of stands comprised of bamboo and broad-leaved mixed forests with varying mixing ratios influences the productivity of moso bamboo. Previous studies have demonstrated that stand spatial structure is crucial for enhancing stand productivity [60,61,62]. Consequently, examining the spatial structure of forest stands under different mixing ratios is of particular significance. In this research, the spatial structure of sample plot No. 3 was classified as the highest level (level 5) in the evaluation system, and exhibited the highest biomass of moso bamboo (69,594 kg/ha), suggesting that stand stability is optimal under the appropriate mixing ratio, and the understory soil structure is more conducive to the growth of moso bamboo. However, some studies pointed out that the maximum biomass of moso bamboo was found in the mixed proportion of 30% bamboo-broad-leaved mixed forest [63], which might be caused by the mixed type of upper broad-leaved and lower bamboo and the different associated tree species studied by their authors. The spatial density index of the forest stand reflects the density of trees within a specific spatial range, which has the most direct impact on biomass [64]. In this study, the spatial structure homogeneity-index evaluation of the stands in sample plots No. 4 and No. 6 was the same, level 3, but the spatial density of the stand in the former was greater than that of the latter, resulting in a significantly higher biomass of moso bamboo in the former compared to the latter. The competition index and the complete mixing degree indicate the competition for survival resources and the isolation status between stands, as well as stand diversity; that is, the closer the separation distance between stands, the lower the stand diversity, and the more intense the competition for nutrients between stands [65,66]. Therefore, the biomass of moso bamboo can only reach high levels under conditions of high isolation between bamboo trees and low competition intensity. In this study, the stand competition index and complete mixing degree varied with different mixing ratios of bamboo and broad-leaved mixed forests. The competition index and complete mixing degree were lower in sample plot No. 6 than in sample plot No. 7, and thus its biomass was higher than that in sample plot No. 7. This further indicates that the productivity of moso bamboo is not only closely related to stand density, competition, and isolation degree, but is also influenced by the proportion of mixing. Therefore, the productivity of moso bamboo is affected by the mixing ratio, competition index, and other factors.

5. Conclusions

The aim of this study was to comprehensively assess the spatial structure of bamboo and broad-leaved mixed forests across varying mixing ratios. The results indicate that the spatial structure of the stand was optimal when the mixing proportion was below 35%, particularly at a proportion between 15% and 20%, where the spatial homogeneity index of the stand reached its peak and the aboveground biomass of moso bamboo was correspondingly maximal. The study also identified the complete mixing degree, competition index, and spatial density index as pivotal factors influencing both the spatial structure and the biomass of moso bamboo, thereby providing guidance for future conservation and management strategies of bamboo and broad-leaved mixed forests. Additionally, from a management perspective, mixed ratios for bamboo and broad-leaved forests were proposed to align with varying management objectives. For the management of bamboo and broad-leaved forests focusing on economic benefits, the recommended mixed ratios are 5% to 10% and 25% to 35%. For the management of bamboo and broad-leaved forests aimed at ecological benefits, the mixed ratio should exceed 35%. Considering both ecological and economic benefits, a mixed proportion of 10% to 25% is recommended for management.

Author Contributions

S.L. writing—original draft preparation, visualization, formal analysis; Y.Z. writing—review and editing, conceptualization, investigation, data curation, methodology; H.Y. visualization, software; S.F. resources, funding acquisition; F.G. project administration, supervision; L.Z. data curation. All authors have read and agreed to the published version of the manuscript.

Funding

This study was supported by the Growth Adaptability Research Forest of Wild Indocalamus Indocalamus (0523138) during whiplash root expansion.

Data Availability Statement

The data presented in this study are available on request from the corresponding author, due to the data also forming part of an ongoing study.

Acknowledgments

We are very grateful to Xianli Zeng and Xiong Jing for their help in sampling.

Conflicts of Interest

The authors declare no conflicts of interest.

References

  1. Chen, H.; Hong, W.; Lin, S.; Liu, J.F. Comparison of forest resources in Asian countries based on the Global Forest Resources Assessment Programme. For. Sci. Technol. Newsl. 2023, 5, 9–14. [Google Scholar] [CrossRef]
  2. Feng, P.F.; Li, Y.M. Report on bamboo resources in China in 2021. World Bamboo Ratt. Newsl. 2023, 21, 100–103. [Google Scholar]
  3. Yamada, T.; Oshige, C.; Nakabayashi, M.; Okuda, T.; Zaw, M.A.; Hlaing, E.E. Spatial association of bamboos with trees in a commercial tree plantation forest in Myanmar. J. Trop. Ecol. 2023, 39, 31. [Google Scholar] [CrossRef]
  4. Yan, Y.J.; Xia, M.P.; Fan, S.H.; Zhan, M.C.; Guan, F.Y. Detecting the Competition between Moso Bamboos and Broad-Leaved Trees in Mixed Forests Using a Terrestrial Laser Scanner. Forests 2018, 9, 520. [Google Scholar] [CrossRef]
  5. Peng, C.; Song, Y.; Li, C.; Mei, T.; Zhou, G. Growing in Mixed Stands Increased Leaf Photosynthesis and Physiological Stress Resistance in Moso Bamboo and Mature Chinese Fir Plantations. Front. Plant Sci. 2021, 12, 649204. [Google Scholar] [CrossRef]
  6. Wu, B.L.; Chen, S.L.; Yu, M.Z.; Zheng, D.M.; Zhang, L.X. Comparison of the morphological quality of bamboo timber between pure stands of moso bamboo and mixed stands of bamboo and cedar. Zhejiang For. Sci. Technol. 2007, 27, 47–50. [Google Scholar] [CrossRef]
  7. Zhou, Y.Q.; Dong, J.; Guan, F.Y.; Fan, S.H. Progress and prospect of broad mixed forest research. For. Resour. Manag. 2016, 3, 145–150. [Google Scholar] [CrossRef]
  8. Xiao, X.; Ding, S.; OuYang, X.Z. Analysis of the spatial structure of typical evergreen broad-leaved forest stands in Jinggangshan National Nature Reserve. J. Northwest Agric. For. Univ. Nat. Sci. Ed. 2016, 44, 8. [Google Scholar] [CrossRef]
  9. Lai, M.H.; Lai, R.W.; Hu, R.J.; Ye, W. Analysis of spatial structure parameters and correlation study of planted cedar forest stands. Ecol. Sci. 2021, 6, 58–63. [Google Scholar] [CrossRef]
  10. Zhou, G.M.; Meng, C.F.; Jiang, P.K.; Xu, Q.F. Review of carbon fixation in bamboo forests in China. Bot. Rev. 2011, 77, 262. [Google Scholar] [CrossRef]
  11. Shinohara, Y.; Misumi, Y.; Kubota, T.; Nanko, K. Characteristics of soil erosion in a moso-bambooforest of western Japan: Comparison with a broadleaved forest and a coniferous forest. Catena 2019, 172, 451–460. [Google Scholar] [CrossRef]
  12. Ma, K.Y.; Cao, W.Y.; Yang, Y.H.; Ma, G.Y.; Wang, X.N.; Zhao, K.; Li, F. Discussion on rowan-bamboo composite hybrid model and forestry technology. Agric. Technol. 2024, 44, 58–61. [Google Scholar]
  13. Lin, Z.Q. Research on the productivity and management efficiency of moso bamboo in bamboo-width mixed forest. Bamboo Res. Repos. 2000, 4, 42–45. [Google Scholar] [CrossRef]
  14. Wu, X.A.; Zhong, J.H.; Meng, Y. Effects of bamboo forest structure on the yield of new bamboo in roughly managed moso bamboo forest. Hunan For. Sci. Technol. 2018, 6, 29–33. [Google Scholar] [CrossRef]
  15. Zheng, G.T. Research on the productivity survey of bamboo-width mixed forest stands with different management types. Mod. Agric. Sci. Technol. 2015, 10, 152–153. [Google Scholar] [CrossRef]
  16. Xu, B.; Li, Y.X.; Wang, S.P.; Huang, L.H. Effects of shallow rice straw mulching on asparagus in moso bamboo forest. Anhui Agric. Bull. 2023, 10, 50–53. [Google Scholar] [CrossRef]
  17. Wang, X.Y.; Song, X.Z.; Yang, H.; Wu, B.L.; Lin, X.Y. Structural characteristics of stands at different expansion stages of moso bamboo. J. Northeast For. Univ. 2021, 11, 39–44. [Google Scholar] [CrossRef]
  18. Hui, G.Y.; Hu, Y.B. Research on the expression of spatial segregation degree of mixed forest species. For. Sci. Res. 2001, 1, 23–27. [Google Scholar] [CrossRef]
  19. Pommerening, A. Evaluating structural indices by reversing forest structural analysis. For. Ecol. Manag. 2006, 3, 266–277. [Google Scholar] [CrossRef]
  20. Tang, M.P.; Zhou, G.M.; Chen, Y.G.; Zhao, Y.S.; He, Y.B. Mixing degree of evergreen broad-leaved forest in Tianmu Mountain based on Voronoi diagram. For. Sci. 2009, 6, 1–5. [Google Scholar] [CrossRef]
  21. Sun, Y.H.; Wang, S.B.; Wang, R.H.; Zheng, X.Y.; Yan, F. Evaluation of spatial structure of oil pine plantation forest using Voronoi diagram. J. Zhejiang Agric. For. Univ. 2018, 5, 877–884. [Google Scholar] [CrossRef]
  22. Hui, G.Y.; Li, L.; Zhao, Z.H.; Dang, J.X. A method for analysing spatial distribution patterns of forest trees. J. Ecol. 2007, 11, 4717–4728. [Google Scholar] [CrossRef]
  23. Hui, G.Y. Angular scale a structural parameter describing the distribution pattern of individual forest trees. For. Sci. 1999, 1, 37–42. [Google Scholar] [CrossRef]
  24. Li, M.H.; He, F.H.; Liu, Y.; Pan, C.D. Methods for studying spatial patterns of forest stands. Ecol. Sci. 2003, 1, 77–81. [Google Scholar] [CrossRef]
  25. Tang, M.P.; Lou, M.H.; Chen, Y.G.; Xu, W.B.; Zhao, M.S. Comparative analysis of different hybridisation indices. For. Sci. 2012, 8, 46–53. [Google Scholar] [CrossRef]
  26. Liu, Y.; Li, C.X.; Wang, Z.C.; Zhao, Y.Z.; Li, Y.X. Characteristics of the spatial structure of two major natural secondary forest stands in Daxing’anling. J. Northeast For. Univ. 2020, 6, 128–134. [Google Scholar] [CrossRef]
  27. Zhang, F.; Liu, H.; Fang, Y.; Bai, Z.Q.; Ye, G.; Han, Y.L. Characteristics of the spatial structure of natural coniferous forest stands in the Altai Mountains of Xinjiang. J. Anhui Agric. Univ. 2014, 4, 629–635. [Google Scholar] [CrossRef]
  28. Liu, H.; Dong, X.; Meng, Y.; Gao, T.; Mao, L.L.; Gao, R. A novel model to evaluate spatial structure in thinned conifer-broadleaved mixed natural forests. J. For. Res. 2023, 6, 1881–1898. [Google Scholar] [CrossRef]
  29. Dong, L.; Bettinger, P.; Liu, Z. Optimizing neighbourhood-based stand spatial structure: Four cases of boreal forests. For. Ecol. Manag. 2022, 506, 119965. [Google Scholar] [CrossRef]
  30. Qiu, H.; Zhang, H.; Lei, K.; Hu, X.T.; Yang, T.D.; Jiang, X. A New Tree-Level Multi-Objective Forest Harvest Model (MO-PSO): Integrating Neighborhood Indices and PSO Algorithm to Improve the Optimization Effect of Spatial Structure. Forests 2023, 3, 441. [Google Scholar] [CrossRef]
  31. Zhou, M.L. Research on the stability of different forest communities based on spatial structure index. J. Plant Sci. 2016, 5, 724–733. [Google Scholar] [CrossRef]
  32. Sun, P.Q.; Zhao, Z.H.; Hui, G.Y.; Xu, H.; Jiang, Z.B.; Chen, R.S.; Liu, X.H. Evaluation method of urgency of natural forest stand management and its application. For. Sci. Res. 2009, 3, 343–348. [Google Scholar] [CrossRef]
  33. Hui, G.Y.; Zhang, G.Q.; Zhao, Z.H.; Hu, Y.B.; Liu, W.Z.; Zhang, S.Z.; Bai, C. The π-value law for optimal stand state of natural mixed forest. For. Sci. 2016, 5, 1–8. [Google Scholar]
  34. Zhang, G.; Hui, G.; Zhang, G.; Hu, Y.; Zhao, Z. A Novel Comprehensive Evaluation Method of Forest State Based on Unit Circle. Forests 2018, 10, 5. [Google Scholar] [CrossRef]
  35. Li, Y.C.; Cheng, J.H.; Li, M.F.; Wang, Y. Characterisation of stand spatial structure of cedar-width mixed forests with different tree species configurations in Jiuhuashan Forest Farm, Hubei Province. J. Ecol. 2019, 6, 1908–1916. [Google Scholar] [CrossRef]
  36. Cao, X.Y.; Li, J.P.; Feng, Y.; Hu, Y.J.; Zhang, C.C.; Fang, X.N.; Deng, C. Analysis and evaluation of the spatial structure of fir ecological public welfare forest stands. For. Sci. 2015, 7, 37–48. [Google Scholar]
  37. Li, J.J.; Zhu, K.W.; Liu, S.; Li, D.; Zhang, G.; Liu, X.; Yang, W.M. Introducing tree neighbouring relationship factors in forest pattern spatial analysis: Weighted Delaunay triangulation method. J. For. Res. 2021, 5, 1941–1951. [Google Scholar] [CrossRef]
  38. Cao, X.Y.; Li, J.P.; Chen, L.; Hu, Y.J. Intraspecific and interspecific competition based on weighted Voronoi diagrams in fir ecological public welfare forests. J. Ecol. 2016, 9, 2553–2561. [Google Scholar] [CrossRef]
  39. Li, Y.; Hui, G.; Zhao, Z.; Hu, Y.; Ye, S. Spatial structural characteristics of three hardwood species in Korean pine broad-leaved forest- Validating the bivariate distribution of structural parameters from the point of tree population. For. Ecol. Manag. 2014, 314, 17–25. [Google Scholar] [CrossRef]
  40. Chai, Z.Z.; Sun, C.L.; Wang, D.X.; Liu, W.Z.; Zhang, C.S. Spatial structure and dynamics of predominant populations in a virgin old-growth oak forest in the Qinling Mountains, China. Scand. J. For. Res. 2017, 32, 19–29. [Google Scholar] [CrossRef]
  41. Li, J.J.; Liu, S.; Zhang, H.R.; Kuang, Z.F.; Wang, C.L.; Zhang, J.; Cao, X.P. Evaluation of spatial structure homogeneity of forest ecosystems in Dongting Lake. J. Ecol. 2013, 12, 3732–3741. [Google Scholar] [CrossRef]
  42. Nguyen, Q.V.; Pham, M.P.; Meng, L.; Bui, H.M.; Pham, H.T.; Nguyen, H.V.; Nguyen, T.T.; Kang, Y.X. Spatial Structure of the Dominant Tree Species in an Evergreen Broadleaved Forest Stand in South Vietnam. Biol. Bull. 2022, 49, S69–S82. [Google Scholar] [CrossRef]
  43. Pommerening, A.; Durrheim, G.; Behrend, A.M. Rare spatio-temporal interactions between conspecific species mingling and size inequality in a diverse Afromontane forest. For. Ecol. Manag. 2024, 558, 121787. [Google Scholar] [CrossRef]
  44. Zhang, H.W.; Li, J.P.; LI, J.J. Study on the spatial structure homogeneity of mangrove stands in different tidal zones. J. Cent. South Univ. For. Sci. Technol. 2011, 4, 79–83. [Google Scholar] [CrossRef]
  45. Li, J.J.; Li, J.P.; Liu, S.Q.; Zhang, H.W.; Feng, X.L. Homogeneity index of mangrove spatial structure. For. Sci. 2010, 6, 6–14. [Google Scholar] [CrossRef]
  46. Liu, G.; Lu, Y.C.; Knut, S.; Ning, J.K.; Lei, X.D. Research and application of near-naturalness evaluation method for forest management in Beijing forest area. J. Northeast For. Univ. 2009, 5, 114–118. [Google Scholar] [CrossRef]
  47. Li, X.; Zhang, G.; Li, J. Spatial Structure Evaluation of Natural Secondary Forest around Dongting Lake Based on Entropy Weight—Cloud Model. J. Coast. Res. 2020, 103, 484–489. [Google Scholar] [CrossRef]
  48. Lv, Y.; Zang, H.; Wan, X.J.; Deng, Z.C.; Li, J.J. A study on the forest layer structure of mixed forests with blue species based on the forest layer index. For. Resour. Manag. 2012, 3, 81–84. [Google Scholar] [CrossRef]
  49. Lin, F.C.; Wang, W.F.; Men, X.L.; Sun, Y.S.; Li, G.C.; Liu, D.D. Spatial structure optimal of Larix gmelinii plantation. J. Beijing For. Univ. 2021, 4, 68–76. [Google Scholar] [CrossRef]
  50. Li, J.J.; Li, J.P. Research on classification of decision-making factors for forest stand management based on rough set. Fujian For. Sci. Technol. 2008, 3, 4–9. [Google Scholar] [CrossRef]
  51. Feng, Y.; Li, J.P.; Zhang, C.C.; Zhao, C.Y.; Cao, X.Y. Quantitative analysis of spatial structure of cedar ecological public welfare forest based on weighted Voronoi diagram. J. Cent. South For. Univ. Sci. Technol. 2014, 7, 55–60. [Google Scholar] [CrossRef]
  52. Hu, X.T.; Zhang, H.Q.; Yang, G.B.; Qiu, H.Q.; Lei, K.X.; Yang, T.D.; Liu, Y.; Zuo, Y.Q.; Wang, J.S.; Cui, Z.Y. Visual simulation research on growth polymorphism of Chinese fir stand based on different comprehensive grade models of spatial structure parameters. Forests 2023, 14, 617. [Google Scholar] [CrossRef]
  53. Tang, X.L.; Fan, S.H.; Qi, L.H.; Guan, F.Y.; Du, M.Y.; Zhang, H. Soil respiration and net ecosystem production in relation to intensive management in Moso bamboo forests. Catena Interdiscip. J. Soil Sci. Hydrol.-Geomorphol. Focus. Geoecol. Landsc. Evol. 2016, 137, 219–228. [Google Scholar] [CrossRef]
  54. Li, C.; Zhou, G.M.; Shi, Y.J.; Zhou, Y.F.; Xu, X.J.; Zhang, Y.P.; Fan, Y.Q.; Shen, Z.M. Effects of old bamboo level and management measures on the developmental quality of new bamboo in moso bamboo forest. J. Ecol. 2016, 8, 2243–2254. [Google Scholar]
  55. Gu, Q.; Cheng, X.F.; Huang, W.L.; Wang, F.S. Effects of mixed management of upper broad and lower bamboo on productivity of moso bamboo. Bamboo Res. Repos. 2015, 3, 30–34. [Google Scholar] [CrossRef]
  56. Li, Z.C.; Fu, M.Y.; Xie, J.Z.; Li, R.G.; Xiao, J.H. Ground conservation of moso bamboo and bamboo-width mixed forest communities. J. Bamboo Res. 2003, 1, 32–37. [Google Scholar] [CrossRef]
  57. Yang, M.; Cai, T.J.; Ju, C.Y.; Zou, H.F. Evaluating spatial structure of a mixed broad-leaved/Korean pine forest based on neighbourhood relationships in Mudanfeng National Nature Reserve, China. For. Res. Engl. Ed. 2019, 30, 1375–1381. [Google Scholar] [CrossRef]
  58. Chen, Y.N.; Yang, H.; Ma, S.Y.; Ren, M.M. Spatial structure diversity of semi-natural and plantation stands of larix gmelini in Changbai Mountains, northeastern China. J. Beijing For. Univ. 2015, 12, 48–58. [Google Scholar] [CrossRef]
  59. Zhao, X.J. Research on Forest Stand Structure Characteristics and Its Optimisation Model of Bamboo-Tree Mixed Forest in Northwest Fujian; Beijing Forestry University: Beijing, China, 2017. [Google Scholar]
  60. Ming, A.G.; Liu, S.R.; Li, H.; Zeng, J.; Sun, D.J.; Lei, L.Q.; Meng, M.J.; Tao, Y.; Ming, C.D. Effects of near-naturalisation modification on biomass and its allocation of horsetail pine and fir plantation forests. J. Ecol. 2017, 23, 7833–7842. [Google Scholar] [CrossRef]
  61. Chen, M.H.; Hui, G.Y.; Hu, Y.B.; Zhang, G.Q.; Zhang, G.G.; Liu, R.H.; Yang, Y.M.; Zhao, Z.H.; Wang, H.B. Effects of structured forest management on forest quality of broad-leaved red pine forest in Northeast China. J. Beijing For. Univ. 2019, 5, 19–30. [Google Scholar] [CrossRef]
  62. Lin, B.; Su, L.L.; Cao, L.Q. Effects of different types of natural mixed forests of moso bamboo on bamboo shoots and bamboo formation. World Bamboo Ratt. Newsl. 2018, 1, 11–15. [Google Scholar] [CrossRef]
  63. Cheng, X.F.; Shi, P.J.; Hui, C.; Wang, F.S.; Liu, G.H.; Li, B.L. An optimal proportion of mixing broad-leaved forest for enhancing the effective productivity of moso bamboo. Ecol. Evol. 2015, 5, 1576–1584. [Google Scholar] [CrossRef] [PubMed]
  64. Li, S.F.; JiaCheng, X.Z.; Yang, L.H.; Huang, X.B.; Lang, X.D.; Liu, W.D.; Su, J.R. Effects of stand density on the spatial distribution of root biomass in Simao pine plantation forest. Northwest J. Bot. 2017, 11, 2265–2272. [Google Scholar] [CrossRef]
  65. Dou, X.W.; Tang, M.P. Gravitational model-based competitive analysis of trees. Ying Yong Sheng Tai Xue Bao = J. Appl. Ecol. 2022, 10, 2695–2704. [Google Scholar] [CrossRef]
  66. Xu, M.L.; Wang, J.F.; Xu, H.; Ou, G.L. Relationship between spatial structure and aboveground biomass allocation of individual trees in Simao pine natural forest. J. Yunnan Univ. Nat. Sci. Ed. 2020, 2, 364–373. [Google Scholar]
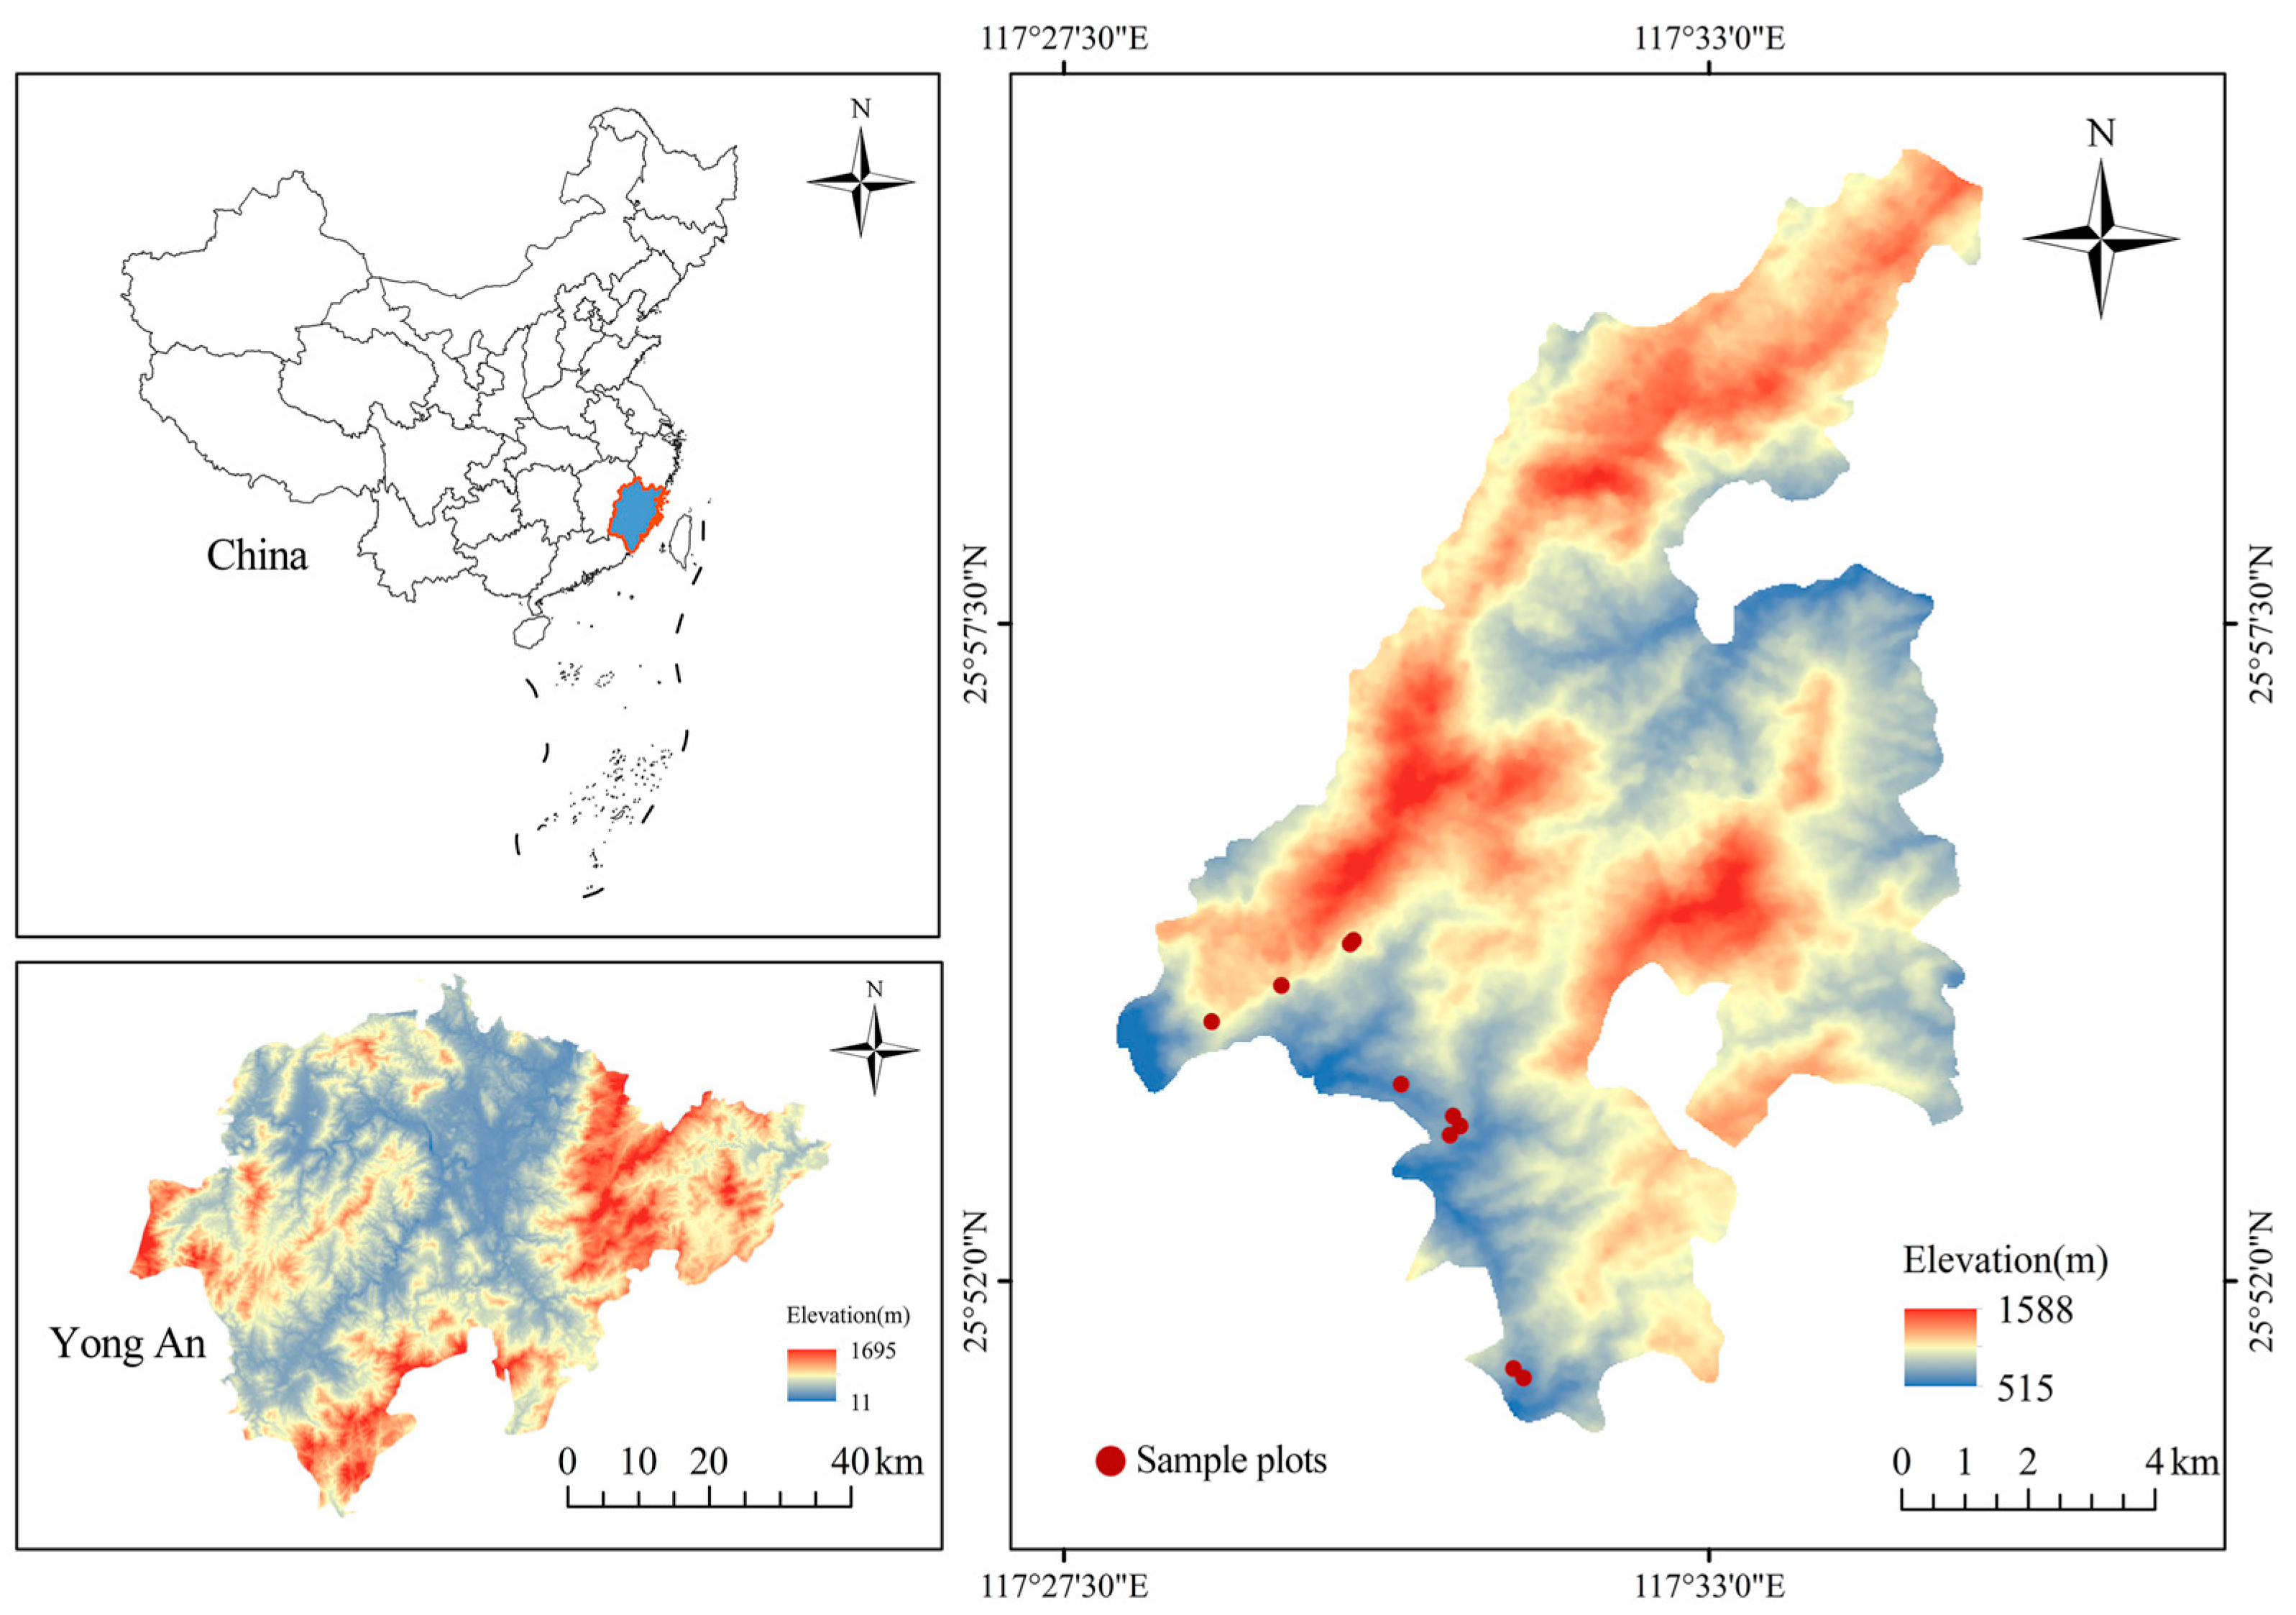
Figure 1. Research area.
Forests 16 00100 g001
Figure 2. Structural units. (a) Pre-weighted structural units; (b) weighted structural units. The blue circle represents the adjacent wood whose position has not changed before and after weighting, the green circle represents the adjacent wood whose position has changed before and after weighting, and the red circle represents the object wood.
Forests 16 00100 g002
Figure 3. Evaluation system of spatial homogeneity of bamboo-width mixed forests.
Forests 16 00100 g003
Figure 4. Spatial homogeneity rating class of forest stands and moso bamboo biomass.
Forests 16 00100 g004
Figure 5. Linear regression of stand spatial-homogeneity index with stand spatial-structure parameters. Note that the gray areas are 95% confidence intervals and the blue dots represent 30 samples. (a) the linear regression of competition index; (b) the linear regression of complete mingling index; (c) the linear regression of spatial density index; (d) the linear regression of uniform angle index; (e) the linear regression of openness ratio; (f) the linear regression of neighborhood comparison; (g) the linear regression of forest layer index.
Forests 16 00100 g005
Figure 6. Correlation analysis between stand spatial-structure parameters and moso bamboo biomass. OP is the openness ratio, W is the uniform angle, U is the neighborhood comparison, CI is the competition index, M is the complete mixing degree, S is the forest layer index, D is the spatial density index, and AGB is the bamboo biomass. “*”, “**” and “****” represent different levels of correlation respectively.
Forests 16 00100 g006
Figure 7. Cluster analysis based on biomass and spatial homogeneity index of stand. In the Figure, 1–10 represent 5%~10%, respectively, of which 10%~15%, 15%~20%, 20%~25%, 25%~30%, 30%~35%, 35%~40%, and 40%~45%, 45%~50% represent more than 50% of the sample area.
Forests 16 00100 g007
Table 1. Basic overview of the survey sample sites.
Sample PlotMixing
Ratio
GradientAspectSlopeAltitudeAverage DBH
(cm)
Average Tree Height (m)Density Bamboo (Plant/hm2)Bamboo Biomass (kg103/hm2)
15%–10%34sunnymiddle71310.6712.40320651.924
210%–15%35sunnymiddle78811.4312.95331363.608
315%–20%21sunnydown77410.7112.43412569.594
420%–25%28shadymiddle81010.8412.52348160.378
525%–30%30sunnymiddle79511.0112.68279445.057
630%–35%29sunnymiddle71210.3812.17300643.189
735%–40%24sunnymiddle87110.9112.60258140.714
840%–45%20sunnyup83910.4212.20156922.552
945%–50%35shadyup63111.3812.96217536.607
10More than 50%33sunnymiddle87210.9012.57156320.815
Table 2. Classification of spatial homogeneity classes of bamboo and broad-leaved mixed forests.
Heterogeneity Evaluation IndexThe Description of Stand Heterogeneity of State FeatureThe Grade Value of Heterogeneity Evaluation
0.2Broad-leaved trees are dominant, the isolation degree of trees is low, the inter-specific competition intensity of stands is high, the stand closure is high, the stand light transmission is poor, the forest layer structure is relatively simple, and most of them are single-layer forests.1
0.2–0.4There are more broad-leaved trees, less bamboo, lower isolation degree, moderate inter-specific competition intensity, higher canopy density, poor light transmission of stand, relatively simple structure of forest layer, and less multilayer forest.2
0.4–0.6The proportion of bamboo increases, the expansion effect is obvious, the interspecific competition intensity is low, the spatial distribution is uniform, the stand closure is general, and the stand light transmission is reasonable.3
0.6–0.8The proportion of bamboo is relatively large, the proportion of broad-leaved trees is relatively small, the degree of forest isolation is high, the intensity of interspecific competition is weak, the stand light transmission condition is better, the structure of the forest layer is more complex, and the single-layer forest is less.4
0.8–1Phyllostachys bamboo is dominant, with weak interspecific competition, high isolation degree, low stand closure, good light transmission conditions, complex forest structure and multi-layered forest.5
Table 3. Spatial structure parameters and homogeneity evaluation indices of bamboo and broad-leaved mixed-forest stands with different mixing ratios.
Samsam PlotMixing
Ratio
OPWUCIMSDLEvaluate
Exponent
1(5%–10%)0.7140.1580.4761.5210.0090.0700.874163,428.9731.000
2(10%–15%)0.6820.1500.4901.5900.0050.0750.903110,506.9150.645
3(15%–20%)0.6290.1590.4831.5080.0170.2130.906146,973.9280.890
4(20%–25%)0.6340.1710.4831.5910.0050.1970.89395,105.3830.541
5(25%–30%)0.7410.1630.4911.7370.0310.0460.89457,655.4770.290
6(30%–35%)0.6750.1700.4791.5780.0240.2800.87085,172.5720.475
7(35%–40%)0.7510.1660.4851.8270.0660.0770.86414,452.6210.0000067
8(40%–45%)0.7150.1600.4782.0970.0490.1090.83120,907.6090.043
9(45%–50%)0.6680.1720.4951.7620.0440.0780.85622,207.6890.052
10(More than 50%)0.7320.1700.4931.6110.0800.1990.80520,344.8180.040
OP is the openness ratio, W is the uniform angle, U is the neighborhood comparison, CI is the competition index, M is the complete mixing degree, S is the forest layer index, D is the spatial density index, and AGB is the bamboo biomass.
Disclaimer/Publisher’s Note: The statements, opinions and data contained in all publications are solely those of the individual author(s) and contributor(s) and not of MDPI and/or the editor(s). MDPI and/or the editor(s) disclaim responsibility for any injury to people or property resulting from any ideas, methods, instructions or products referred to in the content.