Article

Early Thinning: A Promising Tool to Prevent Fistulina hepatica Heart Rot in Castanea sativa Coppice Stands

by
Andreu Meijer
1,2,*,
Emigdio Jordán Muñoz-Adalia
2,3 and
Carlos Colinas
1,2
1
Department of Forestry and Agricultural Science and Engineering, University of Lleida, Av. de l’Alcalde Rovira Roure 191, 25198 Lleida, Spain
2
Forest Science and Technology Centre of Catalonia (CTFC), Carretera St. Llorenç de Morunys km. 2, 25280 Solsona, Spain
3
Department of Agroforestry Sciences, iuFOR University of Valladolid, ETSIAA Palencia, Av. Madrid, 57, 34071 Palencia, Spain
*
Author to whom correspondence should be addressed.
Forests 2024, 15(9), 1639; https://doi.org/10.3390/f15091639
Submission received: 9 May 2024 / Revised: 9 September 2024 / Accepted: 12 September 2024 / Published: 17 September 2024
(This article belongs to the Section Forest Health)

Abstract

:
Castanea sativa is a high-value tree species whose stands have faced significant threats over the past century. The occurrence of one such threat, Chestnut Red Stain—a heartwood discoloration caused by the fungus Fistulina hepatica—has recently increased. This disease devalues the timber by up to 70% due to the rejection of stained wood by the industry. This study aimed to evaluate the effects of three management strategies on the occurrence of F. hepatica in chestnut coppice stands. Additionally, the co-occurrence of F. hepatica and Cryphonectria parasitica, both highly prevalent in the study area, was assessed. In 2013, three different silvicultural treatments were applied to five plots. Seven years later, the stand characteristics were measured, and the incidence of F. hepatica was evaluated using molecular tools. Data modeling revealed that the quadratic mean diameter before the interventions was related to the incidence of F. hepatica. Our results suggest that the thinning at earlier stand stages may be more critical than the type or intensity of the thinning in reducing the incidence of the fungus in the mid-term. This finding provides forest managers with new guidance to improve silvicultural treatments and prevent F. hepatica damage.

1. Introduction

Over the last century, numerous pest and disease outbreaks have caused a generalized silvicultural abandonment of productive sweet chestnut stands (Castanea sativa Mill.) in various regions of Europe [1,2]. The invasive Asian gall wasp (Dryocosmus kuriphilus Yasumatsu) caused extensive damage and fruit harvest losses [3,4]. The Ink disease, a root rot caused by the oomycete Phytophthora spp., has been responsible for high rates of tree decline and mortality [5,6], in addition to Chestnut Blight, caused by the exotic fungus Cryphonectria parasitica (Murrill) M.E. Barr [7]. These diseases have jeopardized the viability of many productive stands. Despite this, in Europe, this tree species still covers over 2.5 million hectares, of which 1.78 Mha are dedicated to timber production and 0.43 Mha to fruit harvesting [8,9].
In Catalonia (northeast Spain), sweet chestnut is present in more than 28,000 ha of woodlands, with over 12,000 ha where it is considered the dominant species [10]. In the 1990s, a heartwood discoloration known as Chestnut Red Stain (CRS) emerged as an additional concern for landowners [11]. Although in initial stages CRS does not significantly alter wood properties [12,13], aesthetic alterations caused by the disease are rejected by the saw wood industry, devaluating the timber up to 70% in the local market [14]. Consequently, several forest managers decided to change the chestnut stands to other tree species with less risk factors [15].
Chestnut Red Stain is caused by the basidiomycete fungus Fistulina hepatica (Schaeff.) with [14]. Fistulina hepatica is a common wood decay fungus that is thought to grow mainly on standing, old-growth Quercus spp. and Castanea spp. forests [16,17]. Fistulina is a genus of wood-rotting fungi of fleshy basidiomata with a poroid hymenium of free tubes, a monomitic hyphal system, and ovoid or ellipsoidal basidiospores (Figure 1) [18]. This fungus causes a brown rot characterized by limited lignin degradation while the structural carbohydrates are degraded [13], although it is also able to obtain a portion of its sugar supply from the tree’s tannic compounds [19]. Heartwood rot fungi usually infect through spores, which are thought to enter the trees through heartwood-exposing injuries [20]. Yet, several aspects of F. hepatica etiology remain understudied. For instance, it has been hypothesized that the fungus could enter trees through old stumps. However, Regué et al. [11] found no difference in incidences between resprouted trees and those grown from seed, proving that basidiospore infection does occur.
Current knowledge on the preventive management of this disease is still incipient; hence, silviculture guides only recommend keeping rotation periods under 30 years—assuming the economic loss of not obtaining large-diameter sawlog timber—and sanitary clear-cuts if a high-infection incidence is detected [15,21]. These indications are usually deemed insufficient by foresters, as CRS detection typically occurs at the end of the rotation when the economic impact is highest, resulting in unaffordable profit losses. Forest management guidelines also recommend maintaining vigorous stand growth by thinning, yet there is no evidence that supports this strategy in CRS incidence or economic impact reduction. In consequence, the aims of this study were (a) to find out whether thinning in managed chestnut stands influences the occurrence of F. hepatica, and (b) to detect whether C. parasitica and F. hepatica tend to co-infect trees, thus causing a synergistic effect in tree decline and economic losses.

2. Materials and Methods

2.1. Study Site

This study was conducted in 2021 in Montseny Natural Park (Catalonia, northeastern Spain), where a total of five stands (blocks) were selected and were divided into three experimental plots each. On each experimental plot, a different silvicultural treatment was applied. The age of all the trees in each stand was 18 years when they underwent thinning in 2013, as per the management records. These interventions were carried out between the months of April and October (Table A1). The interventions applied to each plot were as follows: (Ta) low thinning, that is, the removal of dominated trees only [extracted basal area (BA) ranged from 36 to 50%]; (Tb) selective mixed thinning, a combination of selective thinning removing stems around the best trees and low thinning in the rest of the stand (extracted BA ranged from 36 to 50%); and (Tc) control, a natural evolution of the stand without intervention. Treatments Ta and Tb aimed to reduce competition, thus increasing the vigor and resources available for the remaining trees. The size of the treated plots was 0.65 ± 0.38 ha (mean value and standard error).

2.2. Data Collection

Stands were characterized in a 10 m radius circle at the center of each plot, where ten trees growing from different stumps were randomly selected in five pairs. More specifically, one pair was selected in the center of the plot, and the other four were selected to be as close as possible to the 10 m radius edge, with two to the left and right on the same contour line from the center. Two additional pairs of trees were selected on the highest and the lowest points, as described in Figure 2. The location coordinates of each pair of trees were recorded, and each individual tree was identified with a numbered metallic label. The plot basal area was measured with a Bitterlich relascope (Silvanus RL000, Kirchdorf an der Krems, Austria), and the dominant height was measured using a Suunto OPTI Height Meter (Suunto, Vantaa, Finland). The diameter at breast height (DBH) of each tree (i.e., ten per plot) was measured with a metric tape. In addition, the presence of C. parasitica was assessed according to symptoms occurrence (i.e., swollen cankers, reddish coloration, or visible necrotic area). Dead or dying trees, when present, were excluded.
To determine the stress evolution of the stands over the years, the Normalized Difference Vegetation Index (NDVI) was computed [22]. The index was calculated using multispectral images from Landsat-7 and Landsat-8 (U.S. Geological Survey) from the years 2012 (Landsat-7) and 2014, 2015, 2017, and 2020 (Landsat-8), using the NDVI value of the center of each plot for each year. Annual values were used for calculating the area under the curve (AUC) of the NDVI for each plot throughout the study period.
Once each plot was characterized, wood cores from the stems of the ten selected trees were collected with a 5 mm increment borer at 0.30 m aboveground. After collecting each sample, the increment borer was cleaned with ethanol 99% v/v and flamed to prevent the cross-contamination of the samples. The cores were extended beyond the center of the stem to ensure that the heartwood was sufficiently sampled, since CRS is most prevalent in this kind of tissue [11,14]. The cores were then bagged separately and taken to the laboratory at 5 °C, where they were stored in a freezer at −20 °C for further analysis.

2.3. Molecular Diagnosis of Fistulina hepatica

The total genomic DNA was individually extracted from the wood cores. Firstly, the core section corresponding to the center of each tree was selected by collecting approximately 200 µg of shavings with a sterile scalpel. Liquid nitrogen was used to freeze and grind the samples in a ceramic mortar. The tools were cleaned with a 15% v/v common bleach solution between samples. The processed wood shavings were stored separately in sterile 2 mL Eppendorf tubes at −20 °C until DNA extraction.
The total DNA was extracted using a QIAamp Fast DNA Stool Mini Kit (Qiagen N.V., Hilden, Germany) [23] following the manufacturer’s protocol with minor changes. Specifically, the samples were incubated for a longer period at 95 °C in the lysing buffer (InhibitEX Buffer), stirring the samples after 15 min to ensure that they were completely submerged, and then left incubating for 25 additional minutes. The samples were incubated in a Thermoblock (J.P Selecta, Abrera, Spain) until the temperature reached 70 °C (40 min). After the extraction, the DNA was quantified using a NanoDrop 2000c spectrophotometer (Thermo Scientific, Waltham, MA, USA).
The presence or absence of F. hepatica in the sampled wood cores was assessed through a specific PCR using Illustra PuReTaq Ready-To-Go PCR beads (GE Healthcare, Little Chalfont, UK). The reaction volume was adjusted to 25 µL and the total DNA adjusted to yield 75 ng per sample. The PCR was conducted in a Mastercycler Nexus X2 thermocycler (Eppendorf, Hamburg, Germany) following the protocol described by Regué et al. [11]. The primer pair used was ITS1-DF (5′-TTACACACACACACCTTGAAAAAACCGTC-3′) and ITS2-DF (5′-GGCCCCGGGATGGCAACGACGGCG-3′). These primers allow for the amplification of a specific fragment of the ribosomal internal transcribed spacer (ITS) region whose specificity to F. hepatica was confirmed in an earlier study [11]. The amplification conditions were based on previous studies [11,24]: initial denaturation at 95 °C for 5 min; 35 amplification cycles; and final extension at 72 °C for 10 min. Each amplification cycle consisted of a denaturation at 95 °C for 50 s, annealing at 55 °C for 1 min, and an extension at 72 °C for 45 s.
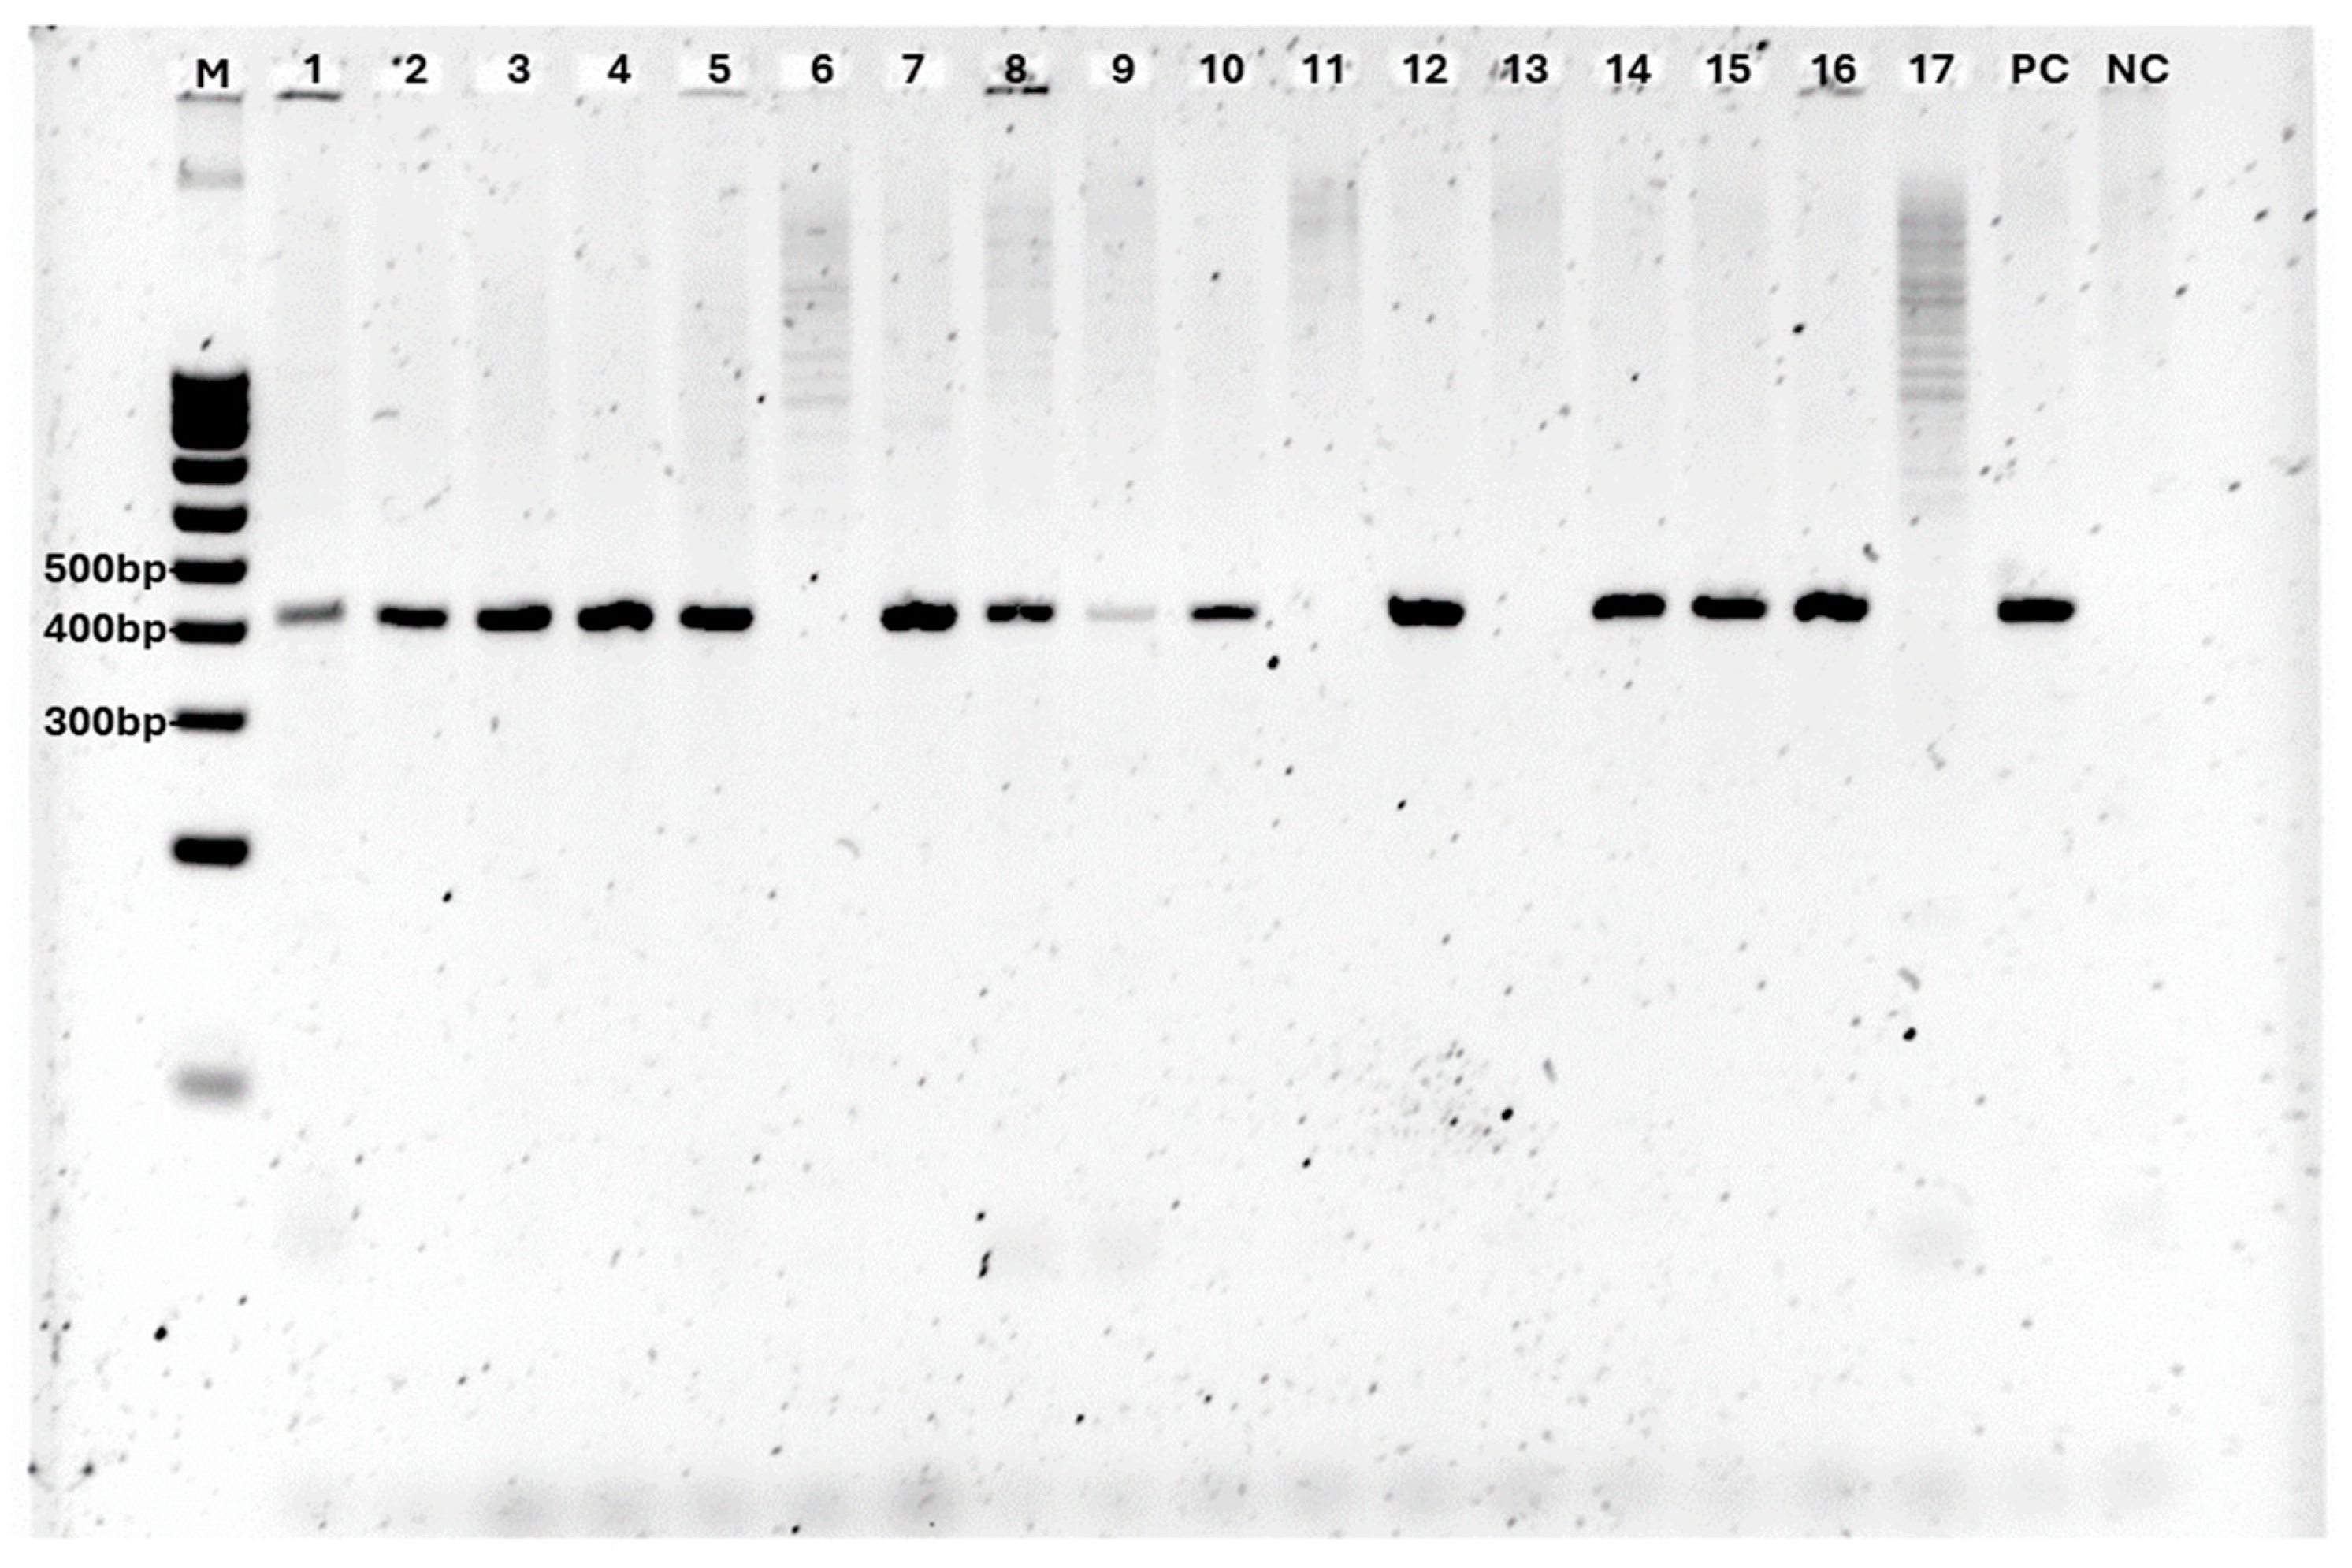
The PCR products were run in a 2% w/v agarose gel including 2 µL of SybrSafe (Thermo Fisher Scientific, Waltham, MA, USA) for a 50 mL gel. The samples were prepared with 4 µL of PCR product and 1.50 µL of gel loading solution DNA dye as a loading buffer (Sigma-Aldrich, Merck KGaA, Darmstadt, Germany). The expected amplicon size was 412 bp (Figure 3). A total of 5 amplicons were randomly selected among the sampled plots and sent to STABVIDA (www.stabvida.com, Caparica, Portugal) for PCR product purification and SANGER sequencing to ensure the identity of the amplified region. The sequences were trimmed using Geneious Prime (Biomatters, Auckland, New Zealand) and compared with those deposited in GenBank (National Center for Biotechnology Information, Bethesda, MD, USA) using BLASTn [database: nr/nt; taxid: fungi (4751)]. All of them corresponded to F. hepatica [query cover and identity to reference sequence > 99% (accession numbers: MZ437010, MZ437011, MZ437012, MZ437013, MZ437014)]. The PCR results were used to create a presence/absence matrix of F. hepatica for all the sampled plots.

2.4. Statistical Analysis

All statistical analyses were performed in an R programming environment [25]. Correlation between the silvicultural and stand variables was evaluated through a correlation test using the “corrplot” package [26]. Uncorrelated variables were selected for further analysis. Generalized linear mixed models (GLMMs) were computed using the “lme4” package [27] and fitted to a binomial distribution (link function: log) with the presence/absence of F. hepatica (R) as a response variable. The silvicultural treatment (control, selective mixed or low thinning) (T), the NDVI index (N), the basal area before (BAi) and after (BAf) the forest intervention in 2013 and updated (BA2021), the quadratic mean diameter of the plot before (QMDi) and after (QMDf) the treatments and current (QMD2021), as well as the trees’ canopy position (dominant, codominant, or dominated) were included as explicative variables (fixed factors) in different combinations. The sampling block (B) was considered random factors in 17 GLMMs. The final GLMM was selected among the most parsimonious fitted models using the Akaike’s Information Criteria (AIC) using the “AICcmodavg” package [28,29] and compared with the null model using the X2 test. The null model was computed as a GLMM that included the presence of F. hepatica as a response variable, the quadratic mean diameter (QMDi) before interventions as an explicative variable, and the block (B) as a random factor.
The possible association between F. hepatica and C. parasitica as co-infective agents was evaluated by computing a co-occurrence analysis using the function “co-occur” of the package “cooccur” [30]. This provided the observed and expected frequencies of co-occurrence (Fobs and Fexp) and two associated probabilities (Pgt and Plt) that could be interpreted as p-values [31]. These probabilities identified each pairwise association between both fungi as positive association (Fobs > Fexp and Pgt < 0.05), negative association (Fobs < Fexp and Plt < 0.05), or random association in the remaining cases [32].

3. Results

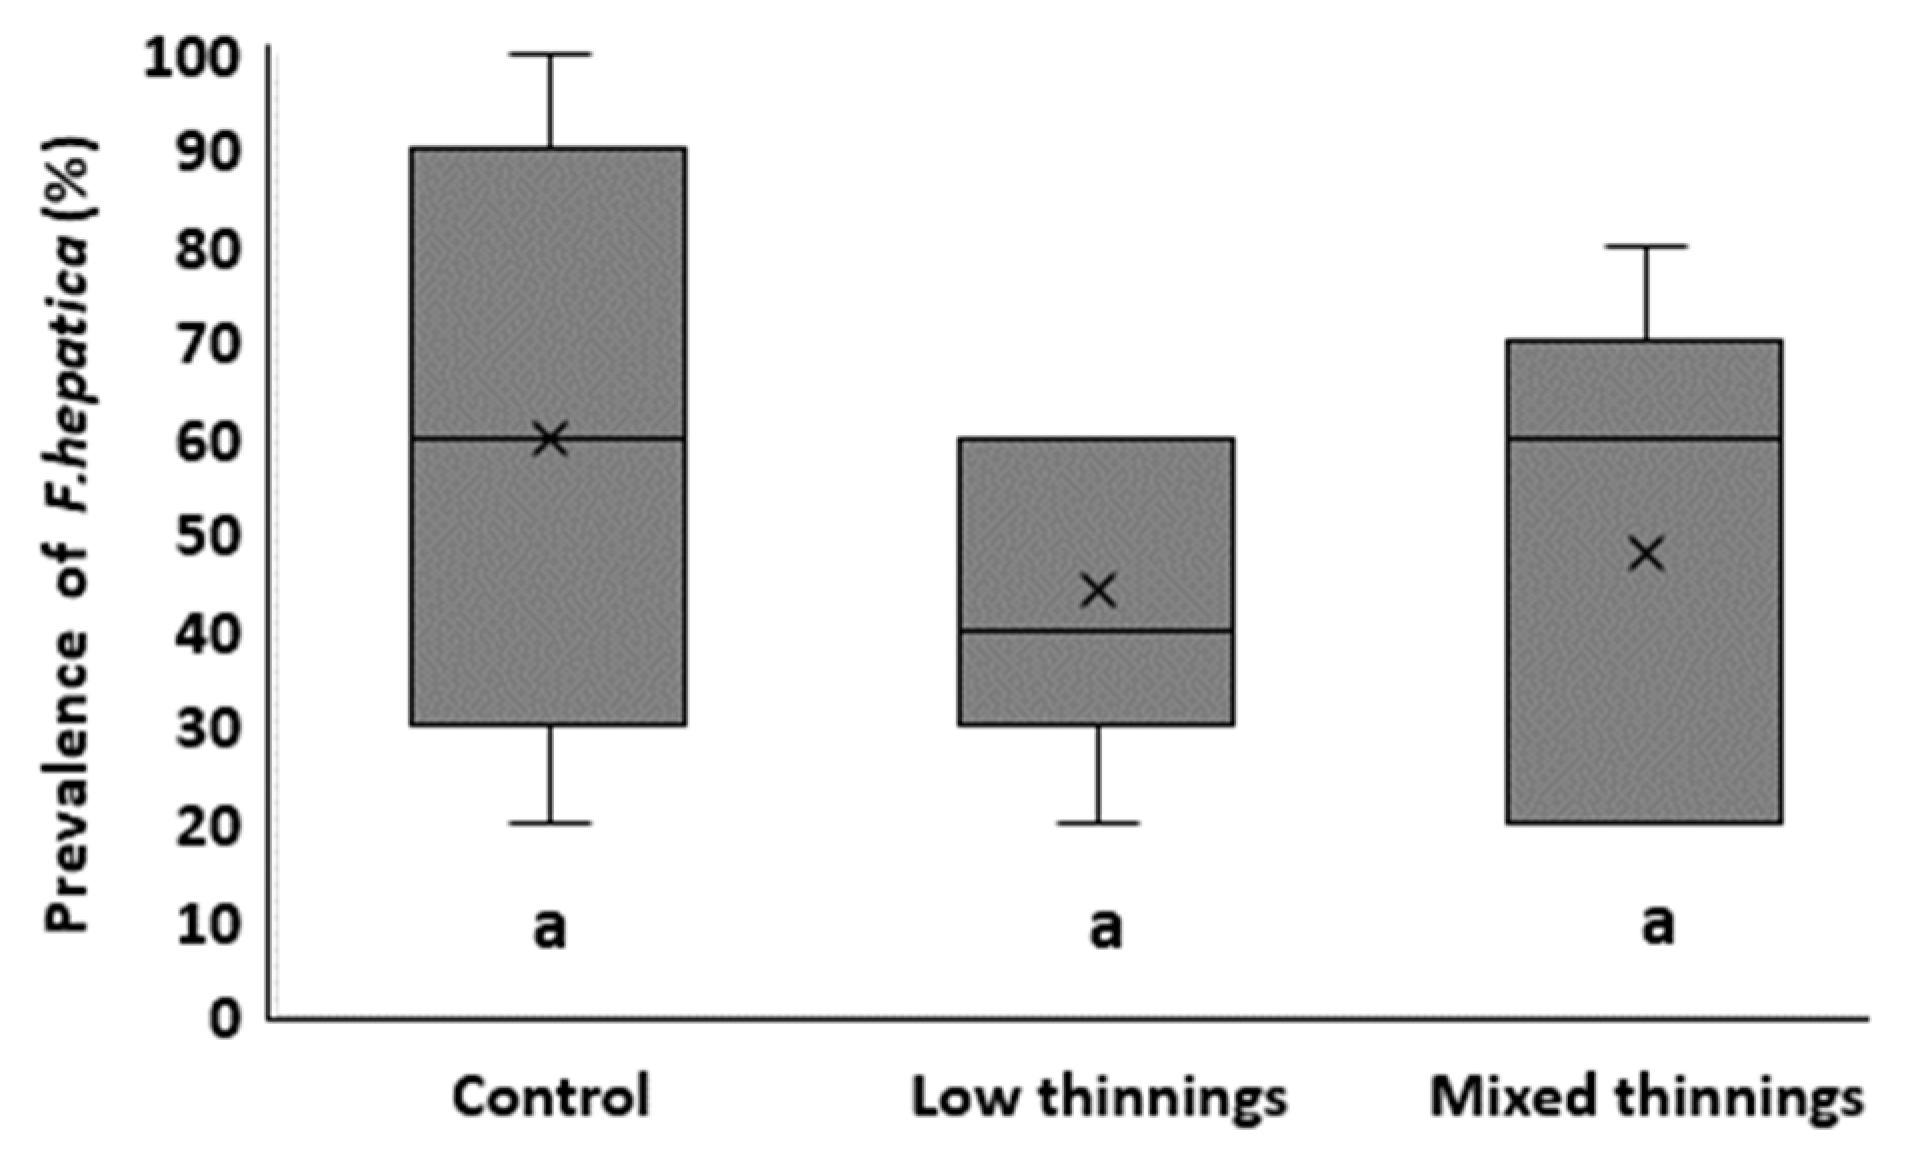
A total of 75 chestnut trees were selected and their corresponding wood cores were analyzed. Molecular detection showed that the incidence of F. hepatica per plot ranged from 20% up to 100% of the trees in the control plots and up to 60% and 80% in the plots with low thinning and selective mixed thinning (Figure 4). Model computing did not reveal a significant effect of the silvicultural treatments (p-value > 0.59), and the inclusion of this variable did not improve the quality of the model (higher AIC; see model M6, Table 1).
Significant correlations were detected among all QMDs (before thinning, after thinning, and actual) (correlation index > 0.90; p-value < 0.05, in all cases) (Figure 5). Accordingly, the QMDi was selected for further model analysis.
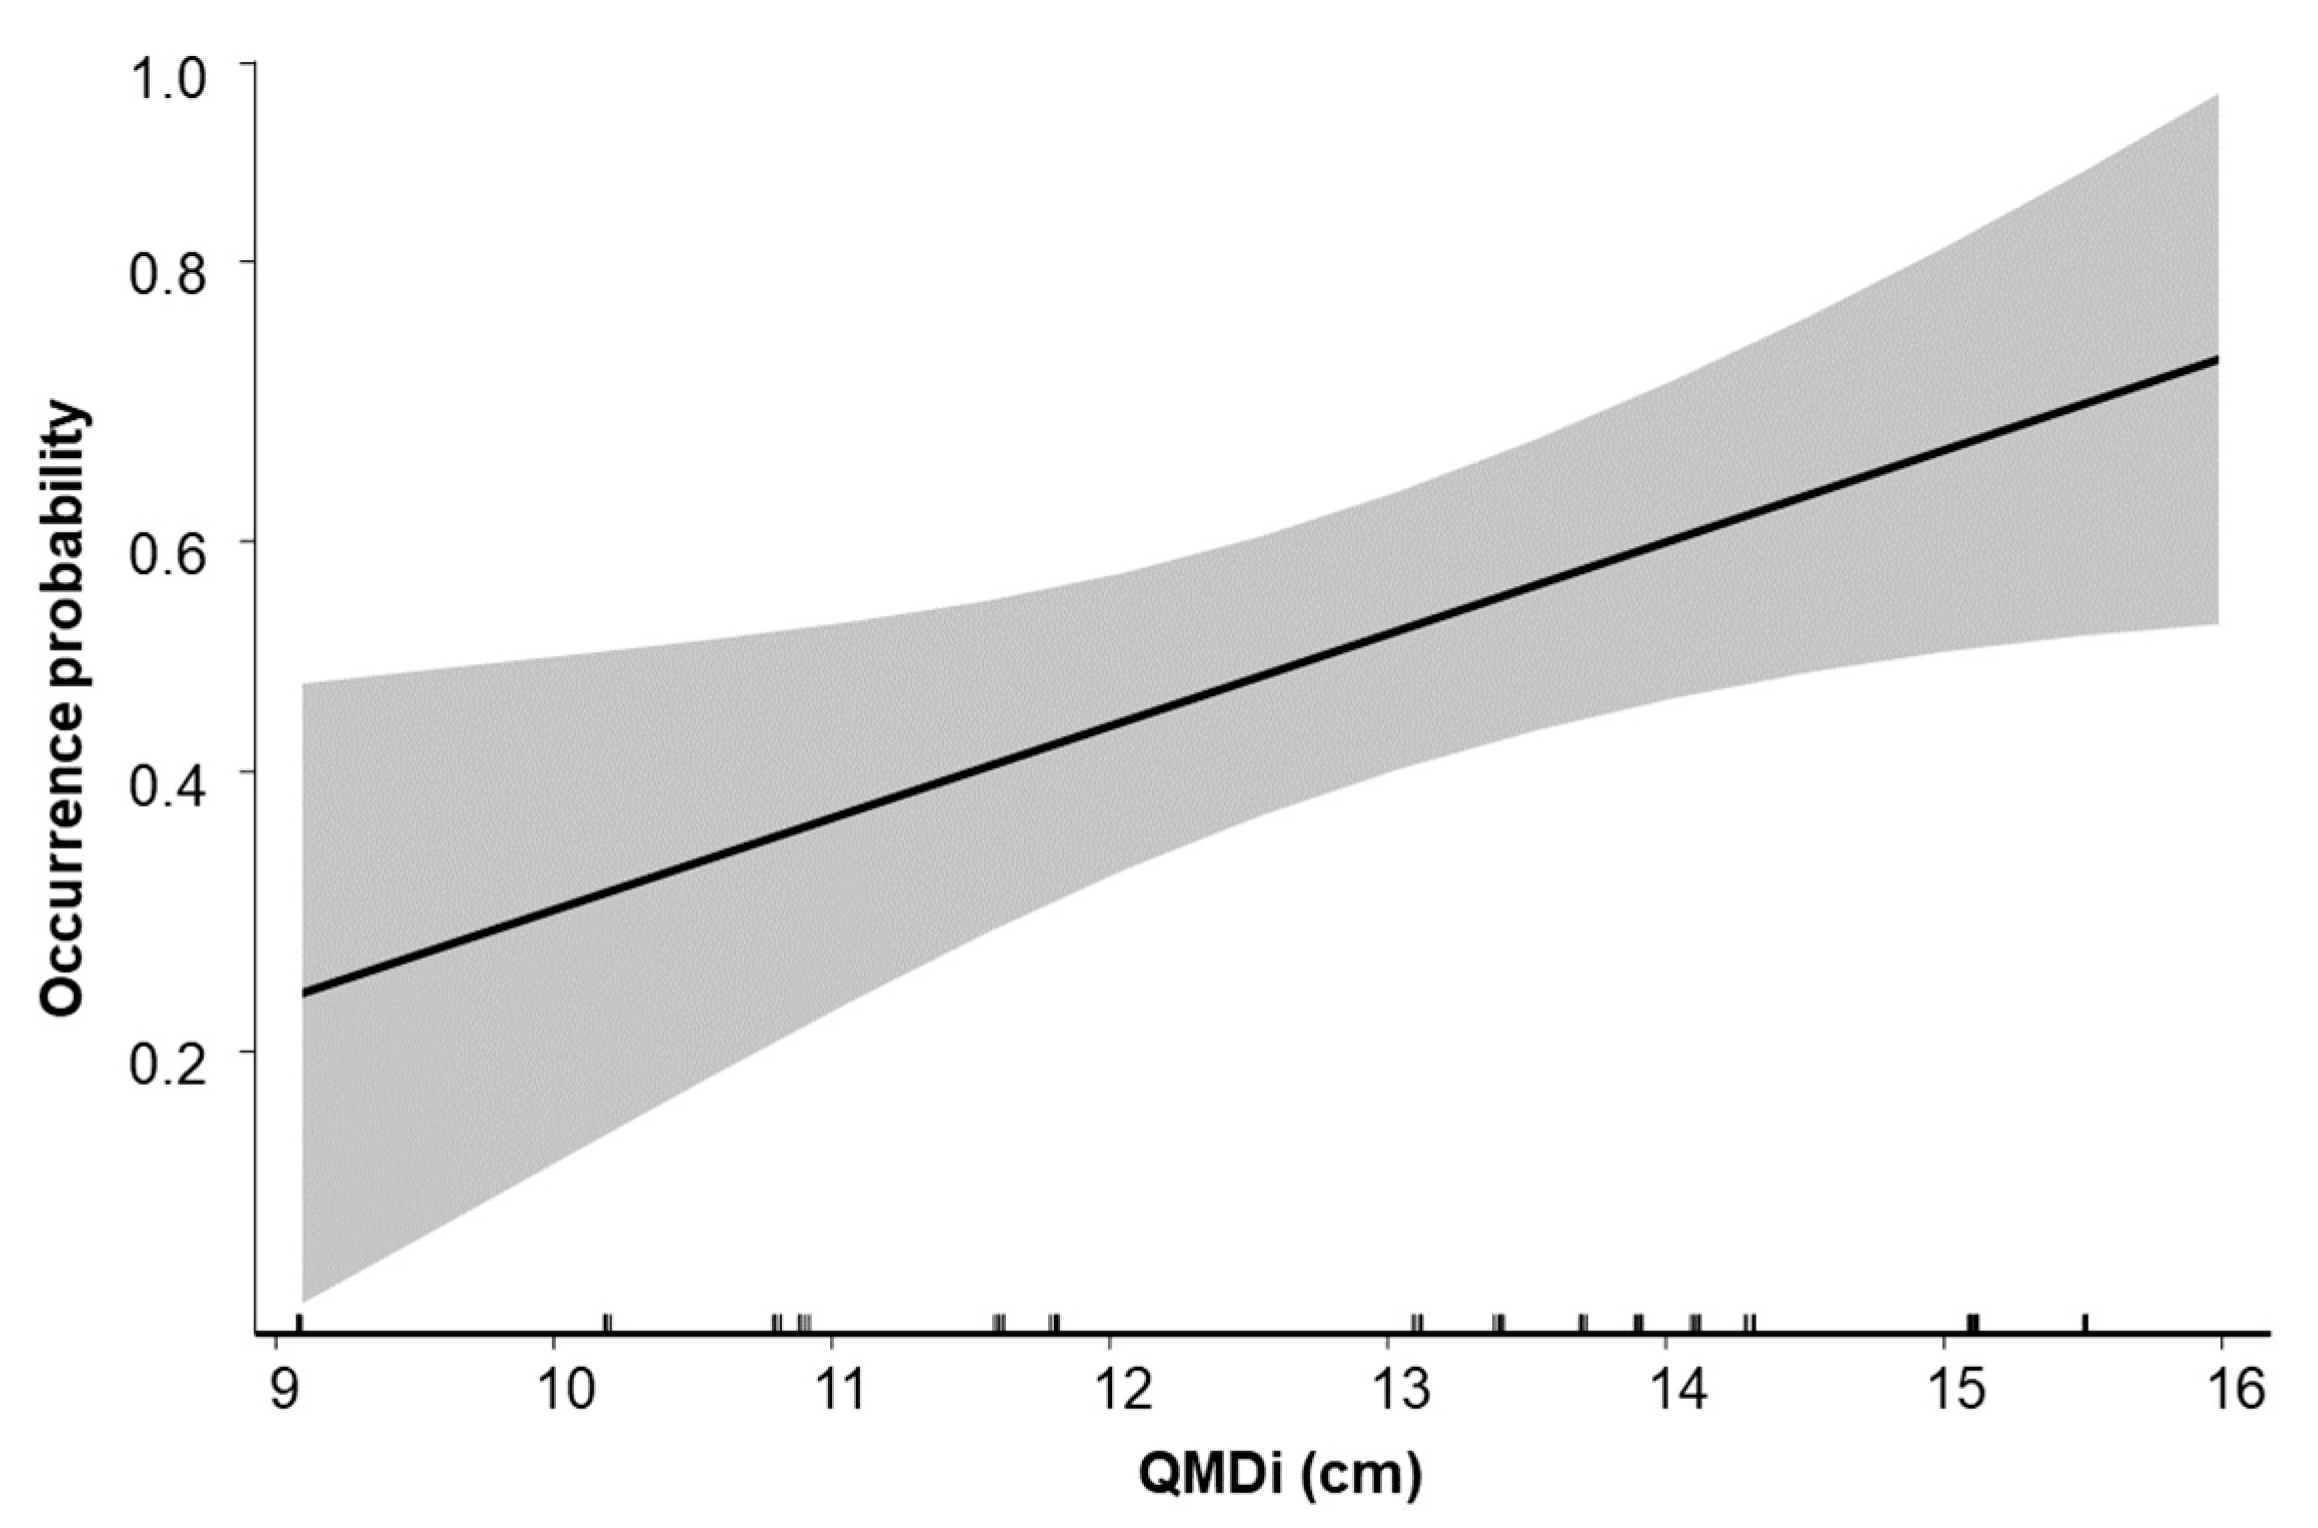
The most explicative model was the null one (M2), which includes the explicative variable QMDi and the random factor block (B) to predict the F. hepatica incidence (AIC = 103.41) (Table 1). More complex models that were tested included M6, which included the silvicultural treatment; M1, M3, and M5, which included the basal area (before and after the interventions and current state); and M4 and M5, which contained the NDVI as an explicative variable. None of these variables showed a significant effect in the variation in fungal incidence and they did not improve the quality of the models (lower AIC) (Table 1). Models M1, M3, and M4 yielded a higher value of AIC (ΔAIC < 2) than M2, although they did not statistically differ from M2 according to the X2 test (p-value > 0.44, in all cases); M2 was selected according to parsimony criterion. M2 revealed the significative relationship between the quadratic mean diameter (QMD) and the F. hepatica incidence (p-value = 0.01; Figure 6).
The co-occurrence analysis did not reveal any association between C. parasitica and F. hepatica co-infecting the same host different than random (Pgt and Plt > 0.05).

4. Discussion

In this study, we evaluated the effect of thinning on the incidence of the heart rot pathogen F. hepatica in productive stands of C. sativa as well as the co-occurrence of F. hepatica with C. parasitica. The results did not show any relationship between the occurrence of F. hepatica and that of C. parasitica, suggesting independent colonization processes. Cryphonectria parasitica is considered a primary pathogen, perfectly able to infect healthy trees through very small and superficial wounds, and then colonize the vascular tissue girdling the trees [33,34]. On the other hand, F. hepatica requires exposed duramen to infect the tree. The lesions caused by hypovirulent strains of C. parasitica may not cause wounds big enough to serve as entry points for F. hepatica, or at least not in the stems or branches large enough to hold a substantial amount of heartwood. In chestnut forests, facilitation processes have been reported in fungi (i.e., C. parasitica and Gnomoniopsis smithogilvyi Shuttleworth, Liew and Guest) infecting abandoned galls of D. kuriphilus after intense attacks [35,36], although this kind of facilitation between both fungal pathogens was not found in our study. More studies are required to completely reject the possibility of the facilitation/non-random co-occurrence of these two fungi, since in this study we only analyzed the existence of co-infection in the lower part of the trunk. Further research could look for co-occurrence in the upper branches of C. sativa killed by C. parasitica that do expose enough heartwood, leaving a possible entry point for heartwood rots since F. hepatica was also found at 1.70 m of height by Regué et al. [11].
Thinning is a forestry tool aimed at managing the complexity of a forest system to meet the objective assigned to it (e.g., biodiversity conservation, wood production, or natural regeneration). In terms of forest health, thinnings can also be aimed at modifying the stand’s structure, such as canopy cover or connectivity, among other factors, which can alter conditions within the stand [37] and influence the dynamics between the hosts and the pathogens [38,39]. In this regard, some factors directly affected by silviculture, such as soil and air humidity, have been reported to favor fungal incidence [40], symptoms development [41], or sporulation [42]. In the study area, a higher presence of CRS has been reported to be in association with higher mean temperatures, higher altitudes (thin soils), larger basal area, and north-facing orientation (lower summer rainfall) [11]. These factors collectively indicate that stress may play an important role in the incidence of F. hepatica, as is assumed by the local foresters. Stress is a predisposing factor on trees that favors the pathogens’ colonization [43,44], and the trees’ vigor is key to enhancing their resistance to many diseases [45], although it is no guarantee [46].
In this study, we analyzed two different thinning types: low thinning and selective mixed thinning (a combination of selective and low thinning). Both thinnings are widely used to obtain saw wood of smaller diameter with low thinning (i.e., ~22 cm of QMD) and larger with selective thinning (i.e., >25 cm of QMD). Low thinning targets the dominated strata as well as any tree presenting health or structural problems. This thinning type does not modify the codominant strata, which in chestnut coppices forms a continuous cover, nor does it release trees from direct competition. In contrast, selective thinning fully releases just the selected trees from direct competition.
Thinning intensities in our plots ranged from 35% to 50% of the stand’s BA in the low thinning and from 28% to 58% in the mixed selective thinning. Despite the different intensities of the interventions, the incidence of F. hepatica was not significantly different than that of the control stands. The same results were obtained by analyzing the NDVI time series. The fact that we could not detect a clear relationship between the NDVI and disease incidence adds complexity to the problem since it weakens the idea often assumed by foresters of CRS being a stress-related disease. In summary, none of the assayed treatments or their intensities differed in F. hepatica infection from the controls, indicating that the interventions did not sufficiently alter the stand conditions, the host, or the pathogen to disrupt the balance of this pathosystem.
However, we found that the influence of the QMD before thinning on F. hepatica’s incidence was relevant. More specifically, the stands that were thinned at a smaller QMD exhibited a lower probability of infection by F. hepatica according to the selected model (M2; Figure 6), suggesting that the fungus colonizes the heartwood of stressed trees early in the rotation. Interestingly, the current QMD (i.e., 2021) showed no relation to the incidence of F. hepatica, supporting this hypothesis. Another possible explanation could be that the trees in the plots with a lower QMD at the thinning time allocated more resources to defense mechanisms [47], potentially at the expense of secondary growth (i.e., diameter), resulting in a lower incidence of F. hepatica seven years later. Further research is required to determine the specific cause of this relationship. Nonetheless, these findings imply that advancing the thinning by a few years could very likely result in an effective reduction in damages caused by F. hepatica. Earlier interventions could potentially disrupt the favorable conditions for the fungus, thereby mitigating its impact on tree health and wood quality, thus enhancing timber production by reducing the incidence of CRS. The results of this study provide a novel approach to forest management, pointing out the importance of early thinning in disease prevention.

5. Conclusions

The findings of this study provide a new indicator to consider when managing chestnut coppice stands for timber production. The probability model presented in this work can help guide foresters to determine a more favorable thinning time, determined through a simple forestry indicator as the quadratic mean diameter. Thinning by itself did not reduce the risk of infection of F. hepatica, but thinning early in the rotation (when the QMD was lower) was related to a lower F. hepatica incidence in the middle term.

Author Contributions

Conceptualization, C.C. and E.J.M.-A.; methodology, A.M. and E.J.M.-A.; formal analysis, A.M. and E.J.M.-A.; investigation, A.M., C.C. and E.J.M.-A.; resources, C.C.; data curation, A.M. and E.J.M.-A.; writing—original draft preparation, A.M.; writing—review and editing, C.C. and E.J.M.-A.; visualization, A.M., C.C. and E.J.M.-A.; supervision, C.C. and E.J.M.-A.; project administration, C.C.; funding acquisition, C.C. All authors have read and agreed to the published version of the manuscript.

Funding

This research was funded in part by Diputació de Barcelona, Àrea de Territori i Sostenibilitat.

Data Availability Statement

The original contributions presented in this study are included in the article and Appendix A; further inquiries can be directed to the corresponding author.

Acknowledgments

We would like to express our gratitude to Miriam Piqué and Mario Beltrán for the use of the study plots they established years ago, and the Diputació de Barcelona for partial funding of this study. The authors also thank Oleguer Plana, Pere Gelabert, and Aitor Ameztegui for their support and comments, and Eduard Busquets, Xavier Ramis, David Magriñà, Pau Román, Hannah R. Uppara, and Jaher Ahmed for their collaboration in the fieldwork.

Conflicts of Interest

The authors declare no conflicts of interest.

Appendix A

Table A1. Description of sampled plots. Slope and elevation: averages of the center of the plot; NDVI: Normalized Difference Vegetation Index; treatment codes: Ta-low thinning, Tb-selective mixed thinning and Tc-control; BAi: basal area before intervention; Extracted BA2013: difference between BAi and BA after intervention; QMDi: mean quadratic diameter before intervention; C. parasitica: percentage of trees affected by C. parasitica’s cankers; BA2021: actual basal area; QMD2021: actual mean quadratic diameter.
BlockPlot IDCoordinates (ETRS89)Slope (%)Elevation (m.a.s.l.)NDVI (a.u.c.)20132021
XY2012–2020Treatment CodeBAi (m2/ha)Extracted BA2013 (%)QMDi (cm)C. parasitica (%)BA2021 (m2/ha)QMD2021 (cm)
11A455285.34,629,103.3217023.55Ta27.93613.96234.517.2
1B455252.84,629,067.3437083.6Tb25.62815.1733420.5
1C455228.54,629,040.7657083.63Tc30.4014.36441.518.8
22A454280.14,631,892.6606473.65Ta33.24215.1714021.1
2B454391.54,631,943.1716373.65Tb31.53713.17933.518.3
2C454417.84,631,952.3556443.62Tc27.1013.4674519.1
33A456266.44,633,157.0617003.63Ta25.23513.7484817.2
3B456167.84,633,171.5617053.75Tb31.53714.14044.516.6
3C456107.64,633,147.7747323.71Tc29015.5105019.7
44A462807.14,639,663.4499273.72Ta17.5409.1185013
4B462769.54,639,672.9449213.75Tb32.75811.63229.517.8
4C462736.74,639,651.2609383.74Tc41.8011.8285918.3
55A464176.74,639,881.4578573.63Ta30.25010.83844.513.8
5B464271.44,639,932.7588503.59Tb26.34810.9323616.8
5C464089.94,639,820.0608623.59Tc27.3010.2263215.2

References

  1. Clark, S.L.; Marcolin, E.; Patrício, M.S.; Loewe-Muñoz, V. A silvicultural synthesis of sweet (Castanea sativa) and American (C. dentata) chestnuts. For. Ecol. Manag. 2023, 539, 121041. [Google Scholar] [CrossRef]
  2. Zlatanov, T.; Schleppi, P.; Velichkov, I.; Hinkov, G.; Georgieva, M.; Eggertsson, O.; Zlatanova, M.; Vacik, H. Structural diversity of abandoned chestnut (Castanea sativa Mill.) dominated forests: Implications for forest management. For. Ecol. Manag. 2013, 291, 326–335. [Google Scholar] [CrossRef]
  3. Marcolin, E.; Pividori, M.; Colombari, F.; Manetti, M.C.; Pelleri, F.; Conedera, M.; Gehring, E. Impact of the Asian Gall Wasp Dryocosmus kuriphilus on the radial growth of the European chestnut Castanea sativa. J. Appl. Ecol. 2021, 58, 1212–1224. [Google Scholar] [CrossRef]
  4. Sartor, C.; Dini, F.; Torello-Marinoni, D.; Mellano, M.G.; Beccaro, G.L.; Alma, A.; Quacchia, A.; Botta, R. Impact of the Asian wasp Dryocosmus kuriphilus (Yasumatsu) on cultivated chestnut: Yield loss and cultivar susceptibility. Sci. Hortic. 2015, 197, 454–460. [Google Scholar] [CrossRef]
  5. Dorado, F.J.; Alías, J.C.; Chaves, N.; Solla, A. Warming Scenarios and Phytophthora cinnamomi Infection in Chestnut (Castanea sativa Mill.). Plants 2023, 12, 556. [Google Scholar] [CrossRef]
  6. Vannini, A.; Vettraino, A.M. Ink disease in chestnuts: Impact on the European chestnut. For. Snow Landsc. Res. 2001, 76, 345–350. [Google Scholar]
  7. Rigling, D.; Prospero, S. Cryphonectria parasitica, the causal agent of chestnut blight: Invasion history, population biology and disease control. Mol. Plant Pathol. 2018, 19, 7–20. [Google Scholar] [CrossRef]
  8. Conedera, M.; Manetti, M.C.; Giudici, F.; Amorini, E. Distribution and economic potential of the sweet chestnut (Castanea sativa Mill.) in Europe. Ecol. Mediterr. 2004, 30, 179–193. [Google Scholar] [CrossRef]
  9. Conedera, M.; Tinner, W.; Krebs, P.; de Rigo, D.; Caudullo, G. Castanea sativa in Europe: Distribution, habitat, usage and threats. In European Atlas of Forest Tree Species; San-Miguel-Ayanz, J., de Rigo, D., Caudullo, G., Houston-Durrant, T., Mauri, A., Eds.; Publications Office of the EU: Luxembourg, 2016; pp. 78–79. [Google Scholar]
  10. MAPA. Cuarto Inventario Forestal Nacional (IFN4); MAPA: Madrid, Spain, 2017. [Google Scholar]
  11. Regué, A.; Bassié, L.; De-Miguel, S.; Colinas, C. Environmental and stand conditions related to Fistulina hepatica heart rot attack on Castanea sativa. For. Pathol. 2019, 49, e12517. [Google Scholar] [CrossRef]
  12. Correal-Mòdol, E. Propietats Químiques, Físiques, Mecàniques i Resistents de la Fusta Massissa i Laminada de Castanyer del Sistema Mediterrani Català. PhD. Thesis, Universitat de Lleida, Lleida, Spain, 2013. [Google Scholar]
  13. Schwarze, F.W.M.R.; Baum, S.; Fink, S. Dual modes of degradation by Fistulina hepatica in xylem cell walls of Quercus robur. Mycol. Res. 2000, 104, 846–852. [Google Scholar] [CrossRef]
  14. Yurkewich, J.I.; Castaño, C.; Colinas, C. Chestnut Red Stain: Identification of the fungi associated with the costly discolouration of Castanea sativa. For. Pathol. 2017, 21, e12335. [Google Scholar] [CrossRef]
  15. Vericat, P.; Navarro, P.; Correal-Mòdol, E.; Castaño, C.; Piqué, M.; Beltrán, M.; Óbón, B.; Rodriguez, J.; Colinas, C.; García, M.; et al. El castanyer a Catalunya: Manual de Gestió, Conservació i Valorització; Diputació de Barcelona i Obra Social “la Caixa”: Barcelona, Spain, 2012. [Google Scholar]
  16. Diamandis, S.; Perlerou, C. The mycoflora of the chestnut ecosystems in Greece. For. Snow Landsc. Res. 2001, 76, 499–504. [Google Scholar]
  17. Piętka, J.; Ciurzycki, W. The first record of Fistulina hepatica (Schaeff.) With. on Castanea sativa Mill. in Poland. Acta Mycol. 2018, 53, 1108. [Google Scholar] [CrossRef]
  18. González, G.C.; Barroetaveña, C.; Visnovsky, S.B.; Rajchenberg, M.; Pildain, M.B. A new species, phylogeny, and a worldwide key of the edible wood decay Fistulina (Agaricales). Mycol. Prog. 2021, 20, 733–746. [Google Scholar] [CrossRef]
  19. Cartwright, K.T.S.G. A reinvestigation into the cause of “brown oak”, Fistulina hepatica (Huds.) fr. Trans. Br. Mycol. Soc. 1937, 21, 68–83. [Google Scholar] [CrossRef]
  20. Vasaitis, R. Heart rots, sap rots and canker rots. In Infectious Forest Diseases; Gonthier, P., Nicolotti, G., Eds.; CABI: Wallingford, UK, 2013. [Google Scholar] [CrossRef]
  21. Beltrán, M.; Vericat, P.; Piqué, M.; Farriol, R. Models de Gestió per als Boscos de Castanyer (Castanea sativa Mill.): Producció de Fusta i Fruit; Centre de la Propietat Forestal, Departament d’Agricultura, Ramaderia, Pesca, Alimentació i Medi Natural, Generalitat de Catalunya: Barcelona, Spain, 2013. [Google Scholar]
  22. Nilson, T.; Rautiainen, M.; Pisek, J.; Peterson, U. Seasonal Reflectance Courses of Forests. In New Advances and Contributions to Forestry Research; Oteng-Amoako, A.A., Ed.; InTech: London, UK, 2012; pp. 33–58. [Google Scholar] [CrossRef]
  23. Guglielmo, F.; Gonthier, P.; Garbelotto, M.; Nicolotti, G. Optimization of sampling procedures for DNA-based diagnosis of wood decay fungi in standing trees: Sampling for decay fungi diagnosis. Lett. Appl. Microbiol. 2010, 51, 90–97. [Google Scholar] [CrossRef]
  24. White, T.J.; Bruns, T.; Lee, S.J.W.T.; Taylor, J. Amplification and direct sequencing of fungal ribosomal RNA genes for phylogenetics. In PCR Protocols: A Guide to Methods and Applications; Innis, M.A., Gelfand, D.H., Sninsky, J.J., White, J.T., Eds.; Academic Press: San Diego, CA, USA, 1990; Volume 18, pp. 315–322. [Google Scholar]
  25. R Core Team. R: A Language and Environment for Statistical Computing; R Foundation for Statistical Computing: Vienna, Austria, 2021. [Google Scholar]
  26. Wei, T.; Simko, V. R Package “Corrplot”: Visualization of a Correlation Matrix (Version 0.84). 2017. Available online: https://github.com/taiyun/corrplot (accessed on 11 April 2022).
  27. Bates, D.; Mächler, M.; Bolker, B.; Walker, S. Fitting Linear Mixed-Effects Models Using lme4. arXiv 2014, arXiv:1406.5823. [Google Scholar]
  28. Anderson, D.R. Model Based Inferences in the Life Sciences: A Primer on Evidence. Ann. Entomol. Soc. Am. 2008, 102, 737–738. [Google Scholar] [CrossRef]
  29. Mazerolle, M.J. Model Selection and Multimodel Inference Based on (Q)AIC(c) (2.2-1) [R]. 2019. Available online: https://rdrr.io/cran/AICcmodavg/ (accessed on 15 May 2022).
  30. Griffith, D.M.; Veech, J.A.; Marsh, C.J. Cooccur: Probabilistic species co-occurrence analysis in R. J. Stat. Softw. 2016, 69, 1–17. [Google Scholar] [CrossRef]
  31. Veech, J.A. A probabilistic model for analysing species co-occurrence. Glob. Ecol. Biogeogr. 2013, 22, 252–260. [Google Scholar] [CrossRef]
  32. Muñoz-Adalia, E.J.; Sanz-Ros, A.V.; Flores-Pacheco, J.A.; Hantula, J.; Diez, J.J.; Vainio, E.J.; Fernández, M. Sydowia polyspora dominates fungal communities carried by two Tomicus species in pine plantations threatened by Fusarium circinatum. Forests 2017, 8, 127. [Google Scholar] [CrossRef]
  33. Anagnostakis, S.L. Chestnut Blight: The Classical Problem of an Introduced Pathogen. Mycologia 1987, 79, 23–37. [Google Scholar] [CrossRef]
  34. Lovat, C.A.; Donnelly, D.J. Mechanisms and metabolomics of the host-pathogen interactions between Chestnut (Castanea species) and Chestnut blight (Cryphonectria parasitica). For. Pathol. 2019, 49, e12562. [Google Scholar] [CrossRef]
  35. Meyer, J.B.; Gallien, L.; Prospero, S. Interaction between two invasive organisms on the European chestnut: Does the chestnut blight fungus benefit from the presence of the gall wasp? FEMS Microbiol. Ecol. 2015, 91, fiv122. [Google Scholar] [CrossRef]
  36. Vannini, A.; Morales-Rodriguez, C.; Aleandri, M.; Bruni, N.; Dalla-Valle, M.; Mazzetto, T.; Martignoni, D.; Vettraino, A. Emerging new crown symptoms on Castanea sativa (Mill.): Attempting to model interactions among pests and fungal pathogens. Fungal Biol. 2018, 122, 911–917. [Google Scholar] [CrossRef]
  37. Roberts, M.; Gilligan, C.A.; Kleczkowski, A.; Hanley, N.; Whalley, A.E.; Healey, J.R. The effect of forest management options on forest resilience to pathogens. Front. For. Glob. Change 2020, 3, 7. [Google Scholar] [CrossRef]
  38. Aylor, D.E. Spread of plant disease on a continental scale: Role of aerial dispersal of pathogens. Ecology 2003, 84, 1989–1997. [Google Scholar] [CrossRef]
  39. Condeso, T.E.; Meentemeyer, R.K. Effects of landscape heterogeneity on the emerging forest disease sudden oak death. J. Ecol. 2007, 95, 364–375. [Google Scholar] [CrossRef]
  40. Vacek, Z.; Vacek, S.; Bulušek, D.; Podrázský, V.; Remeš, J.; Král, J.; Putalová, T. Effect of fungal pathogens and climatic factors on production, biodiversity and health status of ash mountain forests. Dendrobiology 2017, 77, 161–175. [Google Scholar] [CrossRef]
  41. Muñoz-Adalia, E.J.; Colinas, C. Susceptibility of cork oak (Quercus suber) to canker disease caused by Diplodia corticola: When time is of the essence. New For. 2021, 52, 863–873. [Google Scholar] [CrossRef]
  42. Muñoz-Adalia, E.J.; Uppara, A.B.; Albó, D.; Meijer, A.; Colinas, C. Cork harvest planning and climate: High air humidity favors availability of airborne inoculum of Diplodia corticola. For. Ecol. Manag. 2023, 536, 120935. [Google Scholar] [CrossRef]
  43. Desprez-Loustau, M.L.; Marçais, B.; Nageleisen, L.M.; Piou, D.; Vannini, A. Interactive effects of drought and pathogens in forest trees. Ann. For. Sci. 2006, 63, 597–612. [Google Scholar] [CrossRef]
  44. Wargo, P. Consequences of environmental stress on oak: Predisposition to pathogens. Ann. Sci. Forest. 1996, 53, 359–368. [Google Scholar] [CrossRef]
  45. Waring, R.H. Estimating Forest growth and efficiency in relation to canopy leaf area. Adv. Ecol. Res. 1983, 13, 327–354. [Google Scholar] [CrossRef]
  46. Calamita, F.; Imran, H.A.; Vescovo, L.; Mekhalfi, M.L.; La Porta, N. Early Identification of Root Rot Disease by Using Hyperspectral Reflectance: The Case of Pathosystem Grapevine/Armillaria. Remote Sens. 2021, 13, 2436. [Google Scholar] [CrossRef]
  47. Loehle, C. Tree life history strategies: The role of defenses. Can. J. For. Res. 1988, 18, 209–222. [Google Scholar] [CrossRef]
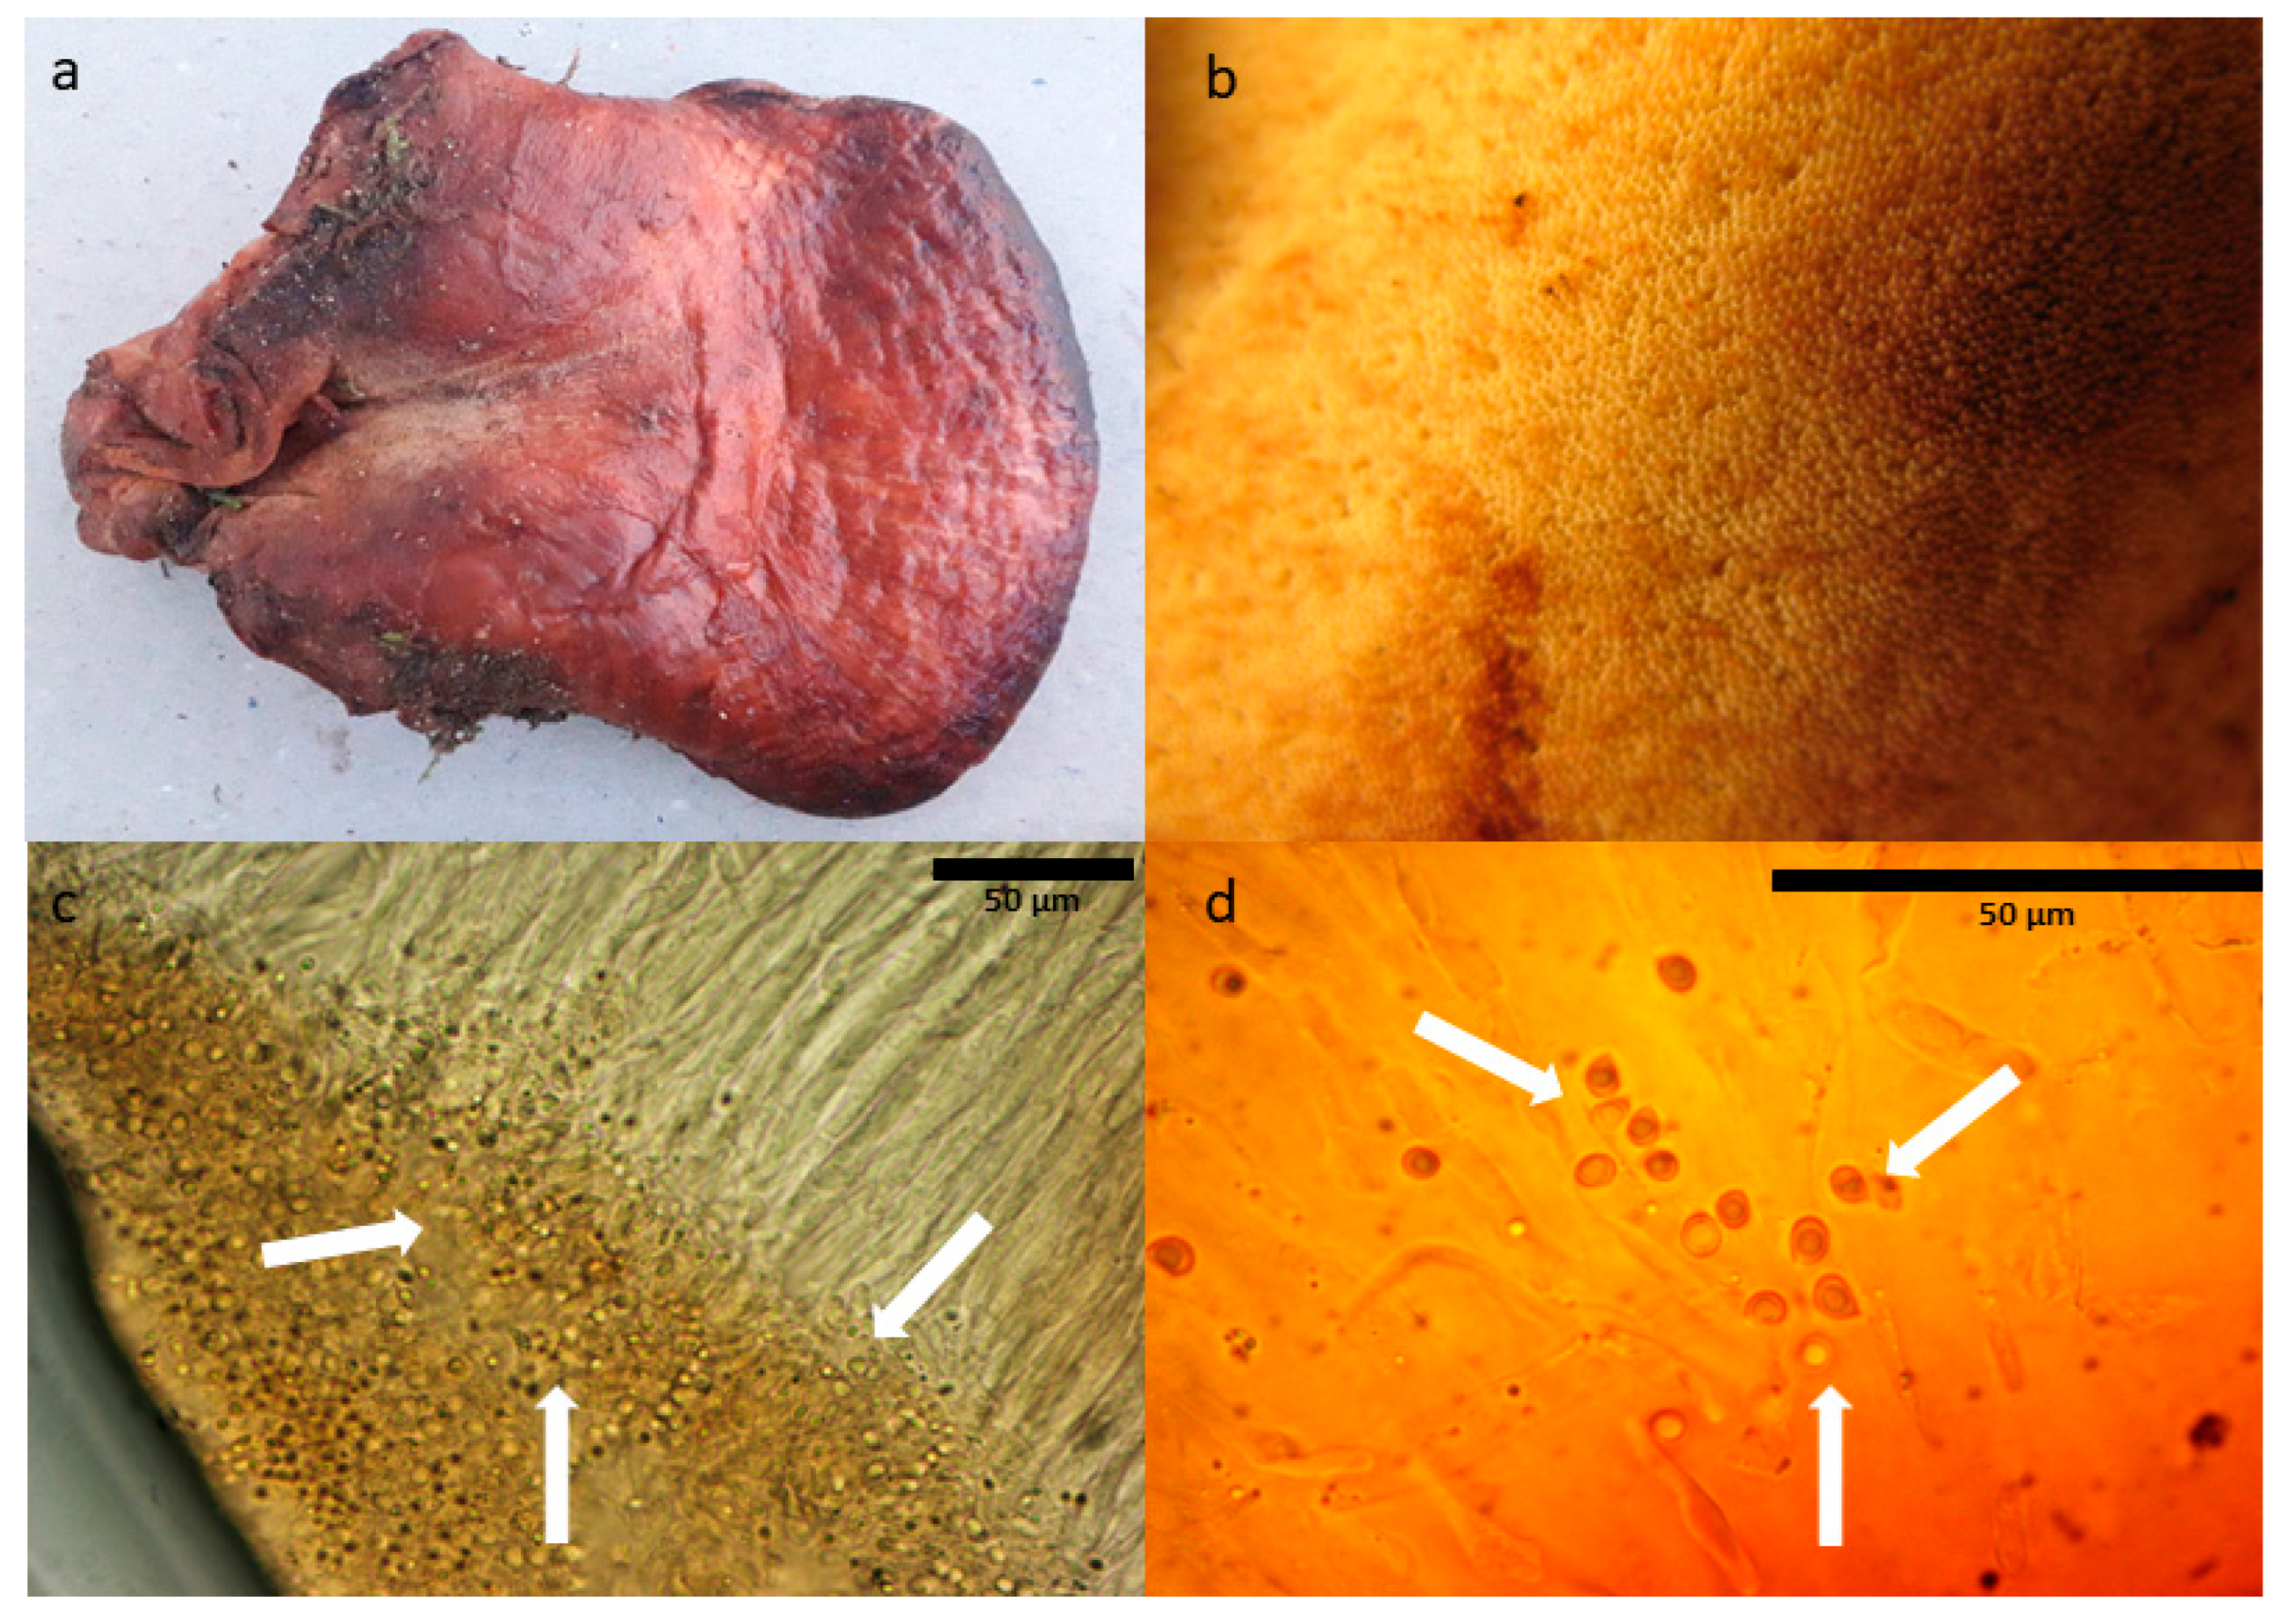
Figure 1. Fistulina hepatica basidiomata (length: 13 cm, width: 9 cm) (a); close up of the poroid hymenium (b); hymenium and spores (white arrows) in KOH 3% w/v at 400× (c); and spores (white arrows) at 1000× (d).
Forests 15 01639 g001
Figure 2. Plot characterization diagram. Green symbols represent selected trees. Lines represents terrain contour lines.
Forests 15 01639 g002
Figure 3. Example of agarose gel after horizontal electrophoresis. Lanes 1 to 17: DNA extracted from Castanea sativa wood (positive samples show a sharp band at 412 bp); M:100 bp marker [NZYDNA Ladder V, 100–1000 bp (NZYtech, Lisbon, Portugal)]; PC: positive control (Fistulina hepatica DNA identified by PCR and sequencing in a previous study); NC: negative control for PCR.
Forests 15 01639 g003
Figure 4. Boxplot of incidence of F. hepatica per treatment. x: mean value. Small letter (a) denotes absence of significance of prevalence between treatments.
Forests 15 01639 g004
Figure 5. Correlogram of stand and silviculture variables. Only significantly correlated variables are shown. QMDi: quadratic mean diameter of the plot before thinning; QMDf: quadratic mean diameter of the plot after thinning; QMD2021: quadratic mean diameter of the plot in 2021; BAi: basal area before thinning; BAf: basal area after thinning; BA2021: basal area of the plot in 2021; NDVI: Normalized Difference Vegetation Index (period 2012 to 2020).
Forests 15 01639 g005
Figure 6. Fitted values (M2) of probability of infection by F. hepatica in relation to the quadratic mean diameter of the plot before the thinning (QMDi). Shaded area represents 95% confidence intervals.
Forests 15 01639 g006
Table 1. Results of GLMMs describing the probability of presence of F. hepatica (R) regarding quadratic mean diameter of the plot before the treatments (QMDi), basal area before (BAi) and after (BAf) the interventions, basal area in 2021 (BA2021), the NDVI index (N), silvicultural treatment (T), and sampling block (B). Random factors are shown in brackets. Selected model in bold. Df: degree of freedom; AIC: Akaike’s Information Criteria.
ModelDescriptionDflogLikDevianceAICΔAIC
M2R~QMDi + (B)1−48.7097.40103.410.00
M1R~QMDi + BAf + (B)2−48.4096.81104.821.41
M3R~QMDi + BA2021 + (B)2−48.4396.87104.881.42
M4R~QMDi + N + (B)2−48.6797.35105.351.94
M6R~QMDi + T + (B)2−48.2096.40107.243.83
M5R~QMDi + N + BAi + BA2021 + (B)4−48.2296.45108.455.04
Disclaimer/Publisher’s Note: The statements, opinions and data contained in all publications are solely those of the individual author(s) and contributor(s) and not of MDPI and/or the editor(s). MDPI and/or the editor(s) disclaim responsibility for any injury to people or property resulting from any ideas, methods, instructions or products referred to in the content.