
Soil-Sensitive Weibull Distribution Models of Larix principis-rupprechtii Plantations across Northern China


Abstract
1. Introduction
2. Materials and Methods
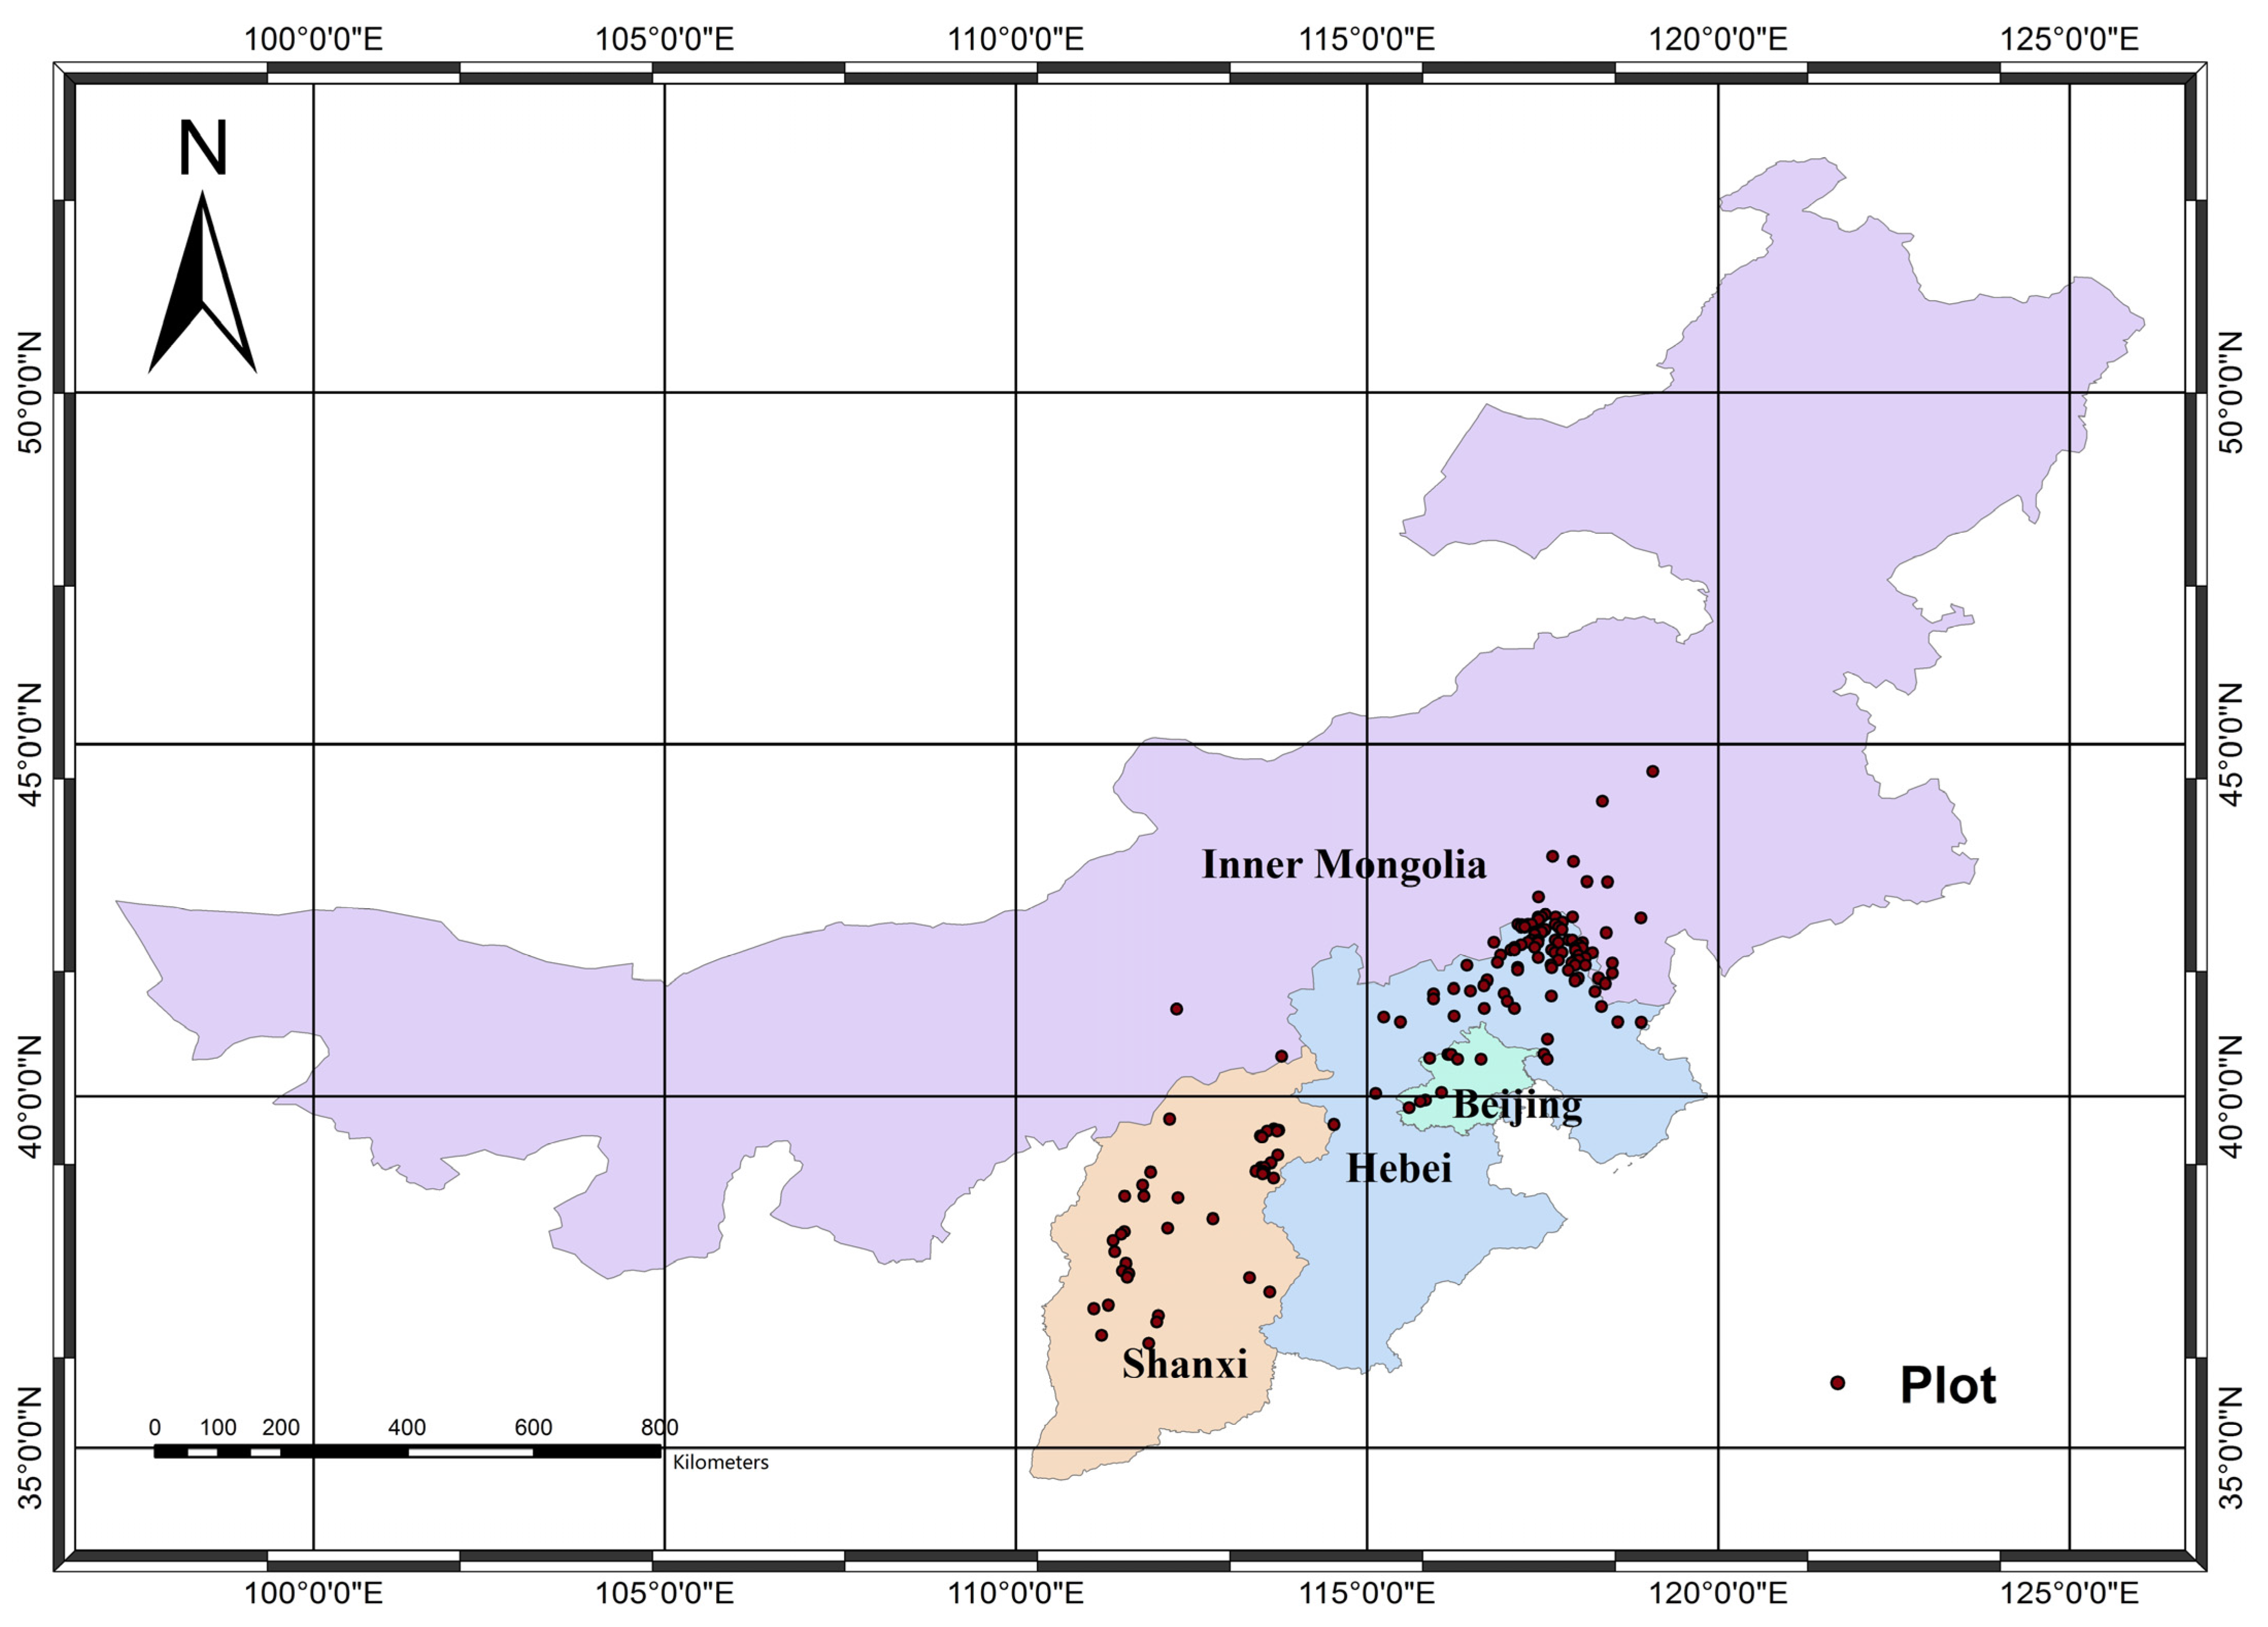
2.1. Sample Plot Data
2.2. Site and Soil Data
2.3. Weibull Distribution Model and Parameter Estimation Methods
2.4. Diameter Distribution Model with Soil Factors
2.5. Model Test
2.5.1. Kolmogorov–Smirnov Test for the Weibull Distribution
2.5.2. Model Evaluation for Regression
3. Results
3.1. Parameter Estimation Methods for the Weibull Distribution Models
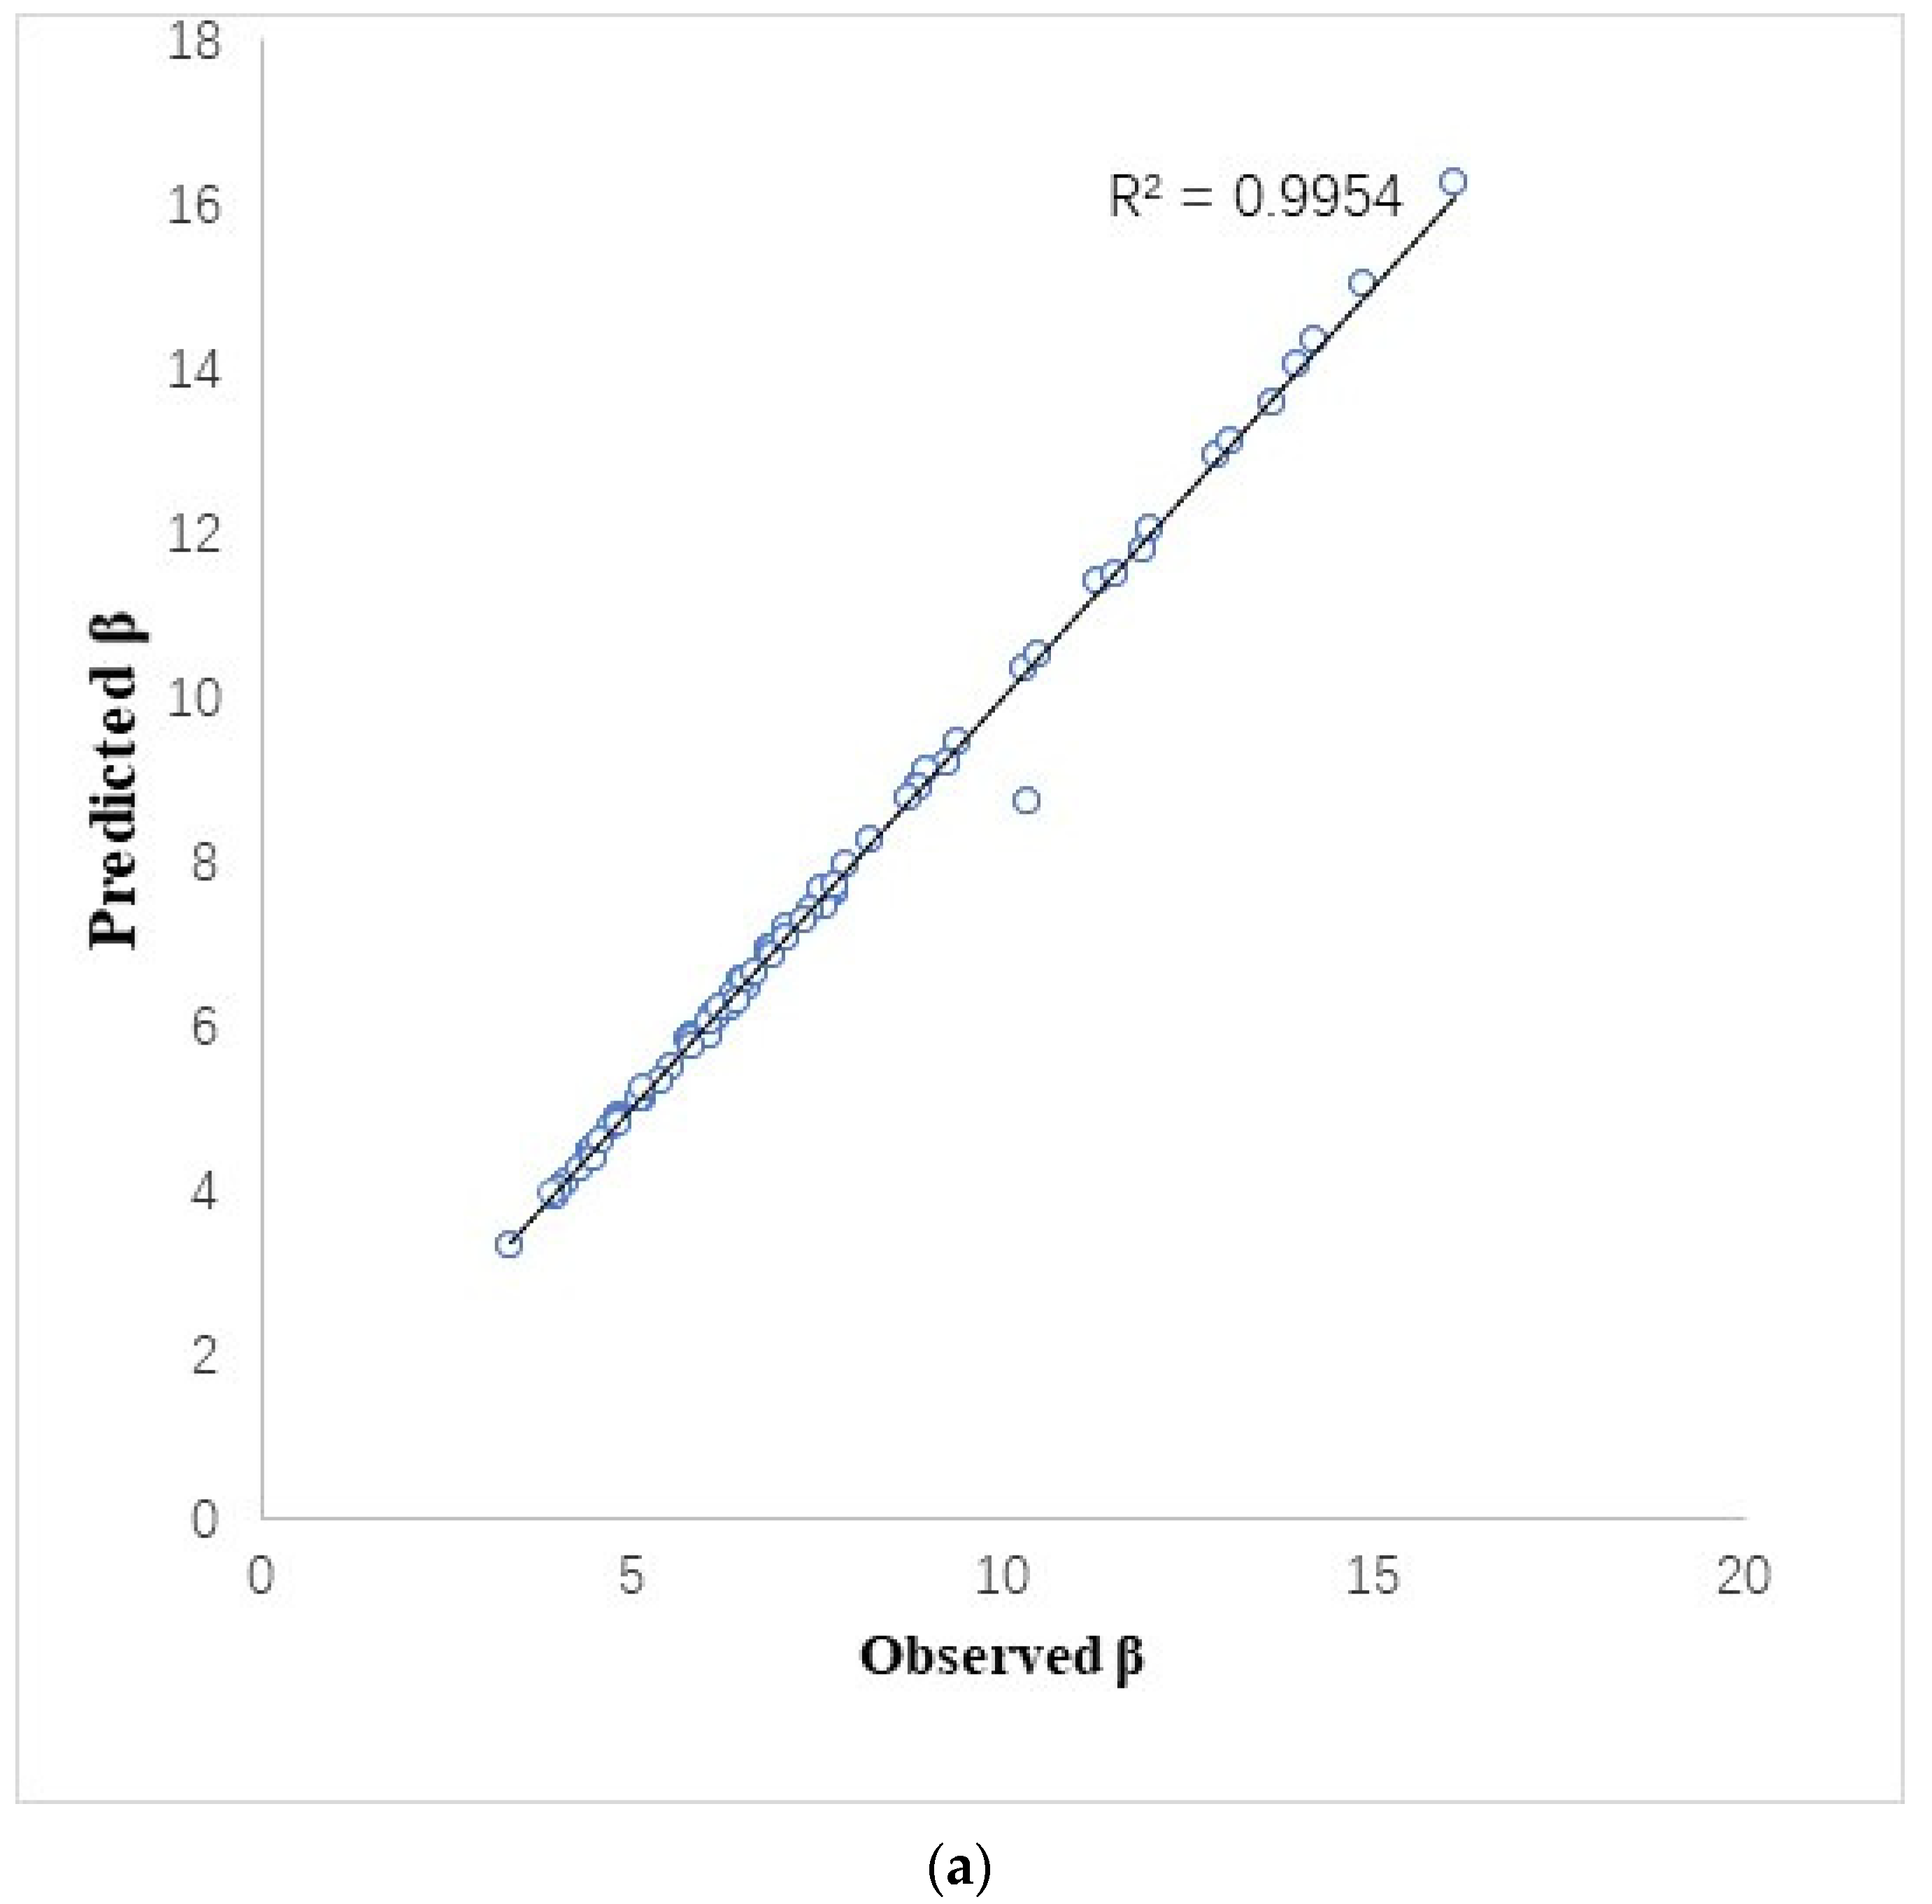
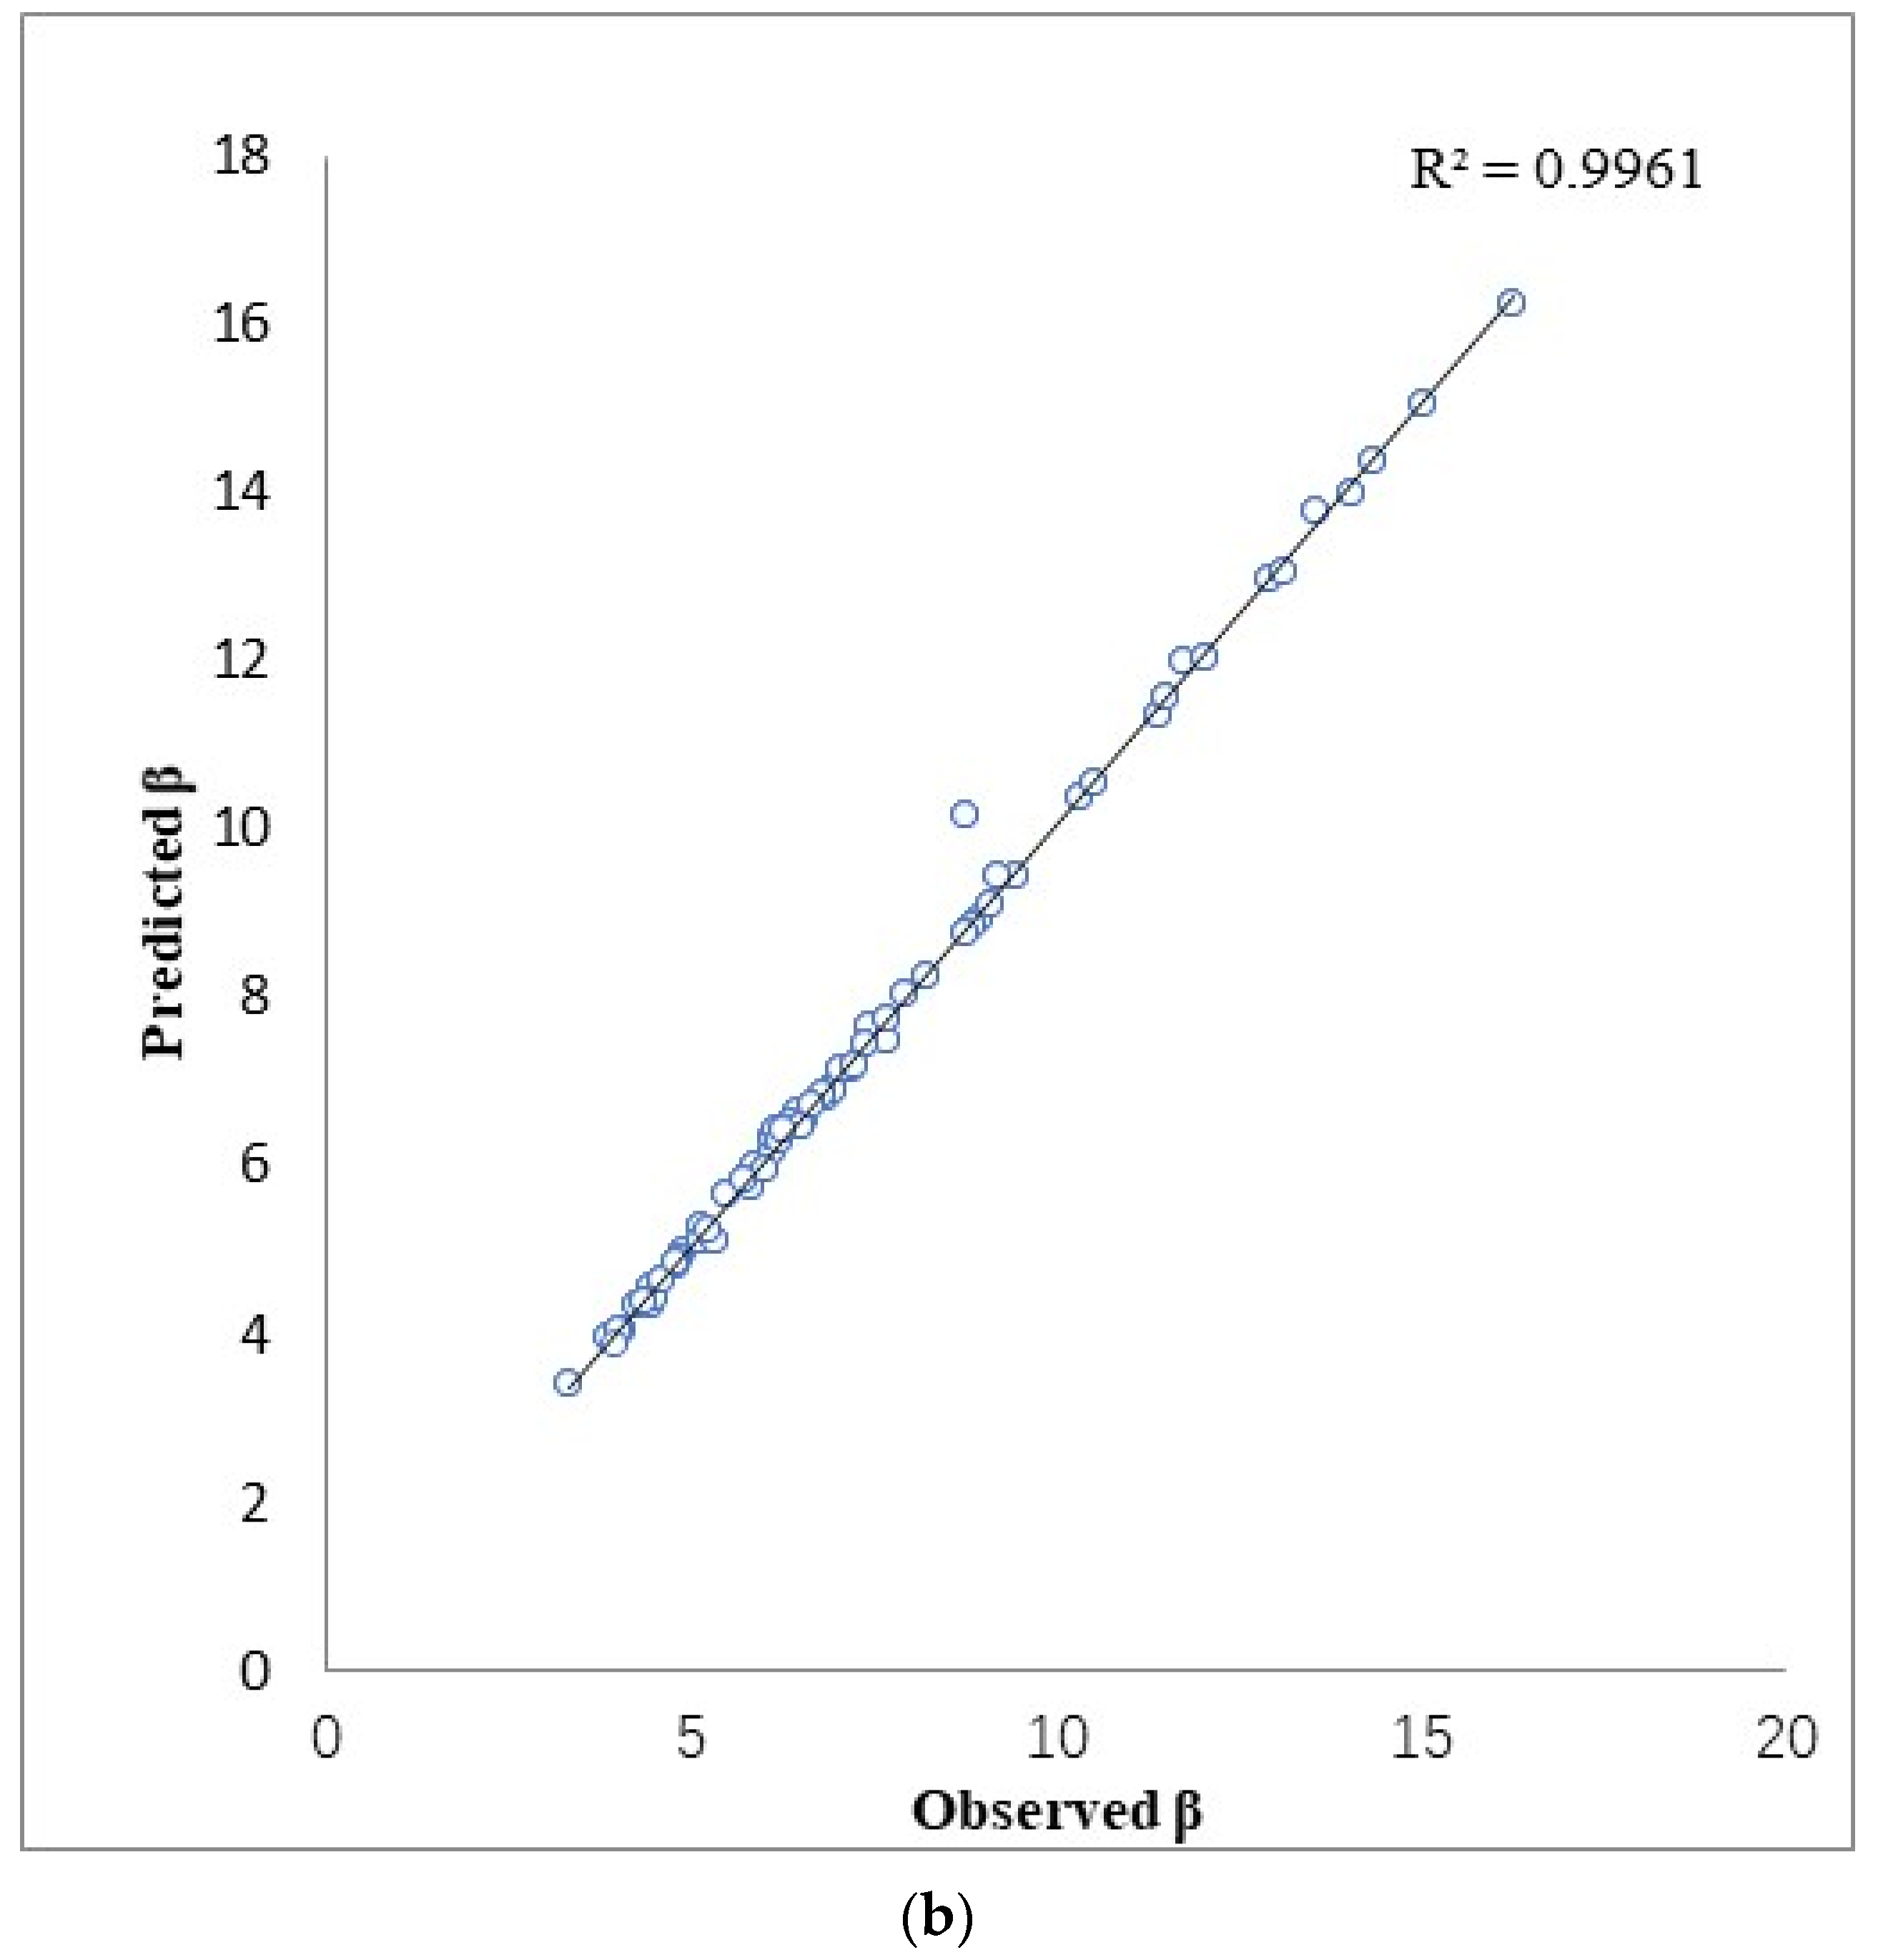
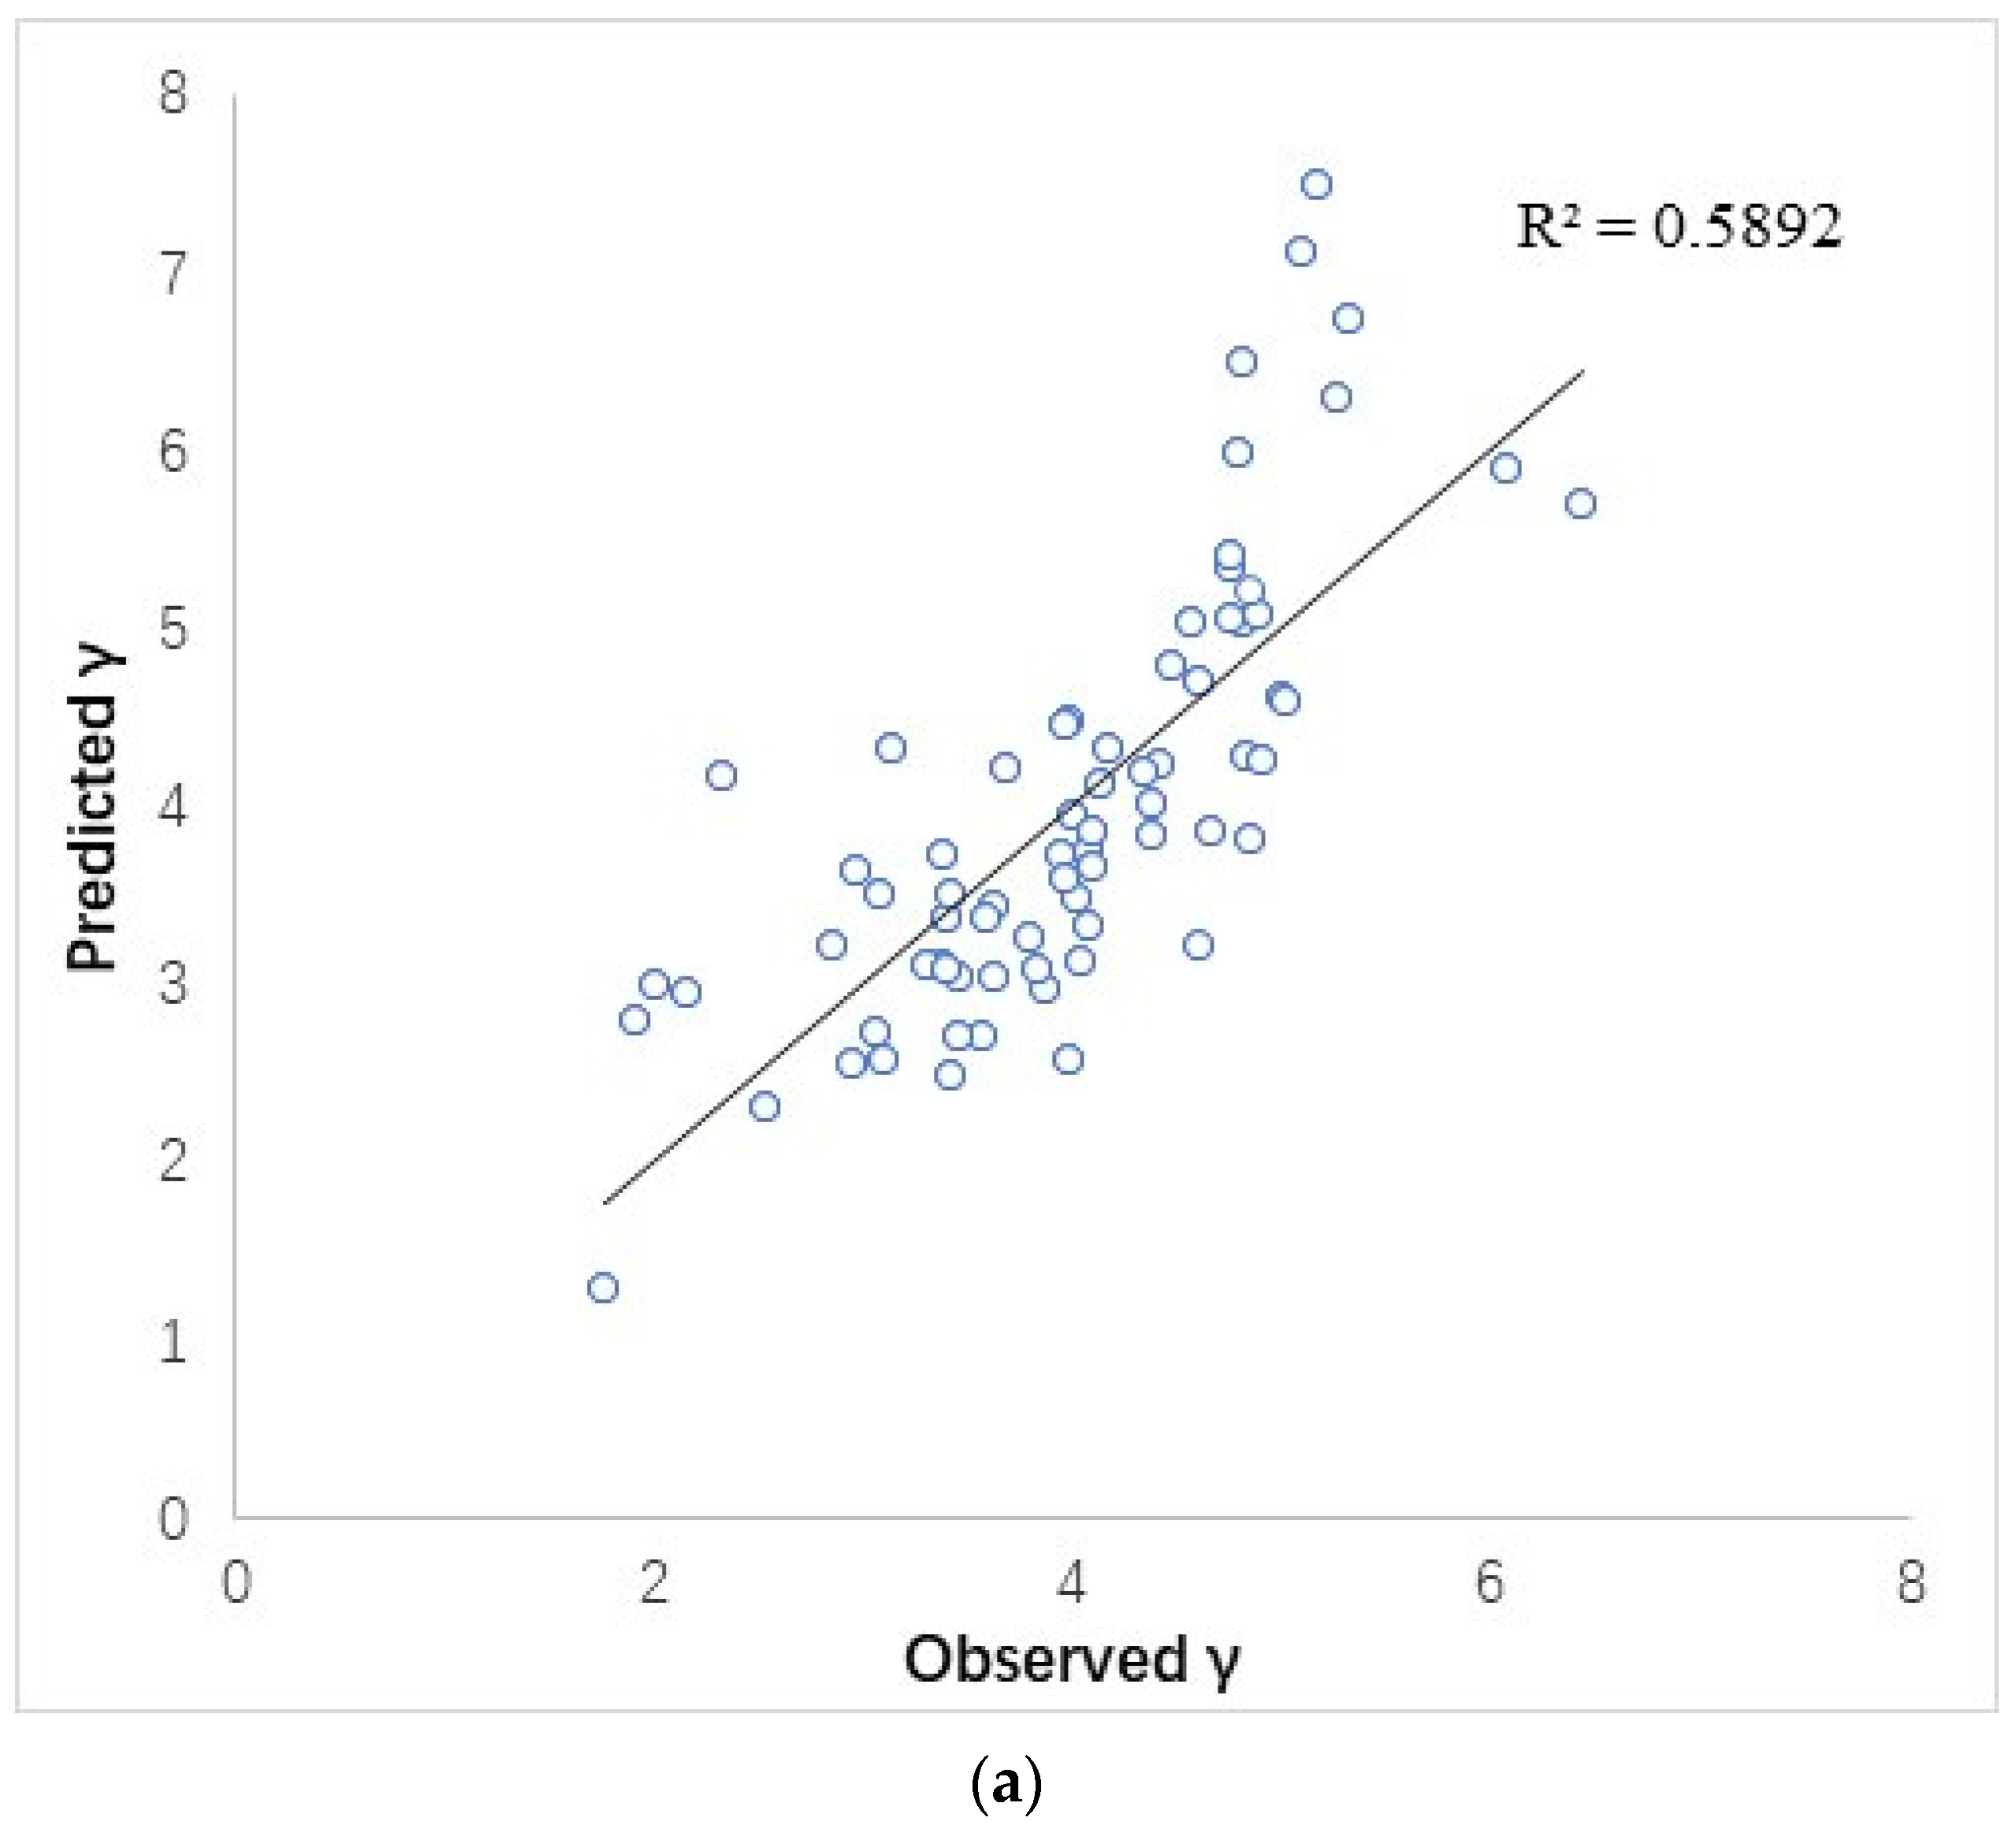
3.2. Comparison of Models for Estimating Diameter Distribution Parameters with and without Soil Variables
4. Discussion
4.1. Attributes of the Diameter Distribution Model
4.2. Influence of Stand Factors and Soil Factors on the Parameters of the Weibull Distribution Model
4.3. Insufficient Research and Future Directions
5. Conclusions
Author Contributions
Funding
Data Availability Statement
Conflicts of Interest
References
- Loetsch, F.; Zohrer, F.; Haller, K.E. Forest Inventory; BLV: Műnchen, Germany, 1973; p. 479. [Google Scholar]
- Andrasev, S.; Bobinac, M.; Orlovic, S. Diameter structure models of Black Poplar selected clones in the section Aigeiros (Duby) obtained by the Weibull distribution. Sumar. List 2009, 133, 589–603. [Google Scholar]
- Russell, M.B.; Burkhart, H.E.; Amateis, R.L.; Prisley, S.P. Regional Locale and Its Influence on the Prediction of Loblolly Pine Diameter Distributions. South. J. Appl. For. 2012, 36, 198–203. [Google Scholar] [CrossRef]
- Burkhart, H.E.; Strub, M.R. A model for simulation of planted loblolly pine stands. In Growth Models for Tree and Stand Simulation; Fries, J., Ed.; Royal College of Forestry: Stockholm, Sweden, 1974; pp. 128–135. [Google Scholar]
- Hafley, W.L.; Schreuder, H.T. Statistical distributions for fitting diameter and height data in even-aged stands. Can. J. For. Res. 1977, 7, 481–487. [Google Scholar] [CrossRef]
- Guo, H.; Lei, X.; You, L.; Zeng, W.; Lang, P.; Lei, Y. Climate-sensitive diameter distribution models of larch plantations in north and northeast China. For. Ecol. Manag. 2022, 506, 119947. [Google Scholar] [CrossRef]
- Urban, J.; Holušová, K.; Menšík, L.; Čermák, J.; Kantor, P. Tree allometry of Douglas fir and Norway spruce on a nutrient-poor and a nutrient-rich site. Trees 2013, 27, 97–110. [Google Scholar] [CrossRef]
- Marshall, A.; Willcock, S.; Platts, P.; Lovett, J.; Balmford, A.; Burgess, N.; Latham, J.; Munishi, P.; Salter, R.; Shirima, D.; et al. Measuring and modelling above-ground carbon and tree allometry along a tropical elevation gradient. Biol. Conserv. 2012, 154, 20–33. [Google Scholar] [CrossRef]
- Sanquetta, C.R.; Behling, A.; Corte, A.P.D.; Netto, S.P.; Rodrigues, A.L.; Simon, A.A. A Model Based on Environmental Factors for Diameter Distribution in Black Wattle in Brazil. PLoS ONE 2014, 9, e100093. [Google Scholar] [CrossRef]
- Zang, H.; Lei, X.; Zeng, W. Height–diameter equations for larch plantations in northern and northeastern China: A comparison of the mixed-effects, quantile regression and generalized additive models. For. Int. J. For. Res. 2016, 89, 434–445. [Google Scholar] [CrossRef]
- Lei, X.; Yu, L.; Hong, L. Climate-sensitive integrated stand growth model (CS-ISGM) of Changbai larch (Larix olgensis) plantations. For. Ecol. Manag. 2016, 376, 265–275. [Google Scholar] [CrossRef]
- Fu, L.; Sun, W.; Wang, G. A climate-sensitive aboveground biomass model for three larch species in northeastern and northern China. Trees-Struct. Funct. 2017, 31, 557–573. [Google Scholar] [CrossRef]
- He, X.; Lei, X.D.; Dong, L.H. How large is the difference in large-scale forest biomass estimations based on new climate-modified stand biomass models? Ecol. Indic. 2021, 126, 107569. [Google Scholar] [CrossRef]
- Ali, A.; Yan, E.-R.; Chen, H.Y.H.; Chang, S.X.; Zhao, Y.-T.; Yang, X.-D.; Xu, M.-S. Stand structural diversity rather than species diversity enhances aboveground carbon storage in secondary subtropical forests in Eastern China. Biogeosciences 2016, 13, 4627–4635. [Google Scholar] [CrossRef]
- Forrester, D.I. Linking forest growth with stand structure: Tree size inequality, tree growth or resource partitioning and the asymmetry of competition. For. Ecol. Manag. 2019, 447, 139–157. [Google Scholar] [CrossRef]
- Ullah, F.; Gilani, H.; Sanaei, A.; Hussain, K.; Ali, A. Stand structure determines aboveground biomass across temperate forest types and species mixture along a local-scale elevational gradient. For. Ecol. Manag. 2021, 486, 118984. [Google Scholar] [CrossRef]
- Sanaei, A.; Ali, A.; Yuan, Z.; Liu, S.; Lin, F.; Fang, S.; Ye, J.; Hao, Z.; Loreau, M.; Bai, E.; et al. Context-dependency of tree species diversity, trait composition and stand structural attributes regulate temperate forest multifunctionality. Sci. Total Environ. 2021, 757, 143724. [Google Scholar] [CrossRef] [PubMed]
- Newton, P.F. Stand density management diagrams: Modelling approaches, variants, and exemplification of their potential utility in crop planning. Can. J. For. Res. 2021, 51, 236–256. [Google Scholar] [CrossRef]
- Shangguan, W.; Dai, Y.; Duan, Q.; Liu, B.; Yuan, H. The global soil dataset for earth system modeling (2014). A Big Earth Data Platform for Three Poles. J. Adv. Model. Earth Syst. 2014, 6, 249–263. [Google Scholar] [CrossRef]
- Bowling, E.H.; Burkhart, H.E.; Burk, T.E.; Beck, D.E.; Fortin, M.; Bédard, S.; DeBlois, J.; Meunier, S.; Packard, K.C.; Radtke, P.J.; et al. A stand-level multispecies growth model for Appalachian hardwoods. Can. J. For. Res. 1989, 19, 405–412. [Google Scholar] [CrossRef]
- Zarnoch, S.J.; Feduccia, D.P.; Baldwin, V.C.; Dell, T.R. Growth and Yield Predictions for Thinned and Unthinned Slash Pine Plantations on Cutover Sites in the West Gulf Region; USDA Forest Service Southern Forest Experiment Station Research Paper SO1991; USDA: Washington, DC, USA, 1992; Volume 264. [Google Scholar]
- Knowe, S.A. Basal Area and Diameter Distribution Models for Loblolly Pine Plantations with Hardwood Competition in the Piedmont and Upper Coastal Plain. South. J. Appl. For. 1992, 16, 93–98. [Google Scholar] [CrossRef]
- Liu, C.; Zhang, S.Y.; Lei, Y.; Newton, P.F.; Zhang, L. Evaluation of three methods for predicting diameter distributions of black spruce (Picea mariana) plantations in central Canada. Can. J. For. Res. 2004, 34, 2424–2432. [Google Scholar] [CrossRef]
- Smirnov, N. Table for Estimating the Goodness of Fit of Empirical Distributions. Ann. Math. Stat. 1948, 19, 279–281. [Google Scholar] [CrossRef]
- Reynolds, M.R.; Burk, T.E.; Huang, W.-C. Goodness-of-fit tests and model selection procedures for diameter distribution models. For. Sci. 1988, 34, 373–399. [Google Scholar] [CrossRef]
- Bailey, R.; Dell, T. Quantifying Diameter Distributions with the Weibull Function. For. Sci. 1973, 19, 97–104. [Google Scholar] [CrossRef]
- Zellner, A. An efficient method of estimating seemingly unrelated regressions and tests for aggregation bias. J. Am. Stat. Assoc. 1962, 57, 348–368. [Google Scholar] [CrossRef]
- Vu, D.H.; Muttaqi, K.M.; Agalgaonkar, A.P. A variance inflation factor and backward elimination based robust regression model for forecasting monthly electricity demand using climatic variables. Appl. Energy 2015, 140, 385–394. [Google Scholar] [CrossRef]
- R Core Team. R: A Language and Environment for Statistical Computing; R Foundation for Statistical Computing: Vienna, Austria, 2021; Available online: https://www.R-project.org/ (accessed on 2 September 2024).
- Henningsen, A.; Hamann, J.D. Systemfit: A Package for Estimating Systems of Simultaneous Equations in R. J. Stat. Softw. 2008, 23, 1–40. [Google Scholar] [CrossRef]
- Gao, Z.; Wang, Q.; Hu, Z.; Luo, P.; Duan, G.; Sharma, R.P.; Ye, Q.; Gao, W.; Song, X.; Fu, L. Comparing independent climate-sensitive models of aboveground biomass and diameter growth with their compatible simultaneous model system for three larch species in China. Int. J. Biomath. 2019, 12, 19500530. [Google Scholar] [CrossRef]
- Akaike, H. A new look at the statistical model identification. IEEE Trans. Autom. Control 1974, 19, 716–723. [Google Scholar] [CrossRef]
- Newton, P.; Lei, Y.; Zhang, S. Stand-level diameter distribution yield model for black spruce plantations. For. Ecol. Manag. 2005, 209, 181–192. [Google Scholar] [CrossRef]
- Kilkki, P.; Maltamo, M.; Mykkänen, R.; Päivinen, R. Use of the Weibull function in estimating the basal area dbh-distribution. Silva Fenn. 1989, 23, 311–318. [Google Scholar] [CrossRef]
- Gorgoso, J.J.; Gonzalez, J.G.A.; Rojo, A.; Grandas-Arias, J.A. Modelling diameter distributions of Betula alba L. stands in northwest Spain with the two-parameter Weibull function. For. Syst. 2007, 16, 113–123. [Google Scholar] [CrossRef]
- Güemes, C.G.; Cañadas, N.; Montero, G. Modelización de la distribución diamétrica de lasmasas de Pinus pinea L. de Valladolid (España) mediantela función de Weibull. Investig. Agrar. Sist. Recur. For. 2002, 11, 264–282. [Google Scholar]
- Calzado, A.; Torres, E. Modelling diameter distributions of Quercus suber L. stands in “Los Alcornocales” Natural Park (Cádiz-Málaga, Spain) by using the two parameter Weibull functions. For. Syst. 2013, 22, 15–24. [Google Scholar] [CrossRef]
- Boggess, W.R. Amount of throughfall and stemflow in a shortleaf pine plantation as related to rainfall in the open. Trans. Ill. Acad. Sci. 1956, 48, 55–61. [Google Scholar]
- Bassett, J.R. Tree growth as affected by soil moisture availability. Soil Sci. Soc. Am. J. 1964, 28, 436–438. [Google Scholar] [CrossRef]
- Hannah, P.R. Topography & soil relations for white and black oak in Southern Indiana. In North Central Forest Experiment Station; Forest Service; US Department of Agriculture: Washington, DC, USA, 1968. [Google Scholar]
- Downs, J.M. Soil Water Regimes for Undisturbed Forest Communities in the Shawnee Hills, Southern Illinois. Ph.D. Thesis, Department of Forestry, Southern Illinois University, Carbondale, IL, USA, 1976. [Google Scholar]
- Fralish, J.S. Forest site-community relationships in the Shawnee Hills region, southern Illinois. In Proceedings of the Central Hardwood Forest Conference, Proceedings of a Meeting, Carbondale, IL, USA, 17–19 October 1976; pp. 17–19. [Google Scholar]
- Hills, S.; Fralish, J.S. The Effect of Site Environment on Forest Productivity in the Illinois. Ecol. Appl. 1994, 4, 134–143. [Google Scholar]
- Mayoral, C.; van Breugel, M.; Turner, B.L.; Asner, G.P.; Vaughn, N.R.; Hall, J.S. Effect of microsite quality and species composition on tree growth: A semi-empirical modeling approach. For. Ecol. Manag. 2018, 432, 534–545. [Google Scholar] [CrossRef]
- Lozano-García, B.; Parras-Alcántara, L.; Brevik, E.C. Impact of topographic aspect and vegetation (native and reforested areas) on soil organic carbon and nitrogen budgets in Mediterranean natural areas. Sci. Total Environ. 2016, 544, 963–970. [Google Scholar] [CrossRef]
- Agbeshie, A.A.; Abugre, S. Soil properties and tree growth performance along a slope of a reclaimed land in the rain forest agroecological zone of Ghana. Sci. Afr. 2021, 13, e00951. [Google Scholar] [CrossRef]
- Cao, Q.V. Predicting parameters of a Weibull function for modeling diameter distribution. For. Sci. 2003, 50, 682–685. [Google Scholar] [CrossRef]


| Provinces | Plot Size | Statistic | SAA /Years | AH /m | QMD/cm | SI/m | BA/m2/ha | S/ha |
|---|---|---|---|---|---|---|---|---|
| Beijing | 0.0667 ha | Mean | 24.56 | 7.02 | 10.86 | 26.47 | 9.29 | 773 |
| Standard Deviation | 9.43 | 1.32 | 3.64 | 3.93 | 10.04 | 509 | ||
| Min | 13.00 | 5.58 | 7.16 | 14.01 | 0.79 | 195 | ||
| Max | 43.00 | 9.76 | 18.70 | 46.35 | 28.84 | 1694 | ||
| Hebei | 0.06 ha | Mean | 17.86 | 6.30 | 9.39 | 19.25 | 7.57 | 1040 |
| Standard Deviation | 5.27 | 1.27 | 3.49 | 3.30 | 5.82 | 610 | ||
| Min | 9.00 | 4.77 | 5.65 | 9.70 | 0.75 | 217 | ||
| Max | 31.00 | 9.85 | 20.00 | 33.42 | 24.11 | 2733 | ||
| Inner Mongolia | 0.06 ha | Mean | 21.33 | 7.97 | 11.68 | 23.00 | 10.64 | 939 |
| Standard Deviation | 5.96 | 1.80 | 3.39 | 3.33 | 6.31 | 496 | ||
| Min | 13.00 | 5.89 | 8.32 | 14.01 | 1.9 | 350 | ||
| Max | 33.00 | 11.17 | 18.09 | 35.57 | 18.84 | 2133 | ||
| Shanxi | 0.0667 ha | Mean | 22.16 | 6.64 | 9.60 | 23.89 | 8.58 | 1128 |
| Standard Deviation | 8.84 | 1.58 | 2.67 | 2.66 | 5.86 | 522 | ||
| Min | 14.00 | 4.82 | 6.20 | 15.09 | 0.54 | 180 | ||
| Max | 50.00 | 12.24 | 18.11 | 53.90 | 24.72 | 1979 | ||
| Total | Mean | 19 | 7.30 | 9.32 | 8.84 | 7.81 | 1076 | |
| Standard Deviation | 8 | 2.01 | 3.21 | 2.56 | 5.86 | 180 | ||
| Min | 5 | 4.52 | 5.59 | 4.68 | 0.48 | 653 | ||
| Max | 50 | 17.80 | 23.69 | 19.20 | 28.84 | 3820 | ||
| Category | Variable Unit | Description | Statistic | ||
|---|---|---|---|---|---|
| Maximum | Minimum | Mean | |||
| Soil chemical properties | TN (g/100 g) | Soil total nitrogen | 0.48 | 0.04 | 0.19 |
| TK (g/100 g) | Soil total potassium | 2.51 | 1.41 | 1.93 | |
| TP (g/100 g) | Soil total phosphorus | 0.13 | 0.04 | 0.06 | |
| SOM (g/100 g) | Soil organic matter | 8.90 | 0.55 | 3.69 | |
| pH | pH value (H2O) | 8.39 | 6.07 | 6.88 | |
| AN (mg/kg) | Alkali-hydrolysable nitrogen | 284.15 | 24.78 | 140.64 | |
| AK (mg/kg) | Available potassium | 254.44 | 49.22 | 140.25 | |
| AP (mg/kg) | Available phosphorus | 13.81 | 2.19 | 6.66 | |
| AL (Me/100 g) | Exchangeable Al3+ | 3.21 | 0.03 | 0.37 | |
| CEC (Me/100 g) | Cation exchange capacity (CEC) | 27.90 | 6.39 | 16.84 | |
| Soil physical property | PDEP (cm) | Soil profile depth | 147.85 | 43.86 | 85.62 |
| GRAV | Rock fragment | 43.73 | 0.25 | 18.30 | |
| BD (g/cm3) | Bulk density | 1.39 | 0.83 | 1.26 | |
| CL | Clay | 22.03 | 9.53 | 15.73 | |
| SI | Silt | 55.34 | 22.22 | 41.97 | |
| SA | Sand | 68.25 | 29.59 | 42.31 | |
| Site | LA (m) | Latitude | 2383.00 | 690.00 | 1471.55 |
| SLD (cm) | Soil layer depth | 100.00 | 1.00 | 24.69 | |
| Variables | β | γ | |
|---|---|---|---|
| Mean | 2.89 | 7.49 | 3.99 |
| Standard Deviation | 0.90 | 2.99 | 1.19 |
| Max | 7.25 | 16.25 | 7.50 |
| Min | 2.50 | 3.33 | 1.28 |
| Parameters | Type | Variables | Estimate | Standard Deviation | Error t Value | Pr | VIF |
|---|---|---|---|---|---|---|---|
| β | Stand | Intercept | 2.37 × 10⁻³ | 7.17 × 10⁻² | 0.033 | 0.97366 | - |
| MinD | −4.98 × 10⁻¹ | 1.15 × 10⁻² | −43.309 | <2.00 × 10⁻¹⁶ | 2.20 | ||
| QMD | 1.05 × 100 | 6.34 × 10⁻³ | 165.833 | <2.00 × 10⁻¹⁶ | 2.39 | ||
| LA | −1.37 × 10⁻⁴ | 4.44 × 10⁻⁵ | −3.083 | 0.00233 | 1.48 | ||
| Density | 1.07 × 10⁻⁴ | 2.58 × 10⁻⁵ | 4.138 | 5.10 × 10⁻⁵ | 1.12 | ||
| Soil depth | 1.04 × 10⁻³ | 5.21 × 10⁻⁴ | 2.004 | 0.04641 | 1.22 | ||
| With soil | Intercept | −1.60 × 10⁻¹ | 9.62 × 10⁻² | −1.661 | 0.09825 | - | |
| MinD | −4.96 × 10⁻¹ | 1.13 × 10⁻² | −43.969 | <2.00 × 10⁻⁶ | 2.40 | ||
| QMD | 1.05 × 100 | 6.42 × 10⁻³ | 162.829 | <2.00 × 10⁻⁶ | 2.75 | ||
| LA | −1.01 × 10⁻⁴ | 4.54 × 10⁻⁵ | −2.215 | 0.02788 | 1.75 | ||
| Density | 9.93 × 10⁻⁵ | 2.53 × 10⁻⁵ | 3.921 | 0.00012 | 1.21 | ||
| SLD | 1.52 × 10⁻³ | 5.18 × 10⁻⁴ | 2.923 | 0.003856 | 1.36 | ||
| AP | 2.68 × 10⁻² | 6.96 × 10⁻³ | 3.847 | 0.00016 | 2.86 | ||
| AL | 6.58 × 10⁻² | 1.97 × 10⁻² | 3.333 | 0.001022 | 1.34 | ||
| AK | −1.55 × 10⁻³ | 4.32 × 10⁻⁴ | −3.584 | 0.000424 | 2.77 | ||
| PDEP | 1.93 × 10⁻³ | 6.89 × 10⁻⁴ | 2.802 | 0.005577 | 1.15 | ||
| γ | Stand | (Intercept) | 3.298216 | 0.271389 | 12.153 | <2.00 × 10⁻¹⁶ | |
| MaxD | −0.19526 | 0.013603 | −14.354 | <2.00 × 10⁻¹⁶ | 1.59 | ||
| MinD | 0.446559 | 0.036948 | 12.086 | <2.00 × 10⁻¹⁶ | 1.42 | ||
| LA | 0.000775 | 0.000172 | 4.515 | 1.06 × 10⁻⁵ | 1.38 | ||
| SLD | −0.00848 | 0.002084 | −4.069 | 6.70 × 10⁻⁵ | 1.22 | ||
| With soil | (Intercept) | 2.163463 | 0.37838 | 5.718 | 3.82 × 10⁻⁸ | 1.59 | |
| (Intercept) | −0.19918 | 0.013451 | −14.808 | <2.00 × 10⁻¹⁶ | 1.76 | ||
| MaxD | 0.47691 | 0.035632 | 13.384 | <2.00 × 10⁻¹⁶ | 1.49 | ||
| MinD | 0.000609 | 0.000168 | 3.623 | 0.000368 | 1.49 | ||
| LA | −0.00889 | 0.002054 | −4.329 | 2.35 × 10⁻⁵ | 1.33 | ||
| AL | 0.208315 | 0.093252 | 2.234 | 0.026581 | 1.86 | ||
| AK | 0.003616 | 0.001422 | 2.543 | 0.011721 | 1.87 | ||
| PDEP | 0.005869 | 0.002973 | 1.974 | 0.049712 | 1.33 | ||
| AN | 0.005541 | 0.001422 | 3.897 | 0.000132 | 2.84 | ||
| TN | −3.02752 | 1.124804 | −2.692 | 0.007704 | 4.35 |
| Parameters | Type | RMSE | Multiple R2 | AIC |
|---|---|---|---|---|
| β | Stand | 0.2005 | 0.9955 | −68.23 |
| With Soil | 0.1864 | 0.9961 | −87.12 | |
| γ | Stand | 0.806 | 0.5472 | 523.83 |
| With Soil | 0.750 | 0.6080 | 503.09 |
| E1 (Stand) | E1 (Soil) | E2 (Stand) % | E2 (Soil) % | |||||||||
|---|---|---|---|---|---|---|---|---|---|---|---|---|
| Provinces | Mean | Min | Max | Mean | Min | Max | Mean | Min | Max | Mean | Min | Max |
| Hebei | 33.3 | 0 | 145 | 32.1 | 0 | 136 | 4.08 | 0.13 | 48.8 | 4.03 | 1.05 | 43.3 |
| Beijing | 93.6 | 2 | 477 | 73.4 | 0 | 347 | 4.31 | 0.23 | 14.1 | 4.26 | 0.05 | 13.8 |
| Shanxi | 74.9 | 0 | 400 | 68.9 | 2 | 364 | 5.38 | 0.31 | 35.2 | 4.96 | 0.23 | 31.3 |
| Inner Mongolia | 57.4 | 8 | 202 | 48.9 | 8 | 175 | 9.2 | 0 | 43.2 | 8.4 | 0 | 38.3 |
Disclaimer/Publisher’s Note: The statements, opinions and data contained in all publications are solely those of the individual author(s) and contributor(s) and not of MDPI and/or the editor(s). MDPI and/or the editor(s) disclaim responsibility for any injury to people or property resulting from any ideas, methods, instructions or products referred to in the content. |
© 2024 by the authors. Licensee MDPI, Basel, Switzerland. This article is an open access article distributed under the terms and conditions of the Creative Commons Attribution (CC BY) license (https://creativecommons.org/licenses/by/4.0/).
Share and Cite
Guo, H.; Liu, X.; Liu, D. Soil-Sensitive Weibull Distribution Models of Larix principis-rupprechtii Plantations across Northern China. Forests 2024, 15, 1562. https://doi.org/10.3390/f15091562
Guo H, Liu X, Liu D. Soil-Sensitive Weibull Distribution Models of Larix principis-rupprechtii Plantations across Northern China. Forests. 2024; 15(9):1562. https://doi.org/10.3390/f15091562
Chicago/Turabian StyleGuo, Hong, Xianzhao Liu, and Dan Liu. 2024. "Soil-Sensitive Weibull Distribution Models of Larix principis-rupprechtii Plantations across Northern China" Forests 15, no. 9: 1562. https://doi.org/10.3390/f15091562
APA StyleGuo, H., Liu, X., & Liu, D. (2024). Soil-Sensitive Weibull Distribution Models of Larix principis-rupprechtii Plantations across Northern China. Forests, 15(9), 1562. https://doi.org/10.3390/f15091562