Article

GLU-YOLOv8: An Improved Pest and Disease Target Detection Algorithm Based on YOLOv8

College of Computer and Control Engineering, Northeast Forestry University, Harbin 150040, China
*
Author to whom correspondence should be addressed.
Forests 2024, 15(9), 1486; https://doi.org/10.3390/f15091486
Submission received: 8 July 2024 / Revised: 29 July 2024 / Accepted: 23 August 2024 / Published: 24 August 2024
(This article belongs to the Section Forest Inventory, Modeling and Remote Sensing)

Abstract

:
In the contemporary context, pest detection is progressively moving toward automation and intelligence. However, current pest detection algorithms still face challenges, such as lower accuracy and slower operation speed in detecting small objects. To address this issue, this study presents a crop pest target detection algorithm, GLU-YOLOv8, designed for complex scenes based on an enhanced version of You Only Look Once version 8 (YOLOv8). The algorithm introduces the SCYLLA-IOU (SIOU) loss function, which enhances the model generalization to various pest sizes and shapes by ensuring smoothness and reducing oscillations during training. Additionally, the algorithm incorporates the Convolutional Block Attention Module (CBAM) and Locality Sensitive Kernel (LSK) attention mechanisms to boost the pest target features. A novel Gated Linear Unit CONV (GLU-CONV) is also introduced to enhance the model’s perceptual and generalization capabilities while maintaining performance. Furthermore, GLU-YOLOv8 includes a small-object detection layer with a feature map size of 160 × 160 to extract more features of small-target pests, thereby improving detection accuracy and enabling more precise localization and identification of small-target pests. The study conducted a comparative analysis between the GLU-YOLOv8 model and other models, such as YOLOv8, Faster RCNN, and RetinaNet, to evaluate detection accuracy and precision. In the Scolytidae forestry pest dataset, GLU-YOLOv8 demonstrated an improvement of 8.2% in mAP@0.50 for small-target detection compared to the YOLOv8 model, with a resulting mAP@0.50 score of 97.4%. Specifically, on the IP102 dataset, GLU-YOLOv8 outperforms the YOLOv8 model with a 7.1% increase in mAP@0.50 and a 5% increase in mAP@0.50:0.95, reaching 58.7% for mAP@0.50. These findings highlight the significant enhancement in the accuracy and recognition rate of small-target detection achieved by GLU-YOLOv8, along with its efficient operational performance. This research provides valuable insights for optimizing small-target detection models for various pests and diseases.

1. Introduction

China is significantly impacted by forestry pests, with an annual infestation area of 60 million hm2 [1]. Various factors contribute to the outbreak of pest populations, including climate warming, biological invasion, and interspecific competition, leading to species substitution [2,3]. These challenges pose major obstacles to forestry production in China. Detecting pests allows for a better understanding of their distribution patterns and seasonal variations, enabling the development of effective prevention and control strategies. This support is crucial for enhancing agricultural and forestry management to boost the yield and quality. Historically, pest detection has relied on visual identification by experienced experts, but this method is time-consuming, labor-intensive, and has low accuracy rates [4,5]. Recently, advancements in computer vision technology and deep learning Convolutional Neural Networks (CNN) have revolutionized crop pest detection. Deep learning CNNs offer superior feature extraction capabilities compared with traditional image detection algorithms, significantly enhancing detection accuracy and precision [6]. Popular detection models now include two-stage algorithms like Faster RCNN [7], DETR [8], EfficientDet [9], CenterNet [10], and RetinaNet [11], as well as single-stage algorithms like SSD [12] and YOLO [13,14].
In 2018, Liu et al. [15] were the first to apply deep learning target detection models to identify grain storage pests such as rice weevils and corn weevils. Their study revealed that using Inception-ResNet-V2 as the feature extraction network and Faster RCNN as the detector, they achieved an mAP@0.50 of 85.76%. They introduced a method that combines a Faster RCNN and a region-based fully convolutional network (RFCN) for pest detection in grain bin environments. This approach involves a two-stage detection method for deep learning target detection, which, despite its high detection accuracy, is relatively slow to execute. Li et al. [16] proposed a Coarse-Fine Network (CFN) based CNN for identifying and detecting tiny and densely distributed aphids. They utilized a Fine-Grained Convolutional Neural Network (FCNN) to refine the aphid regions within the detection cluster. Wang et al. [17] suggested a Faster RCNN-based approach, MPest RCNN, for identifying and counting typical apple pests. This method uses small anchors to extract features, thereby enhancing the recognition accuracy for small pests. Liu et al. [18] developed a new pest dataset containing over 80,000 images and introduced a region-based end-to-end PestNet network for large-scale detection and classification of various types of pests. Sun et al. [19] proposed a deep learning detection method that utilizes an advanced RetinaNet detection model to directly identify and count adult red pine resin beetles (RTB) in pheromone traps. They incorporated k-means anchor optimization and residual classification subnetworks to reduce the size of the detector. Jiao et al. [20] introduced the anchor-free regional convolutional neural network (AF-RCNN) for detecting 24 pests. Their approach involved designing a feature fusion module to extract pest information from effective features, followed by creating an anchor-free regional proposal network (AFRPN) based on fused feature maps to identify potential pest locations. Additionally, they merged the AF-RCNN and Faster RCNN into a single network to address the challenge of identifying small-target pests.
Chen et al. [21] utilized various deep learning target detection algorithms were utilized by in their research on pest detection using edge-computing platforms, with YOLOv4 ultimately achieving the highest detection accuracy. Fuentes et al. [22] combined different meta-architectures and deep learning feature extraction methods to develop a network for tomato pest detection. Zha et al. [23] introduced a lightweight YOLOv4 forestry pest detection method, incorporating MobileNetV2 with a CA attention mechanism for feature extraction, along with feature fusion using Bi-directional Feature Pyramid Network (BiFPN) and Adaptively Spatial Feature Fusion (ASFF), resulting in a mAP@0.50 of 88.93%. Yang et al. [24] proposed a maize pest detection method based on YOLOv7, integrating the CSPResNeXt-50 module and VoVGSCSP module to enhance detection accuracy and speed while reducing model computation. Tian et al. [25] presented a novel multiscale intensive method named MD-YOLO for detecting small-target lepidopteran pests, addressing scale adaptation and information loss issues encountered by traditional YOLO through dense feature extraction at different scales and feature fusion. Ahmad et al. [26] employed a dataset of 7046 images with 23 insect species to evaluate a new method involving YOLO-Lite, YOLOv3, YOLOR, YOLOv5, and eight models including YOLOv5, where the YOLOv5x model achieved a 98.3% mAP value. Liu et al. [27] curated a real-environment tomato pest dataset and proposed an enhanced YOLOv3 algorithm for pest detection, leveraging feature pyramids to enhance accuracy in detecting small targets. Tan et al. [28] compared the performance of deep learning and machine learning algorithms on tomato leaf diseases in the PlantVillage dataset, demonstrating superior outcomes by deep learning algorithms in metrics such as precision, recall, and F1 value. Ren et al. [29] and Liu et al. [30] enhanced the ResNet network and utilized it for the intelligent recognition of pest images. They achieved classification accuracies of 55.24% and 55.43% on the IP102 dataset, which includes 102 pest species, respectively. Reza et al. [31] employed a combination of transfer learning and data augmentation techniques to train Inception-V3 for pest species recognition.
Based on these research findings, it has been established that two-stage algorithms exhibit high performance in crop pest recognition. However, these algorithms are noted for their relatively low recognition speed and limited real-time performance. On the other hand, the YOLO series, representing single-stage target detection algorithms, integrates target frame generation and feature extraction into a single step. This streamlined approach simplifies the detection process and enhances recognition speed. Consequently, the YOLO series is generally more advantageous for pest identification applications that necessitate swift, precise, and real-time recognition.
YOLOv8 [32,33] is shown to outperform two-stage models like Faster RCNN in real-time detection. To enhance pest detection accuracy, the paper introduces the optimized GLU-YOLOv8 model. The main contributions of this work include:
  • Conducting ablation experiments to validate the effectiveness of the proposed method and assessing the impact of CBAM, LSK, GLU-CONV, and the small-object detection layer on model performance.
  • Comparing the recognition performance and inference speed of GLU-YOLOv8 with those of multiple target detection models such as Faster RCNN, CenterNet, DETR, EfficientDet, RetinaNet, SSD, and YOLOv8 for pest detection tasks.
  • Comparing the recognition performance and inference speed of GLU-YOLOv8 with multiple classification models such as ResNet, SqueezeNet, ShuffleNetV2, MobileNetV3, ManasNet, GhostNet, EfficientNetV2, ConvMixer, DPN, and YOLOv8 for pest classification tasks.
The paper is structured as follows: Section 2 describes the experimental materials and methods, Section 3 presents the experimental results, and Section 4 and Section 5 cover the discussion and conclusions, respectively.

2. Materials and Methods

2.1. Dataset

2.1.1. The Scolytidae Forestry Pest Data

Samples of the Scolytidae forestry pest data [34] were collected from the School of Forestry, Beijing Forestry University. The six pests included in the study were the red fat bollworm, pine twelve-toothed bollworm, Huashan pine bollworm, spruce eight-toothed bollworm, four-eyed bollworm, and six-toothed bollworm. Both clear and fuzzy images were used to document the morphology of the pests. To create the dataset, tweezers were used to place the pests in the trap collector, replicating a field environment for pest trapping. High-definition monitors were used to capture detailed images of pests. The dataset consists of 1687 images, with 1517 images used for training and 170 for testing in a 9:1 ratio. Two samples of the dataset are illustrated in Figure 1.
The dataset includes the number of instances of each type of insect, as detailed in Table 1. The images in the dataset had a resolution of 1310 × 1310, which was scaled down to 640 × 640 pixels for the experiments in this paper. External environmental factors, such as the use of fill-in luminaires for natural and strike lighting, were considered. The collectors were divided into scenarios involving alcohol and scenarios without alcohol. Based on the distances between the insects, the situations were classified as crowded or sparse. This differentiation not only enhances the robustness of the trained model by addressing varying distributions of insects but also improves the model’s ability to generalize and remain robust in real-world applications.
The dataset is used exclusively for target detection experiments in this study. In Section 3.1, the effectiveness of the enhanced method proposed in this paper is evaluated on the dataset. In Section 3.2, the performance of the GLU-YOLOv8 model is compared with other target detection models using the same data.

2.1.2. The IP102 Pest Data

The IP102 dataset [35] is a specialized dataset for image classification and target detection tasks related to agroforestry crop pests and diseases. The dataset was created and annotated using a detailed process involving the development of a classification system, image collection, data filtering, and expert annotation. The key characteristics of this dataset include a hierarchical classification system, natural long-tailed distribution, unbalanced data distribution, wide range of pest species, subtle differences between classes (similar characteristics), and significant variations within classes (due to various stages in the life cycle of pests and diseases).
The IP102 dataset contains 102 pest species and covers pest images of eight crops: rice, maize, wheat, sugar beet, alfalfa, grape, citrus, and mango, with over 75,000 images. The distribution of these images is long-tailed, with approximately 19,000 images labeled with bounding boxes for target detection. The crops in the dataset are classified into two categories: Field Crops (FC) and Economy Crops (EC), with the first five crops falling under field crops and the last three under economy crops. The samples of crop pests from both categories are illustrated in Figure 2.
In Section 3.2, the paper presents target detection experiments using the dataset, compares GLU-YOLOv8 with other state-of-the-art target detection models, and validates the performance of the model. Section 3.3 explores image classification experiments on the same dataset, comparing GLU-YOLOv8 with other top classification models, and verifying the classification performance of the model’s backbone network. Statistical examples of the dataset are illustrated in Figure 3 and Table 2.

2.2. Improved Detection Models Based on YOLOv8

2.2.1. YOLOv8

Since the inception of the YOLO single-stage target detection algorithm, it has garnered significant academic interest. Over the years, the YOLO algorithm has undergone continuous updates and optimization. In 2023, the ultralytics team introduced YOLOv8, a version of the algorithm that ensures real-time performance with high detection accuracy and a lightweight network structure, thereby solidifying its position as a popular algorithm in the field of target detection, as shown in Figure 4.
The structure of YOLOv8 comprises four main components: the Input, Backbone, Neck, and Head. The Input component is responsible for scaling and data enhancement operations on the input image. The Backbone serves as the network’s foundation for extracting target features, incorporating the convolutional module Conv, the C2f structure, and the Spatial Pyramid Pooling-Fast (SPPF) module. The C2f structure enhances the gradient flow by linking branches across layers, thereby enhancing feature representation. The Neck component enhances and merges features of varying dimensions, drawing from the Feature Pyramid Network (FPN) and Path Aggregation Network (PAN) methodologies while eliminating the convolution operation in the upsampling phase. The Head component utilizes a decoupled head structure to segregate the classification and detection tasks and embraces the Anchor-Free concept. For the loss function, YOLOv8 employs Binary Cross Entropy (BCE) Loss for classification loss, and Dynamic Focal Loss (DFL) Loss and Complete-IoU (CIOU) Loss for regression loss. Task-Aligned Assigner matching is utilized for sample matching. YOLOv8 builds upon the YOLOv8X baseline model, striving to enhance its detection accuracy.

2.2.2. GLU-YOLOv8 Model

This paper introduces the GLU-YOLOv8 optimization model, which is based on YOLOv8, to address the challenges of low recognition rates and slow recognition speeds of pests. The new GLU-YOLOv8 structure is depicted in Figure 5, and the model enhancement methods are outlined below.
  • The model employs the SIOU loss function instead of CIOU to handle different sizes and shapes of pests and reduce fluctuations during training, as outlined in Section 2.2.3.
  • The attention mechanism assigns varying weights to different channels or regions to assist the model by focusing on extracting crucial feature information. This paper utilizes the CBAM attention mechanism, innovative LSK attention mechanism, and efficient multiscale attention (EMA) mechanism. The attention mechanism is introduced in Section 2.2.4.
  • This paper introduces a novel Gated Linear Unit CONV (GLU-CONV) convolution block as an alternative to the CONV convolution block in the original YOLOv8 model. The structure of the GLU-CONV block is detailed in Section 2.2.5.
  • In this study, a small-object detection layer (SODL) is incorporated into the Neck structure of YOLOv8. The original YOLOv8 model has a maximum feature map size of 80 × 80 pixels. To address issues related to the leakage and false detection of small-target pests, this research implements a more in-depth feature transfer and fusion process. Specifically, a small-object detection layer with a feature map size of 160 × 160 pixels is introduced into the Neck layer. The SODL, depicted in gray in Figure 5, is explained in detail in Section 2.2.6.

2.2.3. SIOU Loss Function

In this paper, we replace the CIOU loss function in YOLOv8 with the SIOU loss function, which considers the angle problem. Where B denotes the predicted frame, b g t denotes the real frame, σ denotes the diagonal distance between the minimum closed area of the predicted and real frames, and α is a balancing parameter to measure whether the aspect ratio is consistent. Adding the angle cost improves detection accuracy, as shown in Figure 6. In Section 3.1, it is demonstrated that the YOLOv8 model converges more rapidly, thereby saving time and cost, particularly when utilizing the SIOU loss function in pest and disease identification tasks.
The SIOU loss ( L S I O U ) consists of four components: the angle loss Ʌ, the distance loss , the shape loss Ω , and the Intersection Over Union loss (IOU). The angle loss formula is as follows:
Λ = cos ( 2 ( arcsin ( c h σ ) π 4 ) )
Among them, C h is the height difference between the center points of the real and predicted frames, and σ is the distance between the center points of the real and predicted frames. The distance loss  formula is as follows:
P x = ( b x gt B x C x ) 2 , P y = ( b y gt B y C y ) 2 , γ = 2 Λ
Δ = t = x , y ( 1 e γ p t ) = 2 e γ p x e γ p y
Among them, ( b x g t , b y g t ) are the coordinates of the center of the real frame, ( B x , B y ) are the coordinates of the center of the prediction frame, ( C x , C y ) are the width and height of the smallest outer rectangle of the real and predicted boxes. The shape loss Ω  equation is as follows:
W w = | w w gt | max ( w , w gt ) , W h = | h h gt | max ( h , h gt )
Ω = t = w , h ( 1 e w t ) θ = ( 1 e w w ) θ + ( 1 e w h ) θ
The Intersection Over Union loss formula is as follows:
I O U = S 1 S 2 S 1 S 2
S 1 and S 2 are the areas of the predicted and real frames, respectively. In summary, the loss function for SIOU can be calculated as
L SIOU = 1 I O U + Δ + Ω 2

2.2.4. Attention Mechanism

Fast Fourier Convolution (FFC) is a Fast Fourier Transform (FFT)-based convolutional acceleration technique widely employed to expedite the training and inference processes of Convolutional Neural Networks (CNNs). FFC divides the channel into local and global branches: the local branch performs feature map updates locally using traditional convolution methods, while the global branch applies a Fourier transform to the feature map, updating it in the spectral domain to influence global features. We integrate FFT as a residual connection into CBAM. allowing for attention adjustments in the frequency domain. Its structure is depicted in Figure 7.
LSK attention demonstrates efficient image-processing capabilities by reducing computational and memory costs through innovative kernel decomposition and tandem convolution strategies. These strategies are especially beneficial when handling large kernel sizes and complex image data; their structures are shown in Figure 8.
The EMA attention mechanism is an efficient multiscale attention mechanism that is based on cross-space learning. This module initially reshapes certain channel dimensions into batch dimensions to prevent dimensionality reduction through general convolution. Subsequently, in each parallel subnetwork, local cross-channel interactions constructed using a new cross-space learning method to merge the output feature maps of two parallel subnetworks. Additionally, a multiscale parallel subnetwork is devised to establish both long and short dependencies. The network structure is illustrated in Figure 9. For a given input X R C × H × W , to learn different semantics, X is divided into G sub-features in the channel dimension, denoted as X = [ X 0 , X 1 , X 2 …, X G 1 ], R C × H × W .

2.2.5. Gated Linear Unit CONV (GLU-CONV)

In this paper, we introduce a new GLU-CONV convolution block inspired by the TransNeXt model. This block is composed of two sequential parts: the GLU block and ConvFFN. The structure of this block can be seen in Figure 10. We replaced the CONV convolutional block in the original YOLOv8 model backbone network with the new convolutional block.
For GLU-CONV, we chose a Gaussian Error Linear Unit (GELU) as the activation function. Compared to RELU and other activation functions, it introduces nonlinear transformations that enhance the model’s expressive power, the comparison of the activation function performance is shown in Figure 11. Its continuous derivative aids in stable gradient propagation. Most importantly, GELU introduces a smooth non-linearity in the negative range, which helps prevent the issue of neuron “death”,which is computed as follows:
GELU ( x ) = 0.5 x ( 1 + tanh ( 2 π ( x + 0.044715 x 3 ) ) )
The new GLU block is a channel mixer consisting of two linear projections and two jump connections. The two projections use Depthwise convolution (DW) and Pointwise convolution (PW), and the results of these two linear branches are multiplied by the input data. The result of multiplication is added to the input data through convolution. The results of the GLU block module is obtained using the activation function. Since the GLU block module does not deal with data size and dimension, it uses jump joins.
Assuming that the input data x 0 has dimensions C × H × W , the data after passing through the linear layer produces data with dimensions 2 C × H × W . The data is then divided into two groups x 1 and x 2 according to the first dimension, the dimensions of both x 1 and x 2   are   C × H × W . DW and PW in the branches do not modify the data dimensions, and the results of the two branches are multiplied by x 0 to produce the result y , which is of dimensions C × H × W . y passes through the convolution layer and then is added to x 0 and finally passes through the activation function with the expression formula shown below.
x 1 , x 2 = Linear ( x 0 ) . chunk ( 2 )
y = x 0 GELU ( DW ( x 1 ) ) GELU ( PW ( x 2 ) )
f ( x 0 ) = x 0 + Conv ( y )
where f ( x 0 ) is the output of the GLU block module, x 0 is the input of the GLU block module, y is the result of triple multiplication of the two linear branches with the input data, DW is the Depthwise convolution, PW is the Pointwise convolution, Linear is the linear layer, GELU is the activation function, CONV is the normal 3 × 3 convolution block, and chunk (2, 1) denotes dividing the data into two groups according to the first dimension.
The ConvFFN module receives input data from the GLU block module and uses a linear layer to double the number of channels, resulting in a data dimension of 2 C × H × W . Following the GELU activation function, a DW convolution with a stride of 2 reduces the dimensionality to 2 C × H 2 × W 2 , effectively compressing the input feature maps while retaining important features. Subsequently, a linear layer adjusts the output channel to 2C, resulting in a final data dimension of 2 C × H 2 × W 2 . The formula for this module is as follows:
f ( x 1 ) = Linear ( DW ( GELU ( Linear ( x 1 ) ) ) ) + Linear ( GELU ( DW ( x 1 ) ) )
where f x 1  is the output of the ConvFFN module, x 1 is the input data of the ConvFFN module, Linear is the linear layer, DW is the Depthwise convolution, and GELU is the activation function.

2.2.6. Small-Object Detection Layer

In pest detection tasks, the model’s ability to detect small targets is crucial due to the pests’ diminutive size. Smaller feature maps offer rich semantic information, but less local detail, making them suitable for detecting larger targets. Conversely, larger feature maps can be used to capture detailed target locations and local features, which makes them ideal for detecting small targets. The original YOLOv8 model is limited to a maximum feature map size of 80 × 80, potentially losing detailed features and impacting the accuracy of small-target pest detection.
To address this issue, this paper proposes an enhancement of the original YOLOv8 network structure. As depicted in Figure 12, the improved neck structure introduces a new small-object detection layer, highlighted in gray. A new feature map output stream is implemented in layer 3 of the backbone network, adding a small-object detection layer (SODL) of size 160 × 160. This new feature layer enables the model to capture detailed features of small-targeted pests, resulting in a significant 5.3% improvement in the small-target detection mAP.

2.3. Model Training

2.3.1. Training Platforms and Parameter Settings

The experimental setup in this study involved a Linux server running Python 3.8.16, Pytorch 1.13.1, and CUDA 11.7. The hardware configuration included 128 GB RAM, two NVIDIA A100 80 GB GPUs, and an Intel(R) Xeon(R) Silver 4310 CPU. The training parameters were set with a momentum of 0.9, a weight decay of 0.0001, an initial learning rate of 0.01, and weights decayed to half every 10 iterations. Input images were 640 × 640, and training was conducted for 100 epochs using a Stochastic Gradient Descent (SGD) optimizer. During the training, only the latest and optimal model weights were saved, while the loss values and accuracies were recorded. To prevent overfitting, training would stop automatically if the model accuracy did not improve after 50 rounds of training. Table 3 provides a summary of the training parameters used in the experiments.

2.3.2. Evaluation Indicators of the Model

In this study, we assess the model’s performance using metrics such as Accuracy (A), Precision (P), Recall (R), Mean Average Precision (mAP), and frames per second (FPS). These metrics are calculated according to Equations (13)–(19), where TP, TN, FP, and FN denote correctly predicting positive samples, correctly predicting negative samples, incorrectly predicting negative samples as positive, and incorrectly predicting positive samples as negative, respectively. Additionally, TPTP represents the processing time per frame.
A = TP + TN TP + FP + TN + FN × 100 %
P = TP TP + FP × 100 %
R = TP TP + FN × 100 %
AP = 0 1 P ( R ) dR
mAP = 1 n i = 1 n A P i
F 1 = 2 × P × R P + R
FPS = 1 PTPF
Accuracy measures the overall correctness of sample classifications using a model. Precision evaluates the accuracy of model predictions, specifically, the ratio of correctly predicted positives to all predicted positives. Recall assesses the completeness of model predictions, indicating the proportion of actual positives that were correctly identified by the model. AP@0.50, and mAP@0.50:0.95, are the metrics used in object detection tasks. mAP@0.50 denotes the average precision at an Intersection Over Union (IOU) threshold of 0.5, while mAP@0.50:0.95 represents the average precision across IOU thresholds ranging from 0.5 0.95. F1 score is used to evaluate the accuracy of the binary classification model. FPS measures the speed of image processing and model inference, with higher values indicating faster computational performance. These metrics were employed in this paper to evaluate the models comprehensively.

3. Result

3.1. Ablation Experiment

To demonstrate the effectiveness of the improved YOLOv8 modeling approach, this section conducts ablation experiments on the Scolytidae forestry pest data. The training set consists of 1517 pictures, while the test set comprises 170 pictures. The YOLOv8 model initially employs the CIOU loss function. When YOLOv8 switches to using the SIOU loss function, it is designated as Model A. Subsequently; we introduce the CBAM mechanism in front of the CONV module of Model A, denoted as Model B. Following this, the CONV module of Model B is replaced with the GLU-CONV module, creating Model C. Further enhancements are made by adding the LSK mechanism in front of the Detect of Model C, resulting in Model D. Finally, the small-object detection layer is incorporated into the Neck structure of Model D, referred to as model GLU-YOLOv8 in this paper. All the above models use the SIOU loss function. The compositions of these models are detailed in Table 4.
The experimental results on the Scolytidae forestry pest data, as depicted in Table 5, demonstrate that our GLU-YOLOv8 model achieves the highest mAP@0.50, reaching 97.4%. Of particular significance is the noteworthy 8.2% enhancement in mAP@0.50 for small-object detection. Our model greatly improves pest recognition performance without compromising inference speed.
Figure 13 shows the relationship between mAP@0.50 and the number of iterations when YOLOv8 uses both the CIOU and SIOU loss functions. The blue line is Model A. The red line is the original YOLOv8 Model, which converges faster when using the SIOU loss function on Scolytidae forestry pest data.
After incorporating the CBAM attention mechanism into Model A, the model is able to dynamically learn the channel and spatial attention weights in order to capture feature correlations. Consequently, Model B achieves an mAP@0.50 of 96.1%, resulting in a notable increase in FPS to process 29.07 images per second. This represents a maximum improvement of 0.9% compared to Model A.
The GLU-CONV module, as proposed in this study, utilizes depthwise separable convolutions to significantly improve feature extraction capabilities. Substituting the CONV module with GLU-CONV in Model B increases the mAP@0.50 to 96.9%, indicating a substantial 0.8% enhancement. Moreover, Recall sees a boost of 0.24%, confirming the efficacy of the GLU-CONV module in enhancing the accurate prediction of all positive samples.
The LSK attention mechanism functions both horizontally and vertically, allowing for a more precise manipulation of image features and improving the model’s comprehension of spatial relationships in the image. Integrating the LSK mechanism prior to the Detect module in Model D results in a 0.7% increase in mAP@0.50 (area = small), thereby enhancing its capacity to detect small objects.
Adding a small-object detection layer to GLU-YOLOv8 further improves its performance in recognizing small objects. Table 5 demonstrates that GLU-YOLOv8 achieves an mAP@0.50 of 97.4%, showing a notable increase of 5.3% in mAP@0.50 (area = small) to 91.6%. Additionally, its FPS is similar to that of the original YOLOv8.
To provide a more visual representation of the model’s feature extraction capabilities, Figure 14 illustrates the detection and heat maps of the GLU-YOLOv8 and YOLOv8 models in detecting pests.

3.2. Target Detection Comparison Experiment

In order to demonstrate the recognition performance of the GLU-YOLOv8 model, we conducted comparative experiments on the Scolytidae forestry pest data. We compared the models in this paper with Faster RCNN, CenterNet, DETR, EfficientDet, etc., and used mAP, Precision, Recall, F1, and FPS metrics to evaluate the performance of the models. All models were trained using the same dataset. The experimental results are shown in Table 6. The mAP and iteration numbers of the models during the training process are shown in Figure 15.
Based on the findings presented in Table 6, our GLU-YOLOv8 model demonstrates an impressive mAP@0.50 of 97.4% on the dataset, consistently outperforming the other models. While Faster RCNN shows similar recognition performance, it suffers from a lower FPS, impacting real-time capabilities. Models like CenterNet, RetinaNet, EfficientDet, and DETR exhibit inferior recognition results on this dataset. Despite a slightly lower FPS compared to the original YOLOv8, our GLU-YOLOv8 model significantly enhances the recognition performance with only a minor trade-off in FPS.
In comparative experiments, GLU-YOLOv8 achieves the highest mAP, Precision, Recall, and F1 scores, showcasing outstanding pest detection performance and a competitive FPS. Figure 15 visually represents the relationship between mAP@0.50, and iteration numbers during training for each model.
Figure 15 illustrates that the GLU-YOLOv8, Faster RCNN, and SSD models in this study exhibit faster convergence speed and achieve complete convergence during the middle of training. On the other hand, the CenterNet, EfficientDet, and DETR models demonstrate slower convergence speeds and achieve complete convergence in the middle to late stages. Additionally, the SSD, RetinaNet, DETR, EfficientDet, and CenterNet models show lower mAP performance. The GLU-YOLOv8 model in this research experiences significant fluctuations in mAP during the pre-training stage, stabilizing in the mid-late stage with higher mAP compared to the original YOLOv8 model, and achieving the highest mAP in the Scolytidae forestry pest data.
The confusion matrix provides a clear representation of the model’s prediction results and true labels, showcasing the classification performance in each category, including true positives, false positives, true negatives, and false negatives. This matrix offers crucial insights for a comprehensive evaluation of model performance. The confusion matrix for the GLU-YOLOv8 model for this dataset is depicted in Figure 16.
In order to enhance the use of GLU-YOLOv8 for pest detection, this study conducted target detection control experiments using the IP102 dataset. The dataset consists of 17,078 sample instances, with 15,370 samples in the training set and 1708 samples in the testing set. The same eight models from the previous study were utilized for the controlled experiments, ensuring consistency in experimental conditions. The results of the experiments are presented in Table 7.
Table 7 illustrates the superior performance of the GLU-YOLOv8 model in this study on the dataset, with multiple metric rankings at the top. The GLU-YOLOv8 model shows a 7.1% increase in mAP@0.50, compared to the original YOLOv8 model, signifying a substantial enhancement in accuracy. While RetinaNet displays better recognition performance on this dataset, its low FPS of 7.23 makes it unsuitable for routine pest detection tasks.
The GLU-YOLOv8 model in this study significantly surpasses YOLOv8 across various performance metrics. Specifically, GLU-YOLOv8 outperforms YOLOv8 by 7.1% and 5% on mAP@0.50 and mAP@0.50:0.95, respectively, indicating higher average accuracy. Additionally, GLU-YOLOv8 shows improvements of 10.1%, 2.6%, and 6.8% in Precision, Recall, and F1 metrics, underscoring its enhancements in prediction accuracy and target capture rate. These findings emphasize the superior performance of GLU-YOLOv8 in pest detection tasks, offering a more reliable solution for complex scenarios. Figure 17 showcases some of the results of the GLU-YOLOv8 model for detecting the dataset.
The IP102 target detection dataset exhibits an uneven sample distribution, long-tailed distribution, and large data volume, posing challenges for model convergence. The speed of the model convergence is a crucial metric for evaluating its performance. Therefore, it is important to closely monitor the convergence of the model in these experiments. Figure 18 illustrates the relationship between the loss of the experimental model and number of iterations. Since each model calculates loss differently, our focus is on the rate of decline in loss rather than the absolute value of the loss.
The GLU-YOLOv8 model introduced in this paper not only converges faster than the original YOLOv8 model but also maintains a faster convergence speed while achieving the highest mAP.
The heat map shows the model’s focus areas in an image, with shades indicating importance levels. Comparing these heat maps reveals the model’s accuracy in highlighting relevant information for each category. The heat map of the experiment is shown in Figure 19.

3.3. Image Classification Comparison Experiment

This subsection conducted comparative image classification experiments on the IP102 dataset to showcase the model’s proficiency in comprehending image content and accurately classifying it. GLU-YOLOv8 was compared with various models, including ResNet, SqueezeNet, and ShuffleNetV2. The performance evaluation of the models was performed using metrics such as Accuracy, Precision, Recall, F1, and FPS. All the models underwent training under identical experimental conditions. The experimental outcomes are presented in Table 8 and Figure 20.
The GLU-YOLOv8 model showcases remarkable performance in pest classification, achieving 66.9% and 88.0% on Top1 and Top5 accuracy, respectively, surpassing the YOLOv8 model by 3.4% and 1.4%. Comparatively, the GLU-YOLOv8 model demonstrates a slightly higher accuracy than the ShuffleNetV2, MobileNetV3, and ManasNet models, while significantly outperforming them in frames-per-second processing. Despite processing fewer frames per second than the YOLOv8 model, the GLU-YOLOv8 model still achieves a commendable speed of 126.58, showcasing a balance between speed and accuracy. Overall, the GLU-YOLOv8 model excels in both accuracy and processing speed, making it a viable option for real-time pest classification applications.

4. Discussion

Pests exhibit various characteristics, including color, shape, and structure. Current models face challenges in accurately detecting small agricultural and forestry pests, resulting in average accuracy in real-world detection scenarios. This paper introduces a new pest detection model, GLU-YOLOv8, based on the YOLOv8 model, which effectively identifies small pest targets.
To address YOLOv8′s limitation in detecting small pest targets, the model integrates CBAM and LSK attention mechanisms for enhanced pest recognition. This improvement, while slightly reducing the FPS, notably enhances accuracy. The CBAM mechanism captures feature correlations by adapting the channel and spatial attention weights, resulting in a 0.9% increase in mAP@0.50. Meanwhile, the LSK mechanism processes image features both horizontally and vertically, improving the model’s grasp of spatial relationships and increasing mAP@0.50 by 0.7%. Additionally, the model replaces the CONV block with the GLU-CONV block to incorporate local details, thereby achieving a 1.3% increase in mAP@0.50. Furthermore, a small-object detection layer is introduced to extract more pest features and boost detection accuracy, particularly for small pest targets. This addition significantly enhances mAP@0.50 (area = small) by 5.3%, without affecting the FPS.
Finally, we compare the performance of the GLU-YOLOv8 model with various object detection models for pest and disease detection tasks using Scolytidae forestry pest data and the IP102 dataset. The results demonstrate that the GLU-YOLOv8 model achieves impressive mAP@0.50 scores of 97.4% and 58.7% on the two datasets, surpassing the YOLOv8 model by 1.6% and 7.1%, respectively. Additionally, the model operates at 17.98 FPS and exhibits an 8.2% improvement in mAP@0.50 for small-target detection. When compared to multiple image classification models on the IP102 dataset for pest and disease identification, the GLU-YOLOv8 model attains Top1 accuracy of 66.9% and Top5 accuracy of 88.0%, outperforming the YOLOv8 model by 3.4% and 1.4%, respectively, at an FPS of 126.58. The experimental findings suggest that the GLU-YOLOv8 model maintains high recognition accuracy while meeting real-time requirements for pest detection, offering valuable insights for small-target detection and model optimization in similar pest and disease scenarios.
To address the long-tailed distribution problem present in the IP102 dataset, some solutions are needed to improve model training and performance. Pest samples with a smaller number of samples can be added, or resampling methods can be used to sample a smaller percentage of samples multiple times during the training process such that these data are used multiple times during training, which alleviates the long-tailed distribution problem and improves the recognition accuracy for rare categories.

5. Conclusions

Agricultural and forestry pests and diseases have a significant impact on crop yield and quality. However, current pest detection algorithms still face challenges, such as low accuracy and slow operation speed in detecting small targets. To address this issue, this paper introduces the GLU-YOLOv8 pest detection model based on YOLOv8. The model’s performance has been validated on the Scolytidae forestry pest data and IP102 dataset. Our model incorporates the SIOU loss function to enhance stability and convergence speed, along with LSK and CBAM attention mechanisms to improve pest identification accuracy. While there has been a slight reduction in FPS, the model has demonstrated a notable enhancement in pest recognition accuracy. Furthermore, we introduced a new GLU-CONV convolution block to enhance the model’s perceptual and generalization capabilities without compromising performance, enabling better adaptation to the complex data distribution of pests. To enhance the detection accuracy of small-target pests and prevent the loss of detailed features due to downsampling, a small-object detection layer with a size of 160 × 160 has been added.
In order to demonstrate the effectiveness of the model proposed in this paper, we have conducted comparative experiments between the GLU-YOLOv8 model and other widely used models. The results of these experiments indicate that our model is capable of real-time pest detection and holds significant value for pest detection. In practical applications, pests may have been densely distributed, leading to the accumulation of insect bodies and mutual occlusion, thus increasing the difficulty of identification. To address this challenge, future research should explore more advanced modules or algorithms to enhance the detection performance and frame rate of the model in complex scenes. For instance, incorporating target segmentation techniques has helped in segmenting stacked and occluded pests to further enhance detection accuracy. Subsequent studies have also prioritized improvements in the computational speed of the model. Apart from ensuring high accuracy, enhancing inference speed is crucial to better support the real-time requirements of pest detection tasks.

Author Contributions

Methodology, G.Y. and Y.L.; resources, G.Y. and L.L.; software, G.Y. and T.N.; writing, G.Y.; format calibration, M.D., Z.W. and L.A. All authors have read and agreed to the published version of the manuscript.

Funding

This research received no external funding.

Data Availability Statement

The original data presented in this study are openly available at DOI: 10.26949/d.cnki.gblyu.2018.000148 [34] and DOI: 10.1109/CVPR.2019.00899 [35].

Conflicts of Interest

The authors declare no conflicts of interest.

References

  1. Dang, Y.Q.; Wang, X.Y.; Yang, Z.Q.; Zhang, Y.Q. Research progress on the biological control of forest insect pests in China. For. Pest Dis. 2022, 41, 6–13. [Google Scholar]
  2. Goodsman, D.W.; Grosklos, G.; Aukema, B.H.; Whitehouse, C.; Bleiker, K.P.; McDowell, N.G.; Middleton, R.S.; Xu, C.G. The effect of warmer winters on the demography of an outbreak insect is hidden by intraspecific competition. Glob. Chang. Biol. 2018, 24, 3620–3628. [Google Scholar] [CrossRef] [PubMed]
  3. Gao, Y.L.; Reitz, S.R. Emerging Themes in Our Understanding of Species Displacements. Annu. Rev. Entomol. 2017, 62, 165–183. [Google Scholar] [CrossRef] [PubMed]
  4. Jiang, T.Y.; Chen, S. A Lightweight Forest Pest Image Recognition Model Based on Improved YOLOv8. Appl. Sci. 2024, 14, 1941. [Google Scholar] [CrossRef]
  5. Cai, Q.; Sun, B.; Zhang, X.; Bo, W.; Wang, G.; Zhou, Z. Forest Biological Disaster Control Behaviors of Forest Farmers and Their Spatial Heterogeneity in China. Forests 2024, 15, 970. [Google Scholar] [CrossRef]
  6. Zhang, J.Z.; Cong, S.J.; Zhang, G.; Ma, Y.J.; Zhang, Y.; Huang, J.P. Detecting Pest-Infested Forest Damage through Multispectral Satellite Imagery and Improved UNet plus. Sensors 2022, 22, 7440. [Google Scholar] [CrossRef]
  7. Zhang, Y.; Song, C.L.; Zhang, D.W. Deep Learning-Based Object Detection Improvement for Tomato Disease. IEEE Access 2020, 8, 56607–56614. [Google Scholar] [CrossRef]
  8. Yang, Y.L.; Wang, X.L. Recognition of bird nests on transmission lines based on YOLOv5 and DETR using small samples. Energy Rep. 2023, 9, 6219–6226. [Google Scholar] [CrossRef]
  9. Zhu, X.Y.; Chen, F.J.; Zhang, X.W.; Zheng, Y.L.; Peng, X.D.; Chen, C. Detection the maturity of multi-cultivar olive fruit in orchard environments based on Olive-EfficientDet. Sci. Hortic. 2024, 324, 112607. [Google Scholar] [CrossRef]
  10. Liang, D.; Liu, W.; Zhao, L.; Zong, S.; Luo, Y. An Improved Convolutional Neural Network for Plant Disease Detection Using Unmanned Aerial Vehicle Images. Nat. Environ. Pollut. Technol. 2022, 21, 899–908. [Google Scholar] [CrossRef]
  11. Li, J.B.; Li, C.C.; Fei, S.P.; Ma, C.Y.; Chen, W.N.; Ding, F.; Wang, Y.L.; Li, Y.C.; Shi, J.J.; Xiao, Z. Wheat Ear Recognition Based on RetinaNet and Transfer Learning. Sensors 2021, 21, 4845. [Google Scholar] [CrossRef] [PubMed]
  12. Aamir, S.M. Real-Time Object Detection in Occluded Environment with Background Cluttering Effects Using Deep Learning. arXiv 2024, arXiv:2401.00986. [Google Scholar]
  13. Li, C. YOLOv6 v3.0: A Full-Scale Reloading. arXiv 2023, arXiv:2301.05586. [Google Scholar]
  14. Hussain, M. YOLO-v1 to YOLO-v8, the Rise of YOLO and Its Complementary Nature toward Digital Manufacturing and Industrial Defect Detection. Machines 2023, 11, 677. [Google Scholar] [CrossRef]
  15. Liu, Z.; Zhang, G.; Yang, H.; Sun, M.; Dang, H.; Zhou, X. Application of Object Detection Algorithm in Identification of Rice Weevils and Maize Weevils. In Proceedings of the 2018 2nd International Conference on Deep Learning Technologies, Chongqing, China, 27–29 June 2018; pp. 76–80. [Google Scholar]
  16. Li, R.; Wang, R.J.; Xie, C.J.; Liu, L.; Zhang, J.; Wang, F.Y.; Liu, W.C. A coarse-to-fine network for aphid recognition and detection in the field. Biosystens Eng. 2019, 187, 39–52. [Google Scholar] [CrossRef]
  17. Wang, T.W.; Zhao, L.G.; Li, B.H.; Liu, X.W.; Xu, W.K.; Li, J. Recognition and counting of typical apple pests based on deep learning. Ecol. Inform. 2022, 68, 101556. [Google Scholar] [CrossRef]
  18. Liu, L.; Wang, R.J.; Xie, C.J.; Yang, P.; Wang, F.Y.; Sudirman, S.; Liu, W.C. PestNet: An End-to-End Deep Learning Approach for Large-Scale Multi-Class Pest Detection and Classification. IEEE Access 2019, 7, 45301–45312. [Google Scholar] [CrossRef]
  19. Sun, Y.; Liu, X.X.; Yuan, M.S.; Ren, L.L.; Wang, J.X.; Chen, Z.B. Automatic in-trap pest detection using deep learning for pheromone-based monitoring. Biosyst. Eng. 2018, 176, 140–150. [Google Scholar] [CrossRef]
  20. Jiao, L.; Dong, S.F.; Zhang, S.Y.; Xie, C.J.; Wang, H.Q. AF-RCNN: An anchor-free convolutional neural network for multi-categories agricultural pest detection. Comput. Electron. Agric. 2020, 174, 105522. [Google Scholar] [CrossRef]
  21. Chen, J.W.; Lin, W.J.; Cheng, H.J.; Hung, C.L.; Lin, C.Y.; Chen, S.P. A Smartphone-Based Application for Scale Pest Detection Using Multiple-Object Detection Methods. Electronics 2021, 10, 372. [Google Scholar] [CrossRef]
  22. Fuentes, A.; Yoon, S.; Kim, S.C.; Park, D.S. A Robust Deep-Learning-Based Detector for Real-Time Tomato Plant Diseases and Pests Recognition. Sensors 2017, 17, 2022. [Google Scholar] [CrossRef] [PubMed]
  23. Zha, M.; Qian, W.; Yi, W.; Hua, J. A Lightweight YOLOv4-Based Forestry Pest Detection Method Using Coordinate Attention and Feature Fusion. Entropy 2021, 23, 1587. [Google Scholar] [CrossRef] [PubMed]
  24. Yang, S.; Xing, Z.Y.; Wang, H.B.; Dong, X.R.; Gao, X.; Liu, Z.; Zhang, X.D.; Li, S.M.; Zhao, Y.Y. Maize-YOLO: A New High-Precision and Real-Time Method for Maize Pest Detection. Insects 2023, 14, 278. [Google Scholar] [CrossRef]
  25. Tian, Y.N.; Wang, S.H.; Li, E.; Yang, G.D.; Liang, Z.Z.; Tan, M. MD-YOLO: Multi-scale Dense YOLO for small target pest detection. Comput. Electron. Agric. 2023, 213, 108233. [Google Scholar] [CrossRef]
  26. Ahmad, I.; Yang, Y.Y.; Yue, Y.; Ye, C.; Hassan, M.; Cheng, X.; Wu, Y.Z.; Zhang, Y.H. Deep Learning Based Detector YOLOv5 for Identifying Insect Pests. Appl. Sci. 2022, 12, 10167. [Google Scholar] [CrossRef]
  27. Liu, J.; Wang, X.W. Tomato Diseases and Pests Detection Based on Improved Yolo V3 Convolutional Neural Network. Front. Plant Sci. 2020, 11, 898. [Google Scholar] [CrossRef]
  28. Tan, L.; Lu, J.; Jiang, H. Tomato Leaf Diseases Classification Based on Leaf Images: A Comparison between Classical Machine Learning and Deep Learning Methods. AgriEngineering 2021, 3, 542–558. [Google Scholar] [CrossRef]
  29. Ren, F.J.; Liu, W.J.; Wu, G.Q. Feature Reuse Residual Networks for Insect Pest Recognition. IEEE Access 2019, 7, 122758–122768. [Google Scholar] [CrossRef]
  30. Liu, W.; Wu, G.; Ren, F.; Kang, X. DFF-ResNet: An insect pest recognition model based on residual networks. Big Data Min. Anal. 2020, 3, 300–310. [Google Scholar] [CrossRef]
  31. Reza, M.T.; Mehedi, N.; Tasneem, N.A.; Alam, M.A. Identification of crop consuming insect pest from visual imagery using transfer learning and data augmentation on deep neural network. In Proceedings of the 2019 22nd International Conference on Computer and Information Technology, Dhaka, Bangladesh, 18–20 December 2019; pp. 1–6. [Google Scholar]
  32. Yang, G.L.; Wang, J.X.; Nie, Z.L.; Yang, H.; Yu, S.Y. A Lightweight YOLOv8 Tomato Detection Algorithm Combining Feature Enhancement and Attention. Agronomy 2023, 13, 1824. [Google Scholar] [CrossRef]
  33. Wang, X.; Gao, H.; Jia, Z.; Li, Z. BL-YOLOv8: An Improved Road Defect Detection Model Based on YOLOv8. Sensors 2023, 23, 8361. [Google Scholar] [CrossRef]
  34. Zuo, Y.Z. Pest Recognition System Based on Deep Learning; Beijing Forestry University: Beijing, China, 2020; pp. 26–32. [Google Scholar]
  35. Nanni, L.; Maguolo, G.; Pancino, F. Insect pest image detection and recognition based on bio-inspired methods. arXiv 2020, arXiv:1910.00296. [Google Scholar] [CrossRef]
Figure 1. The Scolytidae forestry pest data. (a) natural light, no alcohol, crowded, (b) hit light, no alcohol, sparse.
Forests 15 01486 g001
Figure 2. Sample IP102 dataset. (a) Field Crop pests and (b) economic crop pests.
Forests 15 01486 g002
Figure 3. Classification of the IP102 dataset. “FC” and “EC” denote Field Crops and Economy Crops. At the subclass level in the figure, only 33 subclasses are shown.
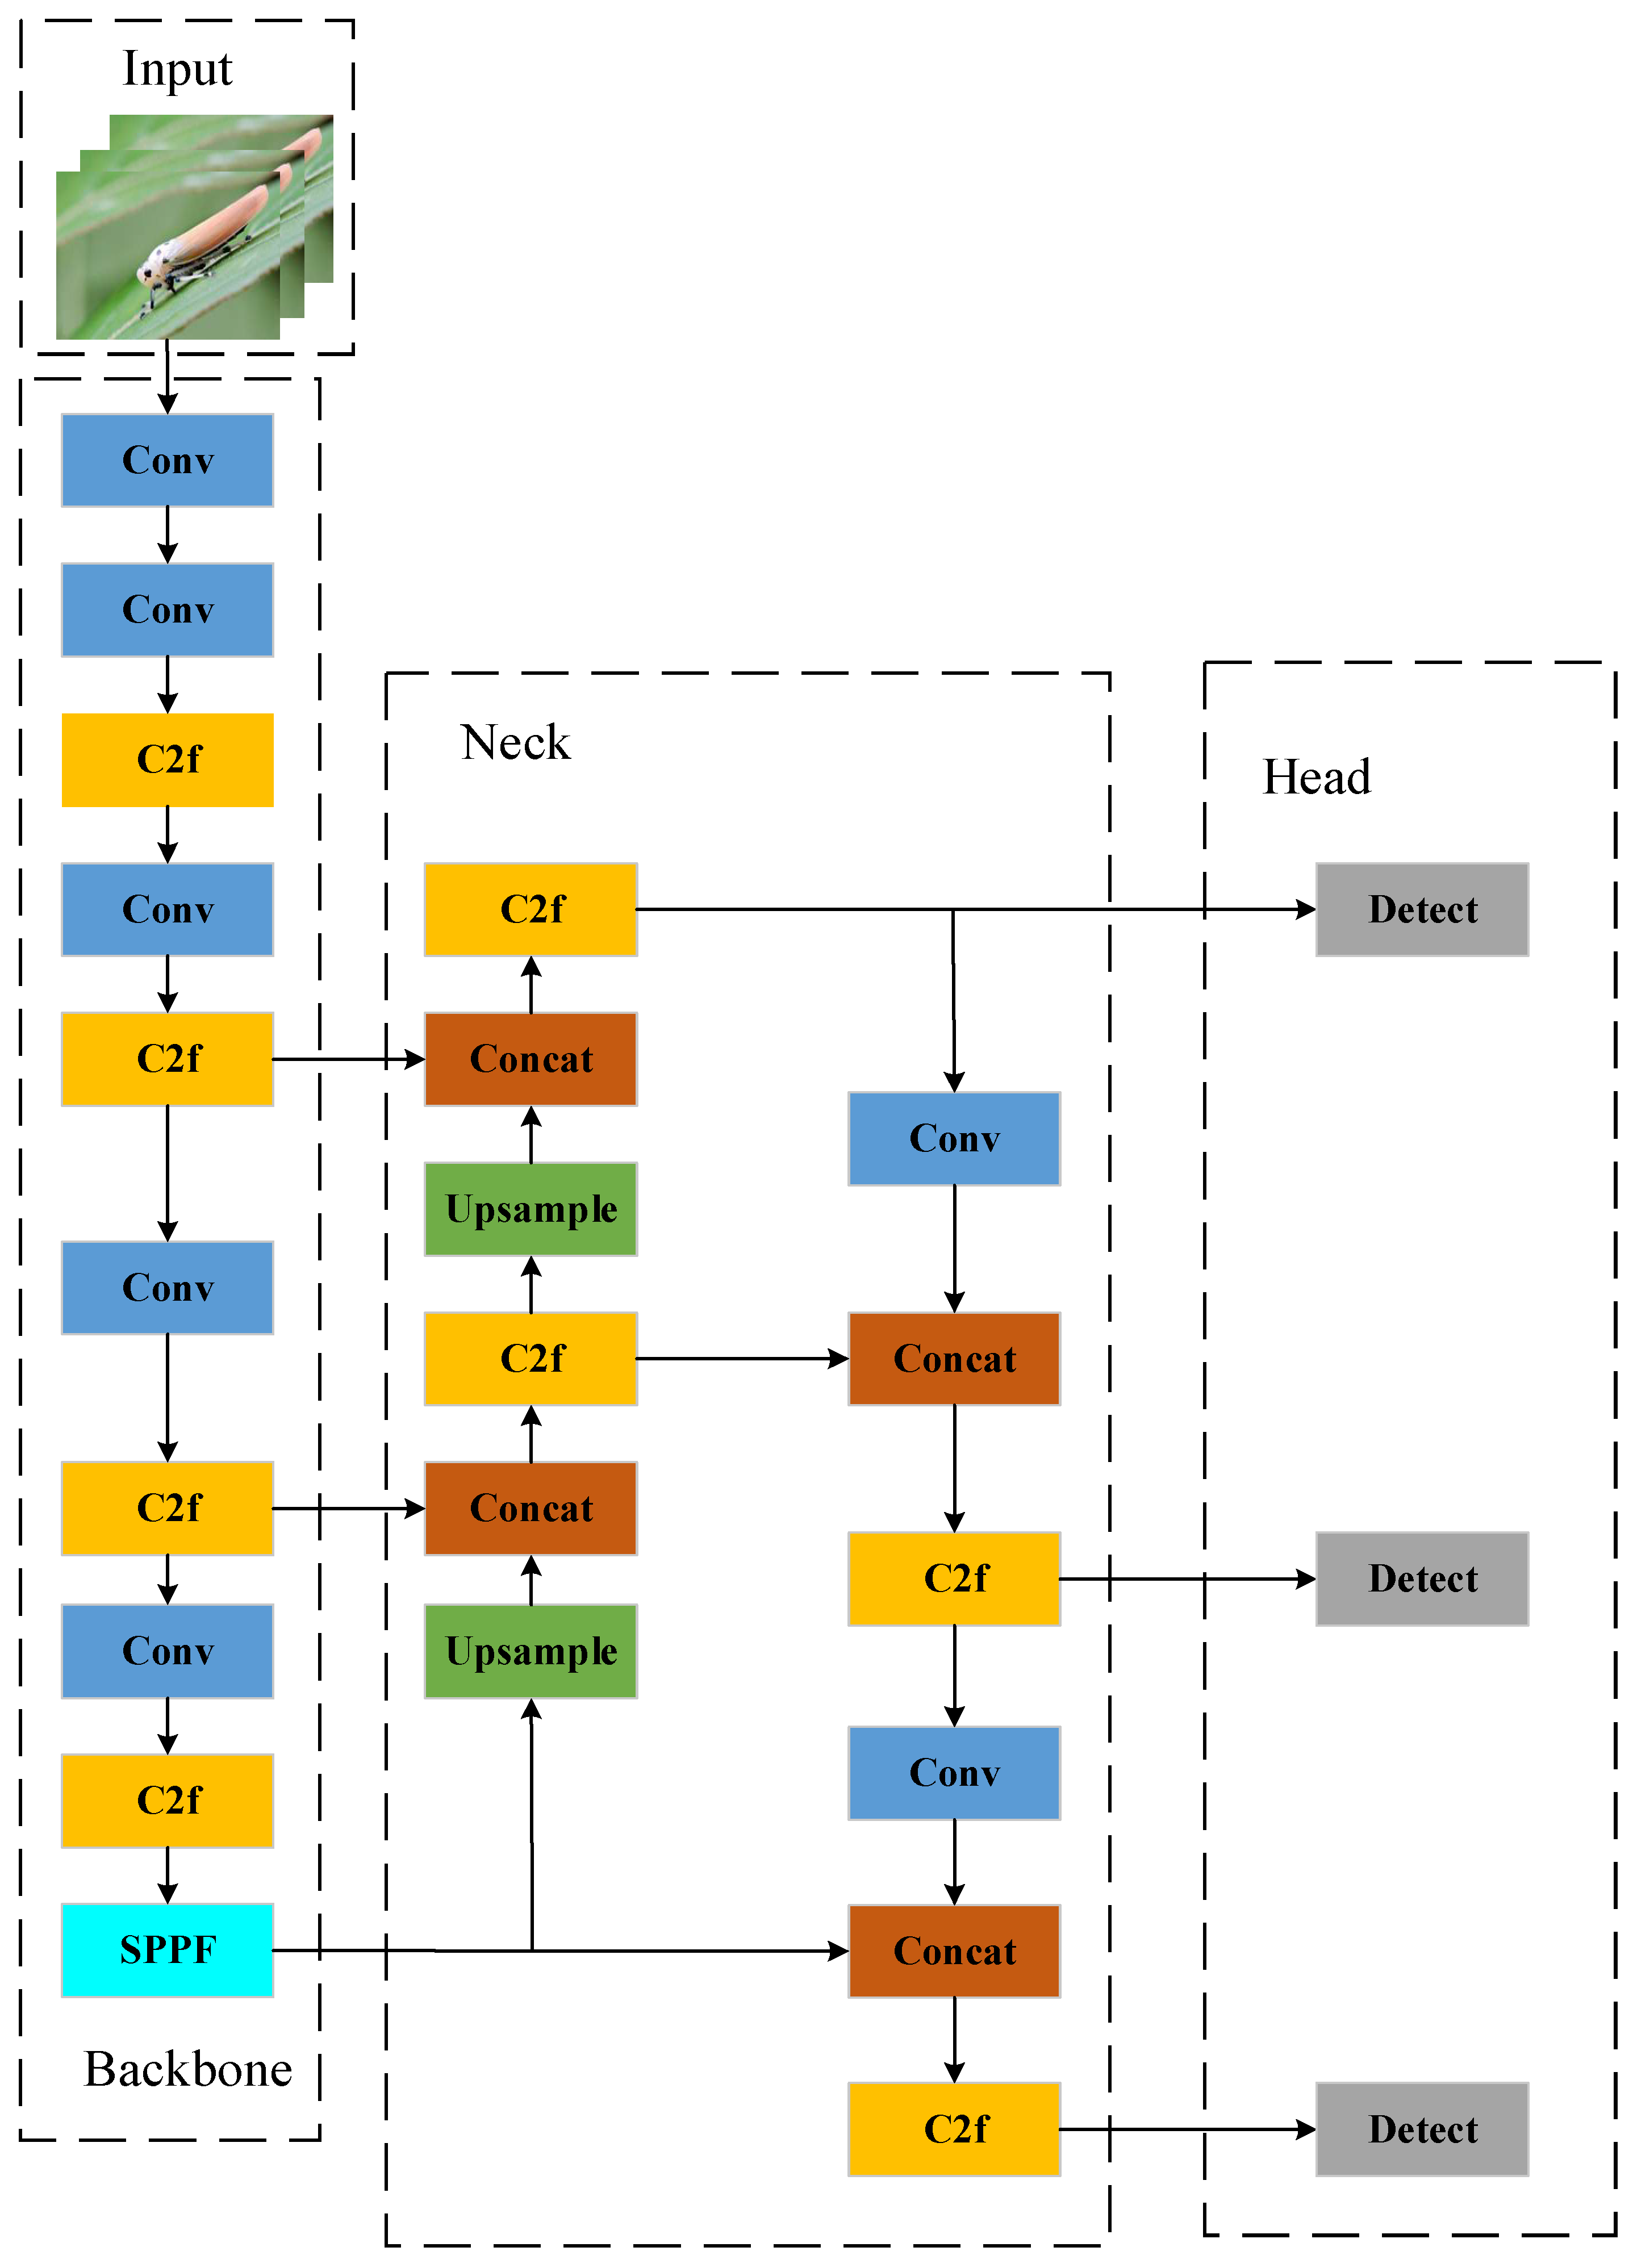
Forests 15 01486 g003
Figure 4. YOLOv8 model structure.
Forests 15 01486 g004
Figure 5. GLU-YOLOv8 model structure.
Forests 15 01486 g005
Figure 6. Calculation of the SIOU loss function.
Forests 15 01486 g006
Figure 7. CBAM Attention Structure.
Forests 15 01486 g007
Figure 8. LSK attention structure.
Forests 15 01486 g008
Figure 9. EMA Attention Structure.
Forests 15 01486 g009
Figure 10. GLU-CONV convolutional block structure.
Forests 15 01486 g010
Figure 11. Activation Function. GELU is smooth near zero, which benefits the gradient continuity and flow. In contrast, RELU is nondifferentiable at zero, potentially causing instability during optimization. Tanh and Sigmoid have sharply diminishing gradients near their extremities, which can also lead to inefficient optimization. The non-saturation and smoothing nature of GELU make it easier to avoid the problem of vanishing or exploding gradients during training, and helps the model converge faster.
Forests 15 01486 g011
Figure 12. Improved Neck structural form. The numbers in the figure indicate the number of layers in which the module is located, where Detect is the last detection layer.
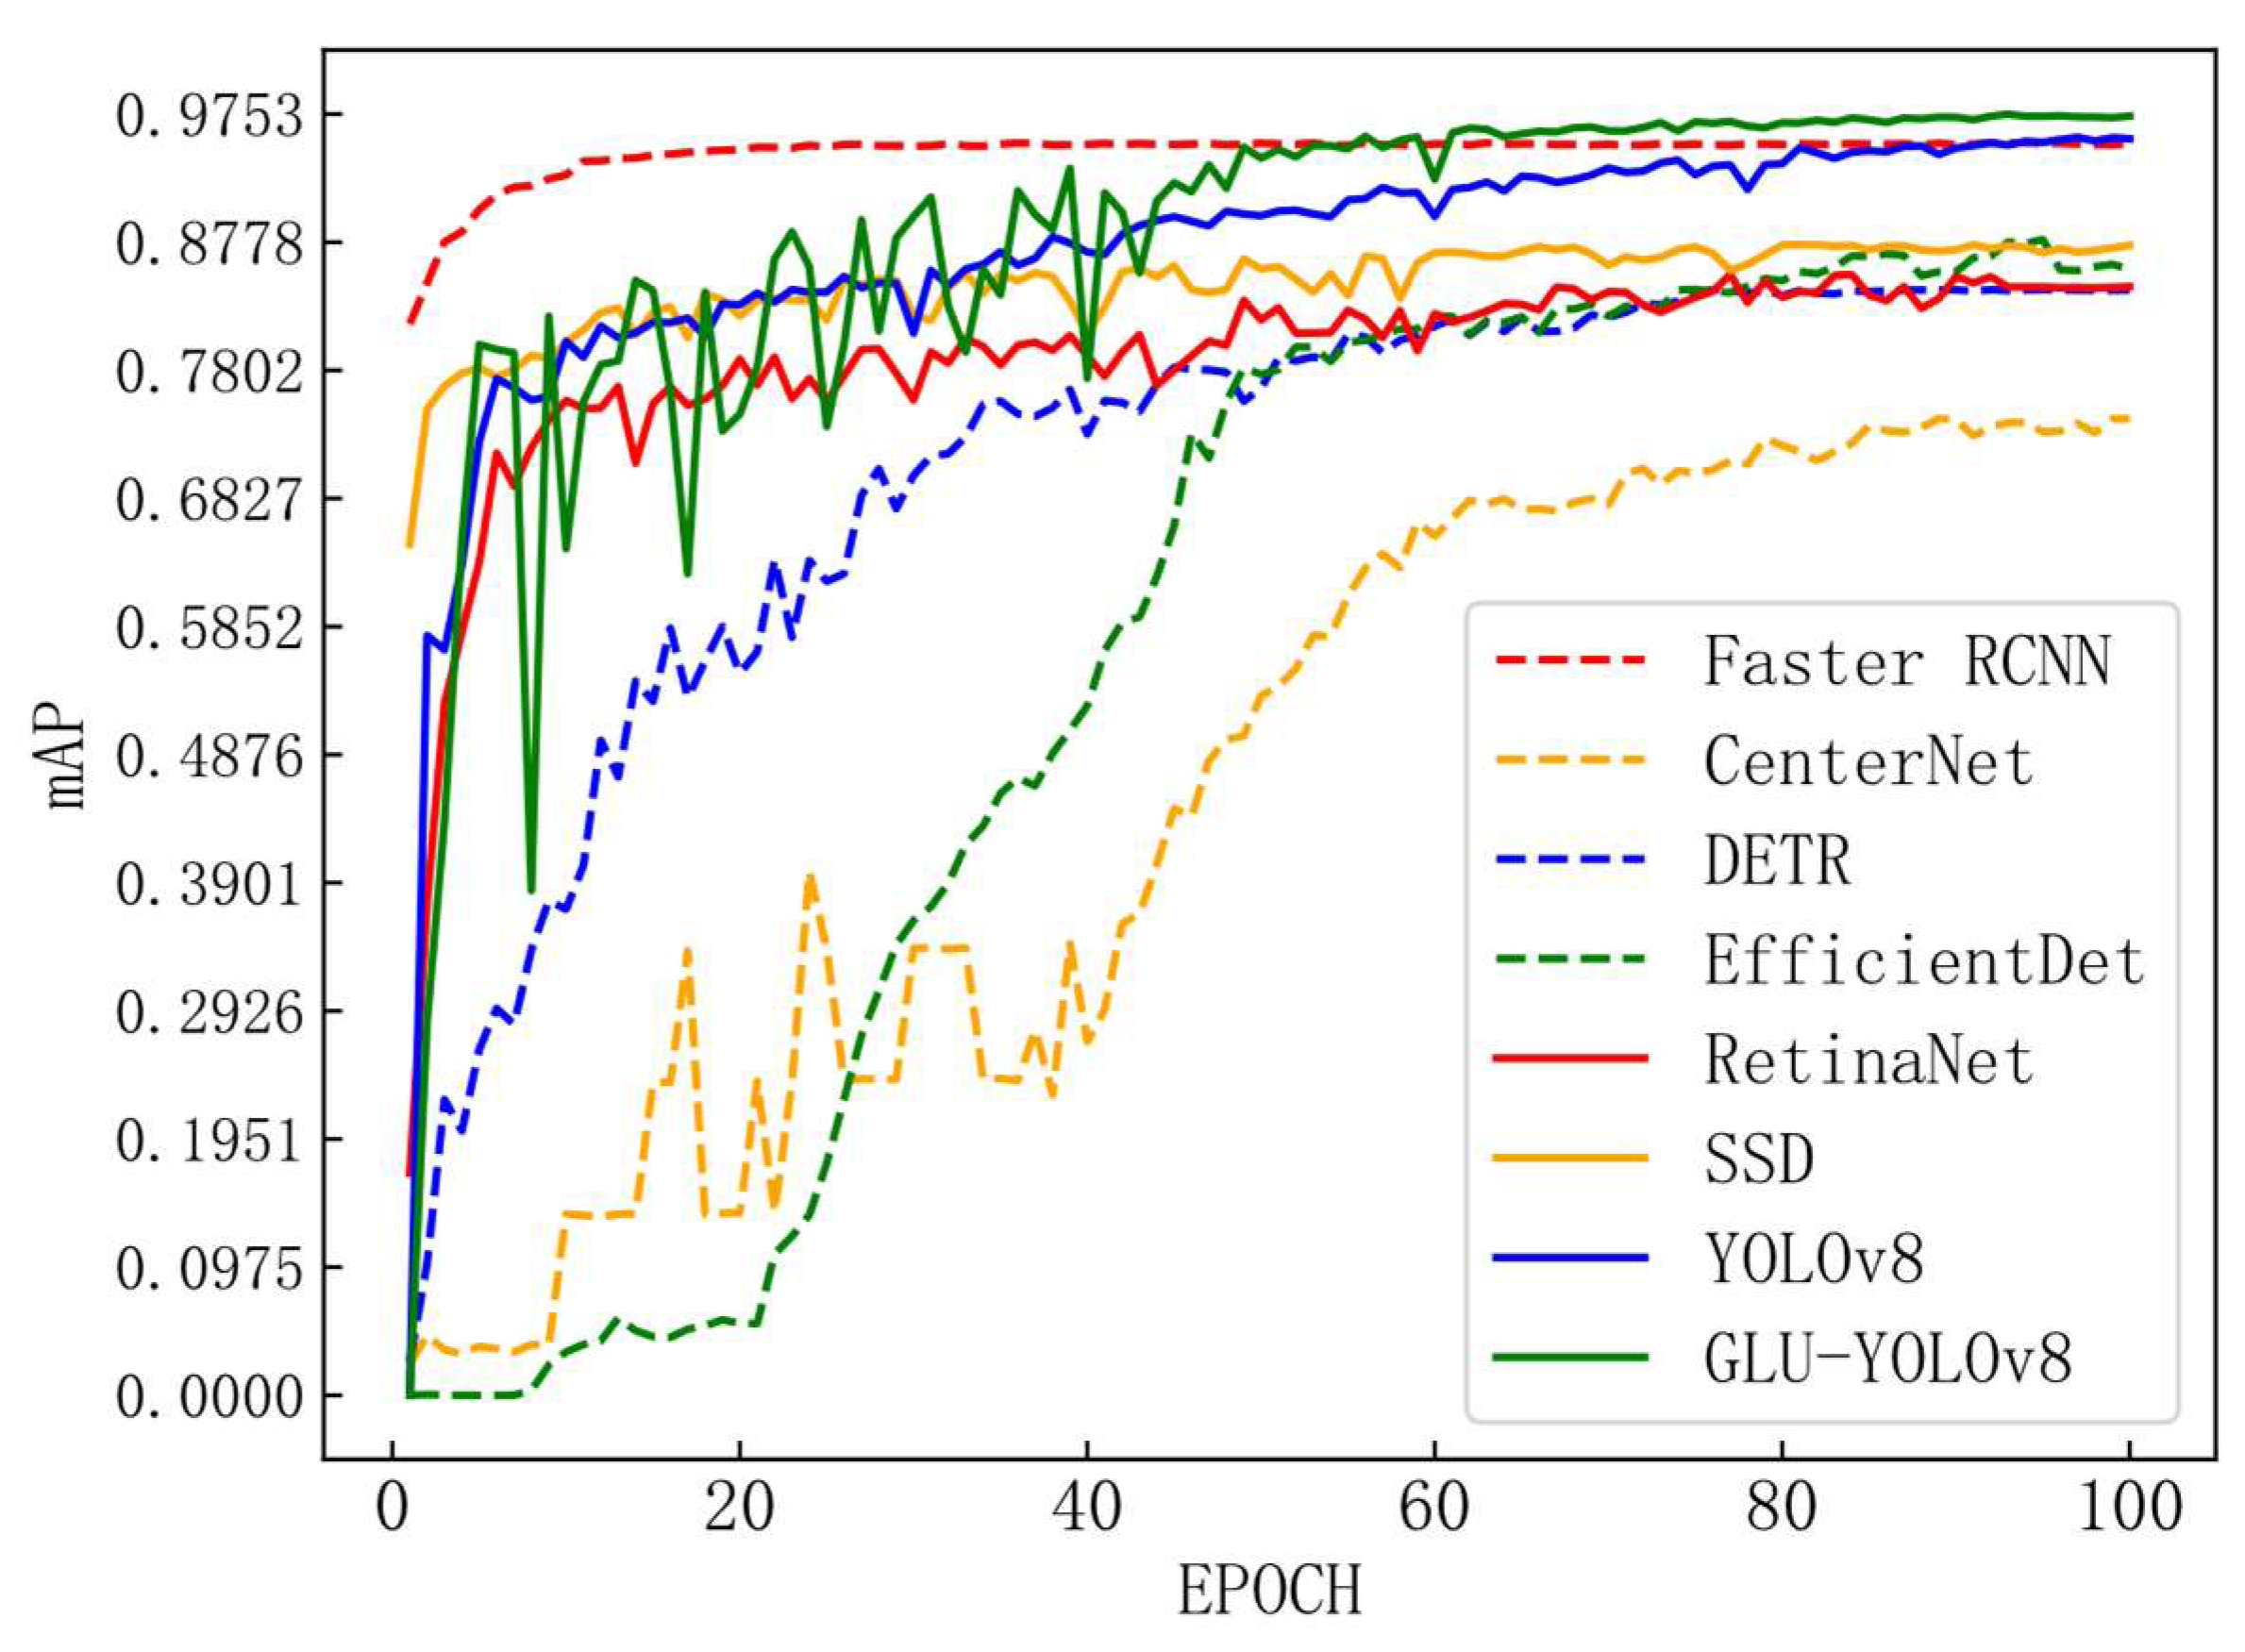
Forests 15 01486 g012
Figure 13. mAP, and iteration number variation chart.
Forests 15 01486 g013
Figure 14. Detection plots for the ablation experiment. Two representative photos (a,b) in the dataset exhibit different light sources and sparse conditions. Thermogram photos (c), (e), and (d), (f) correspond to (a) and (b), respectively. Thermograms (c,d) belong to the original YOLOv8 model, while (e,f) belong to the GLU-YOLOv8 model. The comparison reveals that the model proposed in this paper places greater emphasis on the lower body of the pest during decision-making. Moreover, the model demonstrates a more focused ability to extract features of the pest’s trunk compared to the original YOLOv8 model, which prioritizes detailed features of the lower limbs.
Forests 15 01486 g014
Figure 15. mAP, and iteration number variation chart.
Forests 15 01486 g015
Figure 16. GLU-YOLOv8 model confusion matrix. The model effectively identifies six types of pests with excellent overall performance. However, it shows a slight weakness in distinguishing between Coleoptera and Acuminatus, leading to potential misjudgment. In contrast, the model excels in identifying the remaining four types of pests. Future work should focus on addressing these shortcomings and enhancing the model’s ability to differentiate between Coleoptera and Acuminatus.
Forests 15 01486 g016
Figure 17. IP102 dataset detection map.
Forests 15 01486 g017
Figure 18. Loss and iteration number variation chart.
Forests 15 01486 g018
Figure 19. The heat map. (a) shows the original image, (b) shows the recognition heat map of the YOLOv8 model, (c) shows the recognition heat map of the GLU-YOLOv8 model. A comparison between (b,c) reveals that the red area in (c) is more intense and concentrated, indicating that the model proposed in this study exhibits enhanced focus and stronger feature extraction capabilities.
Forests 15 01486 g019
Figure 20. The histogram of model classification results. The GLU-YOLOv8 model excels in image classification, particularly in terms of high accuracy and overall performance. Compared to the other models, GLU-YOLOv8 demonstrates the highest accuracy, surpassing the performance of the comparison models. Additionally, GLU-YOLOv8 remains competitive in precision, recall, and F1 metrics, showcasing a balanced performance across various dimensions.
Forests 15 01486 g020
Table 1. Statistics of insect instances in the Scolytidae forestry dataset.
NameNumberTrainTest
Leconte27112493218
Boerner18591682177
Linnaeus19531759194
Armandi19321737195
Coleoptera21631934229
Acuminatus11301021109
Table 2. Number of samples in the IP102 dataset.
SuperclassClassTrainTestIR
FCRice14504333741.5
FCCorn13840456111.5
FCWheat9204813701.5
FCBeet8264917711.5
FCAlfalfa13623041601.5
ECVitis1610,52570261.5
ECCitrus19435629171.5
ECMango10584038981.5
IP102FC5724,37416,2861.5
EC4520,72113,8411.5
IP10210245,09530,1271.5
Train/Test denotes an Imbalance Ratio (IR). Class denotes the number of subclasses of the corresponding superclass. FC and EC denote Field Crop and Economy Crops, respectively.
Table 3. Experimental parameter settings.
ParameterValueParameterValue
EPOCH100Input size640 × 640
Initial learning0.01Momentum0.9
Learning rate decay rate0.5Weight decay0.0001
Learning rate decay period10OptimizerSGD
Table 4. Structure of the ablation experiment model.
ModelSIOUCBAMGLU-CONVLSKSODL
YOLOv8×××××
Model A××××
Model B×××
Model C××
Model D×
GLU-YOLOv8
Table 5. Ablation experiment model detection results.
ModelmAP@0.50mAP@0.50
(Area = Small)
mAP@0.5:0.95PrecisionRecallF1FPS
YOLOv895.7%83.2%74.9%91.2%91.2%0.91120.34
Model A95.8%83.4%74.8%91.1%91.0%0.90520.12
Model B96.1%84.3%77.1%92.8%91.6%0.92029.07
Model C96.9%85.6%78.9%94.9%94.0%0.94418.72
Model D97.1%86.3%78.5%94.5%94.8%0.94617.92
GLU-YOLOv897.4%91.6%81.2%95.8%94.1%0.94917.24
Table 6. Comparison of experimental model detection results.
ModelmAP@0.50PrecisionRecallF1FPS
Faster RCNN95.2%87.1%78.3%0.8234.54
CenterNet74.4%91.7%79.9%0.69512.34
DETR84.2%79.1%88.7%0.83021.43
EfficientDet89.1%97.2%76.2%0.81324.32
RetinaNet85.3%91.7%78.5%0.8458.73
SSD87.5%77.7%73.7%0.75611.45
YOLOv895.8%91.1%91.0%0.90520.12
GLU-YOLOv897.4%95.8%94.1%0.94917.24
Table 7. Experimental model detection results.
ModelmAP@0.50mAP@0.50:0.95PrecisionRecallF1FPS
Faster RCNN49.2%26.7%41.5%44.6%0.4304.74
CenterNet51.0%30.5%32.0%44.7%0.37512.12
DETR34.9%21.1%22.8%39.3%0.28720.47
EfficientDet54.9%30.3%52.8%50.7%0.51722.45
RetinaNet56.6%34.3%37.3%47.9%0.4197.23
SSD44.7%25.6%43.0%44.9%0.43911.45
YOLOv851.6%32.9%46.2%56.7%0.50919.34
GLU-YOLOv858.7%37.9%56.3%59.3%0.57717.98
Table 8. Comparison of experimental model classification results.
ModelAccuracy (Top1)Accuracy (Top5)FPS
ResNet60.1%81.1%110.66
SqueezeNet50.0%75.2%65.49
ShuffleNetV263.9%84.4%97.87
MobileNetV362.9%83.0%56.97
ManasNet65.6%84.6%58.82
GhostNet60.1%81.9%45.77
EfficientNetV260.9%81.3%55.76
ConvMixer60.8%81.0%82.20
DPN61.4%81.6%84.33
YOLOv863.5%86.6%243.90
GLU-YOLOv866.9%88.0%126.58
Disclaimer/Publisher’s Note: The statements, opinions and data contained in all publications are solely those of the individual author(s) and contributor(s) and not of MDPI and/or the editor(s). MDPI and/or the editor(s) disclaim responsibility for any injury to people or property resulting from any ideas, methods, instructions or products referred to in the content.

