
A New Paradigm for Assessing Detailed Dynamics of Forest Landscape Fragmentation


Abstract
1. Introduction
2. Materials and Methods
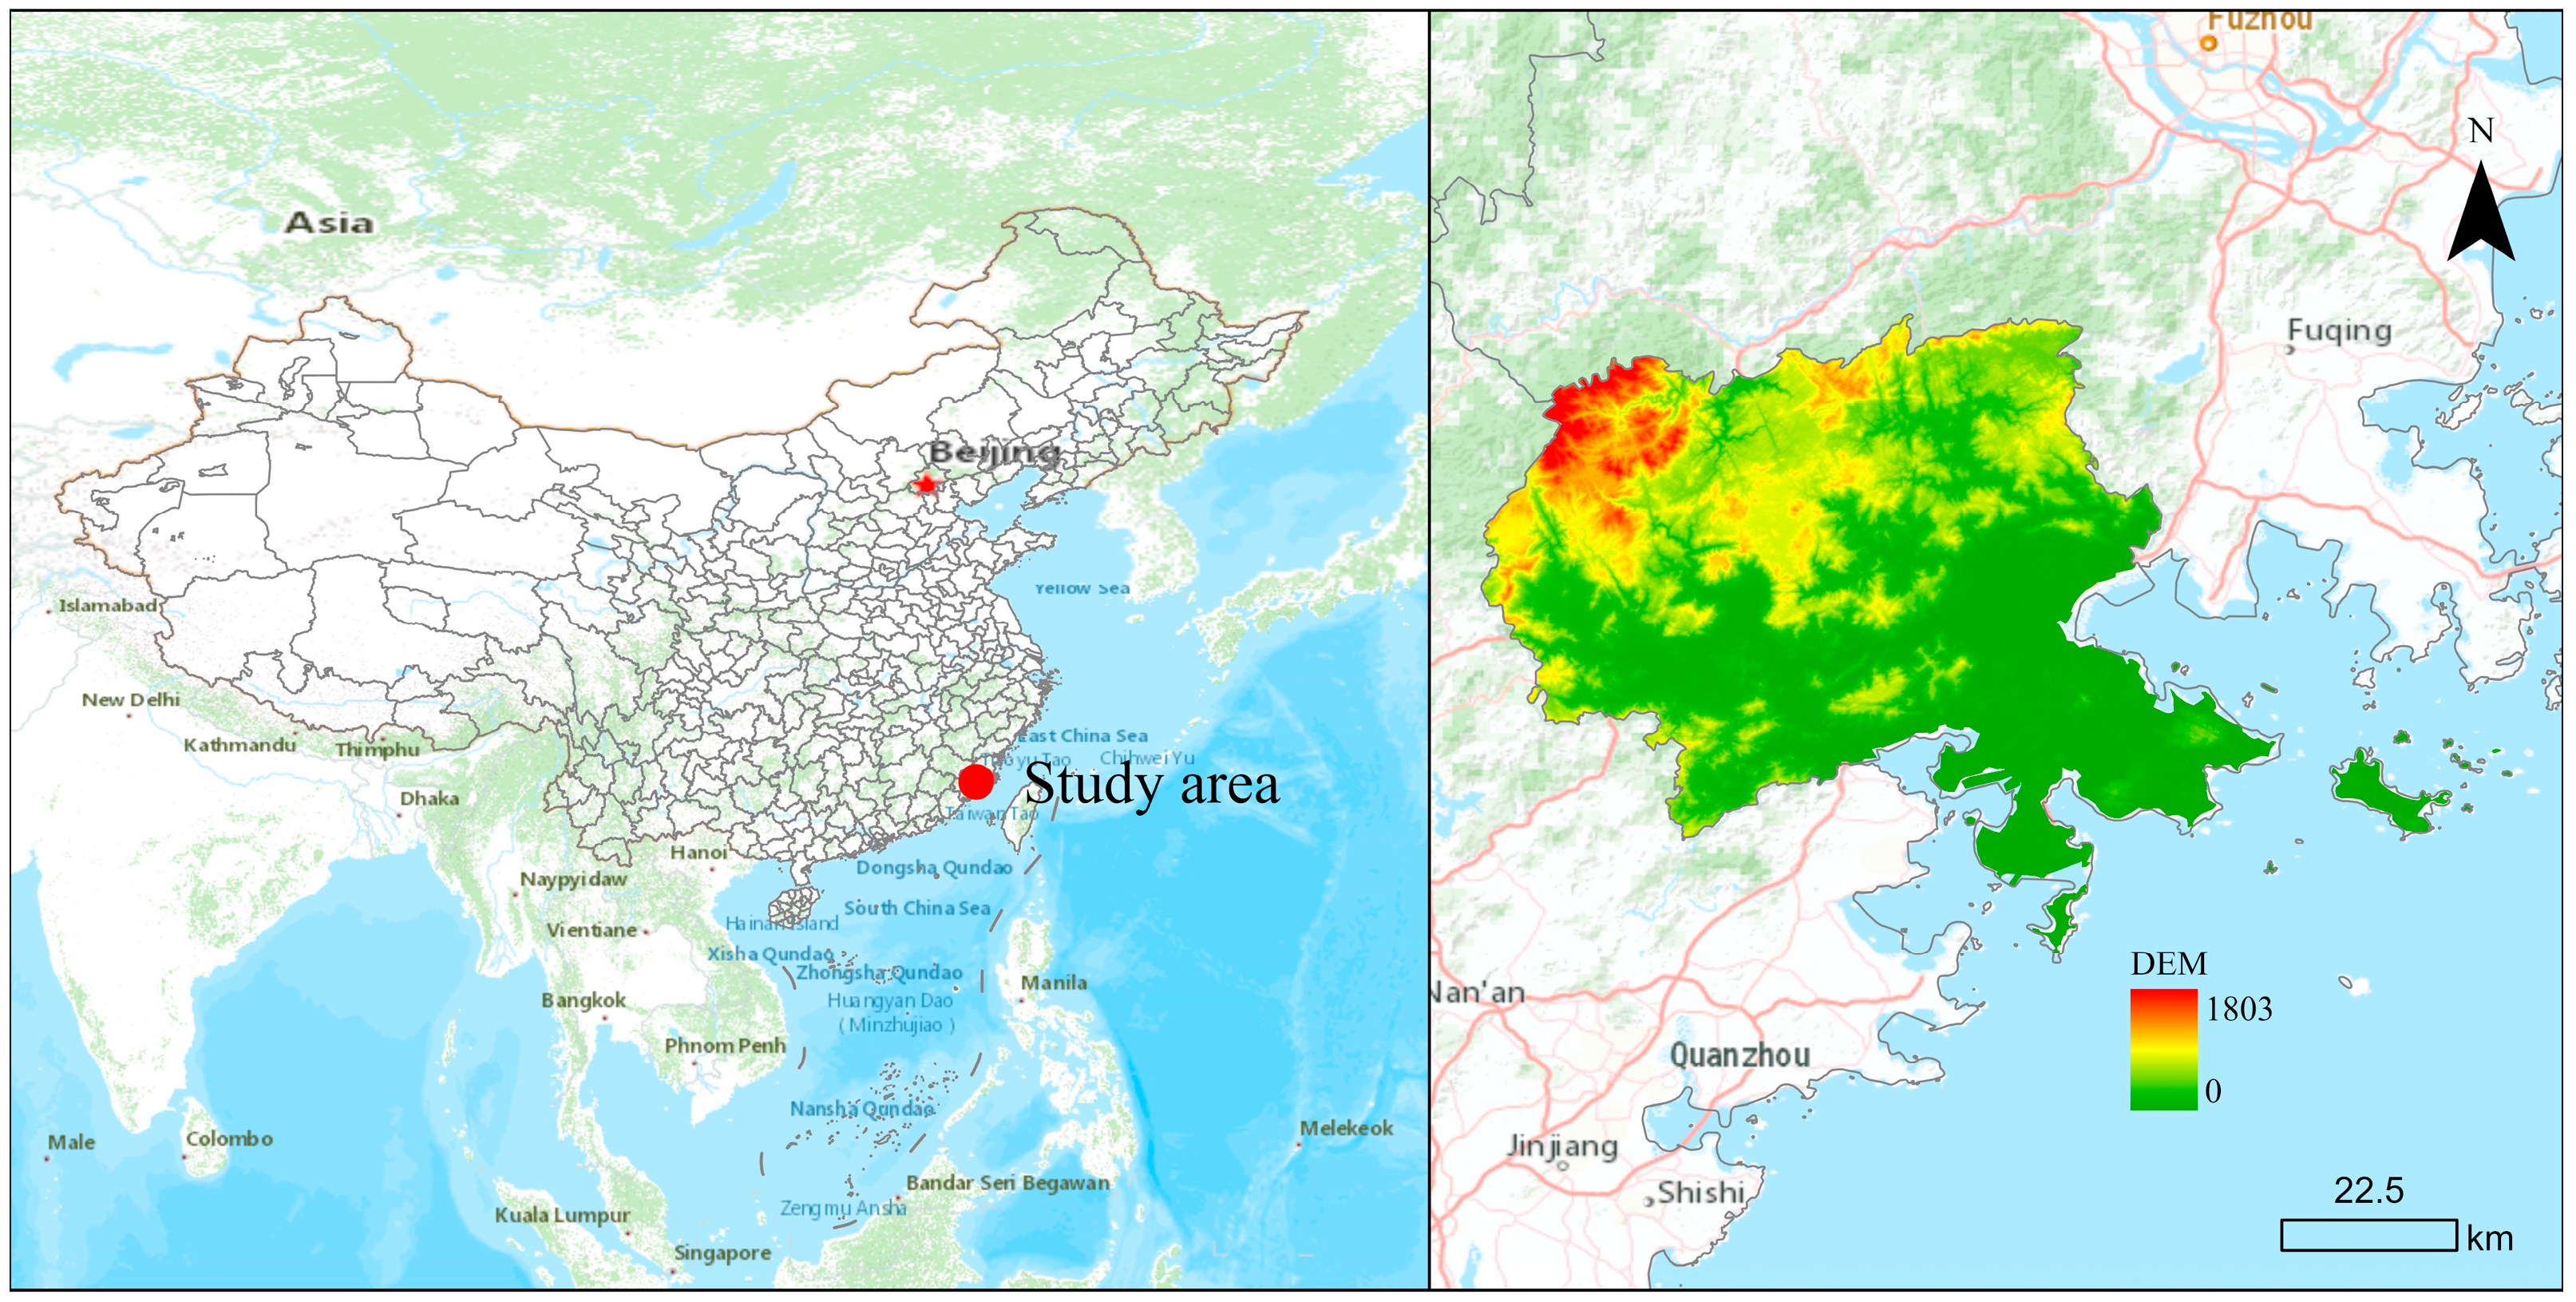
2.1. Study Area
2.2. Data Sources and Processing
2.2.1. Land Use Data
2.2.2. Driving Factor Data
2.3. Calculation of Forest Landscape Fragmentation Comprehensive Index
2.3.1. Selection of Landscape Metrics
2.3.2. Synthesis of Forest Landscape Fragmentation Comprehensive Index
2.4. Bivariate Spatial Autocorrelation Analysis
2.5. Machine Learning Algorithms
3. Results
3.1. Spatial Distribution in Static and Dynamic Forest Landscape Fragmentation
3.2. Spatial Coupling Modes of Forest Landscape Fragmentation Processes
3.3. Impact Factors of Forest Landscape Fragmentation Processes
4. Discussion
4.1. Forest Landscape Fragmentation Process
4.2. Driving Patterns of Forest Landscape Fragmentation Process
4.3. Variability in Random Forest Models
5. Conclusions
- (1)
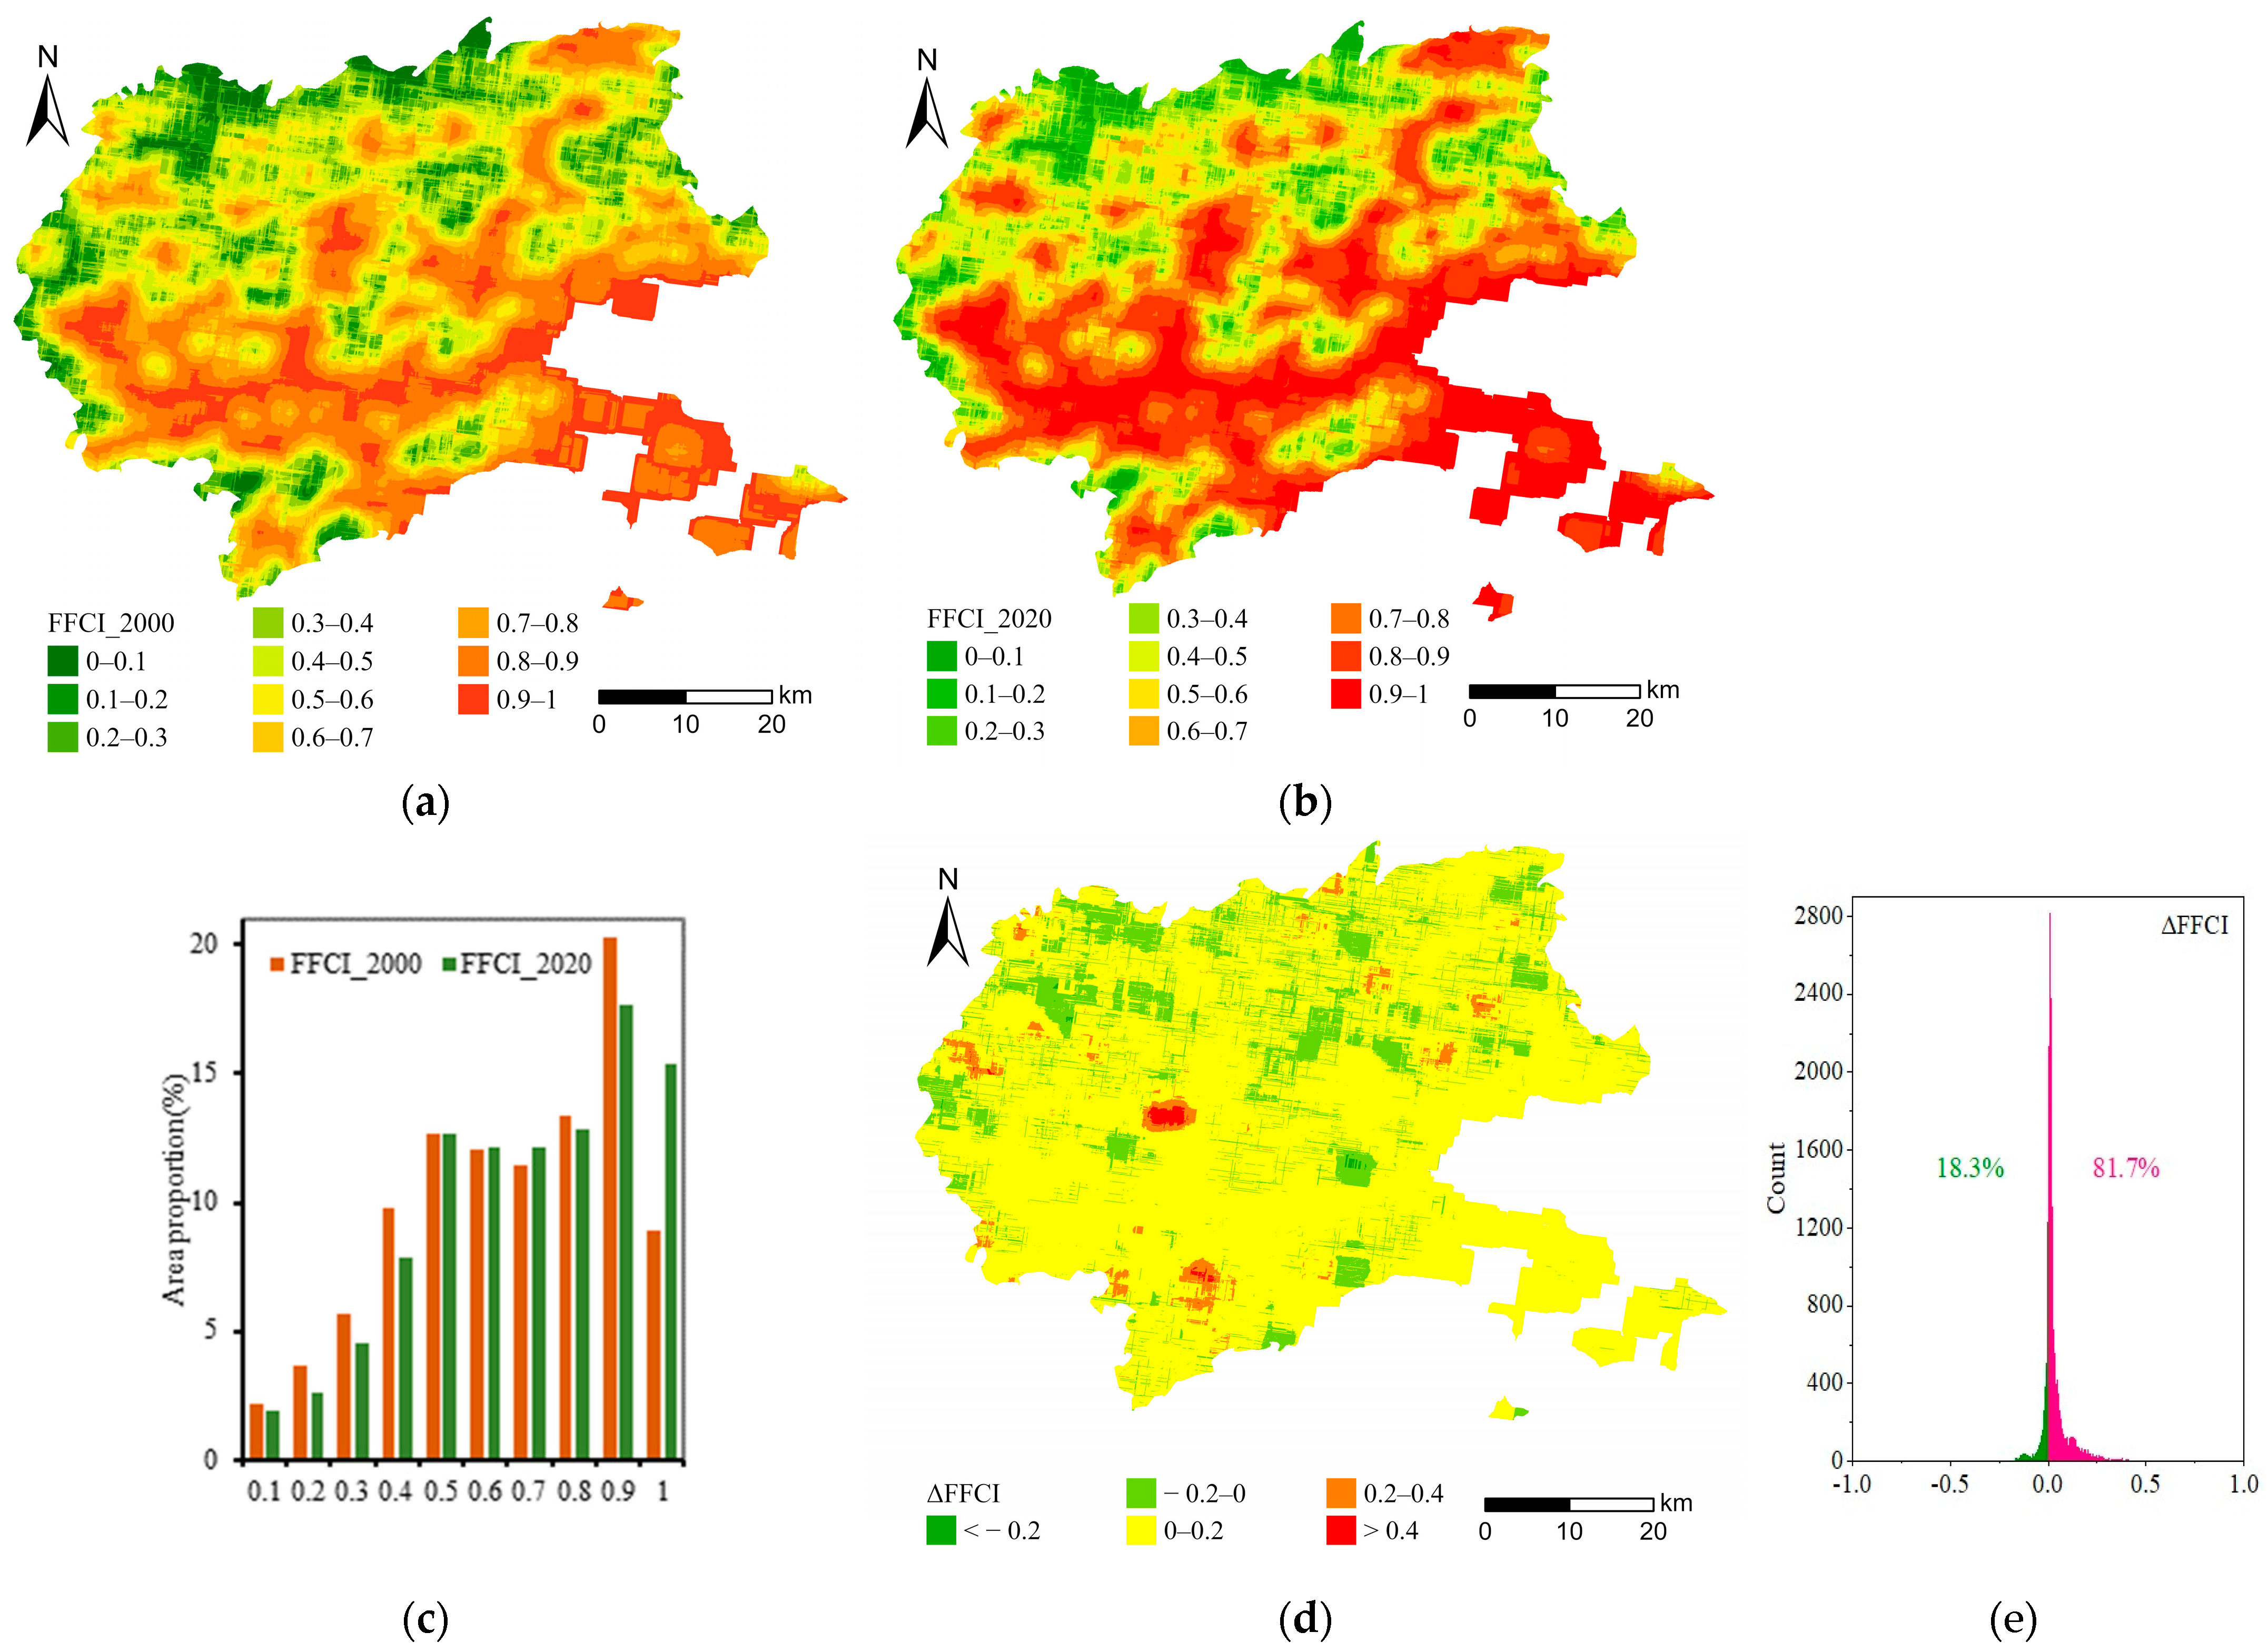
- The forest landscapes with different degrees of fragmentation exhibited more noticeable changes at both ends, with the intermediate level remaining consistent from 2000 to 2020. Around 18.3% of forest landscapes experienced a decrease in fragmentation, particularly in the northern part of the study area, while approximately 81.7% of forest landscapes exhibited an increasing trend in fragmentation. In most study regions during 2000–2020, fragmentation remained relatively stable (−0.2 < ΔFFCI < 0.2).
- (2)
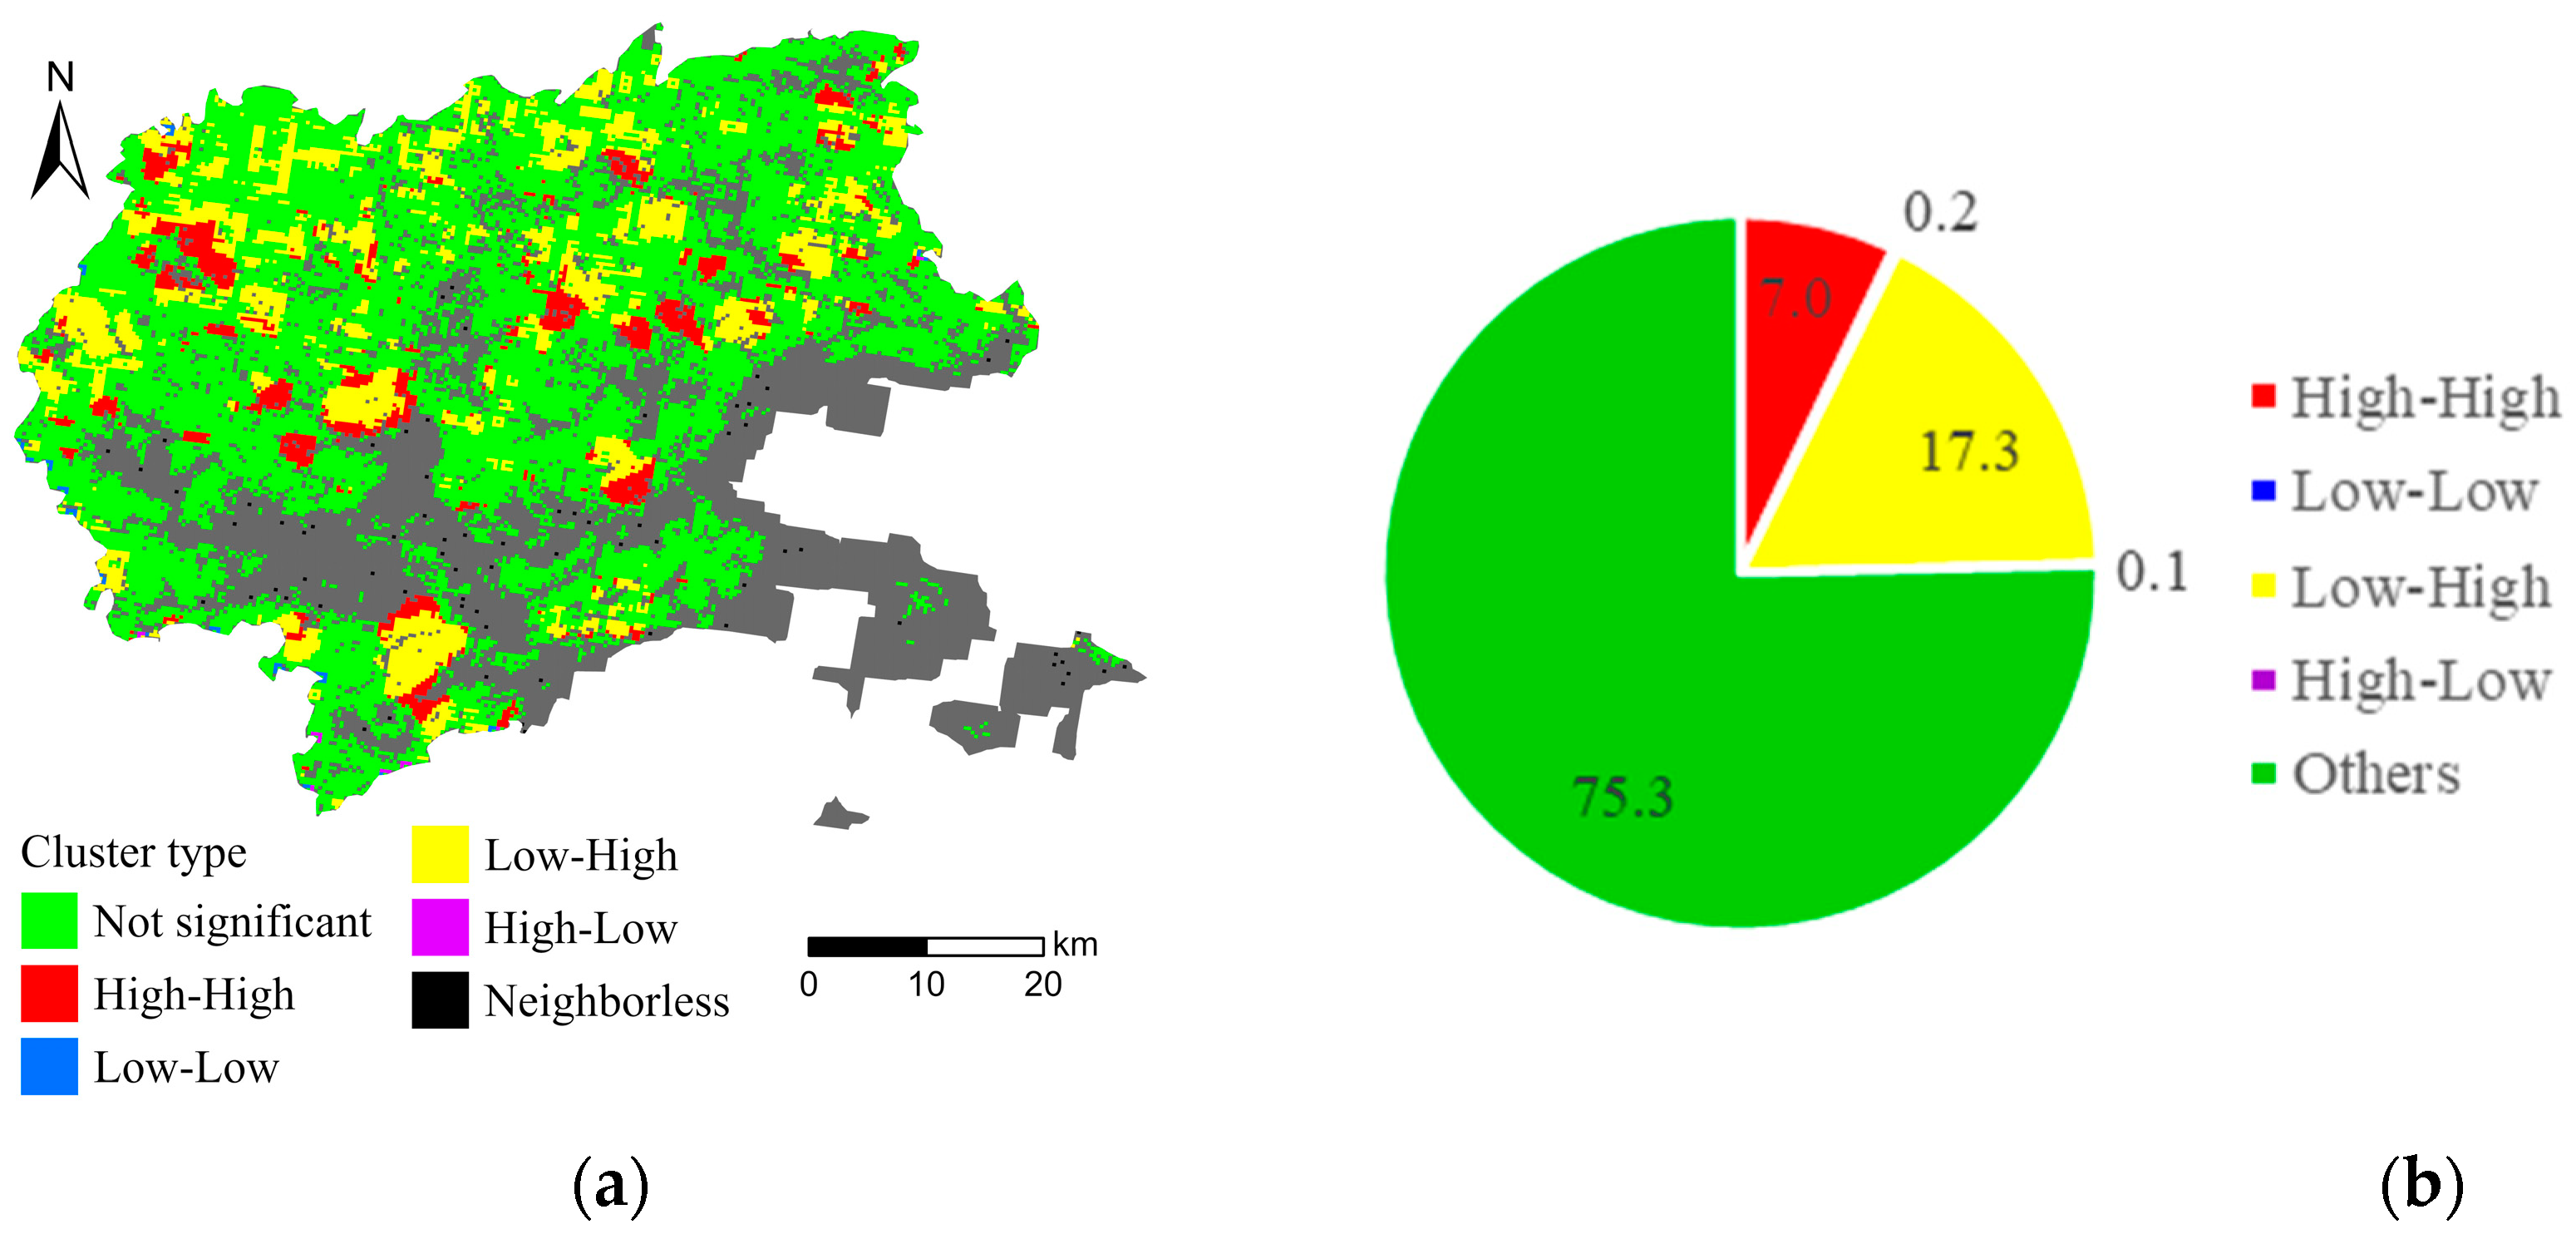
- The bivariate spatial autocorrelation analysis indicated that the proportion of Low–High-type grids was the highest, at 17.3%, followed by the High–High type at 7.0%.
- (3)
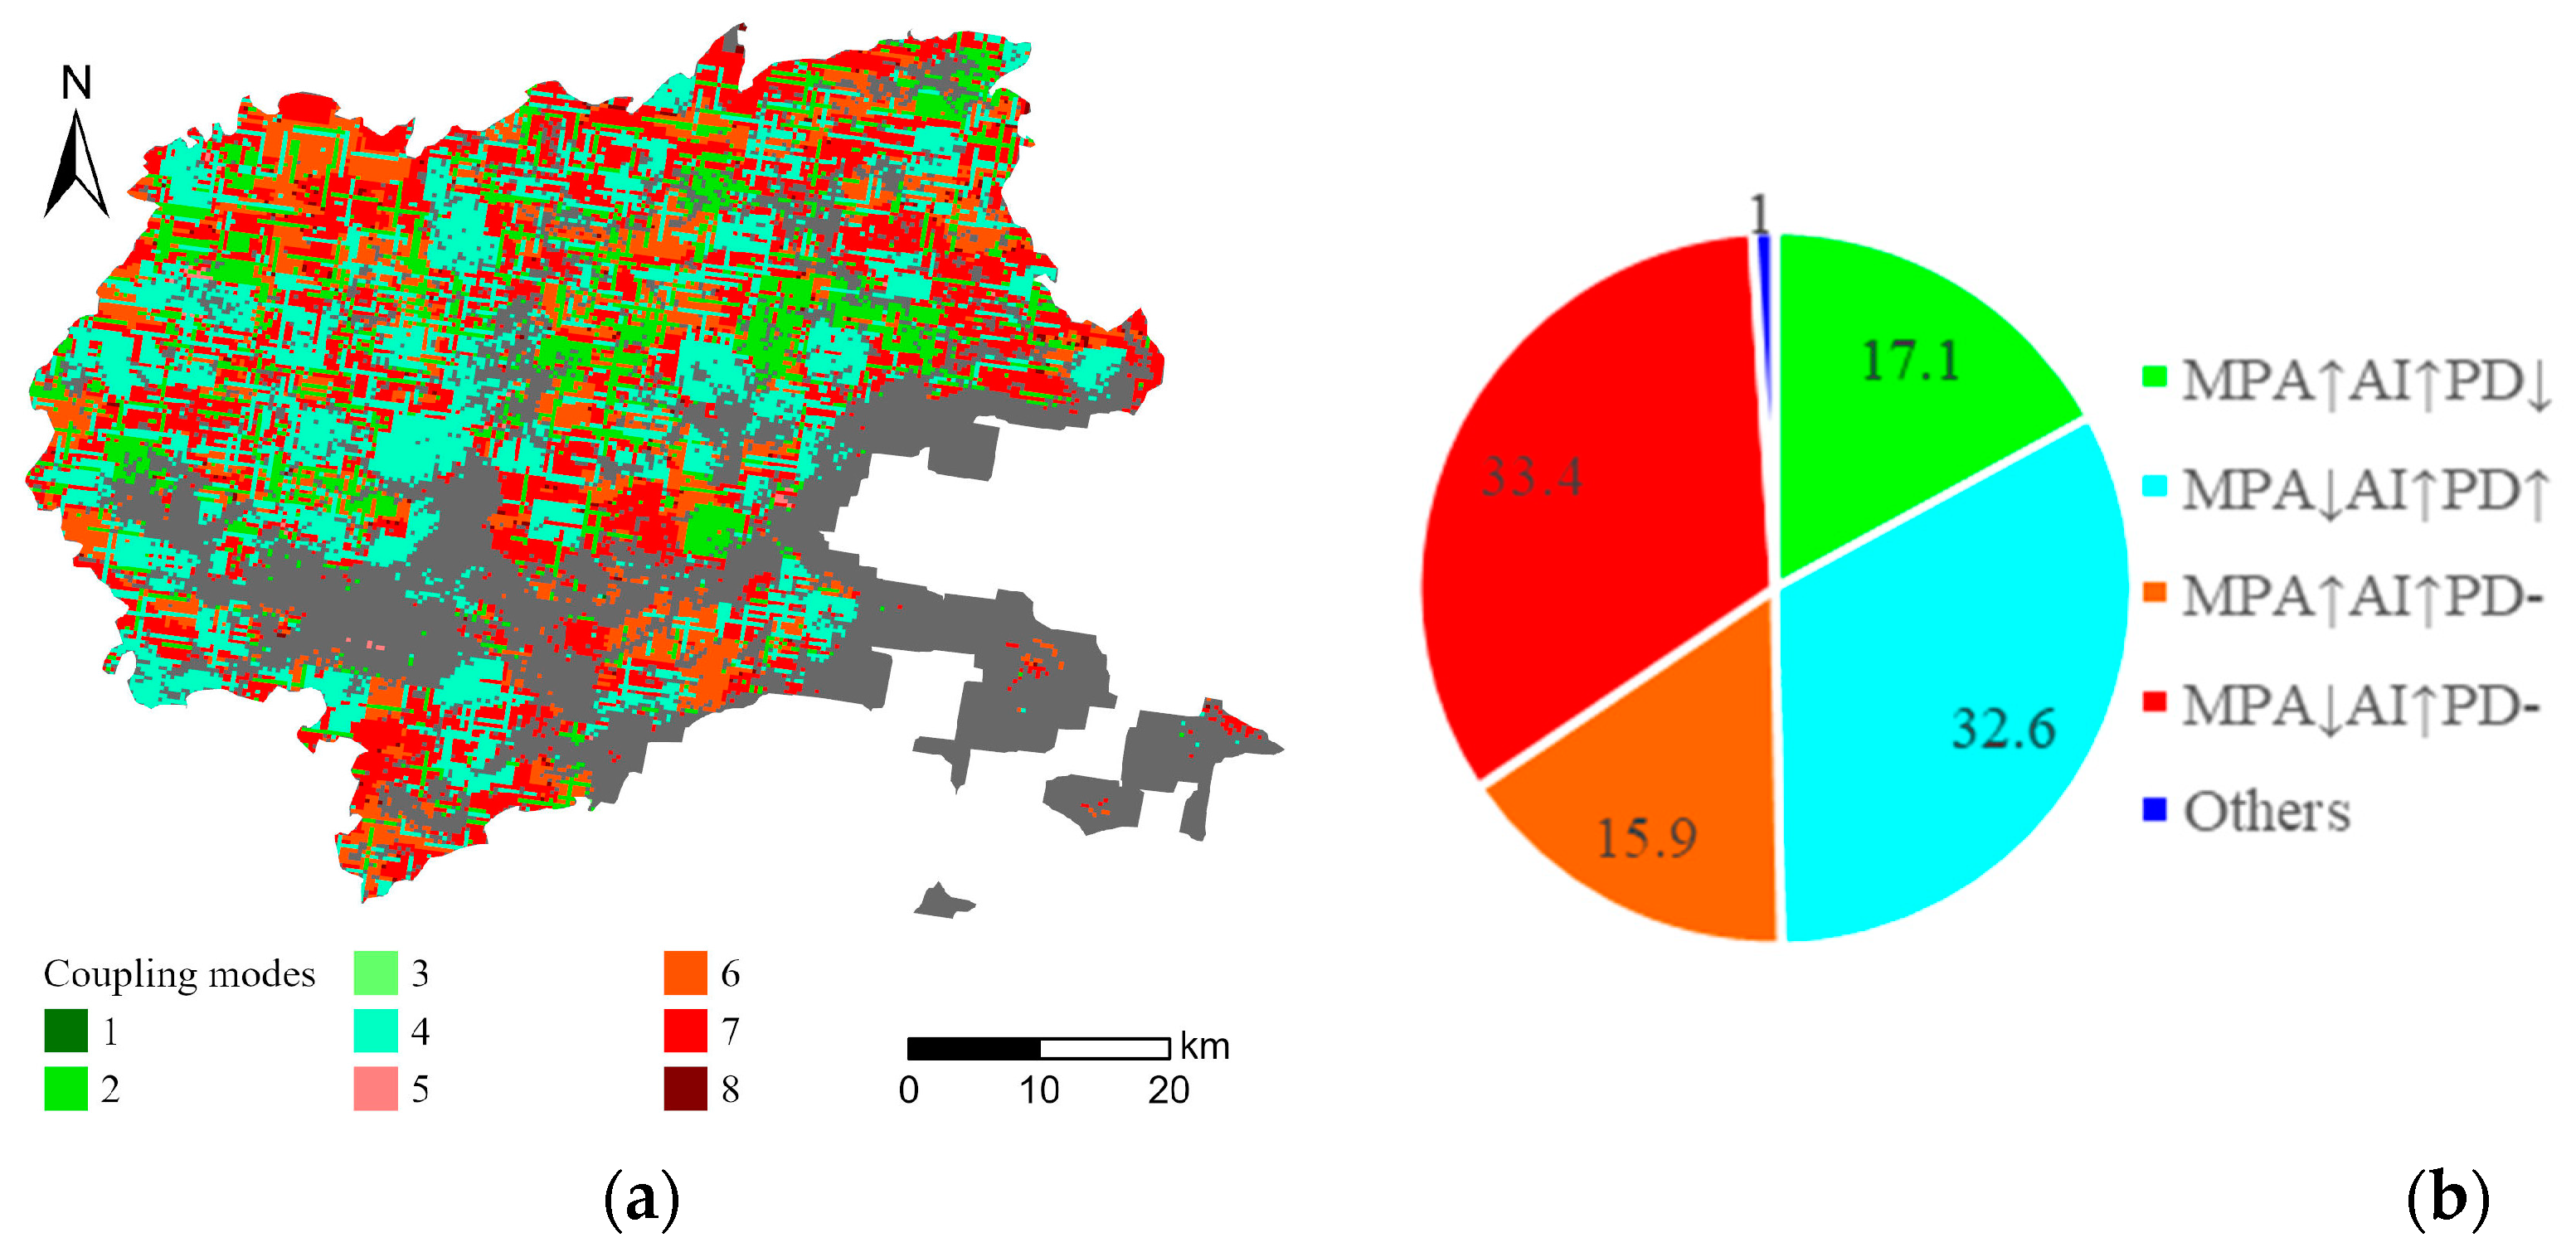
- We also identified eight modes of fragmentation that indicate that the most significant forest landscape fragmentation pattern is a decrease in MPA and an increase in PD. The mode MPA↓AI↑PD- was one of the most prevalent and widely distributed patterns across the study area, accounting for 33.4% of the total area. It was followed by the mode MPA↓AI↑PD↑, which represented 32.6% of the area and was primarily found at the non-forest edges. Other modes, such as MPA↑AI↑PD↓ and MPA↑AI↑PD-, accounted for 17.1% and 15.9% of the area, respectively, and were predominantly concentrated in the central forest region.
- (4)
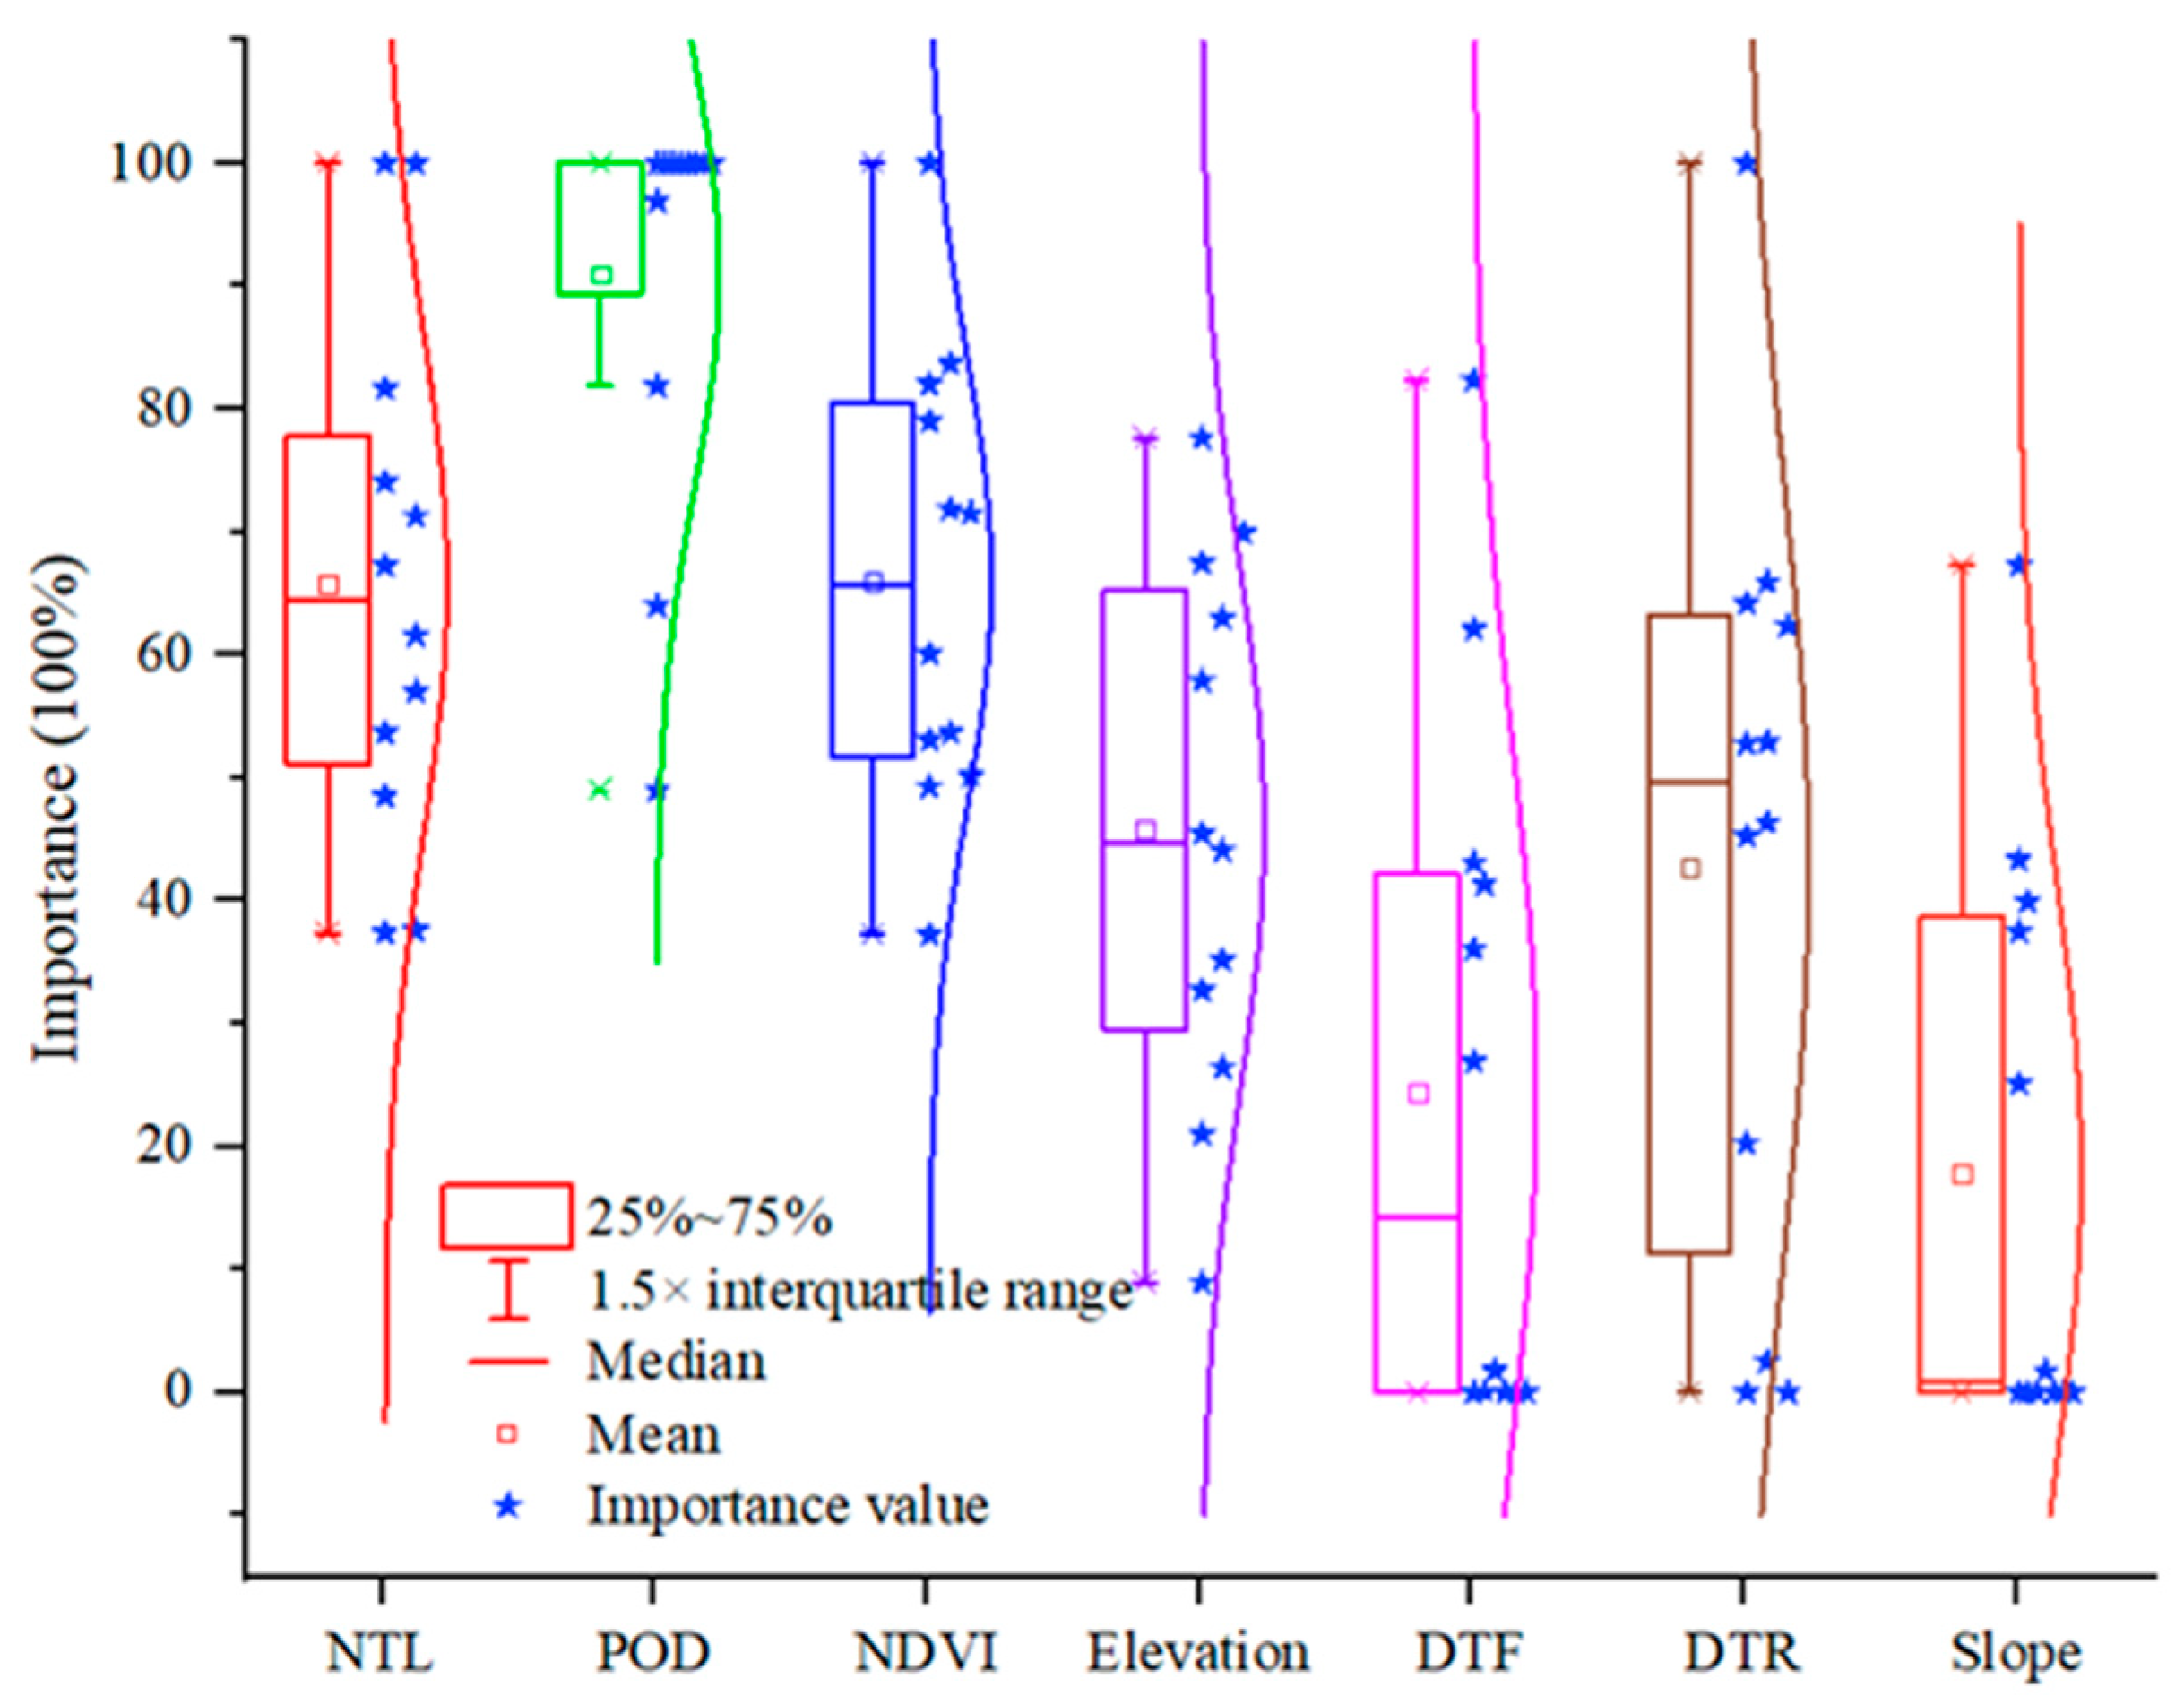
- The anthropogenic factors (e.g., population density and night light intensity) were found to dominate the FFCI dynamics during 2000–2020. However, the impact of DTR and DTF on forest landscape fragmentation dynamics varied significantly across different models.
Author Contributions
Funding
Data Availability Statement
Conflicts of Interest
References
- Taubert, F.; Fischer, R.; Groeneveld, J.; Lehmann, S.; Müller, M.S.; Rödig, E.; Wiegand, T.; Huth, A. Global patterns of tropical forest fragmentation. Nature 2018, 554, 519–522. [Google Scholar] [CrossRef]
- Ma, J.; Li, J.; Wu, W.; Liu, J. Global forest fragmentation change from 2000 to 2020. Nat. Commun. 2023, 14, 3752. [Google Scholar] [CrossRef] [PubMed]
- Arroyo-Rodríguez, V.; Melo, F.P.L.; Martínez-Ramos, M.; Bongers, F.; Chazdon, R.L.; Meave, J.A.; Norden, N.; Santos, B.A.; Leal, I.R.; Tabarelli, M. Multiple successional pathways in human-modified tropical landscapes: New insights from forest succession, forest fragmentation and landscape ecology research. Biol. Rev. 2017, 92, 326–340. [Google Scholar] [CrossRef] [PubMed]
- Chen, S.; Wu, S.; Ma, M. Ecological restoration programs reduced forest fragmentation by stimulating forest expansion. Ecol. Indic. 2023, 154, 110855. [Google Scholar] [CrossRef]
- Taylor, C.; Lindenmayer, D.B. Temporal fragmentation of a critically endangered forest ecosystem. Austral. Ecol. 2020, 45, 340–354. [Google Scholar] [CrossRef]
- Zhen, S.; Zhao, Q.; Liu, S.; Wu, Z.; Lin, S.; Li, J.; Hu, X. Detecting spatiotemporal dynamics and driving patterns in forest fragmentation with a forest fragmentation comprehensive index (FFCI): Taking an area with active forest cover change as a case study. Forests 2023, 14, 1135. [Google Scholar] [CrossRef]
- Magrach, A.; Laurance, W.F.; Larrinaga, A.R.; Santamaria, L. Meta-analysis of the effects of forest fragmentation on interspecific interactions. Conserv. Biol. 2014, 28, 1342–1348. [Google Scholar] [CrossRef] [PubMed]
- Siegel, T.; Magrach, A.; Laurance, W.F.; Luther, D. A global meta-analysis of the impacts of forest fragmentation on biotic mutualisms and antagonisms. Conserv. Biol. 2023, 38, e14206. [Google Scholar] [CrossRef] [PubMed]
- de Santana, N.S.; Santos, A.S.; Borges, D.B.; França, D.d.S.; Reis, J.B.L.; de Oliveira, F.A.; Barreto, M.A.; Corrêa, R.X.; Zucchi, M.I.; Martins, K.; et al. Genetic resilience of Atlantic forest trees to impacts of biome loss and fragmentation. Eur. J. For. Res. 2023, 142, 161–174. [Google Scholar] [CrossRef]
- Brennan, A.; Naidoo, R.; Greenstreet, L.; Mehrabi, Z.; Ramankutty, N.; Kremen, C. Functional connectivity of the world’s protected areas. Science 2022, 376, 1101–1104. [Google Scholar] [CrossRef]
- Gong, C.; Yu, S.; Joesting, H.; Chen, J. Determining socioeconomic drivers of urban forest fragmentation with historical remote sensing images. Landsc. Urban Plan. 2013, 117, 57–65. [Google Scholar] [CrossRef]
- Valle, D.; Silva, C.A.; Longo, M.; Brando, P. The Latent Dirichlet Allocation model applied to airborne LiDAR data: A case study on mapping forest degradation associated with fragmentation and fire in the Amazon region. Methods Ecol. Evol. 2022, 13, 1329–1342. [Google Scholar] [CrossRef]
- Frazier, A.E.; Kedron, P. Comparing forest fragmentation in Eastern, U.S. forests using patch-mosaic and gradient surface models. Ecol. Inform. 2017, 41, 108–115. [Google Scholar] [CrossRef]
- González-Ávila, S.; Ortega, E.; Martín, B. Multiscale fragmentation of forest types in Spain. For. Ecol. Manag. 2023, 546, 121317. [Google Scholar] [CrossRef]
- Jha, C.; Goparaju, L.; Tripathi, A.; Gharai, B.; Raghubanshi, A.; Singh, J. Forest fragmentation and its impact on species diversity: An analysis using remote sensing and GIS. Biodivers. Conserv. 2005, 14, 1681–1698. [Google Scholar] [CrossRef]
- Vellend, M.; Verheyen, K.; Jacquemyn, H.; Kolb, A.; Van Calster, H.; Peterken, G.; Hermy, M. Extinction debt of forest plants persists for more than a century following habitat fragmentation. Ecology 2006, 87, 542–548. [Google Scholar] [CrossRef] [PubMed]
- Gibson, L.; Lynam, A.J.; Bradshaw, C.J.A.; He, F.; Bickford, D.P.; Woodruff, D.S.; Bumrungsri, S.; Laurance, W.F. Near-complete extinction of native small mammal fauna 25 years after forest fragmentation. Science 2013, 341, 1508–1510. [Google Scholar] [CrossRef]
- Keken, Z.; Panagiotidis, D.; Skaloš, J. The influence of damming on landscape structure change in the vicinity of flooded areas: Case studies in Greece and the Czech Republic. Ecol. Eng. 2015, 74, 448–457. [Google Scholar] [CrossRef]
- Guo, H.; Duan, D.; Lei, H.; Chen, Y.; Li, J.; Albasher, G.; Li, X. Environmental Drivers of Landscape Fragmentation Influence Intraspecific Leaf Traits in Forest Ecosystem. Forests 2023, 14, 1875. [Google Scholar] [CrossRef]
- Sulieman, H.M. Exploring Drivers of Forest Degradation and Fragmentation in Sudan: The Case of Erawashda Forest and its Surrounding Community. Sci. Total. Environ. 2018, 621, 895–904. [Google Scholar] [CrossRef]
- Çalışkan, E.; Sevim, Y. Forest road detection using deep learning models. Geocarto Int. 2022, 37, 5875–5890. [Google Scholar] [CrossRef]
- Nasejje, J.B.; Mbuvha, R.; Mwambi, H. Use of a deep learning and random forest approach to track changes in the predictive nature of socioeconomic drivers of under-5 mortality rates in sub-Saharan Africa. BMJ Open 2022, 12, e049786. [Google Scholar] [CrossRef] [PubMed]
- Patoine, G.; Eisenhauer, N.; Cesarz, S.; Phillips, H.R.P.; Xu, X.; Zhang, L.; Guerra, C.A. Drivers and trends of global soil microbial carbon over two decades. Nat. Commun. 2022, 13, 4195. [Google Scholar] [CrossRef] [PubMed]
- Yang, J.; Huang, X. The 30 m annual land cover datasets and its dynamics in China from 1985 to 2022. Earth Syst. Sci. Data 2023, 13, 3907–3925. [Google Scholar] [CrossRef]
- Cinelli, M.; Coles, S.R.; Kirwan, K. Analysis of the potentials of multi criteria decision analysis methods to conduct sustainability assessment. Ecol. Indic. 2014, 46, 138–148. [Google Scholar] [CrossRef]
- Norouzian-Maleki, S.; Bell, S.; Hosseini, S.-B.; Faizi, M. Developing and testing a framework for the assessment of neighbourhood liveability in two contrasting countries: Iran and Estonia. Ecol. Indic. 2015, 48, 263–271. [Google Scholar] [CrossRef]
- Seddon, A.W.R.; Macias-Fauria, M.; Long, P.R.; Benz, D.; Willis, K.J. Sensitivity of global terrestrial ecosystems to climate variability. Nature 2016, 531, 229–232. [Google Scholar] [CrossRef] [PubMed]
- Hu, X.; Xu, H. A new remote sensing index for assessing the spatial heterogeneity in urban ecological quality: A case from Fuzhou City, China. Ecol. Indic. 2018, 89, 11–21. [Google Scholar] [CrossRef]
- Anselin, L. GeoDa 0.9 User’s Guide; Spatial Analysis Laboratory (SAL), University of Illinois, Urbana-Champaign: Urbana, IL, USA, 2003. [Google Scholar]
- Chen, J.; Xu, C.; Lin, S.; Wu, Z.; Qiu, R.; Hu, X. Is there spatial dependence or spatial heterogeneity in the distribution of vegetation greening and browning in Southeastern China? Forests 2022, 13, 840. [Google Scholar] [CrossRef]
- Hu, X.; Xu, C.; Chen, J.; Lin, Y.; Lin, S.; Wu, Z.; Qiu, R. A synthetic landscape metric to evaluate urban vegetation quality: A case of Fuzhou City in China. Forests 2022, 13, 1002. [Google Scholar] [CrossRef]
- Laurance, W.F.; Camargo, J.L.C.; Fearnside, P.M.; Lovejoy, T.E.; Williamson, G.B.; Mesquita, R.C.G.; Meyer, C.F.J.; Bobrowiec, P.E.D.; Laurance, S.G.W. An Amazonian rainforest and its fragments as a laboratory of global change. Biol. Rev. 2018, 93, 223–247. [Google Scholar] [CrossRef] [PubMed]
- Hansen, M.C.; Wang, L.; Song, X.-P.; Tyukavina, A.; Turubanova, S.; Potapov, P.V.; Stehman, S.V. The fate of tropical forest fragments. Sci. Adv. 2020, 6, eaax8574. [Google Scholar] [CrossRef] [PubMed]
- Zhou, W.; Zhang, S.; Yu, W.; Wang, J.; Wang, W. Effects of urban expansion on forest loss and fragmentation in six megaregions, China. Remote Sens. 2017, 9, 991. [Google Scholar] [CrossRef]
- Lin, Y.; Hu, X.; Zheng, X.; Hou, X.; Zhang, Z.; Zhou, X.; Qiu, R.; Lin, J. Spatial variations in the relationships between road network and landscape ecological risks in the highest forest coverage region of China. Ecol. Indic. 2019, 96, 392–403. [Google Scholar] [CrossRef]
- Engert, J.E.; Campbell, M.J.; Cinner, J.E.; Ishida, Y.; Sloan, S.; Supriatna, J.; Alamgir, M.; Cislowski, J.; Laurance, W.F. Ghost roads and the destruction of Asia-Pacific tropical forests. Nature 2024, 629, 370–375. [Google Scholar] [CrossRef] [PubMed]
- Fischer, R.; Taubert, F.; Müller, M.S.; Groeneveld, J.; Lehmann, S.; Wiegand, T.; Huth, A. Accelerated forest fragmentation leads to critical increase in tropical forest edge area. Sci. Adv. 2021, 7, eabg7012. [Google Scholar] [CrossRef] [PubMed]
- Hu, X.; Wu, Z.; Wu, C.; Ye, L.; Lan, C.; Tang, K.; Xu, L.; Qiu, R. Effects of road network on diversiform forest cover changes in the highest coverage region in China: An analysis of sampling strategies. Sci. Total. Environ. 2016, 565, 28–39. [Google Scholar] [CrossRef] [PubMed]
- Hu, X.; Zhang, L.; Ye, L.; Lin, Y.; Qiu, R. Locating spatial variation in the association between road network and forest biomass carbon accumulation. Ecol. Indic. 2017, 73, 214–223. [Google Scholar] [CrossRef]
- Lin, Y.; Qiu, R.; Yao, J.; Hu, X.; Lin, J. The effects of urbanization on China’s forest loss from 2000 to 2012: Evidence from a panel analysis. J. Clean. Prod. 2019, 214, 270–278. [Google Scholar] [CrossRef]
- Bryan, B.A.; Gao, L.; Ye, Y.; Sun, X.; Connor, J.D.; Crossman, N.D.; Stafford-Smith, M.; Wu, J.; He, C.; Yu, D.; et al. China’s response to a national land-system sustainability emergency. Nature 2019, 559, 193–204. [Google Scholar] [CrossRef]
- Wang, Y.; Chen, X.; Gao, M.; Dong, J. The use of random forest to identify climate and human interference on vegetation coverage changes in southwest China. Ecol. Indic. 2022, 144, 109463. [Google Scholar] [CrossRef]
- Leroux, L.; Bégué, A.; Seen, D.L.; Jolivot, A.; Kayitakire, F. Driving forces of recent vegetation changes in the Sahel: Lessons learned from regional and local level analyses. Remote Sens. Environ. 2017, 191, 38–54. [Google Scholar] [CrossRef]
- Kafy, A.-A.; Saha, M.; Fattah, A.; Rahman, M.T.; Duti, B.M.; Rahaman, Z.A.; Bakshi, A.; Kalaivani, S.; Rahaman, S.N.; Sattar, G.S. Integrating forest cover change and carbon storage dynamics: Leveraging Google Earth Engine and InVEST model to inform conservation in hilly regions. Ecol. Indic. 2023, 152, 110374. [Google Scholar] [CrossRef]
- Augusto, L.; Boča, A. Tree functional traits, forest biomass, and tree species diversity interact with site properties to drive forest soil carbon. Nat. Commun. 2022, 13, 1097. [Google Scholar] [CrossRef]

| Type | Data | Variable | Sources |
|---|---|---|---|
| Geomorphic factors | Digital Elevation Model (DEM) | Elevation | https://www.gscloud.cn/ (accessed on 6 December 2021) |
| Slope | |||
| Natural factors | Normalized Difference Vegetation Index (NDVI) | NDVI | http://www.resdc.cn/ (accessed on 6 December 2023) |
| China Land Cover Dataset (CLCD) | Distance to Forest (DTF) | Google Earth Engine | |
| Socio-economic factors | Population Density (POD) | POD | WorldPop dataset (accessed on 12 December 2021) |
| Nighttime-Light Intensity (NTL) | NTL | http://www.geodata.cn/ (accessed on 12 December 2021) | |
| Open Street Map (OSM) | Distance to Road (DTR) | Open Street Map (accessed on 12 December 2022) |
Disclaimer/Publisher’s Note: The statements, opinions and data contained in all publications are solely those of the individual author(s) and contributor(s) and not of MDPI and/or the editor(s). MDPI and/or the editor(s) disclaim responsibility for any injury to people or property resulting from any ideas, methods, instructions or products referred to in the content. |
© 2024 by the authors. Licensee MDPI, Basel, Switzerland. This article is an open access article distributed under the terms and conditions of the Creative Commons Attribution (CC BY) license (https://creativecommons.org/licenses/by/4.0/).
Share and Cite
Lin, X.; Zhen, S.; Zhao, Q.; Hu, X. A New Paradigm for Assessing Detailed Dynamics of Forest Landscape Fragmentation. Forests 2024, 15, 1212. https://doi.org/10.3390/f15071212
Lin X, Zhen S, Zhao Q, Hu X. A New Paradigm for Assessing Detailed Dynamics of Forest Landscape Fragmentation. Forests. 2024; 15(7):1212. https://doi.org/10.3390/f15071212
Chicago/Turabian StyleLin, Xin, Shiyong Zhen, Qing Zhao, and Xisheng Hu. 2024. "A New Paradigm for Assessing Detailed Dynamics of Forest Landscape Fragmentation" Forests 15, no. 7: 1212. https://doi.org/10.3390/f15071212
APA StyleLin, X., Zhen, S., Zhao, Q., & Hu, X. (2024). A New Paradigm for Assessing Detailed Dynamics of Forest Landscape Fragmentation. Forests, 15(7), 1212. https://doi.org/10.3390/f15071212