

Tree Species Composition and Structure of a Vegetation Plot in a Montane Forest in the Department of Amazonas, Peru

 , , , ,
  , ,
, ,  , , and
Abstract
1. Introduction
2. Materials and Methods
2.1. Study Area
2.2. Establishment of Permanent Plot
2.3. Processing of Botanical Material
- Shannon–Wiener Index (H′)whereH′ = Shannon–Wiener IndexS = Total number of species
- Simpson’s IndexwhereD = Simpson’s IndexS = Total number of species
- Fisher’s Diversity IndexwhereS = Total number of speciesα = Fisher diversity indexN = Total number of individuals
3. Results
3.1. Structure and Generalities of Forest Type
3.2. Diversity
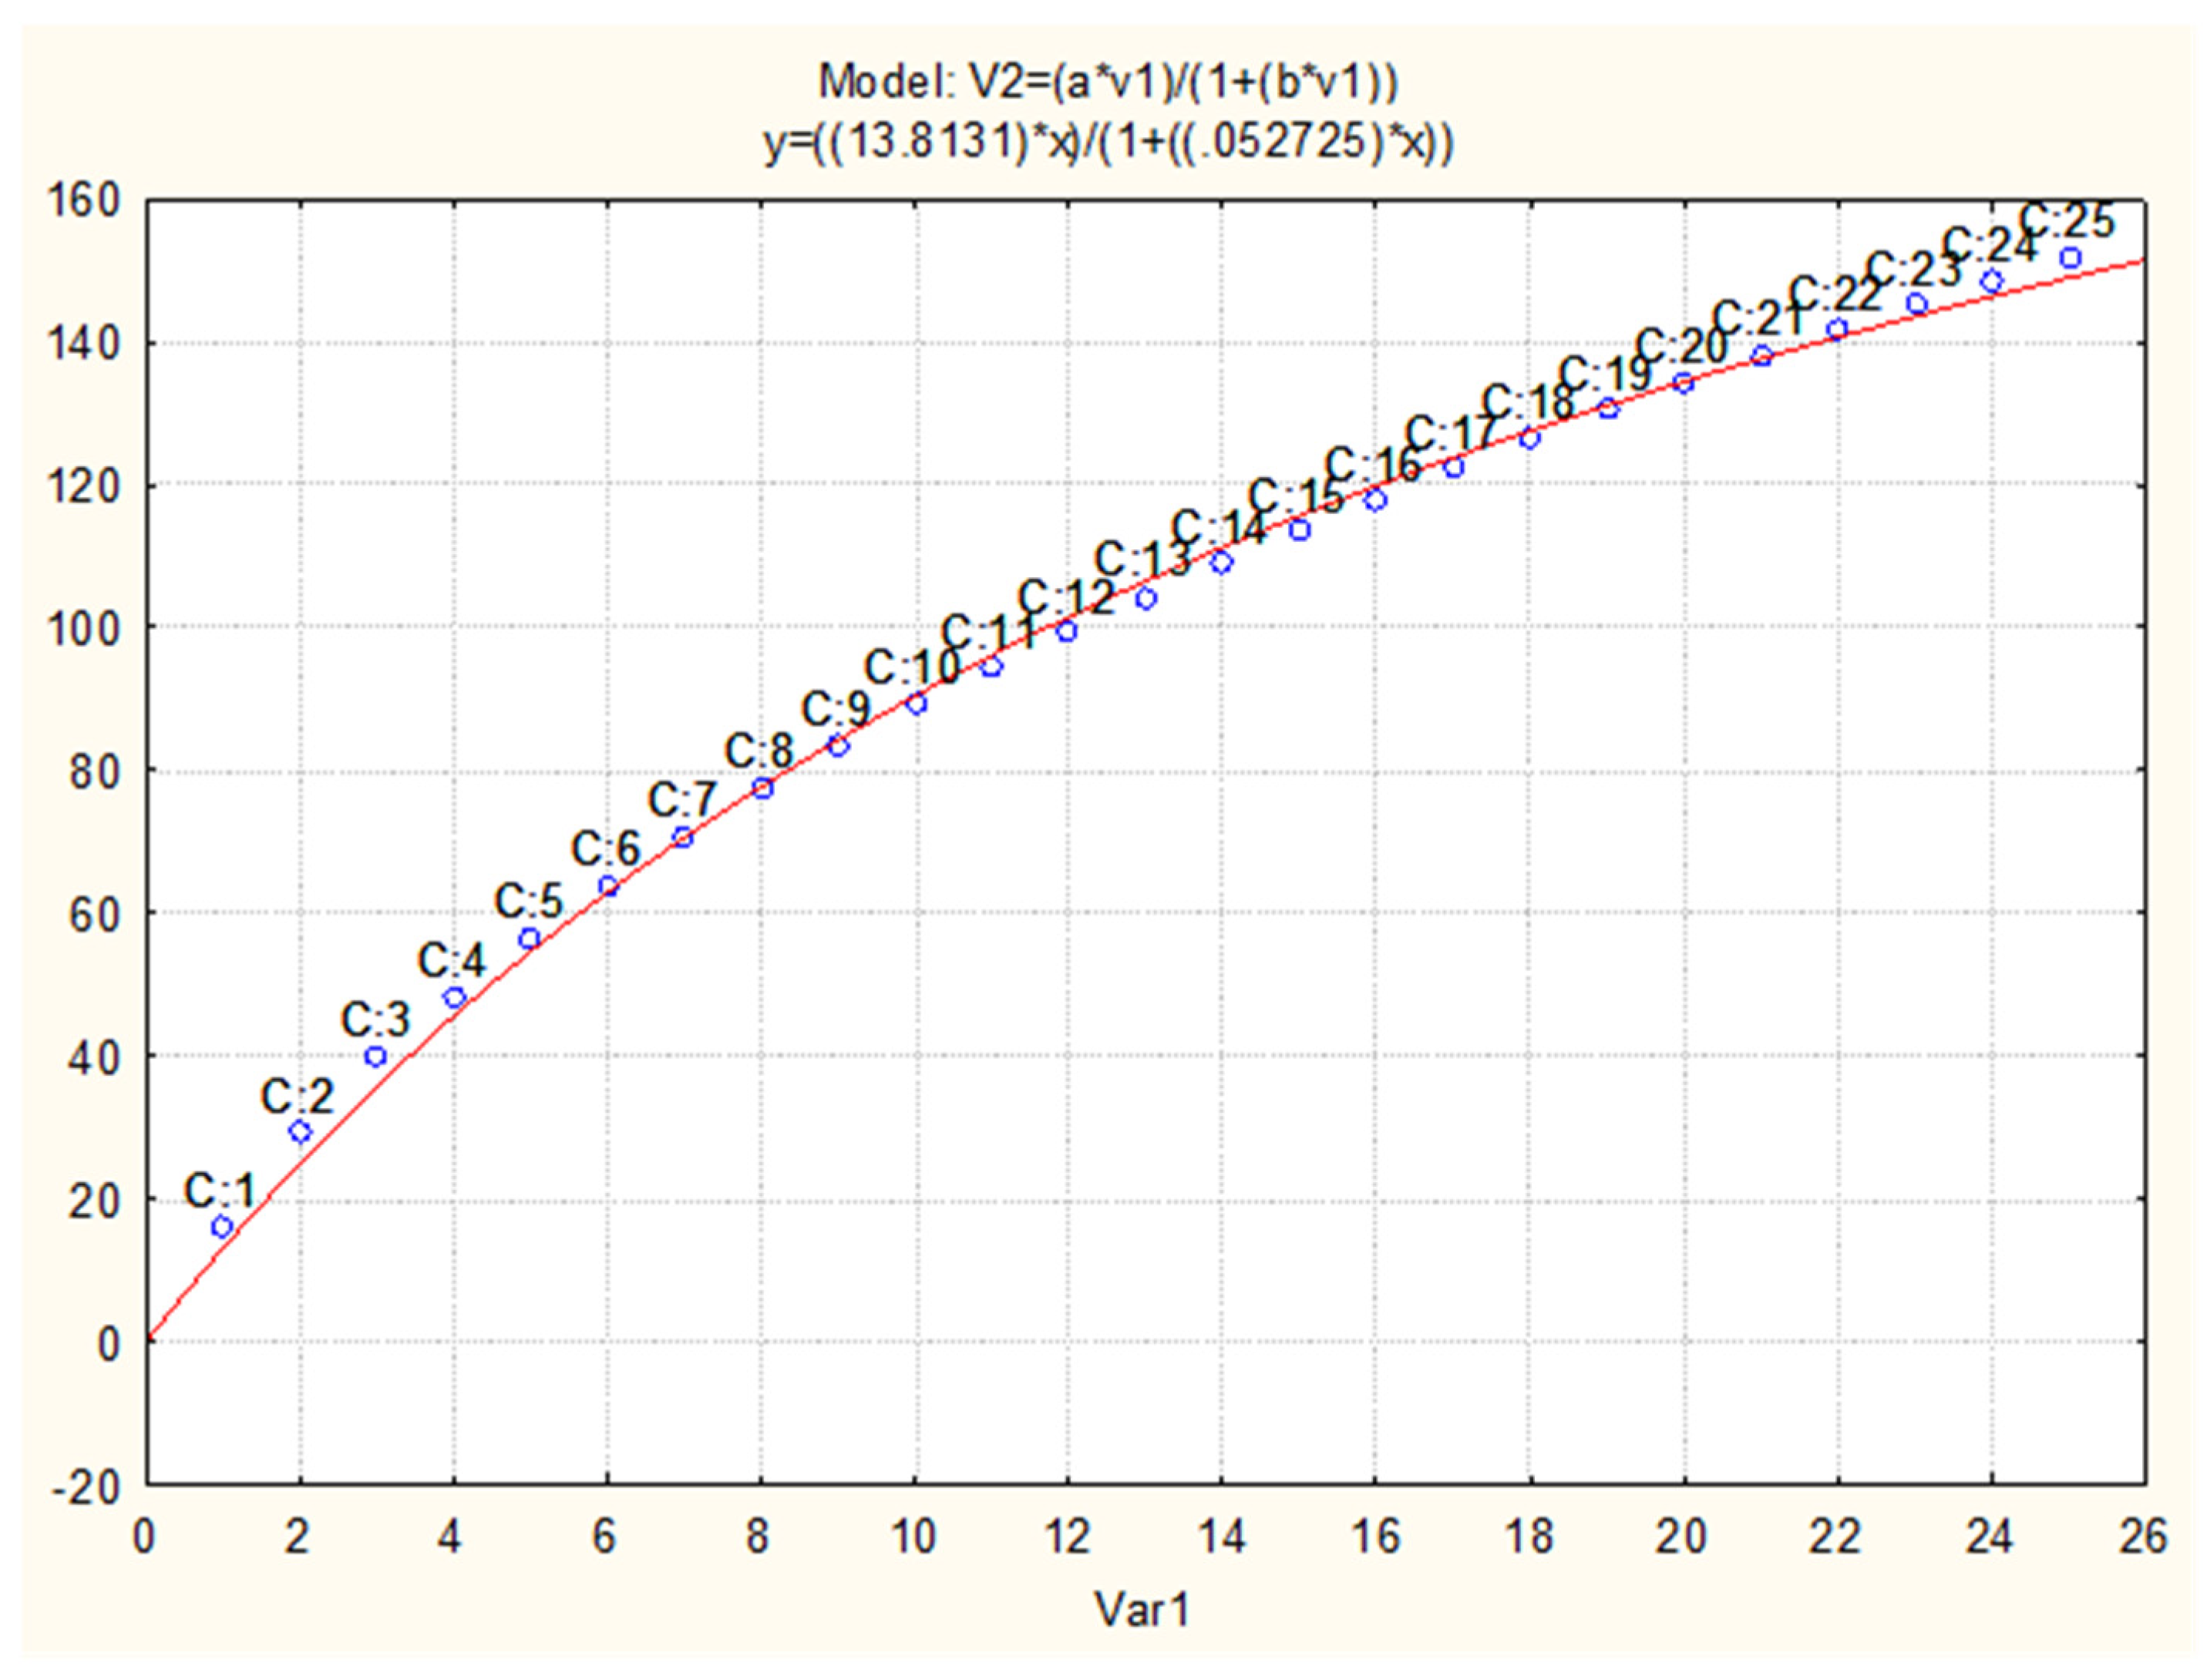
3.3. Species–Area Curve
3.4. Mixing Coefficient
3.5. Diversity Index, Evenness, and Dominance
3.6. Floristic Composition
Most Abundant Families, Genera, and Species
3.7. Structure Analysis
3.8. Importance Value Index
4. Discussion
4.1. Alpha Diversity and Floristic Composition
4.2. Structural Analysis
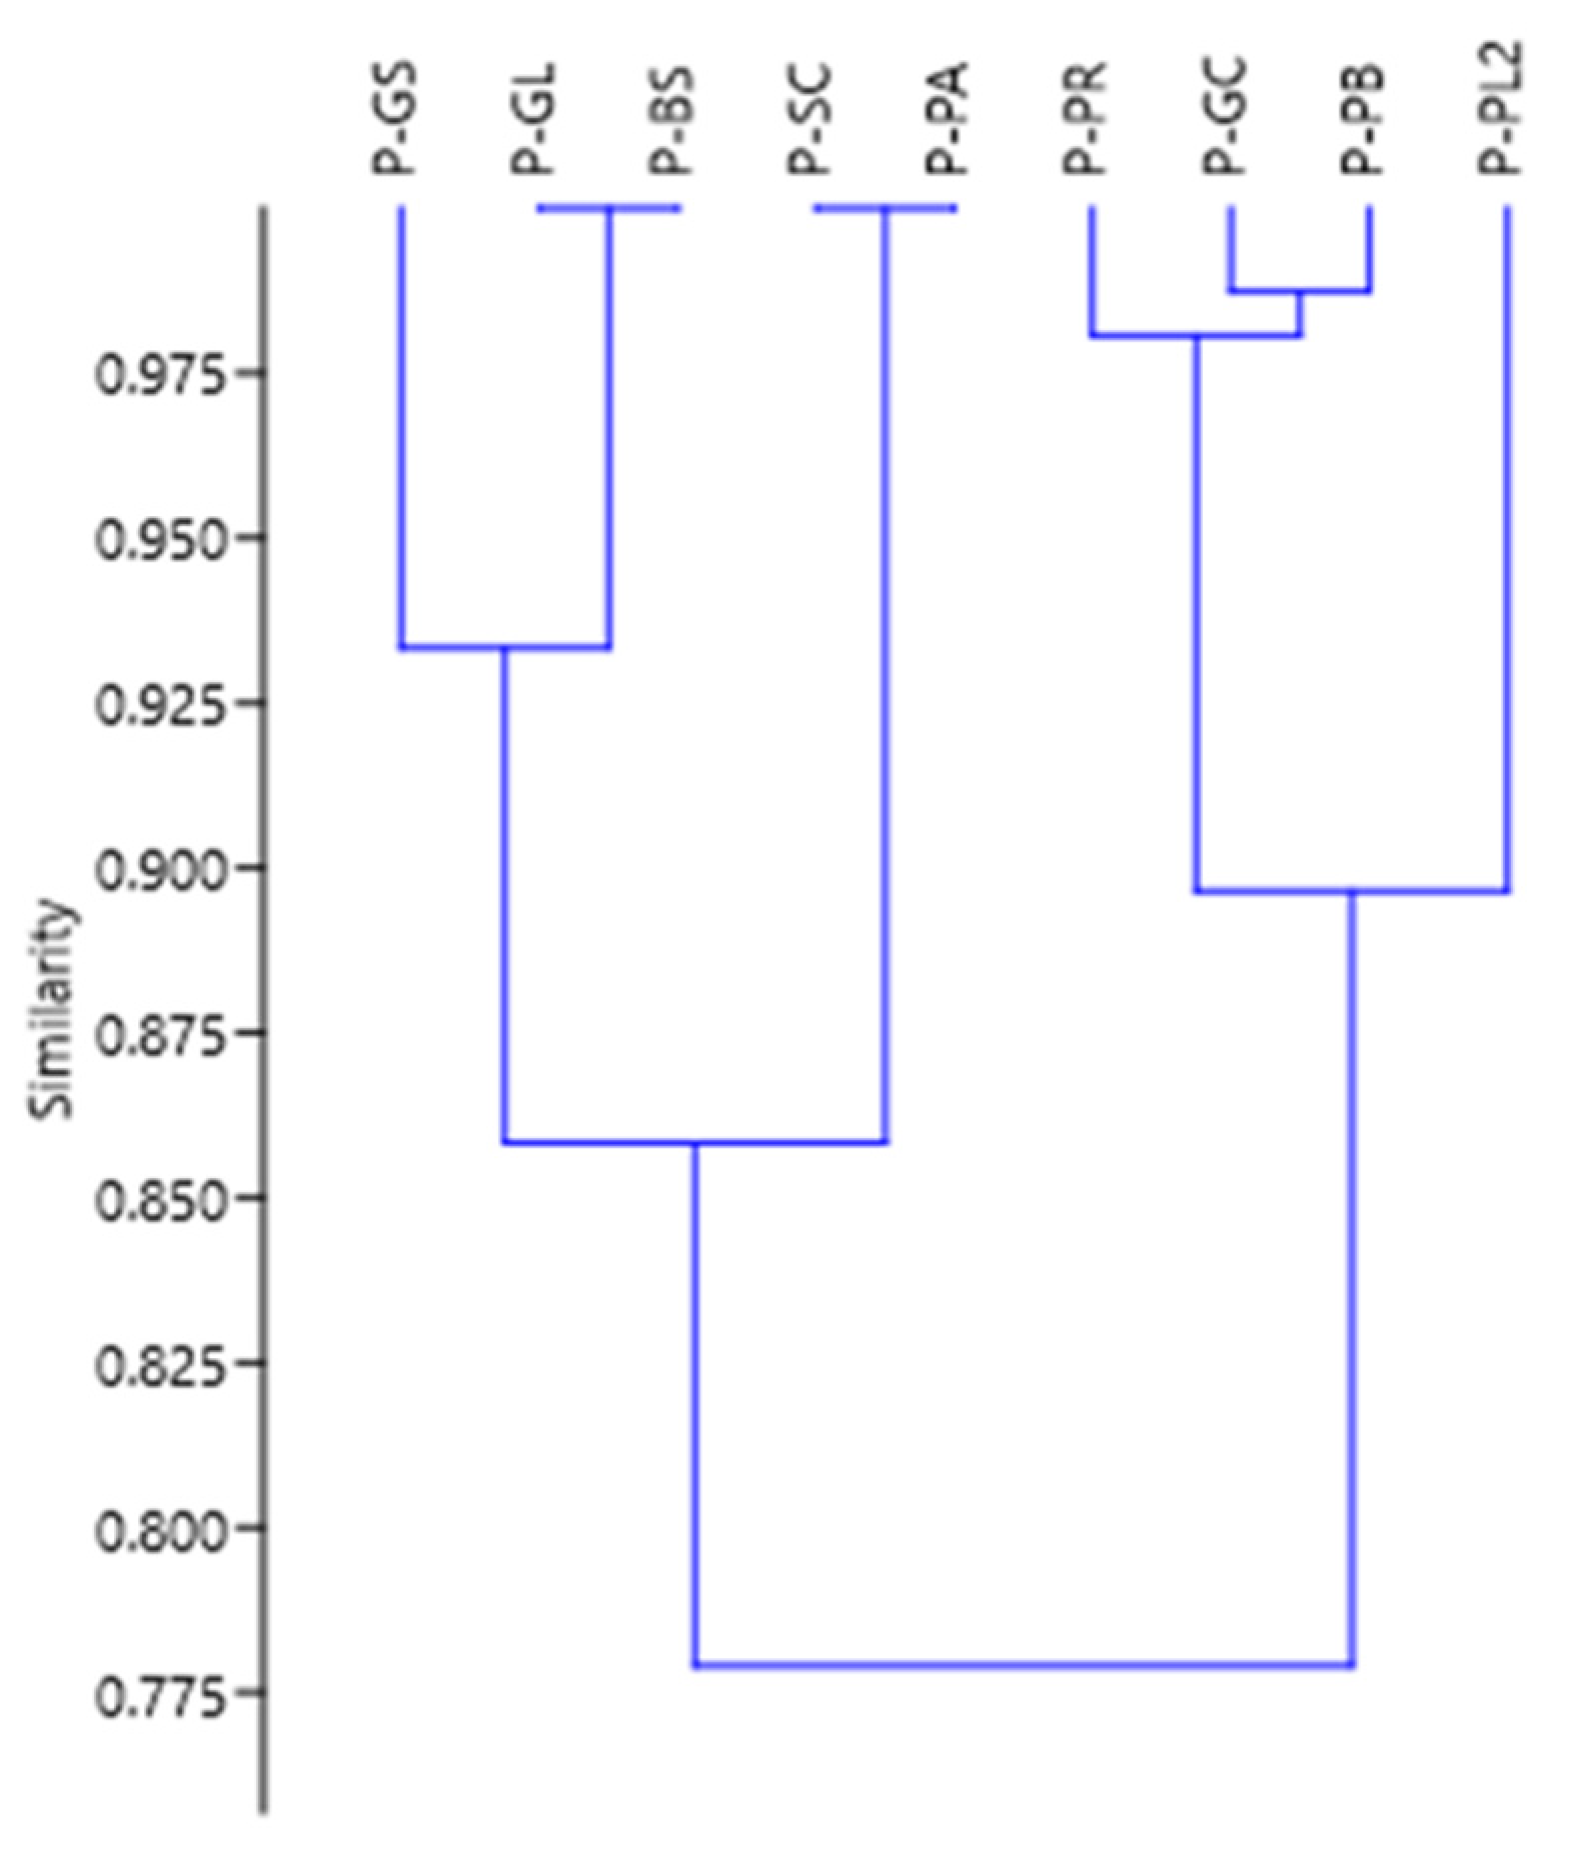
4.3. Comparative Analysis of Montane Forests
5. Conclusions
Author Contributions
Funding
Data Availability Statement
Conflicts of Interest
References
- Köhl, M.; Lasco, R.; Cifuentes, M.; Jonsson, Ö.; Korhonen, K.T.; Mundhenk, P.; de Jesus Navar, J.; Stinson, G. Changes in forest production, biomass and carbon: Results from the 2015 UN FAO Global Forest Resource Assessment. For. Ecol. Manag. 2015, 352, 21–34. [Google Scholar] [CrossRef]
- Torres, B.; Vasco, C.; Günter, S.; Knoke, T. Determinants of Agricultural Diversification in a Hotspot Area: Evidence from Colonist and Indigenous Communities in the Sumaco Biosphere Reserve, Ecuadorian Amazon. Sustainability 2018, 10, 1432. [Google Scholar] [CrossRef]
- Torres, B.; Vasseur, L.; López, R.; Lozano, P.; García, Y.; Arteaga, Y.; Bravo, C.; Barba, C.; García, A. Structure and above ground biomass along an elevation small-scale gradient: Case study in an Evergreen Andean Amazon forest, Ecuador. Agrofor. Syst. 2020, 94, 1235–1245. [Google Scholar] [CrossRef]
- Körner, C.; Paulsen, J.; Spehn, E.M. A definition of mountains and their bioclimatic belts for global comparisons of biodiversity data. Alp. Bot. 2011, 121, 73–78. [Google Scholar] [CrossRef]
- Nagy, L.; Eller, C.B.; Mercado, L.M.; Cuesta, F.X.; Llambí, L.D.; Buscardo, E.; Aragão LE, O.C.; García-Núñez, C.; Oliveira, R.S.; Barbosa, M.; et al. South American mountain ecosystems and global change—A case study for integrating theory and field observations for land surface modelling and ecosystem management. Plant Ecol. Divers. 2023, 16, 1–27. [Google Scholar] [CrossRef]
- Pearce, D.; Moran, D. The Economic Value of Biodiversity, 1st ed.; Routledge: London, UK, 1994. [Google Scholar] [CrossRef]
- da Rosa, C.M.; Marques, M.C. How are biodiversity and carbon stock recovered during tropical forest restoration? Supporting the ecological paradigms and political context involved. J. Nat. Conserv. 2022, 65, 126115. [Google Scholar] [CrossRef]
- Navarro, L.M.; Fernández, N.; Guerra, C.; Guralnick, R.; Kissling, W.D.; Londoño, M.C.; Muller-Karger, F.; Turak, E.; Balvanera, P.; Costello, M.J.; et al. Monitoring biodiversity change through effective global coordination. Curr. Opin. Environ. Sustain. 2017, 29, 158–169. [Google Scholar] [CrossRef]
- Thakur, S.; Negi, V.S.; Dhyani, R.; Satish, K.V.; Bhatt, I.D. Vulnerability assessments of mountain forest ecosystems: A global synthesis. Trees For. People 2021, 6, 100156. [Google Scholar] [CrossRef]
- Cortés Capano, G.; Toivonen, T.; Soutullo, A.; Di Minin, E. The emergence of private land conservation in scientific literature: A review. Biol. Conserv. 2019, 237, 191–199. [Google Scholar] [CrossRef]
- López de la Lama, R.; Bennett, N.; Bulkan, J.; Boyd, D.; Chan, K.M. A legal assessment of private land conservation in South America. Conserv. Biol. 2023, 37, e14068. [Google Scholar] [CrossRef]
- De Rutte, J.; Reynel, C. Composición y Diversidad Arbórea en la Cumbre del Bosque Montano Nublado Puyu Sacha, Chanchamayo, DP. de Junín, Perú; Universidad Nacional Agraria la Molina: Lima, Peru, 2016; Available online: https://www.aprodes.org/pdf/composicion.pdf (accessed on 15 May 2024).
- León, J.F.; Musaja, C.C.; Quispe, L.S. Flora y vegetación del departamento de Tacna. Cienc. Desarro. 2004, 8, 8. [Google Scholar] [CrossRef]
- Giacomotti, J.; Reynel, C.; Fernandez-Hilario, R.; Revilla, I.; Palacios-Ramos, S.; Terreros-Camac, S.; Daza, A.; Linares-Palomino, R. Diversidad y composición florística en un gradiente altitudinal en Chanchamayo, selva central del Perú. Folia Amaz. 2021, 30, 1–14. [Google Scholar] [CrossRef]
- Phillips, O.; Baker, T.; Feldpausch, T.; Brienen, R. Manual de Campo para el Establecimiento y la Remedición de Parcelas; RAINFOR, 2016. Available online: https://forestplots.net/upload/es/recursos/RAINFOR_field_manual_ES.pdf (accessed on 15 May 2024).
- Añazco Urbina, B.; Rivera López, R.Y.; Pariente Mondragón, E.; Añazco Urbina, B.; Rivera López, R.Y.; Pariente Mondragón, E. Diversidad y composición florística de un área de bosque montano, San Carlos, Bongará, Amazonas. Arnaldoa 2021, 28, 441–458. [Google Scholar] [CrossRef]
- Arista, J.P.; Hágsater, E.; Santiago, E.; Edquén, J.D.; Pariente, E.; Oliva, M.; Salazar, G.A. New and noteworthy species of the genus Epidendrum (Orchidaceae, Laeliinae) from the Área de Conservación Privada La Pampa del Burro, Amazonas, Peru. PhytoKeys 2023, 227, 43–87. [Google Scholar] [CrossRef] [PubMed]
- Colwell, R.K. EstimateS: Statistical Estimation of Species Richness and Shared Species from Samples (Software and User’s Guide), Versión 9.1. 2013. Available online: http://viceroy.eeb.uconn.edu/estimates (accessed on 11 June 2024).
- StatSoft. STATISTICA (Data Analysis Software System and Computer Program Manual). Versión 6. 2001. Available online: http://www.statsoft.com (accessed on 11 June 2024).
- Jiménez-Valverde, A.; y Hortal, J. Las curvas de acumulación de especies y la necesidad de evaluar la calidad de los inventarios biológicos. Rev. Ibérica Aracnol. 2003, 8, 151–161. [Google Scholar]
- Armey, R.; Giacomotti, J.; Reynel, C.; Palacios-Ramos, S.; Linares-Palomino, R. Diversidad arbórea en bosques secundarios de los estratos montano y premontano en la provincia de Chanchamayo (Perú). Lilloa 2024, 61, 47–64. [Google Scholar] [CrossRef]
- Loza, I.; Moraes, R.M.; Jørgensen, P.M. Variación de la diversidad y composición florística en relación a la elevación en un bosque montano boliviano (PNANMI Madidi). Ecol. Boliv. 2010, 45, 87–100. [Google Scholar]
- Lozano, P.; Armas, A.; Gualán, M.; Guallpa, M. Diversidad y composición florística del Bosque Los Búhos ubicado en la provincia de Chimborazo, Ecuador. Enfoque UTE 2018, 9, 12–28. [Google Scholar] [CrossRef]
- Vásquez, R.; Vásquez, R.; Rojas, R.; Monteagudo, A.; Meza, K.; van der Werff, H.; Ortiz, R.; Catchpole, D. Flora Vascular de la selva central del Perú: Una aproximación de la composición florística de tres Areas Naturales Protegidas. Arnaldoa Rev. Herb. HAO 2005, 12, 112–125. [Google Scholar]
- Burga-Cieza, A.; Burga, J.; Iglesias-Osores, S.; Alcalde-Alfaro, V.; Martínez-Sovero, G.; Dávila-Estela, L.; Villena-Velásquez, J. Estructura, diversidad y endemismo de la flora del relicto Los Lanches del bosque montano Las Palmas, Cajamarca, Perú. Cienc. Amaz. 2021, 9, 43–58. [Google Scholar] [CrossRef]
- Mendoza, Z.; Orellana, F.; Jaramillo, N.; Peña, J.; Quizhpe, W. Composición florística, estructura y endemismo del componente leñoso en una parcela permanente en el bosque protector El Sayo, Loja, Ecuador. Cienc. Lat. Rev. Científica Multidiscip. 2021, 5, 3. [Google Scholar] [CrossRef]
- Coelho, M.M.; Amorim, A.M. Floristic composition of the Montane Forest in the Almadina-Barro Preto axis, Southern Bahia, Brazil. Biota Neotrop. 2014, 14, e20133878. [Google Scholar] [CrossRef]
- Zhu, H.; Yong, C.; Zhou, S.; Wang, H.; Yan, L. Vegetation, Floristic Composition and Species Diversity in a Tropical Mountain Nature Reserve in Southern Yunnan, SW China, with Implications for Conservation. Trop. Conserv. Sci. 2015, 8, 528–546. [Google Scholar] [CrossRef]
- Rasal-Sánchez, M.; Troncos-Castro, J.; Lizano-Durán, C.; Parihuamán-Granda, O.; Quevedo-Calle, D.; Rojas-Idrogo, C.; Delgado-Paredes, G.E. La vegetación terrestre del bosque montano de Lanchurán (Piura, Perú). Caldasia 2012, 34, 1–24. [Google Scholar]
- Shankar Raman, T.R. Assessment of census techniques for interspecific comparisons of tropical rainforest bird densities: A field evaluation in the Western Ghats, India. Ibis 2003, 145, 9–21. [Google Scholar] [CrossRef]
- Burel, F.; Baudry, J. Landscape Ecology Concepts, Methods and Applications, 1st ed.; CRC Press: Boca Raton, FL, USA, 2003. [Google Scholar] [CrossRef]
- Alvarez-Montalván, C.E.; Manrique-León, S.; Fonseca, M.V.-D.; Cardozo-Soarez, J.; Callo-Ccorcca, J.; Bravo-Camara, P.; Castañeda-Tinco, I.; Alvarez-Orellana, J. Composición florística, estructura y diversidad arbórea de un bosque amazónico en Perú. Sci. Agropecu. 2021, 12, 1. [Google Scholar] [CrossRef]
- Ledo, A.; Condés, S.; Alberdi, I. Forest biodiversity assessment in Peruvian Andean Montane cloud forest. J. Mt. Sci. 2012, 9, 372–384. [Google Scholar] [CrossRef]
- Pardo-Molina, G.; Pereira, L.; Feldpausch, T.R.; Vos, V.A.; Aramayo-Parada, R.; Arancibia-Rocabado, I.; Mamio, R.; Enríquez, S.; Mamani-Loza, M.A.; Suarez-Tabo, N.; et al. Composición florística del bosque amazónico de tierra firme del sector Alto Madera, Bolivia. Ecol. Boliv. 2020, 55, 111–126. [Google Scholar]
- Araujo-Murakami, A.; Bascopé, F.; Cardona-Peña, V.; De la Quinta, D.; Fuentes, A.; Jørgensen, P.; Maldonado, C.; Miranda, T.; Paniagua-Zambrana, N.; Seidel, R. Composición florística y estructura del bosque amazónico preandino en el sector del Arroyo Negro, Parque Nacional Madidi, Bolivia. Ecol. Boliv. 2005, 40, 281–303. [Google Scholar]
- Arias, D.I. Influencia de la Vegetación en la Diversidad Ornitológica de los Parques Metropolitanos: Sur de Quito y Chilibulo-Huayrapungo del Distrito Metropolitano de Quito-Pichincha-Ecuador. Bachelor’s Thesis, UCE, Quito, Ecuador, 2022. Available online: http://www.dspace.uce.edu.ec/handle/25000/26028 (accessed on 5 June 2024).
- Medrano, M.J.; Hernández, J.; Corral, S.; Nájera, J.A. Diversidad arbórea a diferentes niveles de altitud en la región de El Salto, Durango. Rev. Mex. Cienc. For. 2017, 8, 57–68. [Google Scholar]
- Young, K.; León, B. Perú. In Bosques Nublados del Neotrópico; Kapelle, M., Brown, A.D., Eds.; INBio, The Costa Rican Biodiversity Institute: Santo Domingo, Costa Rica, 2001; pp. 549–580. [Google Scholar]

| Plot | Number of Individuals | Total Basal Area (m2) | Number of Families | Number of Genera | Number of Species | Evenness Coefficient | Simpson’s Index | Shannon–Wiener Index | Fisher’s α |
|---|---|---|---|---|---|---|---|---|---|
| Montane Forest | 640 | 201.06 | 39 | 60 | 152 | 0.24 | 0.974 | 4.264 | 23.744 |
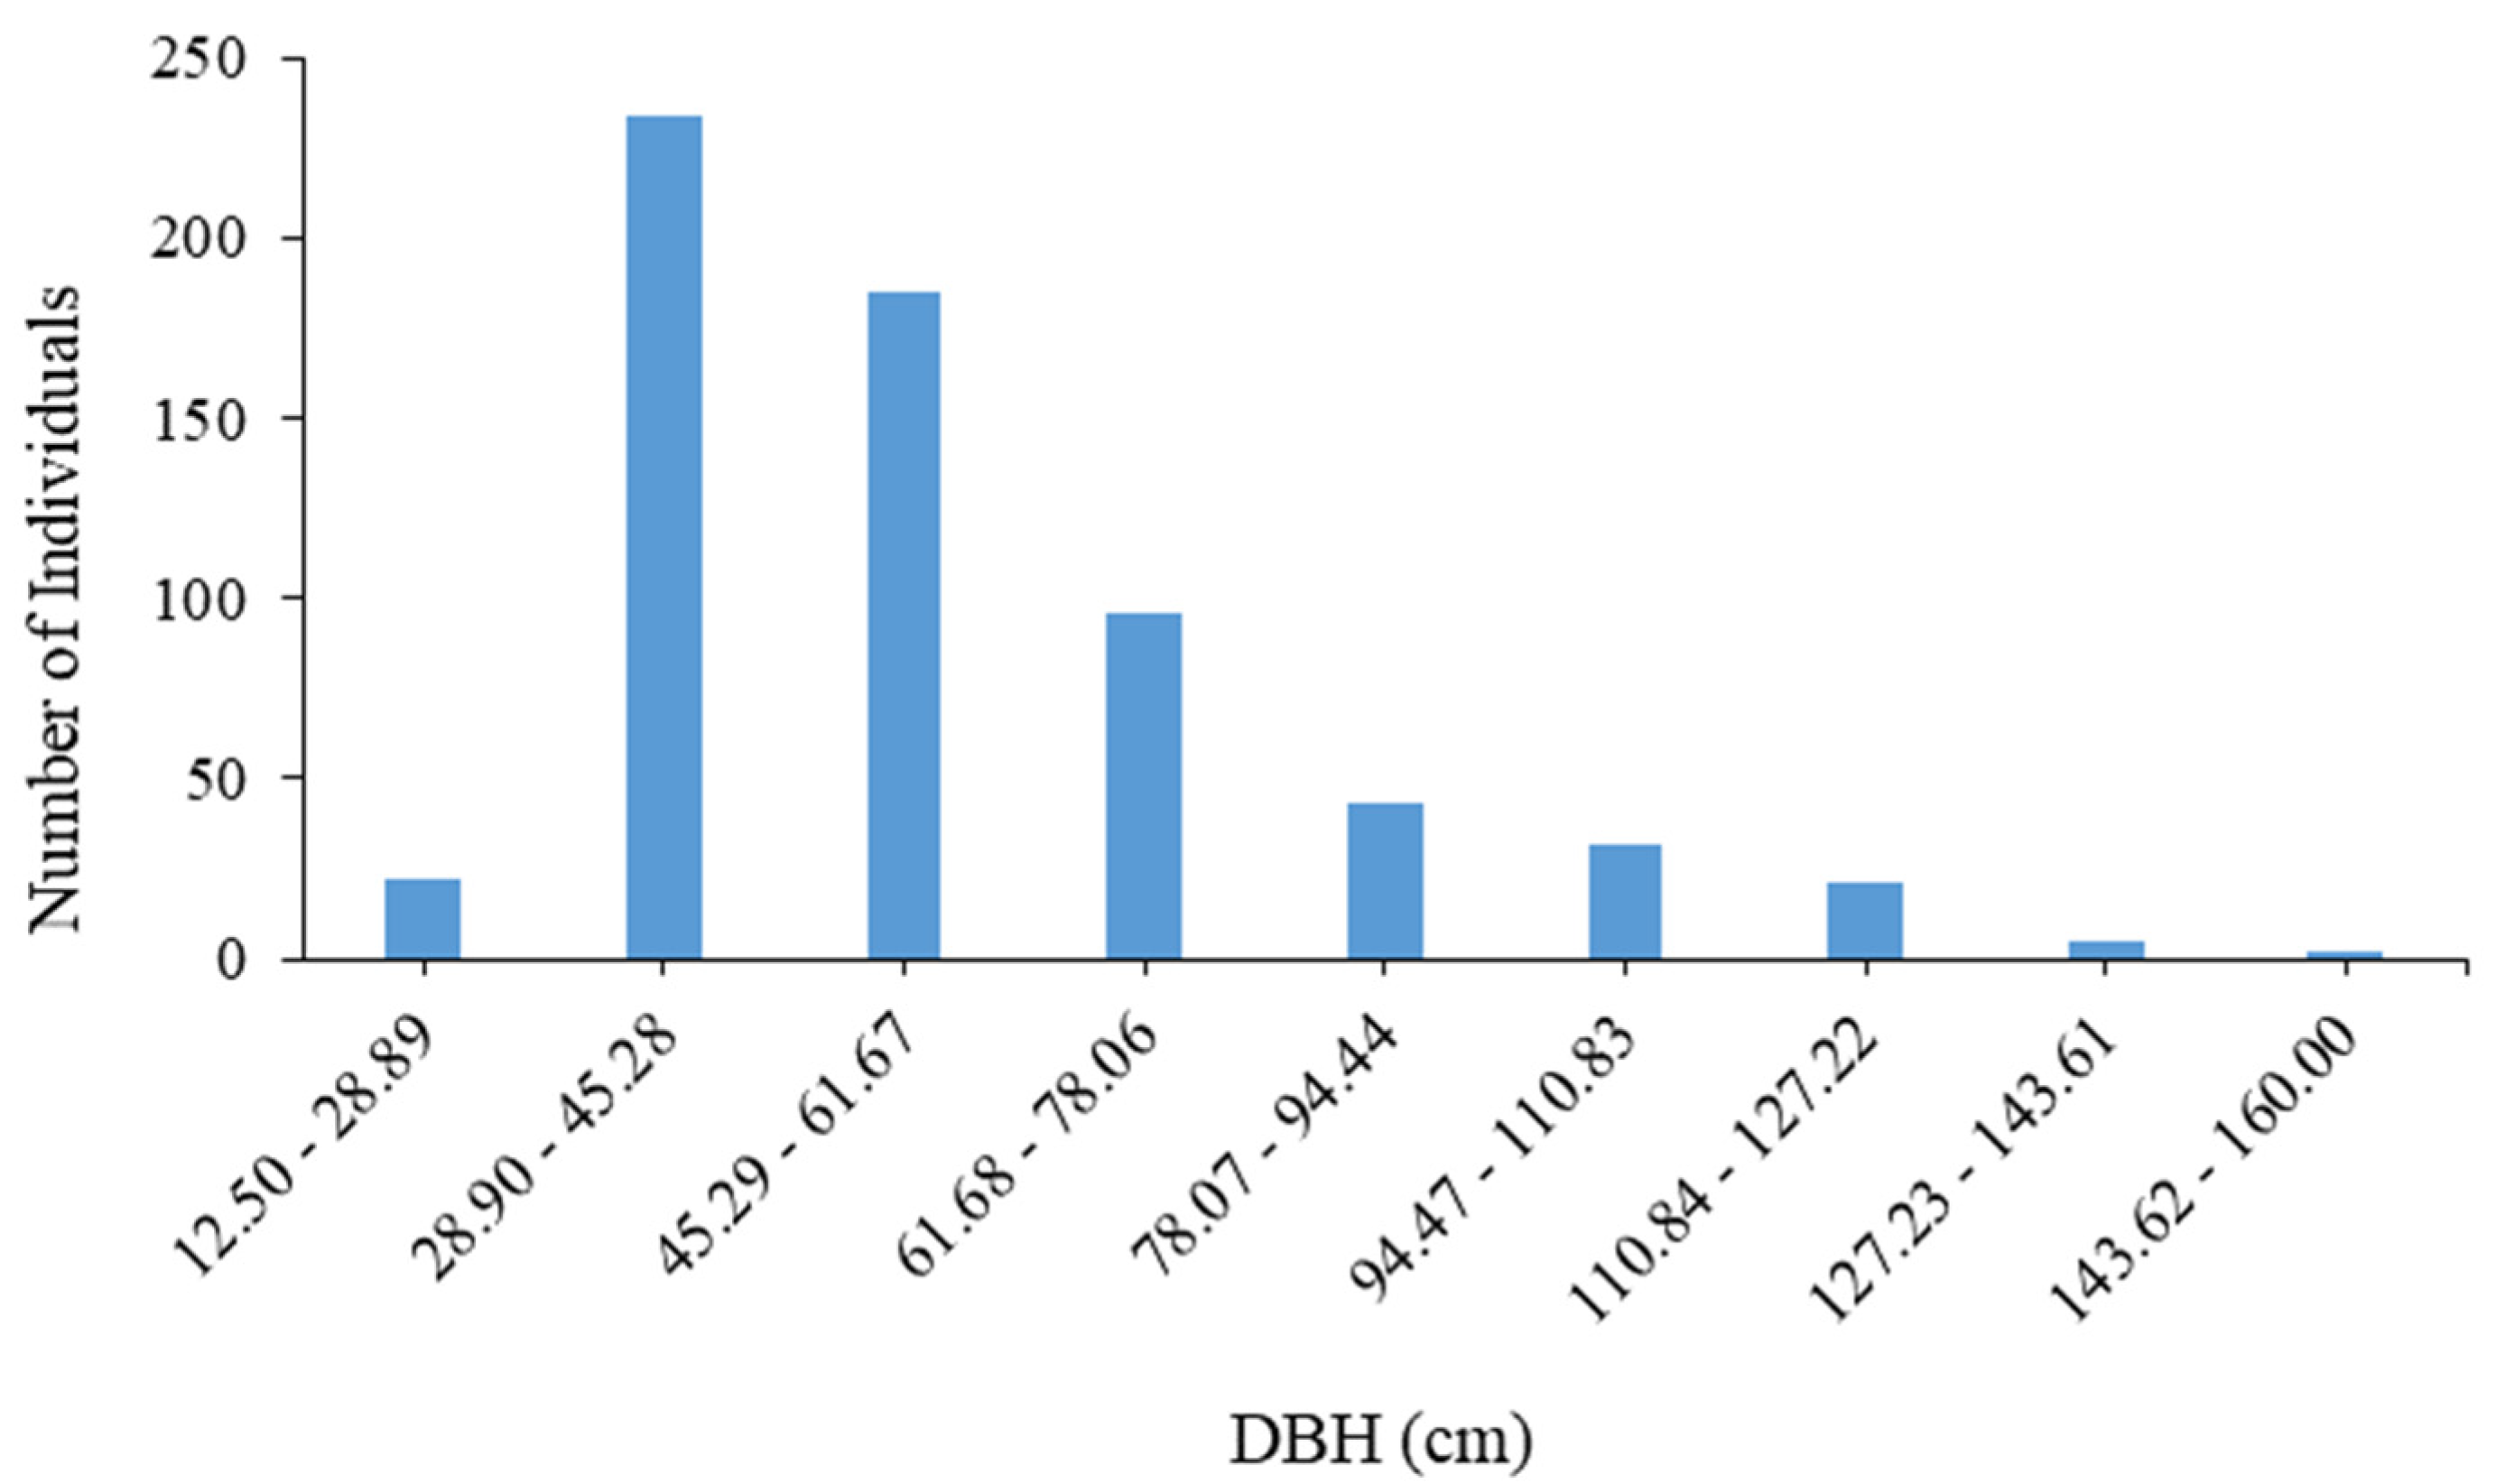
| Diameter Class | Range (cm) | Number of Individuals | Absolute Frequency (%) | Relative Frequency (%) |
|---|---|---|---|---|
| I | [12.50–28.89] | 22 | 3.44% | 3.44% |
| II | (28.89–45.28] | 234 | 36.56% | 40.00% |
| III | (45.28–61.67] | 185 | 28.91% | 68.91% |
| IV | (61.67–78.06] | 96 | 15.00% | 83.91% |
| V | (78.06–94.44] | 43 | 6.72% | 90.63% |
| VI | (94.44–110.83] | 32 | 5.00% | 95.63% |
| VII | (110.83–127.22] | 21 | 3.28% | 98.91% |
| VIII | (127.22–143.61] | 5 | 0.78% | 99.69% |
| IX | (143.61–160.00] | 2 | 0.31% | 100.00% |
| Total | 640 | 100.00% | ||
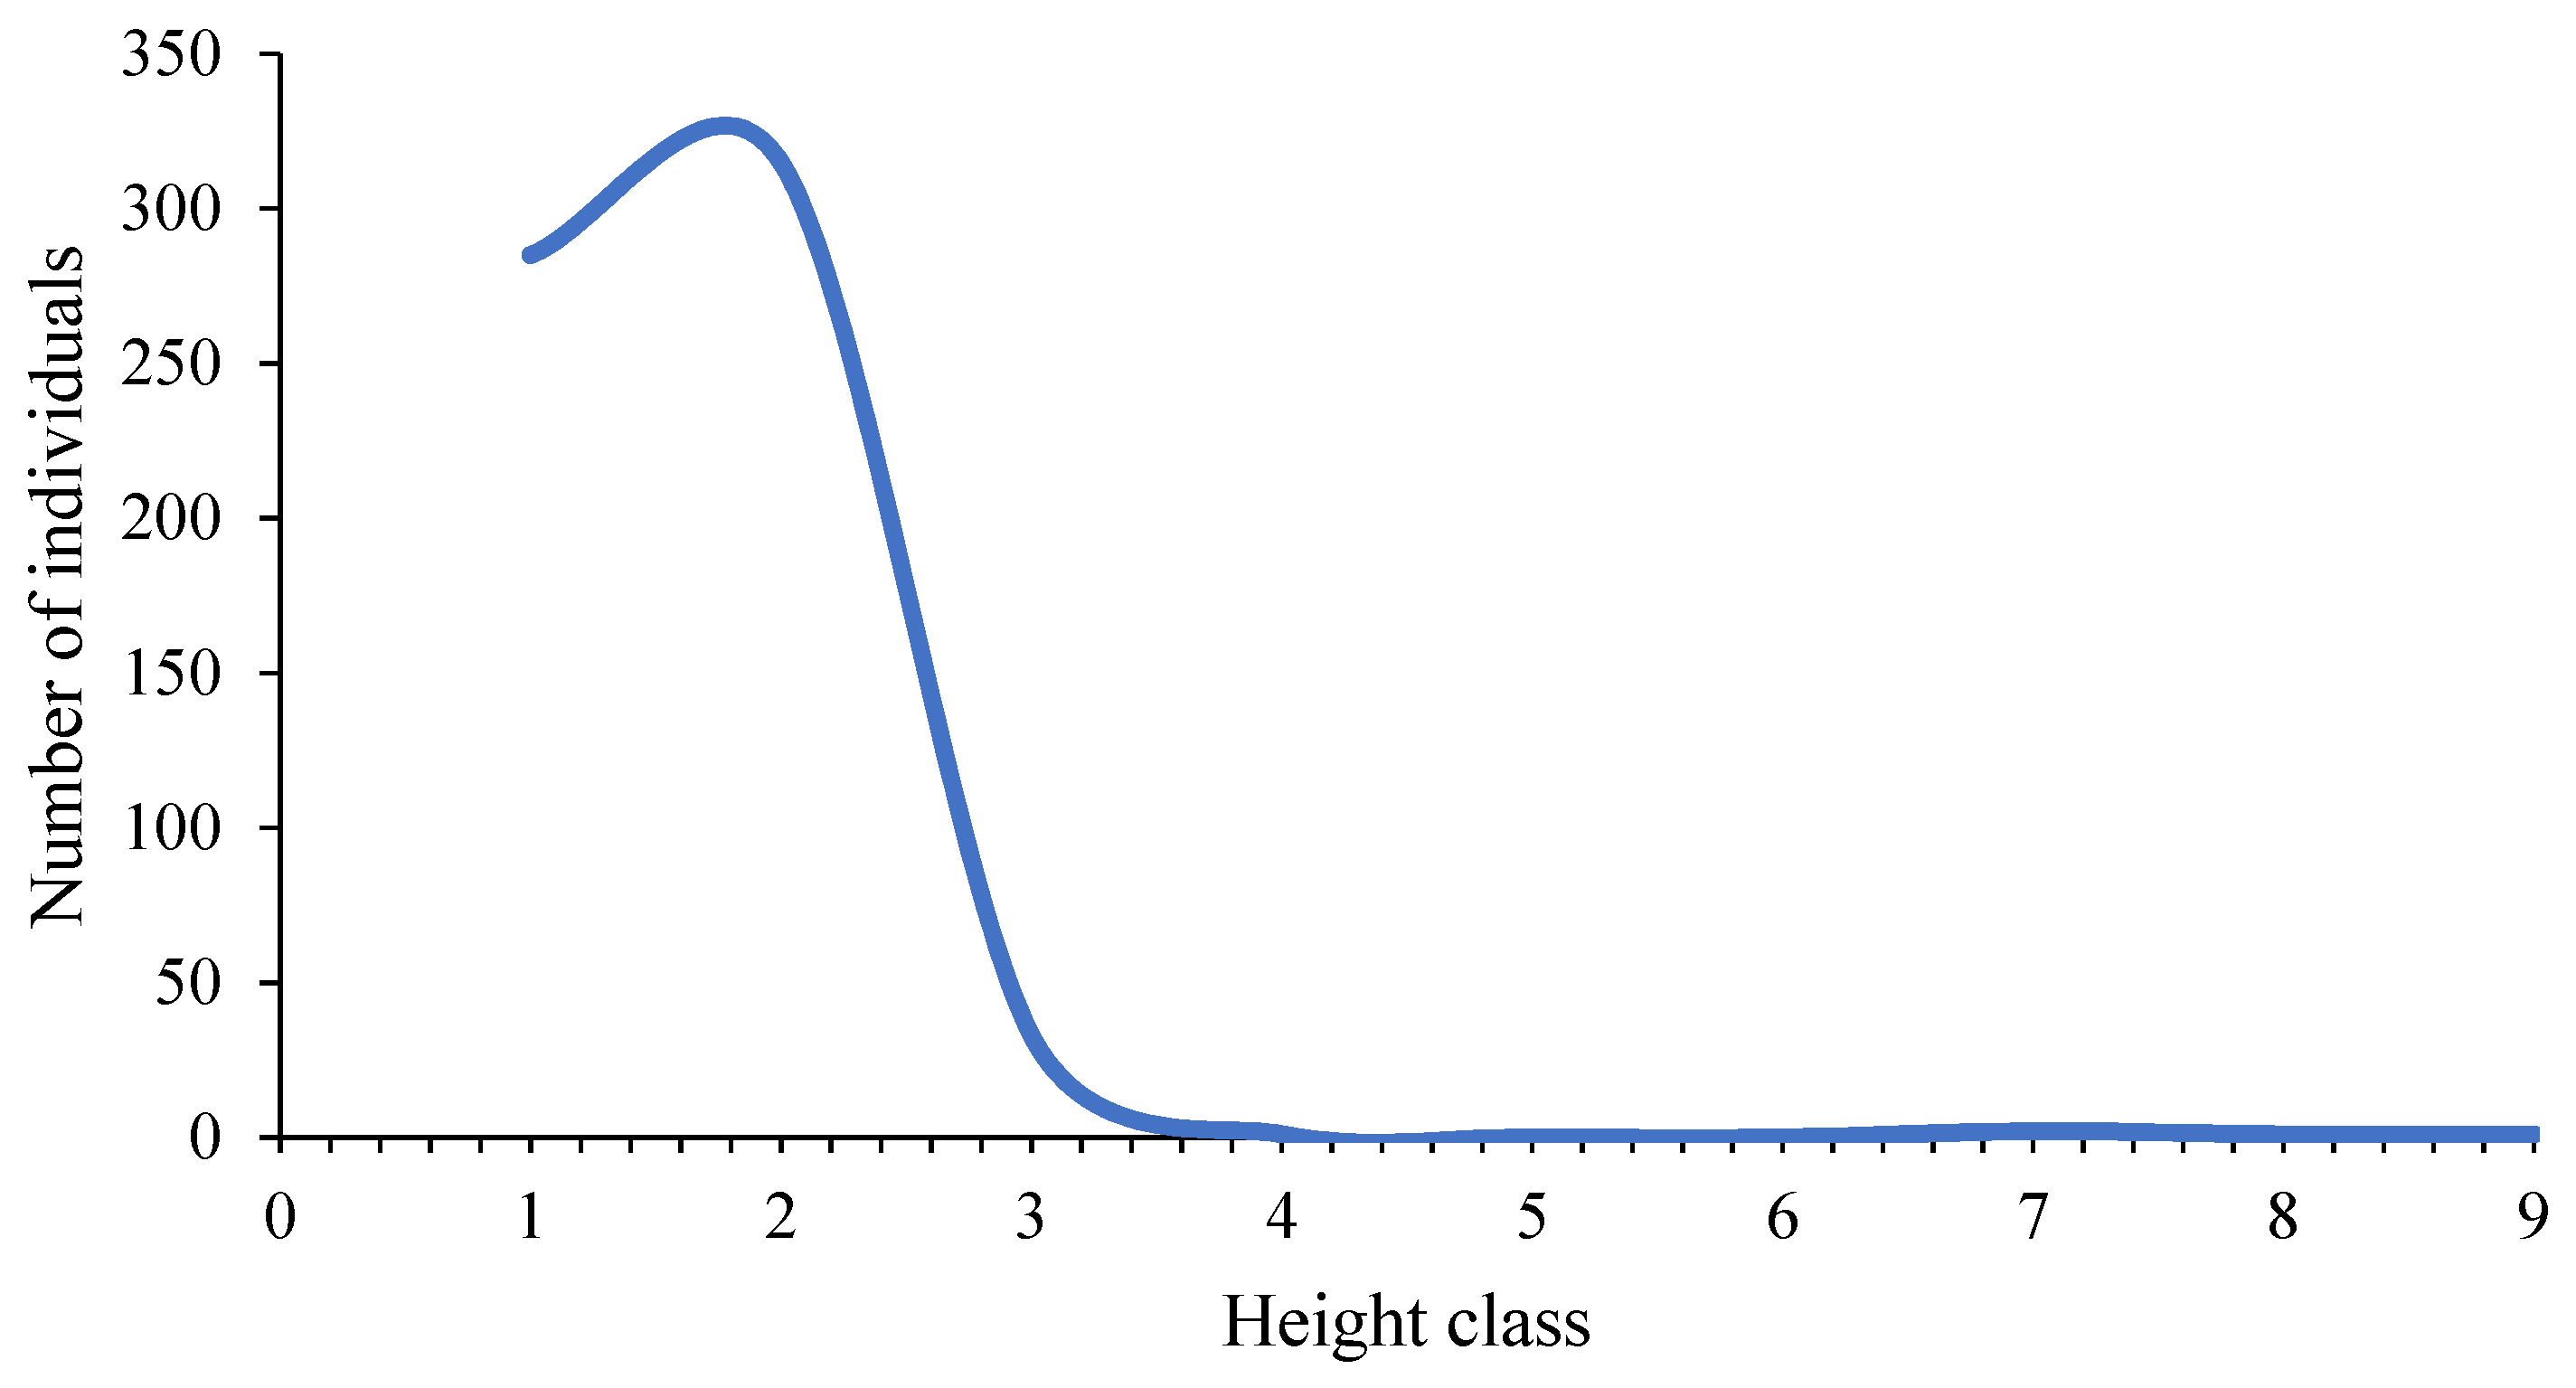
| Altitudinal Class | Range (cm) | Number of Individuals | Frequency (%) | Cumulative Frequency (%) |
|---|---|---|---|---|
| I | [4.00–13.11] | 285 | 44.67% | 44.67% |
| II | (13.11–22.22] | 315 | 49.37% | 94.04% |
| III | (22.22–31.33] | 33 | 5.17% | 99.22% |
| IV | (31.33–40.44] | 1 | 0.16% | 99.37% |
| V | (40.44–49.56] | 0 | 0.00% | 99.37% |
| VI | (49.56–58.67] | 0 | 0.00% | 99.37% |
| VII | (58.67–67.78] | 2 | 0.31% | 99.69% |
| VIII | (67.78–76.89] | 1 | 0.16% | 99.84% |
| IX | (76.89–86.00] | 1 | 0.16% | 100.00% |
| Total | 638 | 100.00% | ||
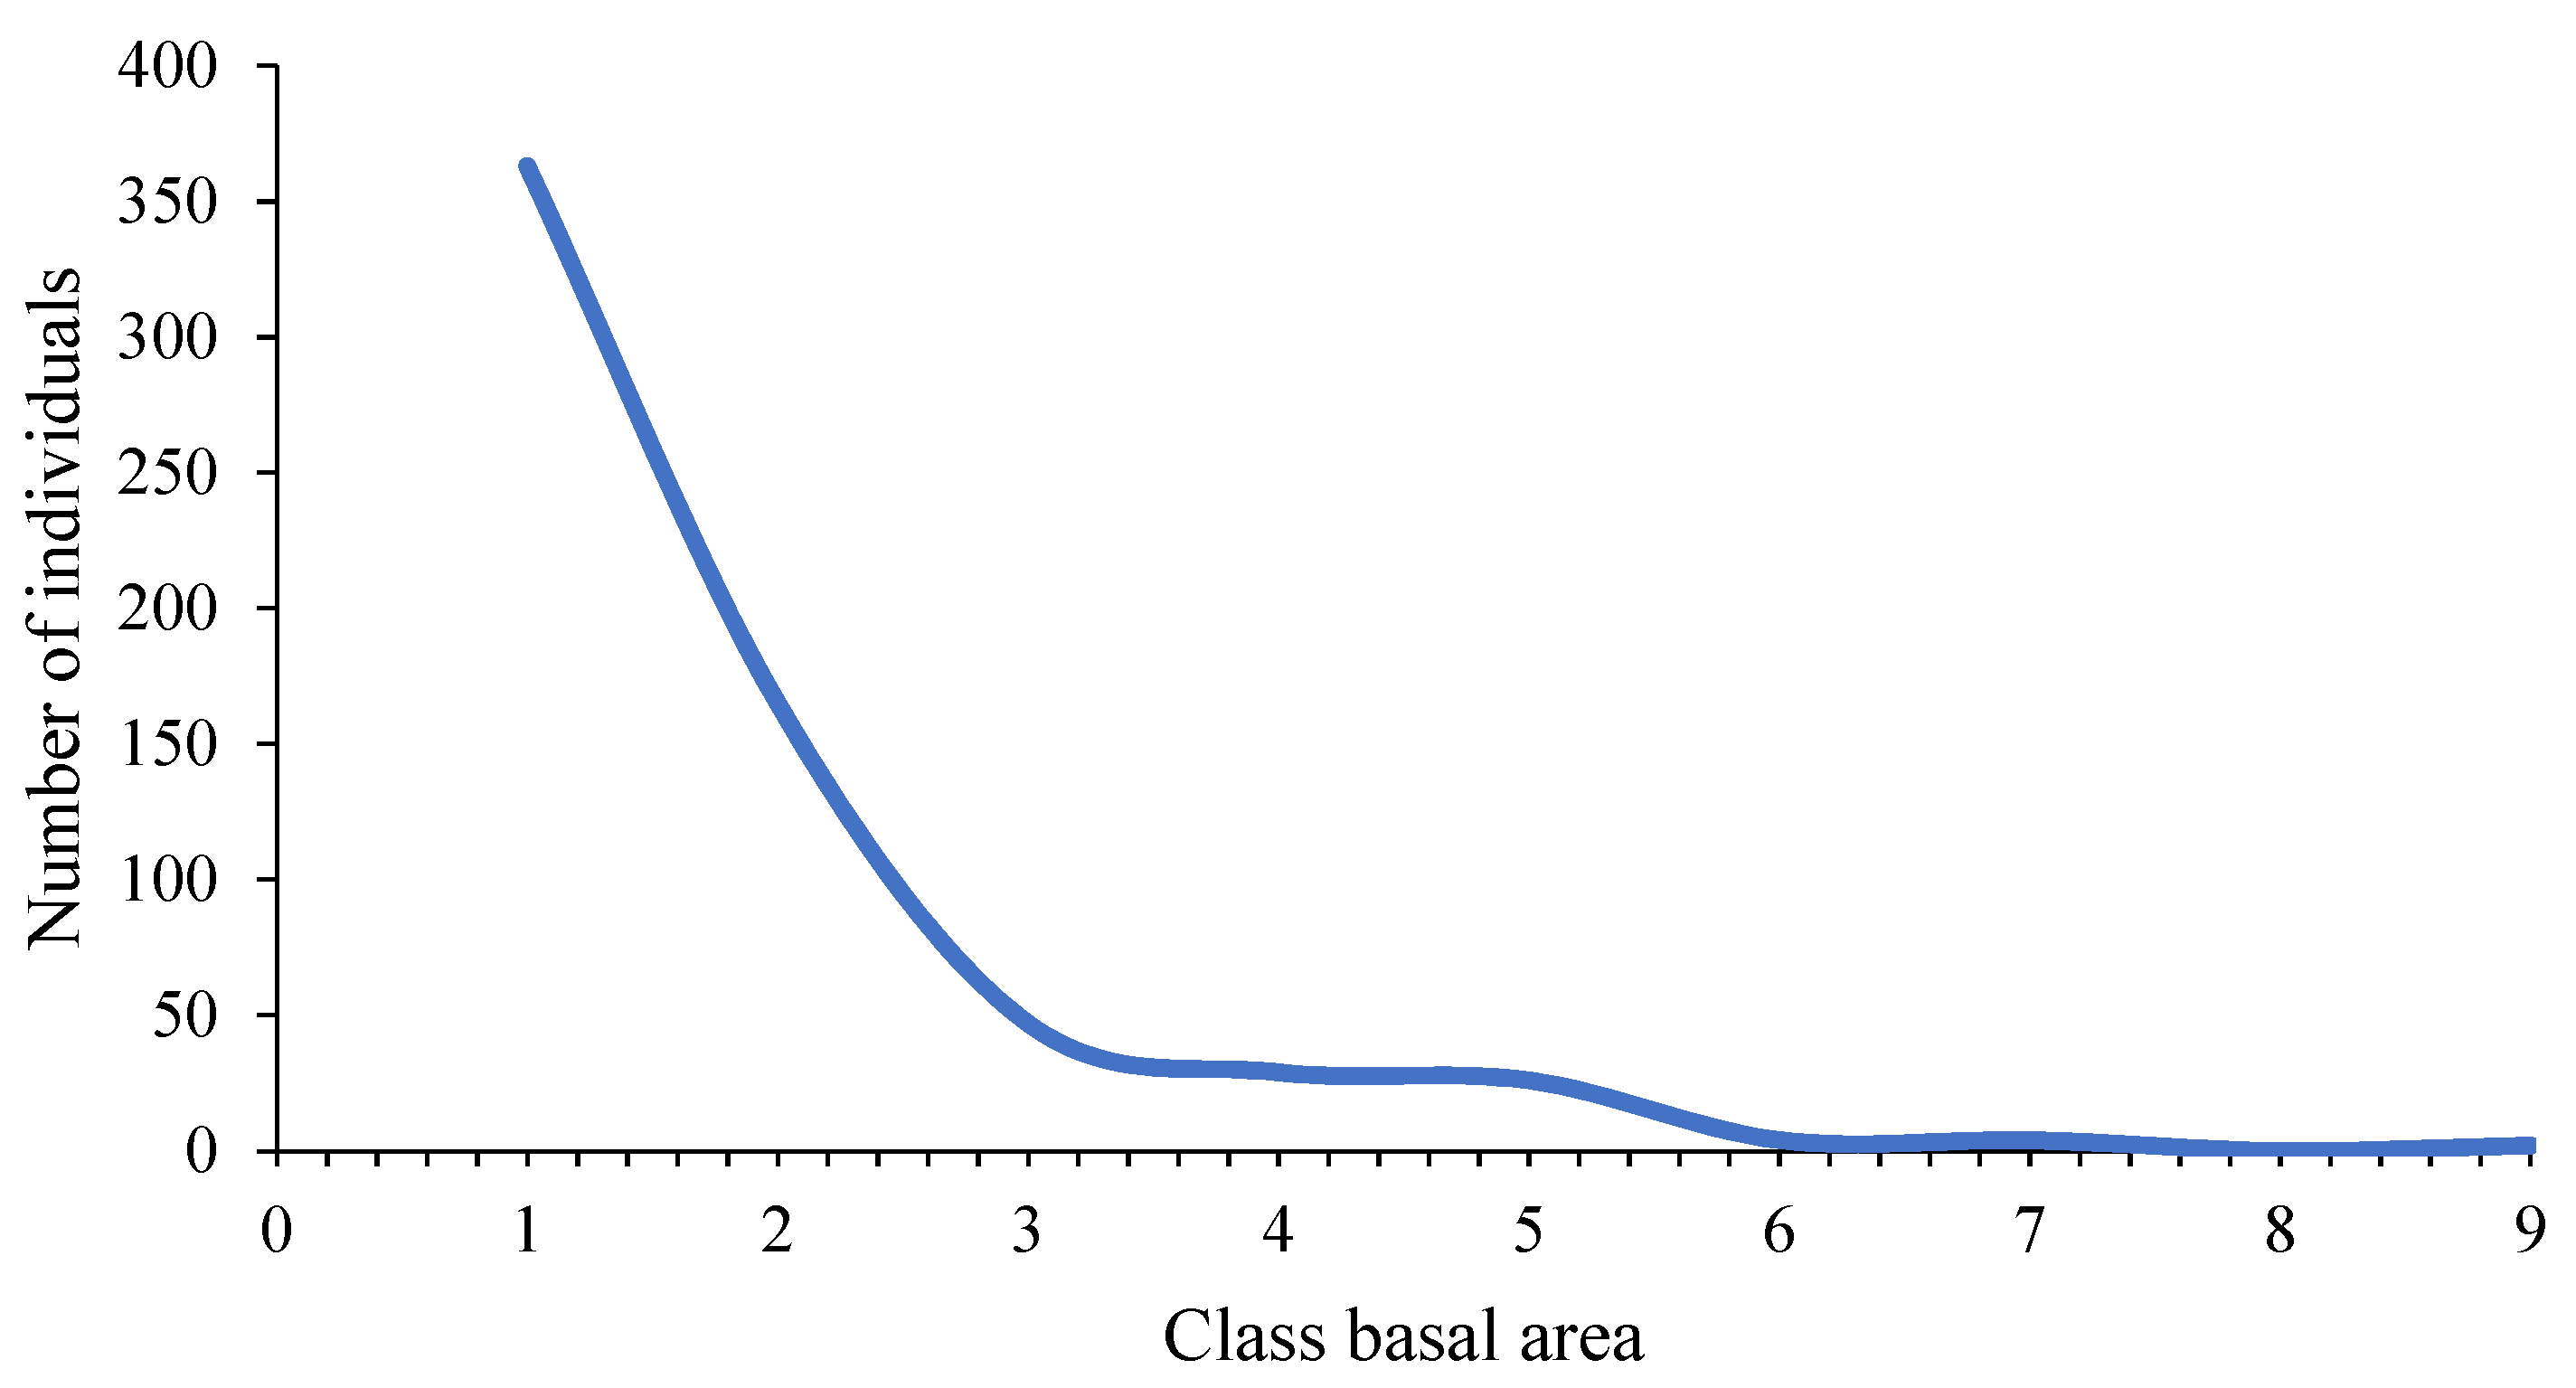
| Basal Area Class | Range (m2) | Number of Individuals | Frequency (%) | Cumulative Frequency (%) |
|---|---|---|---|---|
| I | [1.23–23.43] | 363 | 56.72% | 56.72% |
| II | (23.43–45.64] | 165 | 25.78% | 82.50% |
| III | (45.64–67.84] | 47 | 7.34% | 89.84% |
| IV | (67.84–90.04] | 29 | 4.53% | 94.38% |
| V | (90.04–112.25] | 26 | 4.06% | 98.44% |
| VI | (112.25–134.45] | 4 | 0.63% | 99.06% |
| VII | (134.45–156.65] | 4 | 0.63% | 99.69% |
| VIII | (156.65–178.86] | 0 | 0.00% | 99.69% |
| IX | (178.86–201.06] | 2 | 0.31% | 100.00% |
| Total | 640 | 100.00% | ||
| Reference | PP Location | PP Abbreviation | Life Zone | Altitude (m.a.s.l.) | No. of Ind | No. of Fam | No. of Gen. | No. of Spp | CM | Shannon–Wiener I. | Fisher’s I. |
|---|---|---|---|---|---|---|---|---|---|---|---|
| Current Study | AM-Yambrasbamba | P-PB | bh-M | 1890 | 640 | 39 | 60 | 152 | 0.238 | 4.264 | 23.74 |
| [16] | AM-San Carlos | P-SC | bh-MB | 2158 | 395 | 22 | 27 | 29 | 0.073 | 2.62 | 7.21 |
| [14] | JU-Puyu Sacha Alto | P-PA | bh-MB | 2770 | 480 | 22 | 27 | 45 | 0.094 | - | 12.16 |
| JU-Puyu Sacha Ribera | P-PR | bh-MB | 2275 | 576 | 38 | 57 | 112 | 0.194 | - | 41.47 | |
| JU-Puyu Sacha Ladera | P-PL2 | bh-MB | 2078 | 696 | 48 | 74 | 146 | 0.210 | - | 56.33 | |
| JU-Génova Cumbre | P-GC | bh-P | 1150 | 508 | 40 | 82 | 109 | 0.215 | - | 42.59 | |
| JU-Génova Terraza 1 | P-GS | bh-P | 1150 | 512 | 32 | 52 | 70 | 0.137 | - | 21.93 | |
| JU-Génova Ladera | P-GL | bh-P | 1075 | 425 | 28 | 55 | 72 | 0.169 | - | 24.87 | |
| [21] | JU-Puyu Sacha | P-PS | bh-MB | 2060 | 638 | 28 | 37 | 52 | 0.08 | - | 13.38 |
Disclaimer/Publisher’s Note: The statements, opinions and data contained in all publications are solely those of the individual author(s) and contributor(s) and not of MDPI and/or the editor(s). MDPI and/or the editor(s) disclaim responsibility for any injury to people or property resulting from any ideas, methods, instructions or products referred to in the content. |
© 2024 by the authors. Licensee MDPI, Basel, Switzerland. This article is an open access article distributed under the terms and conditions of the Creative Commons Attribution (CC BY) license (https://creativecommons.org/licenses/by/4.0/).
Share and Cite
Sánchez Zamora, Y.; Sopla Mas, B.; Coronel-Castro, E.; Rivera López, R.Y.; Auquiñivin Silva, E.A.; Fernández Jeri, A.B.; Oliva Cruz, S.M.; Gamarra Torres, O.A.; Giacomotti, J.; Pariente-Mondragón, E. Tree Species Composition and Structure of a Vegetation Plot in a Montane Forest in the Department of Amazonas, Peru. Forests 2024, 15, 1175. https://doi.org/10.3390/f15071175
Sánchez Zamora Y, Sopla Mas B, Coronel-Castro E, Rivera López RY, Auquiñivin Silva EA, Fernández Jeri AB, Oliva Cruz SM, Gamarra Torres OA, Giacomotti J, Pariente-Mondragón E. Tree Species Composition and Structure of a Vegetation Plot in a Montane Forest in the Department of Amazonas, Peru. Forests. 2024; 15(7):1175. https://doi.org/10.3390/f15071175
Chicago/Turabian StyleSánchez Zamora, Yorena, Betty Sopla Mas, Elver Coronel-Castro, Rosalynn Yohanna Rivera López, Erick Aldo Auquiñivin Silva, Armstrong Barnard Fernández Jeri, Segundo Manuel Oliva Cruz, Oscar Andrés Gamarra Torres, José Giacomotti, and Elí Pariente-Mondragón. 2024. "Tree Species Composition and Structure of a Vegetation Plot in a Montane Forest in the Department of Amazonas, Peru" Forests 15, no. 7: 1175. https://doi.org/10.3390/f15071175
APA StyleSánchez Zamora, Y., Sopla Mas, B., Coronel-Castro, E., Rivera López, R. Y., Auquiñivin Silva, E. A., Fernández Jeri, A. B., Oliva Cruz, S. M., Gamarra Torres, O. A., Giacomotti, J., & Pariente-Mondragón, E. (2024). Tree Species Composition and Structure of a Vegetation Plot in a Montane Forest in the Department of Amazonas, Peru. Forests, 15(7), 1175. https://doi.org/10.3390/f15071175